Article

Geochemistry of Soils from the Surrounding Area of a Coal Mine Waste Pile Affected by Self-Burning (Northern Portugal)

1
Institute of Earth Sciences, Pole of University of Porto, 4169-007 Porto, Portugal
2
Department of Geosciences, Environment and Spatial Planning FCUP, University of Porto, 4169-007 Porto, Portugal
3
Department of Earth Sciences, University of Coimbra, 3030-790 Coimbra, Portugal
4
Department of Environmental Health, National Institute of Health Doutor Ricardo Jorge, 4000-055 Porto, Portugal
5
LAQV/REQUIMTE, University of Porto, 4050-083 Porto, Portugal
6
AmbiTerra Laboratory, Department of Geosciences, School of Science and Technology, University of Évora, 7002-554 Évora, Portugal
7
Institute of Earth Sciences, Pole of University of Évora, 7002-554 Évora, Portugal
*
Author to whom correspondence should be addressed.
Minerals 2023, 13(1), 28; https://doi.org/10.3390/min13010028
Submission received: 16 November 2022 / Revised: 11 December 2022 / Accepted: 21 December 2022 / Published: 24 December 2022
(This article belongs to the Special Issue Geochemistry, Environmental Impact and Remediation of Mining Areas)

Abstract

:
Coal mining can generate organic and inorganic contaminants that can be disseminated in the surrounding soils by leaching and/or aerial deposition. This study aims to identify and characterize the physicochemical and geochemical changes promoted in soils from the surrounding area of a self-burning waste pile in an abandoned coal mine. A soil sampling campaign was conducted bordering the waste pile, comprising the main drainage areas as well as the areas uphill. The soils were characterized geochemically for major and trace elements and multivariate statistics was used in combination with geostatistical methodologies to study the statistical and spatial relations of the different elements and infer their Potentially Toxic Elements (PTEs) sources. The 16 priority Polycyclic Aromatic Hydrocarbons (PAHs) were identified and quantified in soils according to their spatial distribution, and their pyrogenic/petrogenic sources were inferred. Different sources were identified as contributing to the soil geochemical signature, considering not only the mine but also anthropogenic urban contamination or naturally enhanced regional geochemical background in multiple PTEs. PAHs tend to concentrate downstream of the waste pile, along the runoff areas, presenting a greater variety of the 16 priority PAHs and an increase of High Molecular Weight (HMW) PAHs pointing to its pyrogenic origin, possibly related to the self-combustion phenomenon occurring in the waste pile.

1. Introduction

Coal mining can be responsible for soil and water contamination, ecological deterioration, and human health risks [1,2,3,4,5,6].
Coal usually contains Polycyclic Aromatic Hydrocarbons (PAHs) and Potentially Toxic Elements (PTEs) such as As, Cd, Cr, Cu, Ni, Pb, and Zn, considered as environmentally hazardous elements that can cause contamination and human health problems during different steps of mining, coal preparation, or even its combustion [7,8,9,10]. Coal mining generates significant volumes of gangue, which may have high concentrations of hazardous elements, leading to leaching into the surrounding soils where that material is landfilled [7,11,12].
Anthracite A [13] was mined in the Douro Coalfield (N Portugal) between 1795 and 1994 generating dozens of waste piles along the abandoned mining complexes. The mine of São Pedro da Cova, located in the city of Gondomar, northwest of Portugal, was one of the most significant in the Douro Coalfield, and operated between 1795 and 1972. Its mining legacy remains in the field until today, manifested by the abandoned mining facilities and an extensive waste pile, covering an area of over 28,000 m2. In the year 2005, the southern part of the waste pile started to burn, after ignition caused by a wildfire, and has been in self-combustion ever since.
The comprehensive characterization of the waste pile materials in São Pedro da Cova, as well as the identification of combustion by-products was previously studied [14,15,16,17]. The sampling conducted in previous studies included solid waste material affected by self-burning, as well as unburned waste, neoformed minerals found on the surface of the deposit (coal fire gas minerals), and gaseous emissions.
Adding to the previous environmental concerns, it is estimated that between 2001 and 2002, an approximate volume of 50,000 m3, about 88,000 t of industrial wastes were deposited over and along the northeastern border of the coal mine waste [18]. These wastes included particles released by electric furnaces captured in dust removal systems by the national steel industry for over 20 years. Such materials are classified has hazardous, enriched in Pb, Zn, and Cr, and were therefore recently removed from the site.
The abandoned mining area, including the waste pile, are contiguous to the population centre where locals develop small areas of subsistence farming. Since 2018, the mine has been the object of environmental monitoring, with studies particularly focused on the waste pile and on effluent discharge areas, with the objective of identifying potential environmental impacts in the surrounding areas, including soil and water [19]. A hydropedological assessment including geochemical, mineralogical, and hydrological data was conducted on the self-burning waste pile [20]. The mining effluents were characterized in terms of their physicochemical properties and suitability for irrigation purposes [21].
The objective of this research is to study the effects of coal mining in São Pedro da Cova on soils from the surrounding area of the self-burning waste pile. This research focused on the soil physicochemical and geochemical characterization, comparing the elemental concentrations present in soils enclosing the mine, with the concentrations previously found in the waste pile, in fly ashes from produced by combustion of the coal exploited in the Douro Coalfield for energy production in a thermal power plant, and with national, European, and world soil reference values. Multivariate statistics were used in combination with spatial analysis methodologies to study the statistical and spatial inter-elements relations and to infer PTEs sources. The 16 priority PAHs were identified and quantified in soils according to their spatial distribution. Additionally, their pyrogenic/petrogenic sources were inferred.

2. Materials and Methods

2.1. Study Area and Sampling Procedures

The abandoned mine of São Pedro da Cova (N41°09′25″; W08°30′11″) is related to the multiple coal deposits hosted in the Douro Coalfield and represents the most important coal-bearing deposit in Portugal (Upper Pennsylvanian), with NW–SE alignment, variable width (30–250 m) and approximately 53 km in length [22]. This unit is located along the Valongo Anticline western limb. The geological units in the study area correspond to metasedimentary formations with ages between the Precambrian and/or Cambrian, Ordovician, Silurian, Devonian, and Carboniferous (Figure 1a).
To characterize the soils in the surrounding area of the waste pile, a total of 50 topsoil samples (0–20 cm depth) were collected over a regular mesh with approximately 100 m spacing between samples. The sampling covered an area of about 480,000 m2 and did not include the areas covered by the coal mine waste pile and the adjacent steel industry wastes, as these had been the subject of previous studies [14,15,16,17]. The sampling was preferentially oriented NE-SW, according to the development of the main drainage basin, to the southwest of the waste pile, and considering the dominant wind direction towards NE. The sampling sites covered nearly all land uses in the vicinity of the old mine, including forest, urban and farmed areas, and small landfills.
Each sample was collected using a stainless-steel shovel and consisted of approximately 1.5 kg of soil, stored in a polyethylene bag. The geographic coordinates of the sampling locations were identified using a global positioning system (GPS). Soil samples were dried below 40 °C and sieved at 2 mm to remove gravel and organic residues. The samples were quartered to obtain representative samples and then crushed to obtain 212 μm fractions.

2.2. Geochemical Characterization

Major and trace elements were determined in the Bureau Veritas Laboratories (Vancouver), by inductively coupled plasma emission spectrometry/mass spectrometry (ICP-ES/MS), after digestion with a multi-acid solution of HF-HClO4-HNO3. The data quality was assessed using analytical results of certified reference materials (STD OREAS25A-4A and STD OREAS45E), blanks and random duplicate samples. The results were within the 95% confidence limits of the recommended values given for the certified materials. Bureau Veritas in Vancouver is accredited by ISO/IEC 17025:2017 standard (Accredited Laboratory No. 720).
The carbon (C), hydrogen (H), nitrogen (N), and total sulphur (S) contents were determined in the facilities of Institute of Earth Sciences—Évora Pole, using a CHNS Vario Micro Cube instrument (Elementar), based on the high temperature combustion and subsequent analysis of the combustion gases (N2, CO2, H2O and SO2). The samples were weighed in tin vessels, and transferred through a ball valve into the combustion tube at a permanent temperature of 1100 °C. Each sample was individually flushed with inert gas (argon) to remove atmospheric nitrogen, resulting in a zero blank sampling process. Subsequently, the reduction of the combustion gases on hot copper was carried out in a second furnace. The gases formed by combustion were separated in its components on a column by a temperature programmed desorption (TPD) and their detection by a TCD sensor (Thermal Conductivity Detector). Considering the reproducibility of the results, three assays were done by sample and the average values were determined for each element.
Major and trace soil elements were compared with Portuguese and Canadian soil guidelines for agricultural soils defined by the Portuguese Environmental Agency (Agência Portuguesa do Ambiente) [23], and by the Canadian Council of Ministers of the Environment [24]. The soil analytical results were compared with agricultural soils reference values, since the community contiguous to the mine practices subsistence farming, therefore a conservative approach was thought to be more adequate.
The soil from the study area were also compared with other European [25] and world soil reference values [26] for trace elements. These values were also compared with the analytical values obtained on previous characterization studies conducted over the São Pedro da Cova mine waste pile [15] and fly ashes from the Douro Coalfield coal and other soils from areas surrounding coal power plants [7,27,28,29,30].
The subsequent statistical data analysis, namely univariate and multivariate techniques, was developed using the software TIBCO Statistica version 13.4.014 [31] and REFLEX ioGAS™ software [32]. Spatial analysis regarding the elemental spatial distribution was performed using the software ESRI ArcGIS PRO [33].

2.3. Physicochemical Properties

Soil physicochemical parameters can influence the trace elements mobility and concentration and provide good guidance to understand the contamination dynamics and its sources. The organic matter content was determined by loss-on-ignition (LOI), using a muffle furnace Thermoline 47,900, model F47,925. The samples were submitted to 615 °C for 2 h. This temperature was chosen since multiple soil samples were collected over carboniferous units, rich in anthracite, generally the LOI method temperatures for soils should be maintained below 440 °C to avoid the destruction of any inorganic carbonates that may be present in the sample [34]. However, for organic soils, ASTM method D 2974 [35] allows for ashing the sample up to 750 °C. Considering the dominant geology of the study area, very low carbonates content was expected in the sample, and therefore these should have minor influence on the resultant determination of the organic matter content.
Electric conductivity and pH were measured using the equipment Hanna Instruments HI991300 (previously calibrated with two standard solutions of pH 4.01 and 7.01), using a soil/water ratio of 1:5, suspensions of 5 g of soil in 25 mL of distilled water (pHw). The measurements were done after 5 min stirring followed by a 24 h resting period [36].
In soils the magnetic parameters result from contributions of all soil-forming minerals and vary with concentration and composition of those minerals, depending particularly on their ferromagnetic content, especially magnetite, maghemite, and hematite [37]. Nonetheless, the soil magnetic response can also be affected by anthropogenic airborne particulates originated during high-temperature combustion of fossil fuels [38,39]. Several authors have used mass-specific magnetic susceptibility (χ) in coal fly ash distribution studies as particles disseminated by air [38,40,41,42,43,44]. Fly ash particles can cause an increase in the soil magnetic signal, given they are good absorbers of multiple toxic metals, such as Cd, Cr, Pb, and Zn, mass-specific magnetic susceptibility can provide useful information about the atmospheric dissemination of contaminants generated by the self-burning waste pile.
Magnetic susceptibility measures the soil magnetic response to a low external magnetic field. The specific or mass susceptibility χ, is defined as the ratio of the material magnetization J (per mass unit) to the low external magnetic field H:
J = χH (m3/kg)
The mass susceptibility (χ) determination was achieved by taking 10 g of soil samples sieved at 2 mm, in a polyethylene bag. The samples were exposed to a magnetic field of 300 A/m, on a magnetic susceptibility scale Kappabridge KLY-4S from AGICO supported by SUMEAN software. For each sample, three measurements were taken, and the average value was considered.

2.4. Polycyclic Aromatic Hydrocarbons

PAHs are chemical compounds consisting of fused aromatic rings, potentially carcinogenic, mutagenic, and toxic to human beings, representing a global concern for the environment and human health [45]. Sixteen PAHs were defined as priority pollutants by the United States Environmental Protection Agency (U.S. EPA) [46].
A total of 15 samples were selected for PAHs analysis from the vicinity of the abandoned coal mine waste pile, 5 samples located upstream of the waste pile, in forest areas, 4 samples located downstream of the waste pile, and 6 samples in areas that locally can be affected by smaller volumes of mining waste piles. The 16 priority PAHs were analysed by dispersive liquid–liquid microextraction coupled to gas chromatography/mass spectrometry (DLLME–GC/MS) in a Shimadzu GCMS-QP2010 gas chromatograph mass spectrometer equipped with an auto-injector AOC5000 (Shimadzu Corporation, Kyoto, Japan). Analytical standards were supplied by Sigma–Aldrich (Steinheim, Germany) and Merck (Darmstadt, Germany). Sixteen priority PAHs were analysed based on GC retention time and ion m/z of individual PAH, which included naphthalene (NaP), acenaphthylene (Acy), acenaphthene (Ace), fluorene (Flu), phenanthrene (Phe), anthracene (Ant), fluoranthene (Flua), pyrene (Pyr), benzo[a]anthracene (BaA), chrysene (Chr), benzo[b]fluoranthene (BbF), benzo[k]fluoranthene (BkF), benzo[a]pyrene (BaP), indeno[1,2,3-cd]pyrene (IP), dibenzo[a,h]anthracene (DbA) and benzo[g,h,i]-perylene (BghiP). As internal standard it was used the PAH-Mix31 solution from Dr. Ehrenstorfer (Augsburg, Germany) constituted by the deuterated standards naphthalene-d8, acenaphthene-d10, pyrene-d12, chrysene-d12, and phenanthrene-d10.
PAHs were quantified using the external calibration method. Two stock working standard solutions were prepared, one for native and other for deuterated PAHs, both in acetonitrile. Daily calibration solutions at concentration levels ranging from 0.25 µg Kg−1 to 10 µg Kg−1 were prepared by spiking 1 g of a model sample of soil with different volumes of the working solutions at seven levels of equidistant concentrations.
Calibration curves were constructed using the least squares linear regression model, plotting the peak area ratios of the different compounds and respective internal standard versus the concentration of each analyte under study.
Sample preparation was done according to [47], with slight modifications. A 1 g weighed portion of the test sample was placed in a test tube; 1 mL of acetonitrile was added; the mixture was treated with ultrasound for 5 min. Then, the sample was centrifuged at 10,000 rpm for 10 min. The supernatant was decanted into a 15 mL conical test tube, and 10 mL of ultrapure water, 1 g of sodium chloride and 60 µL of chloroform were added, resulting in a cloudy solution. Finally, the conical tubes were centrifuged at 2000 rpm and 4 °C for 7 min. Dispersive particles were collected at the bottom of the centrifuge tube by a glass Pasteur pipette with latex bulb. The resulting organic phase was transferred to a microinsert of 100 μL and injected in gas chromatography–mass spectrometry (GC–MS) for analysis.
PAHs isomers were used as an attempt to identify the PAHs sources present in the soils surrounding the waste pile. Four molecular diagnostic ratios (MDRs) have been commonly used to discriminate the PAHs sources, according to the different proportions of compounds present in soils [48,49,50,51]. The most significant PAH isomeric pairs generally applied are shown in Table 1, with their source classification criteria. The Flu/(Flu + Pyr) ratio provides insight into petrogenic, petroleum combustion, and biomass and coal combustion sources The Ant/(Ant + Phe) ratio distinguishes between petrogenic and combustion sources. The BaA/(BaA + Chr) ratio distinguishes petrogenic and combustion (pyrogenic) sources and includes a range for mixed sourcing. Finally, the IP/(IP + BghiP) ratio provides insight to petrogenetic, petroleum combustion, and biomass and coal combustion sources [52].

3. Results and Discussion

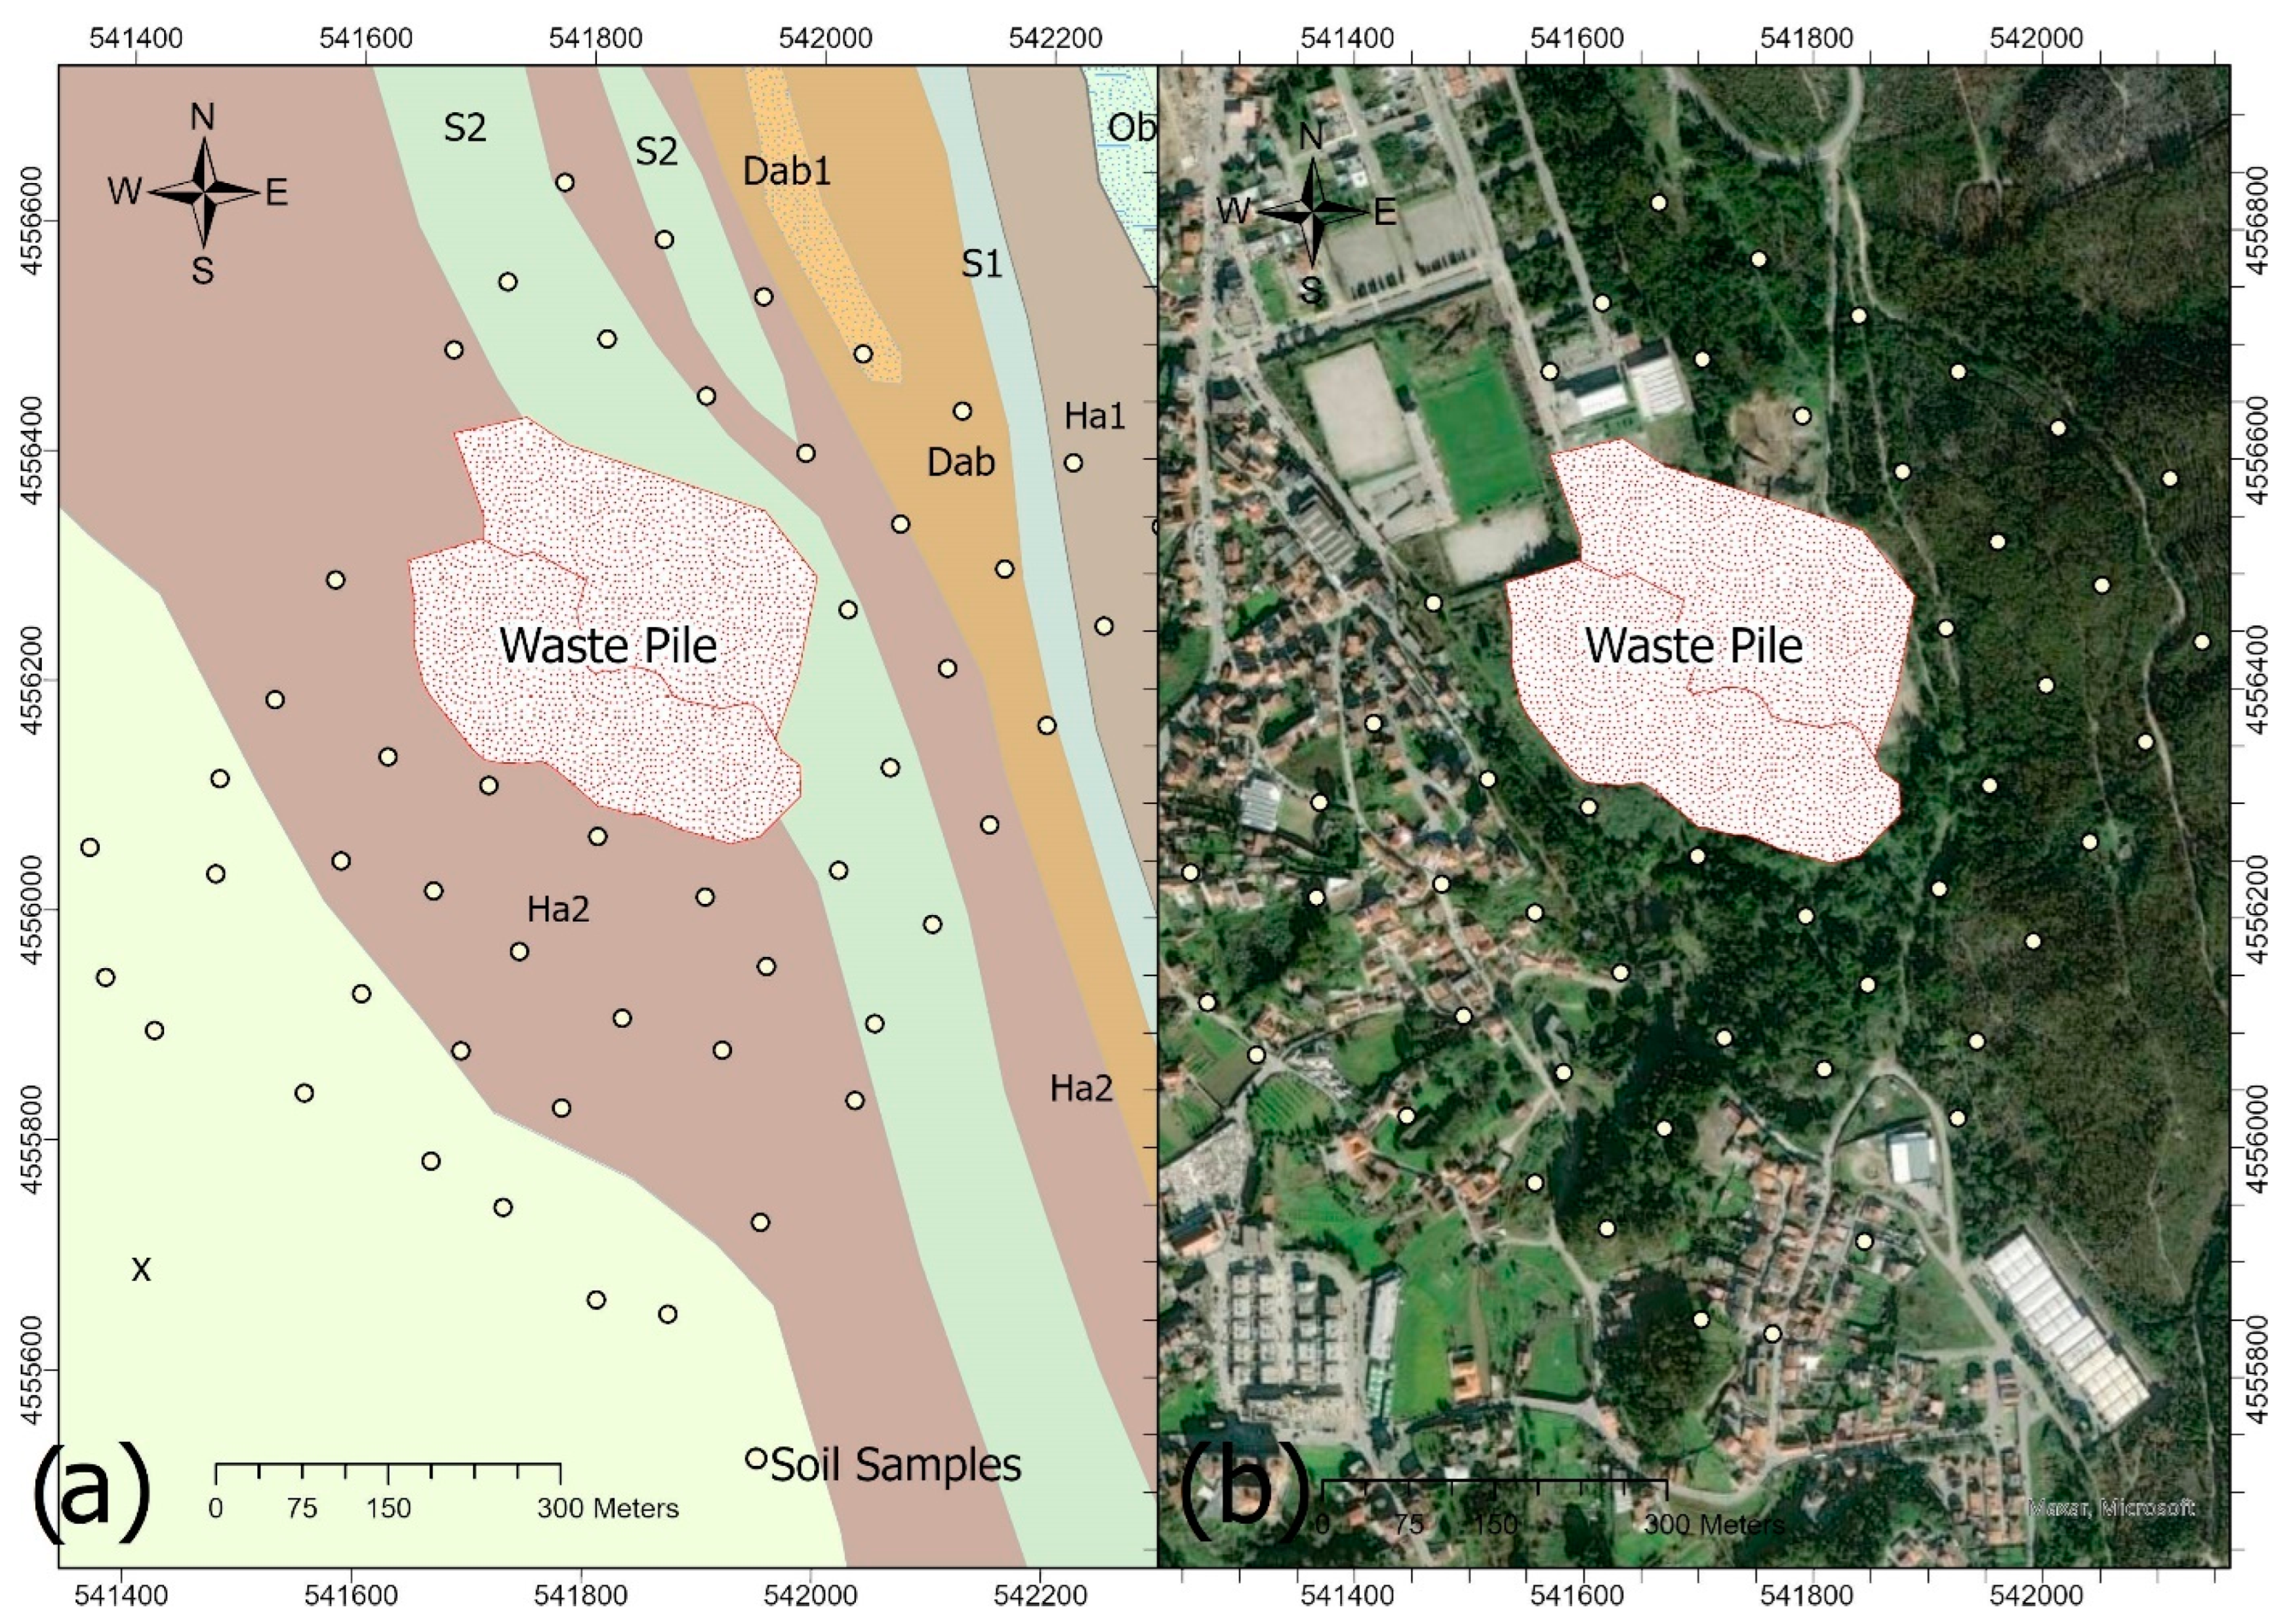
3.1. General Soil Geochemical Characterization

The 50 soil samples collected surrounding the mine were submitted to ultimate analysis for determination of C, H, N, S by CHNOS analyser and analysed by ICP-ES/MS for major and trace elements (Table 2).
Regarding the mean values of the analysed elements present in the samples, the soils are composed (in decreasing proportions) of Al > C > Fe > K > H > Na > N > Ti > Mg > Ca > P > S. Most major elements showed a coefficient of variation (CV) lower than 100%, indicating overall low variability on the data, the elements that present the highest variability are Ca, C and S.
The mean concentrations of trace elements measured in soils followed a descending order as Ba > Mn > ∑LREE > V > Zn > Cr > Pb > Cu >∑HREE > Ni > As > Cs > Th > Y > Co > Sb >Sn > U > Be > Mo > Cd. Skewness values showed that, in general, trace elements data are positively skewed, with tail of distribution towards higher concentrations (except for Th and V) and kurtosis is predominantly leptokurtic (except V), moving away from a normal distribution pattern. The distribution of the data set was evaluated using Shapiro–Wilk’s methods (p < 0.05), which confirmed that the majority of the elements from Table 2 are not normally distributed (exceptions for N, H, K, Al, and Th).
The soils present generally higher content in Mn than the mining wastes, with a mean value of 174 mg/kg, given that the average values measured in wastes were 51.3 and 65.0 mg/kg, respectively, in the unburned and the burned areas [14]. The soils also show slight increase of Co, Cu, Pb, Zn, and HREEs when compared with averaged waste pile material samples, suggesting that the soil may have been concentrating these elements or that they may have been supplied by different sources.
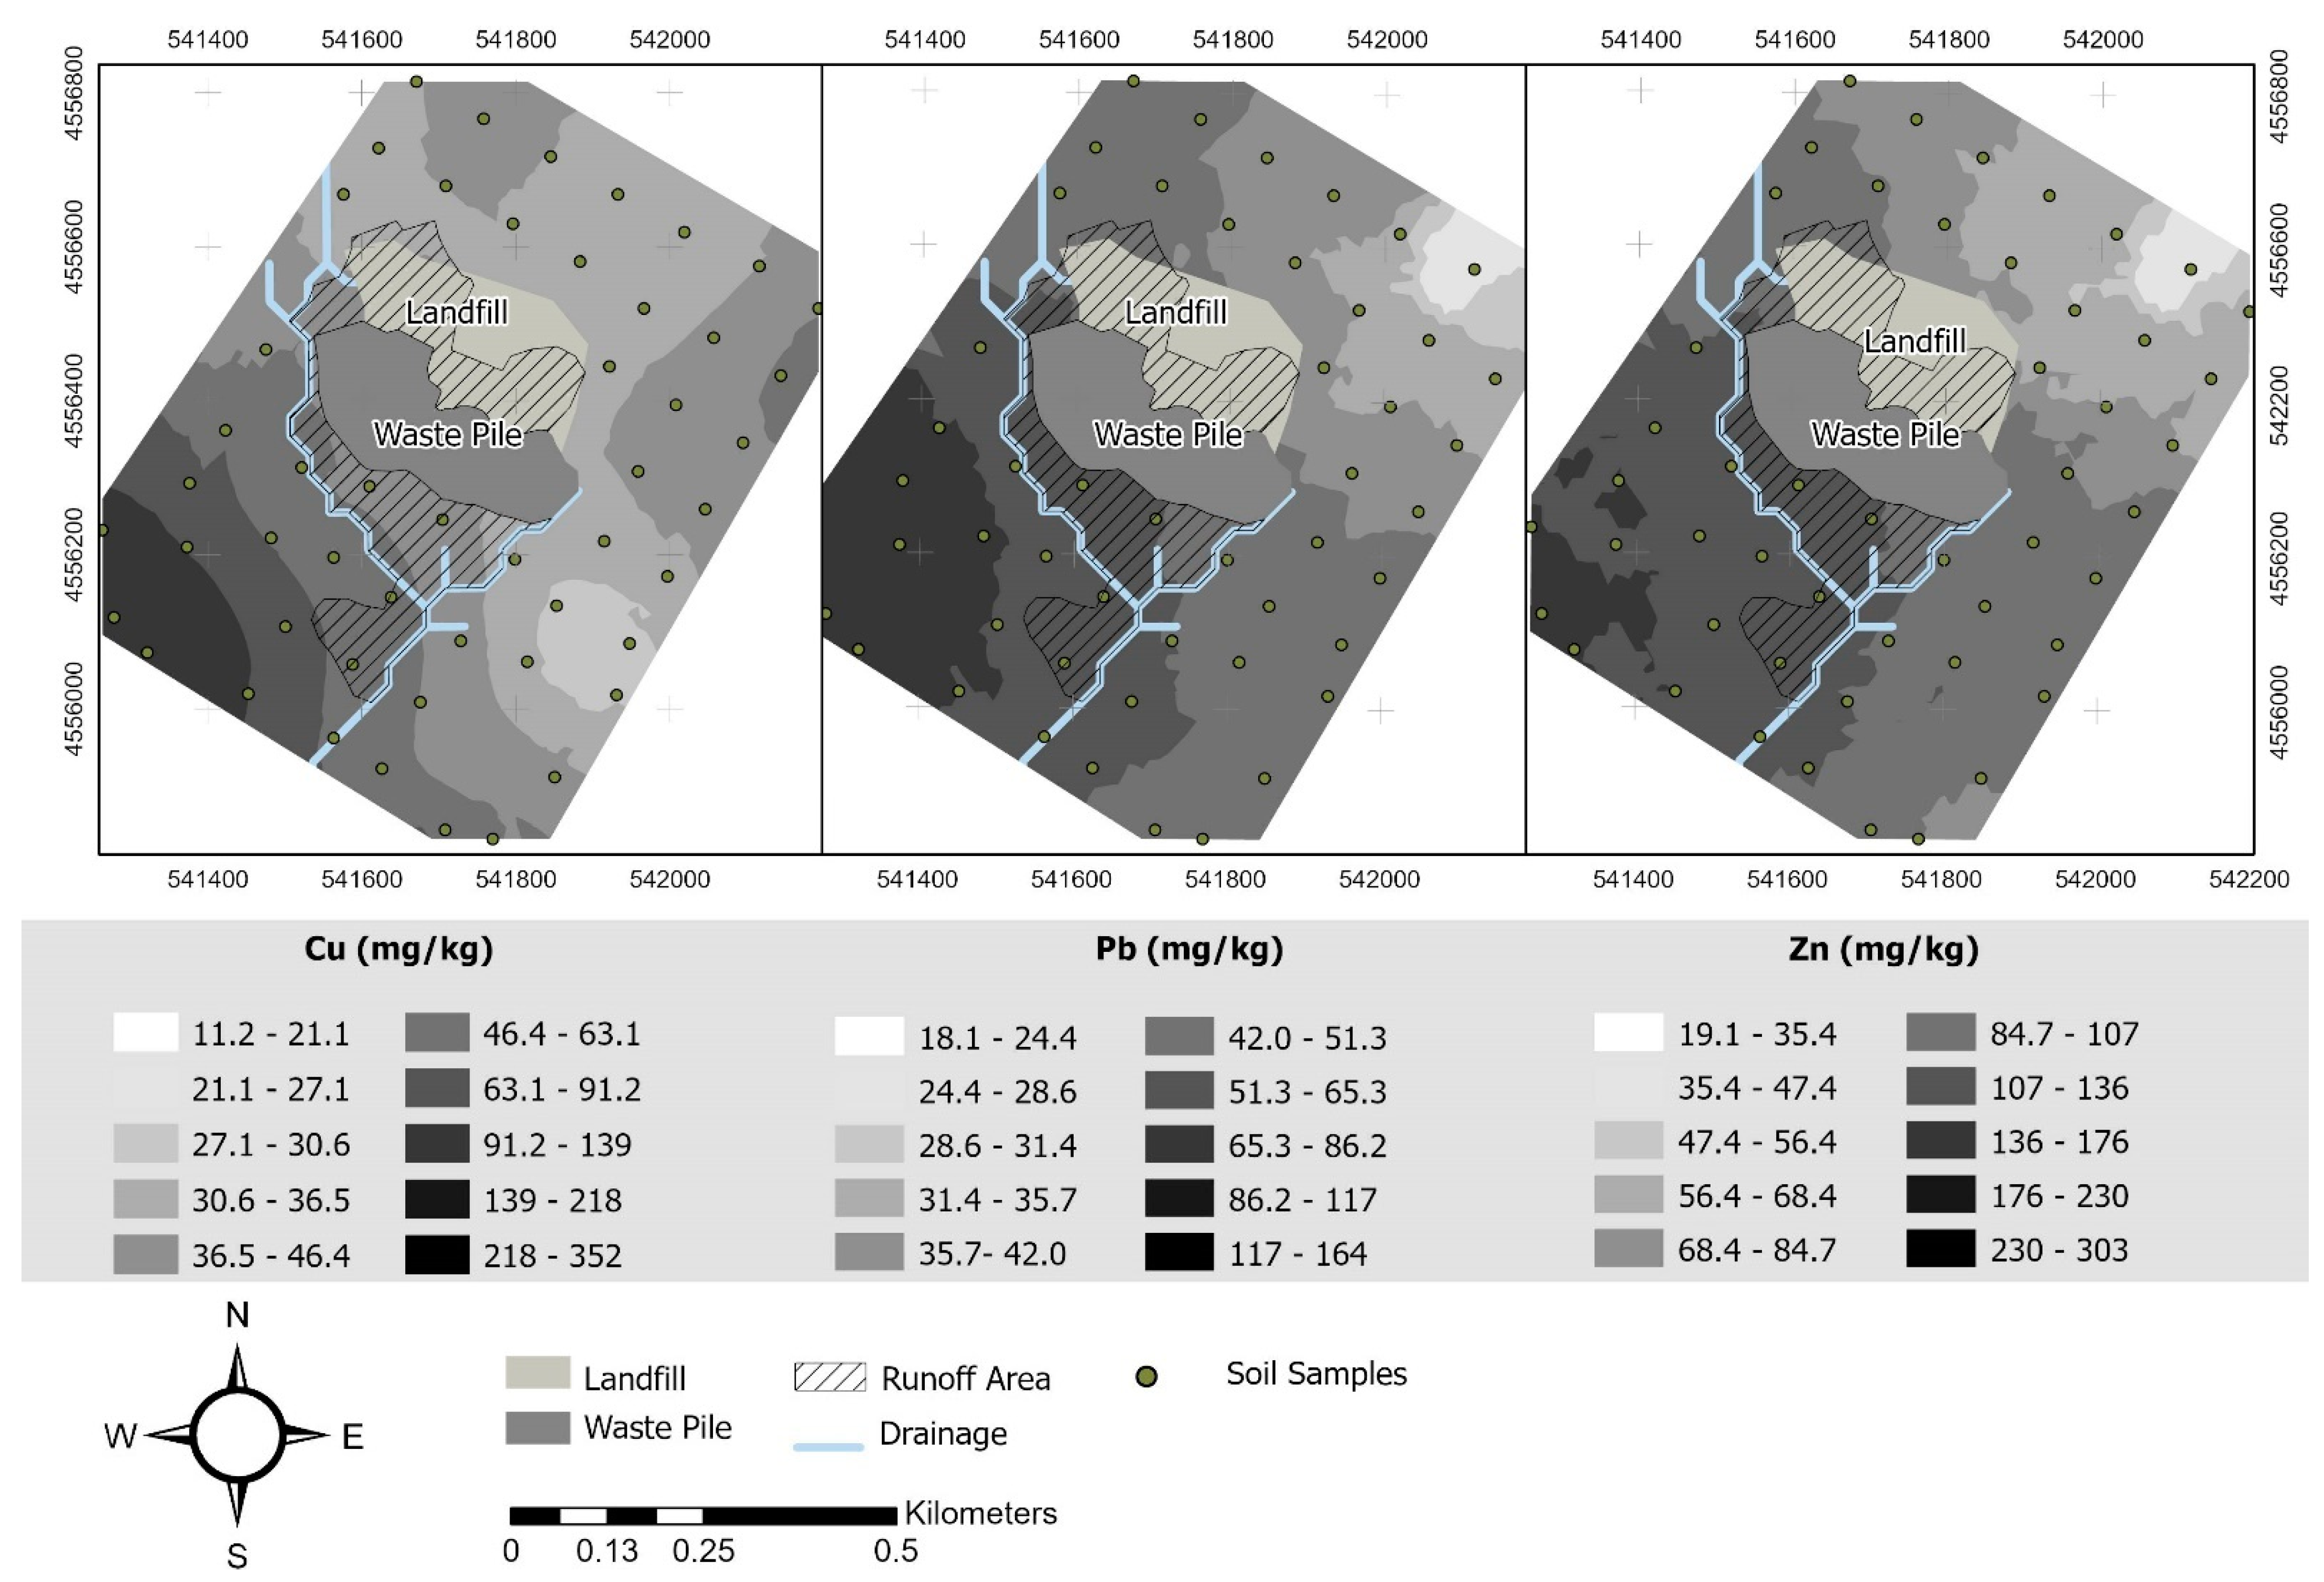
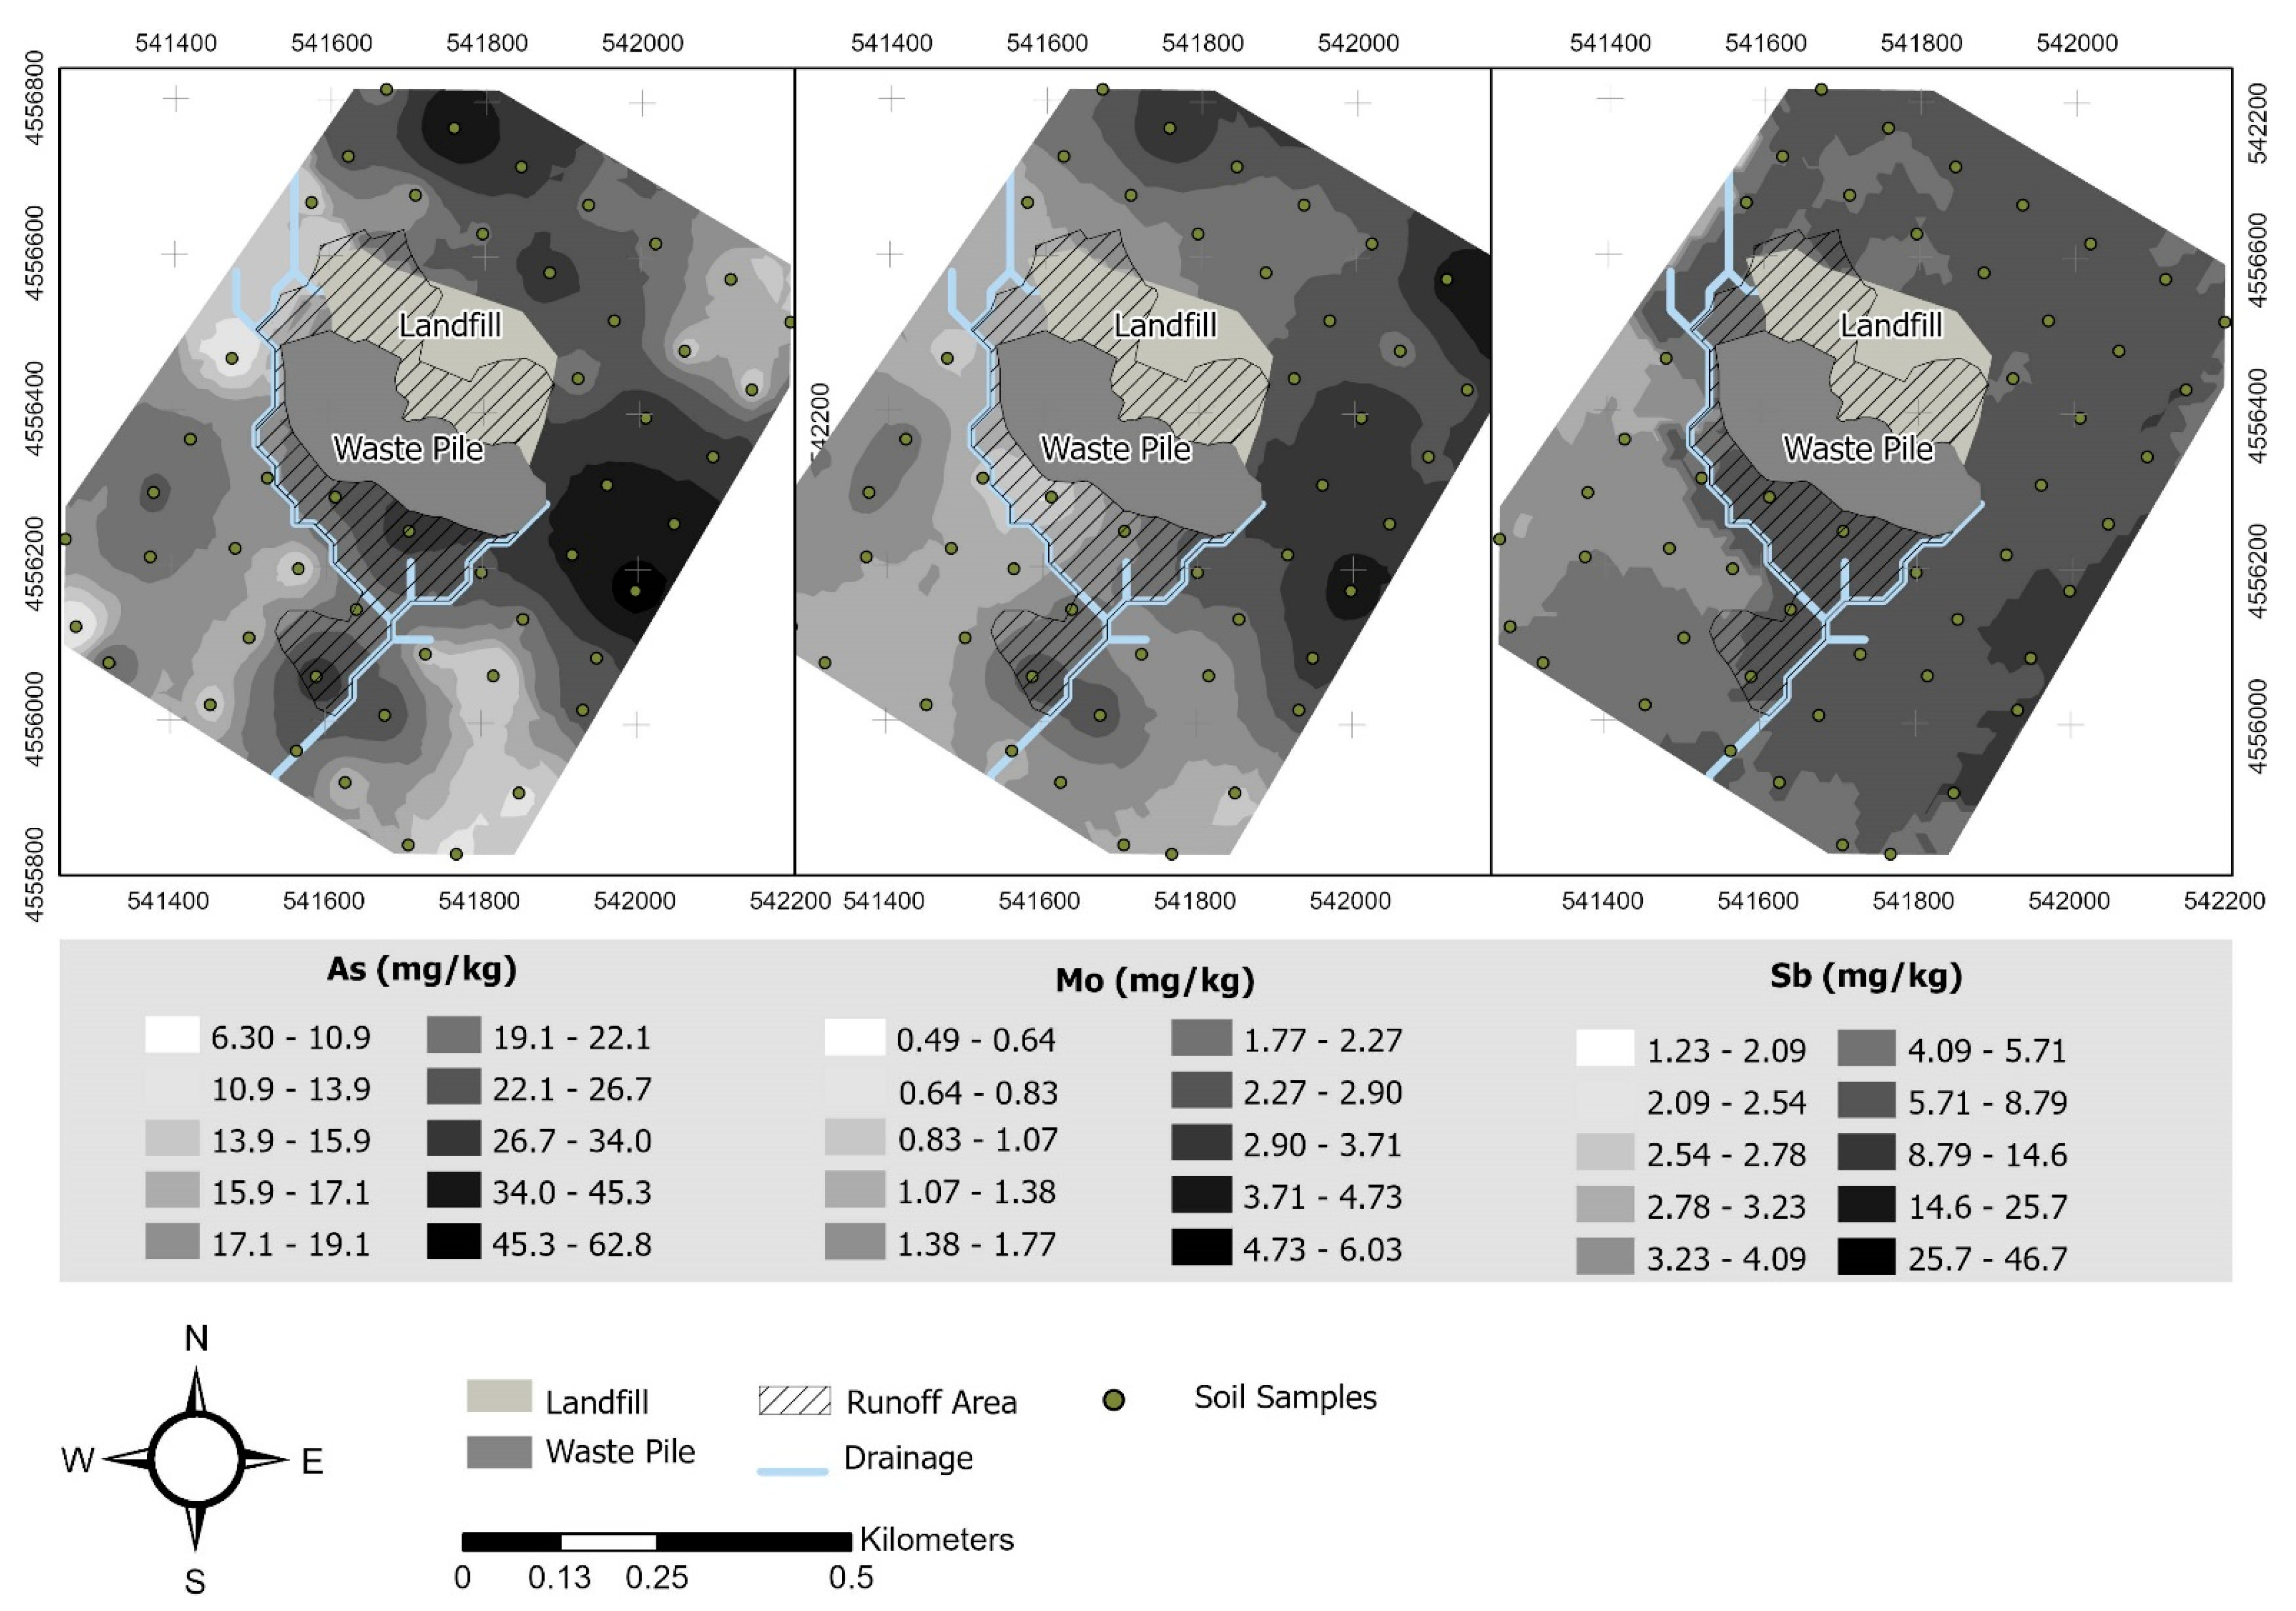
Regarding the concentrations of hazardous elements, their concentrations in soils were compared with the Portuguese soil contamination reference values [22] and with the Canadian guidelines [24] for agriculture soils.
Considering the Portuguese guidelines, all soil samples showed contamination in Sb. In this case, the maximum Sb concentration (46.7 mg/kg) is 46 times higher than the reference value.
Barium concentration in all samples was also above the Portuguese reference value of 210 mg/kg with a maximum of 1489 mg/kg (7 times above the reference). However, considering the Canadian guidelines for Ba, the proposed maximum soil quality threshold for Ba is significantly higher (750 mg/kg). Therefore, the average concentration in soils lies within the suggested ranges, with only two soil samples exceeding this limit. Additionally, the Ba concentrations in the soils from the surrounding area of the coal mine are similar to the concentrations present in world soils [24] and European soils [23]. The average U concentration in these soils is 4.24 mg/kg and all samples exceed the Portuguese reference value (1.90 mg/kg) up to a maximum of 11.0 mg/kg (maximum concentration 7 times higher than the Portuguese limit). Nevertheless, in comparison with the Canadian Guidelines from [24], all samples show U concentration below the reference value (23 mg/kg) When compared to the national [23] and Canadian guidelines [24], over 90% of the samples have As concentrations above the reference values of 11 and 12 mg/kg, respectively, with maximum values reaching 62.8 mg/kg (about 6 times higher than the reference values).
In 74% of the samples, the V concentration is above the Portuguese reference, and only 30% of the samples this concentration is above the reference value proposed by the Canadian guidelines.
Regarding the Be concentrations in the soils, 68% of the samples presented concentrations above the Portuguese reference value of 2.5 mg/kg, up to a maximum of 3.26 mg/kg.
Considering the Cr levels, 62% of the soils are above the regulated threshold values in Portugal (67 mg/g) and 70% of the samples present grades higher than the Canadian reference value (64 mg/kg), up to a maximum of 209 mg/kg.
There were 42% of samples exceeding the Mo value proposed by the Portuguese soil guideline of 2 mg/kg, up to a maximum of 6.03 mg/kg.
As for Pb, 42% of the soil samples showed concentrations above the Portuguese reference value of 45 mg/kg. However, only 18% of the samples exceed the value proposed by the Canadian guideline (70 mg/kg) to a maximum of 164 mg/kg.
In the case of Cu, 16% of the samples presented concentrations above the reference value proposed of 62 mg/kg and 63 mg/kg by the Portuguese and Canadian guidelines, respectively.
There were 14% of soil samples with Ni concentrations above the Portuguese reference value (37 mg/kg) and only one sample exceeding the Canadian legislation.
Six percent of the soil samples have Co concentrations above the Portuguese reference value (19 mg/kg), up to a maximum of 32.6 mg/kg.
The average concentration of Zn in these soils was significantly lower than the reference values. Only 2% of the samples showed concentrations above the reference value proposed by APA (290 mg/kg). While in what concerns the Canadian guidelines, 10% of the soil samples have concentrations higher than the reference value proposed (200 mg/kg).
All Cd levels fall below the reference values for contaminated agricultural soil provided by APA and CCME.
Major elements concentration values in the São Pedro da Cova soils are similar to the EuroGeoSurveys-FOREGS geochemical baseline provided for European Soils [23], pointing to a slight decrease in Ca, Mg, Na, P, and Ti.
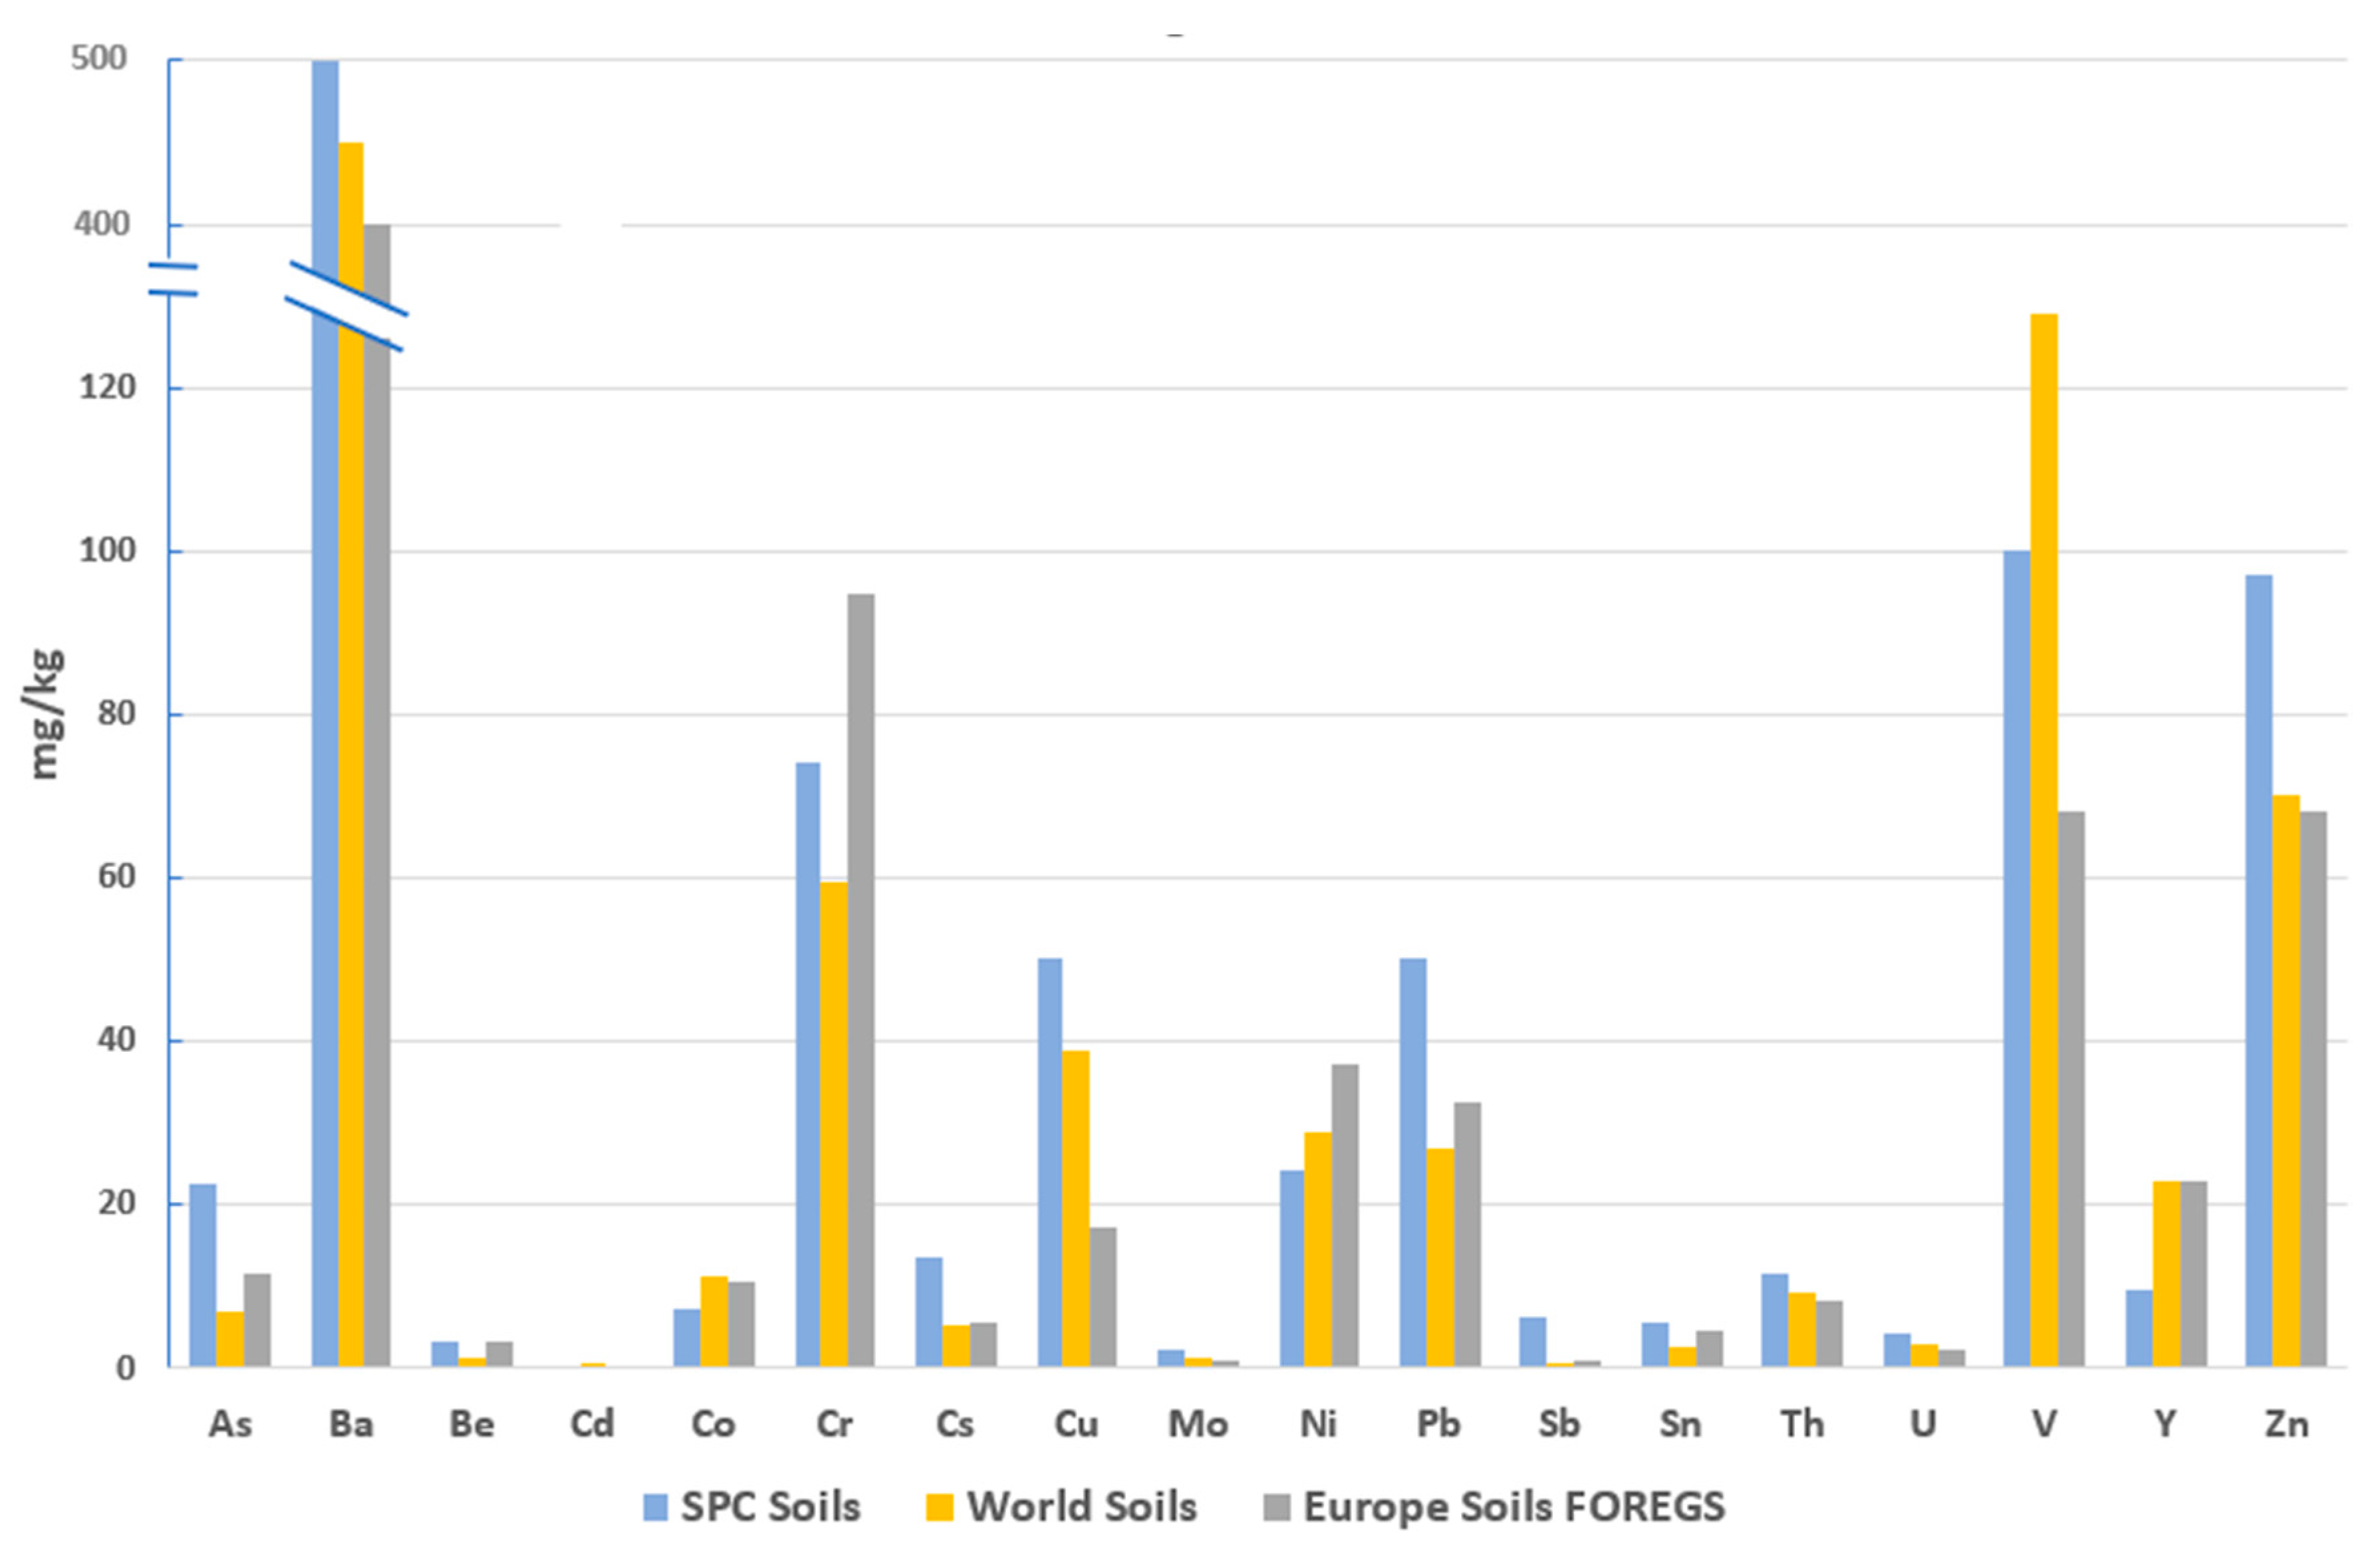
Figure 2 presents a comparison of the trace element concentrations in the soils of the study area and European topsoils from the Geochemical Atlas of Europe [23] and average concentrations of trace elements in world surface soils [24].
The concentration of trace elements in the studied soils points to higher concentrations of As, Cs, and Sb, with average values of 22.6, 13.6, and 6.29 mg/kg, respectively, when compared to (1) European topsoils [23] with 11.6, 5.58 and 1.04 mg/kg, respectively, and (2) the world soils [24], with average concentration of As, Cs, and Sb of 6.83, 5.06, and 0.67 mg/kg. Other trace elements, such as Mo, Be, Cu, Pb, Zn, Sn, Th, and U, also show higher concentrations in São Pedro da Cova, than other topsoils in Europe [25] and worldwide [26] (Figure 2).
Given the coal fire that has been active for 17 years in the waste pile of the São Pedro da Cova mine, probably leading to a migration of atmospheric contaminants, the concentrations of nine PTEs present in the soils surrounding the mine, were also compared with the concentrations of trace elements identified in the vicinity of coal-fired power generation centres from different parts of the world [7,27,28,29,30]. These soils were also compared with the composition of the fly ash resultant from Tapada do Outeiro coal power production, where the Douro coalfield coal (including the one providing from São Pedro da Cova mine) was burned (Table 3).
The As concentrations in the studied soils, range from 6.30 to 62.8 mg/kg and are similar to the As present in fly ash from Tapada do Outeiro (whereas concentrations range from 28–82 mg/kg). However, in general, the As content is higher than in the soils from the vicinity of other power plants worldwide.
The concentrations of Cu, Pb, and Zn measured in São Pedro da Cova soils, can reach maximum values of 352 mg/kg, 164 mg/kg, and 303 mg/kg, respectively. These values are significantly higher than the concentrations determined in the waste pile, and higher than the Tapada do Outeiro fly ash, which may indicate that other sources of metals may be contributing to the system.

3.2. Contamination Sources and PTEs Spatial Distribution

3.2.1. Physicochemical Characterization

To gain an understanding of the mobility of the PTEs in the study area, soil properties such as pH, organic matter content, and electrical conductivity were determined (Table 4) and the correlations of the soil physicochemical properties with PTEs concentration values are expressed in the Spearman’s rank correlation matrix in Table 5.
The pH measured on topsoil varied between 3.92 and 8.17, with an average pH of 5.84. Most soils vary from extremely acid to neutral levels, only two samples were slightly alkaline (7.4), and one sample registered a moderately alkaline pH of 8.17. A total of 72 % of the samples registered a pH below 6.5 from slightly acid to extremely acid and 22 % of the soils were neutral with pH ranging from 6.6 and 7.3. Only 6% of the samples ranged between 7.4 and 8.17, slightly to moderately alkaline.
The spatial distribution of soil pH (Figure 3) shows that the lower pH values are located along a NW-SE trend and to the east, in forest areas upstream of the waste pile. The samples collected downstream of the waste pile are not significantly acidic, ranging between 6.1 and 6.4, with only one sample on the external limit of the waste pile runoff area, with an acidic pH of 4.82. This sampling point is contiguous to the acidic pH measured upstream, to the east, and therefore should be under its influence. The spatial distribution of soil pH suggests that the São Pedro da Cova waste pile is not promoting significant acid mine drainage, which is in accordance with the previous studies focusing on the coal mine effluents [21].
Cd (ρ = 0.49; p < 0.05), Co (ρ = 0.38; p < 0.05), Cu (ρ = 0.31; p < 0.05), Pb (ρ = 0.50; p < 0.05), and Zn (ρ = 0.56; p < 0.05) display significant positive correlations with pH. The Cd, Pb and Zn contents show a moderate positive correlation with soil pH, whereas Co and Cu show a weak positive correlation. The highest concentrations of these elements should not be preferentially associated with acidic soil environments. Low soil pH may decrease the adsorption of these elements by negatively charged mineral particles, for example on clays, and as a direct consequence increase their mobility [55,56]. The spatial distribution of the highest concentrations of Pb and Zn is associated with soil neutral pH.
Soil pH has also a significant weak negative correlation with As (ρ = −0.33; p < 0.05) and Cr (ρ = −0.31; p < 0.05), suggesting that As and Cr concentrations may be moderately associated with more acidic environments. In fact, the spatial pattern of As and Cr distribution in the study area suggests that highest concentrations are spatially associated with the lowest pH values measured on the studied soils, along the north-eastern limits of the study area, upstream of the mine waste pile, this region is densely populated by eucalyptus which can cause soil acidification [57,58].
Organic matter measured by LOI in the study area was extremely variable, ranging from 3.84% up to 32.02%. Organic matter has multiple functions in soil, affecting both chemical and physical properties, one of its most relevant properties is to bind trace elements [59].
The Spearman’s correlation coefficient matrix presented in Table 5 highlights significant moderate positive correlations between organic matter, As (ρ = 0.46; p < 0.05) and Sb (ρ = 0.47; p < 0.05) and a significant week correlation with Cr (ρ = 0.31; p < 0.05).
Soil electrical conductivity (EC) fluctuated on the samples, ranging from 22 to 475 µS/cm, with a significant variance and highly skewed distribution. However, only one sample overcomes the reference value limits proposed by the Portuguese Environmental Agency for EC for agricultural soils with 475 µS/cm[23]. The soil EC does not show significant correlations with the PTE presented in Table 5.

3.2.2. Soil Magnetic Susceptibility

Previous studies in the São Pedro da Cova waste pile, have demonstrated that magnetic susceptibility varies significantly in burning/burnt samples, tending to an enhancement in burnt or burning samples [17]. In this research, a general characterization of the soil magnetic susceptibility in the surrounding area of the waste pile was attained to gain an understanding of the atmospheric dissemination of magnetic contaminants from the self-burning waste pile.
Minerals containing Fe are the most significant in magnetic studies, and these minerals result from pedogenetic processes, of parent rocks, eventually mediated by bacterial activity, by lithogenic processes, and by anthropogenic activities [60,61]. Anthropogenic particles formed during high-temperature combustion of fossil fuels, dust, and fly ashes from various industries and vehicle emissions may create a significant enhancement of soil magnetic susceptibility [38]. Major sources for the formation of ferromagnetic minerals are high-temperature processes like fire. In the burning process, hematite and goethite can be reduced to magnetite. Upon heating to approximately 250 °C, lepidocrocite converts to maghemite [62].
Although coal is predominantly non-magnetic, the products generated during combustion can be rich in magnetic iron oxides and include magnetite spherules [63,64,65]. The pyrite oxidation in coal at high temperature can produce molten iron spheres and sulphur. Besides, iron oxides can form magnetite-type and hematite-type, which are frequent materials in fly ash [38]. Some iron oxides have strong ferromagnetic or ferrimagnetic properties allowing the detection by magnetic susceptibility measurements [66,67]. In coal ash, iron oxides may occur in many forms, including dendritic patterns on the surface and within glassy aluminosilicate spheres [41,68].
The magnetic susceptibility was determined in the soils that surround the self-burning coal waste pile. To analyse spatial trends in this parameter, the magnetic susceptibility measures were overlayed to their spatial distribution inferred by geostatistical modelling (IDW) (Figure 4). This approach was adopted to explore potential enhancements in this parameter caused by the aerial dissemination of ferromagnetic particles from the waste pile combusting areas.
Regarding the spatial distribution of the soil magnetic susceptibility, the lowest values were observed contiguously to the waste pile, ranging between 2.15 × 10⁻⁸ and 366 × 10−8 m3/kg, and the highest values obtained are restricted to upstream of the waste pile, in areas rich in As and Fe. Over these areas, the magnetic susceptibility reached values as 1003 × 10−8 m3/kg, pointing to other possible origins for the ferrimagnetic minerals present in soils, not related to the self-burning process.
Magnetic susceptibility is a parameter very sensitive to the presence of ferrimagnetic minerals, thus the ferrimagnetic fraction of the soil samples with higher magnetic susceptibility values was separated using a ferrite magnet and that fraction was analysed using scanning electron microscopy with energy dispersive X-ray spectrometry (SEM-EDX). Samples of the original soil were also studied under the same methodologies for comparison purposes.
The vast majority of ferrimagnetic particles identified by SEM-EDX were iron oxides partially coated by aluminium silicates, with irregular shapes, and with very different granulometry (from µm up to over 1 mm), which are consistent with pedogenetic processes (Figure 5a–c). Nonetheless, extremely rare iron oxide spherules were found, some showing octahedral iron oxide crystallization (Figure 5d), skeletal-dendritic patterns (Figure 5e) [69] and/or molten aluminium silicates on its surface. One single char particle, rounded, porous, with vesiculated walls was found in one sample (Figure 5f). However, this char is not consistent with high-rank coal chars as anthracite [70]. Therefore, wildfires could be a possible origin for these iron spherules and char.
Pedogenesis seems to be the most dominant process controlling the soil magnetic susceptibility surrounding the São Pedro da Cova coal mine, with an atmospheric dissemination of fly ash and particulate matter from the combusting waste pile only playing a minor role.

3.2.3. Inter Elementary Relations and Spatial Distribution

To identify the possible sources of PTEs in the studied soils and consider the different sources of contamination that may co-exist in the region, a combined approach was used, using multivariate data analysis and geostatistics. The analysis was focused on principal component analysis (PCA) to group the elements based on their similarities and spatial features, through the analysis of elementary spatial distribution using geostatistical algorithms, namely ordinary kriging.
PCA was selected to reduce the high dimensionality of variables, and to study the inter-elements relationships and infer PTEs sources, as positive correlations between different elements suggest analogous origins and similar dissemination processes [27,71,72,73]. The data were transformed using the centred log-ratio (CLR), according to compositional data analysis [74]. In this transformation each variable is divided by the geometric mean of all values and then log normalized (centred) [75]. The PCA calculations and correspondent graphical results were produced with the TIBCO Statistica software [31], using the correlation matrix (covariance matrix of the standardized scaled variables).
The number of significant principal components was selected according to the Kaiser criterion [76]. According to the results from PCA (Table 6), five principal components were extracted cumulatively, accounting for 77% of the total variance in the study area. The numerical output with the eigenvalues ≥ 1 of principal components that provided useful information are listed in Table 6. Figure 6 represents biplots of the factor coordinates of the variables in the correlation circle comparing principal component 1 (PC1) with principal components 2 (PC2), 3 (PC3), 4 (PC4), and 5 (PC5).
The first principal component PC1 explains 35% of the total variance and highlights an association between Pb, Zn, Cd, Sn, and P, which correlates negatively with Mo, Fe, As, Th, Cr, and Al. The strong association of the first group of elements points out a common origin for these elements, and the negative correlation with some major elements as Fe and Al that are typically associated with a lithogenic or pedogenic origin [71,77], points to a common anthropogenic origin. The combination of elements is consistent with the typical usage of agrochemicals and phosphorous fertilizers in agriculture, which may lead to an increase in Cu, Zn, and Cd in soils [78,79,80]. The P concentrations in soils, as well as K, may reflect the use of agrochemicals in soils [81]. Tin compounds may be released on roads, and in agricultural activities, being present in many pesticides [26,82]. The opposing association of Mo, Fe, As, Th, Cr, and Al may reflect a pedological source of elements, as this association correlates positively with Fe and Al.
The second principal component PC2, accounts for 17% of the variance and is characterized by a moderate Cu, Zn, Fe, and Cr association that correlates negatively with U and Th.
U and Th are elements often reported in coals [9,26], including the ones from São Pedro da Cova Coalfield, where Th presents a slight enrichment.
The third principal component PC3 explains 11% of the total variance and expresses a moderate to strong association between As, S, and Cs. This As association with S may point to a lithogenic component related with regional mineralization, whereas As may be related to its natural enrichment in the Valongo Anticline, which resulted in nearly 20 known occurrences of Au and Au-Sb mineralizations [83]. Most of the known occurrences are arsenopyrite/pyrite-rich quartz veins hosted in quartzites and metasedimentary intercalations along the Valongo Anticline [84,85].
The fourth principal component PC4 explains 8 % of the total variance, with strong influence from Ba that correlates negatively with Sb. Finally, the fifth principal component (PC5) explains 6% of the variance, reveals a gentle association between Sb and Ba that present negative correlation with S.
The spatial distribution analysis of different elements in the studied soils, using geostatistical algorithms, such as ordinary kriging combined with multivariate statistical analysis, identified associations of elements and their correlations, allowing to infer the main sources of PTEs present in the area. In this approach, Cu, Pb, Zn, Cd, and Sn are spatially associated and present good statistical correlations. The higher concentrations of these elements are preferentially located along the SW limit of the sampling grid, and are spatially coincident with an urban agglomeration, located on a topographic hilltop, upstream of the waste pile, therefore excluding the possibility that these elements have leached out from the mine wastes (Figure 7). This association can be suggestive of typical urban anthropogenic activities, as these elements can be derived from vehicle combustion, industrial activities, or the use of additives, fertilizers, fungicides, and pesticides in agriculture [86,87]. In the peri-urban zone of São Pedro da Cova subsistence farming, which involves the use of agrochemicals, coexists with small industrial companies, including one facility for machining and injection of metal parts and accessories.
Arsenic and Mo showed good statistical correlation and are spatially associated (Figure 8). Its highest concentrations are located upstream of the waste pile, following a NW-SE trend, the same as local lithology and regional dominant structures, pointing to a pedological source, related to a naturally high regional background of these elements. The Valongo Anticline is well known for its mineral occurrences, which resulted in over 20 Au and Au-Sb mineralizations [83,84,85]. The statistical correlation of As, Mo and Cr can also be validated in space since the preferential distribution of these elements overlap.
The As distribution also highlights two other concentration areas (Figure 8), suggesting that there could be two other sub-dominant sources, for As in soils. One area locates approximately 250 m from the waste pile, along the waste pile runoff area, and despite not showing a clear spatial correlation with other PTEs, it is spatially associated with S and Se, pointing to a leaching effect in the mine waste pile. The second As-rich area is positioned in the urban area, upstream of the waste pile, spatially associated with other PTEs such as Co, Ni, Pb, Zn, Cu, and Cd, pointing to an anthropogenic urban source.
There is a spatial overlap of the highest concentrations of U, Th, Ba, Be, and Ta, which is mainly located along carboniferous units composed of conglomerates, arkoses, carbonaceous schists, and anthracites [88], pointing to a lithogenic source (Figure 9). The sampling point with the highest concentration is contiguous to the main waste pile, and despite not being perfectly included by the main waste pile drainage basin, it may be affected by small mining waste deposits that occur in this area since these are elements commonly present in coals [9,89].

3.3. Soil PAHs Characterization

The concentration of the 16 priority PAHs in 15 soil samples surrounding the main waste pile in the São Pedro da Cova are presented in Table 7.
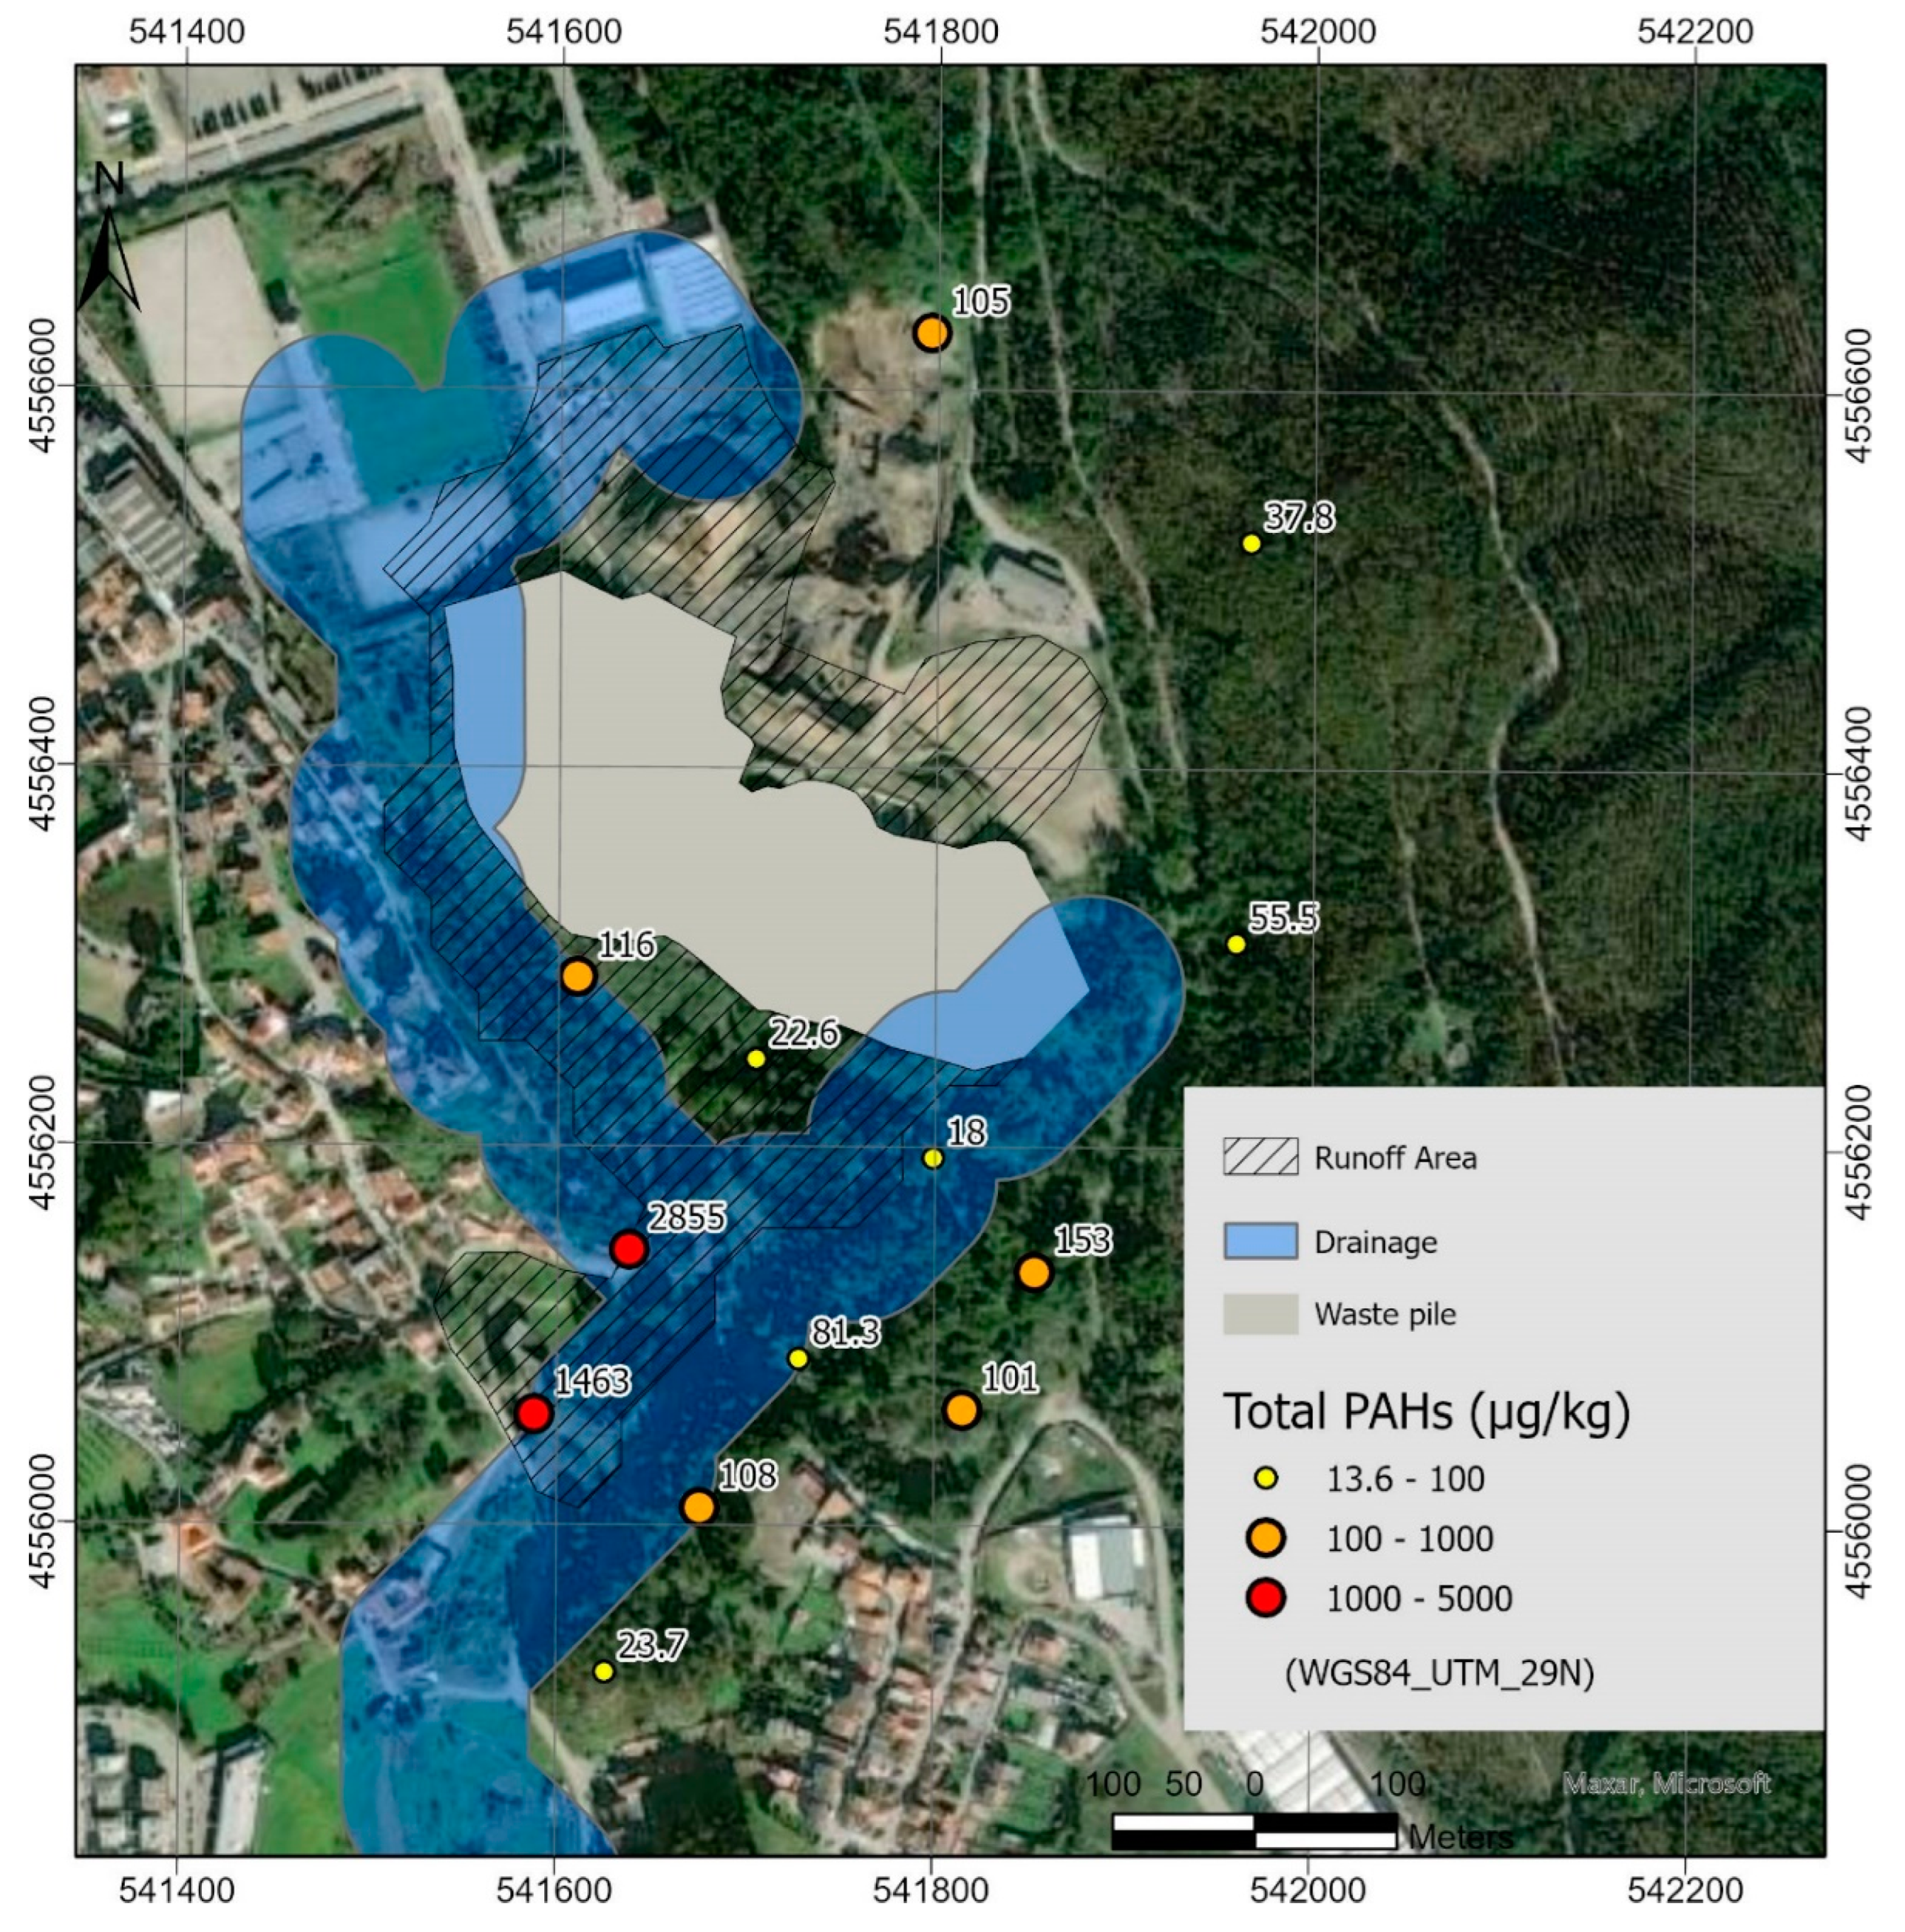
The priority PAHs sums varied at different sampling locations (Figure 10). The samples located upstream of the waste pile, in forest areas, presented a total of the 16 priority PAHs, ranging from 13.6 µg/kg to 55.5 µg/kg, with one sample (SP10) presenting a higher sum of 105.3 µg/kg (this sample may, however, be affected by the steel industry residues deposited, since it is located along the northern border of the landfill).
The samples collected along the runoff, contiguously to the main waste pile, presented a sum of the 16 PAHs on the two samples immediately downstream of the waste pile (22.6 and 116 µg/kg), while two other samples located further downstream registered higher sums of the priority PAHs, 2855 µg/kg (SP42) and 1463 µg/kg (SP49). These greater concentrations seem to be related to the material deposited directly in soils as a result of centuries of mining since the first sample is located next to the mine shaft elevator and the second outside of the old mine processing facilities. The dominant PAH in these samples is benzo[b]fluoranthene, ranging from 4.29 to 615 µg/kg.
A Shapiro–Wilk test was performed, showing that the distribution of the sum of priority PAHs departed significantly from normality (W = 0.47, p-value < 0.01). Based on this outcome, a non-parametric Kruskal–Wallis Test was conducted to examine the differences on the sum of the 16 PAHs in samples collected upstream of the waste pile, along its runoff area and in areas upstream with influence from minor coal mining waste deposits. No significant differences were found (Chi-square = 2.75, p = 0.25, df = 2).
Samples collected upstream of the mine main waste pile, but potentially influenced by minor mining waste deposits, presented a sum of the 16 priority PAHs that ranged from 18.0 to 153 µg/kg, with median sum values of 91.0 µg/kg.
In general, the samples collected upstream in the forest region, NE of Figure 10, with no influence from the mining wastes, presented less variability of the 16 priority PAHs. The median value of the sum of the 16 PAHs is 37.8 µg/kg, ranging from 13.6 and 55.5 µg/kg.
The values of the samples included in the waste pile runoff area present a median sum of priority PAHs of 69.2 µg/kg and 789 µg/kg when the two samples collected near the mining facilities are included.
The results were compared to the Portuguese reference values for soil contamination, regarding agriculture purposes, suggested by the Portuguese Environmental Agency (APA) [23]. All samples presented concentrations for the 16 priority PAHs below the reference values proposed, except samples SP42 and SP49. The first one exceeds the Portuguese reference values for anthracene and all the HMW PAHs (High Molecular Weight PAHs, containing 2 to 3 rings) analysed, except dibenz[ah]anthracene and benzo[ghi]perylene. The concentrations of pyrene and benzo[b]fluoranthene overcome the soil contamination threshold, by more than twice the value proposed by APA, as benzo[a]anthracene and benzo[a]pyrene concentrations are three times higher than the reference value and benzo[k]fluoranthene concentration is five times higher than the proposed reference value.
In sample SP49, the concentrations of benzo[a]anthracene, benzo[a]pyrene, and benzo[k]fluoranthene exceed the reference values almost by double. The high concentrations of HMW PAHs (High Molecular Weight PAHs, with 4 to 6 rings) measured, particularly in SP42 and SP49 samples, are significant since benzo[a]anthracene, benzo[b]fluoranthene, benzo[a]pyrene, and benzo[k]fluoranthene are listed as carcinogenic PAHs [90], and may cause significant damage to the surrounding ecosystems as well as the human health.
Table 8 compiles the LMW and HMW PAHs percentages distributed in the soils upstream of the waste pile, along the runoff areas and influenced by small piles of waste. The samples located along the runoff area present higher proportions of HMW PAHs. On average, these samples include 77% of HMW and only 23% of LMW PAHs, while samples upstream unaffected by the waste pile, and potentially affected by small mining residues piles, seem more balanced, with LMW PAHs average contributes of 48% and 40% to total PAHs, respectively.
The ratio of LMW to HMW PAHs can be an expedient manner to infer if the sources of PAHs are petrogenic or pyrogenic [48,49]. If the LMW PAHs are the majority, it indicates that the PAHs are mainly petrogenic, otherwise, if HMW PAHs are higher than LMW PAHs, the sources are pyrogenic, mostly combustion reactions [91,92,93].
The soils from the surrounding area of the São Pedro da Cova mine show a clear predominance of HMW PAHs (Table 8), which tend to increase particularly along the waste pile runoff area, which points to a pyrogenic origin, possibly related to the self-combustion that has been occurring since 2005 in the waste pile. Previous studies concluded that the waste pile affected materials by self-burning showed greater concentration and variety of PAHs in the soil horizons with higher self-burning temperature, where HMW PAHs were dominant [16,20]
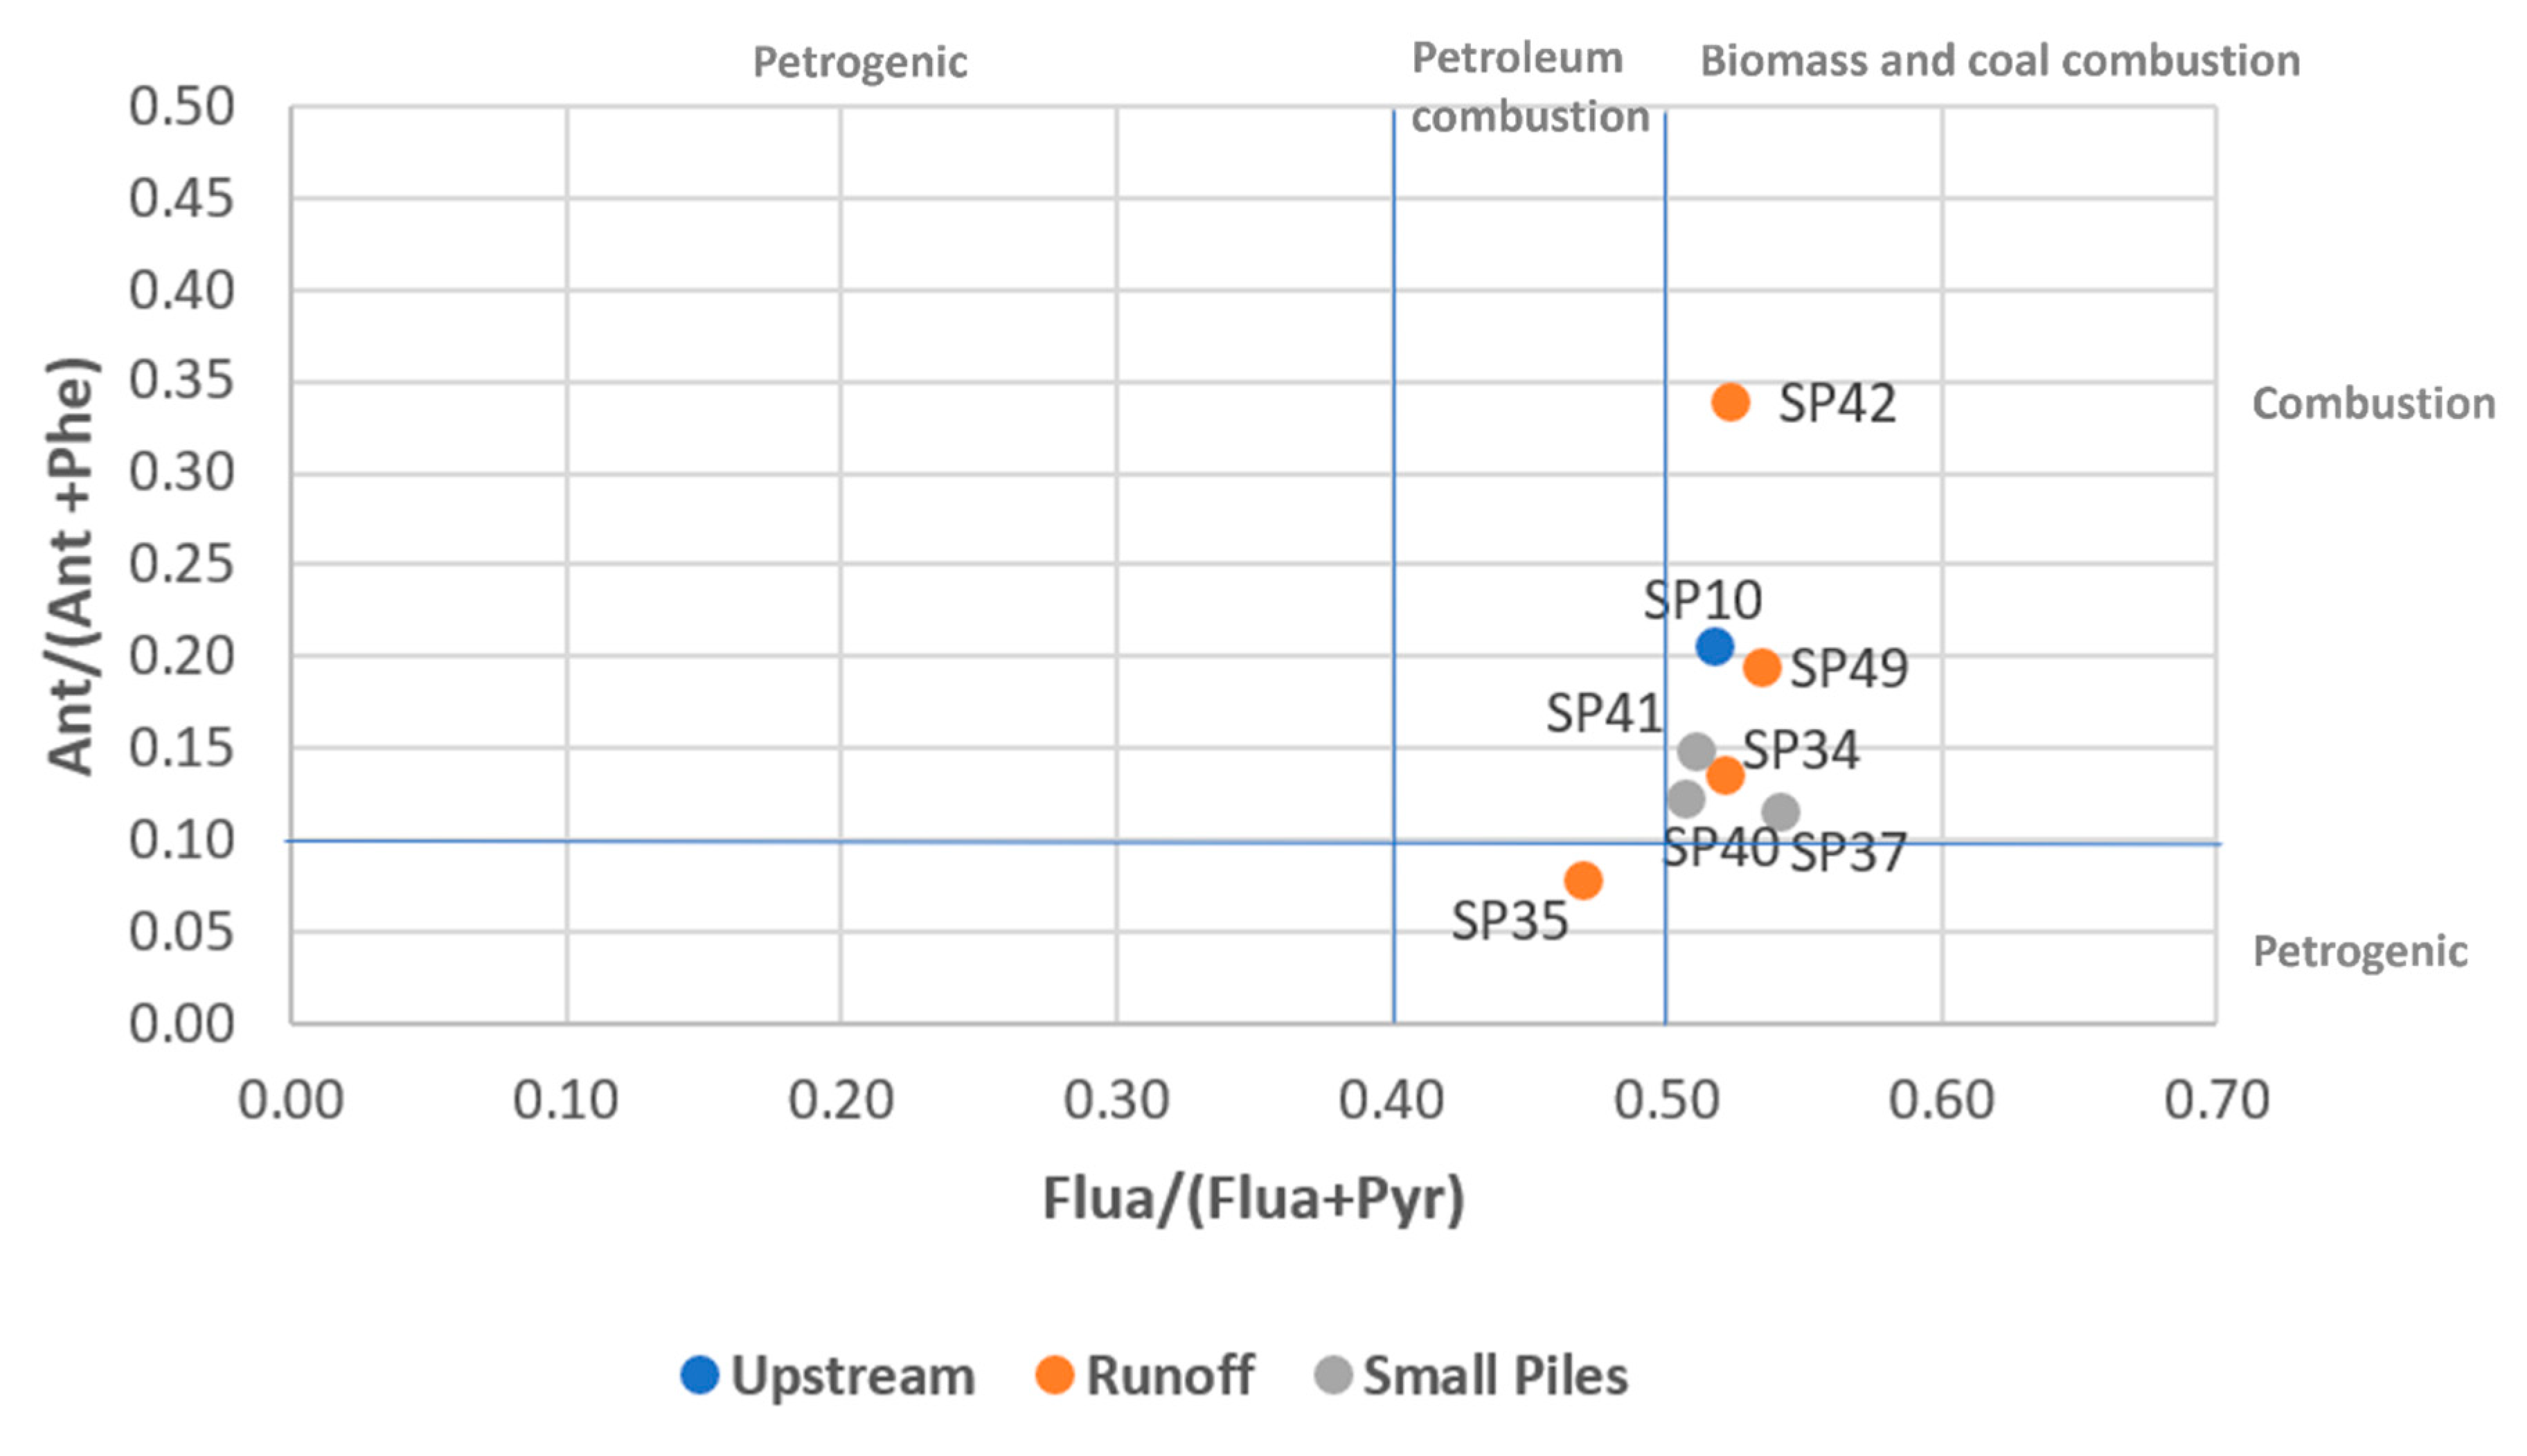
Diagnostic isomer ratios of PAHs can be used to identify the possible emission sources due to the different ratios produced by the multiple sources. In this study, four specific PAHs ratios were used to analyse the source of these PAHs and to distinguish between petrogenic and pyrolytic sources: BaA/(BaA + Chr), Ant/(Ant + Phe), Flua/(Flua + Pyr), and IP/(IP + Bghip) [93].
The ratio of Ant/(Ant + Phe) < 0.1 and Flua/(Flua + Pyr) < 0.4 suggests a petrogenetic source, while Ant/(Ant + Phe) ratio > 0.1 and Flua/(Flua + Pyr) > 0.4 points to combustion or pyrogenic sources. If Flua/(Flua + Pyr) is between 0.4 and 0.5 may imply liquid fossil fuel combustion and if Flua/(Flua + Pyr) is higher biomass and coal combustion [52].
As shown in Figure 11, most of the studied samples seem to have PAHs with combustion origins, and only in one sample (SP35) the PAHs source is classified as petrogenic by the Ant/(Ant + Phe) ratio. According to the ratio Flua/(Flua + Pyr), samples SP35 and SP12 described in Table 8, may potentially result from liquid fuel combustion. However, in most samples, the PAHs sources are coal and/or biomass combustion.
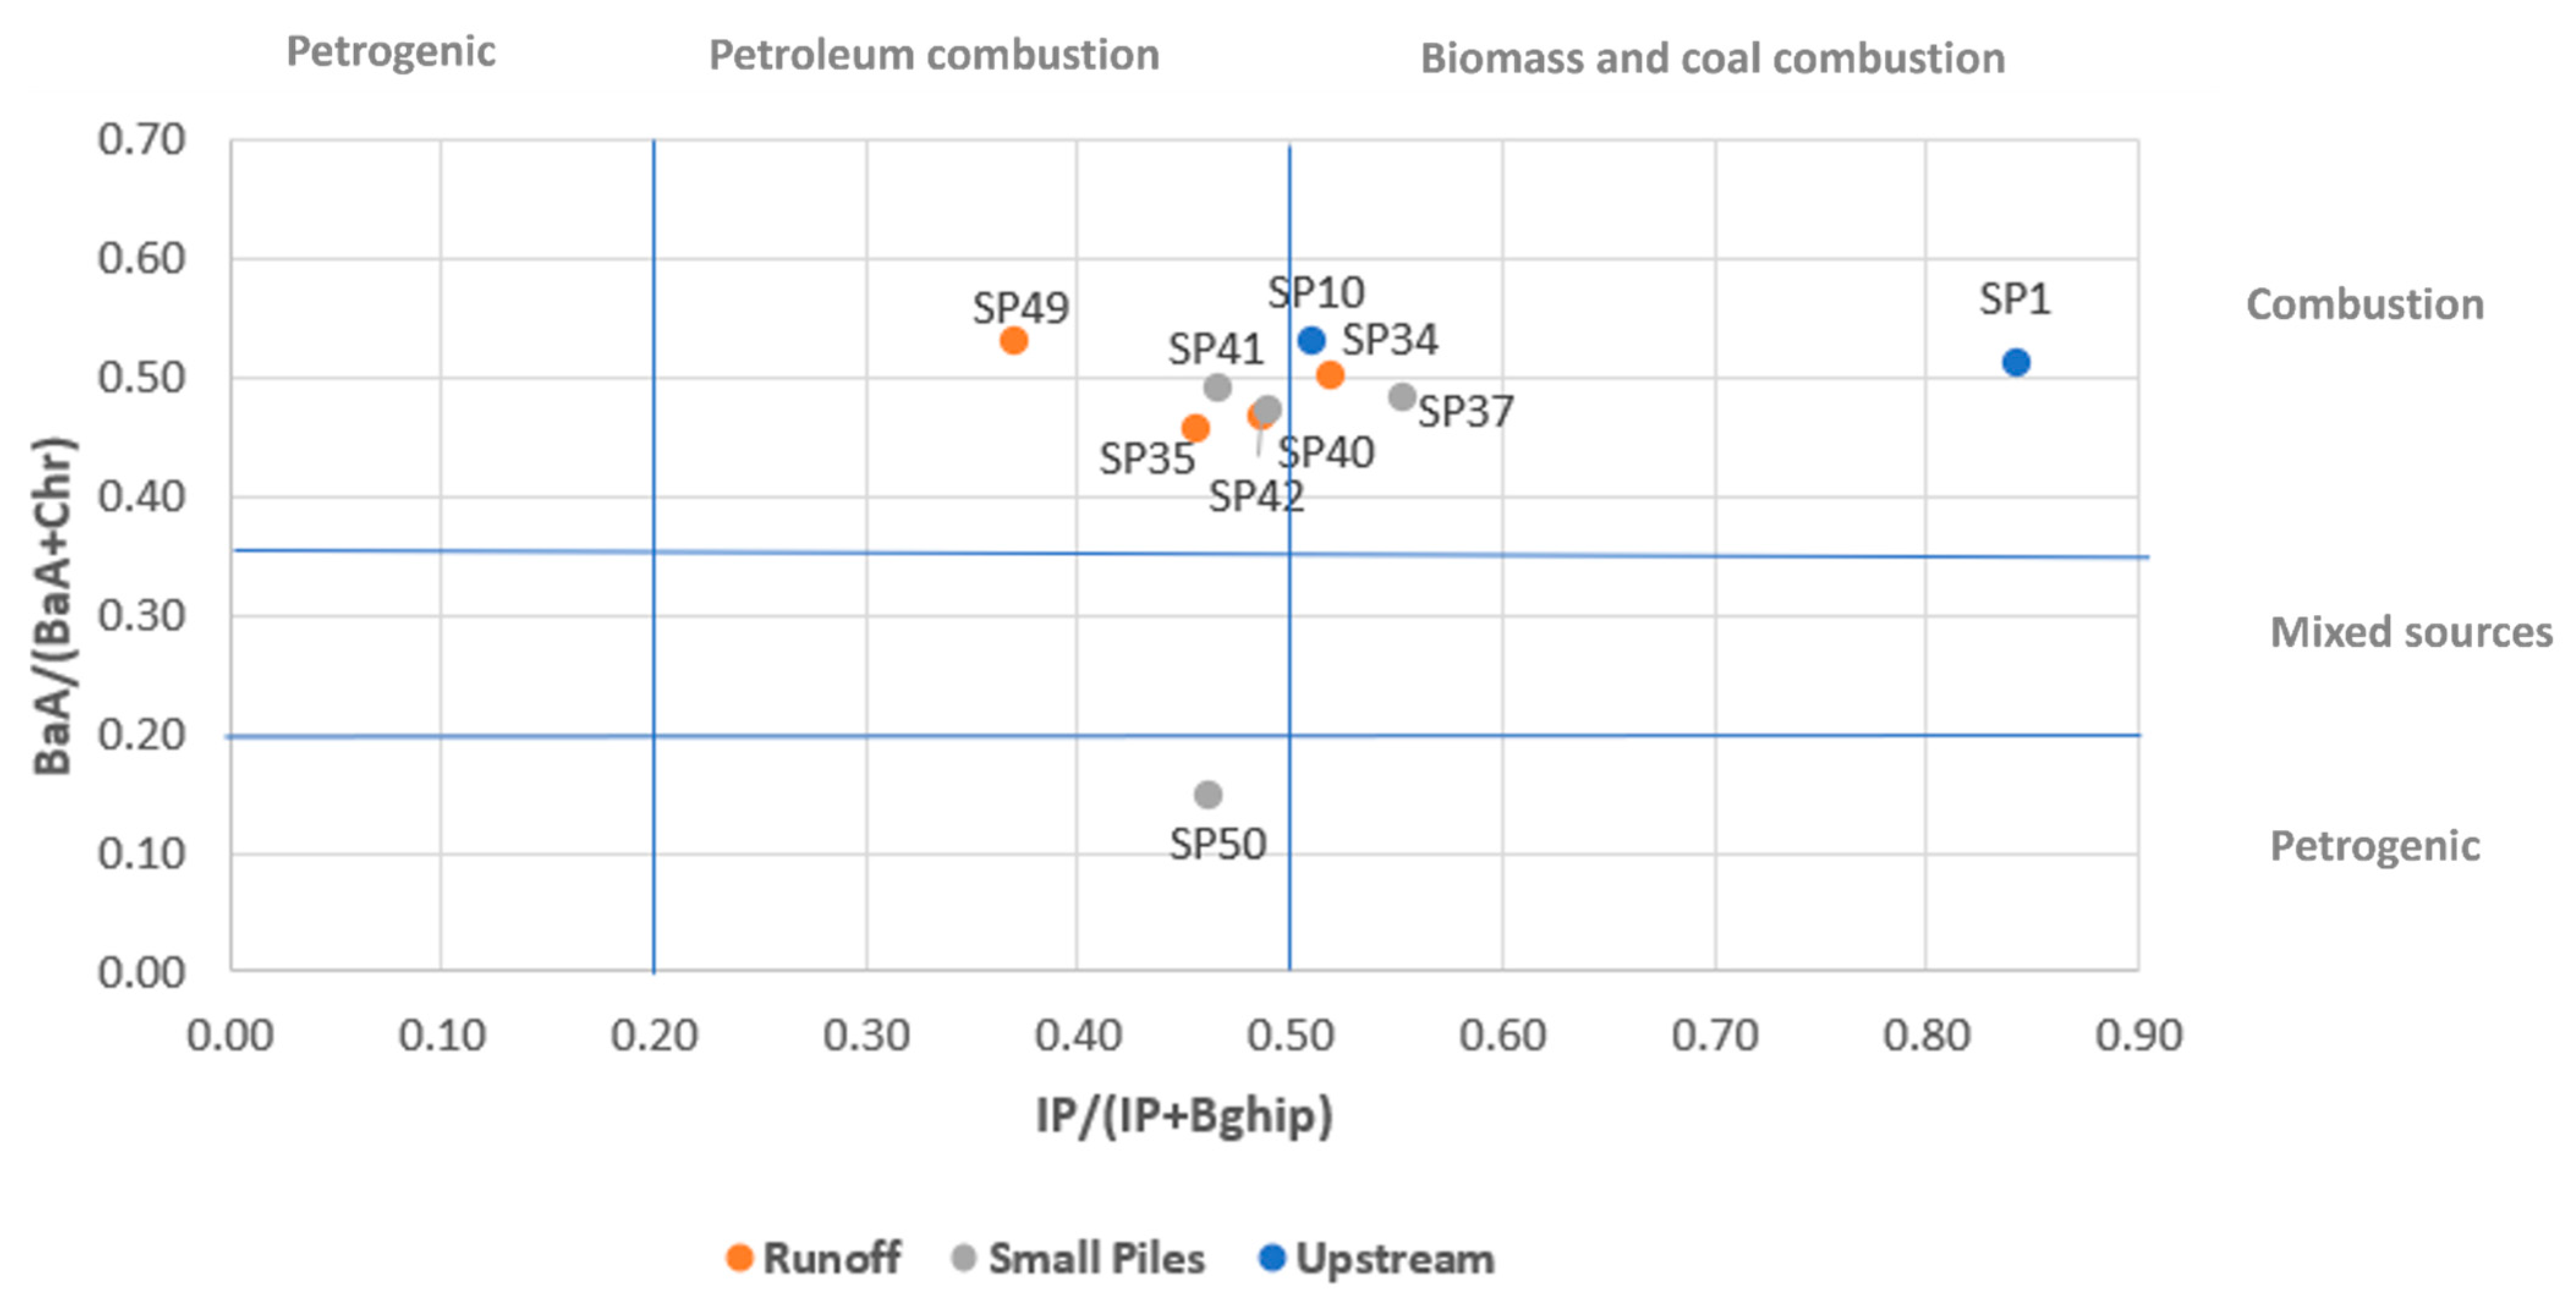
The ratios IP/(IP + BghiP) and BaA/(BaA + Chr) may be used to characterize the nature of potential PAH emission sources (Figure 12), while IcdP/(IcdP + BghiP) < 0.2 and BaA/(BaA + Chr) < 0.2 are indicative of petroleum and petrogenic sources. If BaA/(BaA + Chr) ranges between 0.2 and 0.35 and IP/(IP + BghiP) between 0.2 and 0.5, the PAHs usually come from petroleum combustion (liquid fossil fuel, vehicle, and crude oil combustion). If the IP/(IcdP + BghiP) and BaA/(BaA + Chr) ratios are greater than 0.5, the PAHs sources are coal, grass, and wood combustion [52]. Sample SP50 may be classified as petrogenic (Figure 12), according to the BaA/(BaA + Chr) ratio.
Considering the results obtained in this study, the PAHs sources in most of the samples were classified as coal or biomass combustion; in one sample, the PAHS are classified as petrogenic sourced, whereas in another sample they have mixed contributions. The ratio IP/(IcdP + BghiP) is slightly disruptive of the previous trends since it indicates petroleum combustion as the PAHs source in 5 samples.

4. Conclusions

The soils of the surrounding area of the São Pedro da Cova coal mine and waste pile constitute a complex system, where a combination of different elementary sources contributes to its final geochemical signature. According to Portuguese and international guidelines, these soils are not suitable for agriculture, since they present high concentrations of multiple trace elements, significantly above the reference values. The soil concentrations of As, Cs, and Sb are also significantly higher than the European topsoils [23] and in the world soils [24], and other trace elements such as Mo, Be, Cu, Pb, Zn, Sn, Th, and U, are also present in higher average concentrations. Nonetheless, the highest concentrations of potentially toxic elements are not located along the waste pile runoff or its drainage basin.
Despite previous studies pointing to an enhancement in magnetic susceptibility in burnt or burning waste pile materials [17], the spatial distribution of this parameter on soils surrounding the waste pile does not show an increase caused by atmospheric dissemination of fly ashes or particulate matter from the waste pile. In fact, the magnetic susceptibility of these soils seems to be controlled essentially by pedogenetic factors.
Multivariate data analysis allowed the grouping of the elements based on their similarities. The combination with spatial analysis concerning the elementary spatial distribution patterns using geostatistical algorithms gave a good insight into the possible sources of PTEs in these soils. Based on the spatial and statistical correlations, Cu, Pb, Zn, Cd, and Sn concentrate preferentially in urban areas located on a topographic hilltop, upstream of the waste pile. In this case, the elementary correlations suggest that the sources are typical urban anthropogenic activities, therefore excluding that these elements may have originated in the mine waste pile. Arsenic Mo and Cr are spatially associated and showed good statistical correlation. Their highest concentrations are located upstream of the waste pile, following regional lithological and structural NW-SE trends, pointing to a pedogenetic source, related to naturally high regional background concentrations of these elements on the Valongo Anticline. The As spatial distribution highlights two distinct areas, pointing to two other sub-dominant sources, for the As in soils. The first source is located at approximately 250 m from the waste pile, along the waste pile runoff area, and despite not showing a clear spatial correlation with other PTEs, it is spatially associated with S and Se, pointing to a leaching effect in the mine waste pile. The second area enriched in As is positioned in the urban zone, upstream of the waste pile, spatially associated with other PTEs as Co, Ni, Pb, Zn, Cu, and Cd, pointing to an anthropogenic urban contamination source.
The highest concentrations of U, Th, Ba, Be, and Ta overlap spatially and are mainly distributed along carboniferous units composed of conglomerates, arkoses, carbonaceous schists, and anthracites [88] pointing to a lithogenic source.
The soil samples collected along the runoff areas, actively draining from the waste pile are not significantly acidic. The spatial distribution of pH indicates that the São Pedro da Cova waste pile does not promote significant acid mine drainage to the surrounding soils.
Regarding the organic contamination promoted by the self-burning waste pile, the runoff areas present high concentrations of the 16 priority PAHs. Two samples presented concentrations above the Portuguese reference values for contaminated soils. The high concentrations of HMW PAHs, particularly in two samples, are relevant since the substances found, such as benzo[a]anthracene, benzo[b]fluoranthene, benzo[a]pyrene, and benzo[k]fluoranthene, are listed as carcinogenic [90], therefore with ecological and human health implications. The results from the samples located along the waste pile runoff areas present higher proportions of HMW PAHs. The predominance of HMW PAHs tends to increase particularly along the waste pile runoff areas, point to a pyrogenic origin on these PAHs, possibly related to the self-combustion that has been occurring since 2005 in these waste pile.
The diagnostic isomer ratios classified most of the samples as having PAHs that resulted from coal or biomass combustion, with the PAHs from two samples being classified as petrogenic-sourced and from another sample as having mixed contributions. The ratio IP/(IcdP+BghiP) was the only isomer ratio slightly disruptive of the previous trends, classifying the PAHs from 5 samples as originated by petroleum combustion.
The research characterizes physicochemical and geochemical changes that may occur in the soils that surround a coal mine waste pile affected by self-combustion, highlighting the complexity of PTEs and PAHs sources that may co-exist, particularly when the mines are contiguous to the urban areas. These results can be particularly relevant for the assessment of environmental impact of coal waste piles affected by self-combustion in soils.

Author Contributions

Conceptualization, P.S.; methodology, P.S., J.E.M., J.R., C.M., A.M., H.S. and R.F.; software, P.S.; validation, P.S., J.E.M., J.R., C.M., H.S., R.F. and D.F.; formal analysis, P.S., J.E.M., J.R. and D.F.; investigation, P.S., J.E.M. and J.R.; resources, J.E.M., C.M., A.M., H.S., R.F. and D.F.; data curation, P.S.; writing—original draft preparation, P.S.; writing—review and editing, P.S., J.E.M., J.R., C.M., H.S., R.F. and D.F.; visualization, P.S., J.E.M., J.R., C.M., H.S., R.F. and D.F.; supervision, D.F.; project administration, D.F.; funding acquisition, D.F. All authors have read and agreed to the published version of the manuscript.

Funding

This work was funded through the Foundation for Science and Technology, through the CoalMine project with the ref. POCI-01-0145-FEDER-030138, 02-SAICT-2017, by FEDER funding through the COMPETE 2020 programme and framed within the ICT activities (projects UIDB/04683/2020 and UIDP/04683/2020).

Data Availability Statement

Not applicable.

Acknowledgments

The authors want to acknowledge João Rocha and Ana Catarina Pinho for the support given in several steps of the CoalMine project.

Conflicts of Interest

The authors declare no conflict of interest.

References

  1. Fdez-Ortiz de Vallejuelo, S.; Gredilla, A.; da Boit, K.; Teixeira, E.C.; Sampaio, C.H.; Madariaga, J.M.; Silva, L.F.O. Nanominerals and Potentially Hazardous Elements from Coal Cleaning Rejects of Abandoned Mines: Environmental Impact and Risk Assessment. Chemosphere 2017, 169, 725–733. [Google Scholar] [CrossRef] [PubMed]
  2. Yenilmez, F.; Kuter, N.; Emil, M.K.; Aksoy, A. Evaluation of Pollution Levels at an Abandoned Coal Mine Site in Turkey with the Aid of GIS. Int. J. Coal Geol. 2011, 86, 12–19. [Google Scholar] [CrossRef]
  3. Ward, C.R.; French, D.; Riley, K.; Stephenson, L.; Farrell, O.; Li, Z. Element Leachability from a Coal Stockpile and Associated Coastal Sand Deposits. Fuel Process. Technol. 2011, 92, 817–824. [Google Scholar] [CrossRef]
  4. Bhattacharya, A.; Routh, J.; Jacks, G.; Bhattacharya, P.; Mörth, M. Environmental Assessment of Abandoned Mine Tailings in Adak, Västerbotten District (Northern Sweden). Appl. Geochem. 2006, 21, 1760–1780. [Google Scholar] [CrossRef]
  5. Bhuiyan, M.A.H.; Parvez, L.; Islam, M.A.; Dampare, S.B.; Suzuki, S. Heavy Metal Pollution of Coal Mine-Affected Agricultural Soils in the Northern Part of Bangladesh. J. Hazard Mater. 2010, 173, 384–392. [Google Scholar] [CrossRef]
  6. Zerizghi, T.; Guo, Q.; Tian, L.; Wei, R.; Zhao, C. An Integrated Approach to Quantify Ecological and Human Health Risks of Soil Heavy Metal Contamination around Coal Mining Area. Sci. Total Environ. 2022, 814, 152653. [Google Scholar] [CrossRef]
  7. da Silva Júnior, F.M.R.; Ramires, P.F.; dos Santos, M.; Seus, E.R.; Soares, M.C.F.; Muccillo-Baisch, A.L.; Mirlean, N.; Baisch, P.R.M. Distribution of Potentially Harmful Elements in Soils around a Large Coal-Fired Power Plant. Environ. Geochem. Health 2019, 41, 2131–2143. [Google Scholar] [CrossRef] [PubMed]
  8. Finkelman, R.B. Potential Health Impacts of Burning Coal Beds and Waste Banks. Int. J. Coal Geol. 2004, 59, 19–24. [Google Scholar] [CrossRef]
  9. Finkelman, R.B.; Palmer, C.A.; Wang, P. Quantification of the Modes of Occurrence of 42 Elements in Coal. Int. J. Coal Geol. 2018, 185, 138–160. [Google Scholar] [CrossRef]
  10. Querol, X.; Zhuang, X.; Font, O.; Izquierdo, M.; Alastuey, A.; Castro, I.; van Drooge, B.L.; Moreno, T.; Grimalt, J.O.; Elvira, J.; et al. Influence of Soil Cover on Reducing the Environmental Impact of Spontaneous Coal Combustion in Coal Waste Gobs: A Review and New Experimental Data. Int. J. Coal Geol. 2011, 85, 2–22. [Google Scholar] [CrossRef]
  11. Liu, X.; Shi, H.; Bai, Z.; Zhou, W.; Liu, K.; Wang, M.; He, Y. Heavy Metal Concentrations of Soils near the Large Opencast Coal Mine Pits in China. Chemosphere 2020, 244, 125360. [Google Scholar] [CrossRef] [PubMed]
  12. Marove, C.A.; Tangviroon, P.; Tabelin, C.B.; Igarashi, T. Leaching of Hazardous Elements from Mozambican Coal and Coal Ash. J. Afr. Earth Sci. 2020, 168, 103861. [Google Scholar] [CrossRef]
  13. ISO 11760 Classification of Coals, 1st ed.; International Organization for Standardization: Geneva, Switzerland, 2005; p. 9.
  14. Ribeiro, J.; Ferreira da Silva, E.; Flores, D. Burning of Coal Waste Piles from Douro Coalfield (Portugal): Petrological, Geochemical and Mineralogical Characterization. Int. J. Coal Geol. 2010, 81, 359–372. [Google Scholar] [CrossRef]
  15. Ribeiro, J.; Ferreira da Silva, E.; de Jesus, A.P.; Flores, D. Petrographic and Geochemical Characterization of Coal Waste Piles from Douro Coalfield (NW Portugal). Int. J. Coal Geol. 2011, 87, 226–236. [Google Scholar] [CrossRef]
  16. Ribeiro, J.; Silva, T.; Mendonça Filho, J.G.; Flores, D. Polycyclic Aromatic Hydrocarbons (PAHs) in Burning and Non-Burning Coal Waste Piles. J. Hazard Mater. 2012, 199–200, 105–110. [Google Scholar] [CrossRef]
  17. Ribeiro, J.; Sant’Ovaia, H.; Gomes, C.; Ward, C.; Flores, D. Mineralogy and Magnetic Parameters of Materials Resulting from the Mining and Consumption of Coal from the Douro Coalfield, Northwest Portugal. In Coal and Peat Fires: A Global Perspective; Elsevier Inc.: Amsterdam, The Netherlands, 2014; Volume 3, pp. 494–508. ISBN 9780444595119. [Google Scholar]
  18. LNEC. Avaliação Das Quantidades e Características Físico-Químicas Dos Resíduos Depositados Nas Escombreiras Das Antigas Minas de São Pedro Da Cova (Gondomar). Relatório 121/2011; Laboratório Nacional de Engenharia Civil: Lisbon, Portugal, 2011. [Google Scholar]
  19. Teodoro, A.; Santos, P.; Espinha Marques, J.; Ribeiro, J.; Mansilha, C.; Melo, A.; Duarte, L.; Rodrigues De Almeida, C.; Flores, D. An Integrated Multi-Approach to Environmental Monitoring of a Self-Burning Coal Waste Pile: The São Pedro Da Cova Mine (Porto, Portugal) Study Case. Environments 2021, 8, 48. [Google Scholar] [CrossRef]
  20. Espinha Marques, J.; Martins, V.; Santos, P.; Ribeiro, J.; Mansilha, C.; Melo, A.; Rocha, F.; Flores, D. Changes Induced by Self-Burning in Technosols from a Coal Mine Waste Pile: A Hydropedological Approach. Geosciences 2021, 11, 195. [Google Scholar] [CrossRef]
  21. Mansilha, C.; Melo, A.; Flores, D.; Ribeiro, J.; Ramalheira Rocha, J.; Martins, V.; Santos, P.; Espinha Marques, J. Irrigation with Coal Mining Effluents: Sustainability and Water Quality Considerations (São Pedro Da Cova, North Portugal). Water 2021, 13, 2157. [Google Scholar] [CrossRef]
  22. Pinto de Jesus, A. Evolução Sedimentar e Tectónica Da Bacia Carbonífera Do Douro (Estefaniano C Inferior, NW de Portugal. Cad. Lab. Xeolóxico De Laxe Rev. De Xeol. Galega E Do Hercínico Penins. 2003, 28, 107–125. [Google Scholar]
  23. APA. Solos Contaminados–Guia Técnico, Valores de Referência Para o Solo; Agência Portuguesa do Ambiente: Lisbon, Portugal, 2019. [Google Scholar]
  24. Canadian Environmental Quality Guidelines. Canadian Soil Quality Guidelines for the Protection of Environmental and Human Health: Summary Tables. Canadian Environmental Quality Guidelines; Canadian Council of Ministers of the Environment: Winnipeg, MB, Canada, 2007.
  25. Salminen, R.; Batista, M.J.; Bidovec, M.; Demetriades, A.; De Vivo, B.; De Vos, W.; Duris, M.; Gilucis, A.; Gregorauskiene, V.; Halamic, J.; et al. Geochemical Atlas of Europe. Part 1: Background Information, Methodology and Maps; Salminen, R., Ed.; Geological Survey of Finland: Espoo, Finland, 2005. [Google Scholar]
  26. Kabata-Pendias, A. Trace Elements in Soils and Plants, 4th ed.; Taylor & Francis Group: Boca Raton, FL, USA; London, UK; New York, NY, USA, 2011. [Google Scholar]
  27. Sun, L.; Guo, D.; Liu, K.; Meng, H.; Zheng, Y.; Yuan, F.; Zhu, G. Levels, Sources, and Spatial Distribution of Heavy Metals in Soils from a Typical Coal Industrial City of Tangshan, China. Catena 2019, 175, 101–109. [Google Scholar] [CrossRef]
  28. Dragović, S.; Ćujić, M.; Slavković-Beškoski, L.; Gajić, B.; Bajat, B.; Kilibarda, M.; Onjia, A. Trace Element Distribution in Surface Soils from a Coal Burning Power Production Area: A Case Study from the Largest Power Plant Site in Serbia. Catena 2013, 104, 288–296. [Google Scholar] [CrossRef]
  29. Stalikas, C.D.; Chaidou, C.I.; Pilidis, G.A. Enrichment of PAHs and Heavy Metals in Soils in the Vicinity of the Lignite-Fired Power Plants of West Macedonia (Greece). Sci. Total Environ. 1997, 204, 135–146. [Google Scholar] [CrossRef]
  30. Mandal, A.; Sengupta, D. An Assessment of Soil Contamination Due to Heavy Metals around a Coal-Fired Thermal Power Plant in India. Environ. Geol. 2006, 51, 409–420. [Google Scholar] [CrossRef]
  31. TIBCO. Statistica 13.4.014 [Computer Software]; TIBCO: Palo Alto, CA, USA, 2021. [Google Scholar]
  32. REFLEX. IoGASTM 7.4.2., IMDEX Limited [Computer Software]; REFLEX: Balcatta, Australia, 2022. [Google Scholar]
  33. ESRI. ArcGIS Pro [Computer Software]; ESRI: Redlands, CA, USA, 2021. [Google Scholar]
  34. Schumacher, B.A. Methods for the Determination of Total Organic Carbon (TOC) in Soils and Sediments; U. S. Environmental Protection Agency: Washington, DC, USA, 2002.
  35. Method D 2974-00; Test Methods for Moisture, Ash, and Organic Matter of Peat and Other Organic Soils. ASTM Standard: West Conshohocken, PA, USA, 2000.
  36. ISO 10390; Standard of Soil Quality–Determination of pH. International Organization for Standardization: Geneva, Switzerland, 1994.
  37. Mullins, C.E. Magnetic susceptibility of the soil and its significance in soil science—A review. J. Soil Sci. 1977, 28, 223–246. [Google Scholar] [CrossRef]
  38. Flanders, P.J. Collection, Measurement, and Analysis of Airborne Magnetic Particulates from Pollution in the Environment (Invited). J. Appl. Phys. 1994, 75, 5931–5936. [Google Scholar] [CrossRef]
  39. Flanders, P.J. Identifying Fly Ash at a Distance from Fossil Fuel Power Stations. Environ. Sci. Technol. 1999, 33, 528–532. [Google Scholar] [CrossRef]
  40. Hanesch, M.; Scholger, A.R. Mapping of Heavy Metal Loadings in Soils by Means of Magnetic Susceptibility Measurements. Environ. Geol. 2002, 42, 857–870. [Google Scholar] [CrossRef]
  41. Jordanova, D.; Hoffmann, V.; Fehr, K.T. Mineral Magnetic Characterization of Anthropogenic Magnetic Phases in the Danube River Sediments (Bulgarian Part). Earth Planet Sci. Lett. 2004, 221, 71–89. [Google Scholar] [CrossRef]
  42. Blundell, A.; Hannam, J.A.; Dearing, J.A.; Boyle, J.F. Detecting Atmospheric Pollution in Surface Soils Using Magnetic Measurements: A Reappraisal Using an England and Wales Database. Environ. Pollut. 2009, 157, 2878–2890. [Google Scholar] [CrossRef]
  43. Cowan, E.A.; Seramur, K.C.; Hageman, S.J. Magnetic Susceptibility Measurements to Detect Coal Fly Ash from the Kingston Tennessee Spill in Watts Bar Reservoir. Environ. Pollut. 2013, 174, 179–188. [Google Scholar] [CrossRef] [Green Version]
  44. Zhu, Z.; Li, Z.; Wang, S.; Bi, X. Magnetic Mineral Constraint on Lead Isotope Variations of Coal Fly Ash and Its Implications for Source Discrimination. Sci. Total Environ. 2020, 713, 136320. [Google Scholar] [CrossRef] [PubMed]
  45. Zhang, J.; Liu, F.; Huang, H.; Wang, R.; Xu, B. Occurrence, Risk and Influencing Factors of Polycyclic Aromatic Hydrocarbons in Surface Soils from a Large-Scale Coal Mine, Huainan, China. Ecotoxicol. Environ. Saf. 2020, 192, 110269. [Google Scholar] [CrossRef]
  46. Schoeny, R.; Poirier, K. Provisional Guidance for Quantitative Risk Assessment of Polycyclic Aromatic Hydrocarbons; U. S. Environmental Protection Agency: Washington, DC, USA, 1993.
  47. Temerdashev, Z.A.; Musorina, T.N.; Chervonnaya, T.A. Determination of Polycyclic Aromatic Hydrocarbons in Soil and Bottom Sediments by Gas Chromatography–Mass Spectrometry Using Dispersive Liquid–Liquid Microextraction. J. Anal. Chem. 2020, 75, 1000–1010. [Google Scholar] [CrossRef]
  48. Liu, W.; Wang, D.; Wang, Y.; Zeng, X.; Ni, L.; Tao, Y.; Wu, J.; Liu, J.; Zou, Y.; He, R.; et al. Improved Comprehensive Ecological Risk Assessment Method and Sensitivity Analysis of Polycyclic Aromatic Hydrocarbons (PAHs). Environ. Res. 2020, 187, 109500. [Google Scholar] [CrossRef] [PubMed]
  49. Davis, E.; Walker, T.R.; Adams, M.; Willis, R.; Norris, G.A.; Henry, R.C. Source Apportionment of Polycyclic Aromatic Hydrocarbons (PAHs) in Small Craft Harbor (SCH) Surficial Sediments in Nova Scotia, Canada. Sci. Total Environ. 2019, 691, 528–537. [Google Scholar] [CrossRef] [PubMed]
  50. Wang, W.; Huang, M.J.; Kang, Y.; Wang, H.S.; Leung, A.O.W.; Cheung, K.C.; Wong, M.H. Polycyclic Aromatic Hydrocarbons (PAHs) in Urban Surface Dust of Guangzhou, China: Status, Sources and Human Health Risk Assessment. Sci. Total Environ. 2011, 409, 4519–4527. [Google Scholar] [CrossRef]
  51. Sheikh Fakhradini, S.; Moore, F.; Keshavarzi, B.; Lahijanzadeh, A. Polycyclic Aromatic Hydrocarbons (PAHs) in Water and Sediment of Hoor Al-Azim Wetland, Iran: A Focus on Source Apportionment, Environmental Risk Assessment, and Sediment-Water Partitioning. Environ. Monit. Assess. 2019, 191, 233. [Google Scholar] [CrossRef]
  52. Yunker, M.B.; Macdonald, R.W.; Vingarzan, R.; Mitchell, R.H.; Goyette, D.; Sylvestre, S. PAHs in the Fraser River Basin: A Critical Appraisal of PAH Ratios as Indicators of PAH Source and Composition. Org. Geochem. 2002, 33, 489–515. [Google Scholar] [CrossRef]
  53. Katsoyiannis, A.; Sweetman, A.J.; Jones, K.C. PAH Molecular Diagnostic Ratios Applied to Atmospheric Sources: A Critical Evaluation Using Two Decades of Source Inventory and Air Concentration Data from the UK. Environ. Sci. Technol. 2011, 45, 8897–8906. [Google Scholar] [CrossRef]
  54. Ribeiro, J.; Valentim, B.; Ward, C.; Flores, D. Comprehensive Characterization of Anthracite Fly Ash from a Thermo-Electric Power Plant and Its Potential Environmental Impact. Int. J. Coal Geol. 2011, 86, 204–212. [Google Scholar] [CrossRef]
  55. Yu, H.Y.; Liu, C.; Zhu, J.; Li, F.; Deng, D.M.; Wang, Q.; Liu, C. Cadmium Availability in Rice Paddy Fields from a Mining Area: The Effects of Soil Properties Highlighting Iron Fractions and PH Value. Environ. Pollut. 2016, 209, 38–45. [Google Scholar] [CrossRef] [PubMed]
  56. Waterlot, C.; Pruvot, C.; Ciesielski, H.; Douay, F. Effects of a Phosphorus Amendment and the PH of Water Used for Watering on the Mobility and Phytoavailability of Cd, Pb and Zn in Highly Contaminated Kitchen Garden Soils. Ecol. Eng. 2011, 37, 1081–1093. [Google Scholar] [CrossRef]
  57. Korchagin, J.; Bortoluzzi, E.C.; Moterle, D.F.; Petry, C.; Caner, L. Evidences of Soil Geochemistry and Mineralogy Changes Caused by Eucalyptus Rhizosphere. Catena 2019, 175, 132–143. [Google Scholar] [CrossRef]
  58. Xu, Y.; Du, A.; Wang, Z.; Zhu, W.; Li, C.; Wu, L. Effects of Different Rotation Periods of Eucalyptus Plantations on Soil Physiochemical Properties, Enzyme Activities, Microbial Biomass and Microbial Community Structure and Diversity. For. Ecol. Manag. 2020, 456, 117683. [Google Scholar] [CrossRef]
  59. Bradl, H.B. Adsorption of Heavy Metal Ions on Soils and Soils Constituents. J. Colloid Interface Sci. 2004, 277, 1–18. [Google Scholar] [CrossRef] [PubMed]
  60. Dekkers, M.J. Environmental Magnetism: An Introduction. Geol. Min. 1997, 76, 163–182. [Google Scholar] [CrossRef]
  61. Magiera, T.; Strzyszcz, Z.; Kapicka, A.; Petrovsky, E. Discrimination of Lithogenic and Anthropogenic Influences on Topsoil Magnetic Susceptibility in Central Europe. Geoderma 2006, 130, 299–311. [Google Scholar] [CrossRef]
  62. Gendler, T.S.; Shcherbakov, V.P.; Dekkers, M.J.; Gapeev, A.K.; Gribov, S.K.; McClelland, E. The Lepidocrocite-Maghemite-Haematite Reaction Chain-I. Acquisition of Chemical Remanent Magnetization by Maghemite, Its Magnetic Properties and Thermal Stability. Geophys. J. Int. 2005, 160, 815–832. [Google Scholar] [CrossRef] [Green Version]
  63. Chaddha, G.; Seehra, M.S. Magnetic Components and Particle Size Distribution of Coal Flyash. J. Phys. D Appl. Phys. 1983, 16, 1767–1776. [Google Scholar] [CrossRef]
  64. Sokol, E.V.; Kalugin, V.M.; Nigmatulina, E.N.; Volkova, N.I.; Frenkel, A.E.; Maksimova, N.V. Ferrospheres from Fly Ashes of Chelyabinsk Coals: Chemical Composition, Morphology and Formation Conditions. Fuel 2002, 81, 867–876. [Google Scholar] [CrossRef]
  65. Zyryanov, V.V.; Petrov, S.A.; Matvienko, A.A. Characterization of Spinel and Magnetospheres of Coal Fly Ashes Collected in Power Plants in the Former USSR. Fuel 2011, 90, 486–492. [Google Scholar] [CrossRef]
  66. Thompson, R.; Oldfield, F. Environmental Magnetism; Allen and Unwin: London, UK, 1986. [Google Scholar]
  67. Verosub, K.L.; Roberts, A.P. Environmental Magnetism: Past, Present, and Future. J. Geophys. Res. Solid Earth 1995, 100, 2175–2192. [Google Scholar] [CrossRef]
  68. Kutchko, B.G.; Kim, A.G. Fly Ash Characterization by SEM–EDS. Fuel 2006, 85, 2537–2544. [Google Scholar] [CrossRef]
  69. Zhao, Y.; Zhang, J.; Sun, J.; Bai, X.; Zheng, C. Mineralogy, Chemical Composition, and Microstructure of Ferrospheres in Fly Ashes from Coal Combustion. Energy Fuels 2006, 20, 1490–1497. [Google Scholar] [CrossRef]
  70. Suárez-Ruiz, I.; Valentim, B.; Borrego, A.G.; Bouzinos, A.; Flores, D.; Kalaitzidis, S.; Malinconico, M.L.; Marques, M.; Misz-Kennan, M.; Predeanu, G.; et al. Development of a Petrographic Classification of Fly Ash Components from Coal Combustion and Co-Combustion. (An ICCP Classification System, Fly Ash Working Group–Commission III.). Int. J. Coal Geol. 2017, 183, 188–203. [Google Scholar] [CrossRef] [Green Version]
  71. Fan, M.; Margenot, A.J.; Zhang, H.; Lal, R.; Wu, J.; Wu, P.; Chen, F.; Gao, C. Distribution and Source Identification of Potentially Toxic Elements in Agricultural Soils through High-Resolution Sampling. Environ. Pollut. 2020, 263, 114527. [Google Scholar] [CrossRef]
  72. Wang, Z.; Hong, C.; Xing, Y.; Wang, K.; Li, Y.; Feng, L.; Ma, S. Spatial Distribution and Sources of Heavy Metals in Natural Pasture Soil around Copper-Molybdenum Mine in Northeast China. Ecotoxicol. Environ. Saf. 2018, 154, 329–336. [Google Scholar] [CrossRef]
  73. Sánchez-Donoso, R.; García Lorenzo, M.L.; Esbrí, J.M.; García-Noguero, E.M.; Higueras, P.; Crespo, E. Geochemical Characterization and Trace-Element Mobility Assessment for Metallic Mine Reclamation in Soils Affected by Mine Activities in the Iberian Pyrite Belt. Geosciences 2021, 11, 233. [Google Scholar] [CrossRef]
  74. Pincus, R. Aitchison, J.: The Statistical Analysis of Compositional Data. Chapman and Hall, London-New York 1986, XII, 416 pp., £ 25,00. Biom. J. 2007, 30, 794. [Google Scholar] [CrossRef]
  75. Filzmoser, P.; Hron, K.; Reimann, C. Univariate Statistical Analysis of Environmental (Compositional) Data: Problems and Possibilities. Sci. Total Environ. 2009, 407, 6100–6108. [Google Scholar] [CrossRef]
  76. Kaiser, H.F. The Application of Electronic Computers to Factor Analysis. Educ. Psychol. Meas. 1960, 20, 141–151. [Google Scholar] [CrossRef]
  77. Esmaeili, A.; Moore, F.; Keshavarzi, B.; Jaafarzadeh, N.; Kermani, M. A Geochemical Survey of Heavy Metals in Agricultural and Background Soils of the Isfahan Industrial Zone, Iran. Catena 2014, 121, 88–98. [Google Scholar] [CrossRef]
  78. Nicholson, F.A.; Smith, S.R.; Alloway, B.J.; Carlton-Smith, C.; Chambers, B.J. An Inventory of Heavy Metals Inputs to Agricultural Soils in England and Wales. Sci. Total Environ. 2003, 311, 205–219. [Google Scholar] [CrossRef] [PubMed]
  79. Nziguheba, G.; Smolders, E. Inputs of Trace Elements in Agricultural Soils via Phosphate Fertilizers in European Countries. Sci. Total Environ. 2008, 390, 53–57. [Google Scholar] [CrossRef]
  80. Six, L.; Smolders, E. Future Trends in Soil Cadmium Concentration under Current Cadmium Fluxes to European Agricultural Soils. Sci. Total Environ. 2014, 485–486, 319–328. [Google Scholar] [CrossRef]
  81. Rodríguez Martín, J.A.; Ramos-Miras, J.J.; Boluda, R.; Gil, C. Spatial Relations of Heavy Metals in Arable and Greenhouse Soils of a Mediterranean Environment Region (Spain). Geoderma 2013, 200–201, 180–188. [Google Scholar] [CrossRef]
  82. Howe, P.; Watts, P. Tin and Inorganic Tin Compounds; Concise International Chemical Assessment Document 65; World Health Organization: Geneva, Switzerland, 2005. [Google Scholar]
  83. LNEG. Sistema de Informação de Ocorrência e Recursos Minerais Portugueses–SIORMINP; Laboratório Nacional de Energia e Geologia: Lisboa, Portugal, 2002.
  84. Couto, H.; Roger, G.; Fonteilles, M. Présence de Sills de Roches Ignées Acides Dans La Mine Sb-Au de Ribeiro Da Serra, District Dúrico-Beirão, Nord Portugal. Implications Métallogéniques. Comptes Rendus De L’académie Des Sci.-Ser. IIA-Earth Planet. Sci. 1999, 329, 713–719. [Google Scholar] [CrossRef]
  85. Carvalho, P.C.S.; Neiva, A.M.R.; Silva, M.M.V.G.; Ferreira da Silva, E. Geochemical Comparison of Waters and Stream Sediments Close to Abandoned Sb-Au and As-Au Mining Areas, Northern Portugal. Geochemistry 2014, 74, 267–283. [Google Scholar] [CrossRef]
  86. Guo, G.; Wu, F.; Xie, F.; Zhang, R. Spatial Distribution and Pollution Assessment of Heavy Metals in Urban Soils from Southwest China. J. Environ. Sci. 2012, 24, 410–418. [Google Scholar] [CrossRef]
  87. Yuan, X.; Xue, N.; Han, Z. A Meta-Analysis of Heavy Metals Pollution in Farmland and Urban Soils in China over the Past 20 Years. J. Environ. Sci. 2021, 101, 217–226. [Google Scholar] [CrossRef]
  88. Medeiros, A.C.; Pereira, M.A. Notícia Explicativa Da Folha 9-D Penafiel Da Carta Geológica de Portugal à Escala 1:50,000; Serviços Geológicos de Portugal: Lisboa, Portugal, 1980. [Google Scholar]
  89. Gürdal, G. Geochemistry of Trace Elements in Çan Coal (Miocene), Çanakkale, Turkey. Int. J. Coal Geol. 2008, 74, 28–40. [Google Scholar] [CrossRef]
  90. IARC. Some Non-Heterocyclic Polycyclic Aromatic Hydrocarbons and Some Related Exposures. In Monographs on the Evaluation of Carcinogenic Risks to Humans; International Agency for Research on Cancer: Lyon, France, 2010; Volume 92. [Google Scholar]
  91. Hwang, H.M.; Foster, G.D. Characterization of Polycyclic Aromatic Hydrocarbons in Urban Stormwater Runoff Flowing into the Tidal Anacostia River, Washington, DC, USA. Environ. Pollut. 2006, 140, 416–426. [Google Scholar] [CrossRef] [PubMed]
  92. Zhang, W.; Zhang, S.; Wan, C.; Yue, D.; Ye, Y.; Wang, X. Source Diagnostics of Polycyclic Aromatic Hydrocarbons in Urban Road Runoff, Dust, Rain and Canopy Throughfall. Environ. Pollut. 2008, 153, 594–601. [Google Scholar] [CrossRef] [PubMed]
  93. Zhang, X.L.; Tao, S.; Liu, W.X.; Yang, Y.; Zuo, Q.; Liu, S.Z. Source Diagnostics of Polycyclic Aromatic Hydrocarbons Based on Species Ratios: A Multimedia Approach. Environ. Sci. Technol. 2005, 39, 9109–9114. [Google Scholar] [CrossRef] [PubMed]
Figure 1. (a) Geological setting and sampling points. Legend: X—Precambrian and/or Cambrian schists and greywackes; Ob—Ordovician quartzites with schist intercalations; Ocd—Ordovician shales; S1—Silurian schists; S2—Silurian schists, greywackes, and quartzites; Dab—Devonian shales and sandstones; Dab1—Devonian quartzites; Ha1—Carboniferous conglomerates, sandstones, and micaceous schists; Ha2—Carboniferous conglomerates, arkoses, carbonaceous schists, and anthracite. (b) Local setting—proximity to urban and service areas.
Minerals 13 00028 g001
Figure 2. Average trace elements concentration in the soils of São Pedro da Cova compared with the values of the world surface soils [26] and the European topsoils determined by the FOREGS programme [25].
Minerals 13 00028 g002
Figure 3. pH spatial distribution interpolated by inverse distance weighting (IDW), overlayed by individual pH measurements for each soils sample from the study area.
Minerals 13 00028 g003
Figure 4. Soil magnetic susceptibility in the soils from the surrounding area of São Pedro da Cova waste pile.
Minerals 13 00028 g004
Figure 5. SEM images (ac) ferrimagnetic fractions of soils with high magnetic susceptibility, (d) iron oxide spherule showing octahedral iron oxide crystallization, (e) iron oxides spherules with dendritic pattern with molten aluminium silicates on its surface, (f) rounded char porous particle.
Minerals 13 00028 g005
Figure 6. Biplots of the factor coordinates of the variables in the respective correlation circle (in red), comparing (a) principal component 1 (PC1) versus principal component 2 (PC2); (b) principal component 1 (PC1) versus principal component 3 (PC3); (c) principal component 1 (PC1) versus principal component 4 (PC4) and (d) principal component 1 (PC1) versus principal component (PC5).
Minerals 13 00028 g006
Figure 7. Spatial distribution of Cu, Pb, and Zn in the soils that surround São Pedro da Cova waste pile, interpolated by ordinary kriging.
Minerals 13 00028 g007
Figure 8. Spatial distribution of As, Mo, and Sb in the soils that surround the São Pedro da Cova waste pile, interpolated by ordinary kriging.
Minerals 13 00028 g008
Figure 9. Spatial distribution of U, Th, and Ta in the soils that surround the São Pedro da Cova waste pile, interpolated by ordinary kriging.
Minerals 13 00028 g009
Figure 10. Spatial distribution of the sum of the 16 priority PAHs analysed in soil samples.
Minerals 13 00028 g010
Figure 11. Cross plots for the isomeric ratios of Ant/(Ant + Phe) vs. Flua/(Flua + Pyr) on the topsoils of the surrounding area of the of São Pedro da Cova mine.
Minerals 13 00028 g011
Figure 12. Cross plots for the isomeric ratios of BaA/(BaA + Chr) vs. IP/(IP + Bghip) on the topsoils of the surrounding area of the of São Pedro da Cova mine.
Minerals 13 00028 g012
Table 1. PAHs molecular diagnostic ratios (MDRs) [50,52,53].
SourceAnt/(Ant + Phe)BaA/(BaA + Chr)Flua/(Flua + Pyr)IP/(IP + BghiP)
Petrogenic0–0.10–0.20–0.40–0.2
Pyrogenic
Petroleum0.1–1.00.2–0.350.4–0.50.2–0.5
Biomass/Coal 0.35–1.00.5–1.00.5–1.0
Table 2. Descriptive statistics of general soil inorganic geochemistry of major (%) and trace elements (mg/kg) and comparison with previous waste pile analytical results [14] and with national and international reference values [23,24].
Soil SamplesMine Waste PilesReference Values
Min (n = 50)Max (n = 50)Mean (n = 50)Std DevCV (%)SkewnessKurtosisUB (n = 4)B (n = 4)APACCME
Al4.6610.78.081.2616−0.583.4610.411.2--
C0.7520.74.903.90801.727.00----
Ca0.010.560.170.171000.902.5500--
Fe1.089.393.341.50451.186.643.283.20--
H0.351.870.940.30320.653.69----
K1.113.442.210.6027−0.042.322.252.40--
Mg0.080.760.240.15631.997.030.130.20--
N0.060.480.250.11440.312.33
Na0.101.720.410.35852.056.830.500.50--
P0.010.210.070.04571.284.02----
S0.020.280.040.051253.0412.970.250.20--
Ti0.080.520.240.10420.883.29----
As6.3062.822.611.7521.525.8243.451.31112
Ba2561489505210422.3811.5610670210750
Be1.008.003.261.56480.963.524.604.002.5-
Cd0.010.560.110.161451.514.190.200.2011.4
Co0.6032.67.236.32871.756.883.454.0019
Cr15.020974.134.8471.116.441121276764
Cs3.7045.313.69.27681.775.9253.352.6--
Cu11.235250.251.11024.4725.931.634.56263
Mn12.0713174164941.956.8851.365.0--
Mo0.496.032.131.39801.043.462.432.802-
Ni6.6011424.317.1473.0616.521.423.03750
Pb18.116450.230.0161.675.9439.843.04570
Sb1.2346.76.297.941003.3315.63.506.501-
Sn1.1016.25.663.73451.233.676.086.00--
Th4.9020.111.52.69270.404.0712.813.9--
U2.2011.04.241.43632.3011.36.756.201.923
V22.016510038.585−0.532.3810713986130
Y4.6024.49.434.211251.896.7310.810.0--
Zn19.130397.067.6521.213.7337.432.7290200
∑LREE67.230615249.5420.903.85165170--
∑HREE13.868.433.110.8480.834.3813.212.9--
Std dev—standard deviation; CV—coefficient of variation; UB—unburned; B—burned; APA—Agência Portuguesa do Ambiente (Portuguese Environmental Agency); CCME—Canadian Council of Ministers of the Environment.
Table 3. PTEs concentrations in soils surrounding the waste pile of São Pedro da Cova waste mine affected by active coal fire, in fly ash from Douro Coalfield combustion in Tapada do Outeiro thermal power production and comparison with the soils surrounding coal power production centrals worldwide (mg/kg).
OriginAsCdCoCrCuMnNiPbZn
São Pedro da Cova Soils6.30–62.80.01–0.560.60–32.615.0–20911.2–35212.0–7136.60–11518.10–163.7919.1–303
Tapada do Outeiro Fly Ash [54]28.0–82.60.20–0.8023.9–30.2165–22552.3–70.7-79.6–11830.00–72.3071.9–165
Brazil [7]2.4064.5-12.810.84868.41150.3
China [27]1.19–11.30.03–0.40-8.76–64.647.76–64.5-4.13–33.410.4–47.324.2–137
Serbia [28]0.50–2.902.20–0.5910.3–0.0849.3–19932.3–49.6305–112021.0–89.035.0–81.053.0–145
Greece [29]---0.10–18.40.70–8.207.72–7740.10–1040.10–14.10.10–18.7
India [30]2.57–4.80-14.0–31.170.4–13154.2–89.71210–152937.2–76.620.7–38.470.8–218
Table 4. Descriptive statistics of soil physicochemical properties—pH, electrical conductivity (EC), and organic matter (OM).
Min (n = 50)Max (n = 50)Mean
(n = 50)
Std DevCV(%)SkewnessKurtosis
pH3.928.175.841.05180.022.03
EC (µS/cm)22.0475129103801.986.50
OM (%)3.8432.012.65.87470.994.02
Table 5. Spearman’s rank correlation coefficients of selected properties and PTEs contents in the studied soils.
AsCdCoCrCuNiPbSbZn
OM0.46 *0.02−0.000.31 *0.230.210.030.47 *−0.11
pH−0.33 *0.49 *0.38 *−0.31 *0.31 *0.000.50 *−0.110.56 *
EC0.030.05−0.01−0.14−0.04−0.060.07−0.080.08
* Correlation is significant at p ≤ 0.05.
Table 6. Total variance and matrix of principal components analysis.
PC1PC2PC3PC4PC5
Mo0.670.290.400.090.27
Cu−0.240.71−0.280.180.06
Pb0.840.270.18−0.130.07
Zn−0.740.47−0.110.20−0.02
Fe0.700.49−0.13−0.07−0.34
As0.520.120.57−0.170.29
U−0.31−0.76−0.190.020.12
Th0.50−0.460.23−0.070.07
Cd0.750.390.27−0.100.10
Sb0.270.420.10−0.510.45
P0.800.03−0.15−0.09−0.02
Cr0.710.46−0.250.250.12
Ba0.17−0.11−0.320.700.54
Al0.74−0.32−0.32−0.17−0.14
Sn−0.84−0.19−0.02−0.080.15
S0.0460.210.630.44−0.45
Cs−0.25−0.400.640.290.08
Eigenvalue5.992.821.901.271.07
% Variance35.2616.5711.157.496.31
Cumulative %35.2651.8362.9970.4876.79
Significant (>0.5 and <0.5) factor loadings are designated in bold. The proportion of the total variance captured by a component is given as % Variance and % Cumulative variance at the bottom of the table.
Table 7. PAHs determined in 15 soil samples surrounding São Pedro da Cova waste pile (µg/kg).
16 Priority PAHsNaPAcyAceFluPheAntFluaPyrBaAChrBbFBkFBaPIPDbABghip∑16 PAHs
No. of aromatic rings2222334444445556
Molecular weightLMW HMW
SP12.831.35URRUUR1.181.12R5.751.225.310.961.0020.7
SP43.505.030.84RU2.000.73RRRR1.52RRUR13.6
SP100.900.770.39R6.781.7719.017.713.511.9RR7.8612.6U12.1105
SP121.244.61URUR9.8011.04.123.07RR3.94RRR37.8
SP270.7332.6RRUR0.520.372.156.16URRRR12.955.5
SP342.200.550.490.805.600.8811.710.89.979.8321.56.1611.711.32.0010.4116
SP351.790.21R0.691.880.161.511.711.782.104.291.212.850.930.371.1122.6
SP3610.60.37R0.753.272.80RR0.160.08UURRUR18.0
SP375.991.970.552.1212.91.7021.618.38.378.8927.311.512.88.822.767.15153
SP401.310.630.361.075.190.739.018.788.329.2119.95.5510.19.291.669.72101
SP411.920.46R0.653.100.546.676.397.697.9613.73.418.008.013.549.2081.3
SP429.967.5515.510.810855.538134826029461515424913471.61412855
SP4938.39.523.575.6615236.814312520117724586.187.234.360.958.31464
SP508.705.71R5.85U6.525.414.230.864.9214.741.96.531.35R1.58108
SP574.061.170.452.66U2.081.210.830.861.121.711.941.15R3.550.8423.6
Ref. value [23]5093505019050240190951803005050110100200
NaP, naphthalene; Acy, acenaphthylene; Ace, acenaphthene; Flu, fluorene; Phe, phenanthrene; Ant, anthracene; Flua, fluoranthene; Pyr, pyrene; BaA, benzo[a]anthracene; Chr, chrysene; Bbf, benzo[b]fluoranthene; Bkf, benzo[a]pyrene; BaP, benzo[k]fluoranthene; IP, indeno [123-cd]pyrene; Dba, dibenz[ah]anthracene; Bghip benzo[ghi]perylene; LMW PAHs low molecular weight PAHs; HMW PAHs, high molecular weight PAHs; R, Ratio of reference ion does not match; U, Under the minimum similarity index. (SI: 0).
Table 8. LMW and HMW PAHs distribution in soils and isomer ratios for determining potential sources.
%LMW PAHs%HMW PAHsAnt/(Ant + Phe)BaA/(BaA + Chr)Flua/(Flua + Pyr)IP/(IP + Bghip)
UpstreamSP120.2079.80nd0.51nd0.84
SP488.8311.17ndndndnd
SP1028.1071.900.210.530.520.51
SP1241.3858.62nd0.570.47nd
SP2761.0338.97nd0.260.58nd
RunoffSP3419.2080.800.140.500.520.52
SP3527.6272.380.080.460.470.46
SP4220.5879.420.340.470.520.49
SP4926.5773.430.190.530.530.37
small pilesSP 3698.671.330.460.67ndnd
SP3730.6869.320.120.480.540.55
SP4018.1681.840.120.470.510.49
SP4116.4183.590.150.490.510.47
SP5029.7570.25nd0.150.560.46
SP5749.2250.78nd0.430.59nd
Disclaimer/Publisher’s Note: The statements, opinions and data contained in all publications are solely those of the individual author(s) and contributor(s) and not of MDPI and/or the editor(s). MDPI and/or the editor(s) disclaim responsibility for any injury to people or property resulting from any ideas, methods, instructions or products referred to in the content.

