Article

Mineralogical Evolution and Expansion of Cement Pastes in a Sulfate-Confined Environment

1
Institut de Radioprotection et de Sûreté Nucléaire (IRSN), PSE-ENV/SEDRE/LETIS, 92260 Fontenay-aux-Roses, France
2
Mines Paris, PSL University, Centre for Geosciences and Geoengineering, 77300 Fontainebleau, France
3
Institut de Radioprotection et de Sûreté Nucléaire (IRSN), PSN-RES/SEMIA/LSMA, CEDEX, 13115 Saint-Paul-Lez-Durance, France
*
Author to whom correspondence should be addressed.
Minerals 2023, 13(1), 1; https://doi.org/10.3390/min13010001
Submission received: 9 November 2022 / Revised: 8 December 2022 / Accepted: 16 December 2022 / Published: 20 December 2022
(This article belongs to the Section Environmental Mineralogy and Biogeochemistry)

Abstract

:
The geologic disposal of radioactive waste could lead to confined conditions in which cementitious materials impose a moderate alkaline pH, in which the rocks supply sulfate ions at rather low concentrations. In this context, the purpose of this work was to study the degradation of cement pastes under such conditions using a non-renewed 30 mmol/L Na2SO4 solution without pH regulation. Samples were investigated through laboratory testing and numerical modeling. XRD, SEM–EDS, and micro-indentation acquisitions were performed to follow the evolution of chemical, mineralogical, and mechanical properties during the weak external sulfate attack. Reactive transport modeling was performed with the HYTEC code. Based on these results, the Young’s moduli of the degraded zones were estimated using analytical homogenization. Decalcification occurred despite the high pH value of the solution and significantly affected the mechanical properties. Macroscopic swelling and cracking were caused by the formation of expansive sulfate minerals after 60 days, despite the low sulfate content of the tank solution. The modeling supported the discussion on the evolution of the mineral fronts (ettringite, portlandite, and gypsum).

1. Introduction

Underground concrete structures can be exposed to external sulfate attacks due to sulfate ions present in rocks and waste containers emplaced in a geological disposal facility [1]. This reaction represents a real threat for concrete durability, as it leads to the macroscopic swelling of the material, expansion, and cracking [2,3,4]. Two main modes of transfer occur: a transfer of SO42− ions to the cement matrix and the leaching of Ca2+ and OH ions to the external solution [5]. The consequence of the SO42− ions’ diffusion through the interconnected porosity is the breaking of the equilibrium state of the pore solution with the minerals in concrete. This results in the formation of expansive products such as gypsum and ettringite filling pores, which can lead to the expansion of cement-based materials and microcracks [6,7]. The associated leaching phenomenon in an acid solution leads mainly to the dissolution of portlandite (CH) and the decalcification of calcium silicate hydrates (C-S-H) [8]. The induced minerals’ dissolution increases the material porosity that deteriorates the mechanical properties [9,10,11]. Therefore, the hydrolysis of the cement paste and sulfate products’ formation both have a significant impact on the damage of the material. Additionally, the chemo-mechanical behavior depends on physical and chemical factors intrinsic to the material or the surrounding environment [2,3]. In particular, the rate of damage is governed by the concentration of SO42− and the pH of the solution.
A high-sulfate concentration (e.g., 0.15–0.70 mol/L) accelerates the degradation and is usually used in laboratory tests to obtain results in short time [4,5]. However, the representativity of these tests is still controversial [3]. Furthermore, the sulfate concentrations of groundwater in many geologic disposal sites are generally much lower, e.g., varying up to a maximum of 30 mmol/L in argillaceous formations [12,13,14]. The mechanism of degradation in a highly concentrated sulfate environment can differ from the one found in realistic conditions and leads to the rapid destruction of the cement matrix, which prevents the accurate characterization of the degradation fronts.
The pH of the solution plays a major role in sulfate attacks since it controls the leaching effect and the solubility of the phases. Many laboratory tests are carried out with pH control [5,15,16] in the neutral pH range (pH 7–8). However, geologic disposals in clay formation correspond to confined conditions in which the cementitious materials could impose moderate alkaline pH values (pH 11–12). The effect of the pH value on the degradation remains unclear. Cao et al. [17] found a reduction in expansion when the pH of the sulfate solution was reduced from 12 to 7. This observation was explained by the greater softening of the hardened cement paste due to C-S-H decalcification. Hence, expansion might be expected to be less pronounced. Alternatively, Brown [18] realized an experimental set-up using three different pH levels (6.0, 10.0 and 11.5). He found that the expansion was initiated faster when reducing the pH of the solution.
The present experiments aimed to investigate the effects of a sulfate-confined environment (using moderate sulfate concentration and non-controlled pH solution) on cement degradation. This study focused on the degradation with sodium sulfate (Na2SO4) to emphasize the chemical reactions involving SO42− ions (the counter ion Na+ being weakly reactive). However, other salts associated with external sulfate attack, such as calcium sulfate (CaSO4) and magnesium sulfate (MgSO4), may provide different results for the degradation of cement paste. In particular, a solution of MgSO4 led to the formation of brucite and was found to be more aggressive than a solution of Na2SO4 [3]. CEM I cement pastes were immersed in a low-volume solution (2 L per sample) of 30 mmol/L Na2SO4. The solution was never renewed. The samples were collected after 15, 60, and 120 days of degradation to be characterized. The chemical evolution of samples was investigated by SEM–EDS analyses. XRD analyses were performed to provide data on the mineralogical evolution over depth. Micro-indentation acquisition was carried out to determine the impact of the weak sulfate attack on elastic mechanical properties. Reactive transport modeling of the chemical degradation supported the interpretation of experimental results and was also used for an analytical homogenization scheme to calculate Young’s moduli.

2. Materials and Methods

2.1. Materials and Exposure Conditions

Four CEM I hydrated cement pastes (HCPs) were cast (Beffes CEM I 52.5 N CE CP2 NF), and hydration was performed with a water/cement ratio of 0.5. The cement composition is given in Table 1. The Beffes CEM I is a C3A-rich cement (11% of C3A). The samples had a parallelepipedic shape of 4x4 cm2 square plates and 1 cm thickness.
The samples were cured in sealed bags at a constant temperature (20 °C) for 60 days. A resin-epoxy Resoltech 3030 was applied on the four sides of the cement paste to protect them from lateral degradation and to set unidirectional diffusion perpendicular to the two square faces. The four samples were placed in an 8 L tank (i.e., 2 L per sample) which was filled with a Na2SO4 solution at 30 mmol/L. The ambient temperature was set at 20 °C during the immersion of the samples in the solution. The pH was not controlled to assess the effect of its increase on the degradation. HCPs were collected after 15, 60, and 120 days of degradation in the sodium sulfate solution to be analyzed.

2.2. Experimental Techniques for Characterization

2.2.1. X-ray Diffraction

The mineralogical variation of the degraded samples was followed using X-ray diffraction (XRD) analyses. Acquisition was made directly on the solid [19,20]. Between each measurement, a layer of approximately 100 µm thick was removed from the external surface to the center of the paste with abrasive paper, parallel to the attacked surface. A caliper rule was used to control the thickness of the scraped layer. A diffractometer PANalytical Aeris Research Edition (Fontenay-aux-Roses, France) was used to collect mineralogical data relying on CuKα radiation (λ = 1.5405 Å) with a working voltage of 40 kV and an intensity equal to 15 mA. The XRD patterns were obtained by exposing the polished surface to the X-ray beam directly for an angular range from 5° to 70°s with a step size of 0.01° and a time-per-step of 48 s. The COD database was used for phase identification [21].

2.2.2. Scanning Electron Microscopy

The chemical element distribution in the cement matrix during the external sulfate attack was characterized using scanning electron microscopy (SEM). A Hitachi S3500N SEM (Fontenay-aux-Roses, France) was equipped with two energy-dispersive spectrometry (EDS) Brucker SDD detectors to determine the chemical composition of both sound and degraded zones. Samples were first embedded in epoxy resin. Subsequently, polished, thin sections were prepared and coated with carbon. The analyses were performed under a voltage of 15 keV at a working distance of 16.7 mm. The spot size of the EDS measurement was approximately 1.5 μm, and the SEM–beam interaction pear was about 3 μm in depth. The software ESPRIT (version 1.9, Bruker, Billerica, MA, USA) was used for spectrum and EDS map acquisition. Hyperspectral images acquisition was done at 8s per pixel. The spectra corresponding to ettringite and gypsum were identified (Figure 1) to detect these minerals from the EDS elementary maps.

2.2.3. Micro-Indentation

Micro-indentation analysis was performed using an Anton Paar NHT3 Nanoindenter equipped with a Berkovich diamond indenter and coupled to a Step 700 stabilization platform. The aim was to determine the evolution of the elastic modulus of the degraded paste as a function of depth. Acquisition was made on the polished sections prepared for SEM–EDS analysis. The indenter was vertically pressed into the sample surface, its displacement was monitored, and the load was measured. The corresponding curve displaying displacement versus load was interpreted to calculate the elastic modulus of indented zones. The elastic modulus values of the material at the indented zones were estimated via the Oliver and Phar approach [22]. Adapted indentation parameters were chosen in a way to consider the roughness differences between the sound and degraded zones which could conduct to unreliable elastic-modulus values. The load was first raised from 0 to 100 mN with a constant loading rate of 100 mN/min, then maintained constant for 10 s at the maximum value to limit creep phenomena and, finally, decreased to 0 with an unloading rate of 100 mN/min. The acquisition rate was 15 Hz and the approach distance and speed were 8500 nm and nm/min, respectively. An 8 × 8 grid array of indentation points was adopted with 50 µm between each point to perform a statistical analysis of measured mechanical values. According to Constantinides et al. [23], the distance between each point should be 10 times greater than the maximum displacement before unloading to avoid interaction between neighboring points.

2.3. Modeling Approach and Data

2.3.1. Reactive Transport Equation

The modeling of the tests was performed with the reactive transport code HYTEC [24]. Under the water-saturated conditions, the coupling between chemistry and diffusive transport is modeled by the following equation:
ω c i t = · ( D e ( ω ) c i ) ω c i ¯ t
where   D e represents the effective diffusion coefficient for all the dissolved species, ω is the material total porosity, and c i and c i ¯   are the species’   i total mobile concentration in the solution and total immobile concentration in solid phases, respectively.
Mineral dissolution and precipitation can change porosity and transport properties. The feedback of chemistry on transport was considered by correcting the effective diffusion coefficient   D e according to a modified version of Archie’s law:
D e ( ω ) = D e ( ω 0 ) ( ω ω c ω 0 ω c ) α
where α is an empirical coefficient usually equal to 3 for cementitious materials [25], ω 0 is the initial porosity, and ω c is a threshold under which diffusion stops (set to zero in the present modeling).

2.3.2. Chemical and Physical Data

All chemical reactions were modeled at local thermodynamic equilibrium with the B-dot activity correction model relevant for ionic strengths up to 1 molal typical of CEM I young HCP. The 2019 version of the Thermoddem thermodynamic database was used [26]. All the phases considered during the modeling and their properties are given in Table 2. The progressive C-S-H decalcification was modeled with a discretized set of decreasing C/S ratio. Gypsum, monosulfoaluminate, hemicarboaluminate, calcite, amorphous silica, and gibbsite, which could also be formed during the reaction, were included in addition to the primary solid phases.
The Young modulus and Poisson ratio of the anhydrous phases considered (C3S, C2S, C3A, and C4AF) were, respectively, 117.6 GPa and 0.314 [27].

2.3.3. Initial State and Configuration of the Cement Pastes

The cement pastes contained portlandite, ettringite, monocarboaluminate, and C-S-H, according to XRD. The initial amount of each hydrate was estimated in two steps. First, the quantity of anhydrous phases (C2S, C3S, C3A, and C4AF) that had reacted after 60 days was determined using the model of Parrot and Killoh [28]. Next, the geochemical module of HYTEC (CHESS) was used to calculate the volume fraction of each mineral (Table 3). The initial total porosity was calculated from mineral and unhydrated clinker volume fractions of the sound hydrated paste. The total porosity was 0.31. The initial pH of 13.5 was set using the Na+ and K+ hydroxide concentrations in the porewater.
As was mentioned in Section 2.1, a resin was applied laterally on the cement pastes and the one-dimensional conditions were symmetrically equivalent at each side of the sample. Therefore, only half one-dimensional configuration was considered for the numerical modeling. In the HCP, the grid was composed of 25 rectangular meshes in the first 0.1 cm and 50 meshes from that point, up to 0.5 cm.
Given the configuration of the degradation test (a non-renewed solution without pH control), the tank solution was explicitly considered in the modeling grid. The length of the mesh of the zone containing the sulfate solution was calculated given the experimental liquid/solid volume ratio, which was 125 since the volume of the cement paste was 16 cm3 and there was 2L of solution per sample. Therefore, due to the symmetry, the length of the zone corresponding to the volume of the solution was 62.5 cm and the length of the cement paste was 0.5 cm, as was specified above.
The D e   coefficient in the tank solution was equal to 10−9 m2/s in a zone of 1 cm near the cement paste and it progressively increased to 10−5 m2/s to simulate the low agitation of the solution in the tank. In fact, the solution was not frequently stirred (it was stirred once every two weeks). The meshing of the solution tank was finer near the boundary with the cement. The solution in the tank initially contained 30 mmol/L of Na2SO4 and the concentrations of chemical species in the solution evolved with time. Regarding the cement paste, its initial effective diffusion coefficient D e was set to 8×10⁻¹² m2/s to accurately fit the experimental degradation fronts. This fitted D e is within the range of values measured for tritiated water diffusion in CEM I-HCP with a W/C ratio of 0.5 [29].

2.3.4. Homogenization Method

The homogenization method was applied to estimate the macroscopic elastic properties from the reactive transport modeling results. Portland cement was considered as an isotropic material containing spherical inclusions embedded in an infinite matrix. At the cement-paste scale, the continuous reference matrix is the C-S-H matrix. One type of C-S-H was taken into account, as was depicted in Socié et al. [30]. The inclusions in the scheme were hydrates, capillary porosity, and anhydrous cement [31].
The shear and compressibility homogenized coefficients ( k h o m o and g h o m o , respectively) are given by the Mori–Tanaka scheme:
k h o m o = k C S H + 4 g C S H 3 i = 1 N p h φ i   k i k C S H k i + 4 3 g C S H 1 i = 1 N p h φ i   k i k C S H k i + 4 3 g C S H
g h o m o = g C S H + H C S H i = 1 N p h φ i   g i g C S H g i + H C S H 1 i = 1 N p h φ i   g i g C S H g i + H C S H
where N p h is the number of phases, k C S H and g C S H are the shear and compressibility coefficients of C-S-H, k i and g i are the shear and compressibility coefficients of the phase i , φ i     is the volume fraction of the phase i , and H C S H is the following term:
H C S H = g C S H ( 3 2 k C S H + 4 3 g C S H ) ( k C S H + 2 g C S H )
The total porosity ϕ given in HYTEC includes two families of pores: gel pores and capillary pores, respectively noted as ϕ C S H   and ϕ c a p in the following equation:
ϕ = ϕ C S H   + ϕ c a p
Based on the work of Tennis and Jenning [32], gel porosity is estimated from C-S-H volume fraction:
ϕ = α C S H   φ C S H  
where α C S H   is a coefficient equal to 0.28 [32].
At the cement-paste scale, the following equation must be satisfied:
1 = ϕ c a p + i N p h φ i  
where N p h is the number of phases.
Capillary porosity and the C-S-H volume fraction are estimated from the previous equations and given, respectively, by Equations. 9 and 10:
ϕ c a p = ϕ α C S H   ( 1 i N p h 1 φ i   + φ C S H   )   1 α C S H  
φ C S H   = ( 1 i N p h 1 φ i   ) ϕ )   1 α C S H  
The mechanical properties of the minerals used are given in Table 2. Determinations of the C-S-H mechanical properties were based on the work of Constantinides and Ulm [33]. They estimated the elastic modulus of sound and degraded C-S-H as 23.8 and 4.3 GPa, respectively. Therefore, these values were used to determine the decalcified C-S-H’s Young’s modulus evolution,   E C S H , as a function of their Ca/Si ratio, based on the following equation given by [34]:
{ i f C a S i > 0.8 ,           E C S H = ( 1 C / S 0.8 1.65 0.8 ) E C S H U L + C / S 0.8 1.65 0.8 E C S H S i f C a S i   0.8 ,                                                                                                                           E C S H = E C S H U L
where E C S H U L and E C S H S are the Young’s modulus of leached and sound C-S-H, respectively. Poisson ratio values were assumed to be unaffected by calcium leaching [33].

3. Results and Discussion

3.1. Evolution of the Mineralogy

3.1.1. Distribution of the Mineralogical Phases in the Degraded Zone

External sulfate attacks proceed through the advance of reaction fronts into the material [4,35,36]. These reacting fronts were identified on a cement paste degraded during 60 days through experimental characterization and numerical modeling.
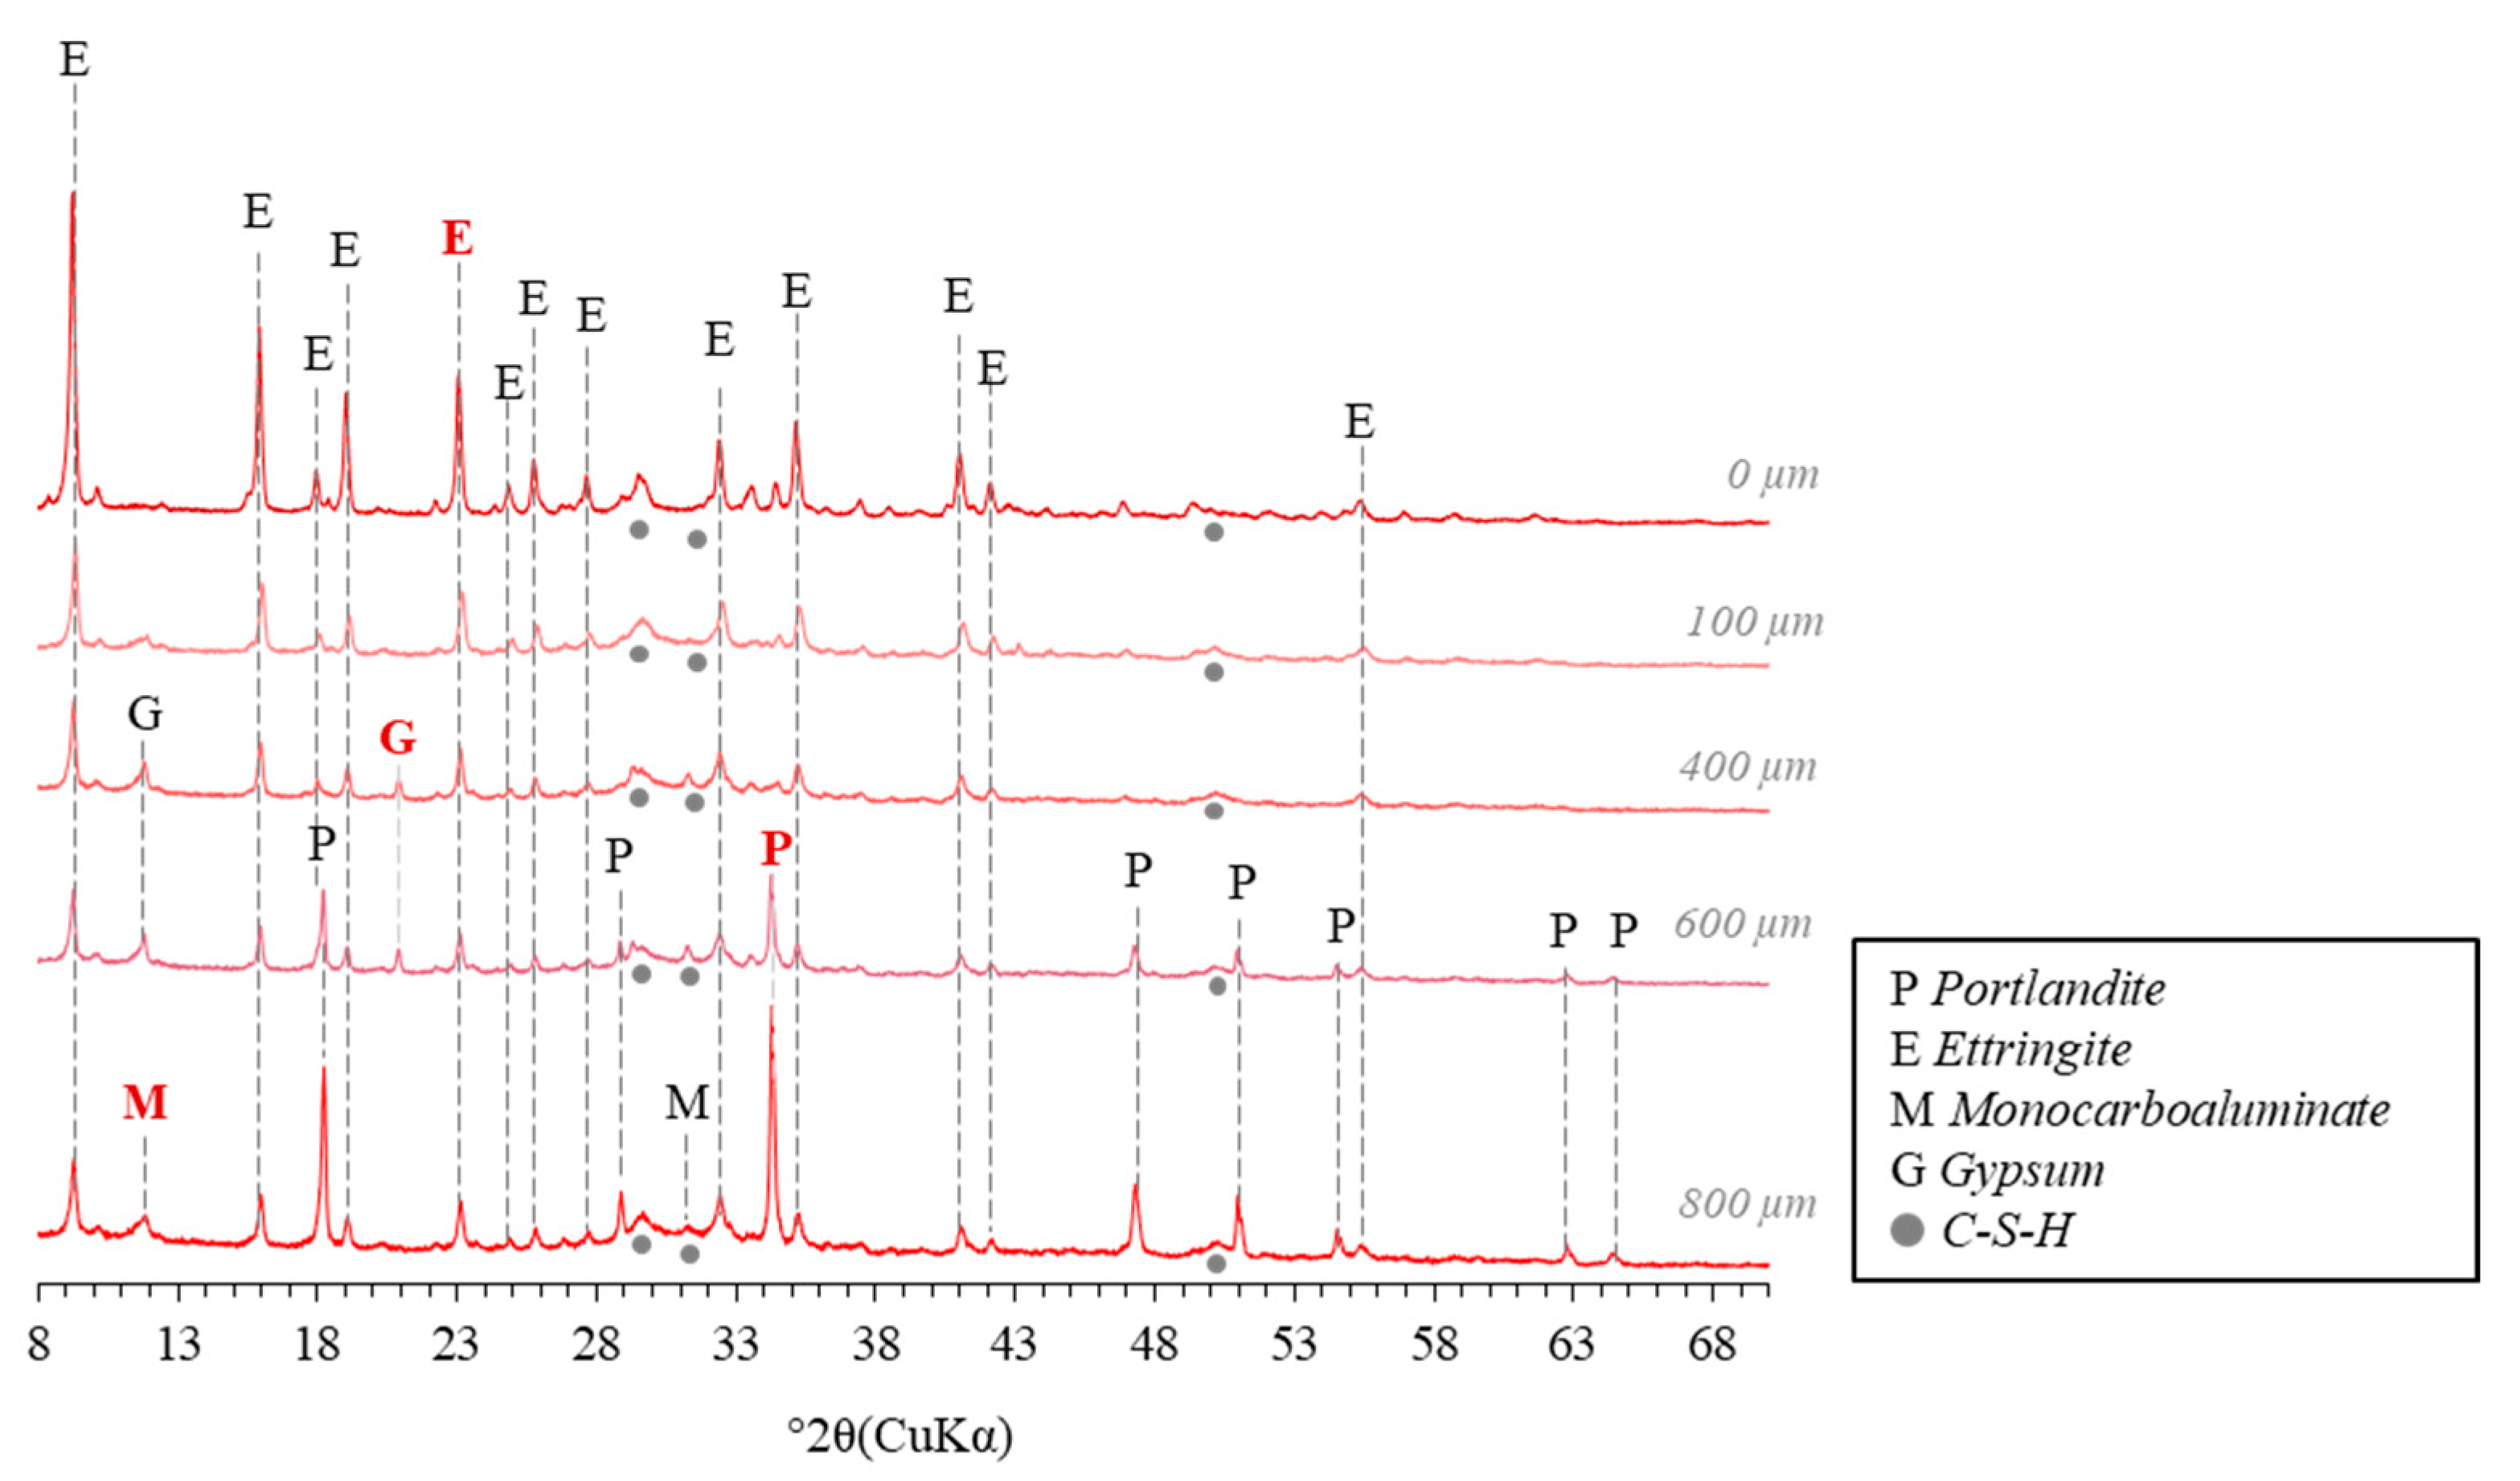
The elementary map of S and Ca was obtained using SEM–EDS. XRD analysis was carried out, and the main peak of ettringite (3.85 Å), gypsum (4.28 Å), portlandite (2.62 Å), and monocarboaluminate (7.57 Å) were plotted as a function of depth. Each peak was normalized with respect to the peak of portlandite in the sound zone, which corresponded to the highest peak. The XRD diagrams from which the peak heights were plotted are given in Appendix A, Figure A1. A typical diffractogram is shown for each zone of different mineralogy.
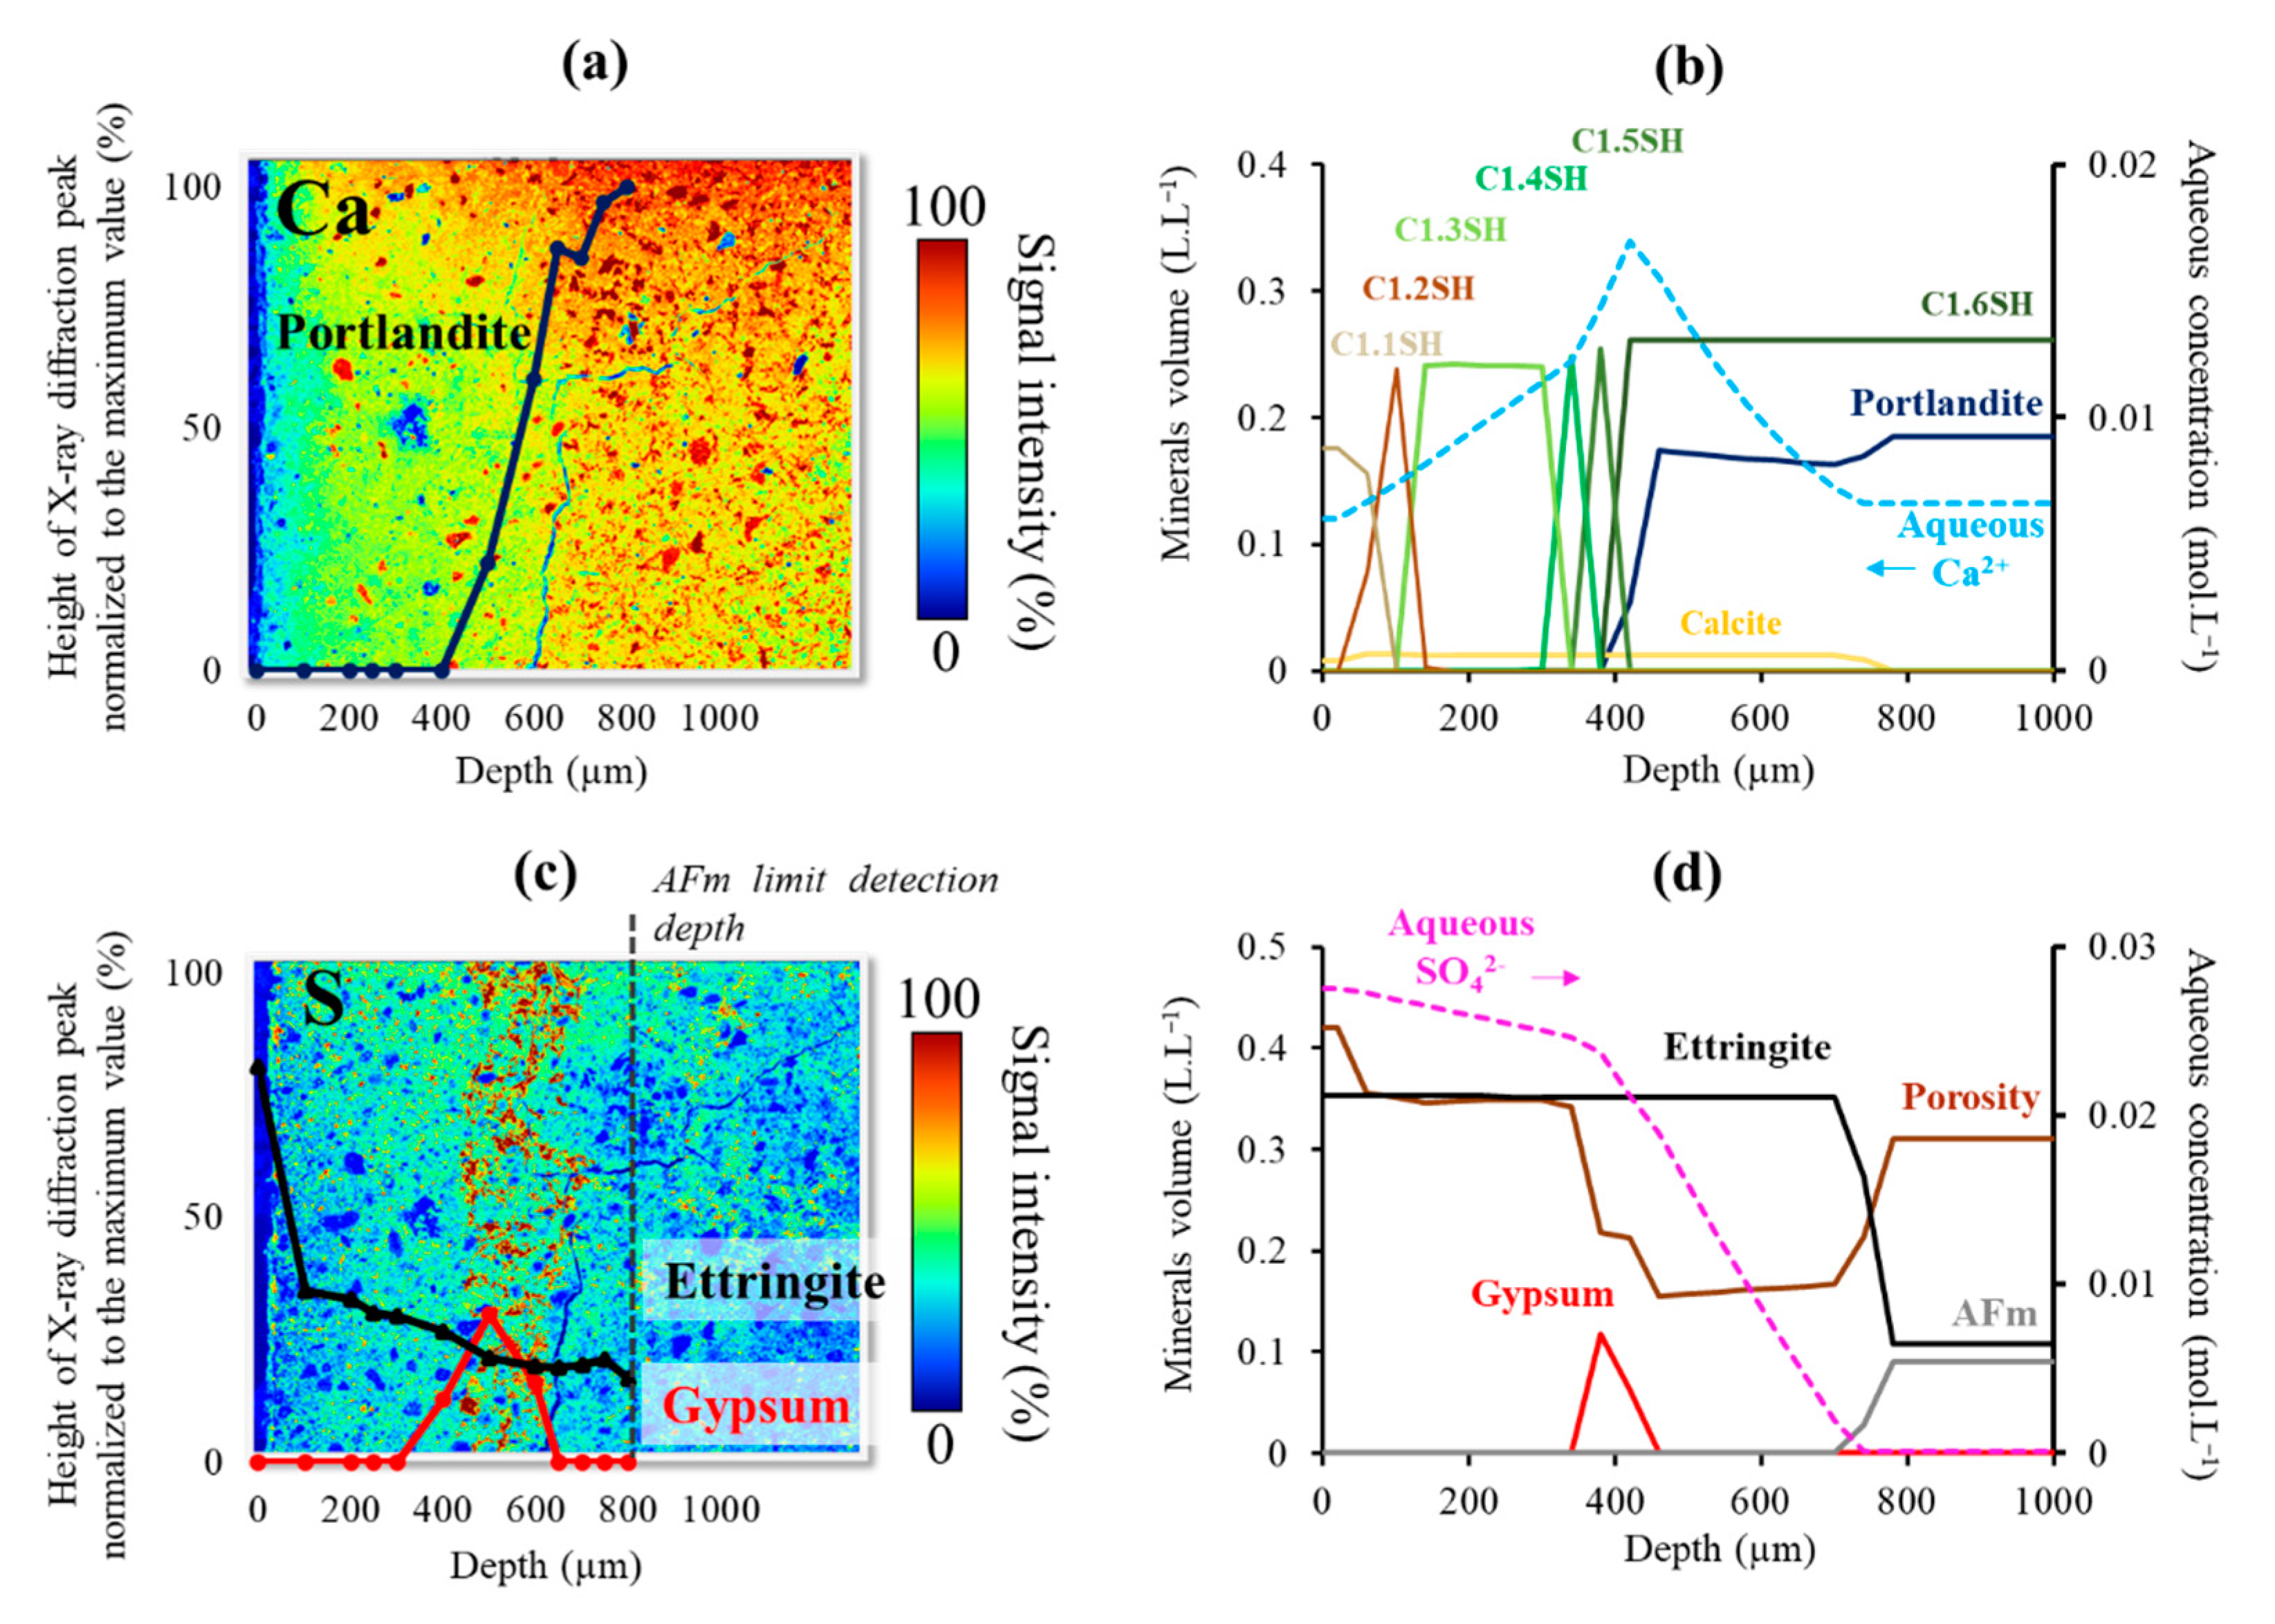
SEM–EDS results showed that the signal intensity of Ca was lower in the degraded zone and even lower near the exposed surface, from 0 to 50 µm (Figure 2a). This calcium depletion was caused by the dissolution of portlandite according to XRD results. The peaks were no longer detected from 0 to 400 µm in Figure 2a, in line with the calculated depth of the portlandite dissolution front (Figure 2b). Simulation results displayed a portlandite dissolution front that occurred at two instances: first at 800 µm, when only a small amount of portlandite dissolved, and then at 400 µm, when this mineral was completely depleted (Figure 2b). The main tendency fitted the experimental measures. However, XRD results indicated a continuous decrease in the peaks from 800 µm. The Ca depletion of the cement paste was also caused by the decalcification of C-S-H given the progressive decrease in the Ca/Si ratio from 1.6 to 1.1, displayed by the modeling results (Figure 2b).
Gypsum precipitation occurred between 300 and 500 µm, according to XRD results which were in good agreement with the localization of the highly S-enriched zone (Figure 2c). The position of the gypsum front displayed by the numerical results (300 µm) was in line with the experimental results, yet its estimated thickness was underestimated. According to numerical results, the precipitation front of the secondary ettringite began at 900 µm (Figure 2d). Unfortunately, the onset of secondary ettringite precipitation could not be identified from the elementary map of sulfur. There was no significant difference in S intensity between the sound and the degraded zones apart from the highly S-enriched zone, which related to the formation of gypsum. However, the ettringite front was deduced from the depth of the dissolution of the monocarboaluminate front (peaks no longer detected by XRD), which was 800 µm (Figure 2c). Thus, the simulated ettringite front was close to the measured depth value (Figure 2d). The calculated pH (not shown) of the cement porewater was initially 13.5 due to the high concentration of alkalis (NaOH, KOH) and decreased to reach 12.2 once these alkalis were leached.
Therefore, the experimental and modeling results exposed two successive dissolution fronts. The first and deeper dissolution front was caused by the in-diffusion of SO42− from the tank solution into the cement paste, which disturbed monocarboaluminate ( 3 CaO · Al 2 O 3 · CaCO 3 ·   11 H 2 O ) equilibrium and caused the formation of ettringite ( 3 CaO · Al 2 O 3 ·   3 CaSO 4 ·   32 H 2 O ) and a weak dissolution of portlandite. The second front corresponded to the full dissolution of portlandite due to the out-diffusion of Ca2+ and OH ions in the tank solution. The hydrolysis of portlandite was enabled since the tank solution remained slightly undersaturated with respect to portlandite during the whole duration of the experiments. A similar trend was found in previous modeling studies [37,38] that predicted two portlandite dissolution fronts with a first and deeper front leading to the precipitation of ettringite.
Ettringite formation caused a local drop of porosity despite the dissolution of monocarboaluminates. This illustrates the clogging action of ettringite. Its formation can impose a significant swelling pressure on the microstructure [39] as ettringite has a molar volume about twice as large as that of monocarboaluminate [26,39,40]. The numerical results predicted the formation of calcite (Figure 2b) due to monocarboaluminate dissolution, but neither this mineral nor its polymorphs were detected in the samples by XRD analysis. This could be due to a kinetic inhibition of calcite precipitation, or the crystals could have been formed on a scale too fine for resolution by XRD.
The formation of ettringite ended when the Al3+ supplied by the AFm phase was deficient, in agreement with the literature [41,42]. Consequently, SO42− concentration increased in the pore solution (Figure 2d), whereas the ongoing dissolution of portlandite increased Ca2+ concentration in the pore solution (Figure 2b). This led to an intermediate zone in which the porewater became saturated with respect to gypsum ( CaSO 4 ·   2 H 2 O ), which precipitated [35,41,42]. This mineralogical distribution was also found in the work of [15,35].
The significant rise of porosity, which began at 500 µm, was caused by the massive dissolution of portlandite and then by the decalcification of C-S-H.

3.1.2. Ettringite and Gypsum Precipitation

Secondary ettringite was formed by the reaction of SO42− with the AFm phase (monocarboaluminate or monosulfoaluminate) present in the cement paste. Thus, the quantity of ettringite in the degraded zone was higher than in the sound part, as was shown by the simulation results (Figure 2d). However, there was no significant difference in the intensity of S between the degraded and the sound zones related to secondary ettringite precipitation (Figure 2c), even though an increase in the XRD peaks occurred from the sound zone to the exposed surface. Secondary ettringite and gypsum were identified from SEM–EDS results by using their spectra provided in Figure 1. Figure 3 shows the map obtained in which only the pixels containing ettringite or gypsum crystals of size greater than 3 µm were represented.
A massive ettringite formation was detected at the surface where the XRD peak intensity was the highest. Ettringite was hardly or not detected at all elsewhere in the leached part of the sample, except near the exposed surface. However, the modeling results showed a constant amount of ettringite formed in all the degraded zones. Secondary ettringite was difficult to identify as its submicroscopic crystals grow within the C-S-H gel on a scale too small for the resolution of XRD [35] and, consequently, for SEM–EDS. Ettringite precipitation could be related to the transformation of AFm embedded in the C-S-H, as was proposed by Yu et al. [4]. The greater amount of detected ettringite at the surface could be caused by the evolution of its crystals into a well-crystallized form, resulting from the decrease in pH and Ca2+ concentration [43].
On the other hand, gypsum was well-detected throughout the S-enriched zone (Figure 3) and the thickness of the gypsum band was close to the one identified from XRD results, indicating that gypsum precipitated mostly as large crystals. Gypsum precipitation seemed to have mainly occurred in the capillary porosity, filling the voids left by portlandite dissolution, as has already been observed by Lothenbach et al. [31].

3.2. Evolution of the Degradation over Time

3.2.1. Evolution of the Mineralogical Fronts and the Tank Solution Chemistry

Figure 4a demonstrates the evolution of the portlandite profile obtained by XRD analysis and Figure 4b shows the HYTEC simulations after 15, 60, and 120 days of degradation. The dissolution front of portlandite went deeper with time, as was shown by both the numerical and experimental results. The depth of the dissolution front was 150 µm at 15 days, then 400 µm and 600 µm after 60 and 120 days of immersion, respectively (Figure 4a,b).
The XRD-detected (Figure 4c) and simulated (Figure 4d) gypsum fronts are also plotted over time. The gypsum formation band shifted with time by a process of precipitation and redissolution, following the portlandite dissolution front. The modeling was able to simulate the migration of the gypsum band that redissolves but enlarges with time, as well as the relative stability of ettringite compared to gypsum during the course of the degradation. However, the calculated thickness of the gypsum front was significantly smaller than the measured one. This outcome was also pointed out by Lothenbach et al. [31], who stated that the dissolution and precipitation fronts were more progressive in the experiments than the numerical ones. The experimental portlandite dissolution seemed to have happened in a more gradual way than in the model, allowing gypsum to precipitate over a larger width.
The precipitation depths of the secondary ettringite deduced from XRD results were compared with the calculated ones (Table 4). Numerical and experimental results were overall in line except for the 120-day (120 days) degraded sample. The decoupling between the front of transformation of monocarboaluminate into ettringite and the portlandite dissolution/gypsum precipitation front seemed to be greater with time, as the ettringite front ingressed faster than the leaching front [31,44].
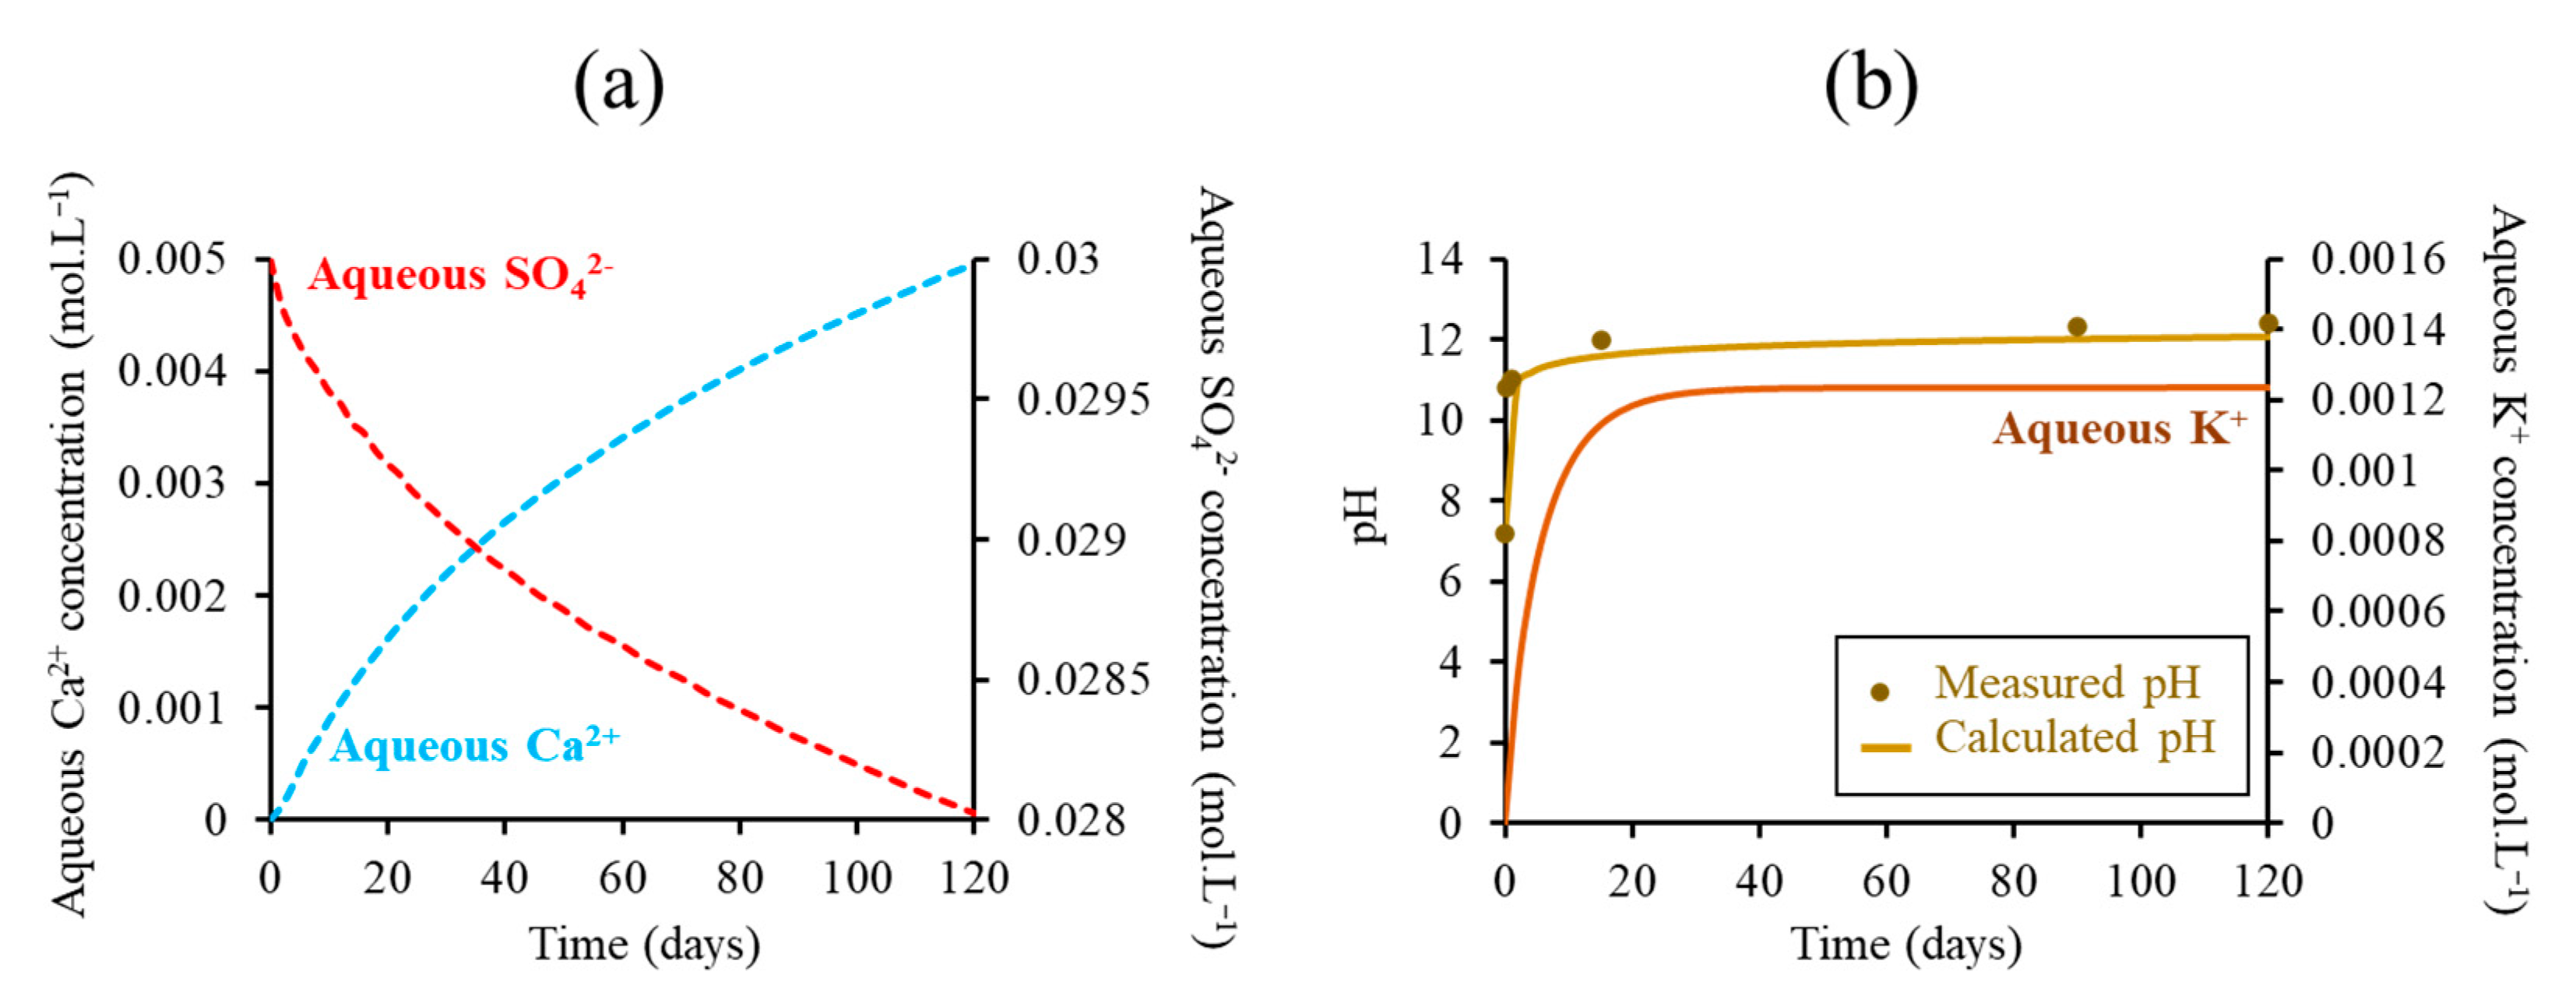
Figure 5 displays the evolution of the calculated total concentrations of Ca2+, SO42−, and the pH in the tank solution over time. The increase in Ca2+ (Figure 5a) and OH in the solution resulted mainly from the dissolution of portlandite and, to a lesser extent, from the calcium depletion of C-S-H [35,45]. A slight decrease in SO42− concentration in the tank solution occurred after 120 days, going from 30 to 28 mmol/L (Figure 5a) due to the transfer of sulfate ions in the cement paste to form ettringite and gypsum. The reduction in SO42− in the non-renewed external solution was also calculated by Lothenbach et al. [31] and Soive et al. [37].
The calculated pH was initially equal to 7 and quickly reached 11 in the first week. After this, its increase was slower to reach a value of around 12. The measured pH followed the same pattern. The fast rise of the pH was mainly caused by the transfer of alkalis in the tank solution, principally the KOH (Figure 5b) initially present in the porewater at a high concentration. Once the leaching of alkalis was complete, OH ions coming mainly from the portlandite dissolution contributed to the increase in pH.

3.2.2. Impact of The Boundary Conditions on The Degradation

In order to investigate the impact of the chemistry of the external solution on the degradation, the present results were compared with the results of a test performed in a volume of tank large enough to keep the solution chemistry constant and under pH regulation between 7 and 9 [46]. This configuration was almost equivalent to one in which the solution is continuously renewed [37]. Table 5 compares the decalcification and precipitation depths of gypsum measured in both cases.
When the volume of solution was large, the decalcification depth was almost 1.5 times greater. The pH and Ca2+ concentration gradients were increased, which favored leaching. Thus, the portlandite dissolution front went further. In the uncontrolled pH test, despite the significant chemistry gradient that existed initially, the leaching process was slower as Ca2+ and pH rapidly increased in the tank solution. Similar observations were made by Soive et al. [37] by numerical modeling that assumed a permanently renewed solution or a solution which was never renewed. The portlandite-dissolution-front ingress was much slower in the latter case.
The chemistry of the solution had also an impact on the formation of gypsum. When the volume of the solution was large enough and the pH was controlled, the gypsum formation front went further as it followed the dissolution front of the portlandite. Its thickness was also greater. This might be caused by the greater decalcification of the paste, which has two effects. On the one hand, it leads to the rise of the local porosity which facilitates the diffusion of sulfates. On the other hand, it releases more Ca2+.

3.3. Impact of the Mineralogy on the Mechanical Properties and Cracking

3.3.1. Effect of the Decalcification

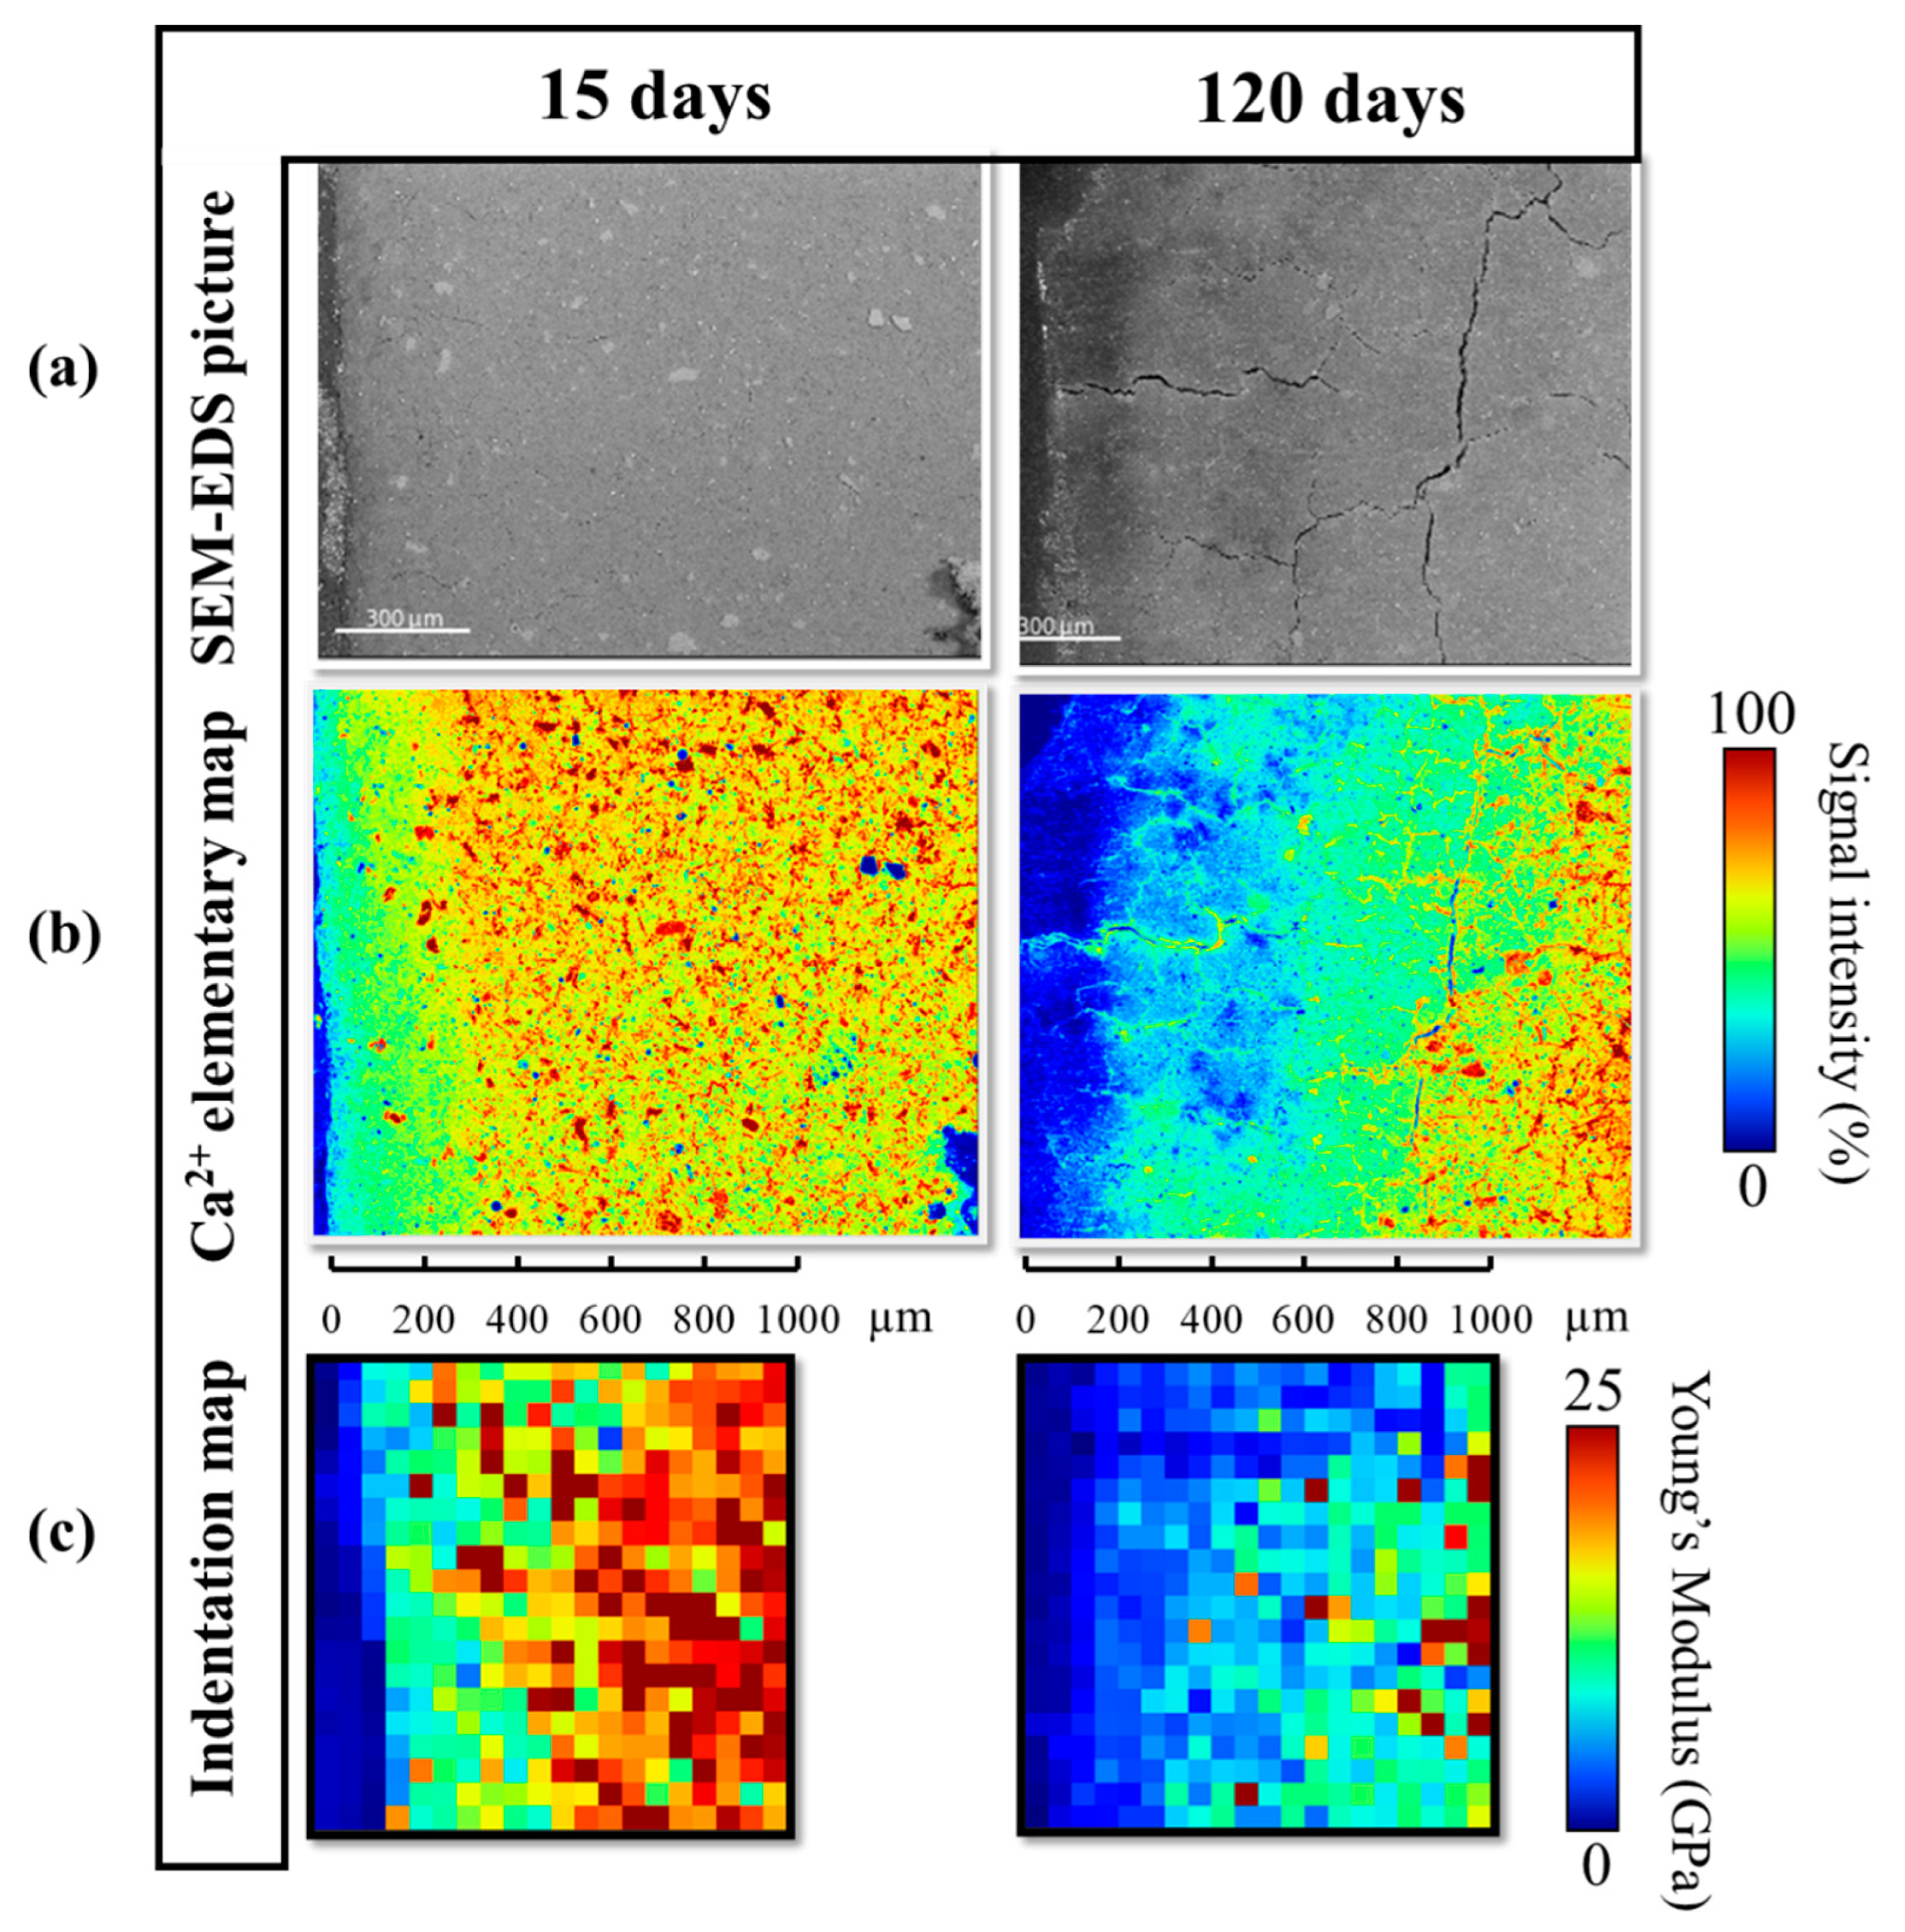
Micro-indentation acquisitions were performed on cement pastes degraded after 15 and 120 days (Figure 6c). The maps of Young’s modulus were compared to the SEM–EDS analyses performed on the same zone (Figure 6a,b). After 15 days of degradation, the depth of the decalcified zone was about 200 µm (Figure 6b). The Young’s moduli measured in this degraded zone were lower than the one measured in the sound part of the sample (21 GPa). Values as low as 5 GPa were measured near the exposed surface where the most decalcified state was reached. This decrease in the Young’s modulus according to the level of decalcification was even clearer on the 120-day degraded sample with three states of decalcification (Figure 6b): the first one occurred between 600 and 800 µm, the second one went from 200 to 600 µm, and the last one appeared from 0 to 200 µm. The Young’s modulus significantly decreased for each of these states (Figure 6c).
The decalcification of the material was due to the dissolution of portlandite and the decalcification of C-S-H. Therefore, these results highlighted the great impact of the depletion of these two minerals on the loss of the mechanical properties of the paste [9,10,11]. Furthermore, the SEM–EDS picture of the 120-day degraded sample (Figure 6a) suggests a greater porosity in the calcium depleted zone, especially near the attacked surface.
There was no observable effect of the formation of sulfate products on the measured Young’s modulus. According to XRD results, gypsum formation occurred between 100 and 400 µm (Figure 4c) and ettringite precipitation began at 550 µm after 15 days (Table 4). However, there was no significant variation in the measured Young’s modulus in these zones (Figure 6c), which highlights the preponderance of decalcification over gypsum/ettringite formation on the evolution of the mechanical properties in the present case.
A vertical crack was observed around 800 µm, which corresponded to the depth of gypsum precipitation (Figure 4c) and portlandite dissolution (Figure 4a). This same process was observed for the 60-day degraded sample at 600 µm (Figure 2a,b). Even though this crack could be due to the preparation of the sample, its presence still revealed the weakness of this zone because of the swelling induced by the sulfate products formation. A similar facies of cracking and its location was observed by Planel et al. [15] and simulated by Bary [47] due to the formation of expansive products in the degraded zone.

3.3.2. Estimation of the Young’s Modulus by Analytical Homogenization

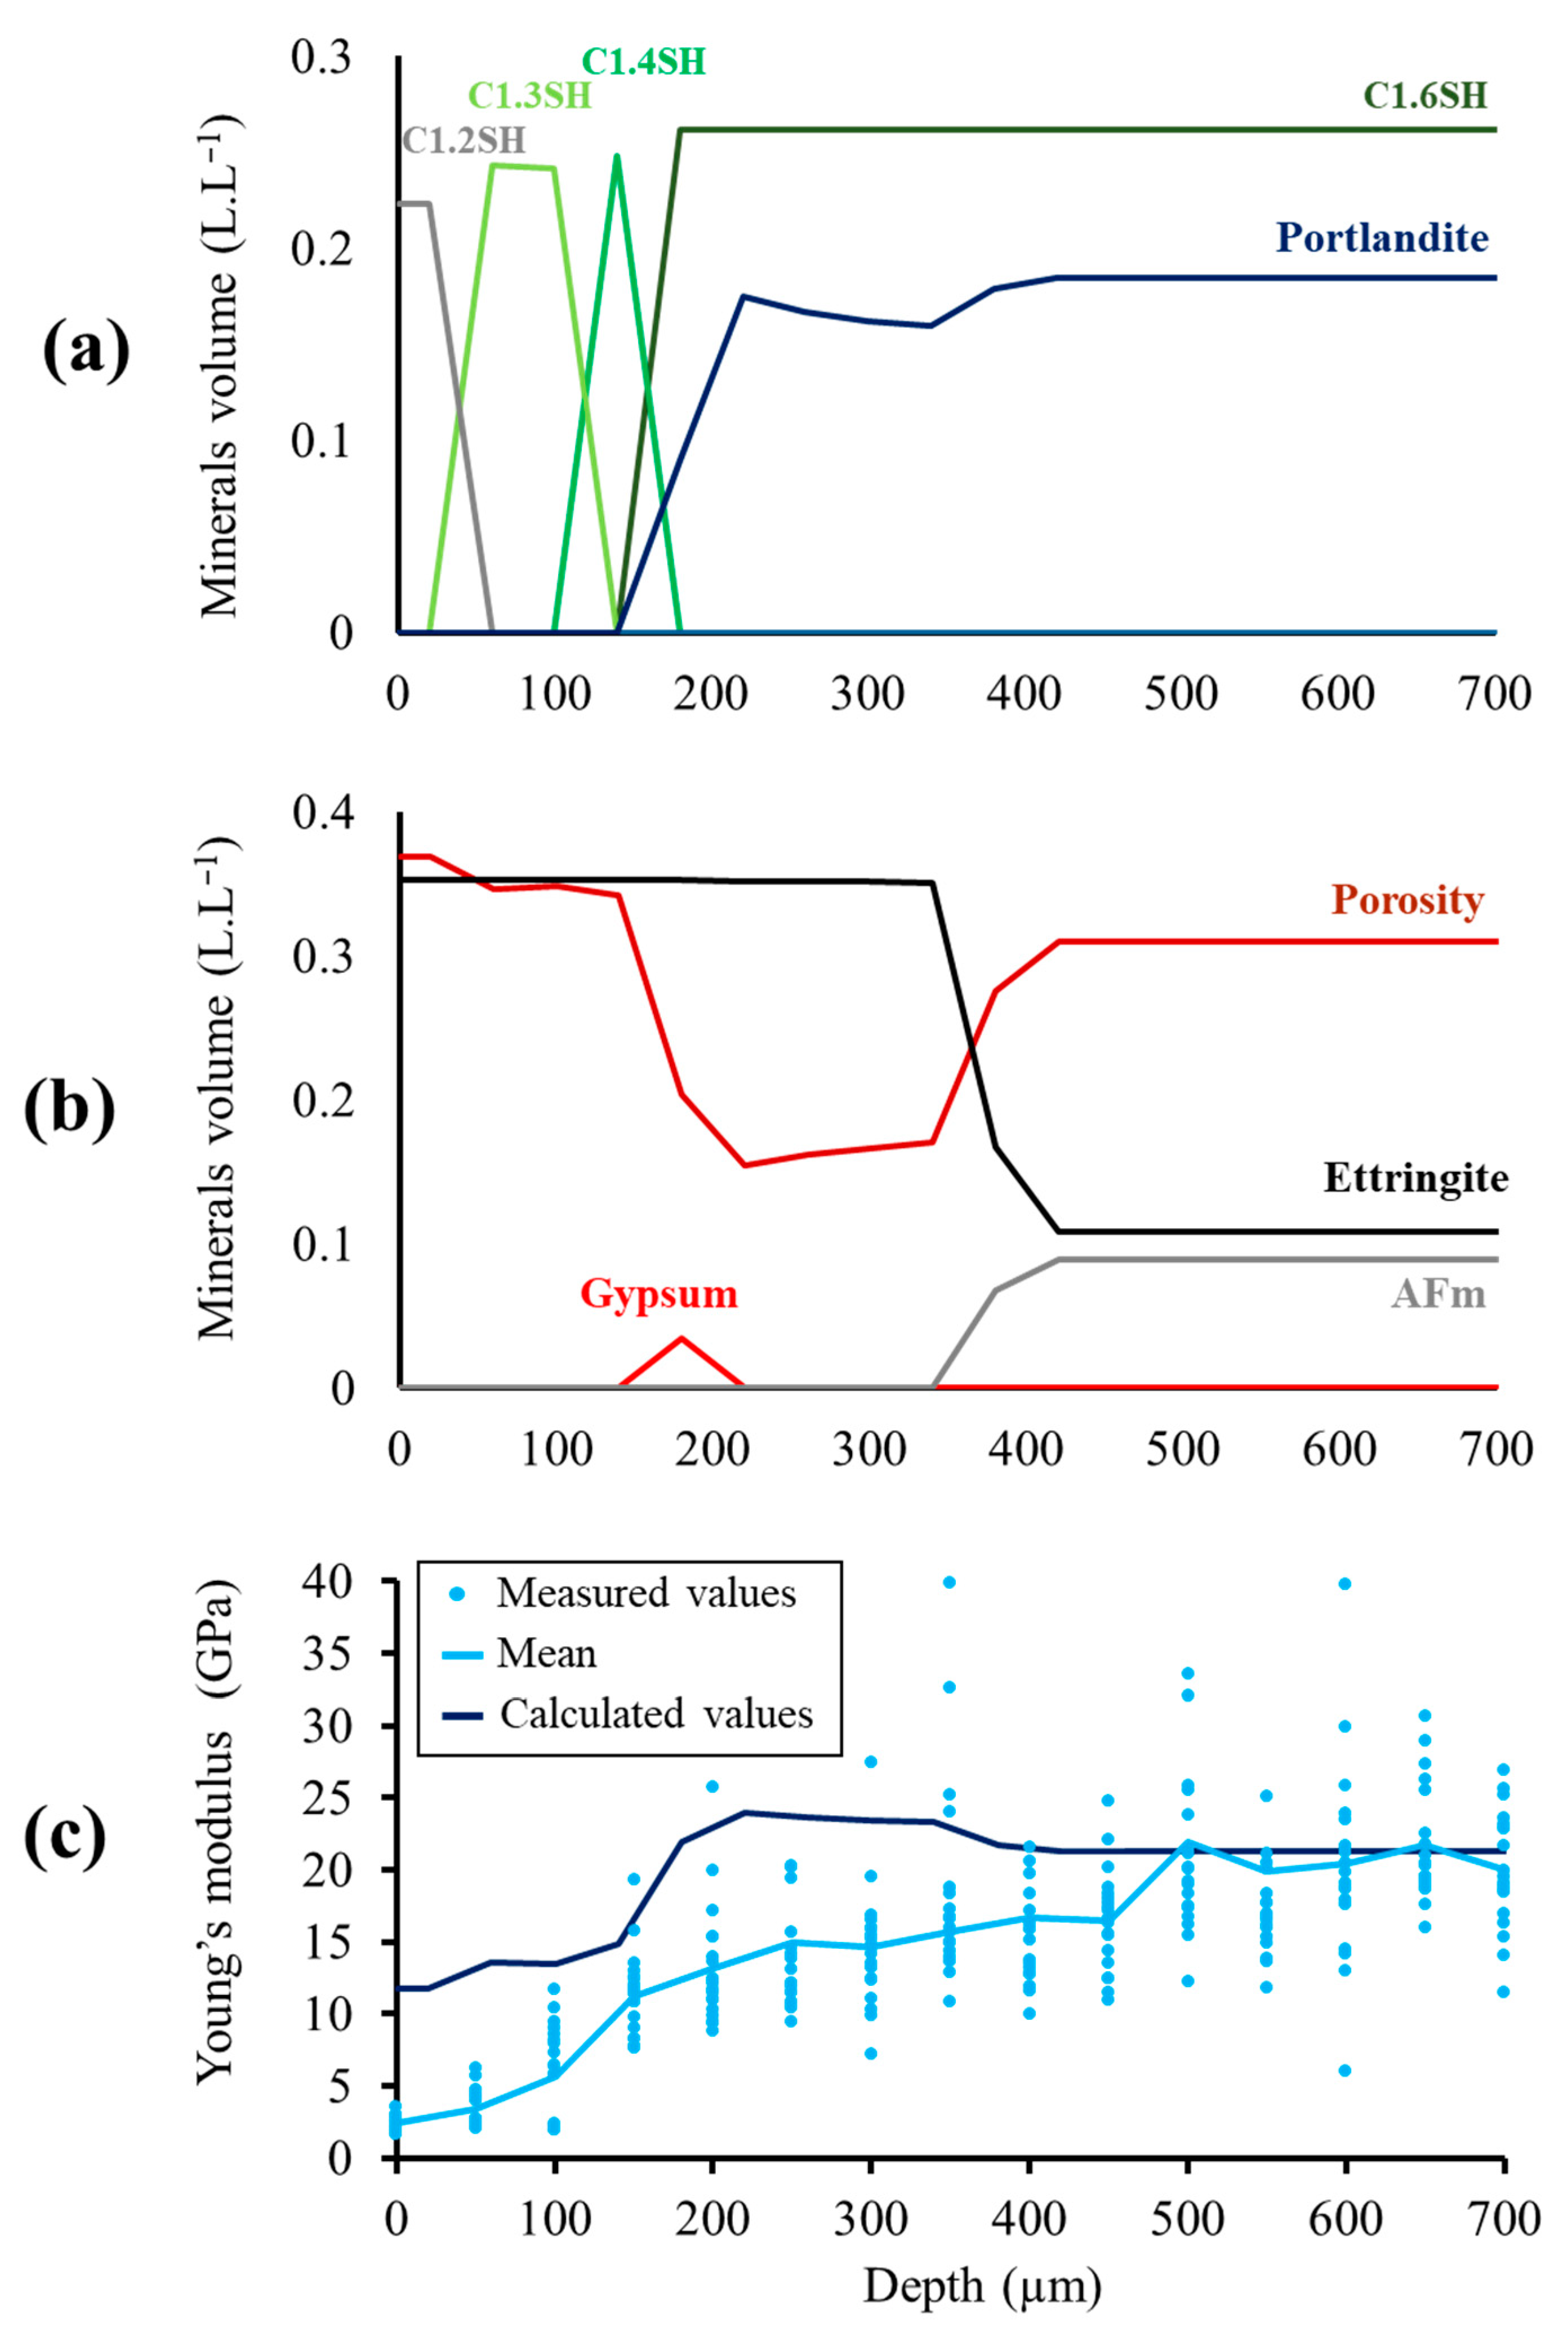
Figure 7a,b show the simulated profiles of mineral and porosity after 15 days of degradation. These results confirm that the 200 µm depth decalcified zone observed on the Ca-elementary map (Figure 6b) corresponds to the zone of portlandite depletion and of C-S-H decalcification. As was observed for the 60-day degraded sample (Figure 2d), ettringite precipitation led to the reduction in porosity while portlandite dissolution was conducive to its increase (Figure 7b). To a lesser extent, porosity increase was also due to the progressive decalcification of the C-S-H.
The micro-mechanical properties were then calculated from these total porosity and volume fractions of minerals using the homogenization method of Section 2.3.4. Calcite was not considered in the calculation as its effective precipitation was unclear. The numerical results were compared to the experimental data (Figure 7c). The cement paste is a heterogeneous material, and therefore the slight variation of the measured values observed at the same depth could be caused by the co-existence of several phases. The values measured in the sound zone (from 500 µm) were around 20 GPa, which corresponded to the values found in the sound CEM I cement paste for a water –cement ratio of 0.5 [27]. Subsequently, a progressive decrease in the Young’s modulus occurred to reach values lower than 5 GPa near the surface.
The calculated Young’s modulus in the sound part was close to the measured one (21 GPa). A slight increase in this calculated value was observed from 450 µm to reach a maximum of 24 GPa, then a diminution took place from 200 µm to reach 10 GPa at the border. These variations were both caused by the evolution of the porosity. In particular, porosity reduction due to ettringite precipitation led to a greater Young’s modulus which was not found experimentally. Furthermore, even though a decrease in the calculated elastic modulus was found where portlandite fully dissolved, the estimated values remained higher than the measured ones. This might be related to microcracking, induced by the leaching of the paste [48] and the formation of sulfate products (ettringite and/or gypsum), which could not be considered in the simulations.

3.3.3. Macroscopic Cracking and Swelling of the Samples

Figure 8 displays pictures of the samples, showing macroscopic cracking after 60 and 120 days of immersion in the sodium sulfate solution. Degradation occurred at the periphery of the cement paste while the core remained unaffected. Cracking was observed to begin at the edge of the sample after 60 days. Cracking was initiated in this specific zone even though the swelling was homogeneous at each depth of degradation. This could be explained by the high-stress concentration that occurred at the edge of the sample due to its geometrical singularity. The propagation of cracks in the core of the cement paste was observable in the 120-day degraded cement paste.
The swelling of the cement paste after 120 days was clear on the side view observed in the opposite direction of the diffusion. Indeed, the white resin that was applied to the sound sample before its degradation was a good indicator of its initial geometry and, therefore, of the deformation generated by its swelling. It is assumed that the microstructural evolution and the pressure exerted by ettringite and/or gypsum formation could be conducive to the observed macroscopic deterioration [5]. SEM–EDS analyses of sample cores revealed microcracks (Figure 2 and Figure 6) which could be an indication of what had happened earlier in the macroscopic degraded zones. Even though the impact of the sample preparation on the appearance of these cracks could not be excluded, they revealed a weakened zone due to the differential strain linked to the precipitation of expansive products and the sound material. The crack path in the sample was thus likely due to the local swelling induced by chemical reaction as well as the macroscopic swelling. Therefore, despite the low sulfate concentration, a significant deterioration of the cement paste occurred after only a few months of degradation. This could be related to the rather low decalcification of the sample during the degradation; indeed, as suggested by Cao et al. [17], a high decalcification of C-S-H leads to softening of the material and lower expansion.

4. Conclusions

The present experiments have brought some new complementary insights on the effects of a sulfate-confined environment on cementitious materials by combining rather low sodium sulfate concentrations (30 mmol/L) and non-controlled high-pH conditions that can be found, for instance, in the geologic disposal of radioactive waste in argillaceous formations.
The high pH value rapidly reached 12 in the sulfated tank solution and did not prevent the decalcification of the C3A-rich cement paste. The experimental results showed that the decalcified zone had almost reached 1 mm after 120 days of degradation, due to full portlandite dissolution and a partial C-S-H decalcification driven by out-diffusion of Ca2+, according to the modeling. The precipitation of secondary ettringite was clearly evidenced, but its amount and its location in the degraded zone were not fully captured. On the contrary, the transient stage of gypsum formation/redissolution was clearly observed and modeled, even though gypsum precipitation was a priori uncertain given the exposure conditions of low sulfate concentration and high pH.
The decalcification of the cement paste led to a great loss of the mechanical properties of the sample as the measured elastic modulus went from 20 GPa in the sound part to 5 Gpa in the most decalcified zone. The overestimation of the calculated elastic modulus may reflect microcracking due to the sample leaching and expansive products formation which locally weakens the sample, but which could not be considered in the modeling. Globally, cracking and macroscopic swelling of samples was observed after 60 days and 120 days of degradation, respectively. Overall, the rather low sulfate content and high pH of the tank solution did not prevent such significant mechanical deteriorations.

Author Contributions

Conceptualization, J.P., M.N., and L.D.W.; formal analysis, J.P.; investigation, J.P.; methodology, J.P., M.N., and L.D.W.; software, J.P., M.N., and L.D.W.; writing–original draft, J.P.; writing–review & editing, M.N., L.D.W., F.P., A.S., and J.C. All authors have read and agreed to the published version of the manuscript.

Funding

This research received no external funding.

Data Availability Statement

The data presented in this study are available on request from the corresponding author.

Acknowledgments

Relevant comments from reviewers and fruitful discussions with Patrick Le Bescop, now retired from CEA (France), are gratefully acknowledged.

Conflicts of Interest

The authors declare no conflict of interest.

Appendix A

Figure A1. XRD diagrams of the 60-day degraded cement paste at critical sample depths. The heights of peaks marked in red were plotted as a function of depth (Figure 2).
Minerals 13 00001 g0a1

References

  1. Figg, J. Field Studies of Sulfate Attack on Concrete. In Materials Science of Concrete: Sulfate Attack Mechanisms (USA); American Ceramic Society, Inc: Columbus, OH, USA, 1999; pp. 315–323. [Google Scholar]
  2. Santhanam, M.; Cohen, M.D.; Olek, J. Sulfate Attack Research—Whither Now? Cem. Concr. Res. 2001, 31, 845–851. [Google Scholar] [CrossRef]
  3. Neville, A. The Confused World of Sulfate Attack on Concrete. Cem. Concr. Res. 2004, 34, 1275–1296. [Google Scholar] [CrossRef]
  4. Yu, C.; Sun, W.; Scrivener, K. Mechanism of Expansion of Mortars Immersed in Sodium Sulfate Solutions. Cem. Concr. Res. 2013, 43, 105–111. [Google Scholar] [CrossRef]
  5. Ragoug, R.; Metalssi, O.O.; Barberon, F.; Torrenti, J.-M.; Roussel, N.; Divet, L.; de Lacaillerie, J.B.D.E. Durability of Cement Pastes Exposed to External Sulfate Attack and Leaching: Physical and Chemical Aspects. Cem. Concr. Res. 2019, 116, 134–145. [Google Scholar] [CrossRef]
  6. Clifton, J.R.; Pommersheim, J.M. Sulfate Attack of Cementitious Materials: Volumetric Relations and Expansions; National Bureau of Standards: Gaithersburg, MD, USA, 1994; Volume 5390, pp. 4–9. [Google Scholar]
  7. Sun, D.; Wu, K.; Shi, H.; Miramini, S.; Zhang, L. Deformation Behaviour of Concrete Materials under the Sulfate Attack. Constr. Build. Mater. 2019, 210, 232–241. [Google Scholar] [CrossRef]
  8. Cefis, N.; Comi, C. Chemo-Mechanical Modelling of the External Sulfate Attack in Concrete. Cem. Concr. Res. 2017, 93, 57–70. [Google Scholar] [CrossRef]
  9. Jebli, M.; Jamin, F.; Garcia-Diaz, E.; El Omari, M.; El Youssoufi, M.S. Influence of Leaching on the Local Mechanical Properties of an Aggregate-Cement Paste Composite. Cem. Concr. Compos. 2016, 73, 241–250. [Google Scholar] [CrossRef] [Green Version]
  10. Choi, Y.S.; Yang, E.I. Effect of Calcium Leaching on the Pore Structure, Strength, and Chloride Penetration Resistance in Concrete Specimens. Nucl. Eng. Des. 2013, 259, 126–136. [Google Scholar] [CrossRef]
  11. Phung, Q.T.; Maes, N.; Jacques, D.; Perko, J.; De Schutter, G.; Ye, G. Modelling the Evolution of Microstructure and Transport Properties of Cement Pastes under Conditions of Accelerated Leaching. Constr. Build. Mater. 2016, 115, 179–192. [Google Scholar] [CrossRef]
  12. Gaucher, E.C.; Tournassat, C.; Pearson, F.J.; Blanc, P.; Crouzet, C.; Lerouge, C.; Altmann, S. A Robust Model for Pore-Water Chemistry of Clayrock. Geochim. Cosmochim. Acta 2009, 73, 6470–6487. [Google Scholar] [CrossRef]
  13. Tremosa, J.; Arcos, D.; Matray, J.M.; Bensenouci, F.; Gaucher, E.C.; Tournassat, C.; Hadi, J. Geochemical Characterization and Modelling of the Toarcian/Domerian Porewater at the Tournemire Underground Research Laboratory. Appl. Geochem. 2012, 27, 1417–1431. [Google Scholar] [CrossRef]
  14. Wersin, P.; Mazurek, M.; Gimmi, T. Porewater Chemistry of Opalinus Clay Revisited: Findings from 25 Years of Data Collection at the Mont Terri Rock Laboratory. Appl. Geochem. 2022, 138, 105234. [Google Scholar] [CrossRef]
  15. Planel, D.; Sercombe, J.; Le Bescop, P.; Adenot, F.; Torrenti, J.-M. Long-Term Performance of Cement Paste during Combined Calcium Leaching–Sulfate Attack: Kinetics and Size Effect. Cem. Concr. Res. 2006, 36, 137–143. [Google Scholar] [CrossRef]
  16. El-Hachem, R.; Rozière, E.; Grondin, F.; Loukili, A. New Procedure to Investigate External Sulphate Attack on Cementitious Materials. Cem. Concr. Compos. 2012, 34, 357–364. [Google Scholar] [CrossRef]
  17. Cao, H.T.; Bucea, L.; Ray, A.; Yozghatlian, S. The Effect of Cement Composition and pH of Environment on Sulfate Resistance of Portland Cements and Blended Cements. Cem. Concr. Compos. 1997, 19, 161–171. [Google Scholar] [CrossRef]
  18. Brown, P.W. An Evaluation of the Sulfate Resistance of Cements in a Controlled Environment. Cem. Concr. Res. 1981, 11, 719–727. [Google Scholar] [CrossRef]
  19. Barbieri-Albert, B. Altération de Matrices Cimentaires Par Des Eaux de Pluie et Des Eaux Sulfatées. Approche Expérimentale et Thermodynamique. Ph.D. Thesis, Ecole Nationale Supérieure des Mines de Saint-Etienne, Saint-Étienne, France, 2002. [Google Scholar]
  20. Le Saout, G.; Füllmann, T.; Kocaba, V.; Scrivener, K. Quantitative Study of Cementitious Materials by X-Ray Diffraction/Rietveld Analysis Using an External Standard. In Proceedings of the 12th International Congress on the Chemistry of Cement, Montréal, QC, Canada, 8–13 July 2007. [Google Scholar]
  21. Vaitkus, A.; Merkys, A.; Gražulis, S. Validation of the Crystallography Open Database Using the Crystallographic Information Framework. J. Appl. Crystallogr. 2021, 54, 661–672. [Google Scholar] [CrossRef]
  22. Oliver, W.C.; Pharr, G.M. An Improved Technique for Determining Hardness and Elastic Modulus Using Load and Displacement Sensing Indentation Experiments. J. Mater. Res. 1992, 7, 1564–1583. [Google Scholar] [CrossRef]
  23. Constantinides, G.; Chandran, K.R.; Ulm, F.-J.; Van Vliet, K.J. Grid Indentation Analysis of Composite Microstructure and Mechanics: Principles and Validation. Mater. Sci. Eng. A 2006, 430, 189–202. [Google Scholar] [CrossRef]
  24. Van Der Lee, J.; De Windt, L.; Lagneau, V.; Goblet, P. Module-Oriented Modeling of Reactive Transport with HYTEC. Comput. Geosci. 2003, 29, 265–275. [Google Scholar] [CrossRef]
  25. de Windt, L.; Devillers, P. Modeling the Degradation of Portland Cement Pastes by Biogenic Organic Acids. Cem. Concr. Res. 2010, 40, 1165–1174. [Google Scholar] [CrossRef]
  26. Blanc, P.; Lassin, A.; Piantone, P.; Azaroual, M.; Jacquemet, N.; Fabbri, A.; Gaucher, E.C. Thermoddem: A Geochemical Database Focused on Low Temperature Water/Rock Interactions and Waste Materials. Appl. Geochem. 2012, 27, 2107–2116. [Google Scholar] [CrossRef]
  27. Haecker, C.-J.; Garboczi, E.J.; Bullard, J.W.; Bohn, R.B.; Sun, Z.; Shah, S.P.; Voigt, T. Modeling the Linear Elastic Properties of Portland Cement Paste. Cem. Concr. Res. 2005, 35, 1948–1960. [Google Scholar] [CrossRef]
  28. Parrot, L.J. Prediction of Cement Hydration. Proc. Br. Ceram. Soc. 1984, 35, 41–53. [Google Scholar]
  29. Bary, B.; Béjaoui, S. Assessment of diffusive and mechanical properties of hardened cement pastes using a multi-coated sphere assemblage model. Cem. Concr. Res. 2006, 36, 245–258. [Google Scholar] [CrossRef]
  30. Socié, A.; Monerie, Y.; Péralès, F. Effects of the Microstructural Uncertainties on the Poroelastic and the Diffusive Properties of Mortar. J. Theor. Comput. Overlay Appl. Mech. 2022. [Google Scholar] [CrossRef]
  31. Lothenbach, B.; Bary, B.; Le Bescop, P.; Schmidt, T.; Leterrier, N. Sulfate Ingress in Portland Cement. Cem. Concr. Res. 2010, 40, 1211–1225. [Google Scholar] [CrossRef]
  32. Jennings, H.M.; Tennis, P.D. Model for the Developing Microstructure in Portland Cement Pastes. J. Am. Ceram. Soc. 1994, 77, 3161–3172. [Google Scholar] [CrossRef]
  33. Constantinides, G.; Ulm, F.-J. The Effect of Two Types of CSH on the Elasticity of Cement-Based Materials: Results from Nanoindentation and Micromechanical Modeling. Cem. Concr. Res. 2004, 34, 67–80. [Google Scholar] [CrossRef]
  34. Stora, E.; Bary, B.; He, Q.-C.; Deville, E.; Montarnal, P. Modelling and Simulations of the Chemo–Mechanical Behaviour of Leached Cement-Based Materials: Leaching Process and Induced Loss of Stiffness. Cem. Concr. Res. 2009, 39, 763–772. [Google Scholar] [CrossRef]
  35. Gollop, R.S.; Taylor, H.F.W. Microstructural and Microanalytical Studies of Sulfate Attack. I. Ordinary Portland Cement Paste. Cem. Concr. Res. 1992, 22, 1027–1038. [Google Scholar] [CrossRef]
  36. Wang, J.G. Sulfate Attack on Hardened Cement Paste. Cem. Concr. Res. 1994, 24, 735–742. [Google Scholar] [CrossRef]
  37. Soive, A.; Roziere, E.; Loukili, A. Parametrical Study of the Cementitious Materials Degradation under External Sulfate Attack through Numerical Modeling. Constr. Build. Mater. 2016, 112, 267–275. [Google Scholar] [CrossRef]
  38. Maltais, Y.; Samson, E.; Marchand, J. Predicting the Durability of Portland Cement Systems in Aggressive Environments—Laboratory Validation. Cem. Concr. Res. 2004, 34, 1579–1589. [Google Scholar] [CrossRef]
  39. Hime, W.G.; Mather, B. Sulfate Attack, or Is It? Cem. Concr. Res. 1999, 29, 789–791. [Google Scholar] [CrossRef]
  40. Matschei, T.; Skapa, R.; Lothenbach, B.; Glasser, F.P. The Distribution of Sulfate in Hydrated Portland Cement Paste. In Proceedings of the 12th International Congress on the Chemistry of Cement, Montréal, QC, Canada, 8–13 July 2007. [Google Scholar]
  41. Irassar, E.F.; Bonavetti, V.L.; Gonzalez, M. Microstructural Study of Sulfate Attack on Ordinary and Limestone Portland Cements at Ambient Temperature. Cem. Concr. Res. 2003, 33, 31–41. [Google Scholar] [CrossRef]
  42. Feng, P.; Garboczi, E.J.; Miao, C.; Bullard, J.W. Microstructural Origins of Cement Paste Degradation by External Sulfate Attack. Constr. Build. Mater. 2015, 96, 391–403. [Google Scholar] [CrossRef] [Green Version]
  43. Le Bescop, P.; Solet, C. External Sulphate Attack by Ground Water: Experimental Study on CEM I Cement Pastes. Rev. Eur. Génie Civ. 2006, 10, 1127–1145. [Google Scholar] [CrossRef]
  44. El-Hachem, R.; Rozière, E.; Grondin, F.; Loukili, A. Multi-Criteria Analysis of the Mechanism of Degradation of Portland Cement Based Mortars Exposed to External Sulphate Attack. Cem. Concr. Res. 2012, 42, 1327–1335. [Google Scholar] [CrossRef]
  45. Adenot, F.; Richet, C.; Faucon, P. Long-Term Prediction of Concrete Durability in Radioactive Waste Management: Influence of the PH of the Aggressive Solution. In Proceedings of the International Conference on Engineering Materials, Ottawa, ON, Canada, 8 June 1997; Volume 2. [Google Scholar]
  46. Pouya, J.; Neji, M.; De Windt, L.; Péralès, F.; Socié, A.; Corvisier, J. Multi-Technical Study of Chemical and Cracking Processes of Cement Paste Degradation Subjected to a Low Concentration External Sulfate Attack. Cem. Concr. Compos. 2022. submitted. [Google Scholar]
  47. Bary, B. Simplified Coupled Chemo-Mechanical Modeling of Cement Pastes Behavior Subjected to Combined Leaching and External Sulfate Attack. Int. J. Numer. Anal. Methods Geomech. 2008, 32, 1791–1816. [Google Scholar] [CrossRef]
  48. Rougelot, T.; Burlion, N.; Bernard, D.; Skoczylas, F. About Microcracking Due to Leaching in Cementitious Composites: X-Ray Microtomography Description and Numerical Approach. Cem. Concr. Res. 2010, 40, 271–283. [Google Scholar] [CrossRef]
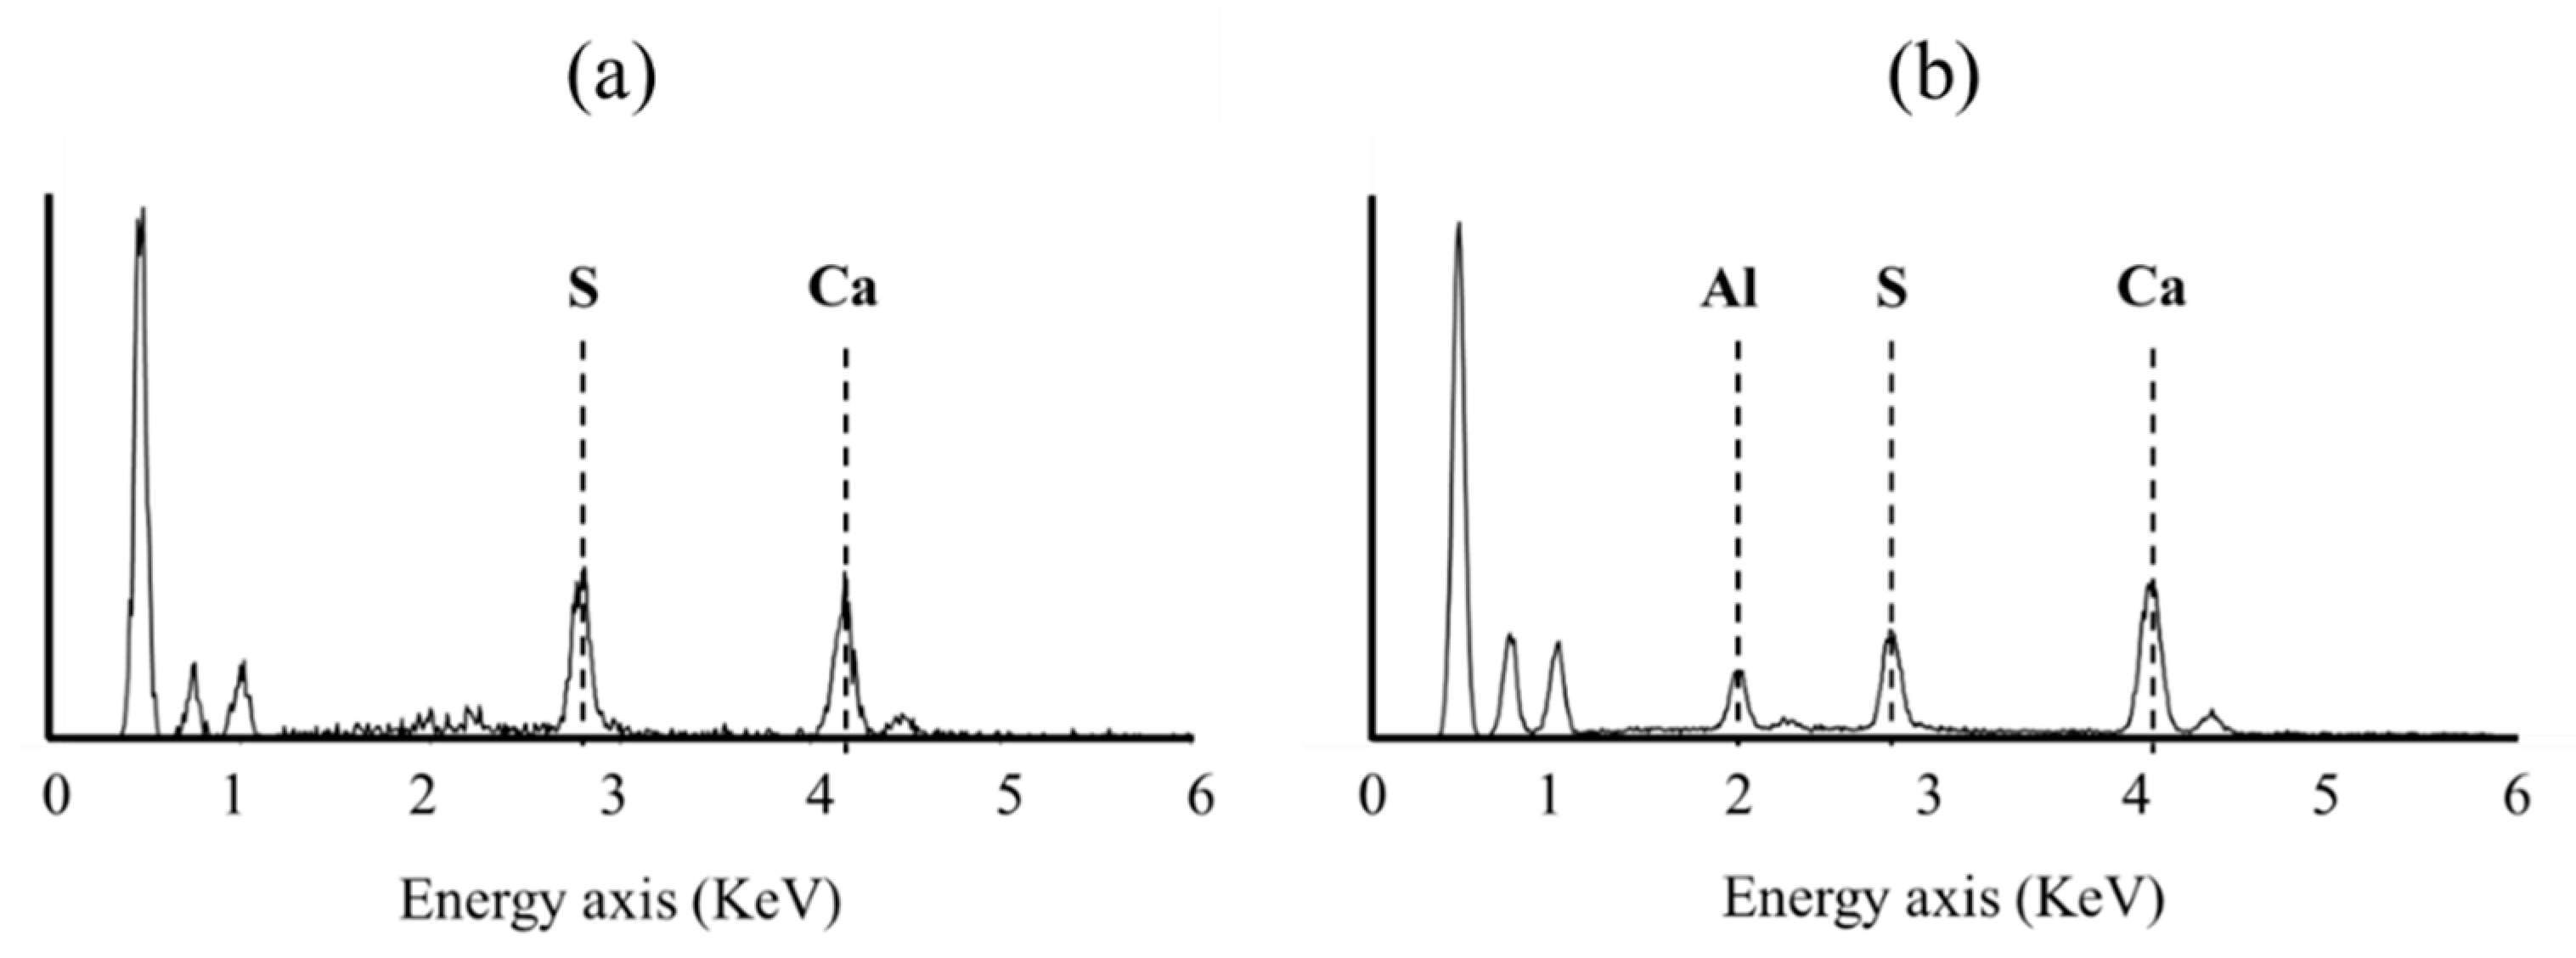
Figure 1. Spectrum of reference to detect gypsum (a) and ettringite (b) by SEM-EDS.
Minerals 13 00001 g001
Figure 2. Elementary SEM–EDS maps of Ca with the mineralogical profile of portlandite obtained by XRD (a) and elementary SEM–EDS map of S with XRD mineralogical profiles of ettringite and gypsum (c) obtained after 60 days of degradation. Simulation results of the cement paste decalcification (b) and sulfate products precipitation (d) at 60 days.
Minerals 13 00001 g002
Figure 3. Gypsum and ettringite precipitation detected using the spectrum given in Figure 1 in the 60-day degraded cement paste.
Minerals 13 00001 g003
Figure 4. Evolution of the portlandite dissolution front (a,b) and gypsum precipitation front (c,d) over time obtained by XRD and modeling. XRD intensity profiles were plotted using the main peak of portlandite (2.62 Å) and gypsum (4.28 Å).
Minerals 13 00001 g004
Figure 5. Calculation of the evolution over time of Ca2+, SO42− (a) and K+ total concentrations and pH (b) in the tank solution. The pH is compared with the measured values.
Minerals 13 00001 g005
Figure 6. SEM–EDS picture (a), Ca-elementary map, (b) and Young’s modulus map (c) of the degraded cement pastes after 15 and 120 days.
Minerals 13 00001 g006
Figure 7. Calculated profiles of minerals and porosity obtained at 15 days (a,b) considered for calculating of Young’s moduli by homogenization (c).
Minerals 13 00001 g007
Figure 8. Pictures of cement-paste degradation after 15, 60, and 120 days. Macroscopic cracking was observable on the samples at 60 days and the expansion at 120 days occurred in the opposite direction of diffusion (side view).
Minerals 13 00001 g008
Table 1. Composition of the CEM I pastes.
Chemical Analysis (g/100g)
SiO219.3
Al2O35.3
Fe2O32.6
CaO63.2
SO33.5
Na2O0.08
K2O0.94
Normative phase composition (g/100 g)
C3A11
C3S66
C2S10
C4AF8
Water
W/C (mass)0.5
Table 2. Thermodynamic formation constants at chemical equilibrium and the mechanical properties of the solid phases considered in geochemical modeling.
Solid PhaseChemical EquationLog K (a) 25 °CDensity (a) (kg·m−3)Young Mod. (b) (GPa)Poisson Coeff. (b)
Cement hydrates
C1.6SH3.2Ca2+ + 2H4SiO4 + 2.6128H2O − 6.4H+
→ (CaO)3.2(SiO2)2(H2O)3.4128
−55.99250623.8 (1)0.24
C1.5SH3Ca2+ + 2H4SiO4 + 2.2631H2O − 6H+
→ (CaO)3(SiO2)2(H2O)3.2631
−51.44247821.4 (1)0.24
C1.4SH2.8Ca2+ + 2H4SiO4 + 1.9144H2O − 5.6H+
→ (CaO)2.8(SiO2)2(H2O)3.1144
−46.93244718.9 (1)0.24
C1.3SH2.6Ca2+ + 2H4SiO4 + 1.5659H2O − 5.2H+
→ (CaO)2.6(SiO2)2(H2O)2.9659
−42.47241516.5 (1)0.24
C1.2SH2.4Ca2+ + 2H4SiO4 + 1.1895H2O − 4.8H+
→ (CaO)2.4(SiO2)2(H2O)2.7895
−38.09238914.1 (1)0.24
C1.1SH2.2Ca2+ + 2H4SiO4 + 0.7491H2O − 4.4H+
→ (CaO)2.2(SiO2)2(H2O)2.5491
−33.76238011.7 (1)0.24
C1SH2Ca2+ + 2H4SiO4 + 0.3978H2O − 4H+
→ (CaO)2(SiO2)2(H2O)2.3978
−29.4723589.2 (1)0.24
C0.9SH1.8Ca2+ + 2H4SiO4 + 0.1062 H2O − 3.6H+
→ (CaO)1.8(SiO2)2(H2O)2.3062
−25.2523276.7 (1)0.24
C0.8SH1.6 Ca2+ +2H4SiO4 − 0.218H2O − 3.2H+
→ (CaO)1.6(SiO2)2(H2O)2.182
−21.1822994.3 (1)0.24
C0.7SH1.4Ca2+ +2H4SiO4 − 0.6724 H2O − 2.8H+
→ (CaO)1.4(SiO2)2(H2O)1.9276
−17.8022924.3 (1)0.24
Ettringite2Al3+ + 6Ca2+ + 3SO42− + 38H2O
→ Ca6Al2(SO4)3(OH)12·26H2O + 12H+
−57.00177022.40.25
PortlanditeCa2+ + 2H2O → Ca(OH)2 + 2H+−22.81224142.30.324
Monocarboaluminate2Al3+ + 4Ca2+ + HCO3 + 16.7 H2O
→ Ca4Al2(CO3)(OH)12·5H2O + 13H+
−80.55214842.30.324
Hemicarboaluminate4Al3+ + 8Ca2+ + HCO3 + 35 H2O
→ Ca8Al4(CO3)(OH)26·18H2O + 27H+
−183.651921--
Monosulfoaluminate2Al3+ + 4Ca2+ + SO42− + 18H2O
→ Ca4Al2(SO42−)(OH)12·6H2O + 12H+
−73.06200042.30.324
Other phases
GypsumCa2+ + SO42− + 2H2O → CaSO4(H2O)24.61230545.70.33
CalciteCa2+ + HCO3 → CaCO3 + H+−1.85271079.60.31
GibbsiteAl3+ + 3H2O → Al(OH)3 + 3H+−7.732441--
Amorphous silicaSiO2(aq) → SiO2(am)2.692072--
(a) [26], (b) [27]. (1) Calculated values (see text in Section 2.3.4).
Table 3. Calculated total porosity from minerals and unhydrated clinker volume fractions.
Volume Fraction
Minerals
Portlandite0.18
C1.6SH0.26
Ettringite0.11
Monocarboaluminate0.09
Unhydrated clinker
C3S0.03
C2S0.01
C3A0.006
C4AF0.006
Porosity0.31
Table 4. Comparison between the monocarboaluminate limit-detection depth deduced from the XRD results with the ettringite precipitation calculated depth obtained from the HYTEC simulation.
Num. Data (HYTEC)
Secondary Ettringite
Precipitation Depth (µm)
Exp. Data (XRD)
Monocarboaluminate Detection Depth (µm)
15 days480550
60 days900800
120 days 1300950
Table 5. Experimental depths of decalcification and gypsum precipitation when the samples are immersed in a small volume of solution without regulation of pH and when the samples are degraded in a large volume of solution under controlled pH.
Decalcification
Limit Depth (µm)
Gypsum
Precipitation Depth (µm)
Gypsum
Thickness (µm)
Small vol. of solution with non-regulated pH900500–800300
Large vol. of solution with pH control around 71400800–1300500
Disclaimer/Publisher’s Note: The statements, opinions and data contained in all publications are solely those of the individual author(s) and contributor(s) and not of MDPI and/or the editor(s). MDPI and/or the editor(s) disclaim responsibility for any injury to people or property resulting from any ideas, methods, instructions or products referred to in the content.