Article

Cumulative Risk Assessment of Soil-Crop Potentially Toxic Elements Accumulation under Two Distinct Pollution Systems

1
School of Environment and Surveying Engineering, Suzhou University, Suzhou 234099, China
2
Yunnan Soil Fertilizer and Pollution Remediation Engineering Laboratory, Kunming 650201, China
3
College of Resources and Environment, Yunnan Agriculture University, Kunming 650201, China
4
School of Biological and Food Engineering, Suzhou University, Suzhou 234099, China
*
Author to whom correspondence should be addressed.
Minerals 2022, 12(9), 1134; https://doi.org/10.3390/min12091134
Submission received: 31 July 2022 / Revised: 24 August 2022 / Accepted: 29 August 2022 / Published: 7 September 2022
(This article belongs to the Special Issue Chemical Composition of Soils and Soil Sediments)

Abstract

:
High geological background and human activities are the two major pollution sources for soil potentially toxic elements (PTEs) accumulation around the world. Mining is the prime human activity that poses a serious threat to the farmland’s ecosystem safety. This study assesses the farmland safety in the typical high geological background area and the superimposed area of high background-mining activity in eastern Yunnan in China by systematic analysis of the accumulation and risk characteristics of seven PTEs such as arsenic (As), mercury (Hg), copper (Cu), zinc (Zn), lead (Pb), cadmium (Cd), and chromium (Cr). Furthermore, we used Cd as the characteristic element to establish a relationship model between crop PTEs accumulation and the physical and chemical characteristics of the soil. We find that in the farmland soil from the superimposed area, the accumulation point over-standard rate of seven PTEs is higher than in the typical high geological background area. The accumulation of Pb, Cd, Cu, and Zn is related to frequent man-made mining activities. The bioavailability relationship model, using Cd as the soil-crop characteristic element, reveals that only in the crops (cereals, vegetables) of the high geological background area; the Cd bio-concentration factor significantly correlate with the physical and chemical properties of the soil. This suggests that the PTEs contaminated farmland in high geological background areas can be concomitantly restored during usage by adjusting the soil’s physical and chemical properties, while in the superimposed area, the farmland area needs prior restoration by removing man-made mining activities.

1. Introduction

Soil, an integral part of the ecological environment, is the basic natural resource for human survival and the most fundamental for the safe production of crops. Given the easy accumulation, difficult degradation, and long damage cycle, potentially toxic elements (PTEs) accumulation is a serious cause of soil quality degradation. PTEs, especially for cadmium (Cd), lead (Pb), arsenic (As), and so on, which get easily absorbed by crops into the edible part and then flow into the food chain, are potential risks to food safety and human health [1,2,3,4,5]. According to the “State of the World Soil Resources” report of the Food and Agriculture Organization of the United Nations, global soil resources are not optimistic, and “soil pollution” has become the topmost global challenge facing soil functional degradation [6]. In the last four decades, rapid urbanization and highly intensive agricultural production, especially the industrial discharge of “three wastes” such as mining, smelting, and electroplating, the excessive usage of pesticides, organic fertilizers, and chemical fertilizers in the agricultural production process [7,8,9,10,11], have aggravated serious problems of farmland soil pollution. The increasing environmental quality degradation has created a grave situation threatening the quality and safety of agricultural products and human life [12]. Presently, the Chinese government, attaching great importance to PTEs pollution and risk management of farmland soils, has set up a series of special agricultural research projects to conduct key investigations [13].
Mining activities and high geological background are the two main factors for the PTEs accumulation in farmland soils [14], especially in the southwestern region of China, such as Yunnan, Guizhou, Sichuan province, etc. The farmland soil contains higher PTEs concentrations in these areas, especially for Cd, Pb, Zn, Cu, and As elements [15], which are considered to be mainly derived from the soil-forming parent rock (mainly granite, phyllite, gneiss, sand shale, and old impact laterite layers, and some purple sandstone and limestone) and the soil-forming process (desiliconization and aluminum enrichment and bioaccumulation). Apart from that, intensive mining activity (lead–zinc mines, copper mines, coal mines, etc.) is also a contributing factor. Previous studies on PTEs soil pollution and remediation mainly focused on the typical regional farmland characteristics, such as mining activity [16,17], long-term fertilization [18,19], sewage irrigation [20,21,22], and so on. Particularly, concerning PTEs pollution, more researches, especially the soil-crop studies, largely focused on intensive mining activity while paying less attention to PTEs accumulation from a typical high background. Notably, in many areas, the PTE concentration has exceeded the risk screening value in the “Soil Environmental Quality: risk control standard for soil contamination of agricultural land “. Regrettably, the Diandong District of Yunnan Province, China is a typical high geological background area [15]. Besides, there are rare reserves of large lead-zinc mines in Huize County [23] that overlap with high background and mining activity areas. Therefore, it is critical to investigate the cumulative risk of PTEs in the farmland soil-crop system under two types of pollution systems, i.e., the typical high geological background and the other with additional densely superimposed mining activity. Accordingly, we selected Qujing City in southwestern Yunnan as a typical case and divided it into high geological background areas with and without obvious mining pollution. The collaborative sampling of farmland soil crops was carried out and the accumulation characteristics of pollution risk of seven PTEs, including As, mercury (Hg), copper (Cu), zinc (Zn), Pb, Cd, and chromium (Cr), were systematically analyzed. Moreover, we explored the bioavailability model to relate PTEs bio-concentration coefficient with soil physical and chemical characteristics (pH, soil organic matter (SOM), total and available PTEs concentration). The purpose of this study is to establish the relationship between pollution risk and soil physical and chemical characteristics to characterize the differences in the safe utilization of heavy metal-contaminated farmland soils with different genetic characteristics, especially in high geological background areas and the superimposed areas with high geological background and industrial mining. Meanwhile, scientific and artificial control measures are established to ensure the safe use of farmland soil in areas contaminated by various types of sources of PTEs.

2. Materials and Methods
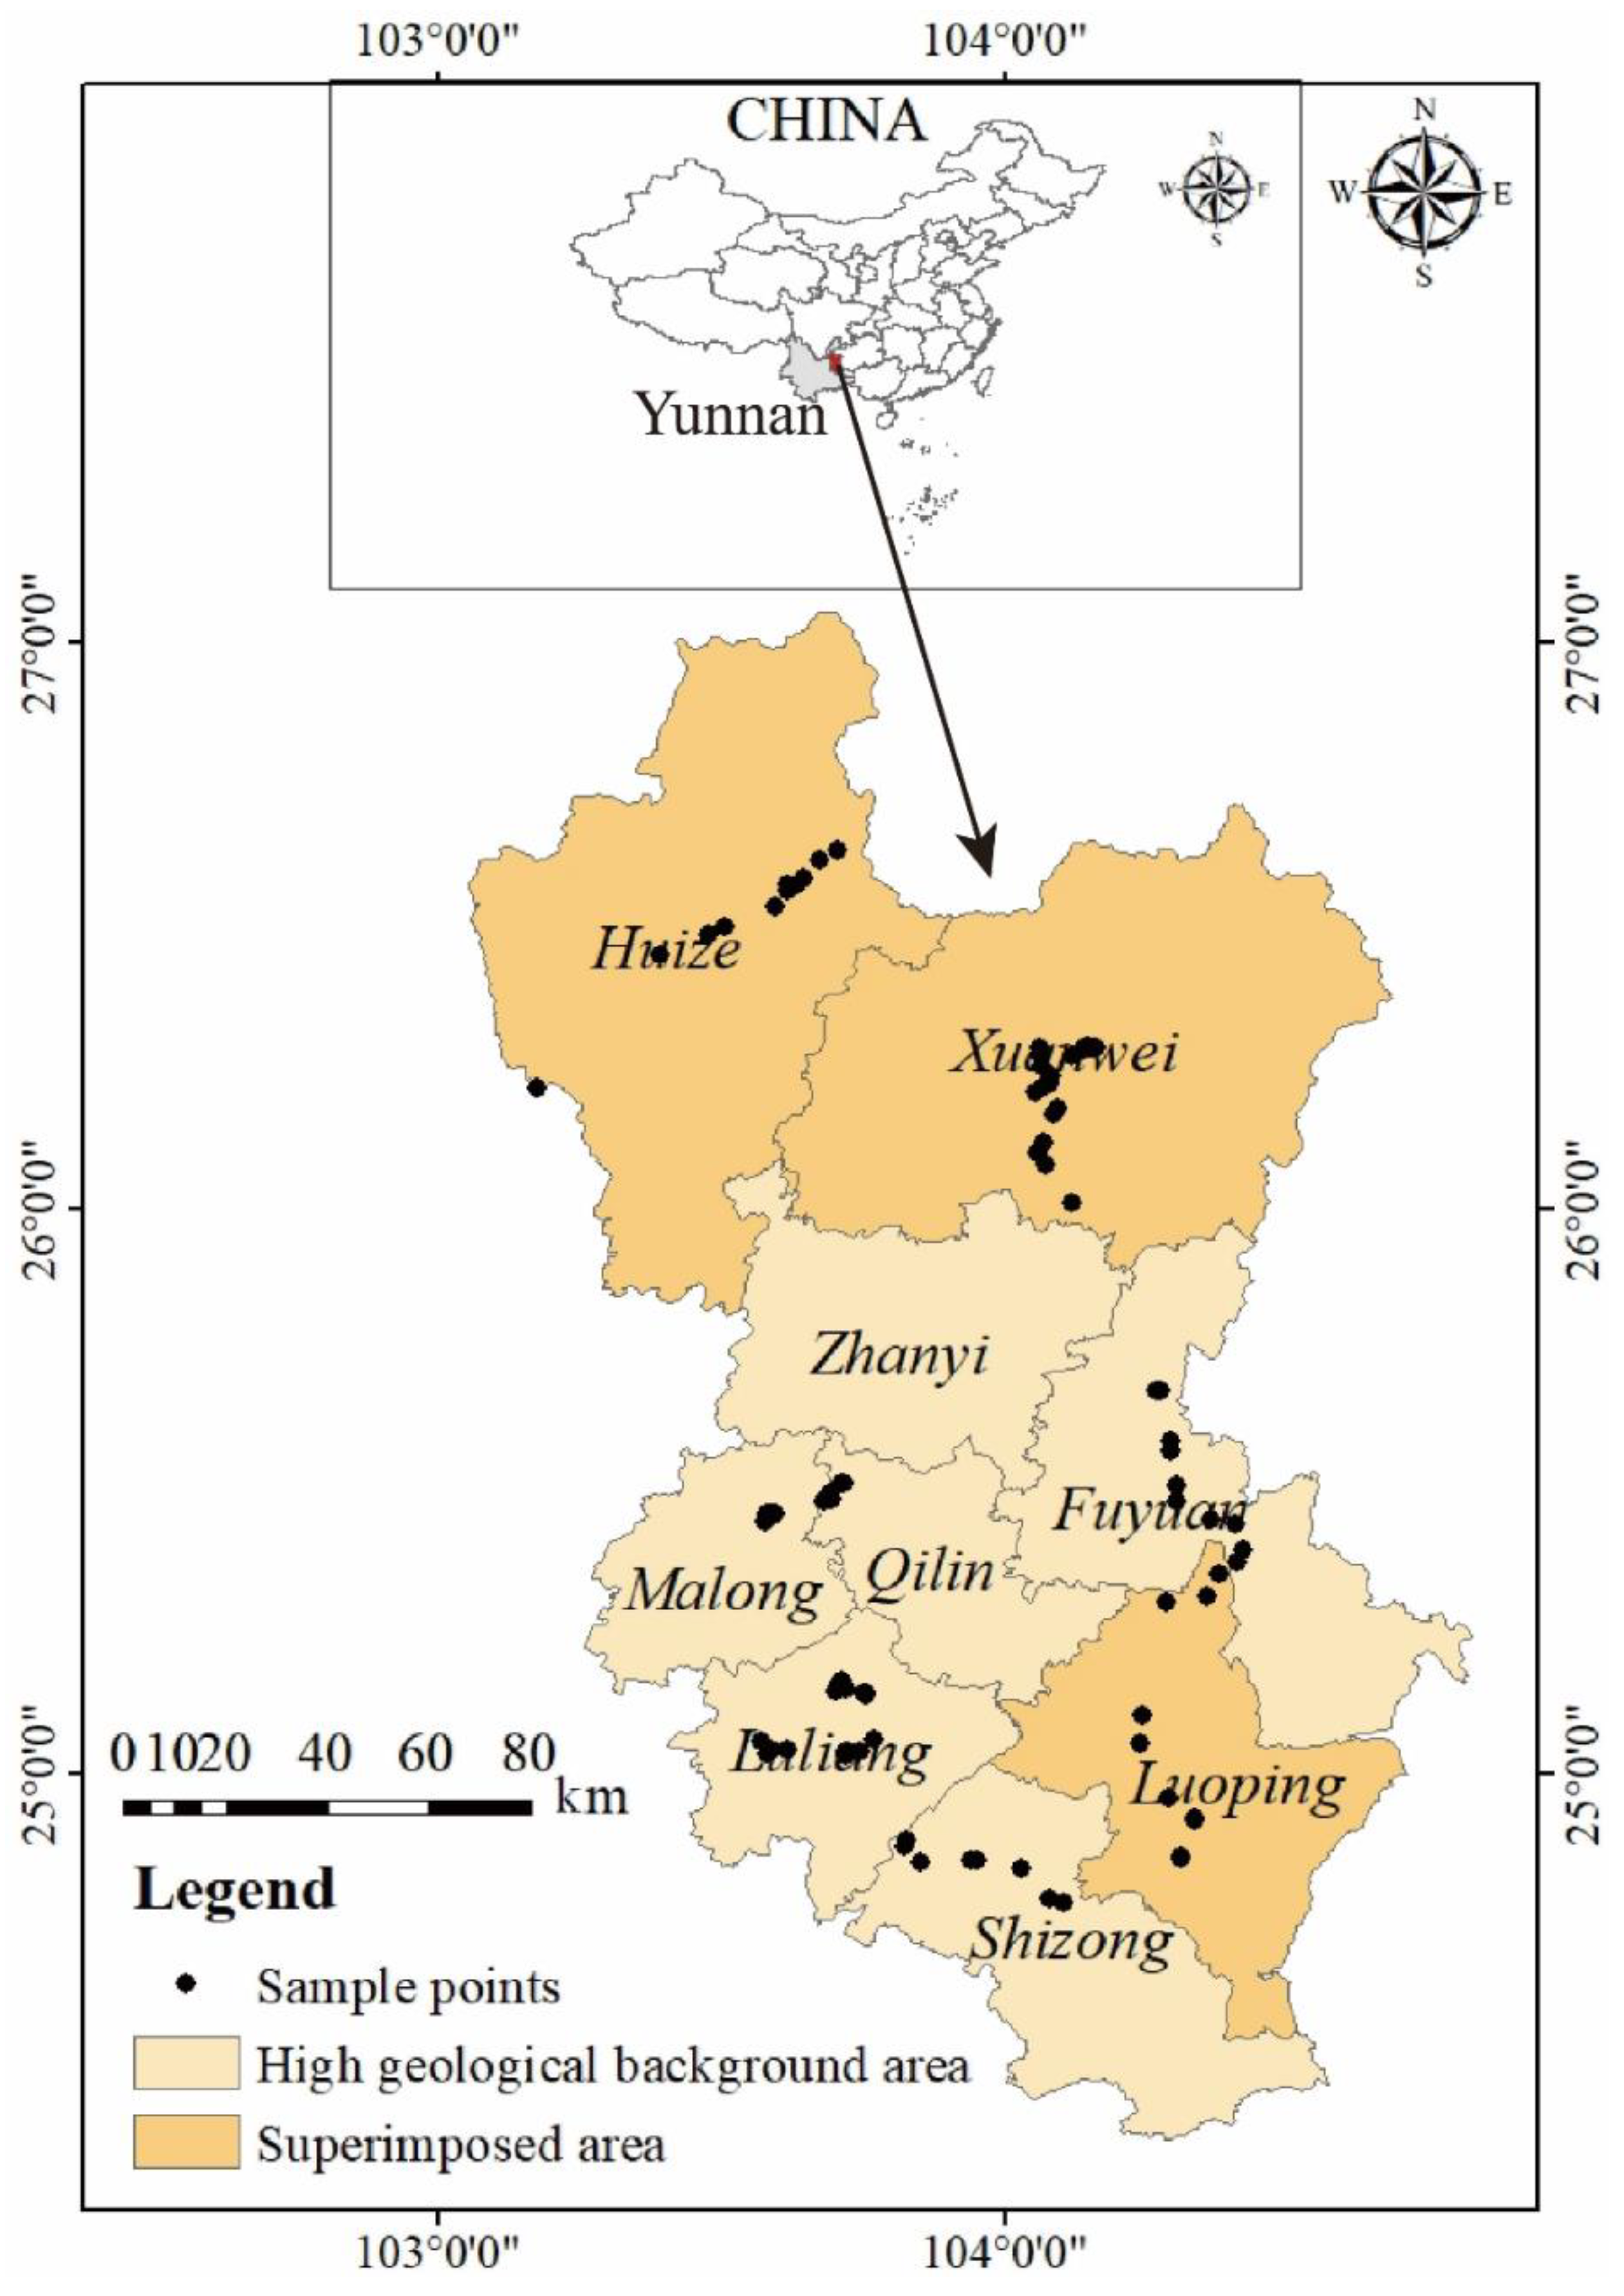
2.1. Study Area

The research area, Qujing City (Figure 1) in eastern Yunnan in southwest China (103°03′–104°50′ E, 24°19′–27°03′ N, average altitude 1881 m) is located in the Wumeng Mountains in the transitional zone from the Eastern Yunnan Plateau to the Western Guizhou Plateau in the middle of the Yunnan-Guizhou Plateau. Being located at the junction of Yunnan, Guizhou, and Guangxi provinces, it is known as the “Dian-qian Lock Key” and the “Yunnan Throat”. The area has a subtropical monsoon climate, and the average temperature, annual precipitation, and sunshine duration are 14.5 °C, 592.1 mm, and 1998.1 h, respectively. The total land area of 2.890 million hm2 includes 0.727 million hm2 of arable land with a grain planting area of 0.63 million hm2. Out of this, 0.171 million hm2 is used for vegetables and edible fungus planting. The main soil types of the arable land area are red soil (61.1%), purple soil (9.8%), and yellow loam (5.2%), respectively. Notably, within the study area, Luoping County, Huize County, and Xuanwei City have lead-zinc mines, phosphate rock, and other mineral resources. Moreover, the relatively dense anthropogenic mining activity and high geological background are superimposed in the area, hereafter referred to as the superimposed area. In contrast, other typical high geological background areas, Qilin District, Malong County, Luliang County, Shizong County, and Fuyuan County, are without anthropogenic pollution, hereafter referred to as the high background area. The main geological types of the overall study area are limestone and basalts, and very few areas are black shales.

2.2. Soil and Crop Sample Collection

The soil-crop (edible part) collaborative samples (Table 1), with relatively concentrated and discrete uniform characteristics, were collected between late August to early September 2018 in the main farmland study area (including Malong County, Luliang County, Qilin District, Luoping County, Fuyuan County, Shizong County, Xuanwei City, and Huize County). Additionally, in each County area tested, the fields with contiguous and relatively concentrated farmland with continuous crop planting were selected for sample collection. A total of 104 sampling sites were selected based on the administrative area (12 sites in the Malong County, 19 sites in the Luliang County, 10 sites in the Qinlin District, 10 sites in the Luoping County, 10 sites in the Fuyuan County, 9 sites in the Shizong county, 20 sites in the Xuanwei City, and 14 sites in the Huize County), and pollution types (60 sites in typical high geological background area, and 44 sites in the superimposed area of high background and pollution activities). The composite soil samples at a depth of 0–20 cm were collected with a wooden shovel following the “S”-shaped five-point sampling method [24], and the 500 g of the mixed soil sample was taken according to the quarter method. The test sample, placed into a sterile Ziplock bag, was transferred to the laboratory for labeling and drying naturally. During the drying process, the sample was rubbed frequently to avoid cementation, remove stones, plant residues, and other soil impurities. The dried sample was lightly ground with a mallet before sieving through a 100-mesh nylon sieve. Crop samples were classified according to grains and vegetables, and the edible parts were collected corresponding to the soil samples. The crop samples, placed in a sterile fresh-keeping plastic bag, were marked and transported to the laboratory in a low-temperature incubator. The sample surface was cleaned from dirt, dry leaves, and other debris with tap water, purified water, and ultrapure water by several repeated washings. The washed samples were oven-dried at a constant temperature of 105 °C for 30 min and then to constant weight at 75 °C. The well-dried samples were pulverized and passed through a 100-mesh nylon sieve for further analysis.

2.3. Sample Analysis

Nitric acid-perchloric acid-hydrofluoric acid digestion was used to extract the total PTE content from the soil. The As element was determined by atomic fluorescence spectrometry (GB/T 22105-2008). Additionally, the Hg, Cu, Zn, Pb, Cd, and Cr elements were determined by inductively coupled plasma mass spectrometry (HJ 766–2015). The soil bio-available Cd content was extracted with DTPA and determined by graphite furnace atomic absorption spectrophotometry (GB/T 23739-2009). The soil pH was estimated by electrode method in a 1:2.5 suspension solution (air-dried soil/distilled water). Soil organic matter (SOM) was determined using concentrated H2SO4 and 0.8 mol·L−1 K2Cr2O7 with external heating oxidation method, followed by titrating with 0.2 mol·L−1 FeSO4 [24]. The crop sample elements such as As, Hg, Cu, Zn, Cd, and Cr were extracted by microwave digestion method and determined by inductively coupled plasma mass spectrometry (GB 5009.268-2016). The limits of detection (LODs) for As, Hg, Cu, Zn, Pb, Cd, and Cr were 7.5, 0.0486, 10.0, 214.0, 245, 13.2, and 5.38 ng·L−1, respectively. For quality control purposes, two certified reference soils (GBW07413a and GBW07451) and two crop materials (GBW10011 and GBW07605) from the National Research Center for Certified Reference Materials of China were also analyzed. The measured concentrations of reference materials were within the certified ranges, and the average recoveries for As, Hg, Cu, Zn, Pb, Cd, and Cr were 90.5, 95.7, 94.6, 103, 98.2, 93.5, and 108.0% for soil samples and 107, 105, 99.6, 90.9, 94.7, 109, and 105% for crop samples, respectively.

2.4. Soil-Crop System Comprehensive Quality Impact Index Assessment

The collaborative assessment of PTEs impacts in agriculture (based on IICQ) was calculated using the five equations described below [25].
(1) Soil relative impact equivalent (RIE) as follows:
R I E = [ I = 1 N ( P s s i ) 1 / n ] / N = [ i = 1 N ( C i / C t i ) 1 / n ] / N
where N is the number of elements, n is the stable oxidation number of the elements i (As, Hg, Cu, Zn, Pb, Cd, and Cr were 5, 2, 2, 2, 2, 2, and 3, respectively) [25,26], Pssi is the soil single pollution index of element i, Ci is the detected concentration of element i, and Cti is the threshold value of the soil environmental quality of element i. The respective threshold values of elements for agricultural land in China are as follows: As, Hg, Cu, Zn, Pb, Cd, and Cr are 40, 1.3, 50, 200, 70, 0.3, and 150 mg·kg−1 (pH < 5.5), 40, 1.8, 50, 200, 90, 0.3, 150 mg·kg−1 (5.5 < pH < 6.5), 30, 2.4, 100, 250, 120, 0.3, and 200 mg·kg−1 (6.5 < pH < 7.5), 25, 3.4, 100, 300, 170, 0.6, and 250 mg·kg−1 (pH > 7.5), respectively [27].
(2) Deviation degree between detected and background values (DDDB) and deviation degree between threshold and background values (DDTB) as follows:
D D D B = [ i = 1 N ( P s b i ) 1 / n ] / N = [ i = 1 N ( C i C b i ) 1 / n ] / N
B B S B = i = 1 N ( C t i / C b i ) 1 / n
where Psbi is the degree of detected concentration beyond the background value for element i, Cbi is the background value of element i, and the other symbols correspond with those in equation (1). The background values of As, Hg, Cu, Zn, Pb, Cd, and Cr in the study area are 16.04, 0.048, 47.20, 93.76, 42.42, 0.24, 76.32 mg·kg−1, respectively [28].
(3) Quality index of agricultural products (QIAP) as follows:
Q I A P = [ i = 1 N ( P a p i ) 1 / n ] / N = [ i = 1 N ( C a p i / C a t i ) 1 / n ] / N
where Papi is the degree of detected concentration beyond the threshold limit value of agricultural crops of element i, Capi is the detected concentration in agricultural crops of element i in corresponding sites, and Cati is the threshold limit value of element i in foods. The threshold limits for As, Hg, Cu, Zn, Pb, Cd, and Cr, concerning cereal crops are 0.5, 0.02, 10, 50, 0.2, 0.1, and 1.0 mg·kg−1, and for vegetable crops are 0.5, 0.01, 10, 20, 0.1, 0.05, and 0.5 mg·kg−1 respectively [29,30,31].
(4) Impact index of comprehensive quality (IICQ) as follows:
II C Q   = II C Q s +   II C Q a p   =   [ X ( 1 + R I E ) + Y ( D D D B / D D S B ) ] + [ Z ( 1 + Q I A P / k ) + Q I A P / ( k D D S B ) ]
where IICQs and IICQap denote IICQ for soil and agricultural crops, respectively. X, Y, and Z are the measured concentrations that exceeded soil threshold values, soil background values, and threshold limit values of agricultural crops, respectively. k is the correction parameter, usually set to 5 [25]. When one of IICQ, IICQs, and IICQap is <1.0, 1.0–2.0, 2.0–3.0, 3.0–5.0, and >5.0, the potential risk of PTEs pollution in the cultivation system is correspondingly uncontaminated, slightly contaminated, moderately contaminated, heavily contaminated, and extremely contaminated.

2.5. Bioaccumulation Coefficient for PTEs in Edible Crops

Based on crop types (cereals, vegetables), SPSS 18.0 (San Francisco, CA, USA) was used to perform multiple regression analysis to construct a PTEs bioavailability model using crop Cd bio-concentration factor (BCF), soil pH, SOM, and the proportion of available Cd. The basic formula is as follows:
l g   B C F = α × p H + β × l g S O M + γ × l g   ( C a v a i l C t o t a l ) + k
where BCF is the bio-concentration factor, which is the ratio of Cd content in the edible part of the crop to the total soil Cd content, pH is the soil pH, and SOM is the soil organic matter, g·kg−1. Cavail is the soil available Cd content determined by the DTPA method, mg·kg−1. Ctotal is the total soil Cd content, mg·kg−1. α, β, and γ are the dimensionless parameters, indicating the degree of influence of soil pH, SOM, and the available Cd proportion on the bio-concentration coefficient. k is the intercept of the variance, signifying the inherent sensitivity of crops to accumulate Cd.

2.6. Data and Statistical Analysis

Data were processed with Microsoft Excel 2016 (Microsoft, Redmond, WA, USA). Principal component factor and Pearson correlation analysis were performed with SPSS 18.0 software, and one-way variance and least significant difference (LSD) were used to find the data significance. Results were plotted with Origin Pro 9.1 (64 Bit) (Origin Lab Corporation Northampton, MA, USA).

3. Results

3.1. Soil PTEs Content

The accumulation characteristics and over-standard rates of seven PTEs As, Hg, Cu, Zn, Pb, Cd, and Cr were statistically analyzed under the two pollution conditions (Table 2). In the samples from high background areas, the average concentration (mg·kg−1) of PTEs was in the following order: Zn (169.36) > Cr (122.06) > Cu (73.78) > Pb (28.83) > As (7.96) > Cd (1.12) > Hg (0.12). Compared to the Chinese standard GB15618–2018, only the Cd soil concentration was found beyond the risk value but within the control value. The soil Cd amount, reaching 87.04%, is the most serious concern. The soil Zn amount also exceeded the standard, reaching 31.48%, while Hg and Pb were within the limits. In the samples from the superimposed area, the average concentration of 7 PTEs showed a trend of Zn (279.56) > Cr (158.73) > Cu (145.95) > Pb (145.77) > As (19.78) > Cd (4.44) > Hg (0.22). Compared to the standard GB15618–2018, Cd, Cu, Pb, and Zn exceed the amounts, reaching 14.8, 1.46, 1.22, and 1.12 times the risk screening value, respectively. The Cd point exceeding rate was the most serious, reaching 100.00%, while the point exceeding rates of Cu, Zn, and Pb reached up to 71.43%, 59.18%, and 24.49%, respectively. These results showed that the PTE pollution risk in the superimposed area was much higher than in the high background area. Notably, in both scenarios, soil Cd pollution was the most serious concern, while the arithmetic mean values of Cu, Zn, and Pb were significantly higher only in the superimposed area, along with significantly increased point-exceeding rates.

3.2. Source Analysis of Soil PTEs Contamination

SPSS 18.0 software was used to perform the Kaiser-Meyer-Olkin test on the PTE concentration data of farmland soil under two pollution conditions; the obtained statistical values were 0.49 and 0.46, and the associated probabilities of the Bartlett sphericity test were 0.00 and 0.00, respectively. Accordingly, the data were subjected to factor analysis (PCA), and the results are shown in Table 3. The Kaiser standardized factors were orthogonally rotated by Varimax. The high background area produced 4 principal components with eigenvalues > 1. The variance contribution rates of 21.26, 20.73, 19.12, and 16.57%, and the cumulative contribution rate of 77.68%, explain the sources of PTEs in farmland soils. Among them, Cd, the most polluting element with the highest rate of excess point, was mainly triggered by the principal component FG2, explaining 90% of the contribution probability. The element Cu, which was a little over the point standard but within the average value, was caused by the main components FG1 and FG2, with a contribution probability of 68 and 48%, respectively. Cr was caused by the main component FG3, explaining 88% of the contribution probability. Zn was caused by FG1, FG2, and FG3 with a contribution probability of 43, 52, and 51, respectively. These findings, combined with the Pearson correlation analysis (Table 4), suggested a very significant correlation between As and Cu (p < 0.05), and a significant correlation with Zn (p < 0.05) indicating a high homology between As and Cu, and a partial homology with Zn. Moreover, Cu and Zn showed a significant correlation. Cd with a significant correlation indicated a high degree of homology with Cu and Zn and a partial degree of homology with Zn and Cr. Considering that the background soil Cd value in Yunnan Province is 2.4 times higher than that of China, and the Cd background value of the study area (Qujing) is extremely high at the provincial level [28]. The contribution rate of factor FG2 for Cd was as high as 90%. Therefore, it can be considered as the soil parent material. Soil Cd showed significant homology with Cu and Zn in the genesis (p < 0.05), with the contribution rate of soil’s parent material for Cu and Zn as 48% and 52%, respectively. Organic fertilizers, pesticides, chemical fertilizers, and livestock manure were another important source of Cu and Zn pollution [32,33,34,35], while the runoff and atmospheric deposition of polluted water from upstream lead–zinc mining areas are the only sources of Pb and Zn pollution, respectively.
In the superimposed area, three principal components with characteristic values > 1 were identified. The variance contribution rates were 31.86%, 18.71%, and 17.64%, respectively, and the cumulative contribution rate was 68.21%. This largely explains the pollution source of PTEs in the soil. Concerning the lead–zinc mine areas in this study (such as Huize and Luoping), Cd mostly existed in symbiosis with Pb and Zn minerals, which was also shown by Pearson correlation (Table 4). Therefore, it was judged that FK1 is a mining activity that contributed as the 90, 93, and 83% of the main sources for the three elements Cd, Pb, and Zn, respectively. FK3, the parent material of soil formation (in the high geological background), explained 15 and 86% of the Cd and Cu sources, respectively.

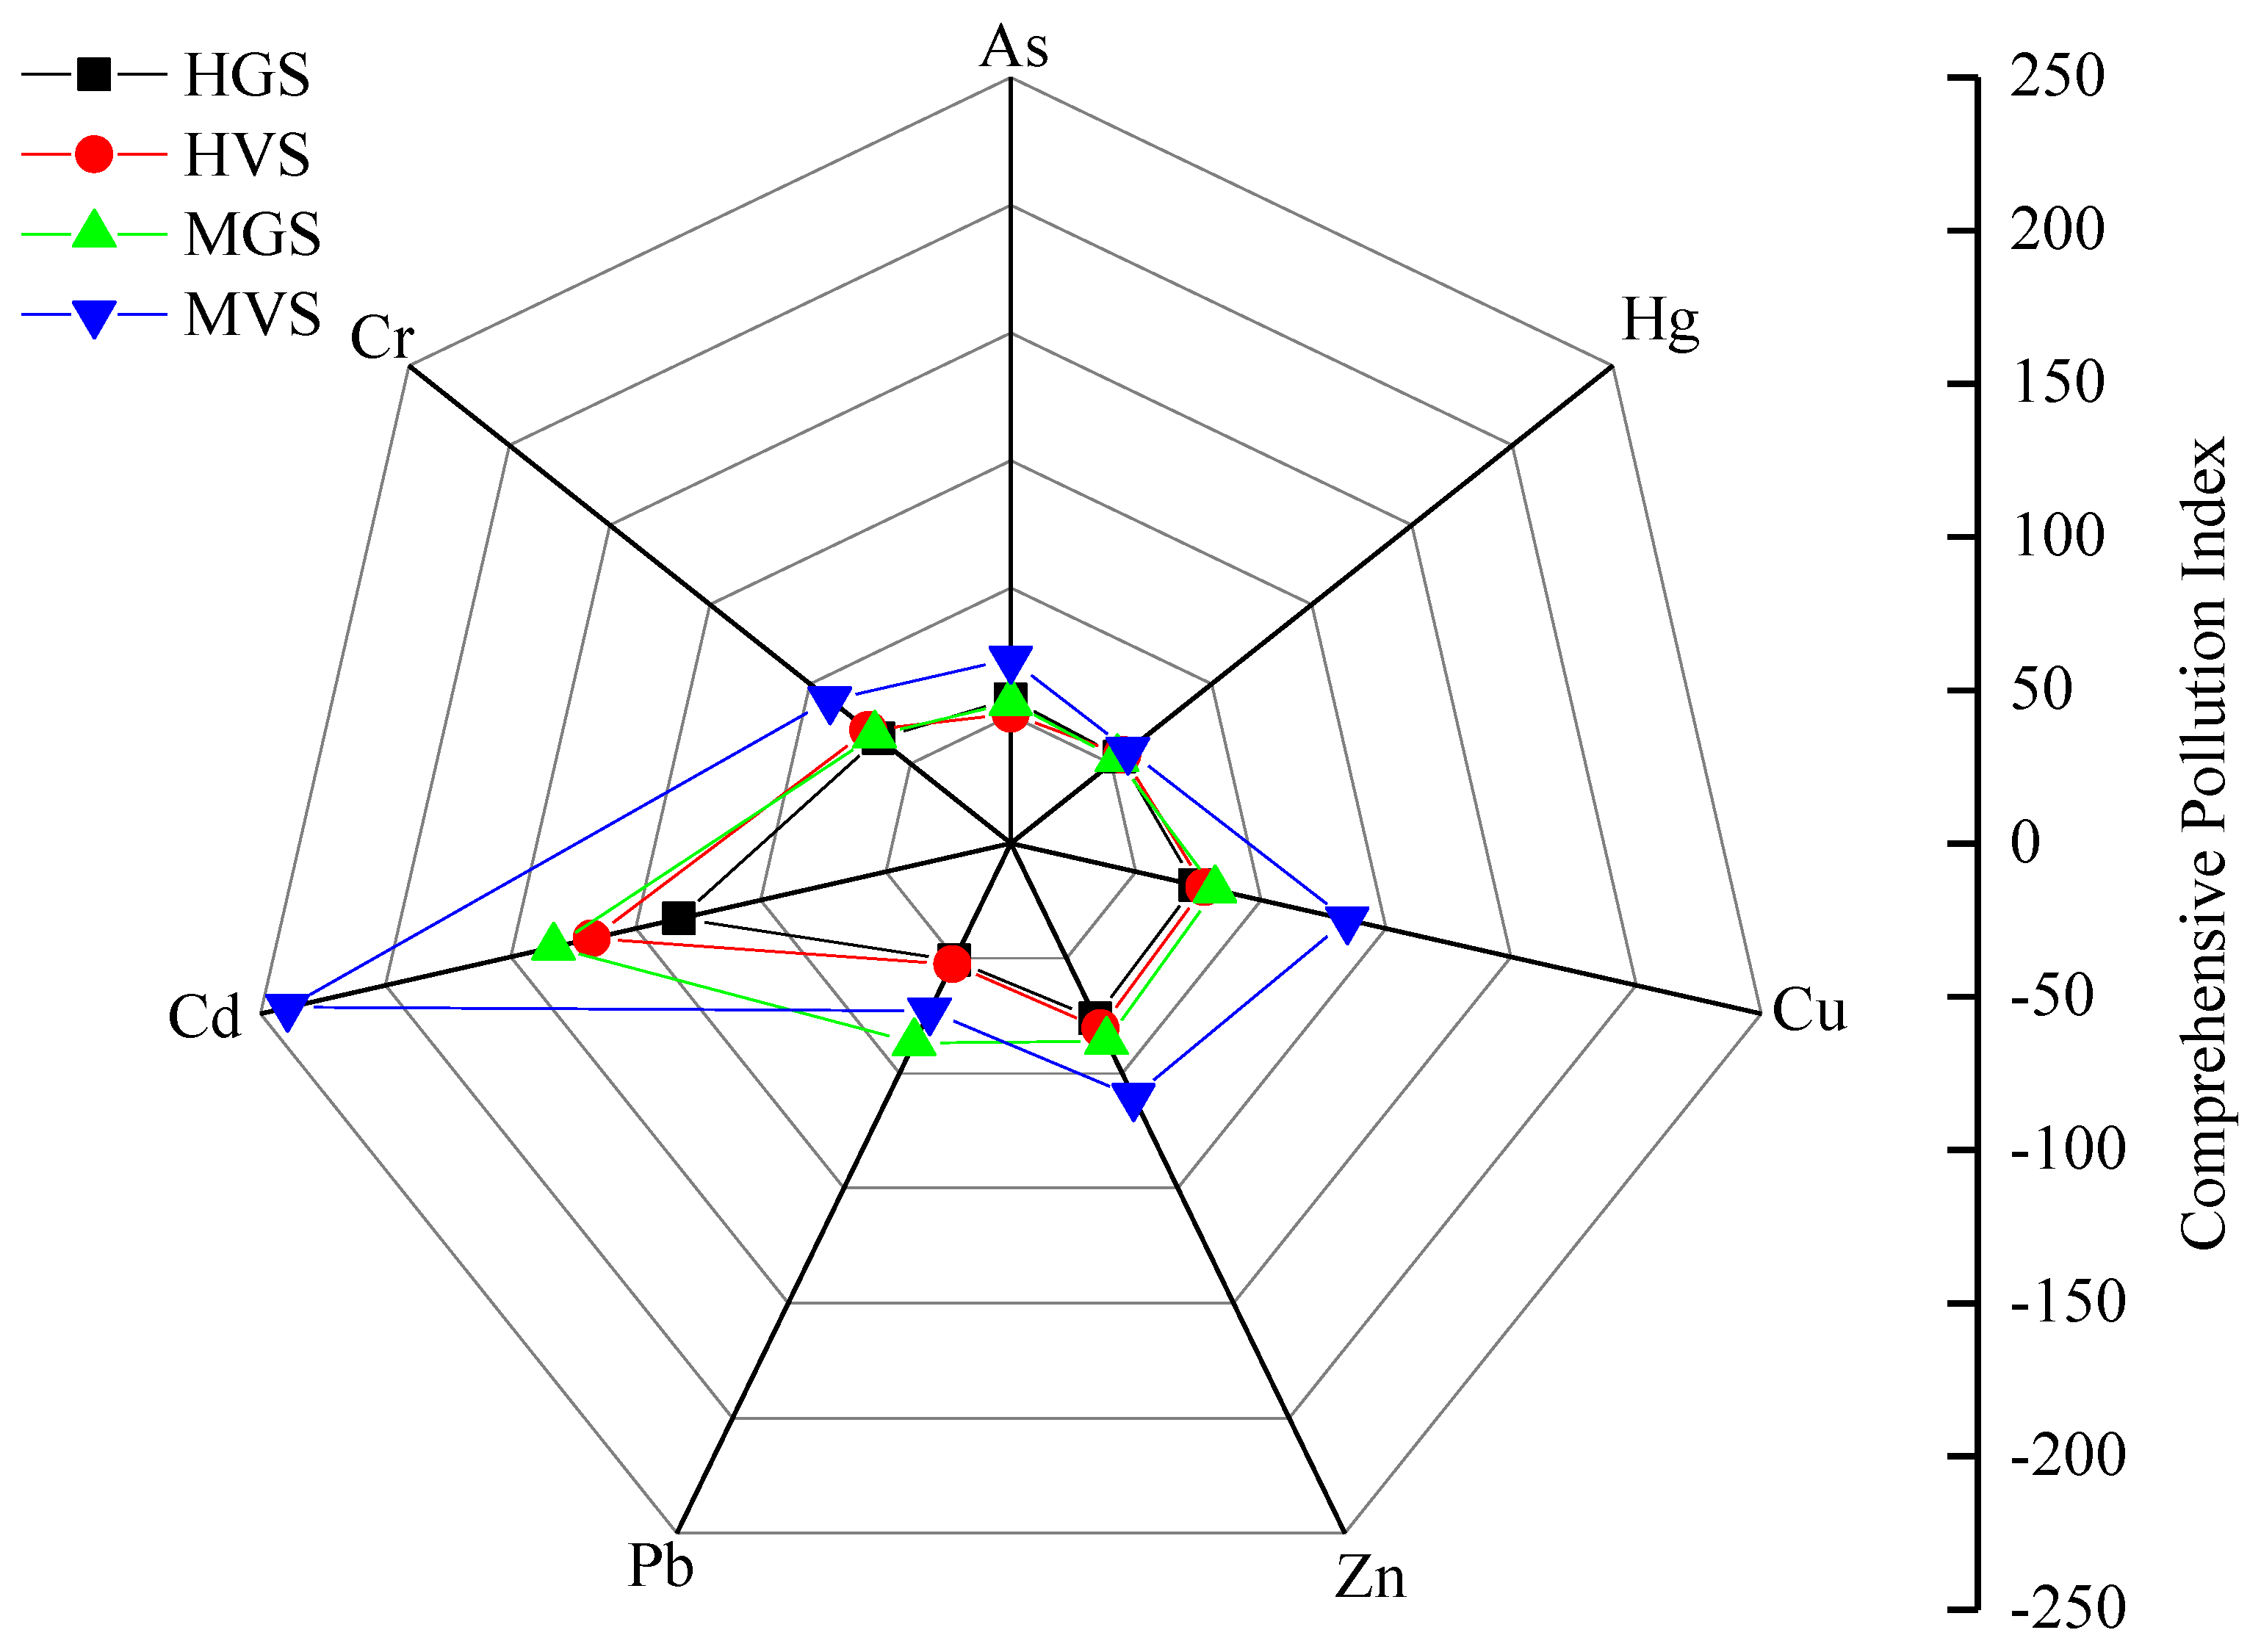
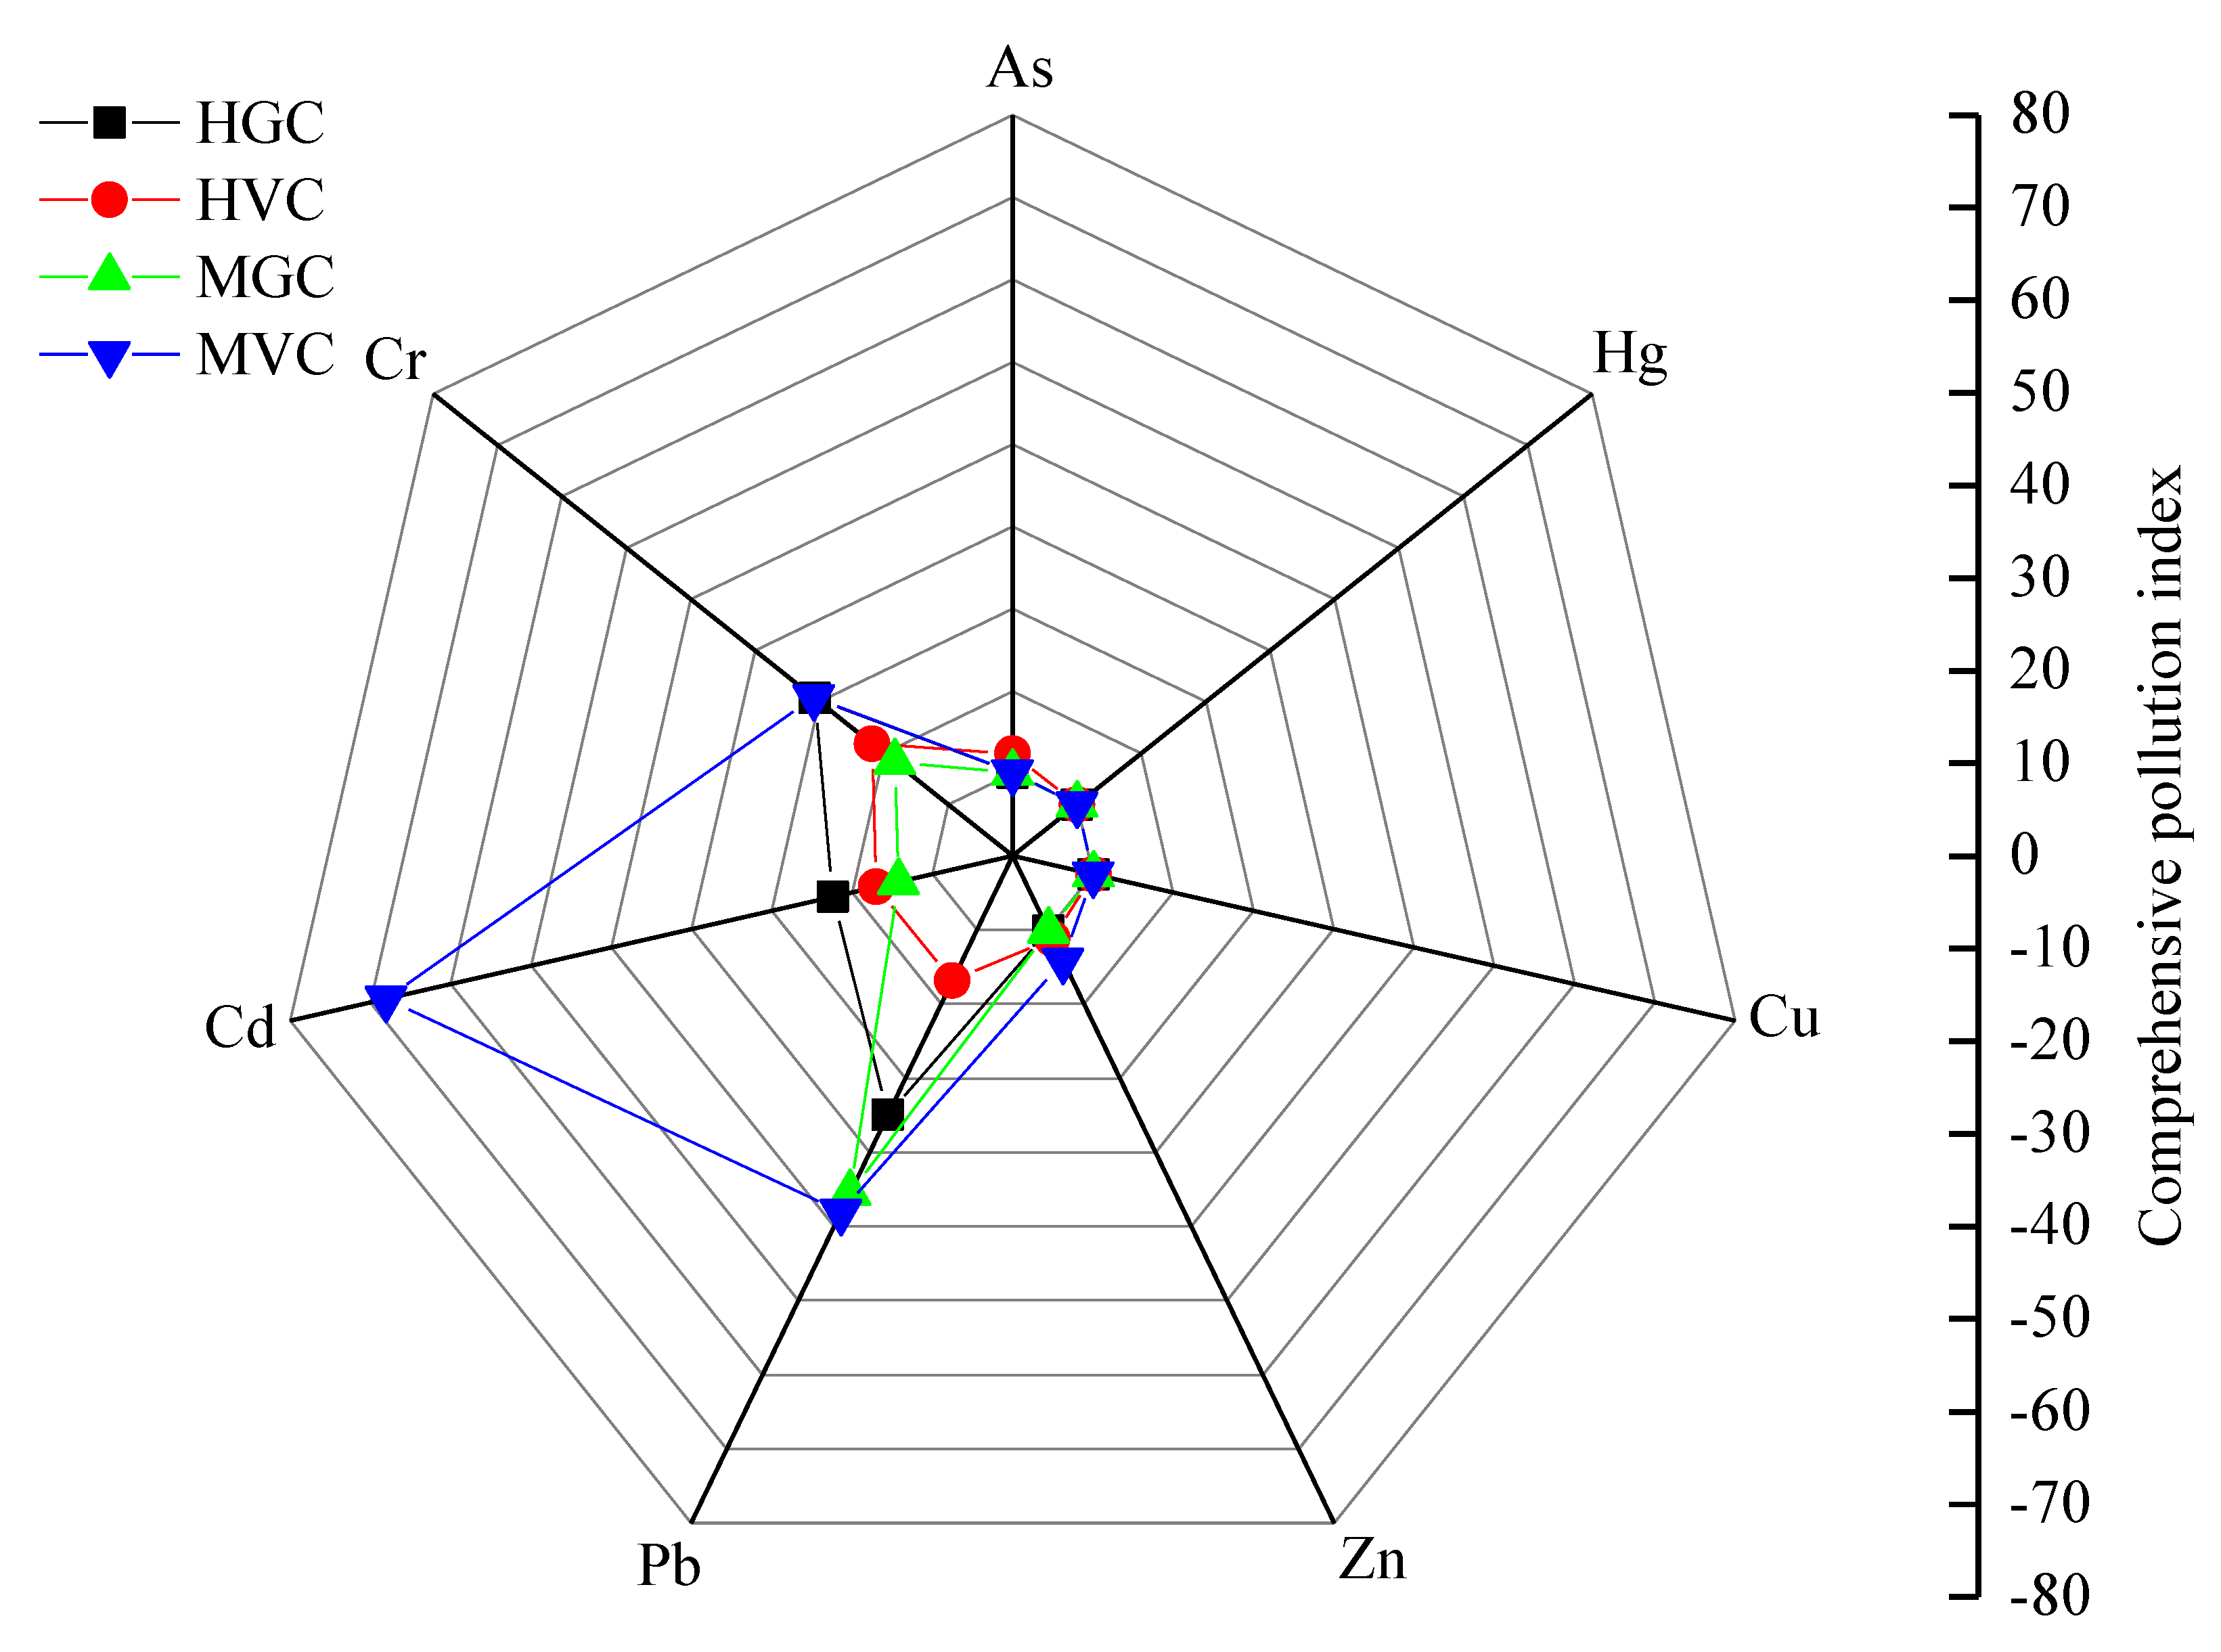
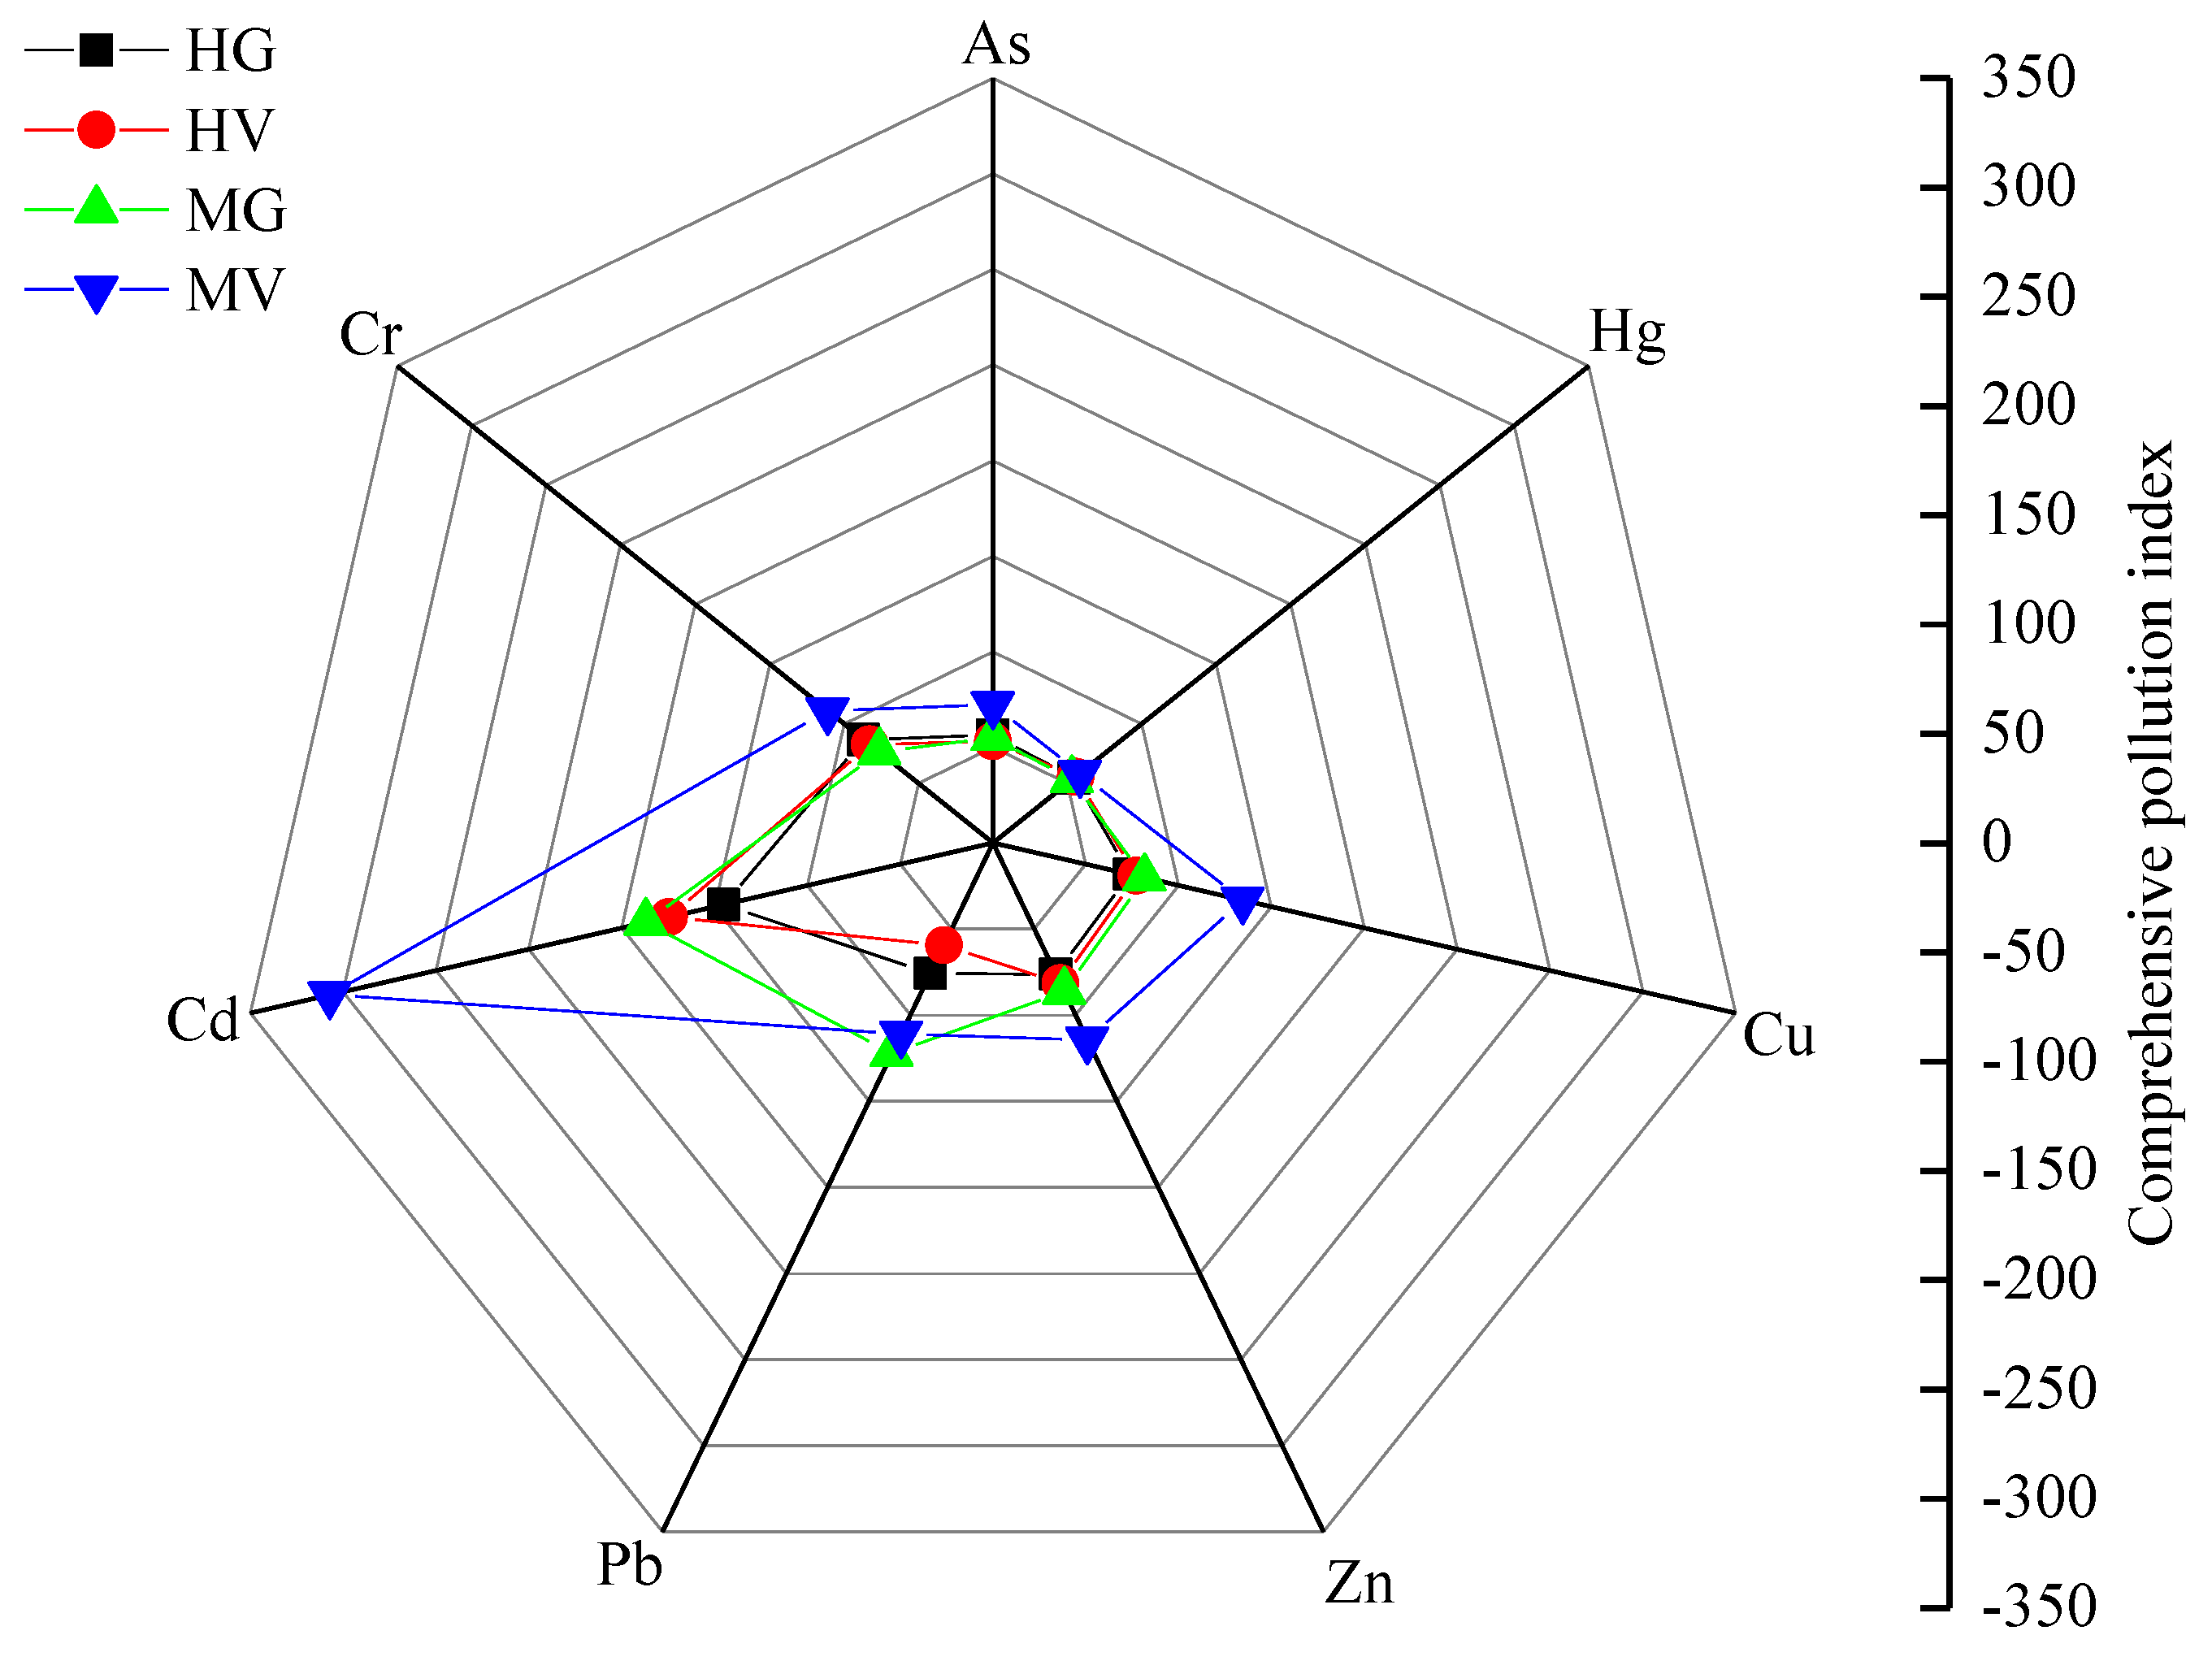
3.3. Soil-Crop System Comprehensive Quality Risk Assessment under Two Types of Pollution

The 104 crop samples, including corn, wheat, cabbage, lettuce, leeks, spinach, potato, radish, and pepper, were collected in the study area. The edible parts of the crop samples in different pollution systems showed distinct accumulation trends for the seven PTEs (Table 5). The arithmetic average concentrations (mg·kg−1) of the PTEs showed a trend of Zn (12.56) > Cu (2.71) > Cr (0.42) > Pb (0.14) > Cd (0.04) > As (0.04) > Hg (0.00) for the cereals in the high geological background area; Zn (12.12) > Cu (2.62) > Cr (1.08) > As (0.16) > Pb (0.12) > Cd (0.07) > Hg (0.00). Based on the food permissible limit (GB 2762–2017), the Pb, Cd, and Cr elements in cereals, edible parts exceeded the permissible limit by 38.7, 9.7, and 25.8%; in vegetables, edible parts exceeded the permissible limit by 37.9, 20.7, and 48.3%, respectively. While the PTEs average concentrations (mg·kg−1) in the superimposed area of the high geological back-ground and mining activities showed a trend of Zn (13.45) > Cu (2.78) > Pb (1.24) > Cr (0.44) > As (0.04) ≈ Cd (0.04) > Hg (0.00) for the cereals; Zn (16.42) > Cu (2.82) > Cr (0.65) > Pb (0.54) > Cd (0.20) > As (0.10) > Hg (0.00) for the vegetables. Based on the food permissible limit (GB 2762–2017), the Pb, Cd, and Cr elements in cereals, edible parts exceeded the permissible limit by 83.3, 8.3, and 16.7%; in vegetables, edible parts exceeded the permissible limit by 57.6, 57.6, and 36.4%, respectively. Taken together, the concentrations and excessive rates of PTEs in the edible parts of crops in the two pollution systems showed that vegetable crops were significantly higher than those of cereal crops, especially for the three elements of Pb, Cd, and Cr.
The comprehensive quality index method was used to evaluate the cumulative risk of seven PTEs under the test two pollution conditions using two main crop types (cereals, vegetables) as the soil-crop system. The evaluation results were classified according to the main crop types (cereals, vegetables). Cereal crops mainly included corn and wheat, while cabbage, pepper, leeks, lettuce, radishes, potatoes, and spinach were the main vegetable crops. In the high background area, the comprehensive soil quality evaluation (Figure 2) showed that the cereal soil Hg comprehensive quality index (IICQ) reached 4.37, suggesting severe Hg contamination. On the contrary, Pb IICQ < 1.0 indicated insignificant Pb contamination. All other PTEs (IICQ > 5.0) suggest extreme contamination risk. The Cd IICQ was the highest, indicating the most severe pollution risk. Likewise, vegetable soil Pb IICQ was 2.49, suggesting moderate contamination, while As IICQ < 1.0 was within the safe range. All other PTEs (IICQ > 5.0) suggested a severe contamination risk. Cd IICQ was the highest, indicating severe pollution risk. In the superimposed area, cereal soil Hg IICQ reached 3.11, indicating heavy contamination. The other PTEs (IICQ > 5.0) were at risk of extreme contamination. Again, Cd IICQ was the highest, indicating the most serious pollution risk in the cereal soil samples. The vegetable soil IICQ of all 7 PTEs exceeded 5.0 indicating the extreme risk of contamination.
The comprehensive quality evaluation of crops (Figure 3) showed that only Pb, Cd, and Cr IICQ of cereal crops exceeded 5.0 in the high background area, reaching the extremely contaminated level. Among the tested PTEs, Pb was the most serious continuation, while As, Hg, Cu, and Zn (IICQ < 1.0) were within the safe level. Likewise, vegetable crops’ IICQ of Pb, Cd, and Cr exceeded 5.0, reaching the extremely contaminated level. Among the PTEs, Cr was at the most serious risk, followed by As and then Zn. Hg and Cu were within the safe range. However, in the superimposed area, cereal crops’ IICQ of Pb and Cr exceeded 5.0, suggesting extreme contamination, with Pb contamination being the most serious concern. The Cd IICQ was at a heavily contaminated level, while the other PTEs were within the safe range. Likewise, vegetable crops’ IICQ of As, Hg, Cu, Zn, Pb, Cd, and Cr exceeded 5.0, reaching the extremely contaminated level.
The soil-crop system quality index evaluation (Figure 4) showed that in the high background area, only Hg (IICQ 4.38) was at the heavily contaminated level, while all other PTEs (IICQ < 5.0) were at the extremely contaminated level. In the soil-vegetable system, As (IICQ 3.13) was at the heavily contaminated level, while all the other PTEs (IICQ > 5.0) were at the extremely contaminated level. However, in the superimposed area soil-grain system, Hg (IICQ 3.12) was at the heavily contaminated level, while the rest of the PTEs (IICQ > 5.0) were at the extremely contaminated level. The IICQ (> 5.0) of As, Hg, Cu, Zn, Pb, Cd, and Cr of the soil-vegetable system suggested the extreme risk of contamination, with Cd being the most serious.
Overall, the comprehensive pollution risk in the superimposition area was much higher than in the high background area. Moreover, the comprehensive pollution risk of the soil-vegetable system was generally higher than the soil-grain system. Among all the PTEs, Cd was at extreme risk of contamination in all systems.

3.4. Farmland Cd Bioavailability Relationship Model under Two Different Pollution Types

According to the comprehensive quality index evaluation, Cd was the most serious contamination in the soil-crop systems of both test pollution types. As shown in Table 6, the Cd bioavailability models in the soil-crop system under different pollution types were different. As per the Cd bioavailability model of the soil-cereal system under high geological background pollution, when pH is the only variable, R2 was 0.544 (p < 0.05), indicating that pH controls 55.1% of its variation. Once SOM was introduced as the second variable, R2 changed to 0.565 (p < 0.05), indicating that pH and SOM could control 56.5% of the model variation. Moreover, the SOM contribution rate to the model accuracy was 1.4%. When all the three factors, pH, SOM, and Cavail/Ctotal were introduced, the coefficient of determination R2 of the model reached 0.575 (p < 0.05), signifying the 57.5% variation of the bio-coefficient of cereal crops, and the contribution rate of Cavail/Ctotal to the model reached 1.0%. It indicated a significant correlation (p < 0.05) between the three-factor model, established by pH, SOM, and Cavail/Ctotal, and the Cd bioconcentration coefficient, explaining most of the causes of variation in the enrichment coefficient of cereal crops in the high background area. Meanwhile, in the bioavailability model of Cd in the soil-vegetable system with high background pollution, the three factors pH, SOM, and Cavail/Ctotal contributed 47.1% (p < 0.01), 6.8% (p < 0.01), and 7.4% (p < 0.01), respectively. It indicated a significant correlation between the Cd bioavailability model and the bioavailability of Cd, explaining 61.3% of the causes of variation in the enrichment coefficient of vegetable crops in the high background area. However, under the superimposed area, regardless of cereal or vegetable crops, the three factors pH, SOM, and Cavail/Ctotal did not show a correlation with the contribution rate of the model.
In summary, under high background conditions, Cd accumulation by crops (including grains and vegetables) exhibited a significant linear relationship with soil pH, SOM, and Cavail/Ctotal. On the contrary, under superimposed conditions, there was no significant linear correlation between Cd enrichment and soil properties.

4. Discussion

The PTEs pollution in agricultural soil is an important factor affecting the quality and safety of agricultural products and the ecological sustainability of cereal and vegetable soil. Currently, a large number of studies have shown that the large-scale use of livestock and poultry manure, excessive application of chemical fertilizers (especially phosphate fertilizers and high-phosphorus compound fertilizers), and pesticides are one of the important sources of PTEs in farmland soil [7,36,37,38]. However, mining activities and high geological background are another two primary causes of soil PTEs contamination in farmland. Especially with the acceleration of industrialization and urbanization in my country and the shortage of cultivated land and the decline in quality worldwide, the impact of mining activities and a high geological background on the safety of farmland soil and crops (edible parts) has attracted more and more attention. Investigating these can reasonably help the restoration and allow safe use of soil resources with different degrees of PTEs accumulation, such as farmland soil. Southwest China, which is rich in metal mineral resources, has a dense mining activities. Moreover, it is a typical high geological background region. Yunnan, once known as the “kingdom of non-ferrous metals”, has now exceeded the soil safety standard for Cd, Pb, Zn, Cu, and other PTEs [39]. Especially in recent years, frequent metal mining has further aggravated the problem [40,41,42]. The waste liquid and residues get leaked into the surrounding farmland soil environment through rainwater. Meanwhile, mining activities also increase atmospheric deposition. Here, we show that the cumulative concentration of As, Hg, Cu, Zn, Pb, Cd, and Cr in the superimposed area was significantly higher, reaching 2.48, 1.83, 1.98, 1.65, 5.06, 3.96, and 1.30 times the typical high background area. Based on the GB15618–2018 standard, the excess rate of seven PTEs in the farmland soil of the superimposed area showed a sharp increasing trend. Especially, the soil Pb accumulation rate is the fastest; the cumulative over-standard rate of soil Cd is the highest (up to 100%), and the over-standard rate of other PTEs exceeds 20%, except Hg. This phenomenon is consistent with the fact that most previous studies mainly focused on the mining activity areas [39,43,44,45,46], ignoring high background areas. Moreover, we found that mining activity seriously impacts the PTEs cliff-style accumulation in the surrounding farmland soil. More importantly, PTE accumulation is often accompanied by other elements, such as lead-zinc mines are often associated with Cd accumulation, and lead–zinc ores are often associated with Cd and Cu accumulation. Likewise, a large release of Pb and Zn during the mining process is often accompanied by Cd and Cu increase in the surrounding soil. This is the potential factor that aggravated the pollution of Cd and Cu in the superimposed area, specifically, Huize and Luoping counties under study here are lead-zinc mine areas.
Soil quality ensures ecosystem productivity and promotes animals’ and humans’ health [47]. Notably, in China, a substantial area of ≈ 460 million hm2 is under soil quality degradation, accounting for 25% of the global soil quality degradation area [48]. PTEs accumulation is an important factor in soil quality degradation. In 2014, the National Survey Bulletin on Soil Pollution showed that the total excess rate of soil pollution reached 16.1%, and more than 12 million tons of PTEs contaminate food every year in China. Soil pollution has become a great threat to food safety and human health. Moreover, PTEs pollution have reduced grain production by > 10 million tons, causing an economic loss of at least 20 billion yuan [49]. Therefore, it is imperative to carry out a risk assessment on farmland soils with different pollution systems. In the past, PTEs risk assessment mostly involved the single-factor pollution index method [50], Nemerow’s comprehensive pollution index method [51,52], the geo-accumulated pollution index method [53], and the potential ecological risk index method [54]. All these methods determine the cumulative pollution risk of PTEs in sediments or soils. In farmland soil, apart from the cumulative pollution risk of PTEs in the soil, the cumulative pollution risk of agricultural products (especially edible parts) is also an important factor. Certainly, safe agricultural products are the ultimate product of safe soil. The comprehensive quality index method used in this study eliminates the defects of the traditional “soil standard management method” considering “soil environmental background value”, “regional pollution critical value” and “heavy metal ions impulse-valence effect “, “Crop heavy metal element limit value”, “Crop heavy metal element cumulative concentration” and other assessment contents. These criteria are more objective for evaluating the cumulative pollution risk of PTEs in farmland soil, especially for the farmland with “high background and low risk”, which is a naturally high geological background derived from the soil’s parent material. In this study, the comprehensive analysis of the farmland soil-crop system in eastern Yunnan revealed that the comprehensive pollution index of the typical high geological background area is significantly lower than the mining pollution superimposed area. It suggests that mining activity forces a greater risk of PTEs pollution in the soilcrop system, while the cumulative PTEs pollution risk from the high geological background is lower. It can be preliminarily speculated that safe usage of PTE-contaminated farmland soil in high geological background areas can be concomitantly rehabilitated during use, while the mining activity area needs prior rehabilitation.
The high geological background is the main cause of the high soil PTEs pollution in southwestern China [55]. Previous studies showed that most of this region presents a state of “high background, low activity” [56], while the farmland soils in many areas are simultaneously affected by the dual effects of high geological background and mining activity, including the area involved in this research [57]. This study shows that the crop enrichment coefficient for PTEs and the physical and chemical properties of soil (pH, organic matter, and soil effective state content) exhibited a significant correlation (p < 0.01) during mathematical modeling of the high geological background conditions. This suggests that the PTEs bioavailability is directly related to long-term soil formation and development conditions, such as the physical and chemical properties of the soil under high geological background areas. However, under the superimposed conditions including both mining activity and a high geological background, the degree of PTEs pollution from mining activity is largely beyond the high geological background, which makes it impossible to establish a correlation model between the PTEs bioavailability and the physical and chemical properties of the soil. This reinstates the fact that PTEs accumulation in farmland soil in a high geological background can be used safely by adjusting the physical and chemical properties of the soil. However, in dense mining areas, it is a prerequisite to reduce the introduction of heavy metals into farmland soil by man-made mining activities, such as mining wastewater irrigation and mining waste residue away from farmland before any agricultural activity.

5. Conclusions

In summary, we show that the seven PTEs accumulation point over-standard rate in the superimposed farmland soil area, including both high geological background and mining activities, is significantly higher than the typical high geological background. Especially, the accumulation of Pb, Cd, Cu, and Zn was highly related to frequent man-made mining activities (such as lead and zinc mines and phosphate mines). Moreover, the soil-crop comprehensive quality index revealed that pollution risk was much more severe in the superimposed area than in typical high background areas, especially in agricultural crops such as vegetables. Furthermore, under the two pollution types, using Cd as the soil-crop characteristic element, we established a heavy metal bioavailability relationship model. Only in the crops (cereals, vegetables) of the high geological background area did the Cd bio-concentration factor show a significant relationship with soil physical and chemical properties. This suggests that such farmland areas can be restored and used simultaneously by adjusting the soil’s physical and chemical properties, while the mining activity area needs to be first restored for safety by removing all pollution sources and then used.

Author Contributions

Conceptualization, W.L. and N.Z.; Data curation, W.L., J.L., Y.W., L.R., and L.B.; Formal analysis, W.L. and J.L.; Funding acquisition, N.Z.; Investigation, W.L. and L.R.; Methodology, W.L., J.L., and Y.W.; Project administration, N.Z. and L.B.; Resources, N.Z. and L.B.; Visualization, Y.W.; Writing-original draft, W.L.; Writing-review and editing, J.L. and N.Z. All authors have read and agreed to the published version of the manuscript.

Funding

This research was funded by Suzhou University Doctoral Foundation Project (grant number 2021BSK047) and the Joint Fund Project of Yunnan Province in the National Natural Science Foundation of China (grant number U2002210).

Institutional Review Board Statement

Not applicable.

Informed Consent Statement

Not applicable.

Data Availability Statement

Not applicable.

Acknowledgments

We acknowledge the scientific research team of Soil Fertilizer and Pollution Remediation Engineering Laboratory of Yunnan Province and the Innovation team of Soil Resources Utilization and Protection of Yunnan Province for their strong support for the relevant work of this paper.

Conflicts of Interest

The authors declare no conflict of interest.

References

  1. Zeng, Y.; Liu, J.; Li, Y.; Wang, Q.; Liu, Z.; Zeng, J. Accumulation and health implications of metals in topsoil of an urban riparian zone adjacent to different functional areas in a subtropical city. J. Environ. Qual. 2021, 50, 744–755. [Google Scholar] [CrossRef] [PubMed]
  2. Chen, H.; Teng, Y.; Lu, S.; Wang, Y.; Wang, J. Contamination features and health risk of soil heavy metals in China. Sci. Total Environ. 2015, 512, 143–153. [Google Scholar] [CrossRef] [PubMed]
  3. Yang, Q.; Li, Z.; Lu, X.; Duan, Q.; Huang, L.; Bi, J. A review of soil heavy metal pollution from industrial and agricultural regions in China: Pollution and risk assessment. Sci. Total Environ. 2018, 642, 690–700. [Google Scholar] [CrossRef] [PubMed]
  4. Joseph, T.; Dubey, E.A. Human health risk assessment from arsenic exposures in Bangladesh. Sci. Total Environ. 2015, 527, 552–560. [Google Scholar] [CrossRef]
  5. Li, X.; Lu, A.; Wang, J.; Ma, Z.; Pan, L.; Feng, X.; Luan, Y. Accumulation status, sources and phytoavailability of metals in greenhouse vegetable production systems in Beijing, China. Ecotoxicol. Environ. Saf. 2015, 122, 214–220. [Google Scholar]
  6. Chen, S.; Wang, M.; Li, S.; Zheng, H.; Lei, X.; Sun, X.; Wang, L. Current status of and discussion on farmland heavy metal pollution prevention in China. Earth Sci. Front. 2019, 26, 35–41. [Google Scholar] [CrossRef]
  7. Yang, X.; Yu, Y.; Li, H.; Hu, Y.; Zhang, C. Comparison of heavy metal limits for chemical fertilizers in China, EU and US and enlightenments. J. Plant Nutr. Fertil. 2019, 25, 149–156. [Google Scholar]
  8. Feng, Z.; Liu, H.; Wang, X. Toxic substances contents in fertilizers and its environmental risk assessment in China. Soil Fertil. Sci. China 2009, 4, 44–47. [Google Scholar]
  9. Huang, Q.; Liu, X.; Zhang, Q.; Qiao, Y.; Li, H. Application of ICP-MS and AFS to detect heavy metals in phosphorus fertilizers. Spectrosc. Spectr. Anal. 2014, 5, 1403–1406. [Google Scholar]
  10. Yu, Y.; Zhu, L.; Guo, T.; Huang, Q.; Li, H. Risk assessment of cadmium and arsenic in phosphate fertilizer. J. Agro-Environ. Sci. 2018, 37, 1326–1331. [Google Scholar]
  11. Wang, R.; Wei, Y. Pollution and control of tetracyclines and heavy metals residues in animal manure. J. Agro-Environ. Sci. 2013, 32, 1705–1719. [Google Scholar]
  12. Osorio-Martinez, J.; Silva, L.F.O.; Flores, E.M.M.; Nascimento, M.S.; Picoloto, R.S.; Olivero-Verbel, J. Environmental and human health risks associated with exposure to hazardous elements present in urban dust from Barranquilla, Colombian Caribbean. J. Environ. Qual. 2021, 50, 350–363. [Google Scholar] [CrossRef] [PubMed]
  13. Xu, C.; Zheng, G.; Lin, Y. Brief introduction to research projects on prevention and control cadmium and arsenic pollution in croplands supported by National Key R&D Program of China in 13th Five-Year Period. J. Agro-Environ. Sci. 2018, 37, 1321–1325. [Google Scholar]
  14. Chorover, J.; Brusseau, M.L. Kinetics of Sorption Desorption. In Kinetics of Water-Rock Interaction; Springer: New York, NY, USA, 2008. [Google Scholar]
  15. Luo, Y.; Teng, Y. Regional difference in soil pollution and strategy of soil zonal governance and remediation in China. Bull. Chin. Acad. Sci. 2018, 33, 145–152. [Google Scholar]
  16. Xie, T.; Guo, J.; Chen, Y.; Li, Y.; Wang, G. Spatial variability and health risk assessment of heavy metals in soils and crops around the mining area in Fujian Province, China. J. Agro-Environ. Sci. 2019, 38, 544–554. [Google Scholar]
  17. Wang, G.; Xin, Q.; Ma, L.; Wang, Y.; Yao, W.; Zhu, X.; Ren, F. Spatial pollution characteristics and magnetic response of surface soil heavy metals in Jinchuan copper-nickel mining area. China Environ. Science. 2021, 9, 4211–4220. [Google Scholar] [CrossRef]
  18. Wo, X.; Yang, L.; Cao, T.; Li, J. Accumulation and ecological risk of heavy metals in greenhouse soil under long-term fertilization. J. Agro-Environ. Sci. 2019, 38, 2319–2327. [Google Scholar]
  19. Rao, Z.; Huang, D.; Wu, J.; Zhu, Q.; Zhu, H.; Xu, C.; Xiong, J.; Wang, H.; Duan, M. Distribution and availability of cadmium in profile and aggregates of a paddy soil with 30-year fertilization and its impact on Cd accumulation in rice plant. Environ. Pollut. 2018, 239, 198–204. [Google Scholar] [CrossRef]
  20. Ugulu, L.; Khan Zafar, L.; Sheik, Z. Effect of wastewater irrigation as an alternative irrigation resource on heavy metal accumulation in ginger (Zingiber officinale Rosc.) and human health risk from consumption. Arab. J. Geosci. 2021, 14, 702. [Google Scholar] [CrossRef]
  21. Ahmad, K.; Wajid, K.; Khan, Z.I.; Ugulu, I.; Memoona, H.; Sana, M.; Nawaz, K.; Malik, I.S.; Bashir, H.; Sher, M. Evaluation of potential toxic metals accumulation in wheat irrigated with wastewater. Bull. Environ. Contam. Toxicol. 2019, 102, 822–828. [Google Scholar] [CrossRef]
  22. Li, C.; Wang, F.; Cao, W.; Pan, J.; Lv, J.; Wu, Q. Source analysis, spatial distribution and pollution assessment of heavy metals in sewage irrigation area farmland soils of Longkou city. Environ. Sci. 2017, 38, 1018–1027. [Google Scholar] [CrossRef]
  23. Li, W.; Huang, Z.; Zhang, G. Sources of the ore metals of the Huize ore field in Yunnan province: Constraints from Pb, S, C, H, O and Sr isotope geochemistry. Acta Petrol. Sin. 2006, 22, 2567–2580. [Google Scholar]
  24. Bao, S. Soil Agrochemical Analysis; China Agriculture Press: Beijing, China, 2000. [Google Scholar]
  25. Wang, Y.; Liu, C.; Zhou, D.; Chen, H. A new approach for evaluating soil heavy metal impact: A comprehensive index combined soil environmental quality and agricultural products quality. J. Agro-Environ. Sci. 2016, 35, 1225–1232. [Google Scholar] [CrossRef]
  26. Wilson, S.C.; Lockwood, P.V.; Ashley, P.M.; Tighe, M. The chemistry and behaviour of antimony in the soil environment with comparisons to arsenic: A critical review. Environ. Pollut. 2010, 158, 1169–1181. [Google Scholar] [CrossRef] [PubMed]
  27. CNMEE. Soil Environmental Quality—Risk Control Standard for Soil Contamination of Agricultural Land; In GB 15618-2018; Ministry of Ecology and Environment of China: Beijing, China, 2018.
  28. National Environmental Protection Agency. Background Value of Soil Environment in China; China Environmental Science Press: Beijing, China, 1990; pp. 94–144. [Google Scholar]
  29. CNMH. Maximum Levels of Contaminants in Foods; In GB 2762–2017; Ministry of Health of China: Beijing, China, 2017.
  30. Ministry of Health of the People’s Republic of China. GB13106-91 Hygienic Standard for Limits of Zinc in Foods; Ministry of Health of the People’s Republic of China: Beijing, China, 1991.
  31. Ministry of Health of the People’s Republic of China. GB15199-94 Hygienic Standard for Limits of Copper in Foods; Ministry of Health of the People’s Republic of China: Beijing, China, 1994.
  32. Luo, L.; Ma, Y.; Zhang, S.; Wei, D.; Zhu, Y. An inventory of trace element inputs to agricultural soils in China. J. Environ. Manag. 2009, 90, 2524–2530. [Google Scholar]
  33. Zhang, S.Q.; Zhang, F.D.; Liu, X.M.; Wang, Y.J.; Zou, S.W.; He, X.S. Determination and analysis on main harmful composition in excrement of scale livestock and poultry feedlots. Plant Nutr. Fertil. Sci. 2005, 11, 822–829. [Google Scholar]
  34. Wang, M.; Li, S.; Li, X.; Zhao, Z.; Chen, S. An overview of current status of copper pollution in soil and remediation efforts in China. Earth Sci. Front. 2018, 25, 305–313. [Google Scholar]
  35. Pang, S.; Li, Y.; Wang, Y.; Yu, H.; Guo, Q.; Chen, D. Spatial variability and influencing factors of the concentrations of Cu, Zn, and Cr in cropland soil on county scales. Sci. Agric. Sin. 2010, 43, 737–743. [Google Scholar] [CrossRef]
  36. Liang, L.; Li, J.; Yang, H.; Zhang, P.; Huang, W.; Wang, L. Soil heavy metal accumulation and risk assessment in a long-term vegetable-growing greenhouse. Environ. Chem. 2018, 37, 1515–1524. [Google Scholar] [CrossRef]
  37. Xia, W.; Zhang, L.; Liu, Z.; Zhang, W.; Lan, X.; Liu, X.; Liu, J.; Liu, G.; Li, Z.; Wang, P. Effects of long-term application of chemical fertilizers and organic fertilizers on heavy metals and their availability in reddish paddy soil. Environ. Sci. 2021, 42, 2469–2479. [Google Scholar]
  38. Zhang, Q.; Xiang, R.; Liu, Z.; Wan, Y.; Zhong, Z.; You, X.; Qi, Y. Content and morphology characteristics of heavy metals in phosphate fertilizers in Hunan province. Nonferrous Met. Sci. Eng. 2016, 5, 125–130. [Google Scholar]
  39. Zhang, J.; Qu, M.; Chen, J.; Yang, L.; Zhao, Y.; Huang, B. Assessing the effects of metal mining on soil heavy metal concentrations in southwest China based on meta-analysis. Environ. Science. 2021, 9, 4414–4421. [Google Scholar] [CrossRef]
  40. Zhang, X.W.; Yang, L.S.; Li, Y.H.; Li, H.R.; Wang, W.Y.; Ye, B.X. Impacts of lead-zinc mining and smelting on the environment and human health in China. Environ. Monit. Assess. 2012, 4, 2261–2273. [Google Scholar] [CrossRef] [PubMed]
  41. Wu, J.; Long, J.; Liu, L.; Li, J.; Liao, H.; Zhang, M.; Zhao, C.; Wu, Q. Risk assessment and source identification of toxic metals in the agricultural soil around a Pb-Zn mining and smelting area in Southwest China. Int. J. Environ. Res. Public Health 2018, 15, 1838. [Google Scholar] [CrossRef]
  42. Zhong, X.; Chen, Z.; Li, Y.; Ding, K.; Liu, W.; Liu, Y.; Yuan, Y.; Zhang, M.; Baker, A.J.M.; Yang, W.; et al. Factors influencing heavy metal availability and risk assessment of soils at typical metal mines in Eastern China. J. Hazard. Mater. 2020, 400, 123289. [Google Scholar] [CrossRef]
  43. Mao, Z.; Tian, K.; Liu, B.; Zhang, X.; Bian, Z.; Huang, B.; Yuan, X.; Wu, L.; Luo, D. Ecological risks of heavy metals and the relationship between sources and sinks in an abandoned mining area of Guangxi Zhuang Autonomous Region. J. Agro-Environ. Sci. 2021, 5, 987–998. [Google Scholar] [CrossRef]
  44. Lu, X.; Yu, K.; Sun, Q.; Sun, L.; Chen, C. Heavy metal content and health risk assessment of lotus roots around the Tongling mining area, China. J. Agro-Environ. Sci. 2019, 38, 2049–2056. [Google Scholar]
  45. Xia, F.; Wang, Q.; Cai, L.; Yang, C.; Feng, Z.; Tang, C.; Wei, Y.; Xu, Z. Contamination and health risk for heavy metals via consumption of vegetables grown in non-ferrous metals smelting area. Resour. Environ. Yangtze Basin 2017, 26, 865–873. [Google Scholar]
  46. Xu, D.; Zhou, P.; Zhan, J.; Gao, Y.; Sun, Q. Assessment of trace metal bioavailability in garden soils and health risks via consumption of vegetables in the vicinity of Tongling mining area, China. Ecotoxicol. Environ. Saf. 2013, 90, 103–111. [Google Scholar] [CrossRef]
  47. Zhao, Q.G.; He, J.Z.; Yan, X.Y.; Zhang, B.; Zhang, G.L.; Cai, Z.C. Progress in significant soil science fields of China over the last three decades: A review. Pedosphere 2011, 21, 1–10. [Google Scholar] [CrossRef]
  48. Zhao, Q.; Sun, B. Soil quality and sustainable environment I. The definition and evaluation method of soil quality. Soils 1997, 29, 113–120. [Google Scholar]
  49. Zhang, J.; Zhang, J.; Shen, J.; Tian, J.; Jin, K.; Zhang, F. Soil health and agriculture green development: Opportunities and challenges. Acta Pedol. Sin. 2020, 57, 783–796. [Google Scholar]
  50. Cheng, J.L.; Shi, Z.; Zhu, Y.W. Assessment and mapping of environmental quality in agricultural soils of Zhejiang Province, China. J. Environ. Sci. 2007, 19, 50–54. [Google Scholar] [CrossRef]
  51. Zhang, Y.; Han, J.; Tu, Q.; Yang, Y.; Xu, Y.; Shi, R. Accumulation characteristics and evaluation of heavy metals in suburban farmland soils of Tianjin. J. Ecol. Rural. Environ. 2019, 35, 1445–1452. [Google Scholar]
  52. Duan, K.; Zhao, B.; Zhang, S.; Ma, Y.; Zhao, B. Contamination characteristics, source analysis, and ecological risk assessment of toxic metals and metalloid in agricultural soil in Yuzhong, China. J. Environ. Qual. 2021, 50, 122–133. [Google Scholar] [CrossRef]
  53. Müller, G. Index of geoaccumulation in sediments of the Rhine River. GeoJournal 1969, 2, 108–118. [Google Scholar]
  54. Hakanson, L. An ecological risk index for aquatic pollution control-a sedimentological approach. Water Res. 1980, 14, 975–1000. [Google Scholar] [CrossRef]
  55. Yang, Y. Geochemistry of anomalous elements in environment of Guizhou. Guizhou Geol. 1999, 16, 66–72. [Google Scholar]
  56. Wu, Y.; Liu, C.; Tu, C. Speciation of heavy metals in urban soil at Guiyang. Acta Mineral. Sin. 2008, 28, 177–180. [Google Scholar] [CrossRef]
  57. Liu, J.; Li, Y.; Zhang, M.; Zhang, N.; Han, D. Health risk assessment and benchmark of lead pollution in agricultural soils in East Yunnan, China. Trans. Chin. Soc. Agric. Eng. 2021, 37, 241–250. [Google Scholar]
Figure 1. Distribution map of sampling sites.
Minerals 12 01134 g001
Figure 2. Soil comprehensive pollution index in different pollution types. Note: HGS represents the soil of the grain field in the high geological background area; HVS represents the soil of the vegetable field in the high geological background area; MGS represents the soil of the grain field in the superimposed area of the high geological background and mining activities; MVS represents the vegetable field soil in the area where the high geological background and mining activity overlap. The same as below.
Minerals 12 01134 g002
Figure 3. Crop comprehensive pollution index in different pollution types. Note: HGC represents the crop of the grain field in the high geological background area; HVC represents the crop of the vegetable field in the high geological background area; MGC represents the crop of the grain field in the superimposed area of the high geological background and mining activities; MVC represents the crop of the vegetable field in the area where the high geological background and mining activity overlap.
Minerals 12 01134 g003
Figure 4. Soil-crop systems comprehensive pollution index in different pollution types. Note: HG represents the soil-crop system of the grain field in the high geological background area; HV represents the soil-crop system of the vegetable field in the high geological background area; MG represents the soil-crop system of the grain field in the superimposed area of the high geological background and mining activities; MV represents the soil-crop system of the vegetable field in the area where the high geological background and mining activity overlap.
Minerals 12 01134 g004
Table 1. The soil-crop (edible part) collaborative samples collected from two distinct pollution systems.
Pollution SystemsAdministrative RegionSoil Sample NumberAgrotypesCrop SpeciesCrop ClassificationCrop Sample Number
High geological background areaLuliang County19Red soil (12), Cinnamon soil (7)corn (8)cereals (8)19
cabbage (3), lettuce (2), radish (2), leeks (1), pepper (1), spinach (2)vegetables (11)
Malong County12Red soil (5), Cinnamon soil (7)corn (6)cereals (6)12
cabbage (3), radish (1), pepper (1), leeks (1)vegetables (6)
Qilin District10Cinnamon soil (10)corn (4)cereals (4)10
cabbage (6)vegetables (6)
Fuyuan County10Red soil (10)wheat (7)cereals (7)10
radish (1), lettuce (2)vegetables (3)
Shizong County9Red soil (9)wheat (6)cereals (6)9
lettuce (3)vegetables (3)
Superimposed area of the high geological background and mining activitiesLuoping County10Red soil (8), Brown soil (2)wheat (1)cereals (1)10
cabbage (2), lettuce (7)vegetables (9)
Xuanwei City20Red soil (18), Brown soil (2)wheat (2)cereals (2)20
cabbage (4), lettuce (6), leeks (4), spinach (4)vegetables (18)
Huize County14Red soil (14)corn (9)cereals (9)14
cabbage (3), potato (2)vegetables
Total/104///104
Note: The numbers in brackets represent the corresponding number of samples.
Table 2. Statistical values, background values, and standard limits of PTEs in soil (mg·kg−1).
Scheme 60.High Geological Background Area
(n = 60)
Superimposed Area of the High Geological Background and Mining Activities (n = 44)
AsHgCuZnPbCdCr AsHgCuZnPbCdCr
Minimum0.270.011.1410.652.680.086.29 1.230.0210.6231.683.350.3442.74
Maximum40.800.31286.53428.6072.565.76494.00 152.002.88292.50487.87889.9221.76511.17
Arithmetic mean7.960.1273.78169.3628.831.12122.06 19.780.22145.95279.56145.774.44158.73
Geometric mean5.620.0949.98136.9424.980.0785.15 10.910.14117.75235.3672.002.81136.52
Median4.950.1053.16144.0127.360.6189.98 9.800.16149.50283.9760.792.72129.05
standard
deviation
7.610.0858.7298.7613.911.36104.08 27.320.4074.77138.76205.924.40102.21
Coefficient of variation %95.6063.7279.5958.3148.26121.6085.27 138.09183.1051.2349.64141.2699.0064.39
China soil background value11.300.0722.6074.4026.500.1061.10 11.300.0722.6074.4026.500.1061.10
Yunnan soil background value16.040.0547.2093.7642.420.2476.32 16.040.0547.2093.7642.420.2476.32
Farmland Soil screening value302.41002501200.3200 302.41002501200.3200
Exceeding standard rate %3.700.0031.4818.520.0087.0418.89 18.372.0471.4359.1824.49100.0020.41
Table 3. Matrix analysis matrix of farmland soil heavy metals.
ElementsHigh Geological Background AreaSuperimposed Area of the High Geological Background and Mining Activities
FG1FG2FG3FG4FK1FK2FK3
As0.87−0.220.080.190.390.270.56
Hg−0.20−0.250.500.630.45−0.590.35
Cu0.680.480.12−0.160.160.160.86
Zn0.430.520.51−0.020.830.240.07
Pb0.170.19−0.170.830.93−0.19−0.07
Cd−0.090.90−0.000.100.900.010.15
Cr0.130.060.88−0.060.140.840.13
Initial eigenvalue2.071.291.071.012.261.311.21
Variance
contribution rate (%)
21.2620.7319.1216.5731.8618.7117.64
Cumulative
contribution rate (%)
77.6868.21
Note: The typical high background area adopted the orthogonal rotation method with Kaiser standardization, and the rotation converges after 12 iterations. The high geological background and mining activity overlap area adopted the orthogonal rotation method with Kaiser standardization, and the rotation converges after 4 iterations.
Table 4. Correlation analysis of coexistence of PTEs in farmland soil.
S-AsS-HgS-CuS-ZnS-PbS-CdS-Cr
S-As1NC0.36 **0.28 *NCNCNC
S-HgNC1NCNCNCNCNC
S-CuNCNC10.44 **NC0.31 *NC
S-ZnNCNCNC1NC0.34 *0.43 **
S-PbNCNCNC0.51 **1NCNC
S-CdNCNC0.28 *0.34 *0.74 **1NC
S-CrNCNCNCNCNCNC1
Note: 1. The light color part on the upper right of the table above represents “typical high geological background area”, and the dark part on the lower left represents “high geological background and mining activity pollution superimposed area”; 2. * in the table represents the 0.05 level (both sides) significantly correlated, ** means a significant correlation at the 0.01 level (two-sided).
Table 5. Concentration of PTEs in crops edible parts (mg·kg−1).
Pollution TypesCrop TypesCrop SpeciesNumberAsHgCuZnPbCdCr
High geological background areaCereals
(dry weight)
Corn180.00–0.060.00–0.000.08–4.542.91–15.360.00–0.610.00–0.200.02–0.44
Wheat130.04–0.100.00–0.000.40–8.006.71–41.310.05–0.290.01–0.200.30–2.25
Average310.04 ± 0.020.00 ± 0.002.71 ± 1.8912.56 ± 10.390.14 ± 0.160.04 ± 0.060.42 ± 0.52
Vegetables
(fresh weight)
Cabbage150.02–0.300.00–0.001.38–8.133.39–25.620.00–0.530.01–0.130.01–4.42
Lettuce40.07–0.710.00–0.001.01–3.255.76–23.700.05–0.260.03–0.160.32–4.65
Leeks20.17–0.430.00–0.001.91–2.181.98–13.050.08–0.360.17–0.210.99–1.77
Spinach20.04–0.170.00–0.000.58–3.526.03–22.380.06–0.210.02–0.070.36–1.27
Radish40.02–0.190.00–0.000.47–8.322.14–59.400.01–0.170.01–0.070.01–1.16
Pepper20.08–0.140.00–0.000.98–1.183.78–7.440.01–0.020.04–0.060.02–0.05
Average290.16 ± 0.180.00 ± 0.002.62 ± 1.9412.12 ± 10.330.12 ± 0.140.07 ± 0.061.08 ± 1.33
Superimposed area of the high geological background and mining activitiesCereals
(dry weight)
Corn90.01–0.080.00–0.001.09–4.317.64–25.550.03–3.130.00–0.070.04–2.42
Wheat30.05–0.120.00–0.000.21–2.327.92–19.860.04–0.500.03–0.150.16–1.08
Average120.04 ± 0.040.00 ± 0.002.78 ± 1.3513.45 ± 5.771.24 ± 1.130.04 ± 0.040.44 ± 0.72
Vegetables
(fresh weight)
Cabbage100.01–0.340.00–0.000.40–5.001.69–23.580.00–1.280.00–0.840.04–1.09
Lettuce120.01–0.240.00–0.000.44–8.365.65–43.920.08–4.950.04–0.320.12–1.38
Leeks40.01–0.210.00–0.001.55–8.096.20–52.740.05–0.230.04–0.230.04–1.19
Spinach40.03–0.180.00–0.000.58–2.151.63–19.000.02–0.310.02–0.490.07–2.96
Potato20.04–0.150.00–0.000.70–8.606.26–33.930.01–2.650.05–0.480.18–1.45
Average320.09 ± 0.090.00 ± 0.002.82 ± 2.4616.42 ± 13.560.54 ± 1.090.20 ± 0.20.65 ± 0.64
Table 6. Farmland Cd bioavailability model in soil-crop system under two different pollution types.
Region and Crop TypeMultiple Regression Equation ModelR2p
Cereal crop in high background arealgBCF = −0.738pH + 2.4500.544<0.05
lgBCF = −0.690pH + 0.152lgSOM + 1.5960.565<0.05
lgBCF = −0.687pH + 0.150lgSOM + 0.099lg(Cavail/Csoil) + 1.6850.575<0.05
Vegetable crop in high background arealgBCF = 0.686pH − 7.9360.471<0.05
lgBCF = 0.707pH − 0.262lgSOM − 6.7520.539<0.05
lgBCF = 0.577pH − 0.338lgSOM + 0.698lg(Cavail/Csoil) − 4.7210.613<0.05
Cereal crop in superimposed arealgBCF = 0.419pH − 4.9740.151
lgBCF = 0.429pH + 0.092lgSOM − 0.60290.158
lgBCF = 0.648pH + 0.078lgSOM + 0.420lg(Cavail/Csoil) − 7.2610.284
Vegetable crop in superimposed arealgBCF = 0.098pH − 2.2970.010
lgBCF = 0.509pH − 0.942lgSOM + 2.4530.729<0.05
lgBCF = 0.488pH − 0.990lgSOM − 0.116lg(Cavail/Csoil) + 2.8900.739
Publisher’s Note: MDPI stays neutral with regard to jurisdictional claims in published maps and institutional affiliations.

