
Safe and Efficient Recovery Technique of Horizontal Isolated Pillar under Loose Tailings Backfill; A Case Study in a Zinc-Lead Mine


Abstract
:1. Introduction
2. Engineering Background and Existing Problems
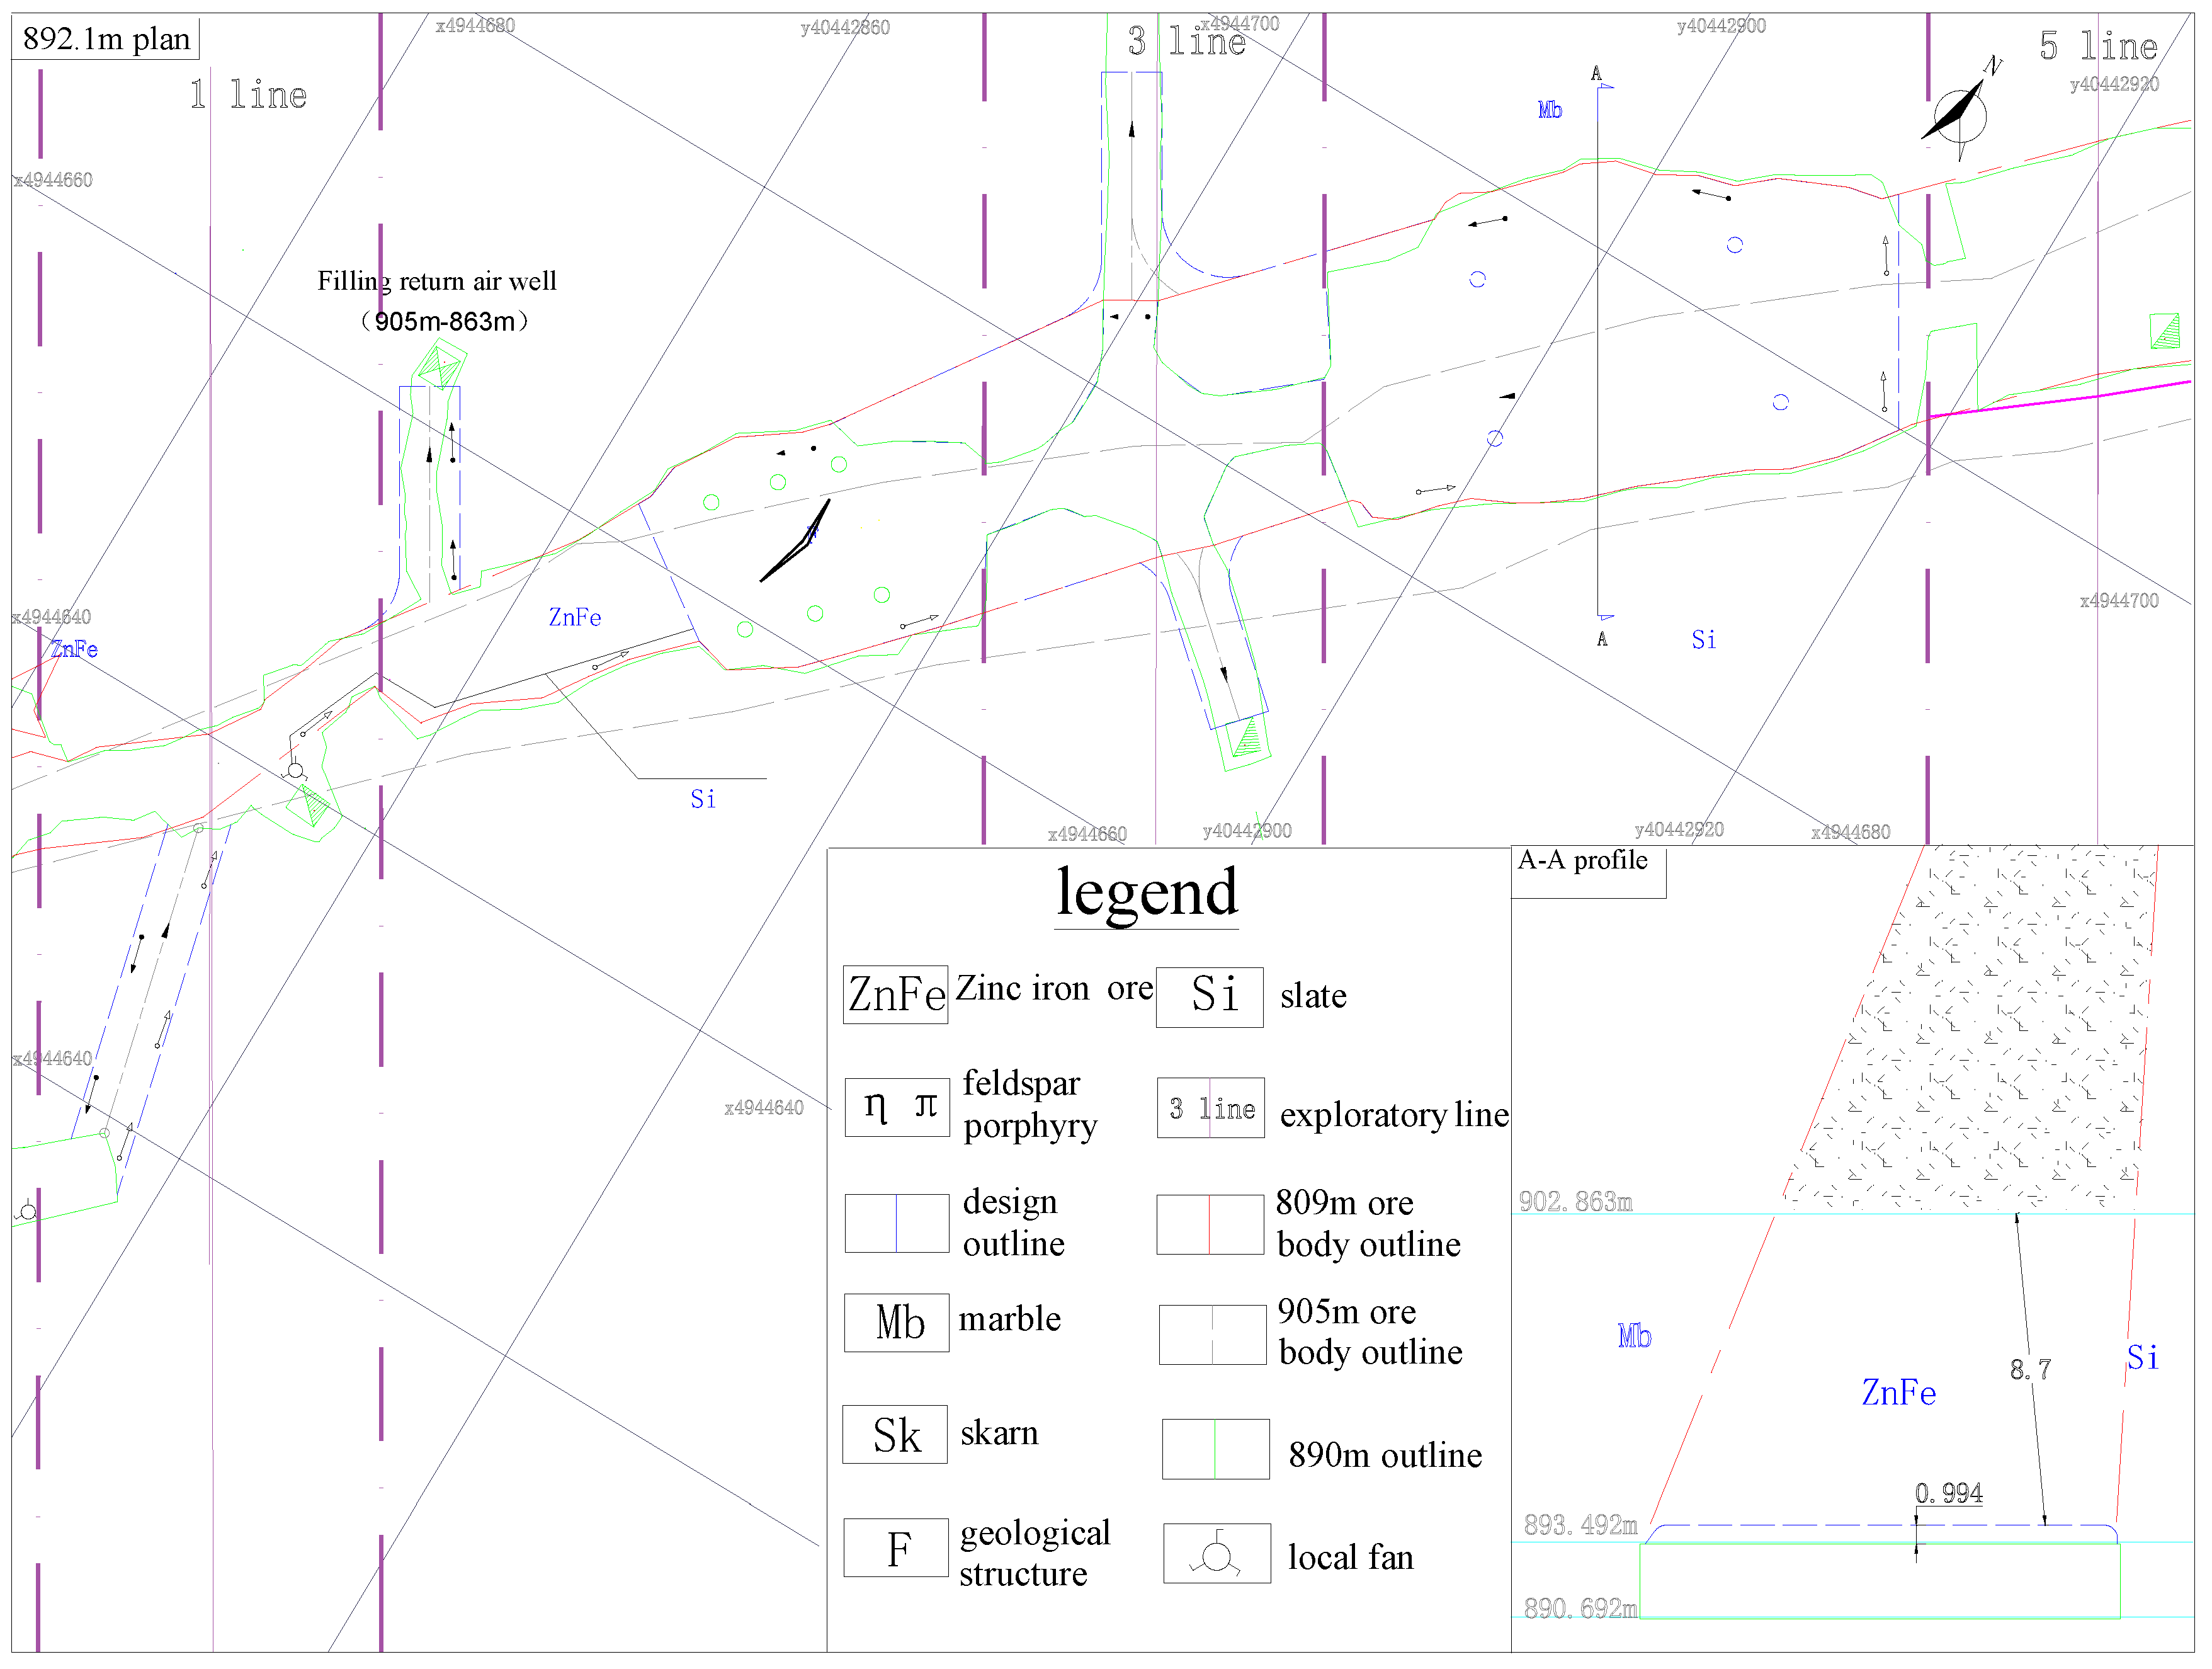
2.1. Basic Overview of the Mining Area
2.2. Existing Problems
2.3. Methods
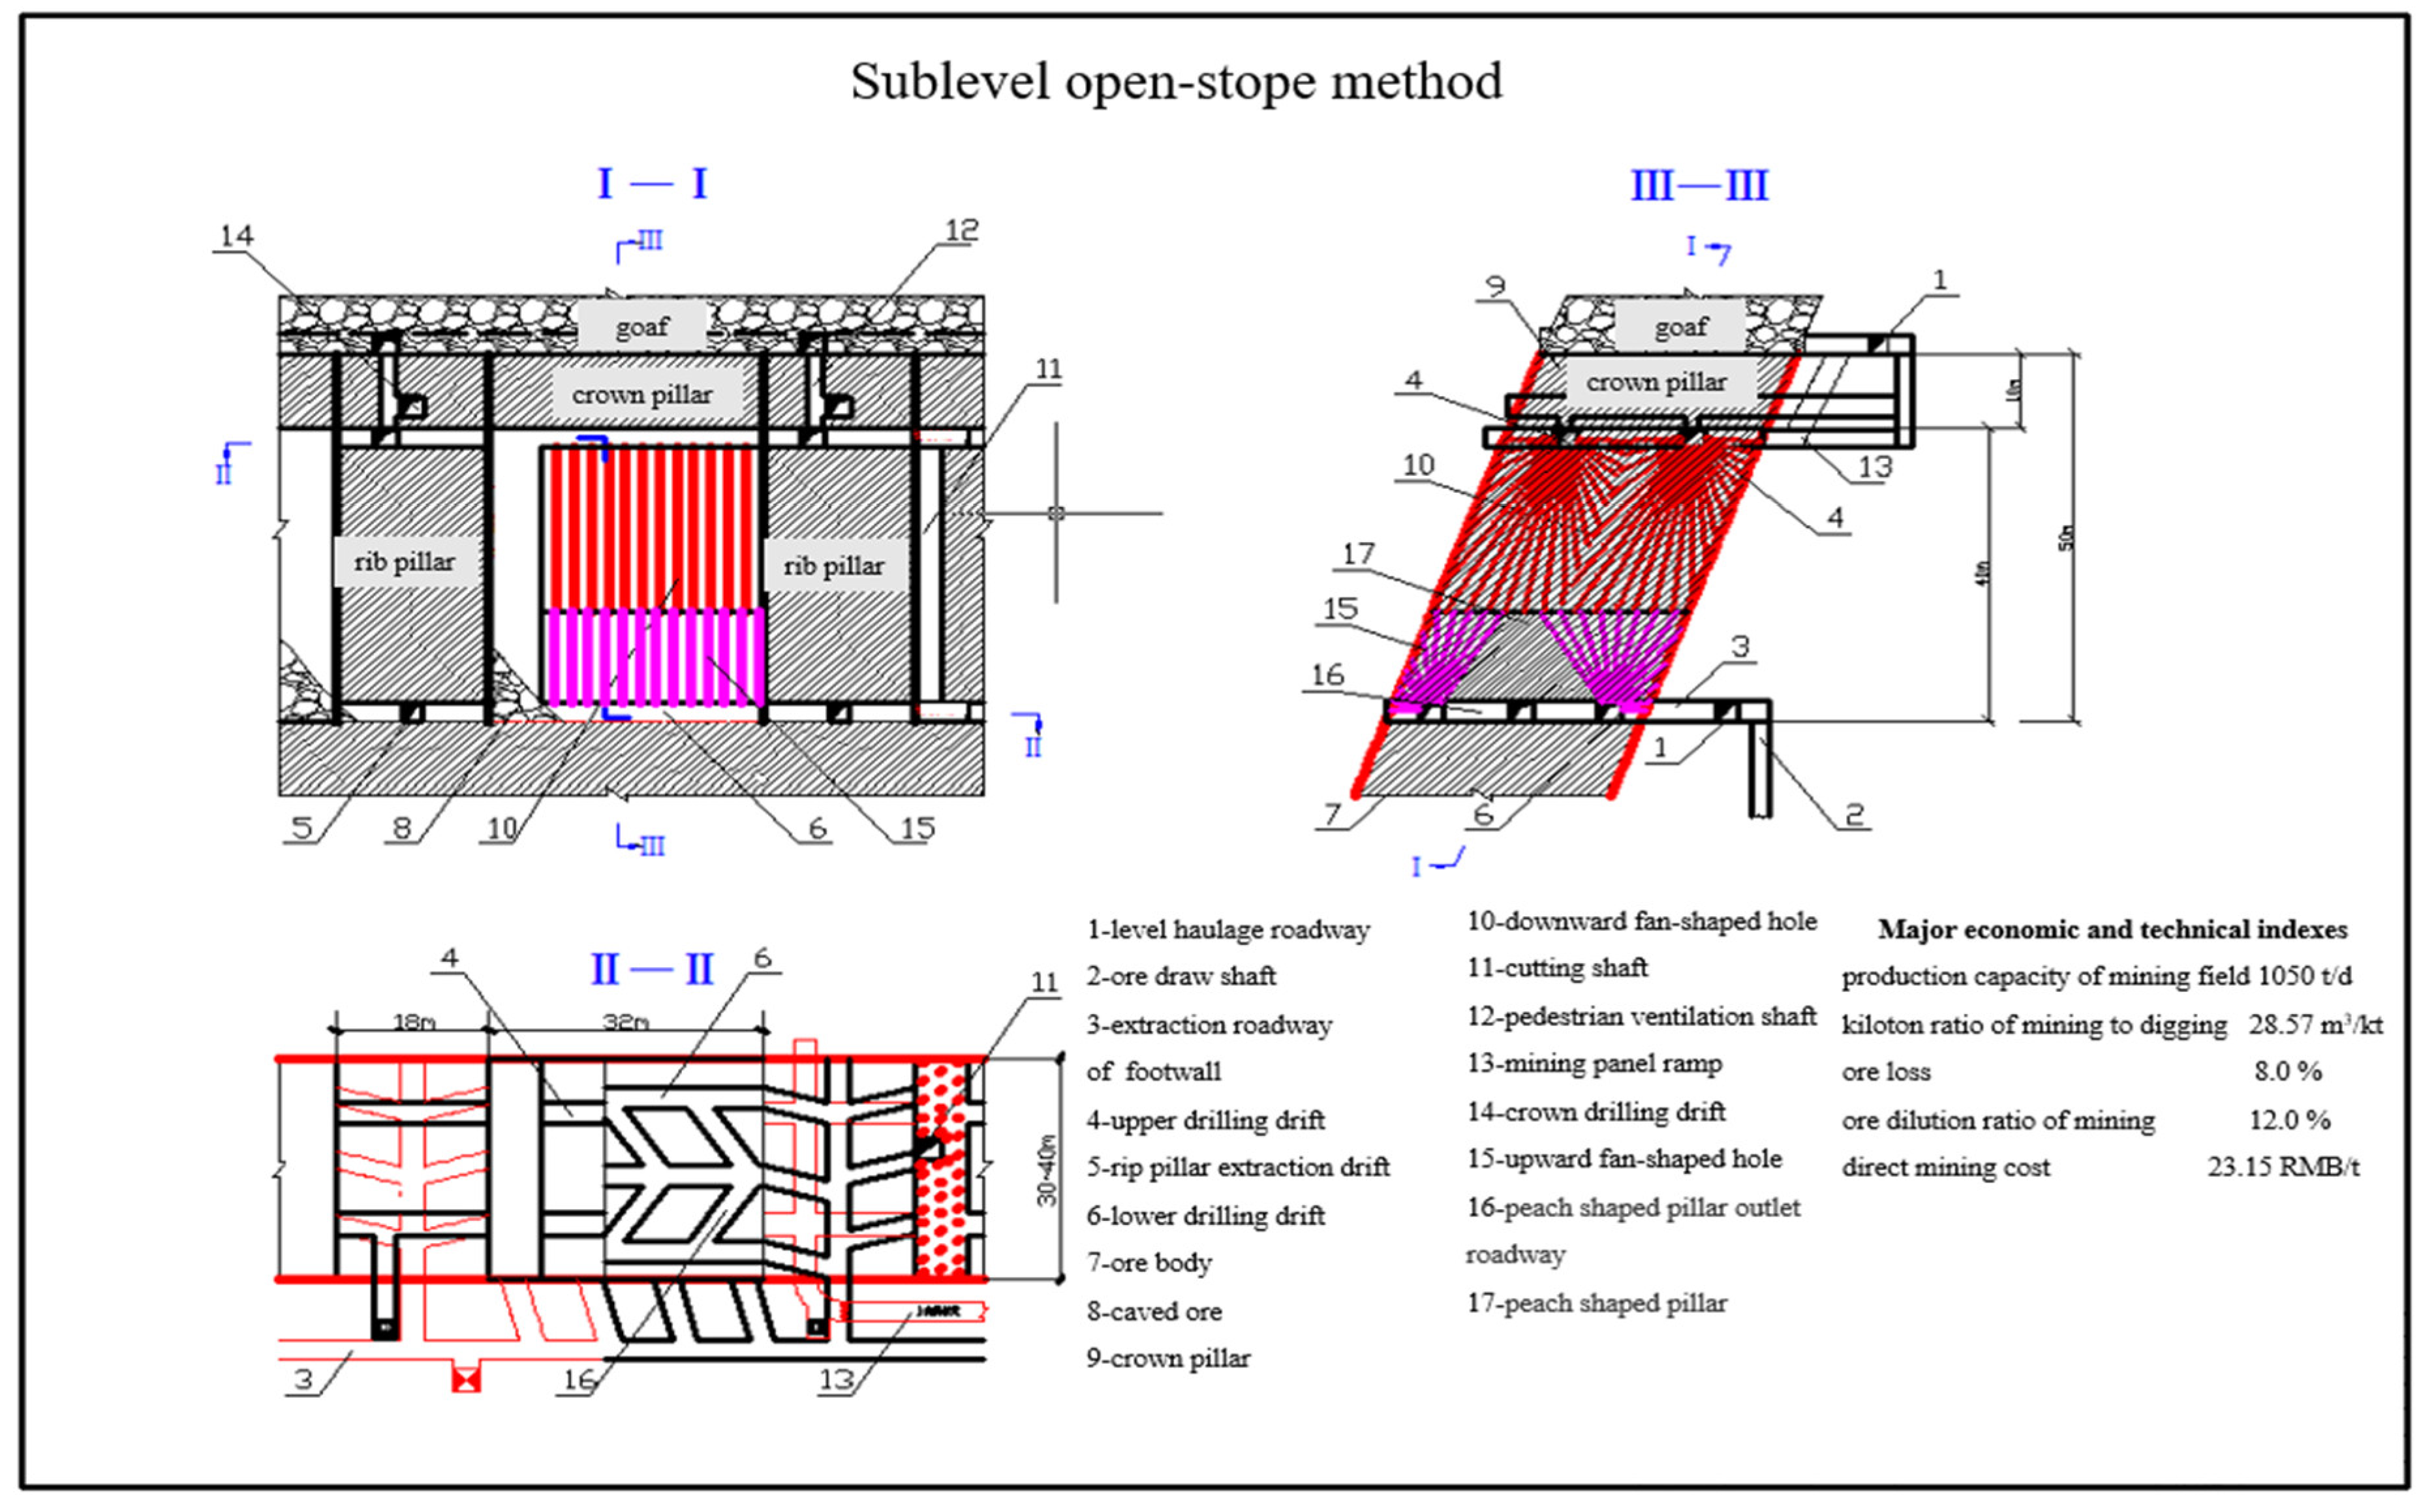
3. Proposed Middle Sublevel Crown Pillar Recovery Schemes
4. Theoretical Calculation of a Reasonable Size for the Preserved Roof Protection Layer of the Crown Pillars of the 855 Middle Sublevel
4.1. Calculation of the Overlying Uniform Load on the Roof Protection Layer
4.2. Theoretical Analysis of the Reasonable Size of Preserved Roof Protection Layer
5. Numerical Simulation and Inversion of Crown Pillar Extraction and Roof Protection Layer Schemes of the 855 Middle Sublevel
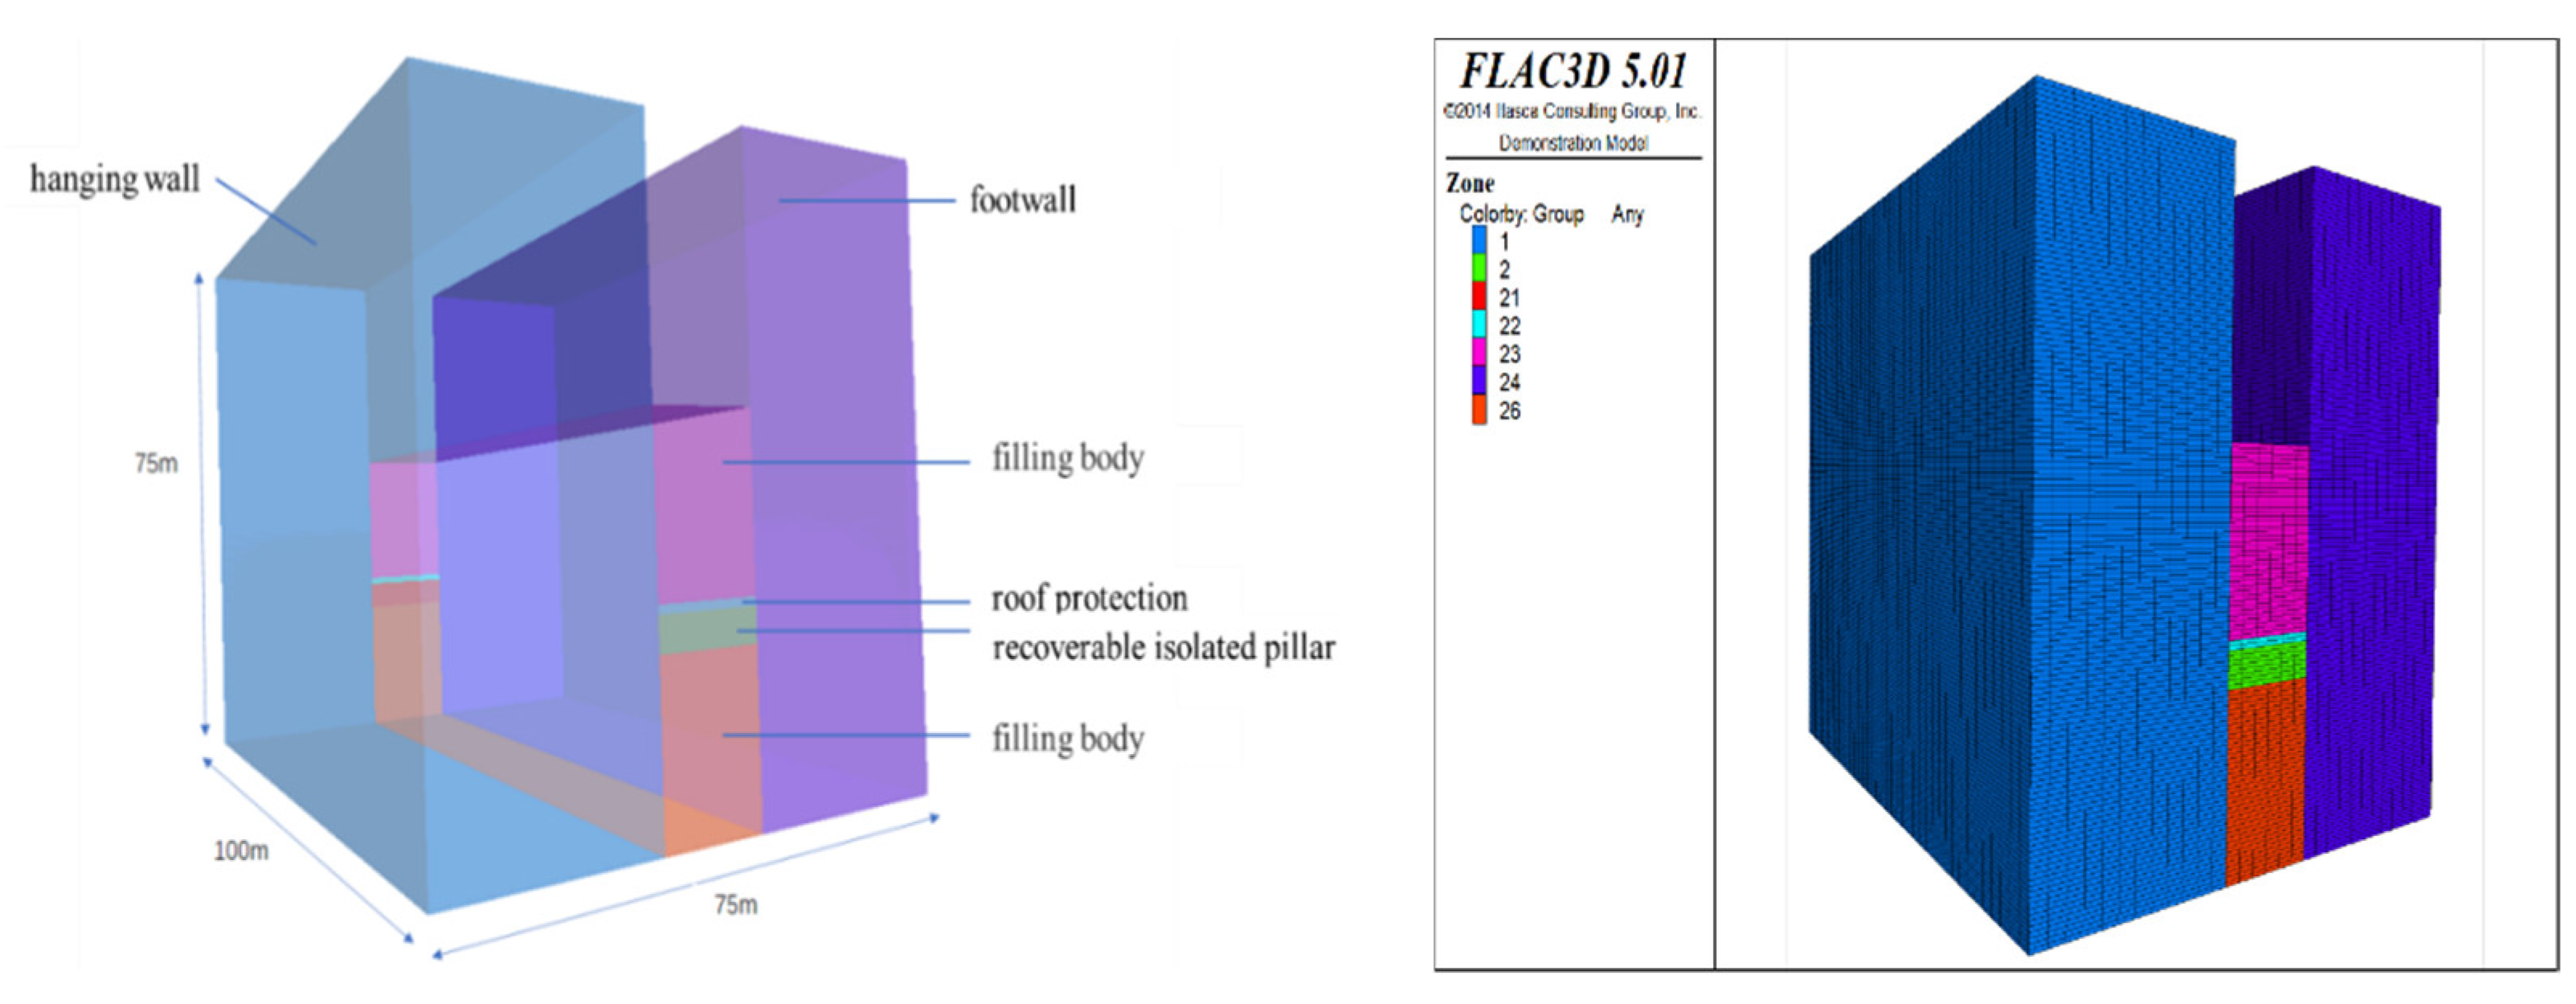
5.1. Numerical Modelling
5.2. Selection of Model Material Parameters
5.3. Numerical Simulation Schemes and Steps
5.4. Analysis and Discussions of Numerical Calculation Results
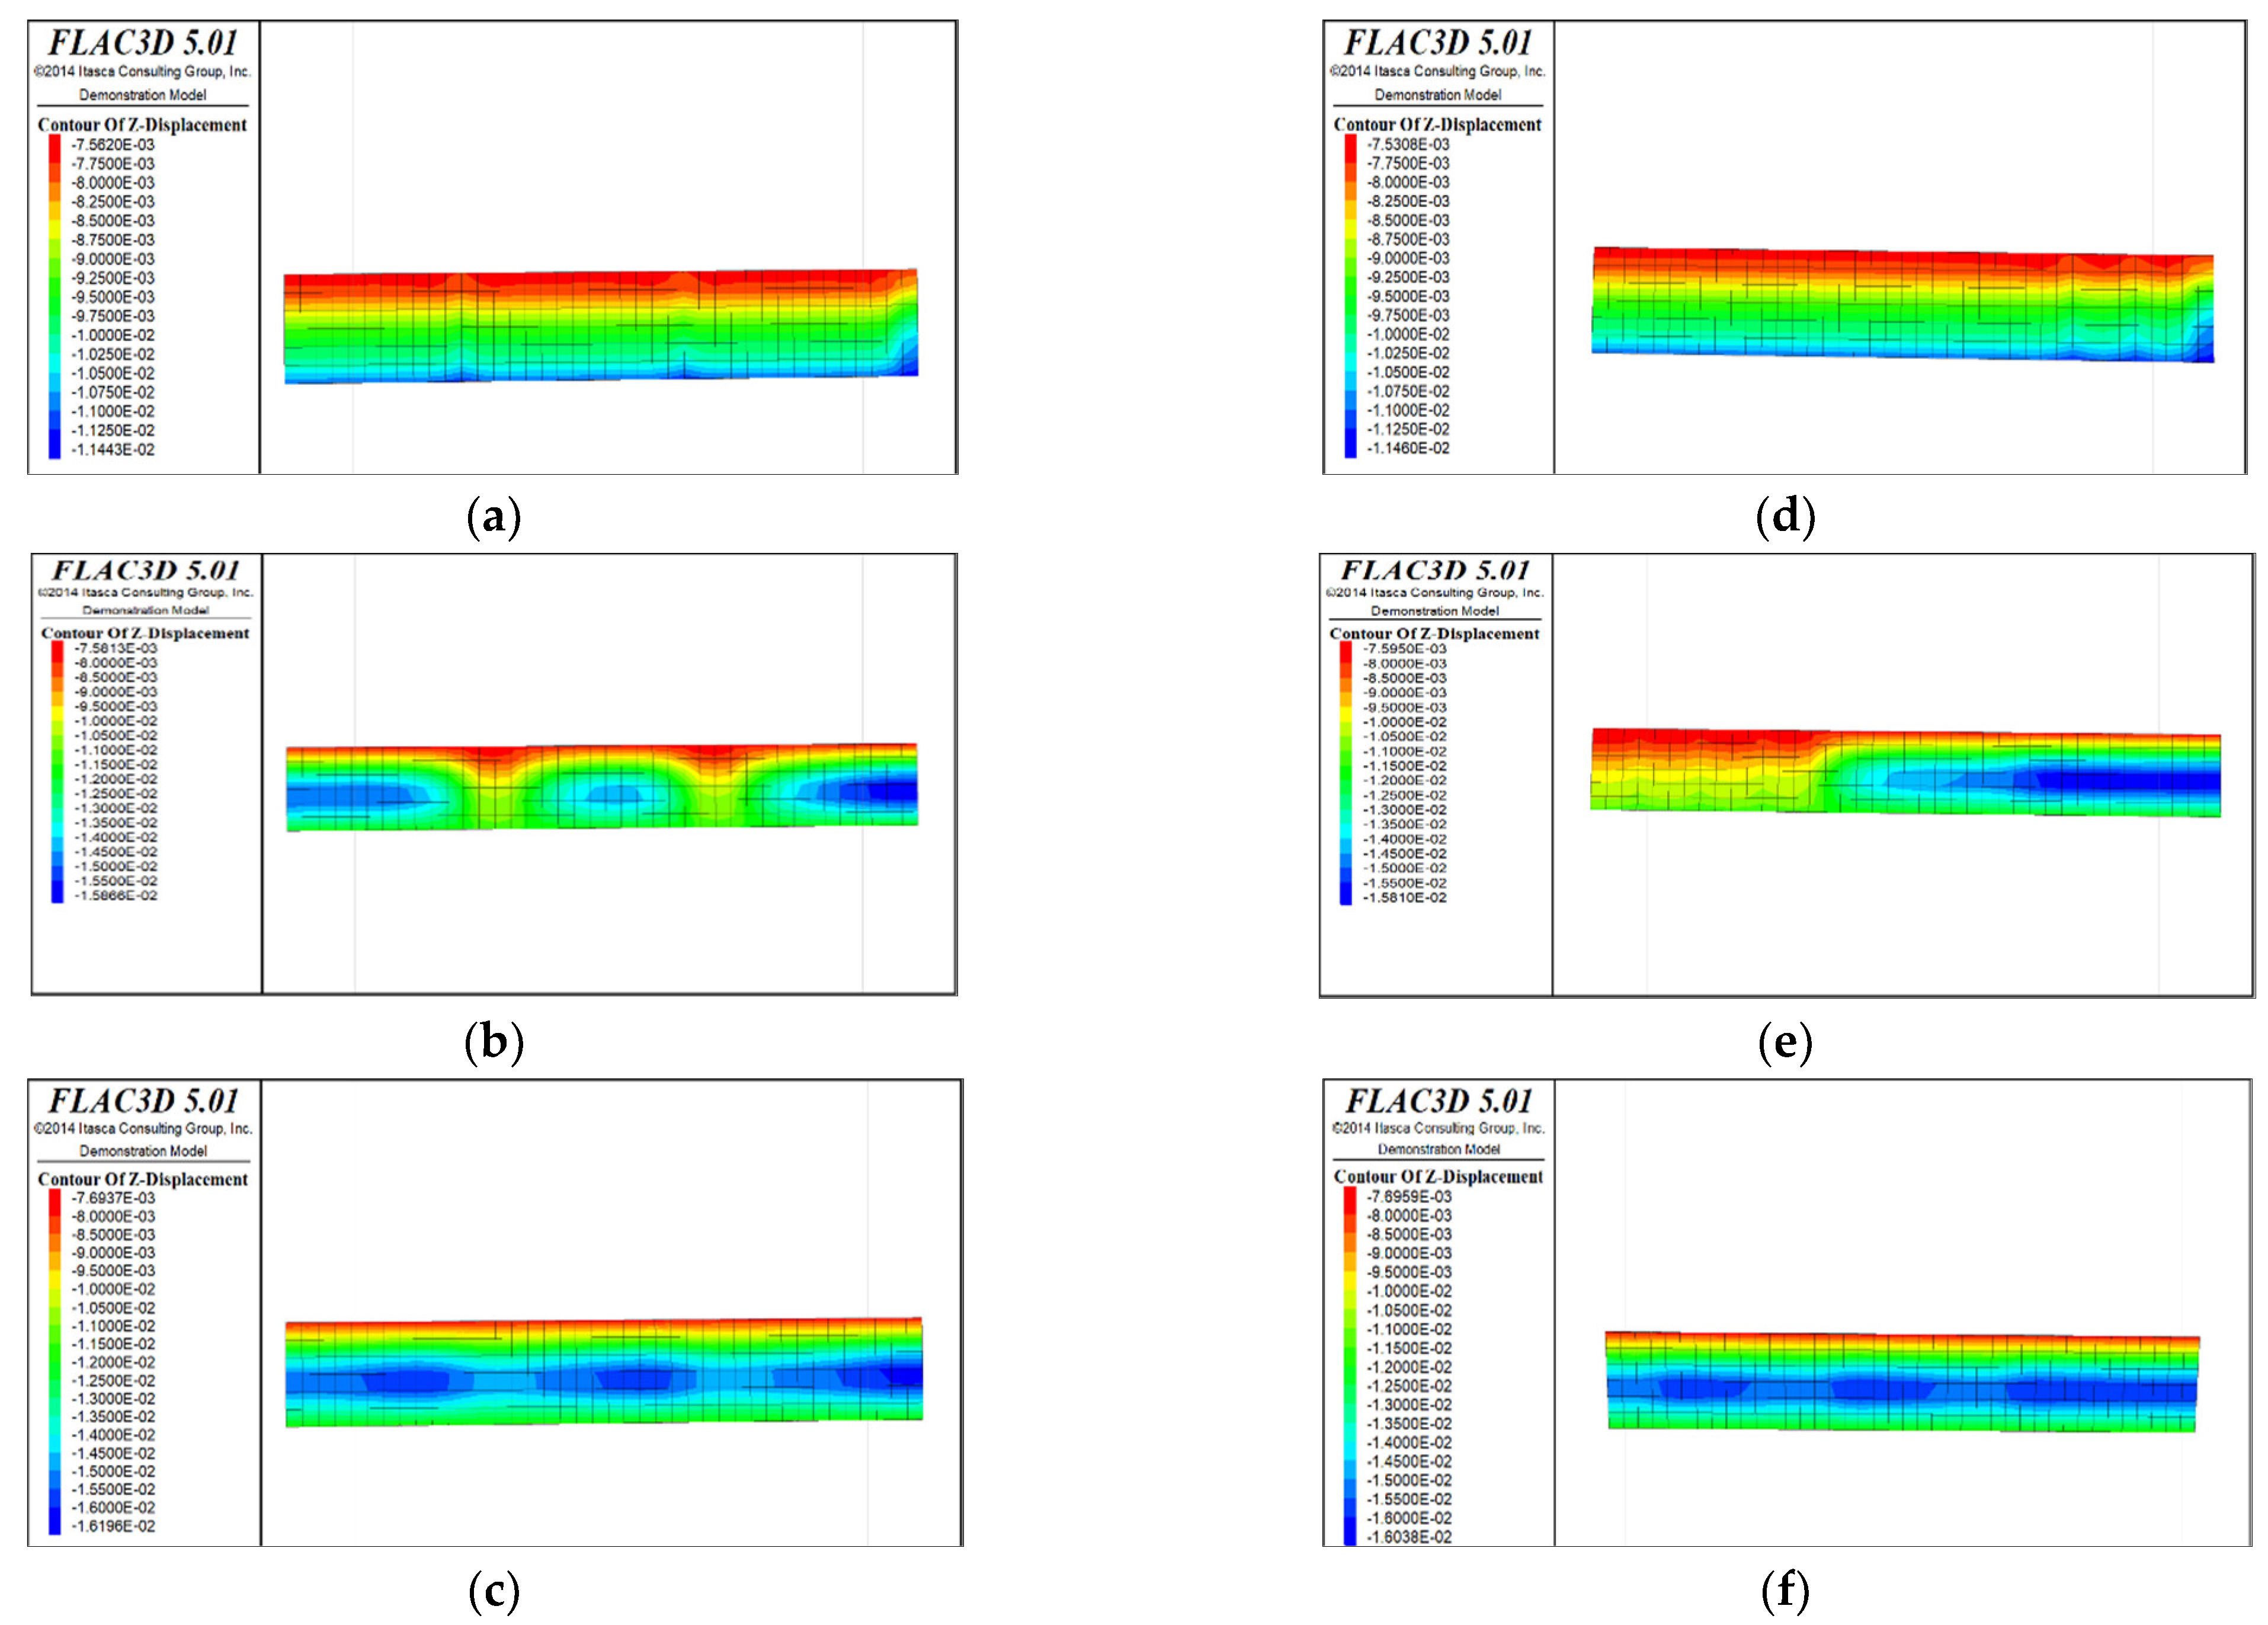
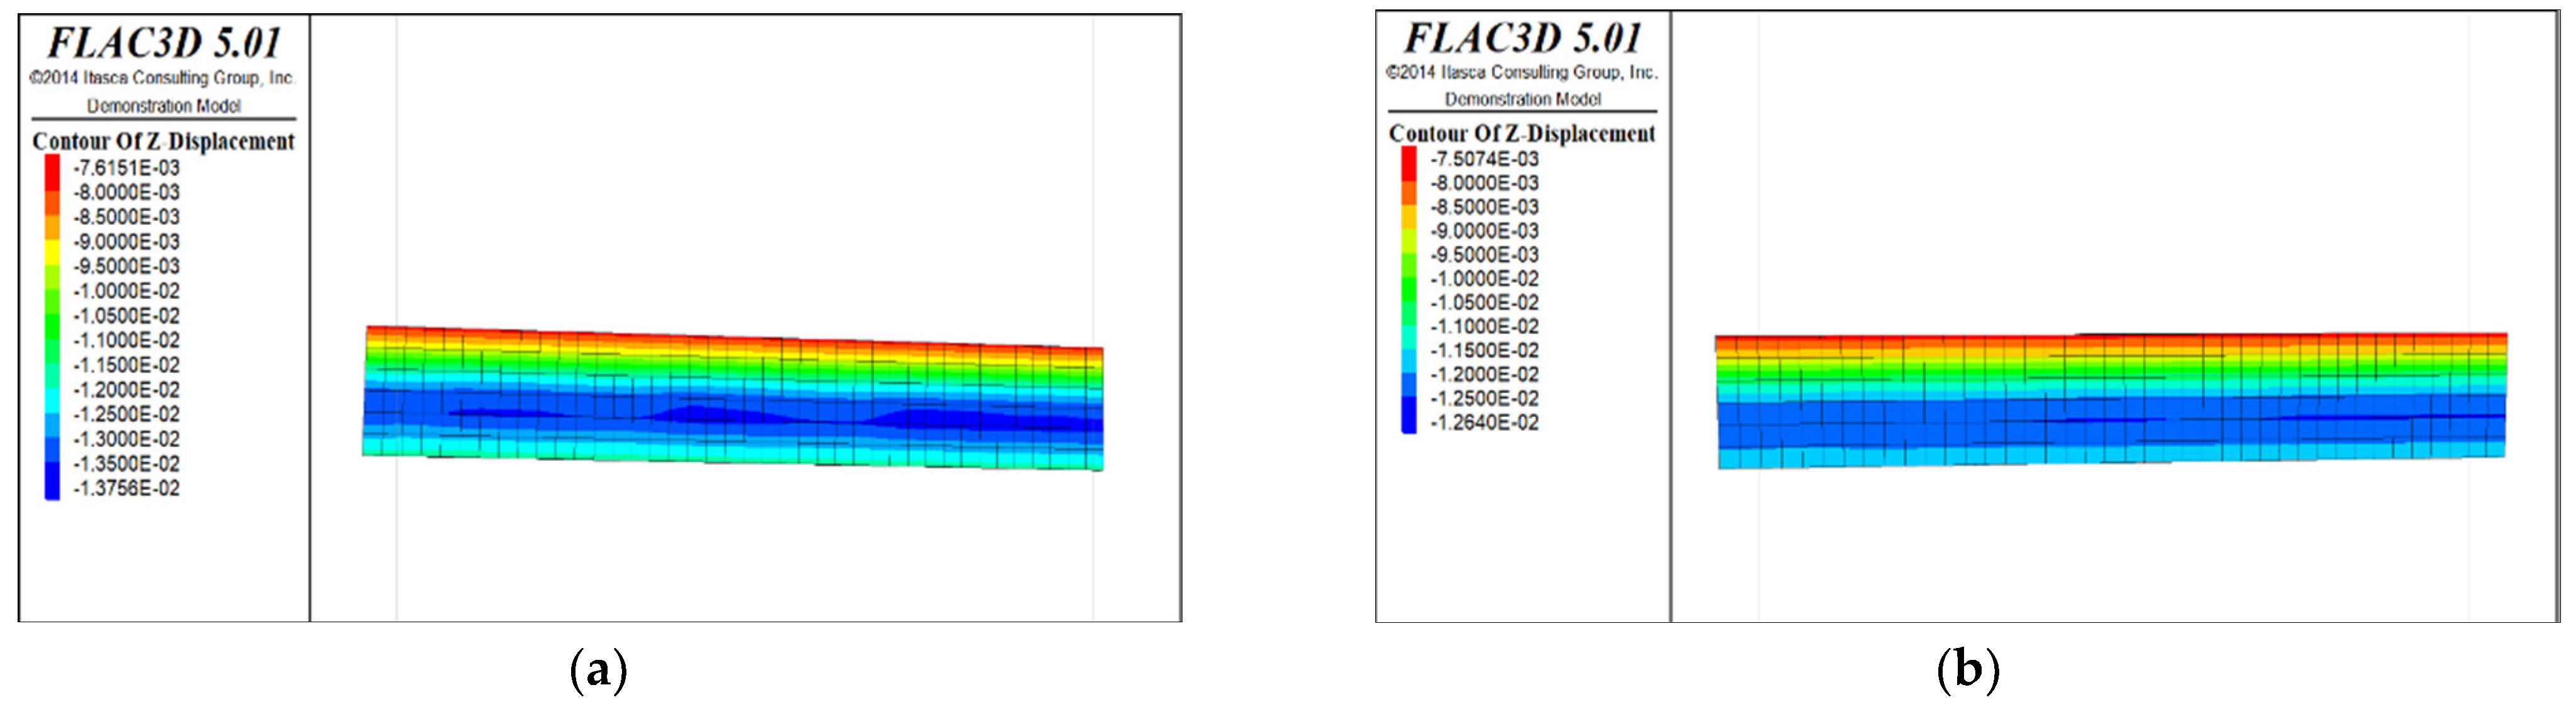
5.4.1. Analysis of Displacement Field
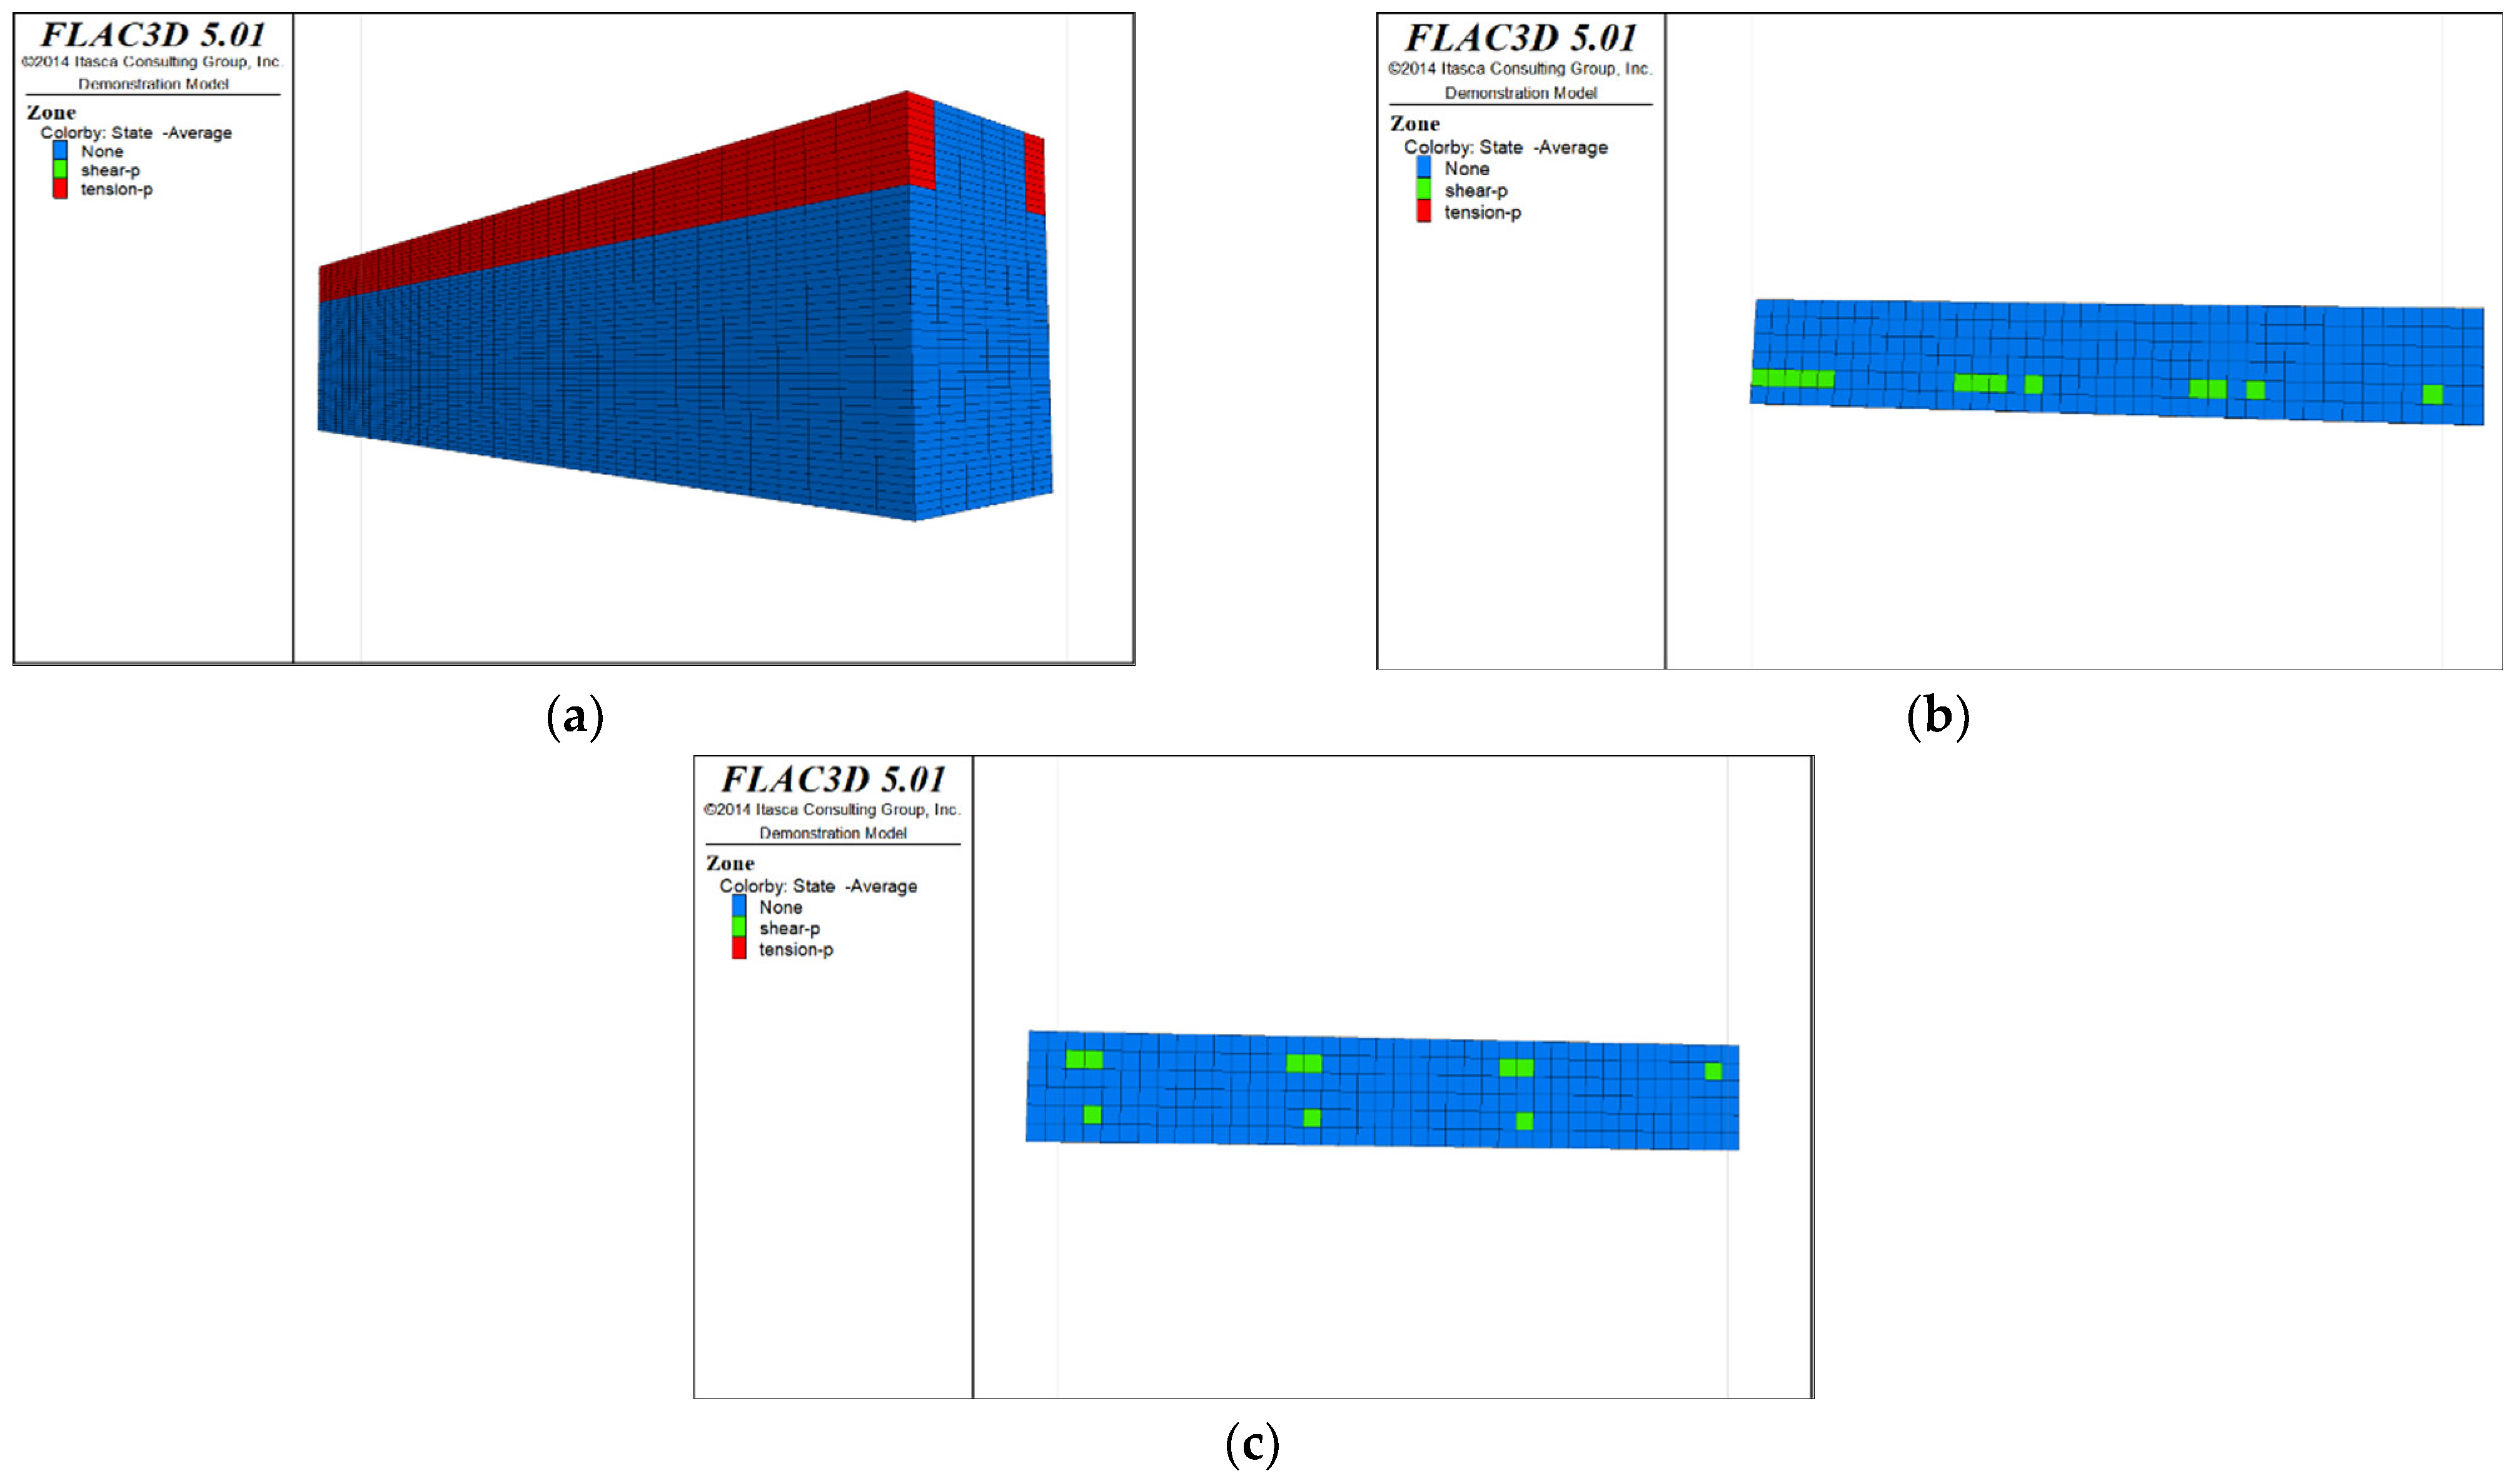
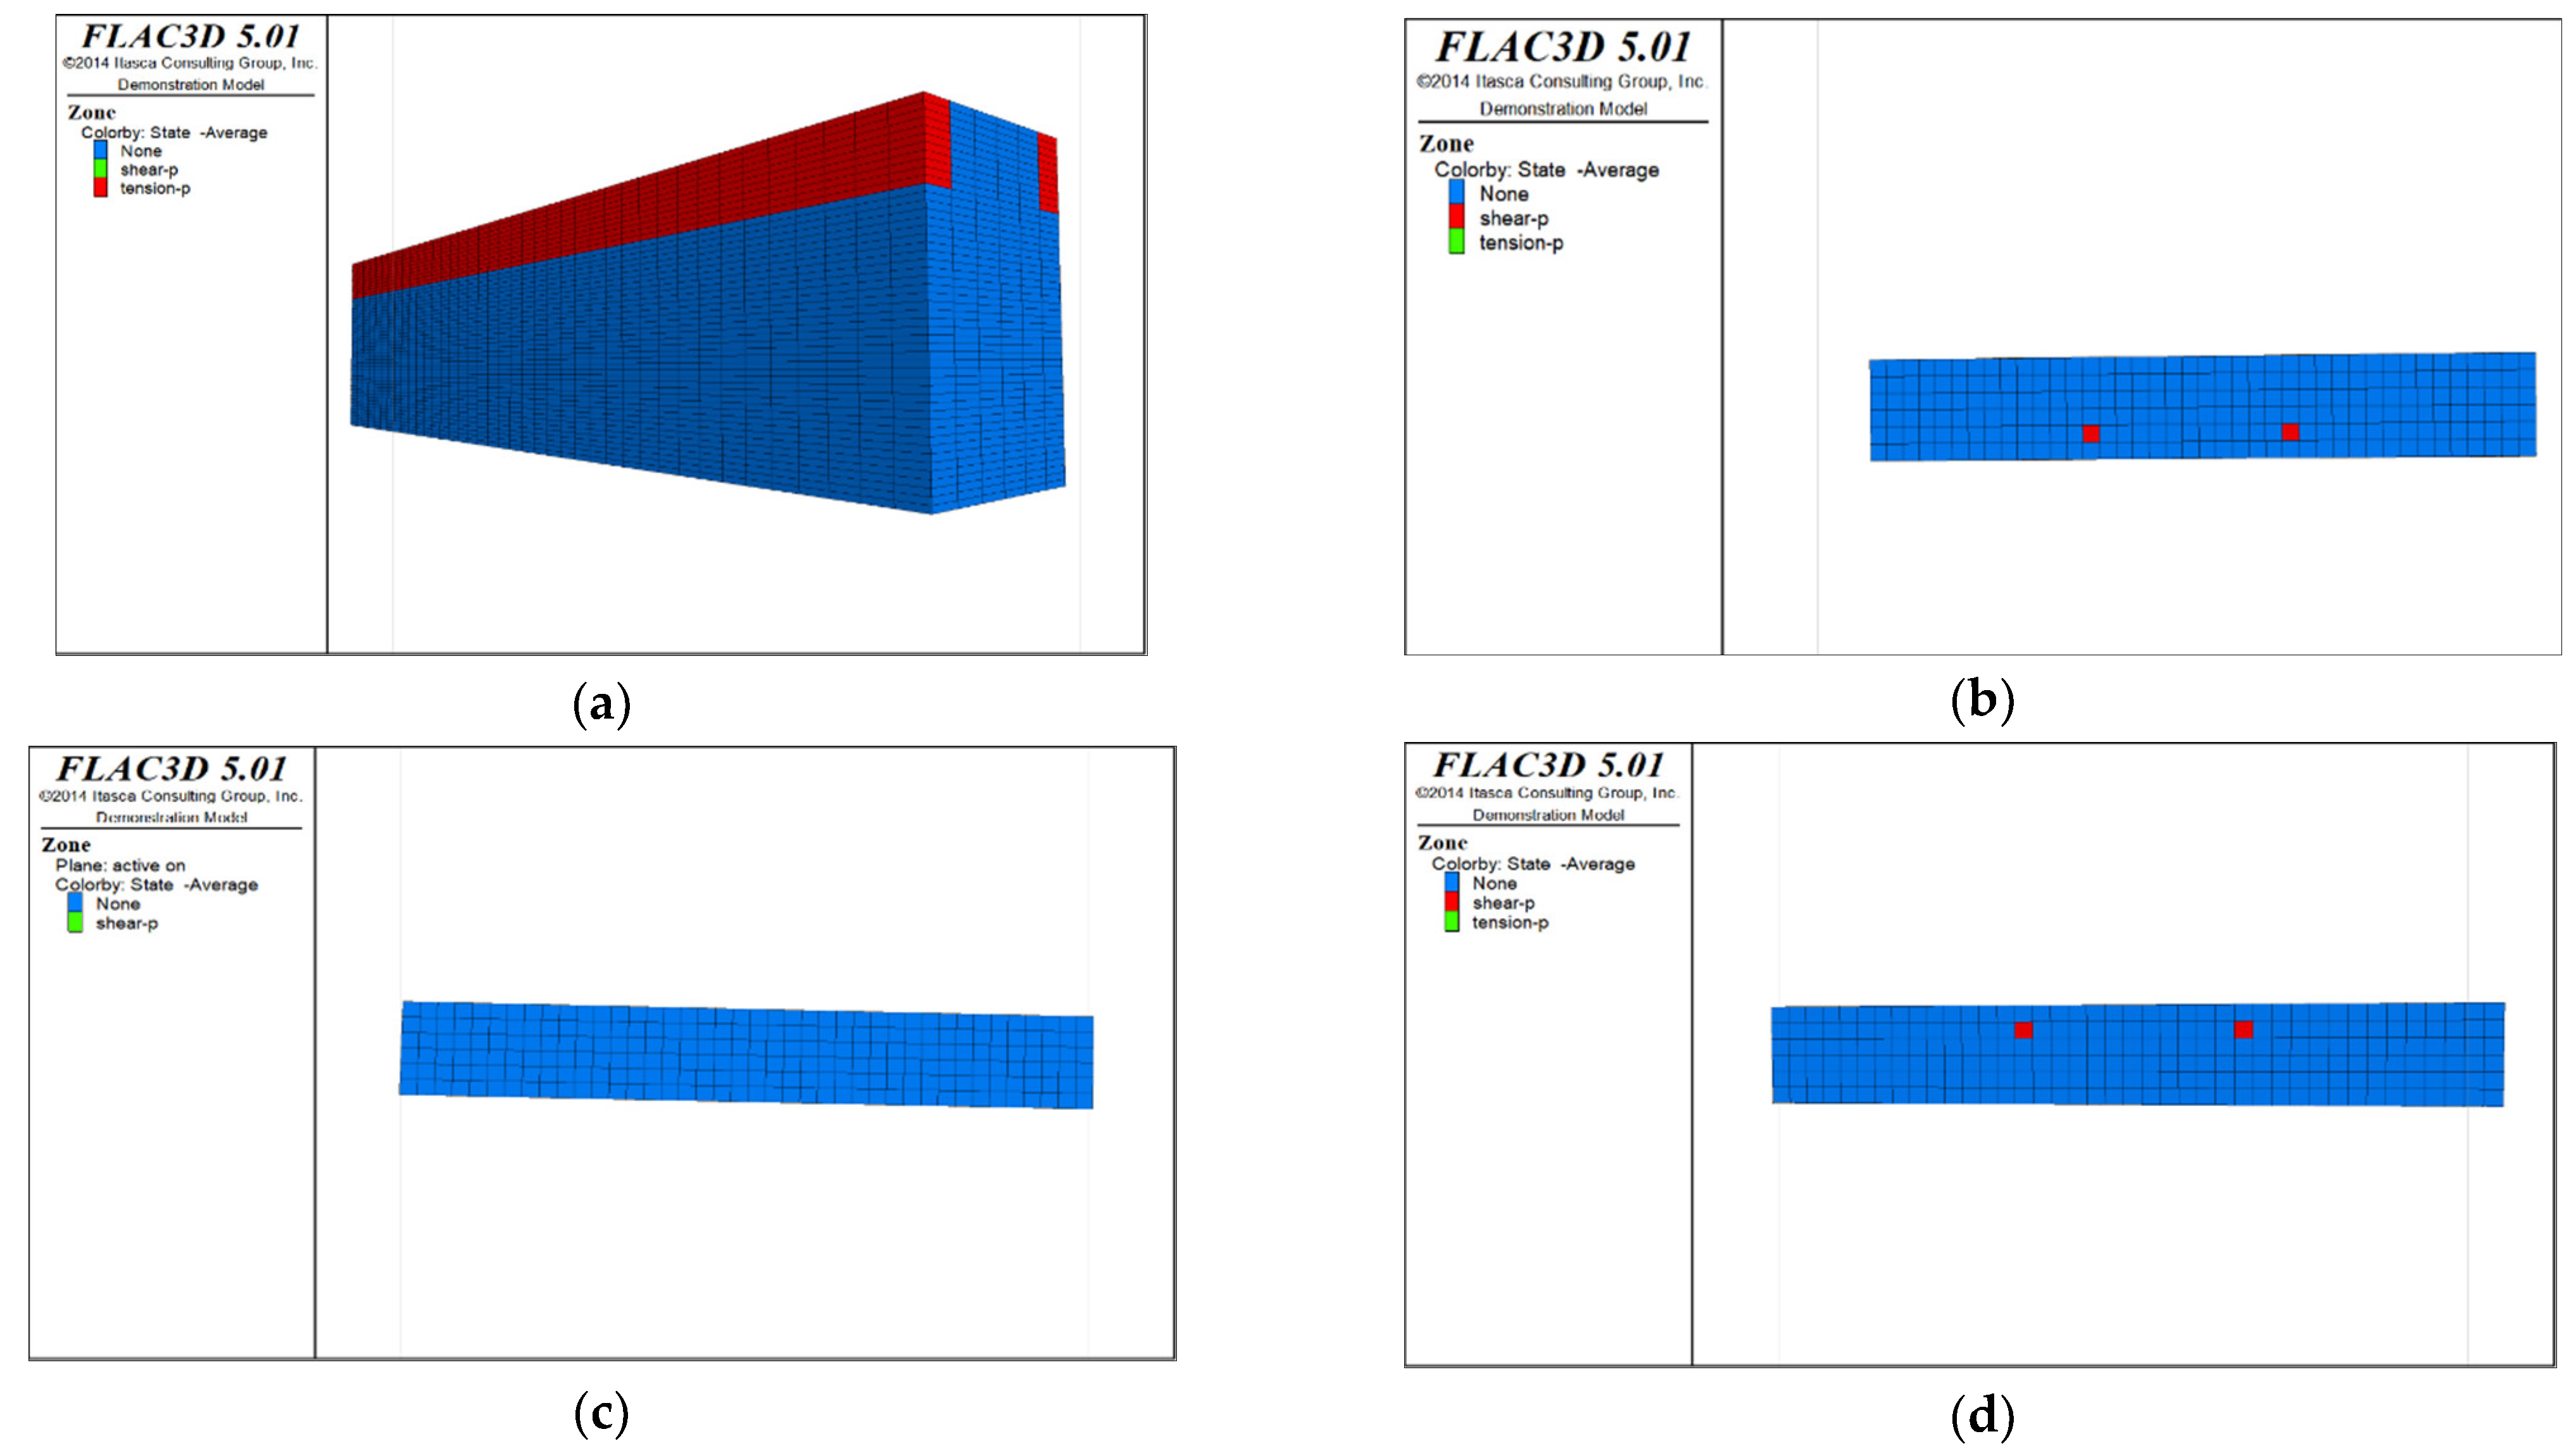
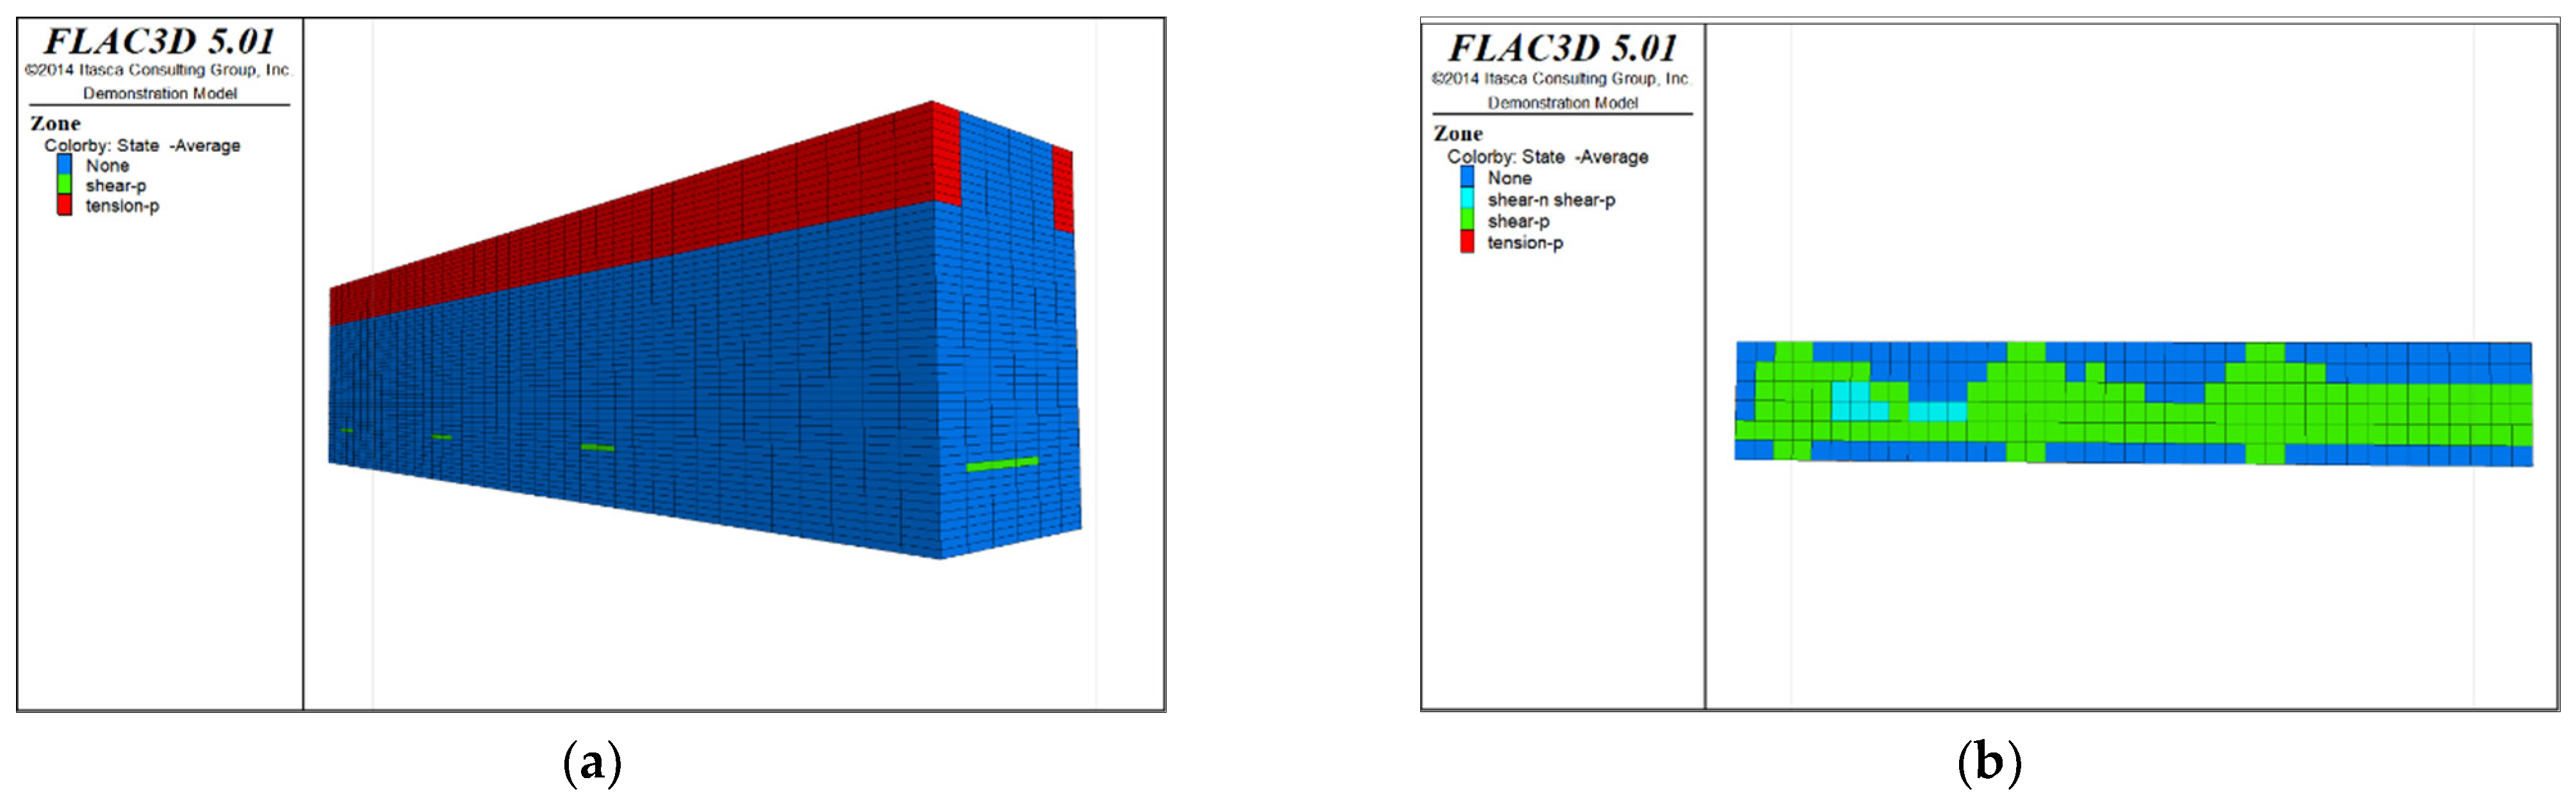
5.4.2. Analysis of Plastic Zone
6. Optimization of the Schemes for the Preservation of Roof Protection Layer and Extraction Sequence Based on Analytic Hierarchy Process
6.1. Establishment of Optimized Fuzzy Mathematics Model
6.2. Determination of the Optimal Scheme for the Preservation of Roof Protection Layer and the Extraction Sequence
7. Conclusions
- (1)
- Based on the existing technical conditions of mining and ore body reserve characteristics of the crown pillar in the 855 middle sublevel, the cut-and-fill stoping of drift vertical to ore body strike was proposed to be the optimal recovery scheme for the crown pillar in the 855 middle sublevel.
- (2)
- Based on the results of a site survey and information query, a preliminary reasonable isolated layer preserved thickness was obtained using seven classical theories. In conformance with the existing technical conditions of mining, three potential roof protection layer thicknesses were proposed: 0.5 m, 1 m, and 1.5 m.
- (3)
- Based on the numerical simulation results, it was found that for each scheme, the displacement field of the roof protection layer and the change rule of the plastic zones were analyzed, the results revealing that the extraction sequence and the thickness of the roof protection layer both have a significant influence on the stability of the pit. By mining at intervals of one strip, the range of the plastic zones in the roof protection layer can be effectively controlled in the early stage of mining, which enhances the overall stability of the roof protection layer in the later stages. It was further shown that the proportion of plastic zones in the roof protection layer monotonically decreases as the thickness of the protection layer increases. However, there are significant reductions in the changes in sedimentation value and proportion of plastic zones once the roof protection layer thickness exceeds 1 m.
- (4)
- Based on the scheme-ranking membership vector produced in the analytic hierarchy process, the optimal extraction scheme for the preservation of the roof protection layer in the 855 middle sublevel was determined to be cut-and-fill stoping of the drift vertical to ore body strike combined with a preserved roof protection layer thickness of 1 m and a spaced mining sequence.
Author Contributions
Funding
Data Availability Statement
Conflicts of Interest
References
- Li, X.B.; Qiu, J.D.; Zhao, Y.Z.; Chen, Z.H.; Li, D.Y. Instantaneous and long-term deformation characteristics of deep room-pillar system induced by pillar recovery. Trans. Nonferrous Met. Soc. China 2020, 30, 2775–2791. [Google Scholar] [CrossRef]
- Kaiser, P.K.; Kim, B.H.; Bewick, R.P.; Valley, B. Rock mass strength at depth and implications for pillar design. Min. Technol. 2014, 120, 170–179. [Google Scholar] [CrossRef]
- Hu, G.J.; Yang, T.H.; Zhou, J.R.; Yu, Q.L.; Xie, L.K.; Liu, H.L.; Zhao, Y. Mechanism of surrounding rock failure and crack evolution rules in branched pillar recovery. Minerals 2017, 7, 96. [Google Scholar] [CrossRef]
- Rybak, J.; Khayrutdinov, M.M.; Kuziev, D.A.; Kongar-Syuryun, C.B.; Babyr, N.V. Prediction of the geomechanical state of the rock mass when mining salt deposits with stowing. J. Min. Inst. 2022, 253, 61–70. [Google Scholar] [CrossRef]
- Christopher, M.; Michael, G. Preventing roof fall fatalities during pillar recovery: A ground control success story. Int. J. Min. Sci. Technol. 2017, 27, 107–113. [Google Scholar]
- Wang, F.F.; Ren, Q.Y.; Chen, B.; Zou, P.; Peng, Z.J.; Hu, W.J.; Ma, Z. Numerical investigation on safe mining of residual pillar in goaf: A case study of Panlong lead–zinc mine. Geotech. Geol. Eng. 2020, 38, 4269–4287. [Google Scholar] [CrossRef]
- Ley, G.M.M.; Steed, C.M. Recovery of pillars under backfill. World Min. Express 1999, 15, 40–45. [Google Scholar]
- Xia, K.Z.; Chen, C.X.; Liu, X.M.; Song, X.G.; Jiang, X.W.; Zhou, Y.C. Rheological mechanical model of pillar-protective roof supporting system in gypsum mines. Rock Soil Mech. 2017, 38, 2923–2930. (In Chinese) [Google Scholar]
- Jiang, L.C.; Yang, C. Safety thickness of bauxite goaf protective roof in hard clay roof. Journal of Central South University. Sci. Technol. 2020, 51, 445–452. [Google Scholar]
- Auvary, C.; Homand, F.; Sorgi, C. The aging of gypsum in underground mines. Eng. Geol. 2004, 74, 183–196. [Google Scholar] [CrossRef]
- Liu, Z.Y. Stability Analysis of Mining of Roof and Bottom Pillars under the Backfill in Xinli Area of Sanshandao Gold Mine. Master’s Thesis, Central South University, Changsha, China, 2014. (In Chinese). [Google Scholar]
- Zhu, H.X.; Han, L.J.; Meng, Q.B.; Tian, M.L.; Meng, L.D.; Zhao, Z.L. Determining the minimum thickness of a crown pillar and optimizing the cross-sectional size of point pillars for the safe exploitation of a subsea gold mine. Arab. J. Geosci. 2021, 14, 1275. [Google Scholar] [CrossRef]
- Zhao, X.D. Stability analysis of insulating pillar of excavation of Chambishi copper mine in depth. Chin. J. Rock Mech. Eng. 2010, 29, 2616–2622. [Google Scholar]
- Ajayi, S.A.; Ma, L.Q.; Spearing, A.J.S. Ground Stress Analysis and Automation of Workface in Continuous Mining Continuous Backfill Operation. Minerals 2022, 12, 754. [Google Scholar] [CrossRef]
- Huang, Y.G.; Yang, W.X.; Li, Y.Y.; Guo, W.B. Spatial distribution characteristics of plastic failure and grouting diffusion within deep roadway surrounding rock under three-dimensional unequal ground stress and its application. Minerals 2022, 12, 296. [Google Scholar] [CrossRef]
- Safonov, A.; Filippi, M.; Mašín, D.; Bruthans, J. Numerical modeling of the evolution of arcades and rock pillars. Geomorphol. 2020, 365, 107260. [Google Scholar] [CrossRef]
- Chen, S.J.; Feng, F.; Wang, Y.J.; Li, D.Y.; Huang, W.P.; Zhao, X.D.; Jiang, N. Tunnel failure in hard rock with multiple weak planes due to excavation unloading of in-situ stress. J. Cent. South Univ. 2020, 27, 2864–2882. [Google Scholar] [CrossRef]
- Feng, F.; Li, X.B.; Rostami, J.; Peng, D.X.; Li, D.Y.; Du, K. Numerical investigation of hard rock strength and fracturing under polyaxial compression based on Mogi-Coulomb failure criterion. Int. J. Geomech. 2019, 19, 04019005. [Google Scholar] [CrossRef]
- Ebrahim, G.; Mohammad, A.; Kourosh, S. An intelligent approach to predict pillar sizing in designing room and pillar coal mines. Int. J. Rock Mech. Min. Sci. 2014, 65, 86–95. [Google Scholar]
- Saffet, Y.; Candan, G. Application of fuzzy inference system and nonlinear regression models for predicting rock brittleness. Expert Syst. Appl. 2020, 37, 2265–2272. [Google Scholar]
- Hyunjun, I.; Huongdoo, J.; Erkan, T.; Micah, N. Long- and short-term strategies for estimation of hydraulic fracturing cost using fuzzy logic. Minerals 2022, 12, 715. [Google Scholar]
- Sławomir, B.; Stanisław, P. Numerical study of pressure on dams in a backfilled mining shaft based on PFC3D code. Comput. Geotech. 2015, 66, 230–244. [Google Scholar]
- Janssen, H.A. Versuche über Getreidedruck in Silozellen. Z. Des. Ver. Dtsch. Ing. 1895, 39, 1045–1049. [Google Scholar]
- Feng, F.; Li, X.B.; Chen, S.J.; Peng, D.X.; Bian, Z. Rational size and stability analysis of horizontal isolated pillars in deep mining from caving to filling method. E3S Web Conf. 2021, 303, 01040. [Google Scholar] [CrossRef]
- Swift, G.M.; Reddish, D.J. Stability problems associated with an abandoned ironstone mine. Bull. Eng. Geol. Environ. 2002, 61, 227–239. [Google Scholar]
- Hoek, E.; Brown, E.T. The Hoek–Brown failure criterion and GSI—2018 edition. J. Rock Mech. Geotech. Eng. 2019, 11, 445–463. [Google Scholar] [CrossRef]
- Yang, J.H.; Dai, J.H.; Yao, C.; Jiang, S.H.; Zhou, C.B.; Jiang, Q.H. Estimation of rock mass properties in excavation damage zones of rock slopes based on the Hoek-Brown criterion and acoustic testing. Int. J. Rock Mech. Min. Sci. 2020, 126, 104192. [Google Scholar] [CrossRef]
- Li, X.B.; Peng, D.X.; Feng, F.; Li, X.S. Stability analysis of horizontal insulating pillar in deep mining from caving to filling method on the basis of refined plate theory. J. China Univ. Min. Technol. 2019, 48, 484–494. [Google Scholar]
- Philip-Mark, S.; Christos, R.; Francis, P. A Methodology combining IDEF0 and weighted risk factor analysis for the strategic planning of mine reclamation. Minerals 2022, 12, 713. [Google Scholar]
- Fatemeh, K.; Ataallah, B.; Jafar, A.S. Mineral processing plant site selection using integrated fuzzy cognitive map and fuzzy analytical hierarchy process approach: A case study of gilsonite mines in Iran. Miner. Eng. 2020, 147, 106143. [Google Scholar]


| Schemes | Scheme I | Scheme II | Scheme III |
|---|---|---|---|
| Name | Cut and fill stoping of drift along the ore body strike | Cut and fill stoping of drift vertical to the ore body strike | Cut and fill stoping of small drift along the ore body strike |
| Basic characteristics | Crown pillars are divided into two ore blocks along the ore body strike direction, and each block is further divided into stope rooms and pillars. The stope room has a length of 40 m, and the pillar has a width of 10 m. In the stope room, the drifts are arranged along the same direction of the ore body, and 3–5 drifts can be arranged at the same time. | Drifts are arranged for the crown pillars along the ore body tendency body without division of stope rooms and pillars. The width of the drifts can be 3–5 m, the length of the drift is the thickness of the crown pillar. If the length of the crown pillar is 100 m, more than 20 drifts need to be arranged. | The small blocks are arranged along the crown pillars, with a width of 20 m and a length of the thickness of the ore body, and 5 small blocks need to be arranged. Each small block is subdivided into stope rooms with a width of 15 m and point pillars with a width of 5 m. In the stope room, the drifts are arranged along the same direction of the ore body, and 3 drifts can be arranged at the same time. |
| Advantages | The pit structure is relatively simple, while the number of drifts is small, and the extraction and backfill operation does not need to be changed frequently, so there is less mutual interference; the stope preparation and cutting work are relatively simple. | The pit features a simpler structure, smaller exposed area of drifts, shorter maintenance time of drifts and higher ore recovery rate, in which the thickness of the roof protection layer required to be preserved can be reduced appropriately; the spaced extraction has a low impact on the ore recovery progress; multiple drifts can be extracted simultaneously, which improves mining efficiency. | Compared to both Schemes I and II, the pit drift features a smaller exposed area, better stability, shorter maintenance time, less thickness of roof protection layer required to be preserved, and a higher ore recovery rate. |
| Disadvantages | The length of each drift is larger, the exposed area of the roof is larger, and the thicker roof protection layer needs to be preserved, resulting in a higher ore loss rate; the non-spaced extraction method was adopted while the number of drifts extracted is only one, affecting the extraction progress inside the pit, thus leading to the extraction period delay; blind heading causes poor ventilation effect in the pit. | The length of the drift is the thickness of the ore body, more drifts need to be arranged in the pit, and the extraction work and the filling work need to be changed frequently, affecting the extraction progress to a certain extent; blind heading causes poor ventilation effect in the pit. | The pit structure is more complex, and the quantities of stope preparation and cutting works are larger; the non-spaced extraction method is adopted, while the number of drifts simultaneously extracted is only one, affecting the extraction progress and work efficiency in the pit, leading to the extraction period delay; blind heading causes poor ventilation effect in the pit. |
| Theoretical Method | Calculation Formula | Definition of Parameters | Thickness of Roof Protection Layer (m) |
|---|---|---|---|
| Limit span theory | 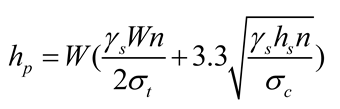 | hp—thickness of the roof protection layer, m; W—drift width, m; σt, σc—the tensile strength and compressive strength of the ore in the roof protection layer, respectively, MPa; γs—waste rock unit weight, kN/m3; hs—the height of caved rock or backfill waste pile, m; n—the safety factor, by using the open stoping, taken as 1.2. | 1.6 |
| K.B. Rubeneita method | 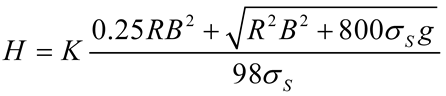 | H-thickness of the roof protection layer, m; K—safety factor, taken as 1.2; γ2—the rock unit weight of the roof protection layer, t/m3; B—drift width, m; σS =σn5/K0K3 is the rock strength limit under bending conditions, K0 = 2–3, K3 = 7–10, σn5 = 0.1σc, σc—the uniaxial compressive strength of rock, MPa; g—the uniform load above the roof protection layer, MPa. | 0.6 |
| B.H. Bogorlyubov method | 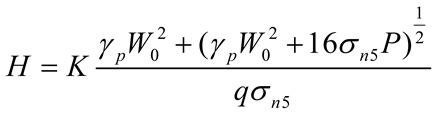 | H—thickness of the roof protection layer, m; P—dynamic load formed due to blasting rock, P = rHYKn(Kc + Knep)/Kp; HY—the gradient height, taken as 5 m; r—crater index, taken as 1.5; Kc, Knep, Kn and Kp—the bench height decreasing coefficient, over-drilling coefficient, dynamic load factor and ore rock loose coefficient, respectively, when blasting is carried out, with Kc as 0.1, Knep as 1.2, Kn as 2 and Kp as 1.3 according to previous studies; | 1.5 |
| Length-to-width ratio plate-girder method | 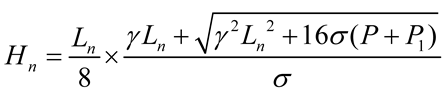 | Hn—thickness of the roof protection layer, m; Ln—pit span (thickness of the ore body), m; γ—unit weight of the isolated pillar rock, kN/m3; σ—permitted tensile stress of the isolated pillar rock, kN/m2; P1—unit pressure of the waste rock and other additional loads on the isolated pillar, kN/m2; P—dynamic load generated by blasting, P = rHYKn(Kc + Knep)/Kp. Where: HY—the gradient height, taken as 5 m; r—crater index, taken as 1.5; Kc, Knep, Kn and Kp—the bench height decreasing coefficient, over-drilling coefficient, dynamic load factor and ore rock loose coefficient, respectively, when blasting is carried out, with Kc as 0.1, Knep as 1.2, Kn as 2 and Kp as 1.3 according to previous studies. | 0.5 |
| Load intersection line method |  | h—thickness of roof protection layer, m; L—drift width, m; β—included angle between the load transfer line and the vertical center line of the goaf roof, taken as 30°, 32° and 35°; K—safety factor, taken as 1.2. | 4.32–5.23 |
| Protodyakonov arch method |  | Hy—thickness of the roof protection layer, m; b—half the width of the drift, m; h—maximum height of the pit, m; φ—angle of internal friction of the rock, °; f—Protodyakonov coefficient of the rock; | 1.0 |
| Limit equilibrium theory |  | h—thickness of the roof protection layer, m; σt—tensile strength of the ore body, MPa; a—length of the drift, m; b—width of the drift, m. | 0.8 |
| Lithology | Elastic Modulus (GPa) | Bulk Modulus (GPa) | Poisson’s Ratio | Internal Friction Angle (°) | Density (g/cm3) | Compressive Strength (MPa) | Tensile Strength (MPa) | Cohesive Force (MPa) |
|---|---|---|---|---|---|---|---|---|
| Marble (Surrounding rock of hanging wall) | 11.64 | 8.43 | 0.27 | 47 | 2.663 | 7.86 | 0.7 | 1.2 |
| Slate (Surrounding rock of foot wall) | 18.81 | 10.81 | 0.21 | 49 | 2.77 | 17.02 | 0.9 | 1.5 |
| Ore body | 21.26 | 11.43 | 0.19 | 50 | 3.565 | 25.33 | 2 | 1.8 |
| Proportioning | Bulk Modulus /MPa | Shear Modulus/MPa | Poisson’s Ratio | Internal Friction Angle /° | Density/g/cm3 | Compressive Strength /MPa | Tensile Strength/MPa | Cohesive Force/KPa |
|---|---|---|---|---|---|---|---|---|
| 1:10 | 80.9 | 58.2 | 0.21 | 36.9 | 1.82 | 1.07 | 0.1 | 143 |
| Scheme A | The thickness of roof protection layer is 0.5 m and strip-by-strip extraction is adopted |  |
| Scheme B | The thickness of roof protection layer is 0.5 m and spaced extraction is adopted | |
| Scheme C | The thickness of roof protection layer is 1.0 m and strip-by-strip extraction is adopted |  |
| Scheme D | The thickness of roof protection layer is 1.0 m and spaced extraction is adopted | |
| Scheme E | The thickness of roof protection layer is 1.5 m and strip-by-strip extraction is adopted |  |
| Scheme F | The thickness of roof protection layer is 1.5 m and spaced extraction is adopted |
| Excavation Stage 1 (Drifts 1, 8 and 15 of Scheme C; and Drifts 1, 3 and 5 of Scheme D) | Backfill Stage 1 (Drifts 1, 8 and 15 of Scheme C; and Drifts 1, 3 and 5 of Scheme D) | Excavation Stage 2 (Drifts 2, 9 and 16 of Scheme C; and Drifts 7, 9 and 11 of Scheme D) | Backfill Stage 2 (Drifts 2, 9 and 16 of Scheme C; and Drifts 7, 9 and 11 of Scheme D) | ||
|---|---|---|---|---|---|
| Scheme C | Distribution diagram of plastic zones in the roof protection layer observed from top to bottom | 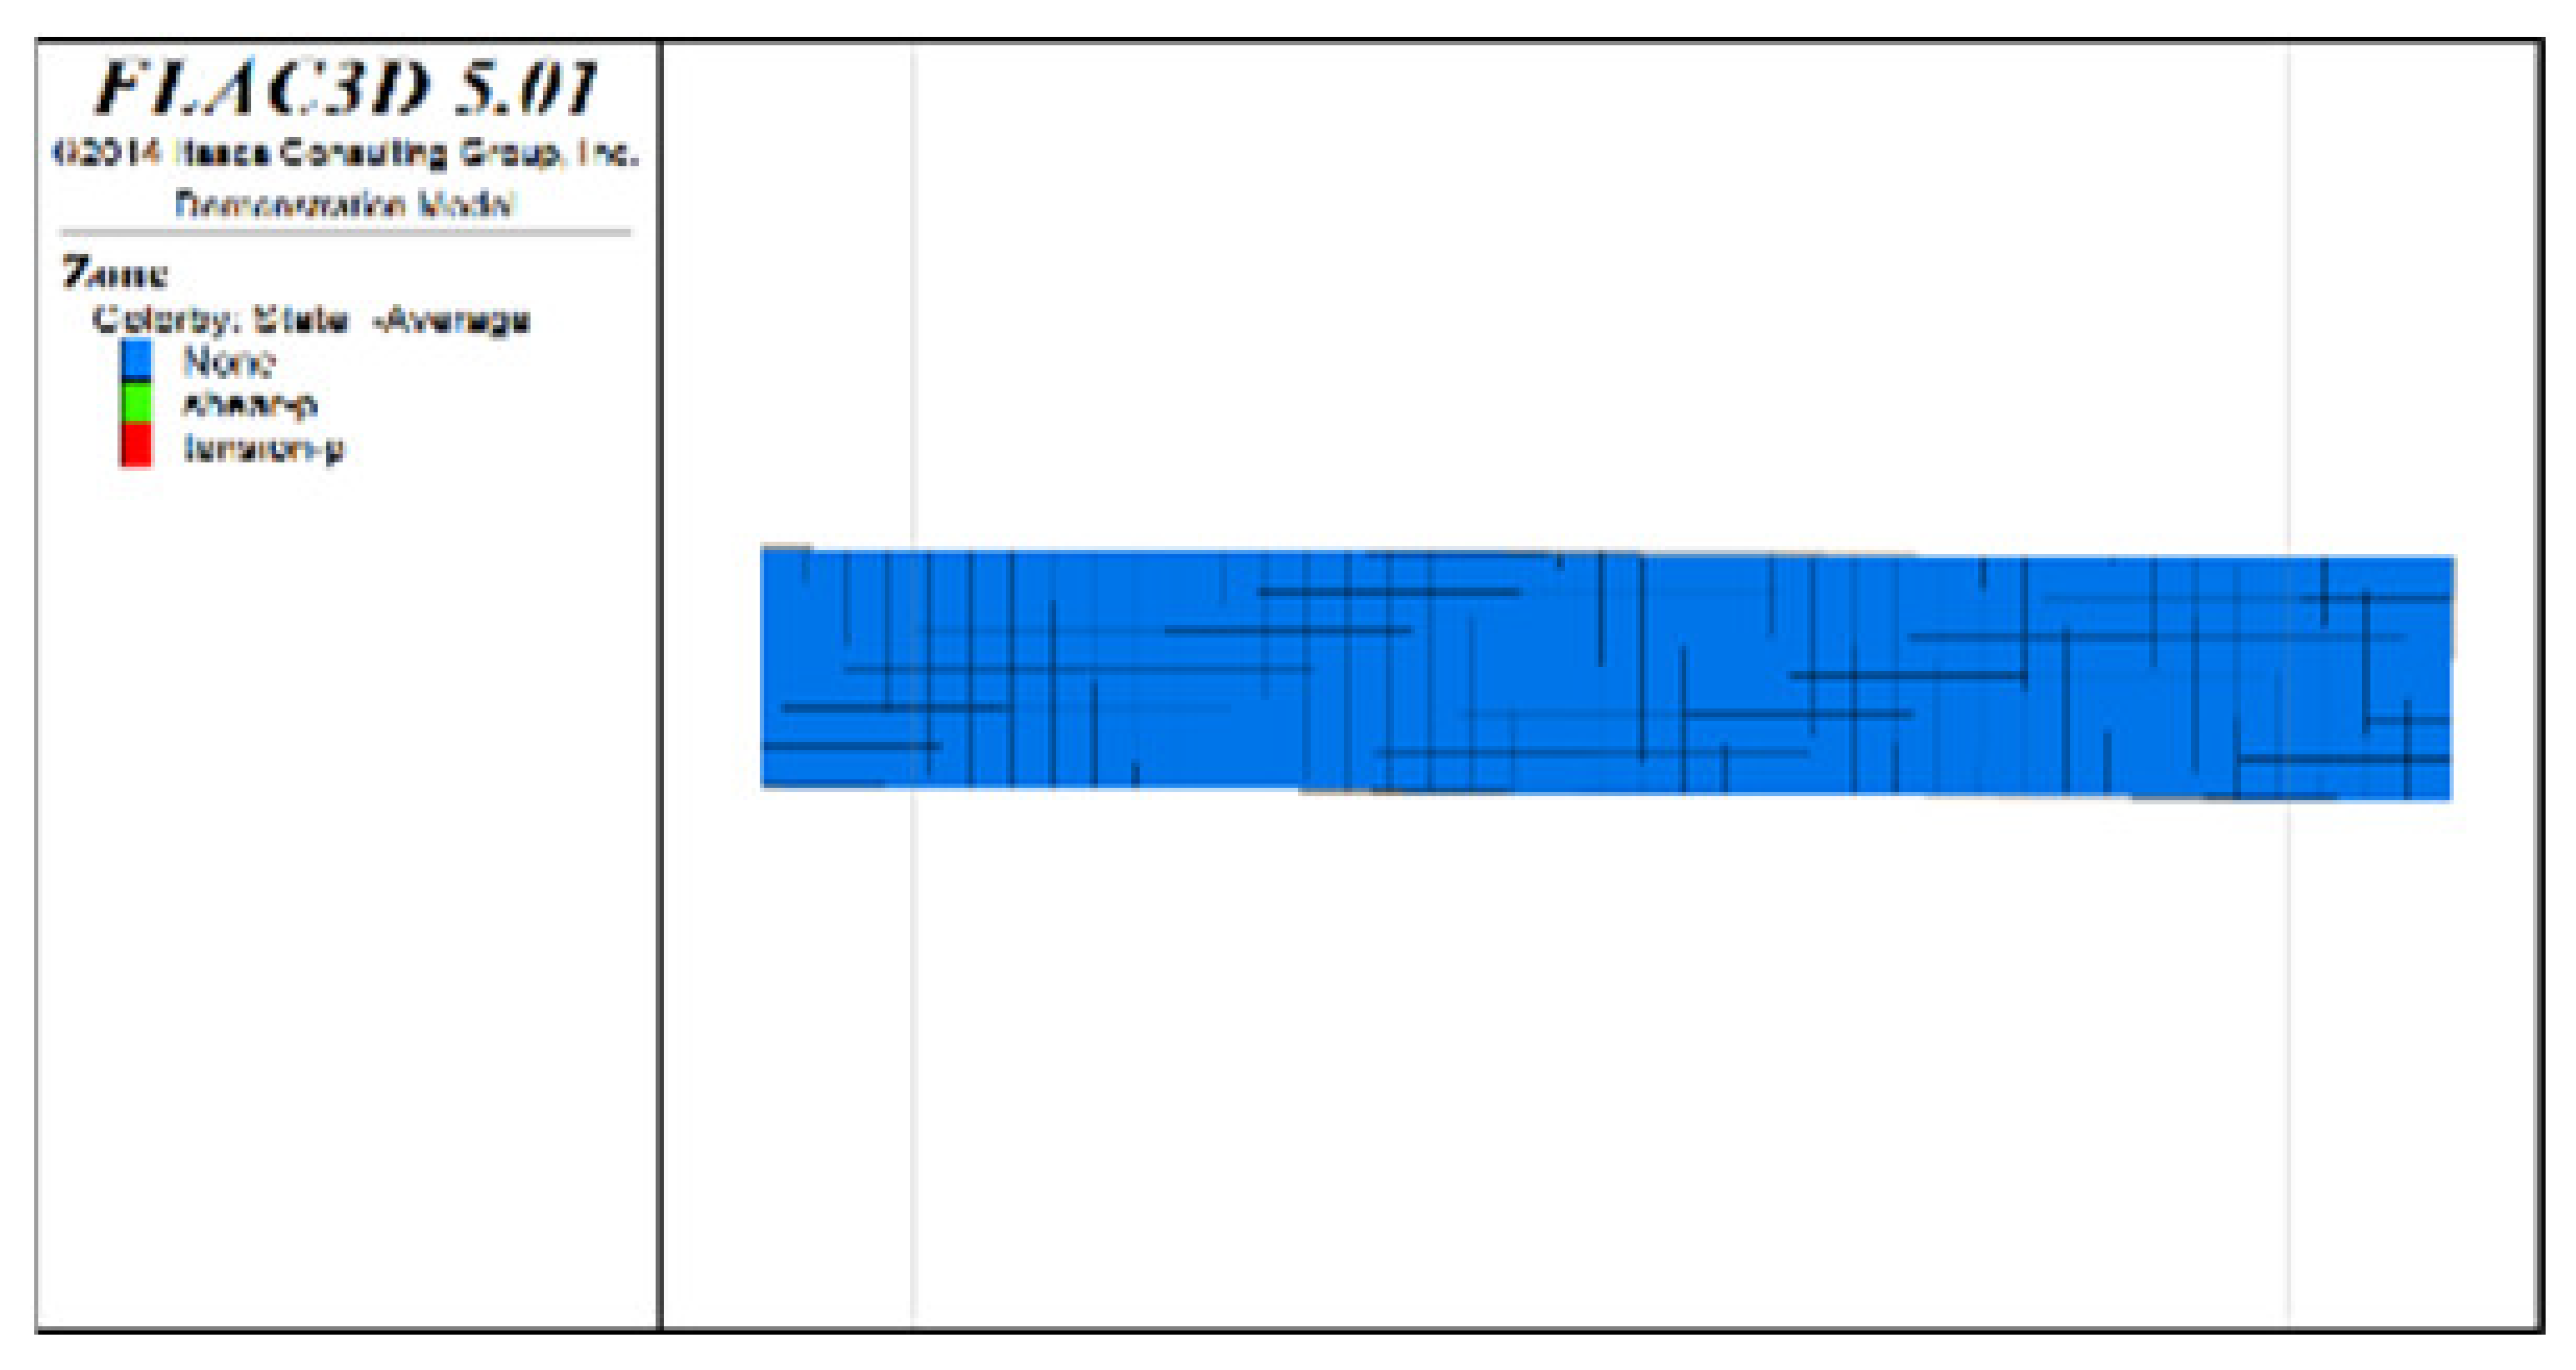 | 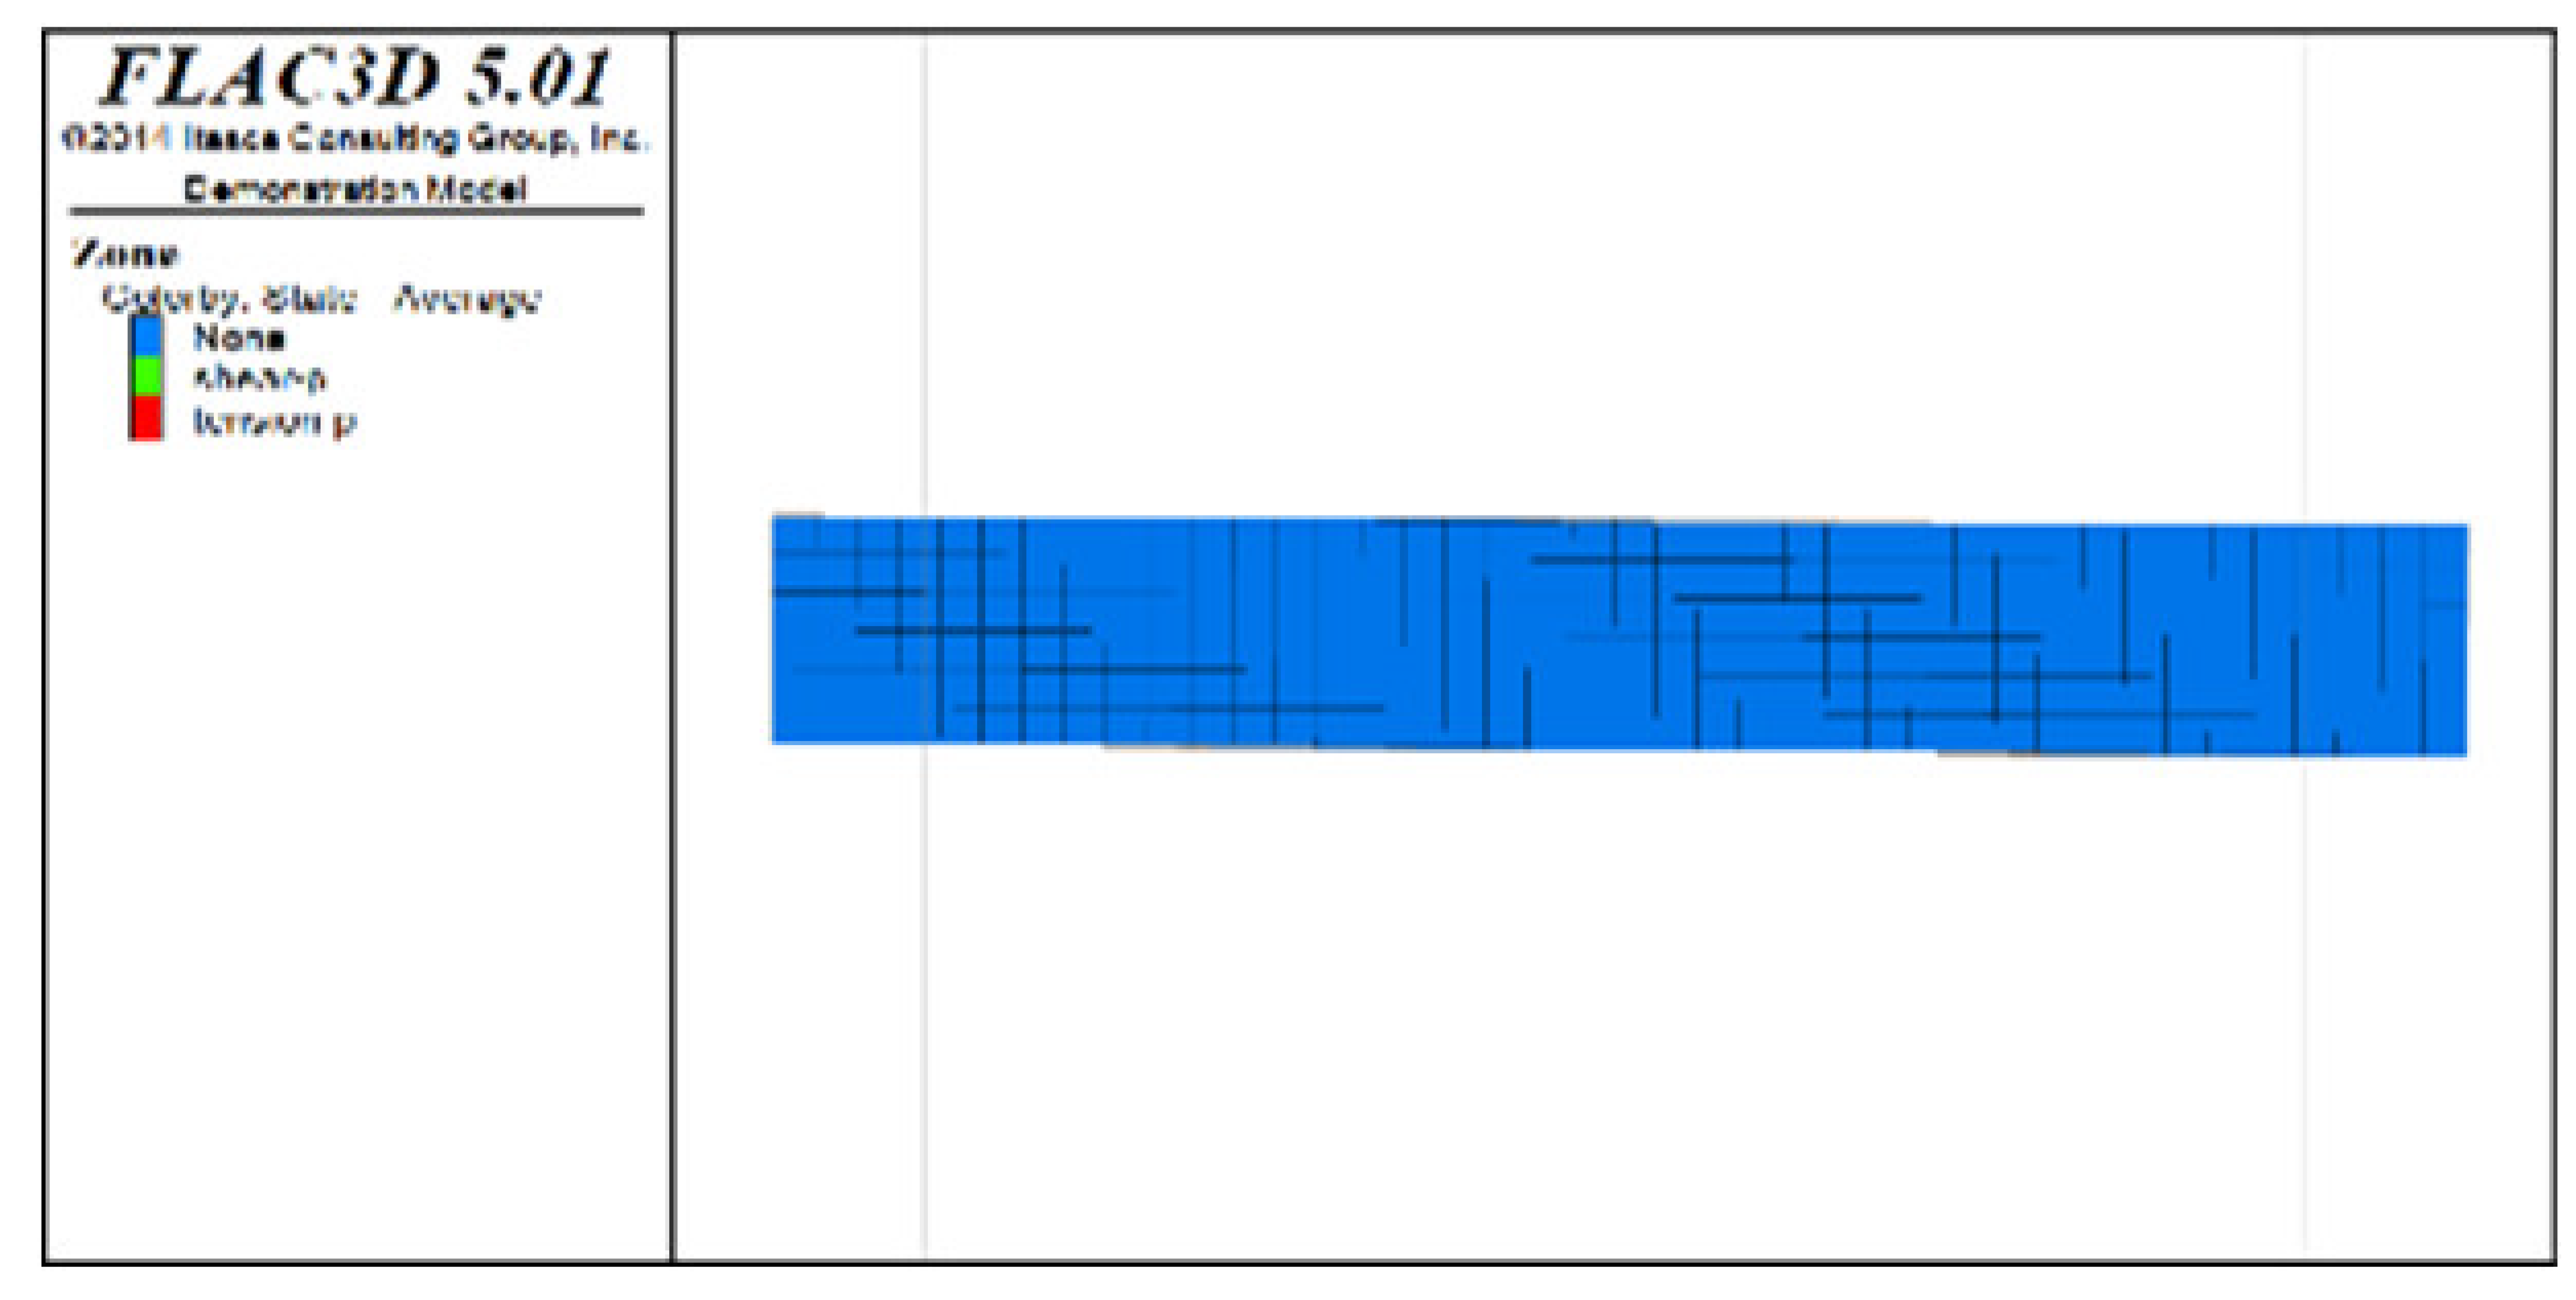 | 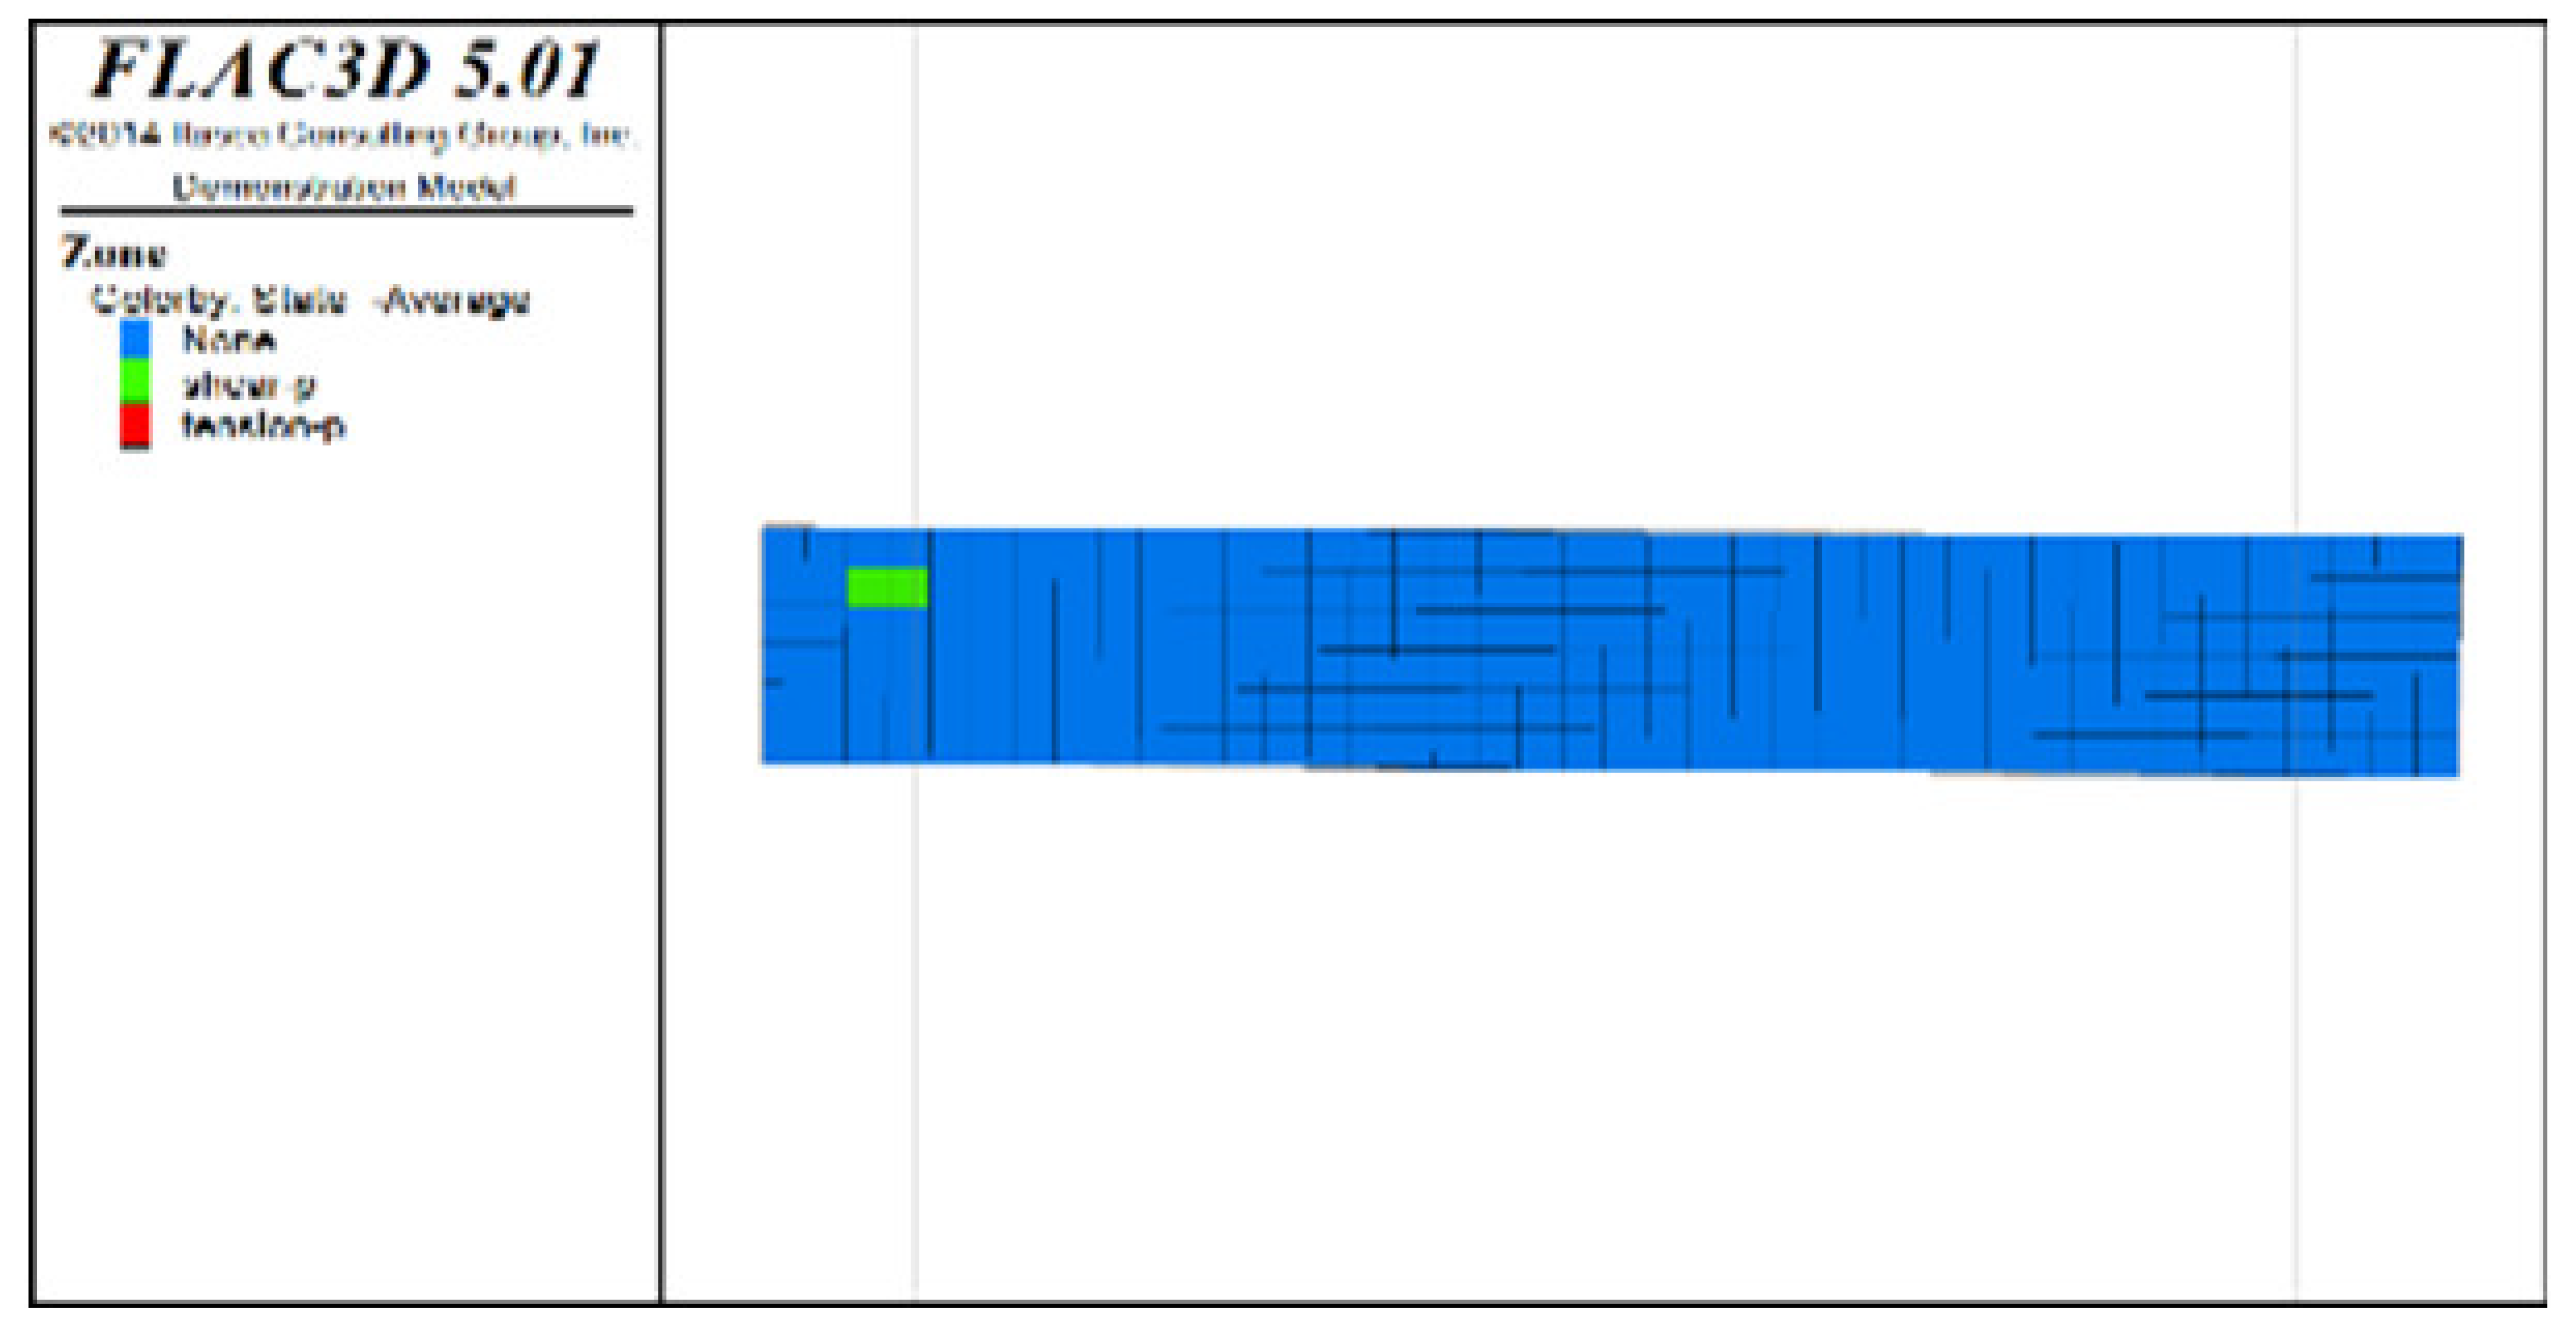 |  |
| Distribution diagram of plastic zones in the roof protection layer observed from bottom to top | 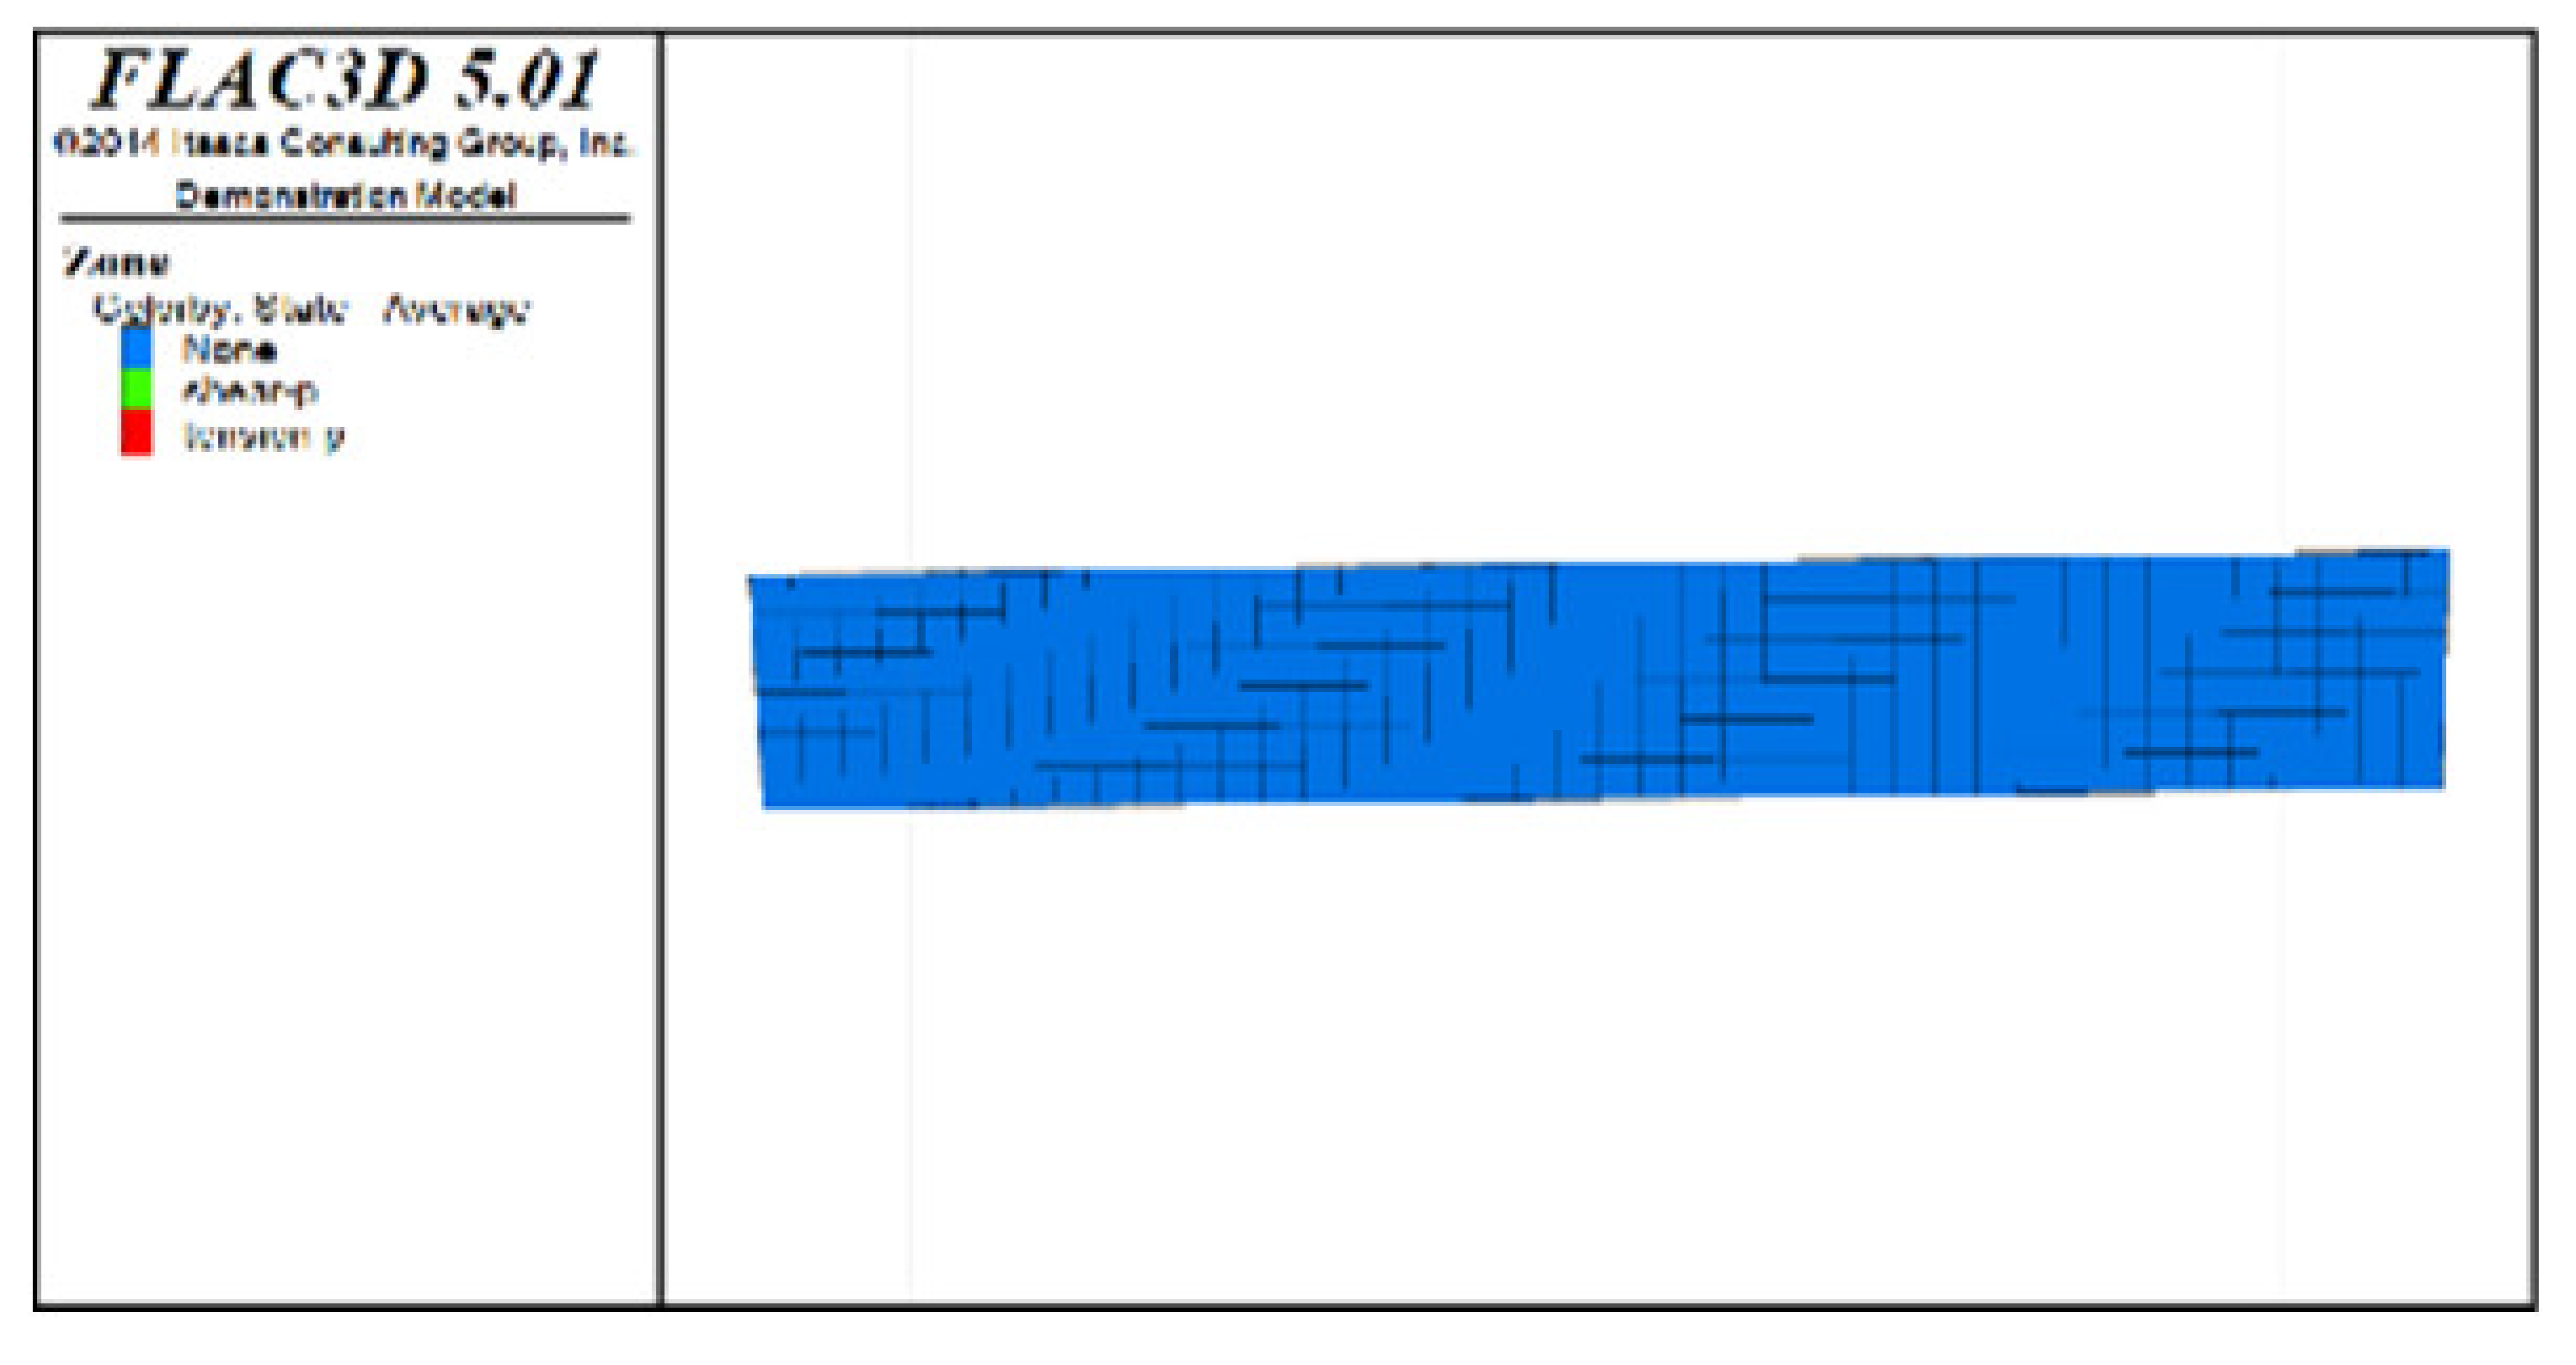 | 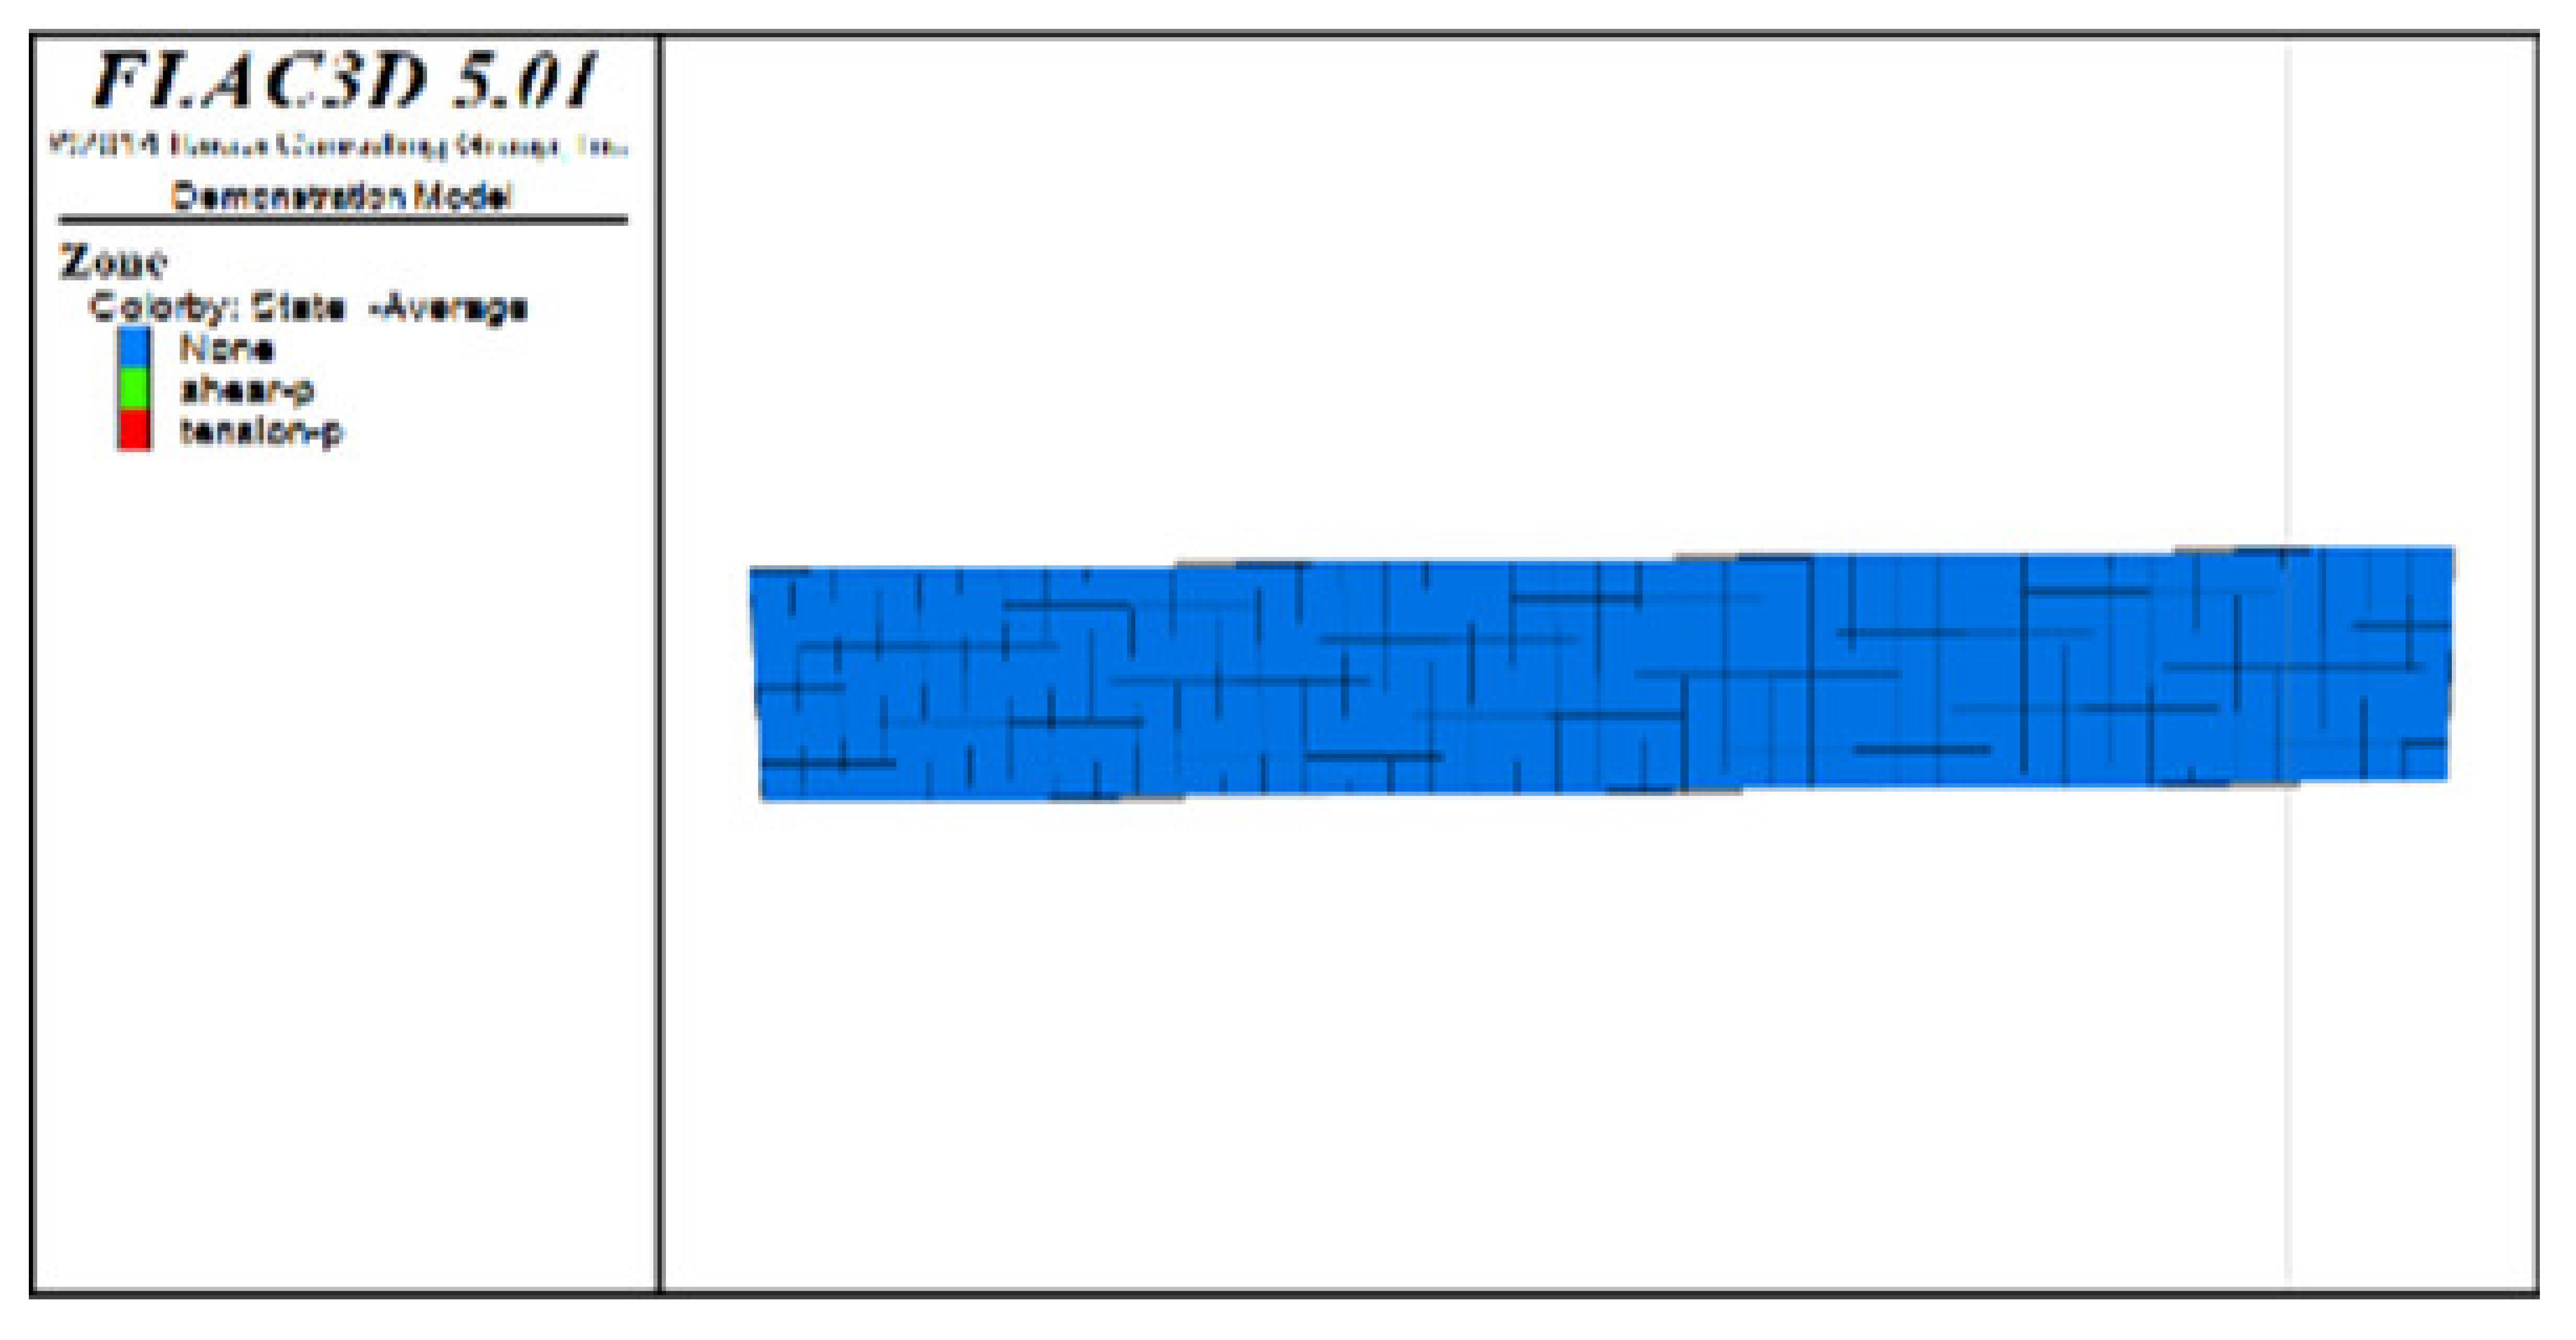 | 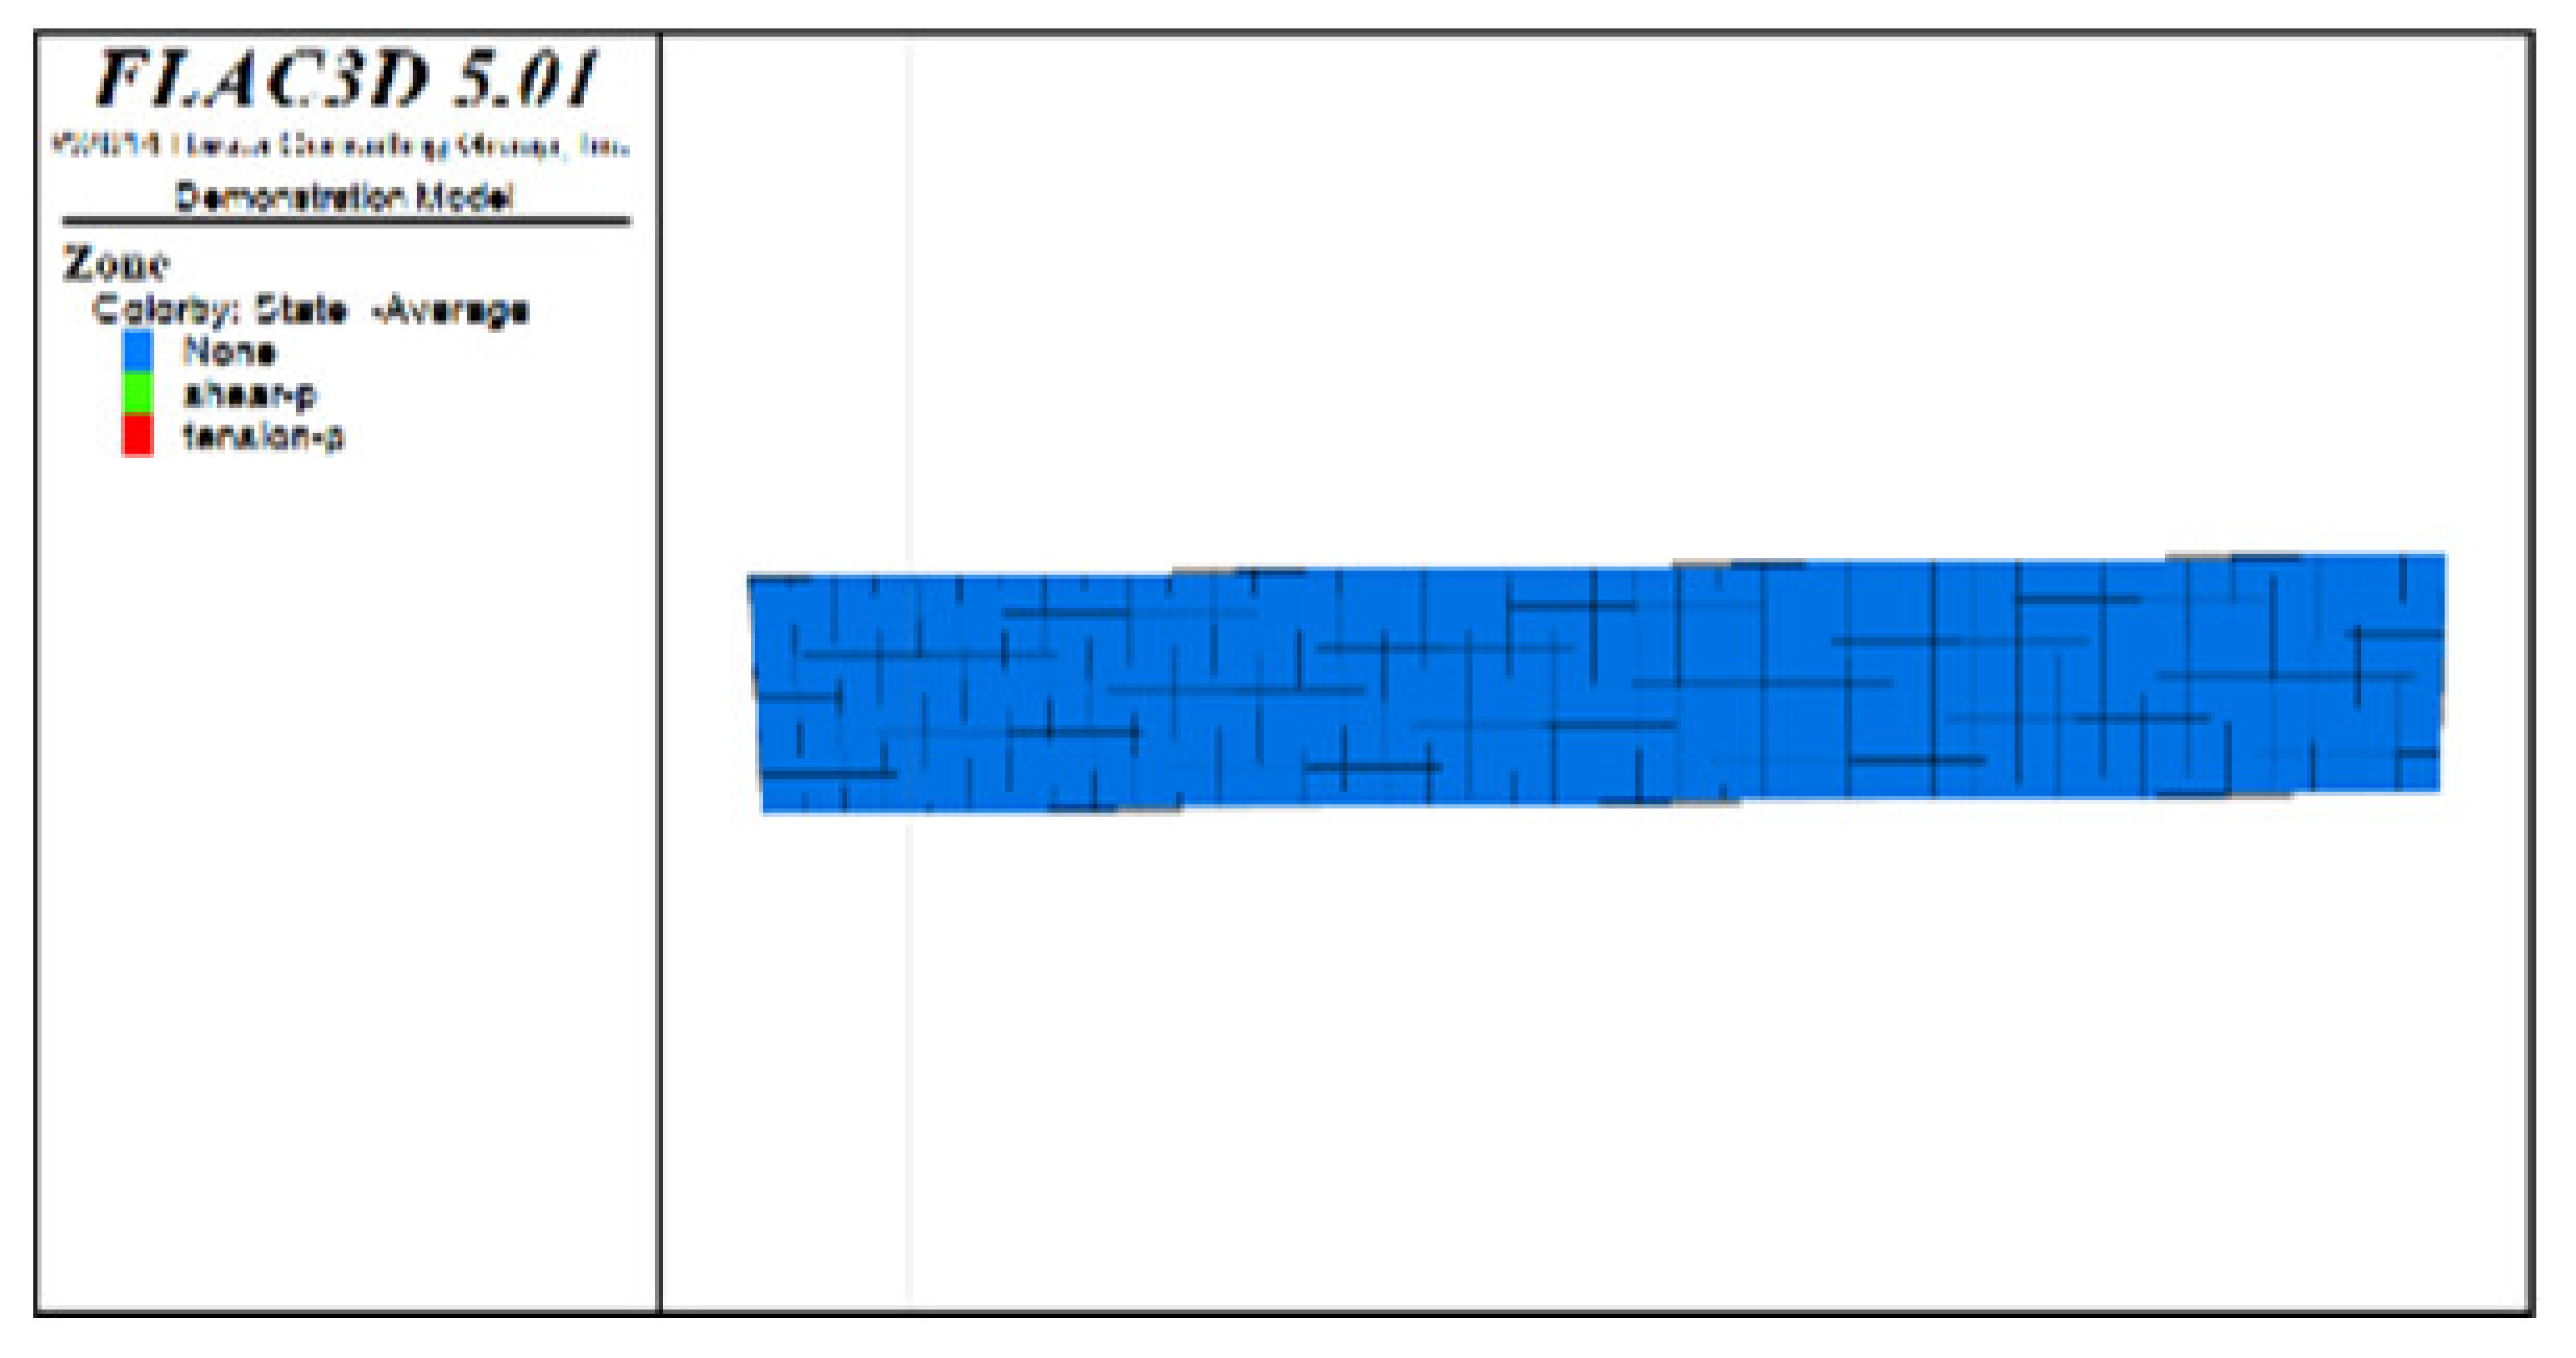 | 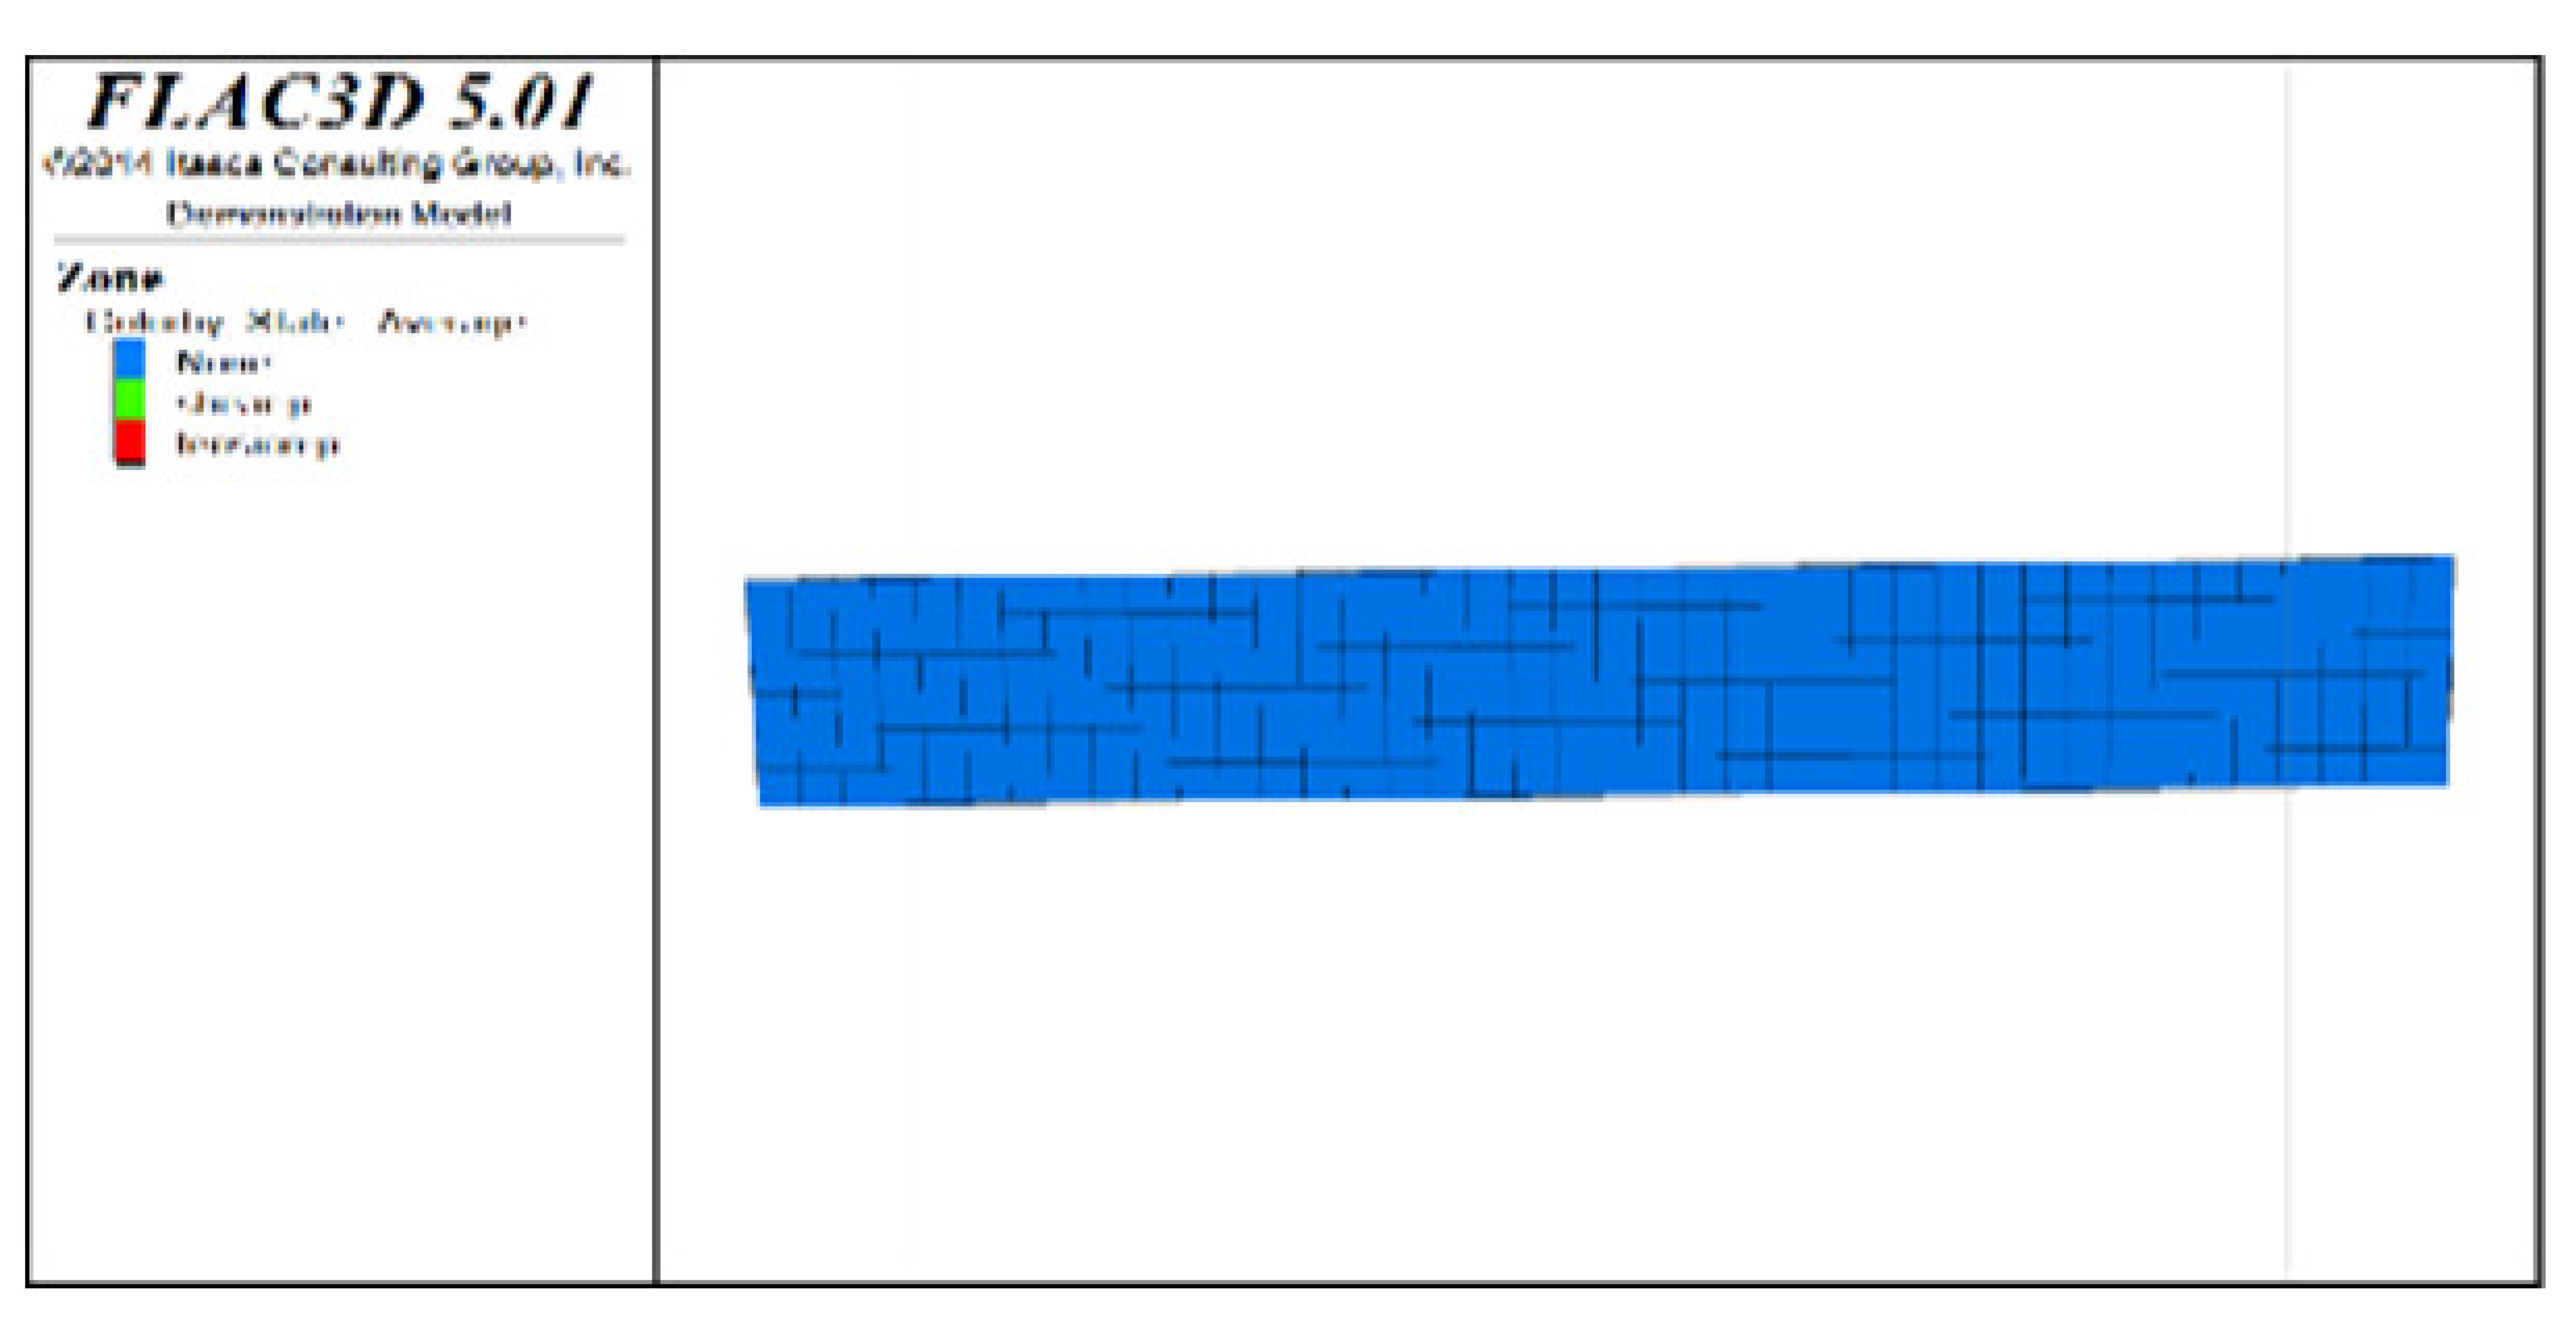 | |
| Scheme D | Distribution diagram of plastic zones in the roof protection layer observed from top to bottom |  |  | 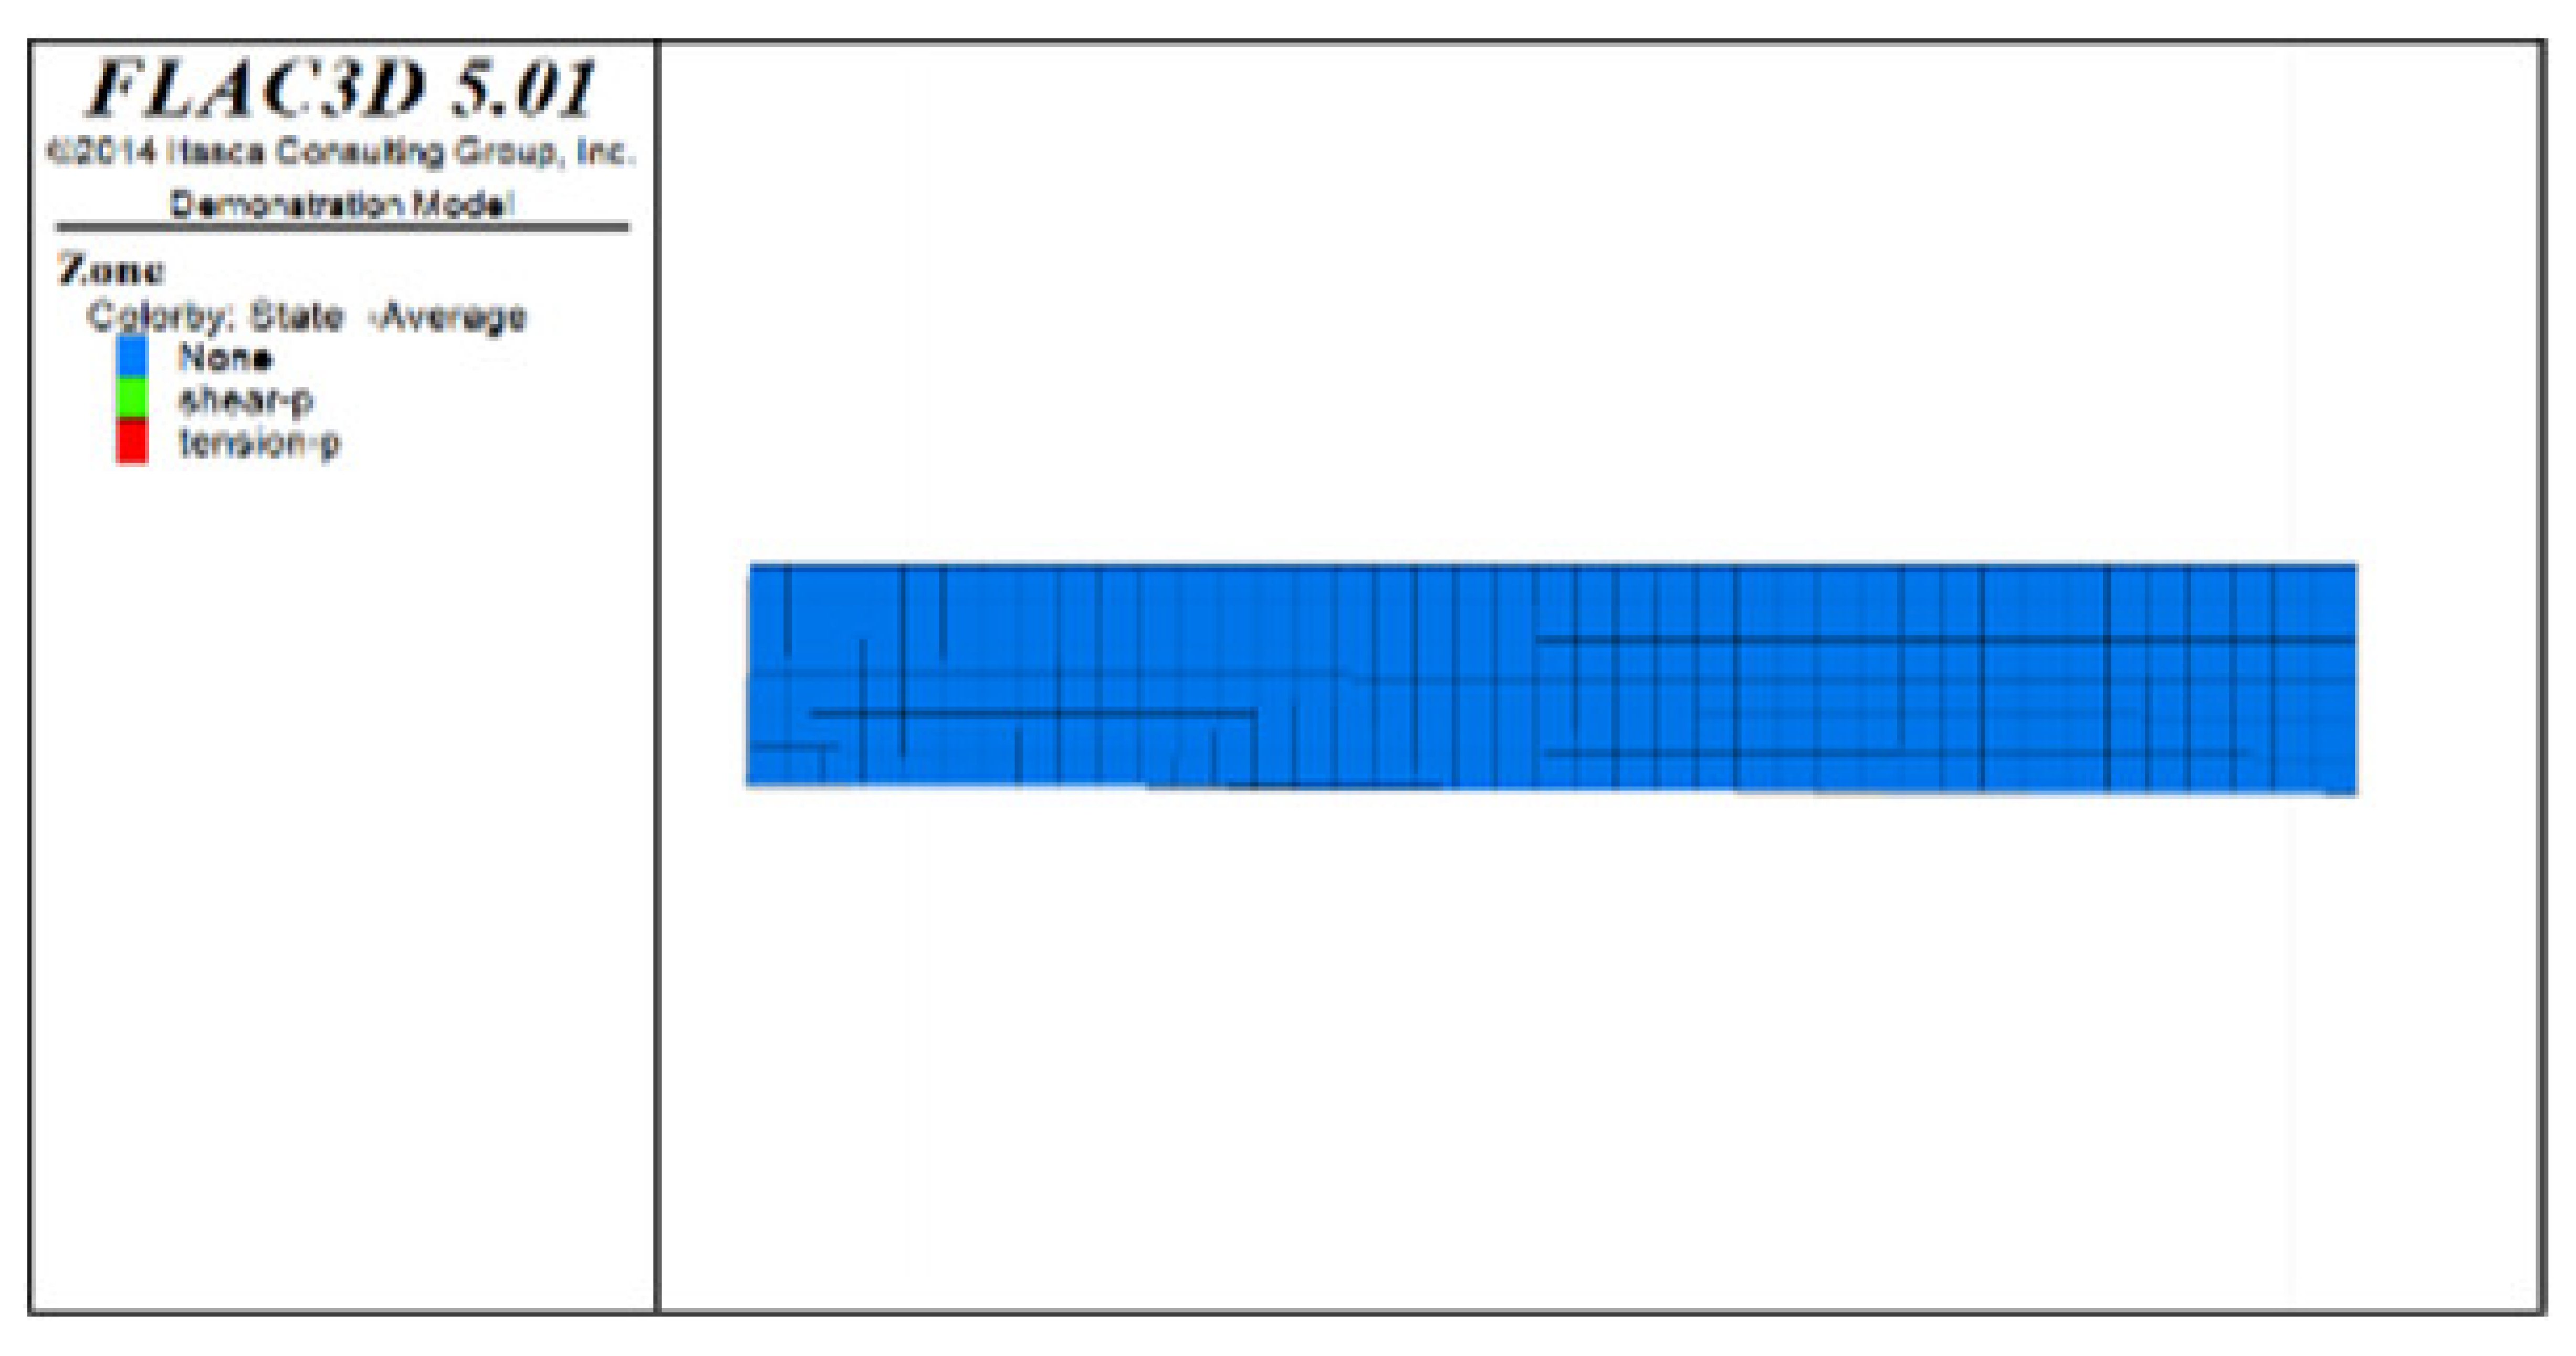 | 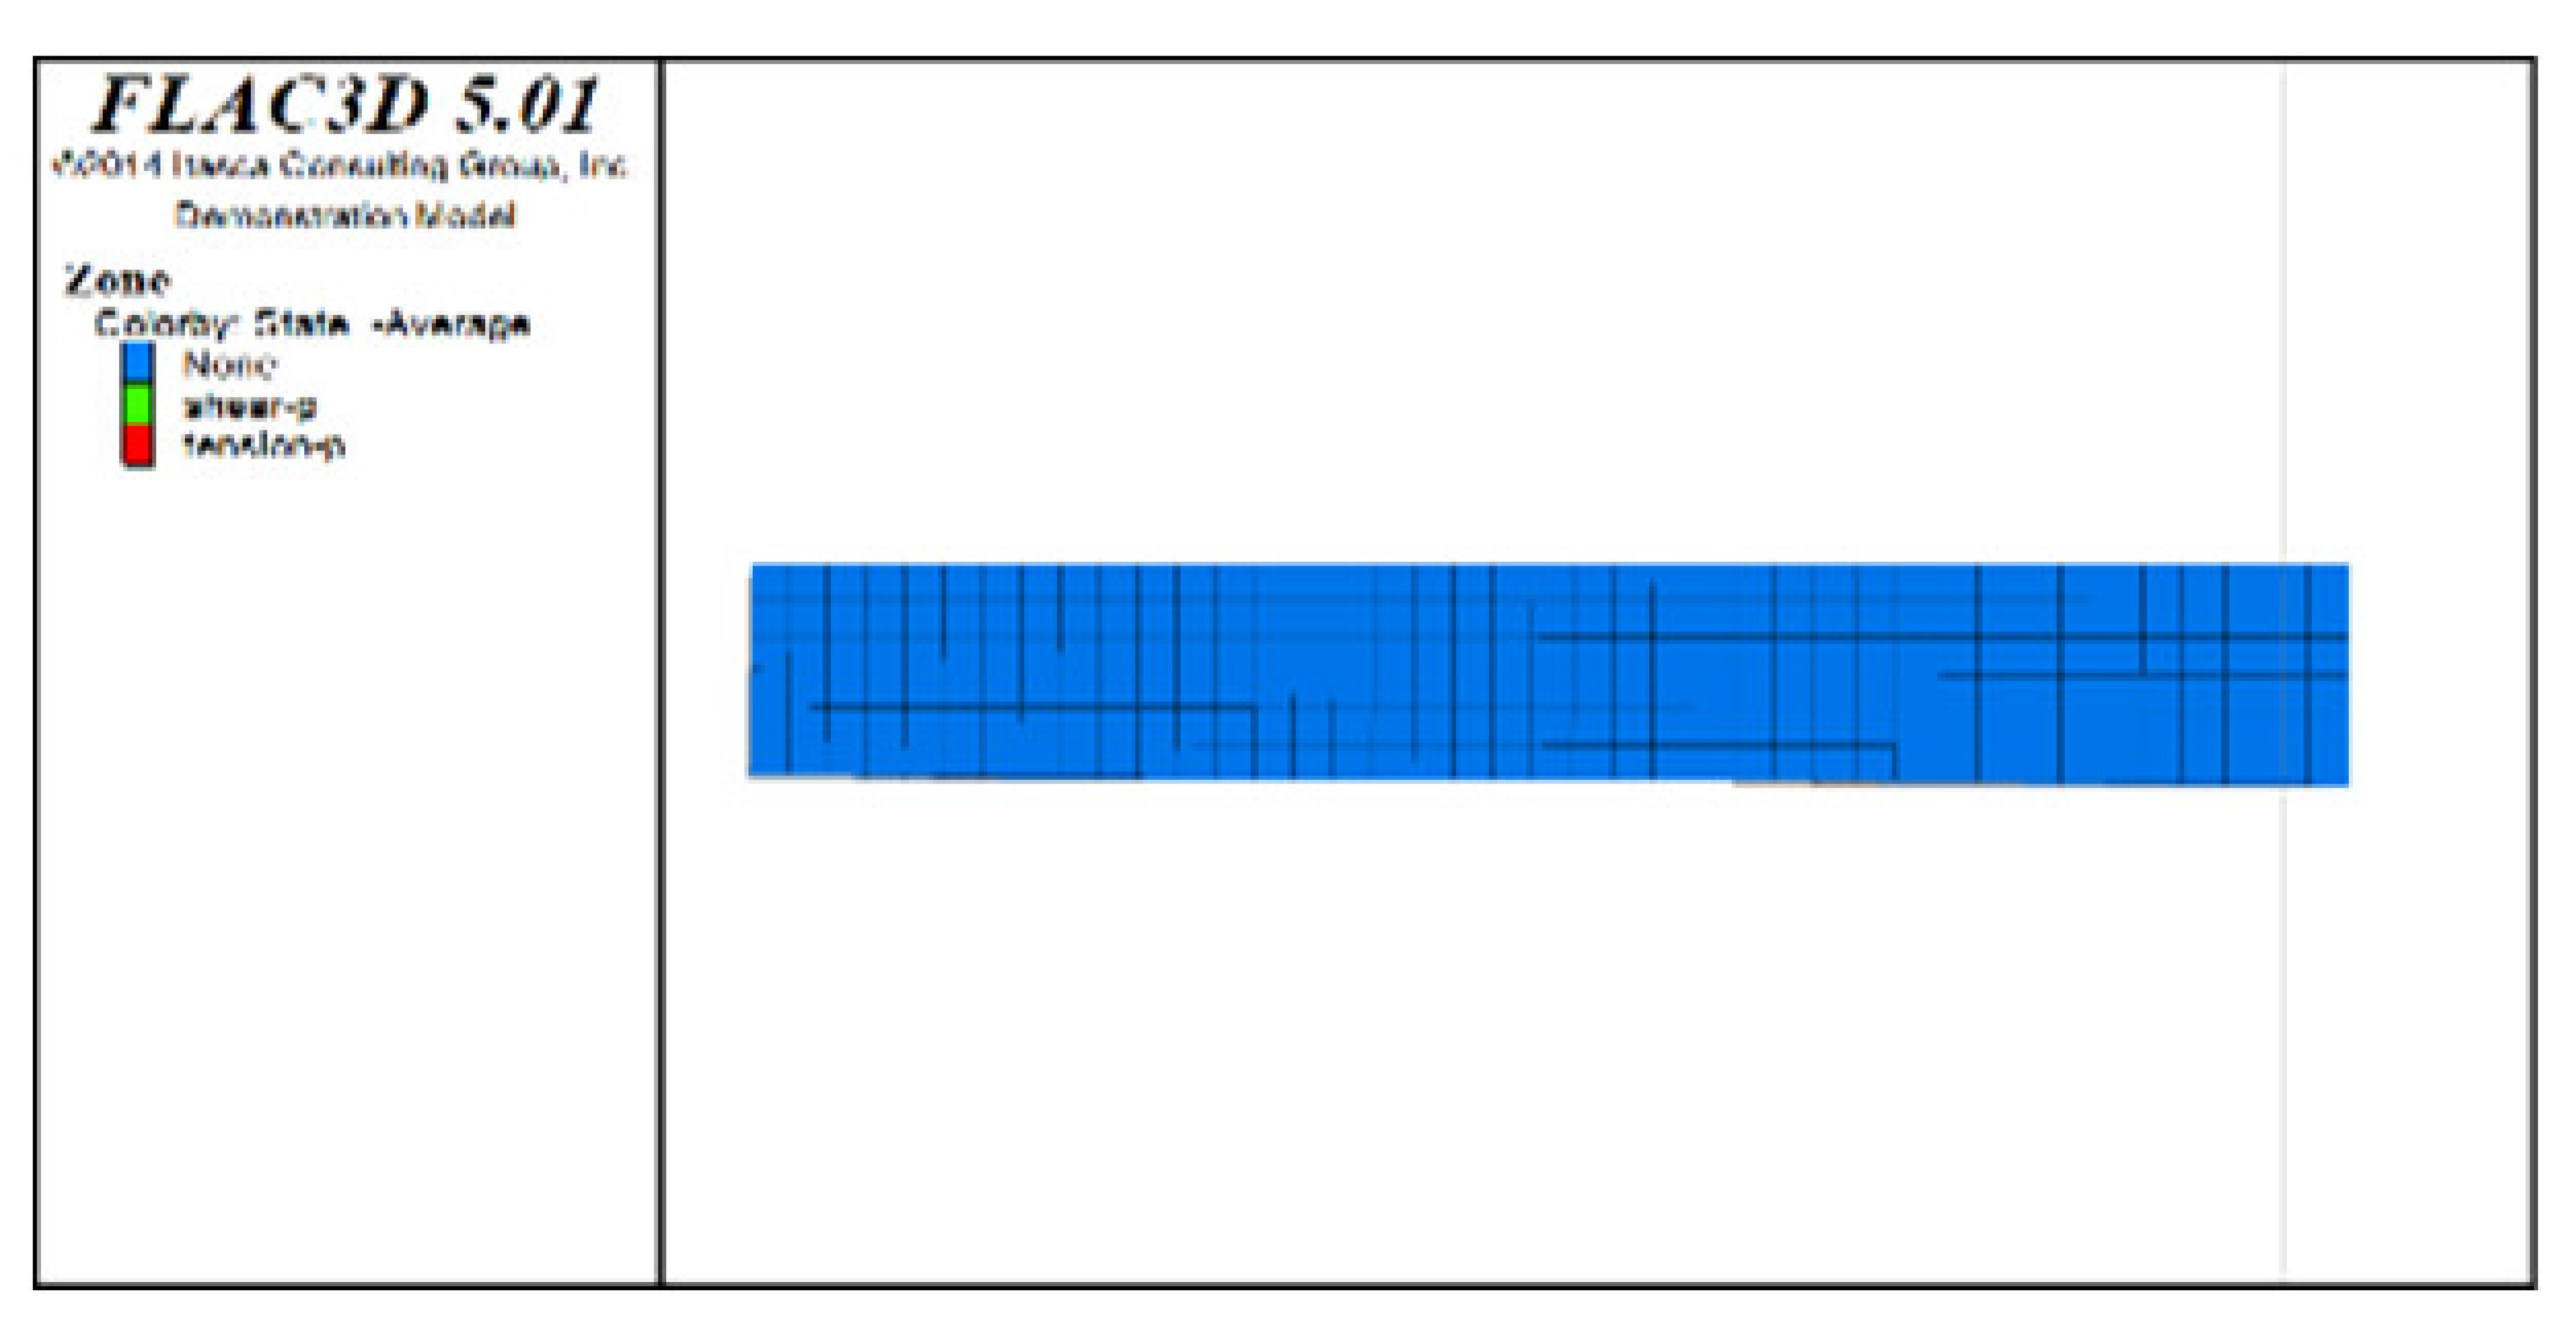 |
| Distribution diagram of plastic zones in the roof protection layer observed from bottom to top | 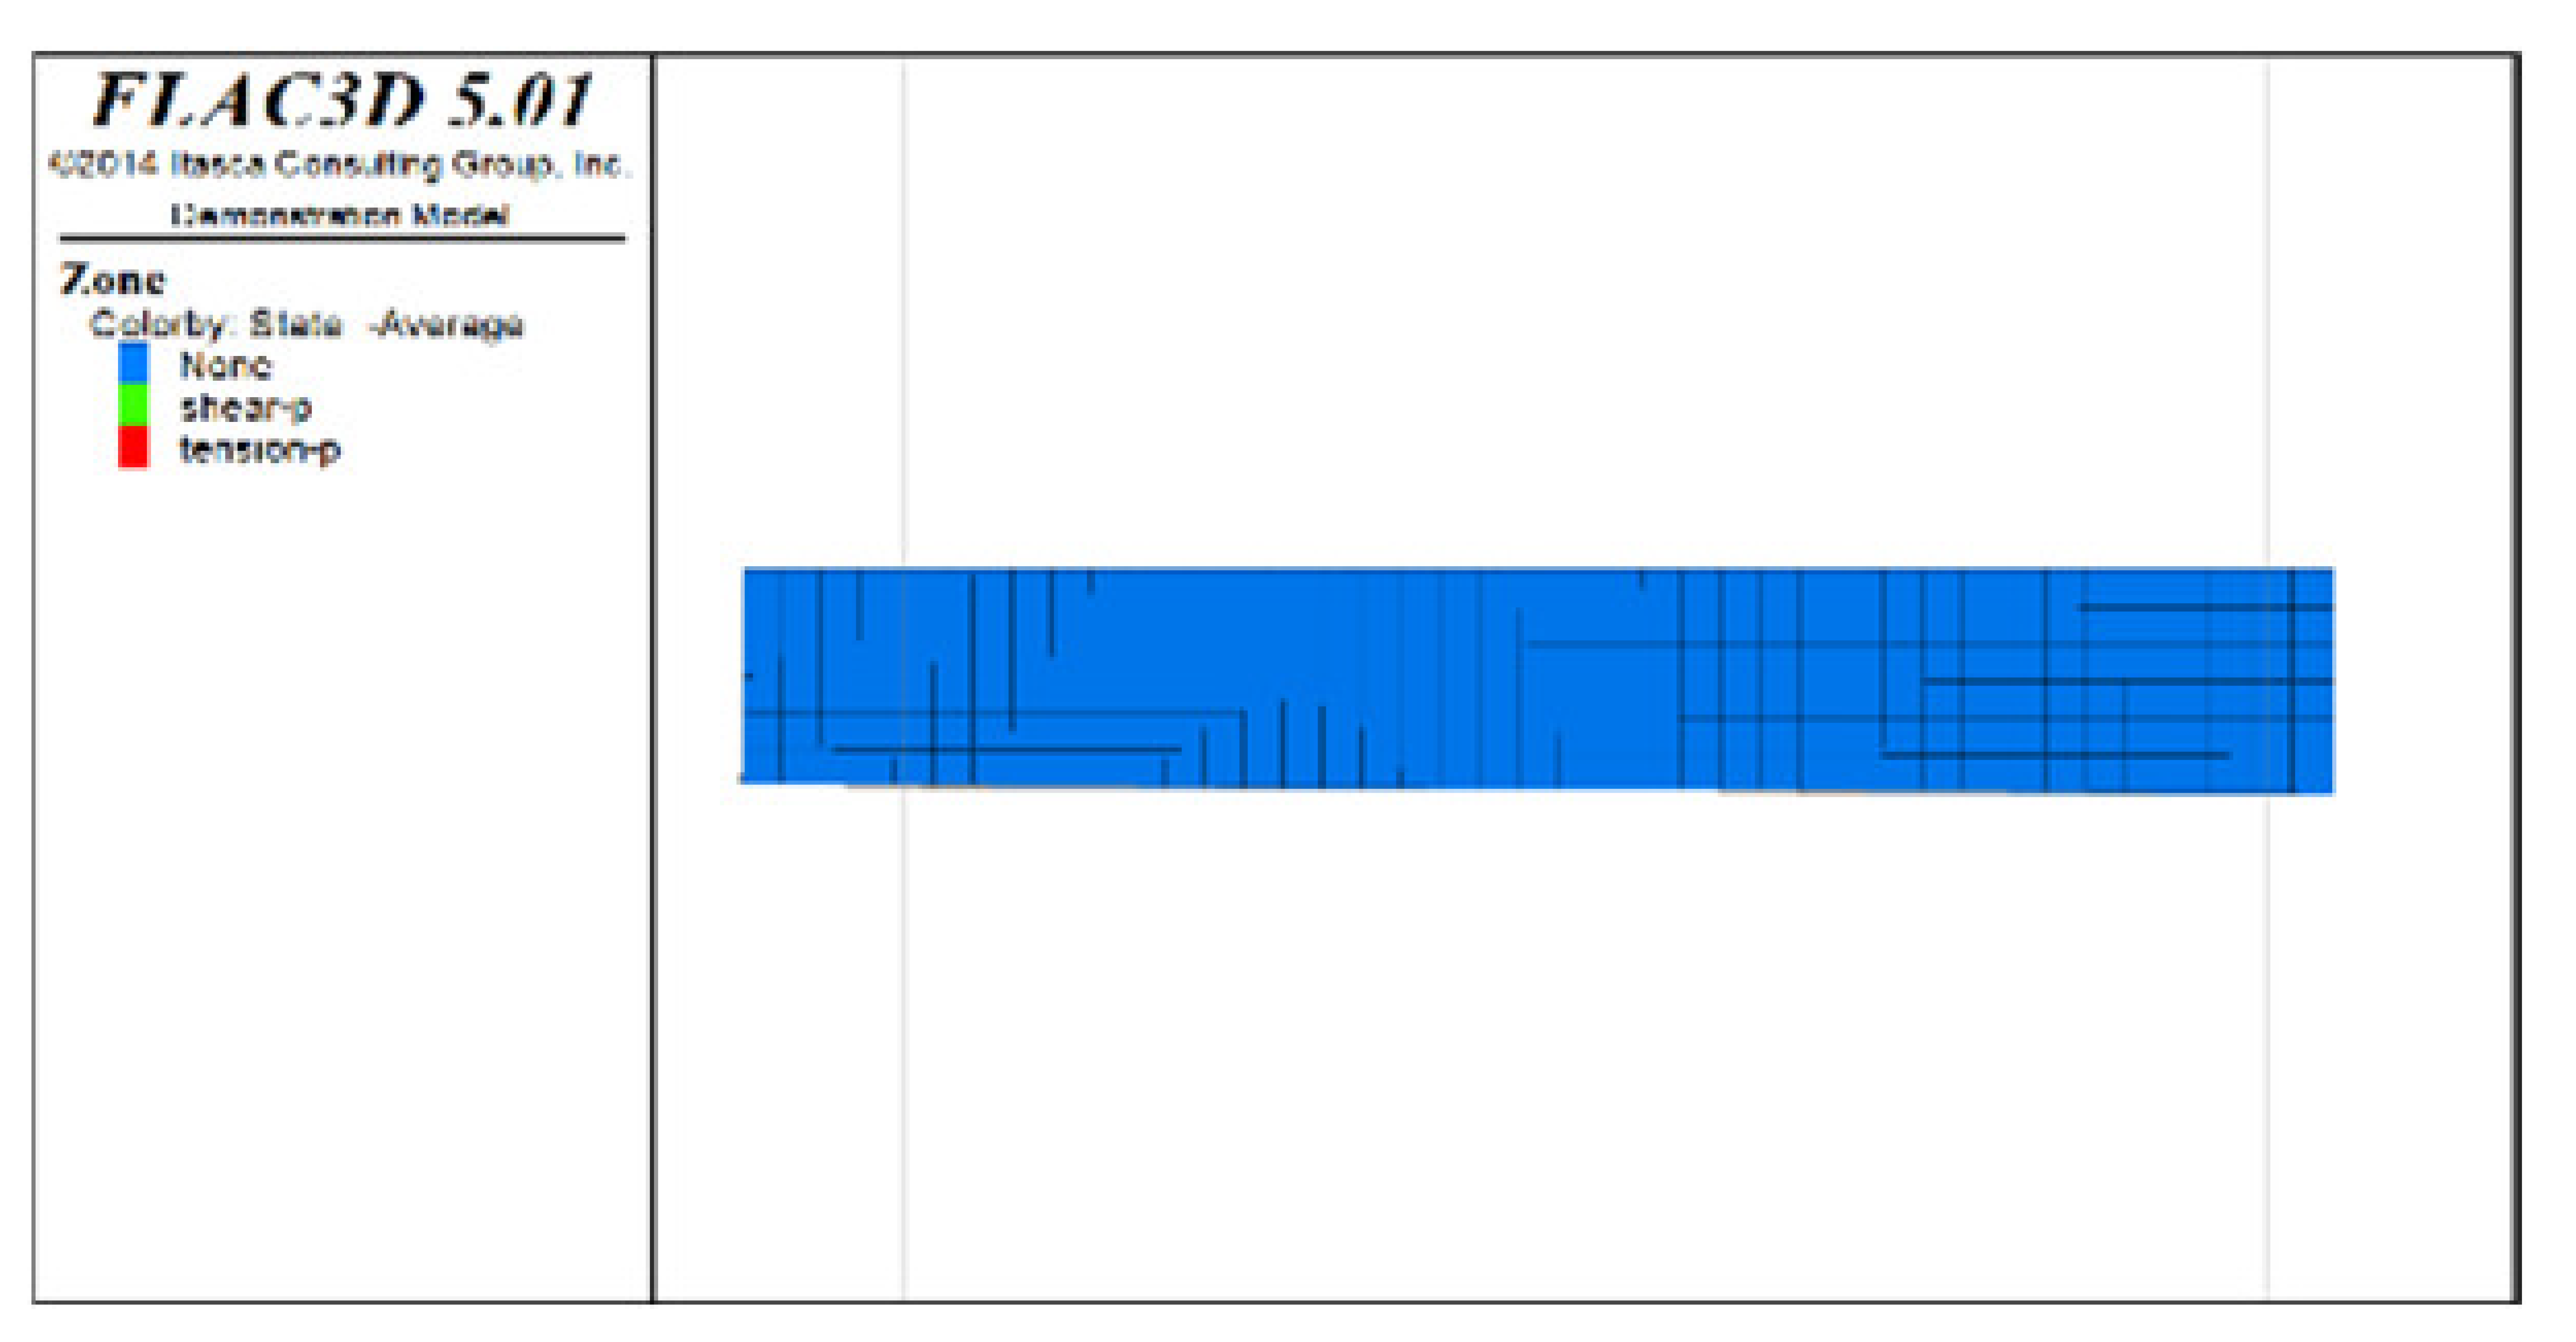 | 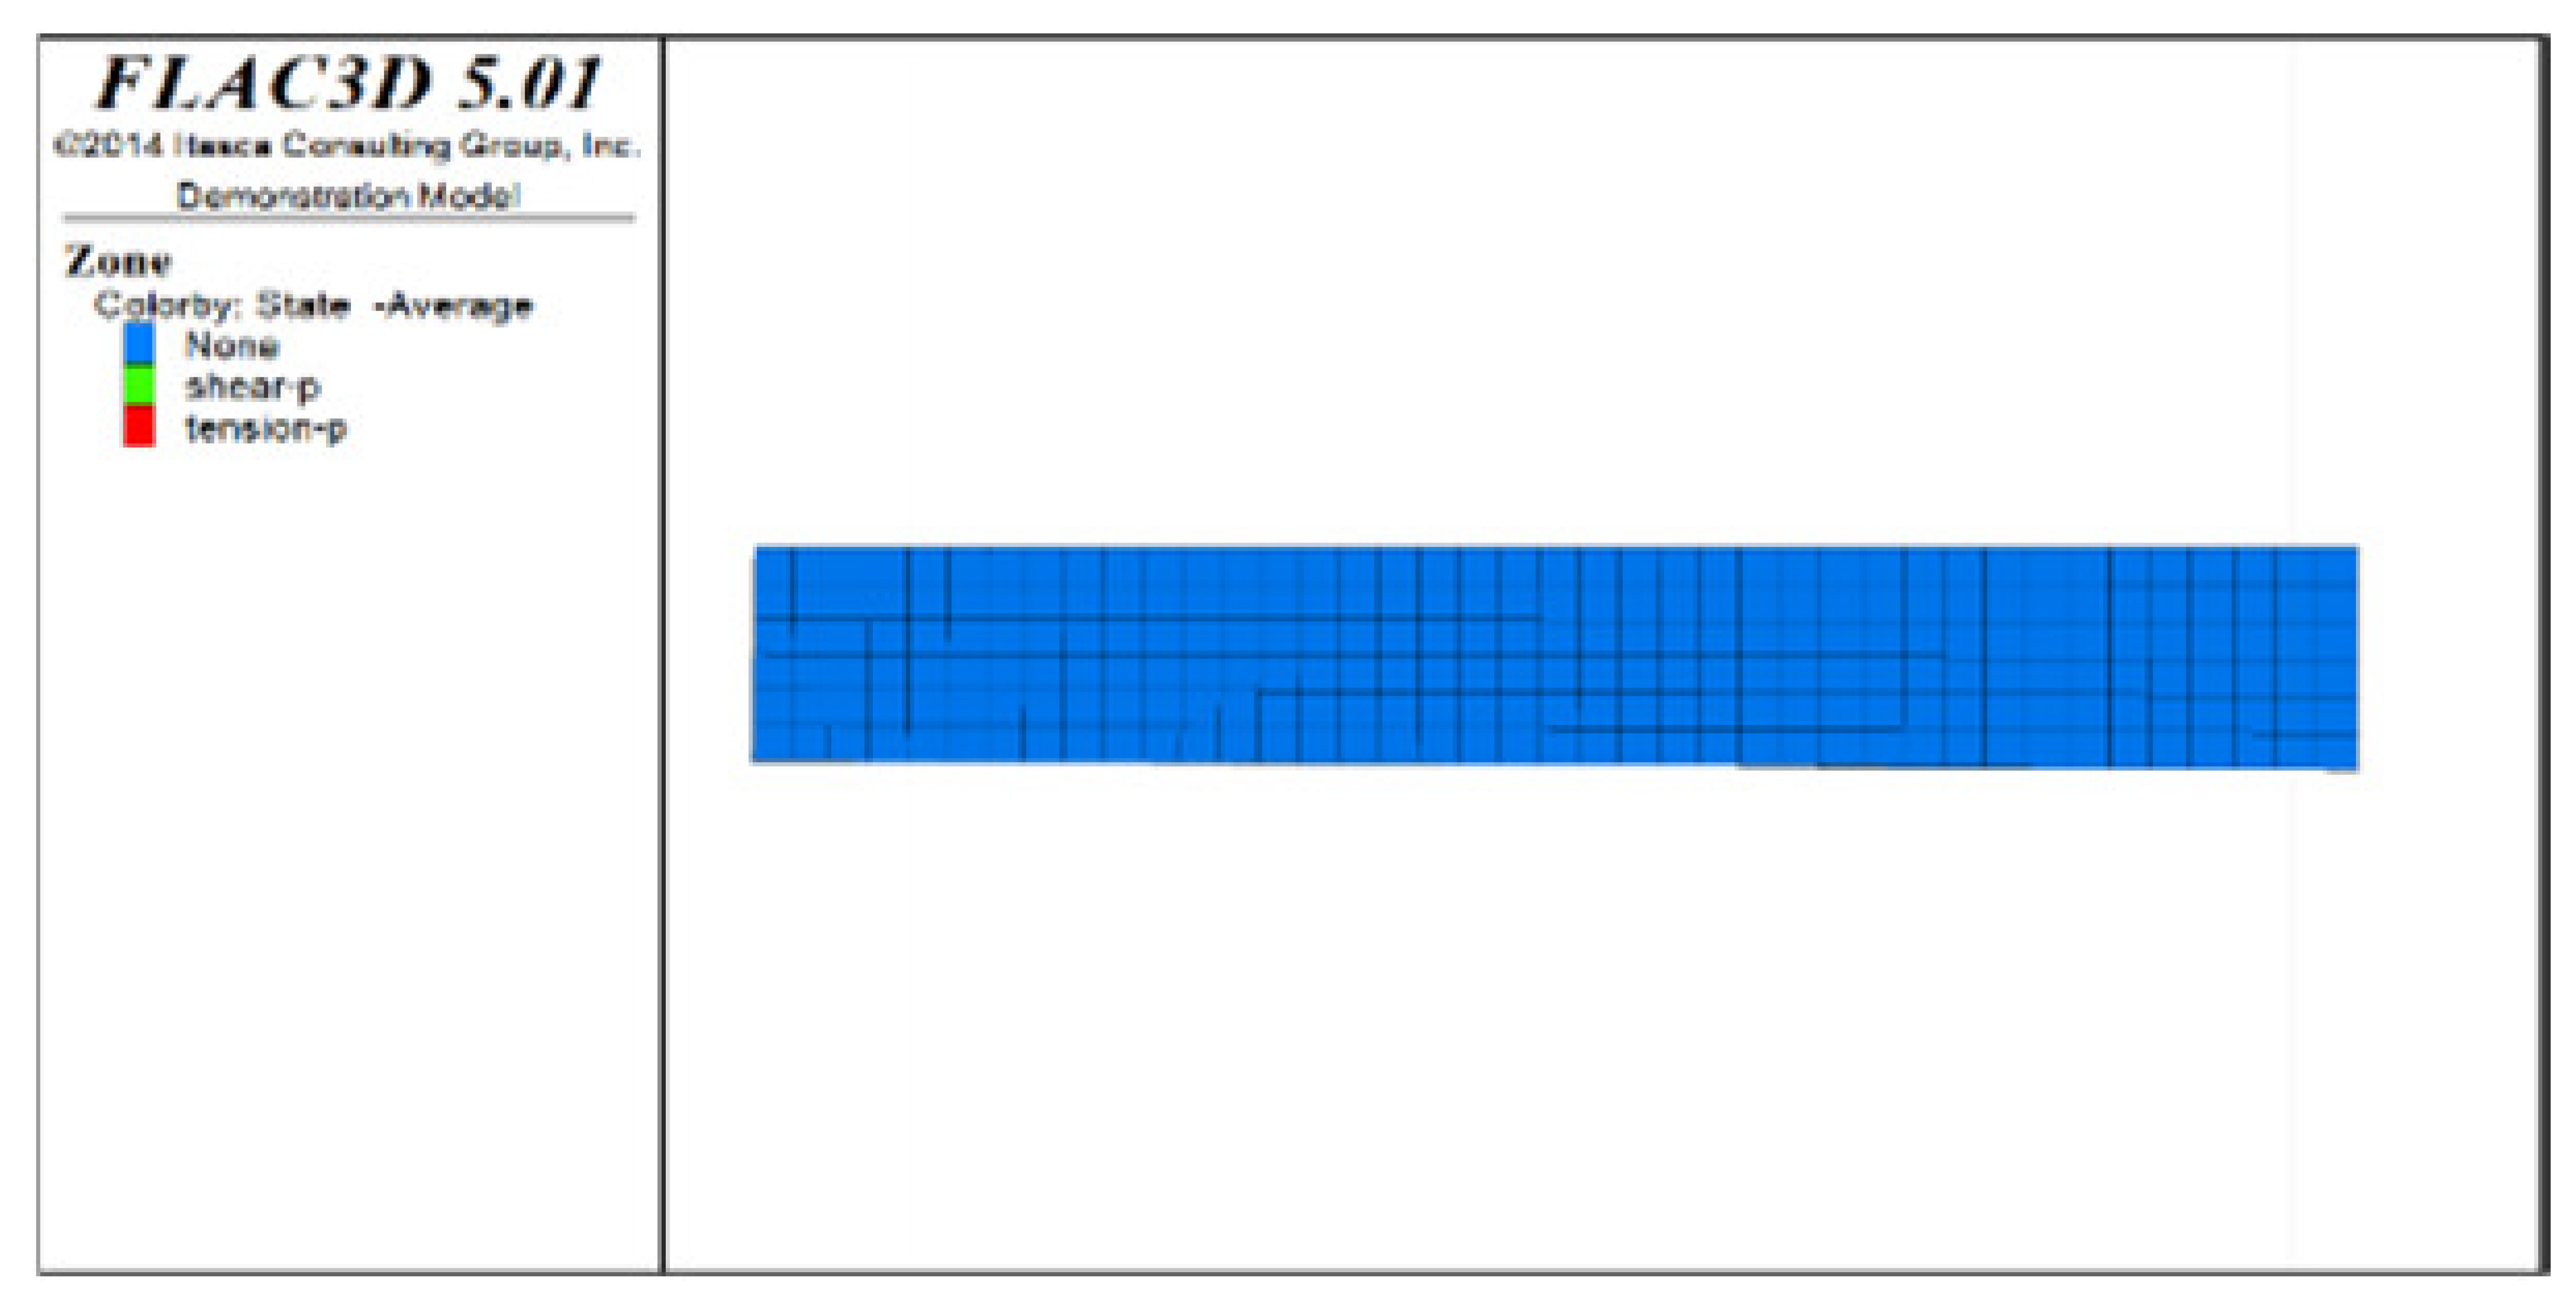 | 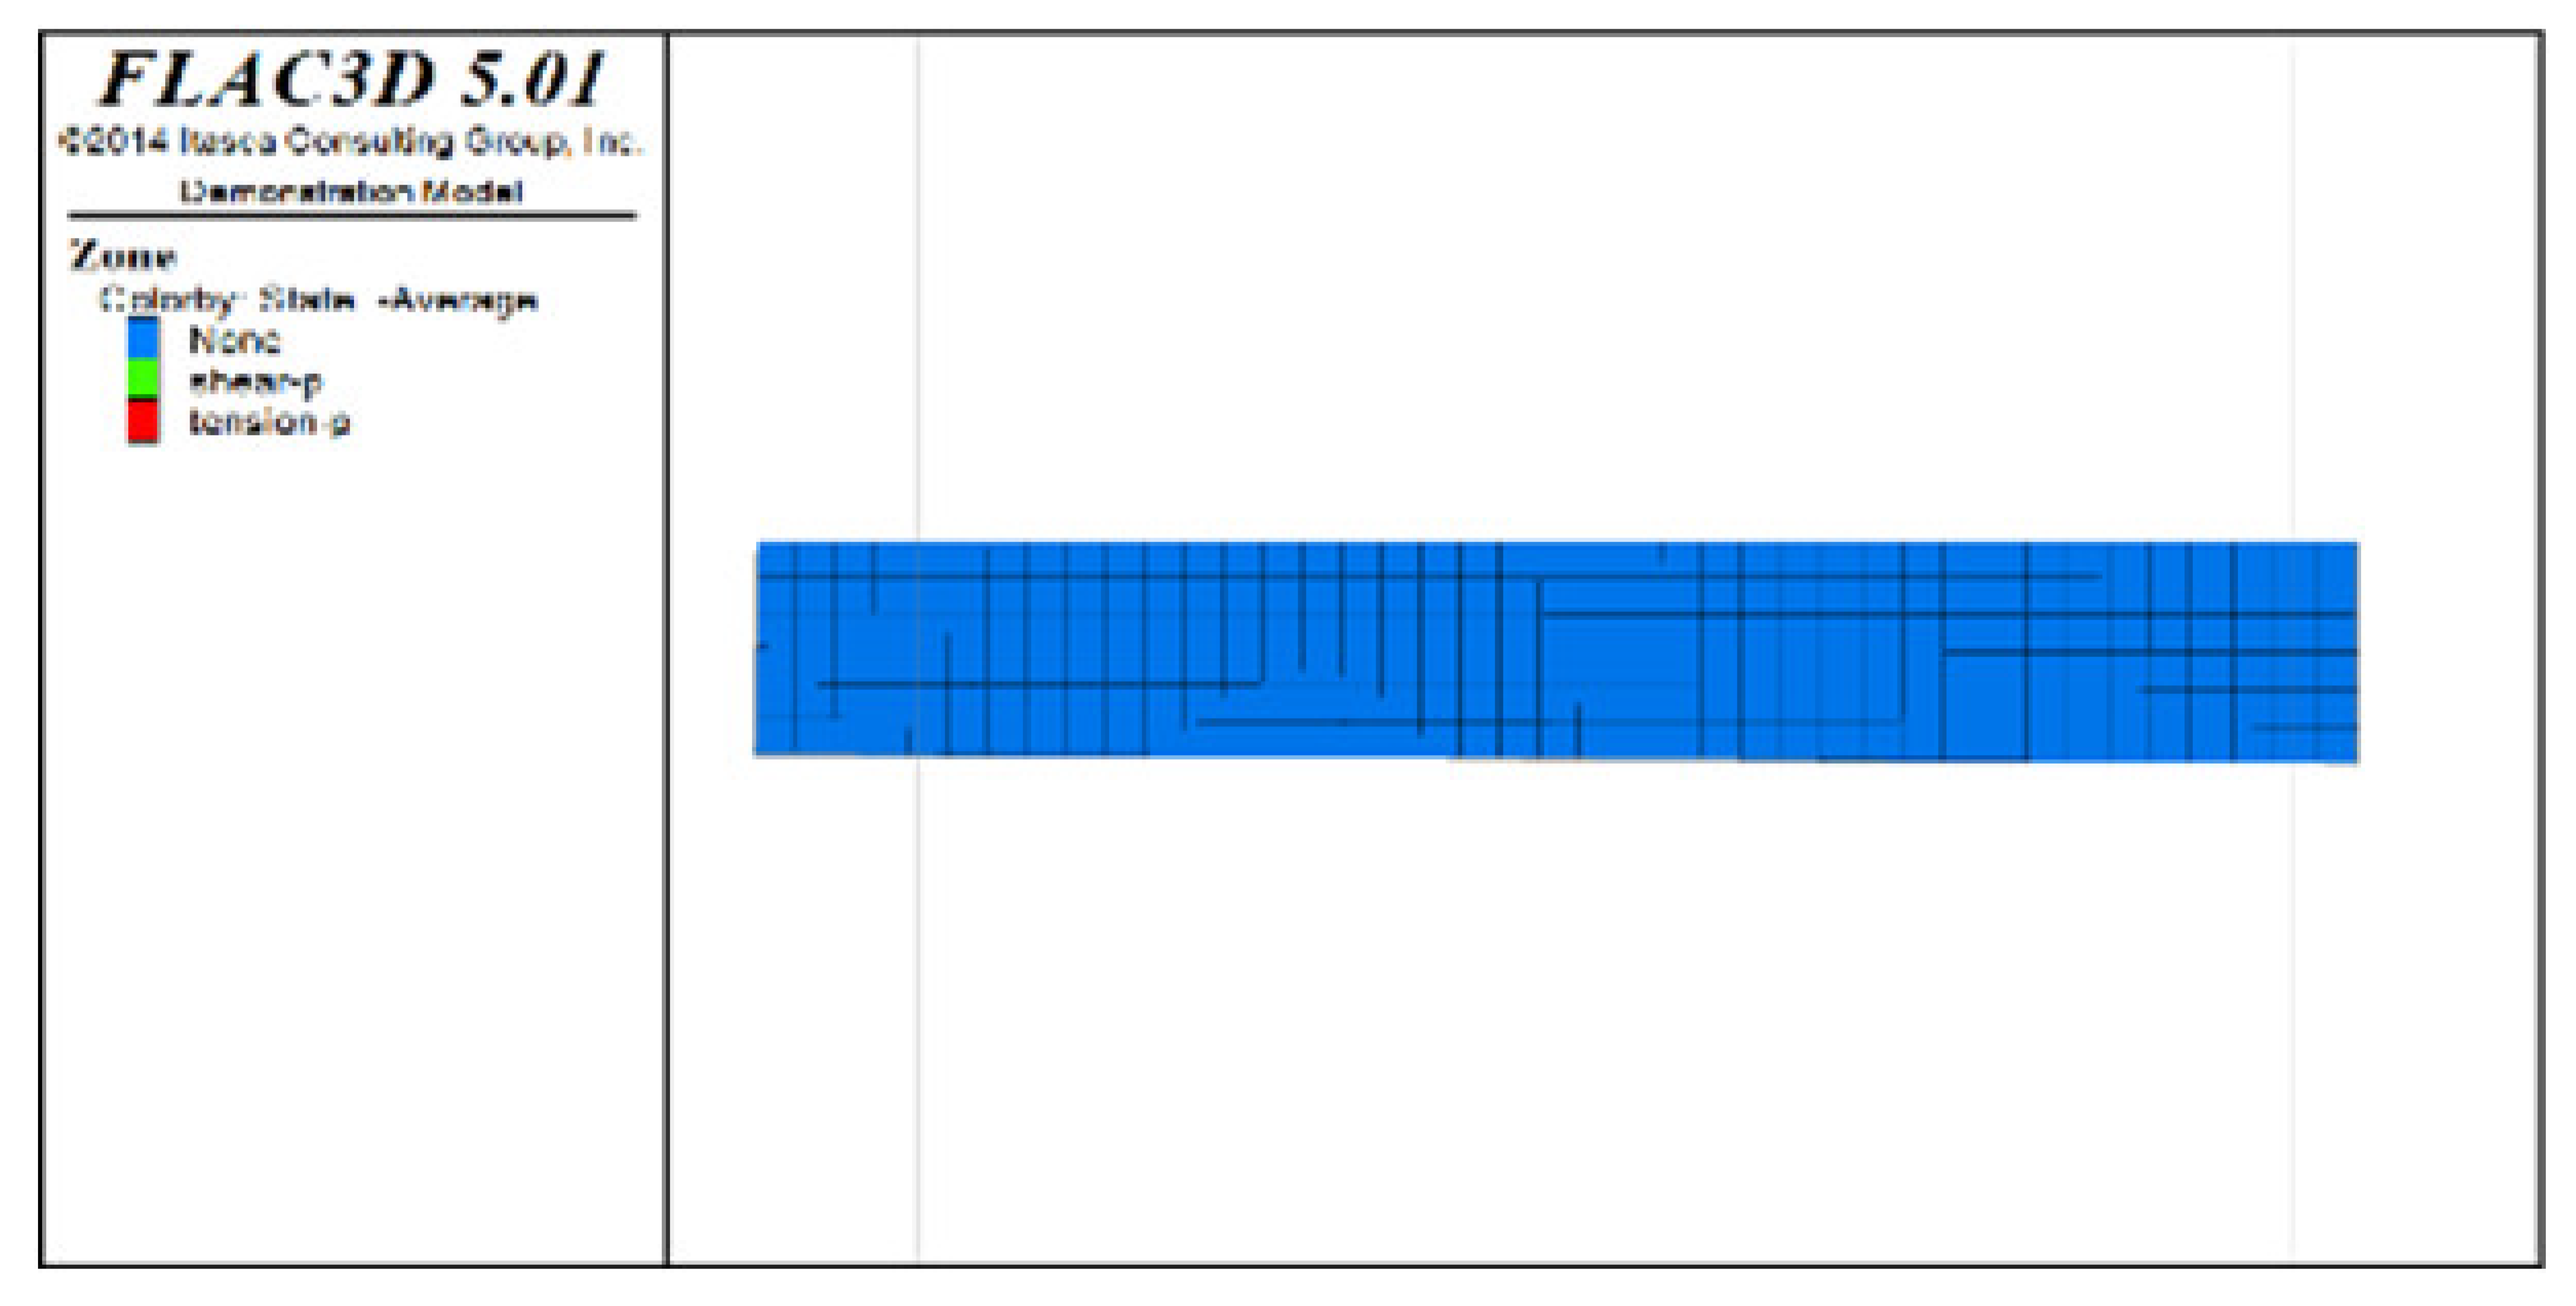 | 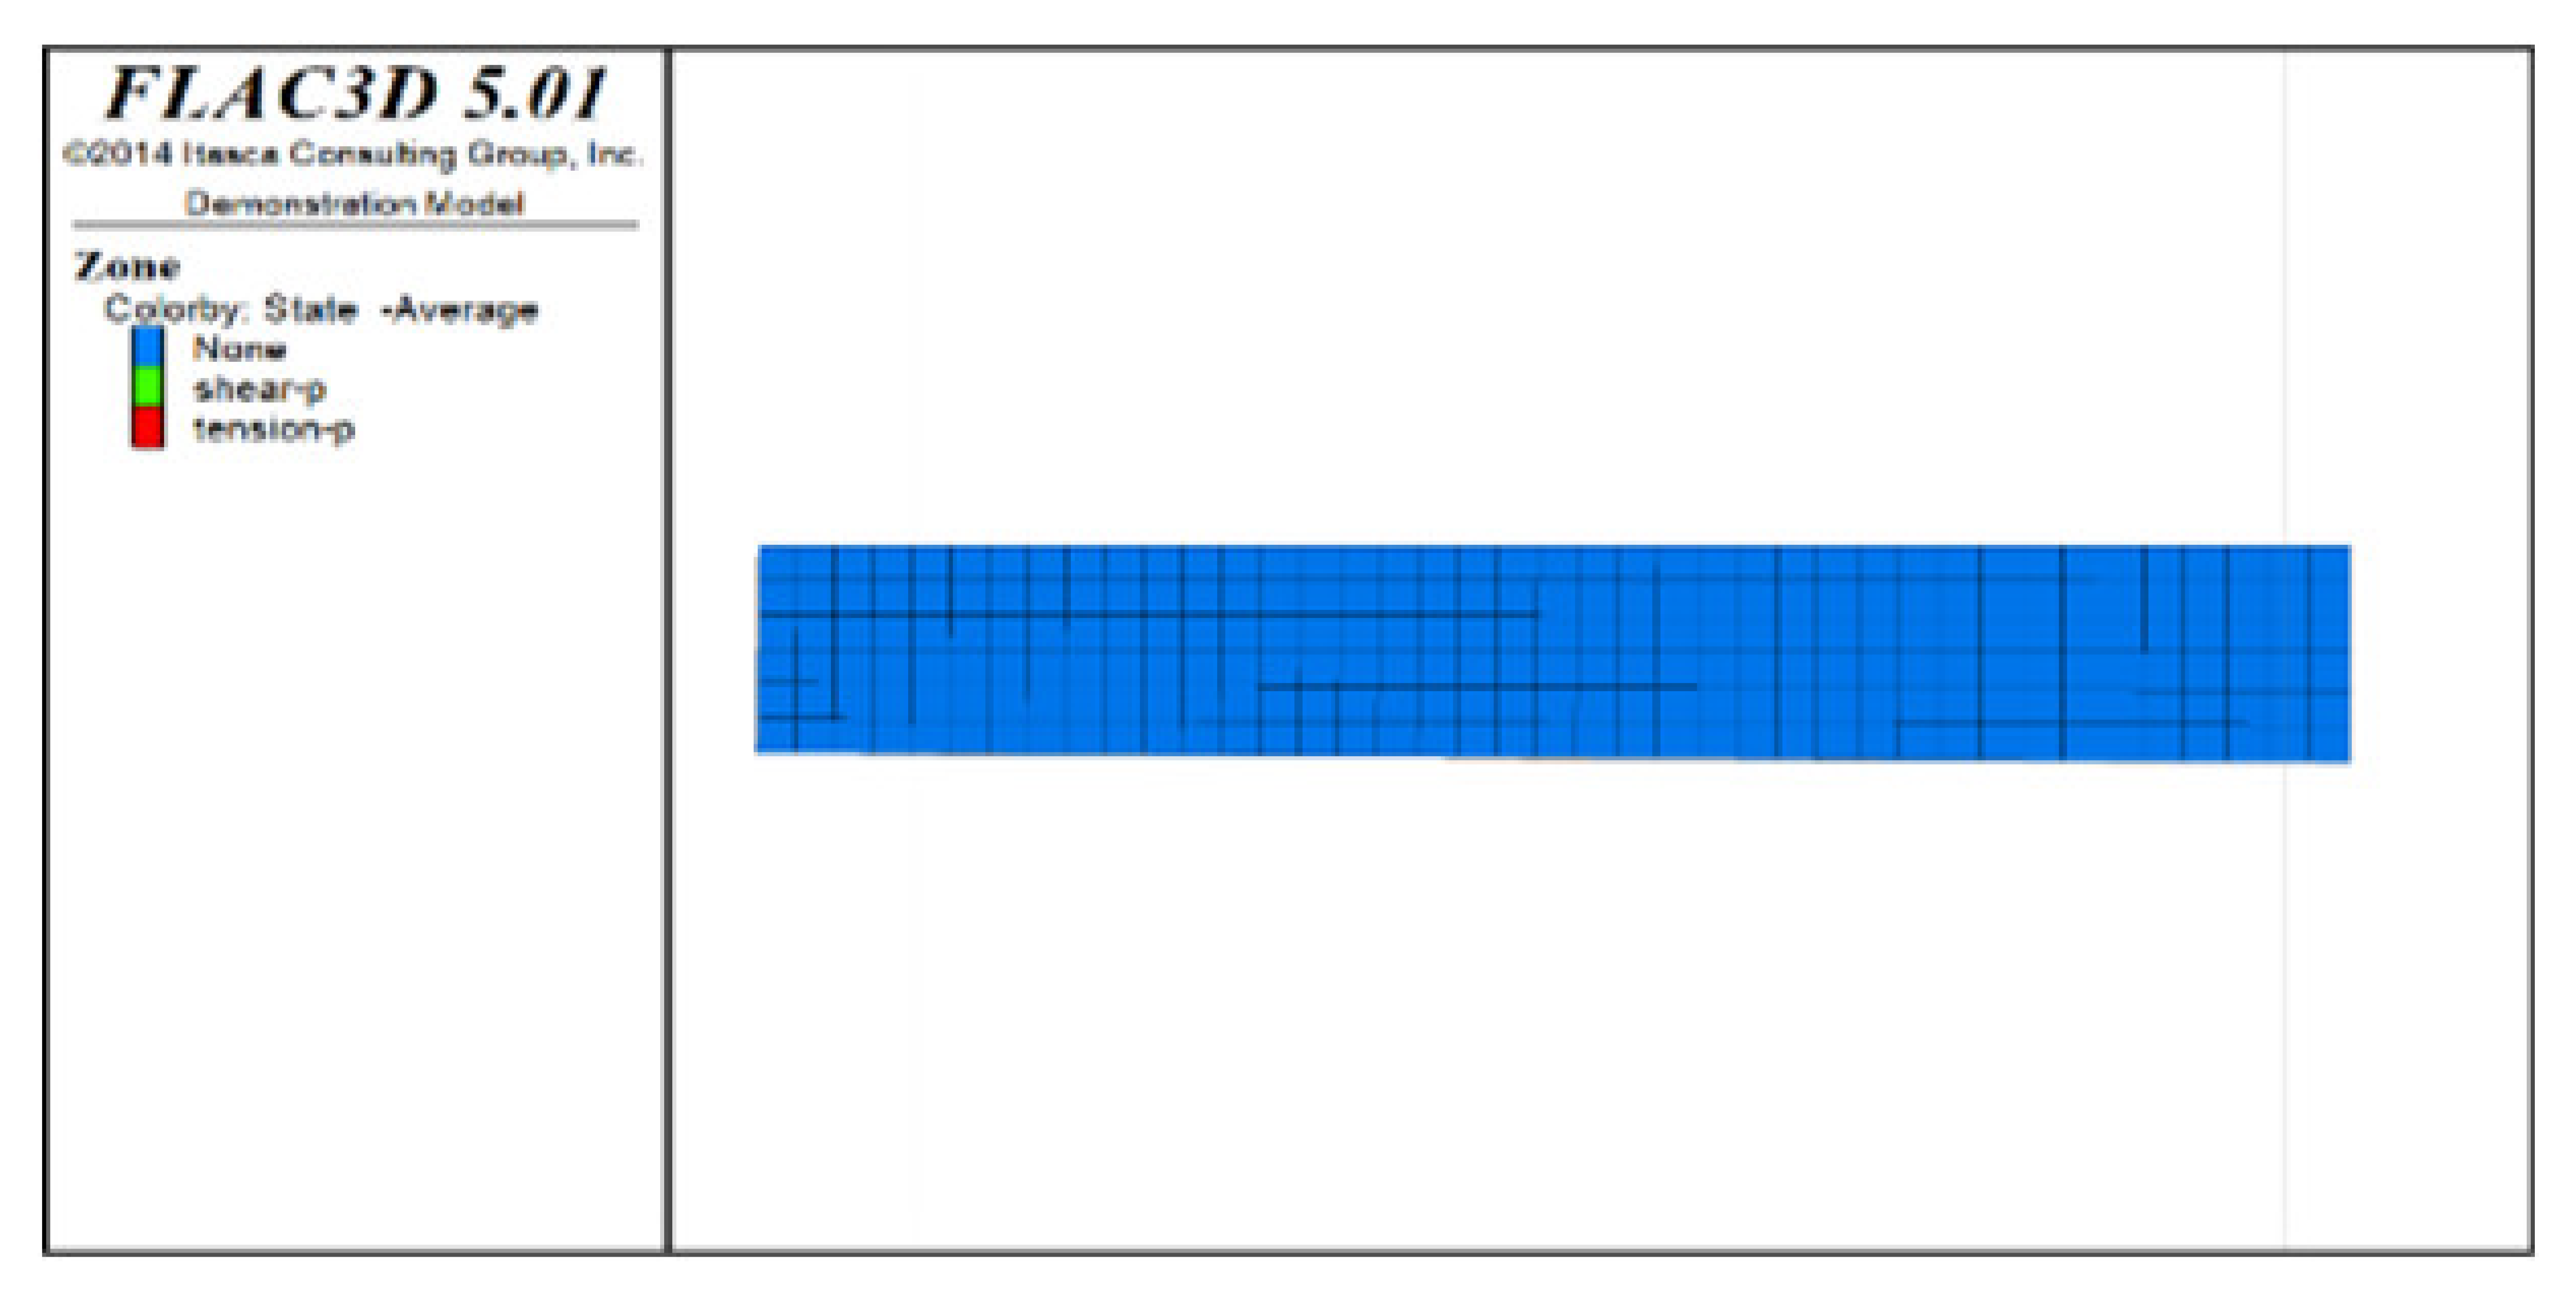 | |
| Excavation Stage 3 (Drifts 3, 10 and 17 of Scheme C; and Drifts 13, 15 and 17 of Scheme D) | Backfill Stage 3 (Drifts 3, 10 and 17 of Scheme C; and Drifts 13, 15 and 17 of Scheme D) | Excavation Stage 4 (Drifts 4, 11 and 18 of Scheme C; and Drift 19 of Scheme D) | Backfill Stage 4 (Drifts 4, 11 and 18 of Scheme C;and Drift 19 of Scheme D) | ||
|---|---|---|---|---|---|
| Scheme C | Distribution diagram of plastic zones in the roof protection layer observed from top to bottom | 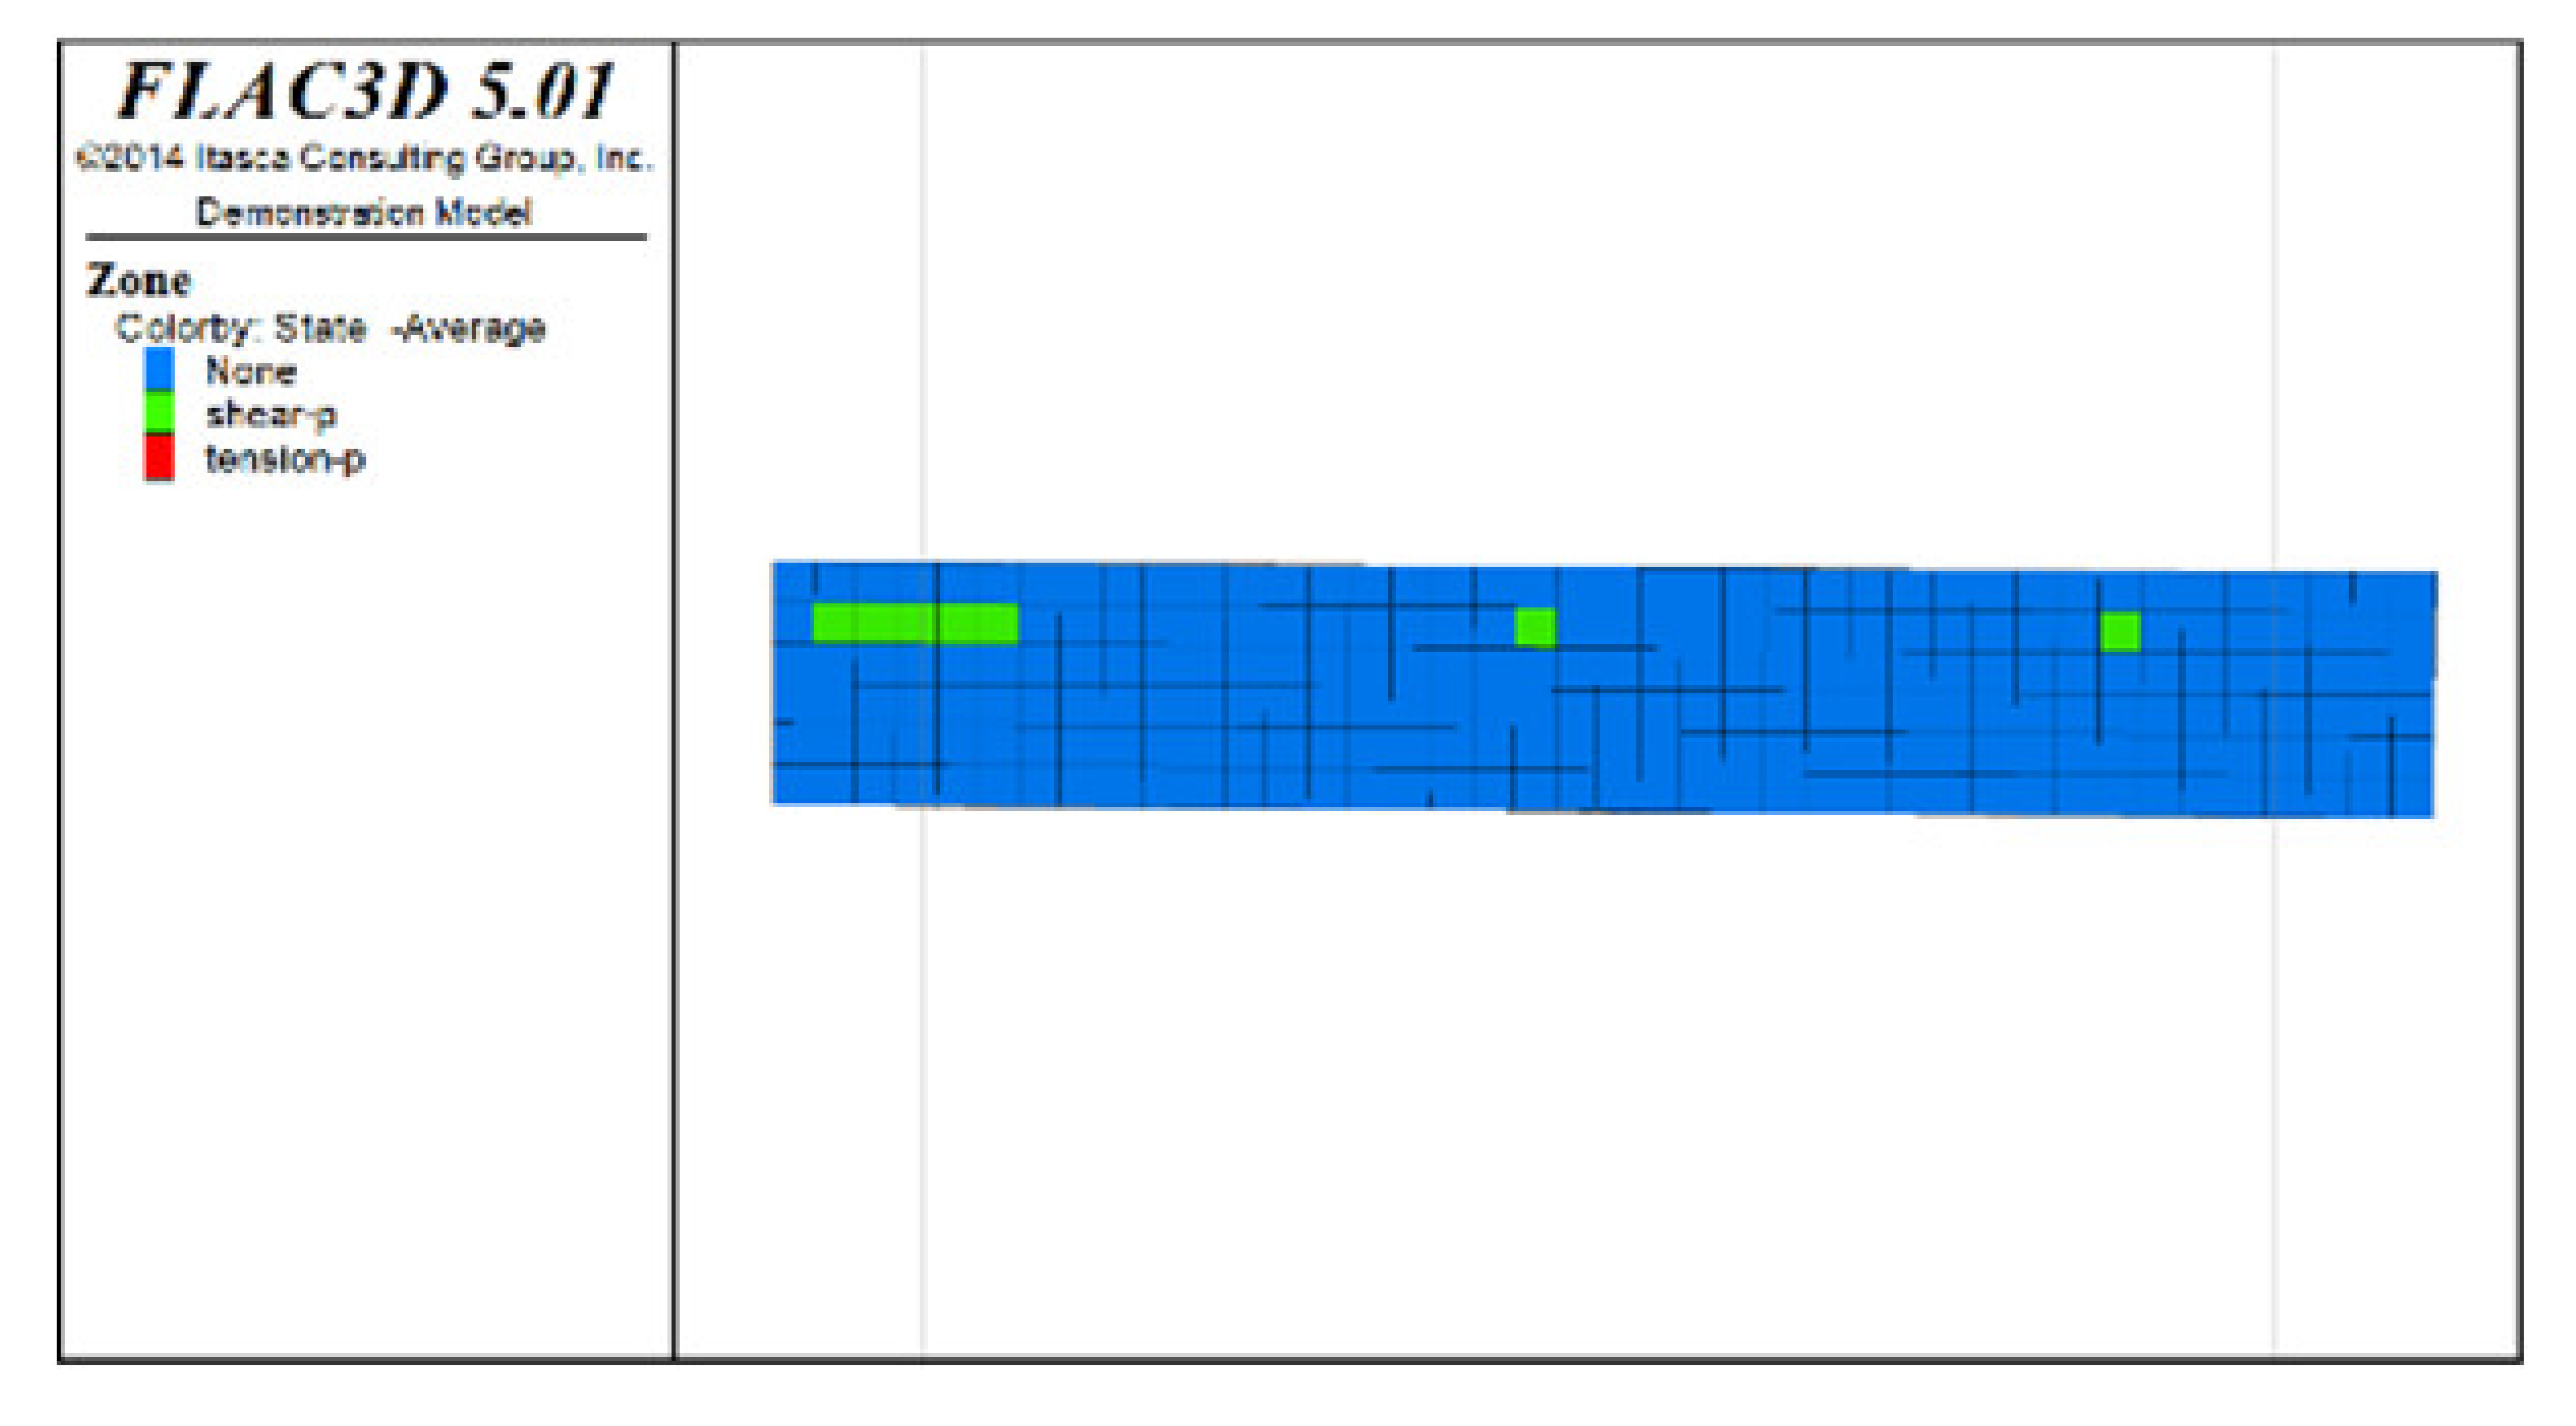 | 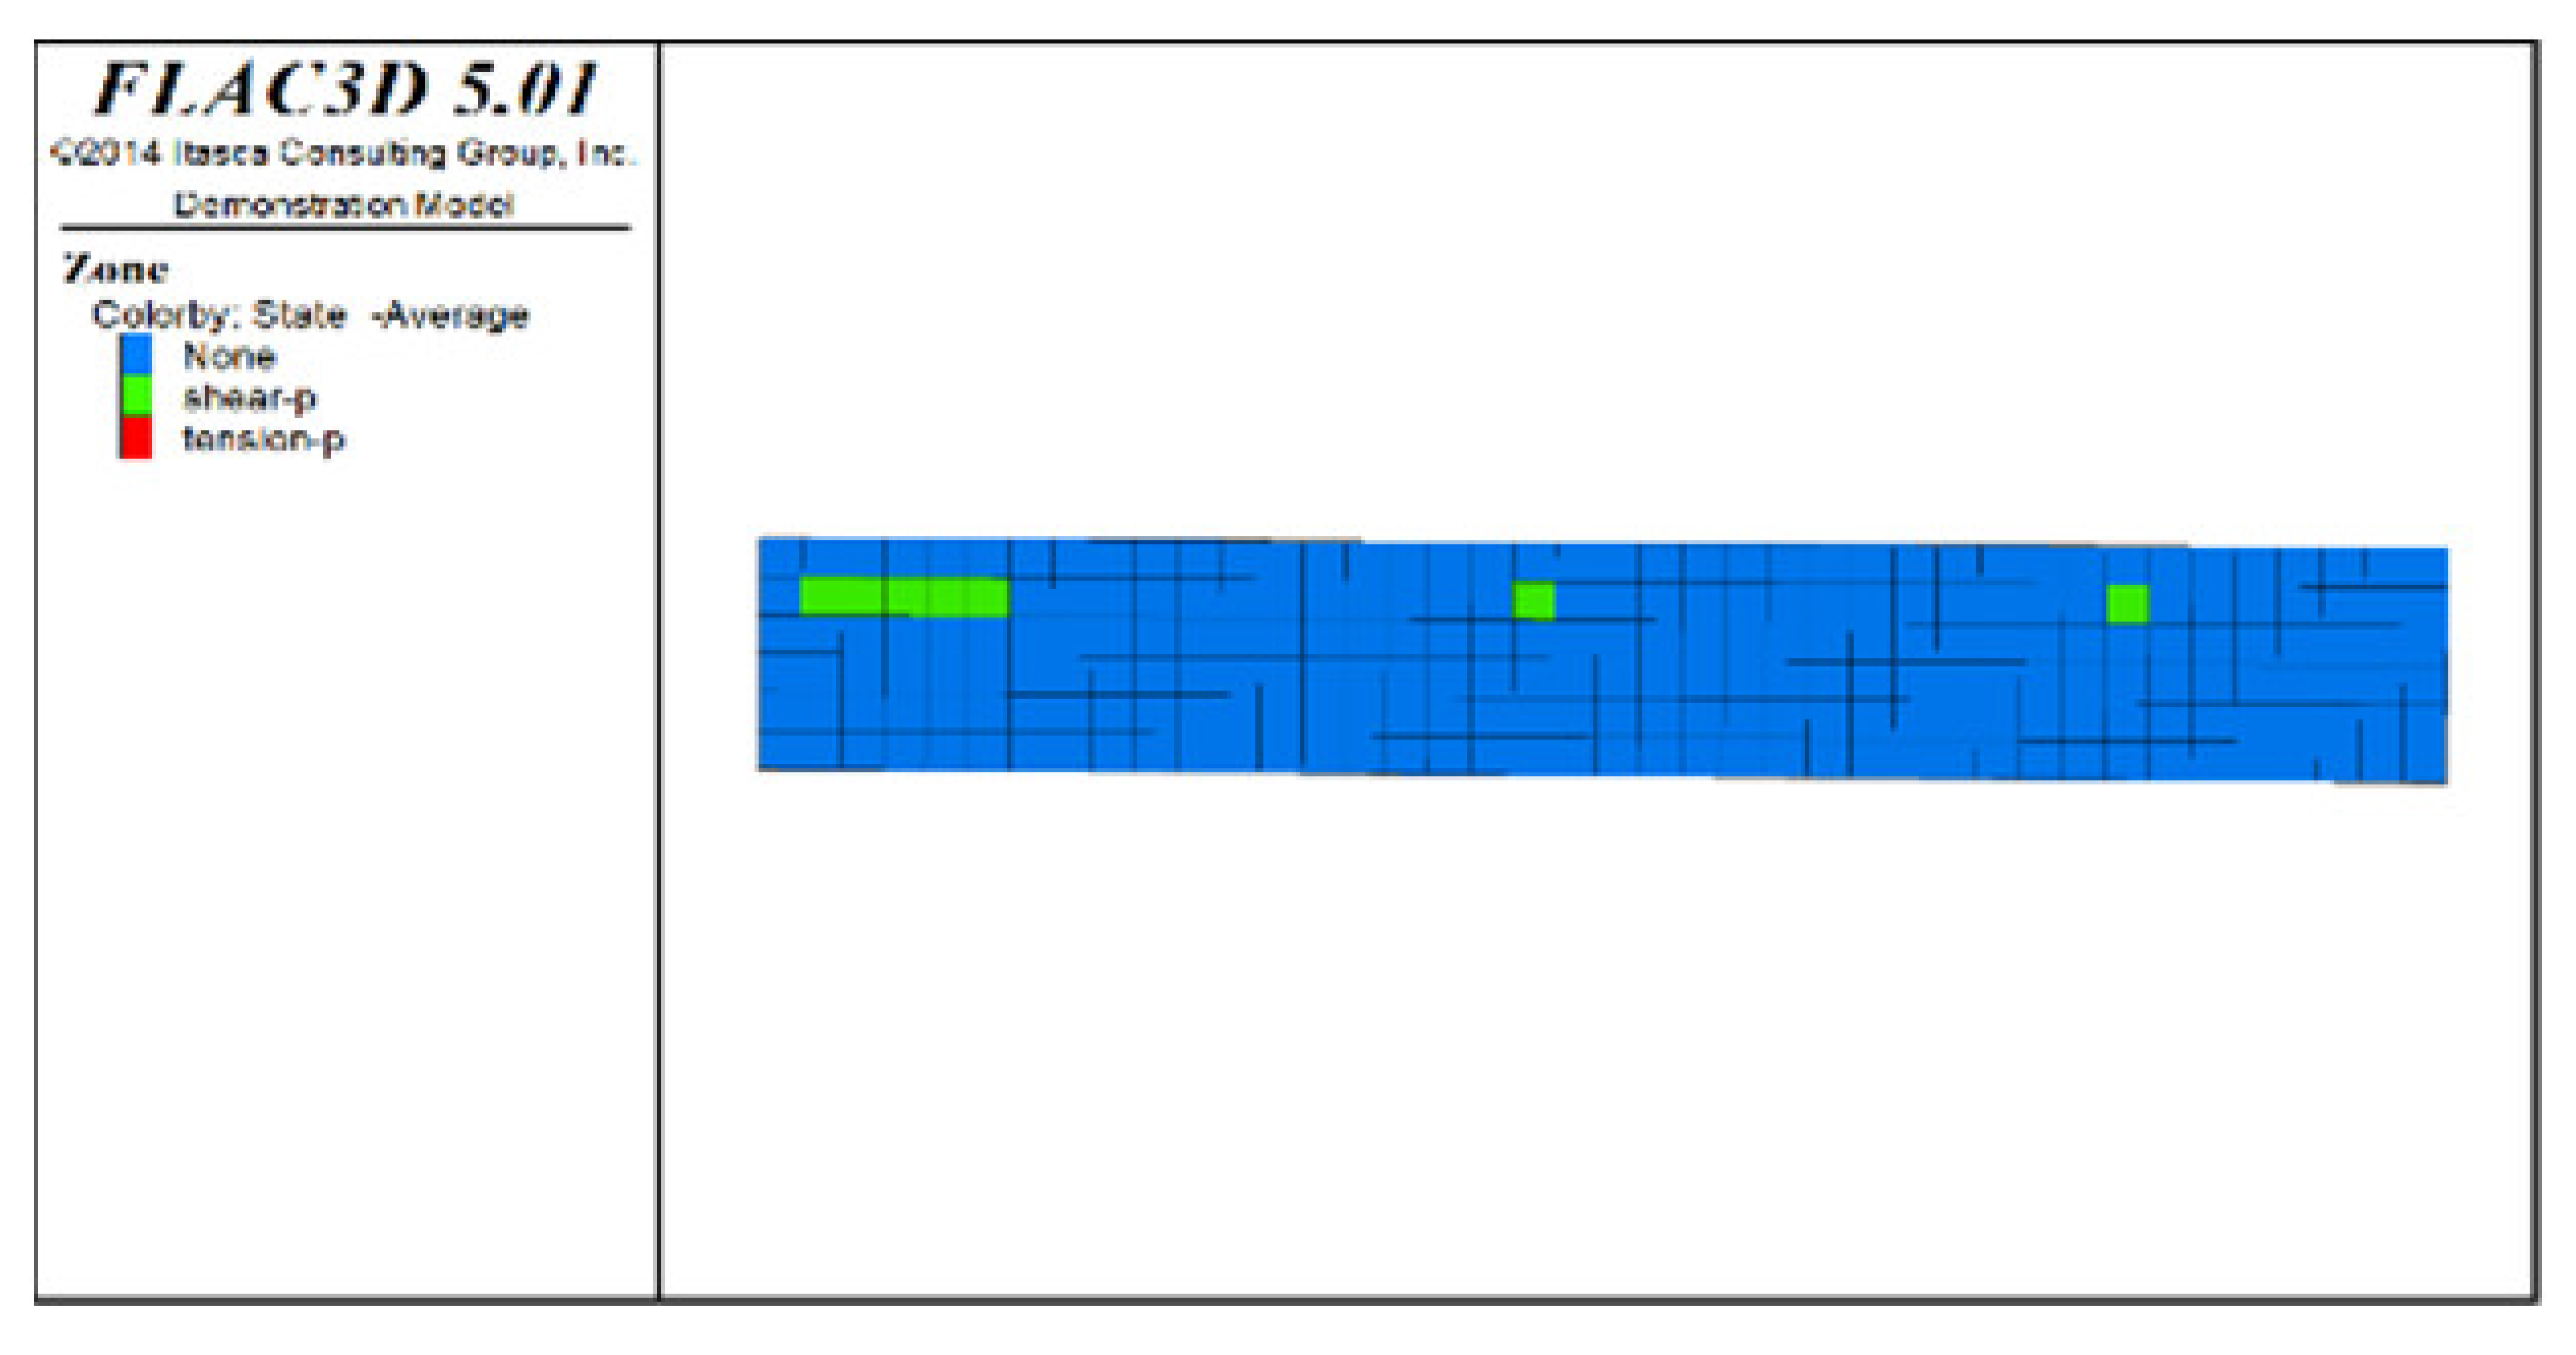 | 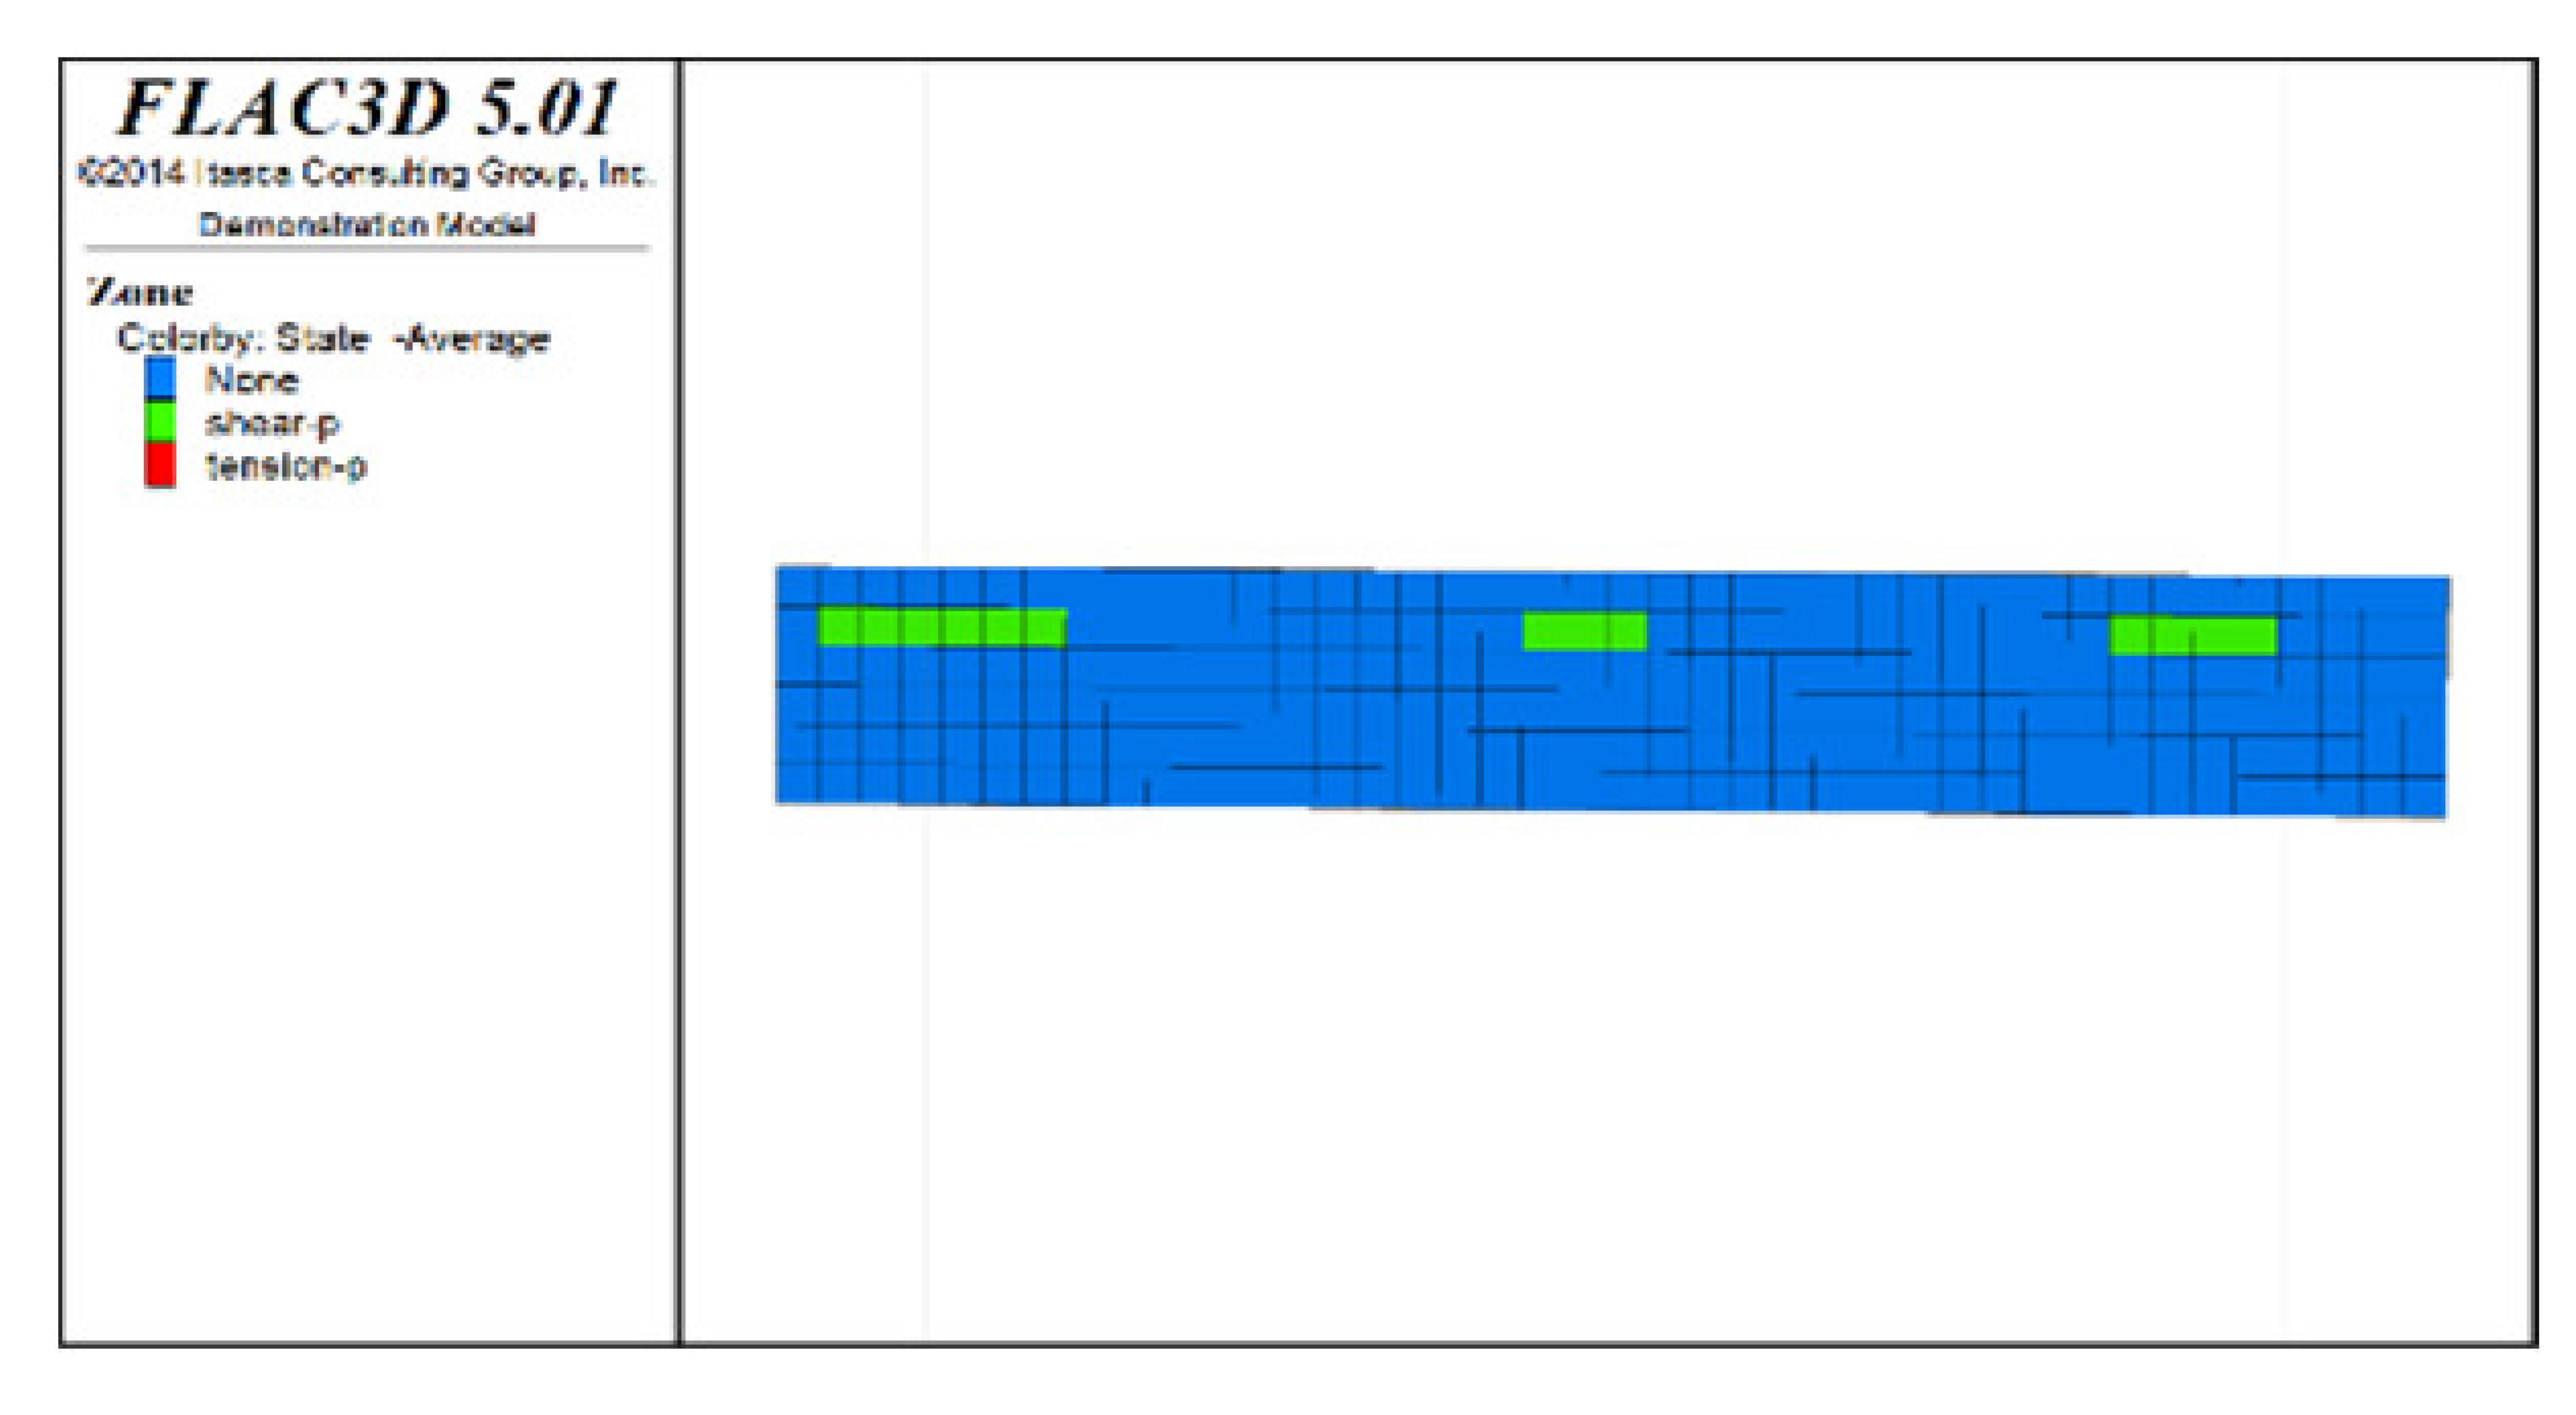 | 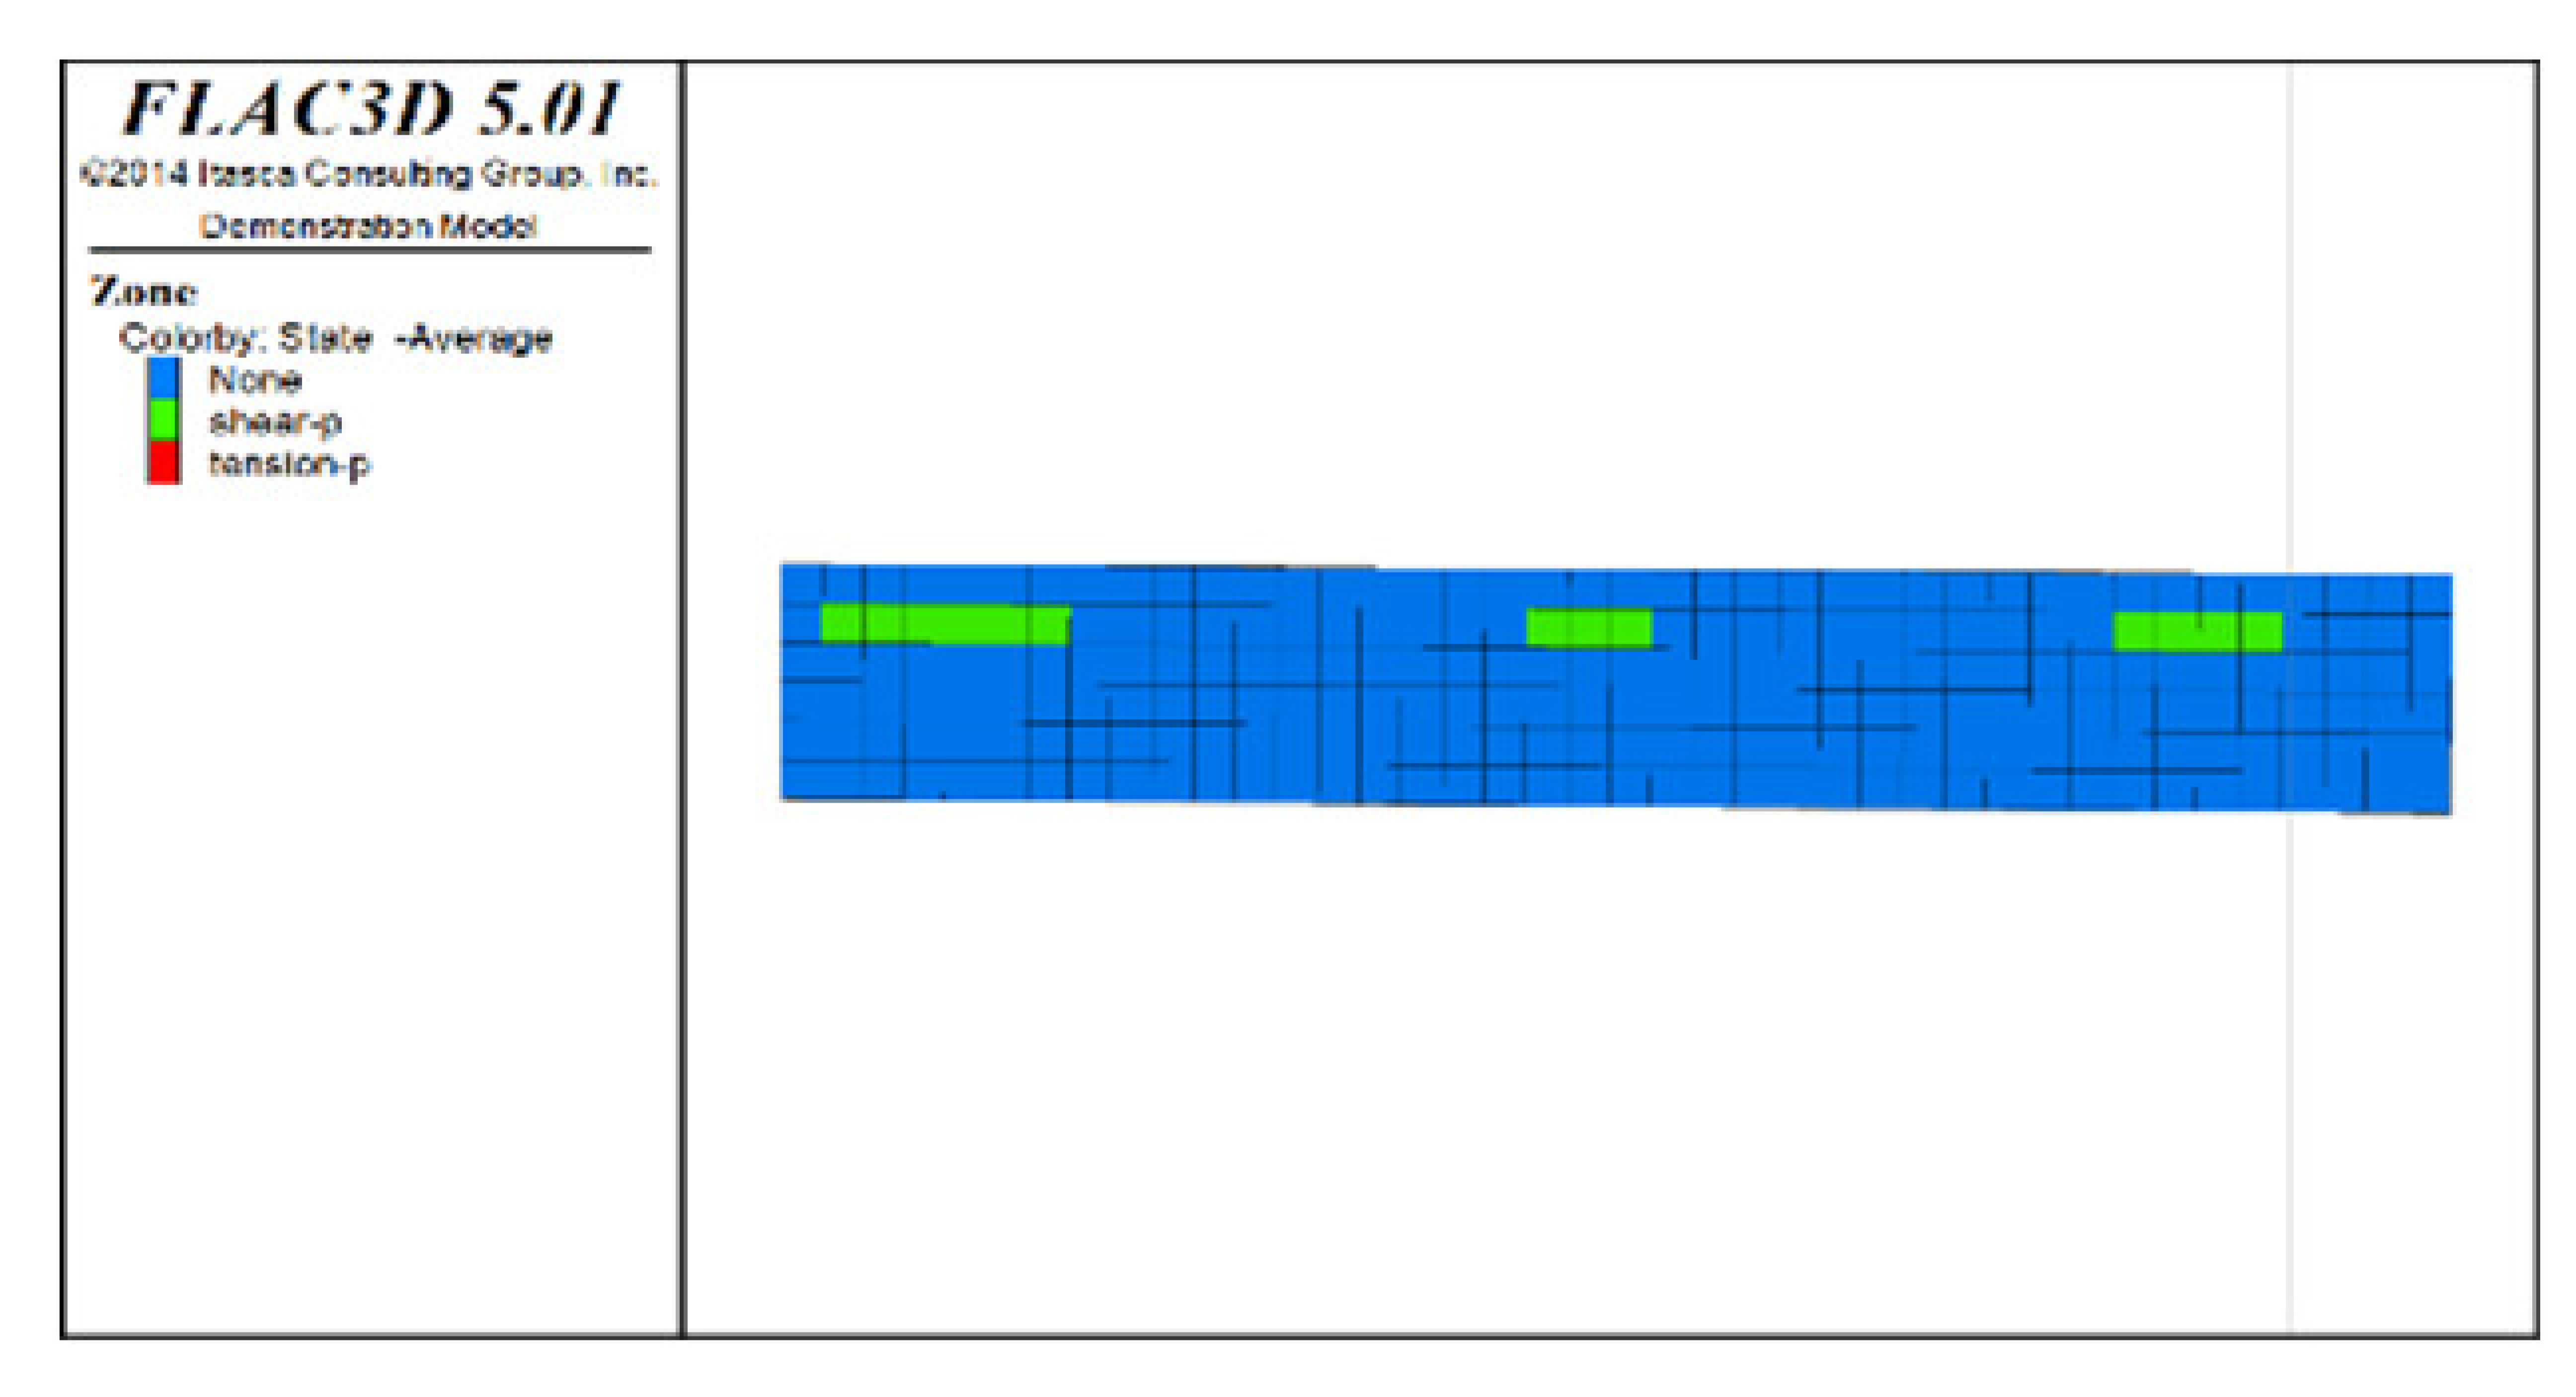 |
| Distribution diagram of plastic zones in the roof protection layer observed from bottom to top | 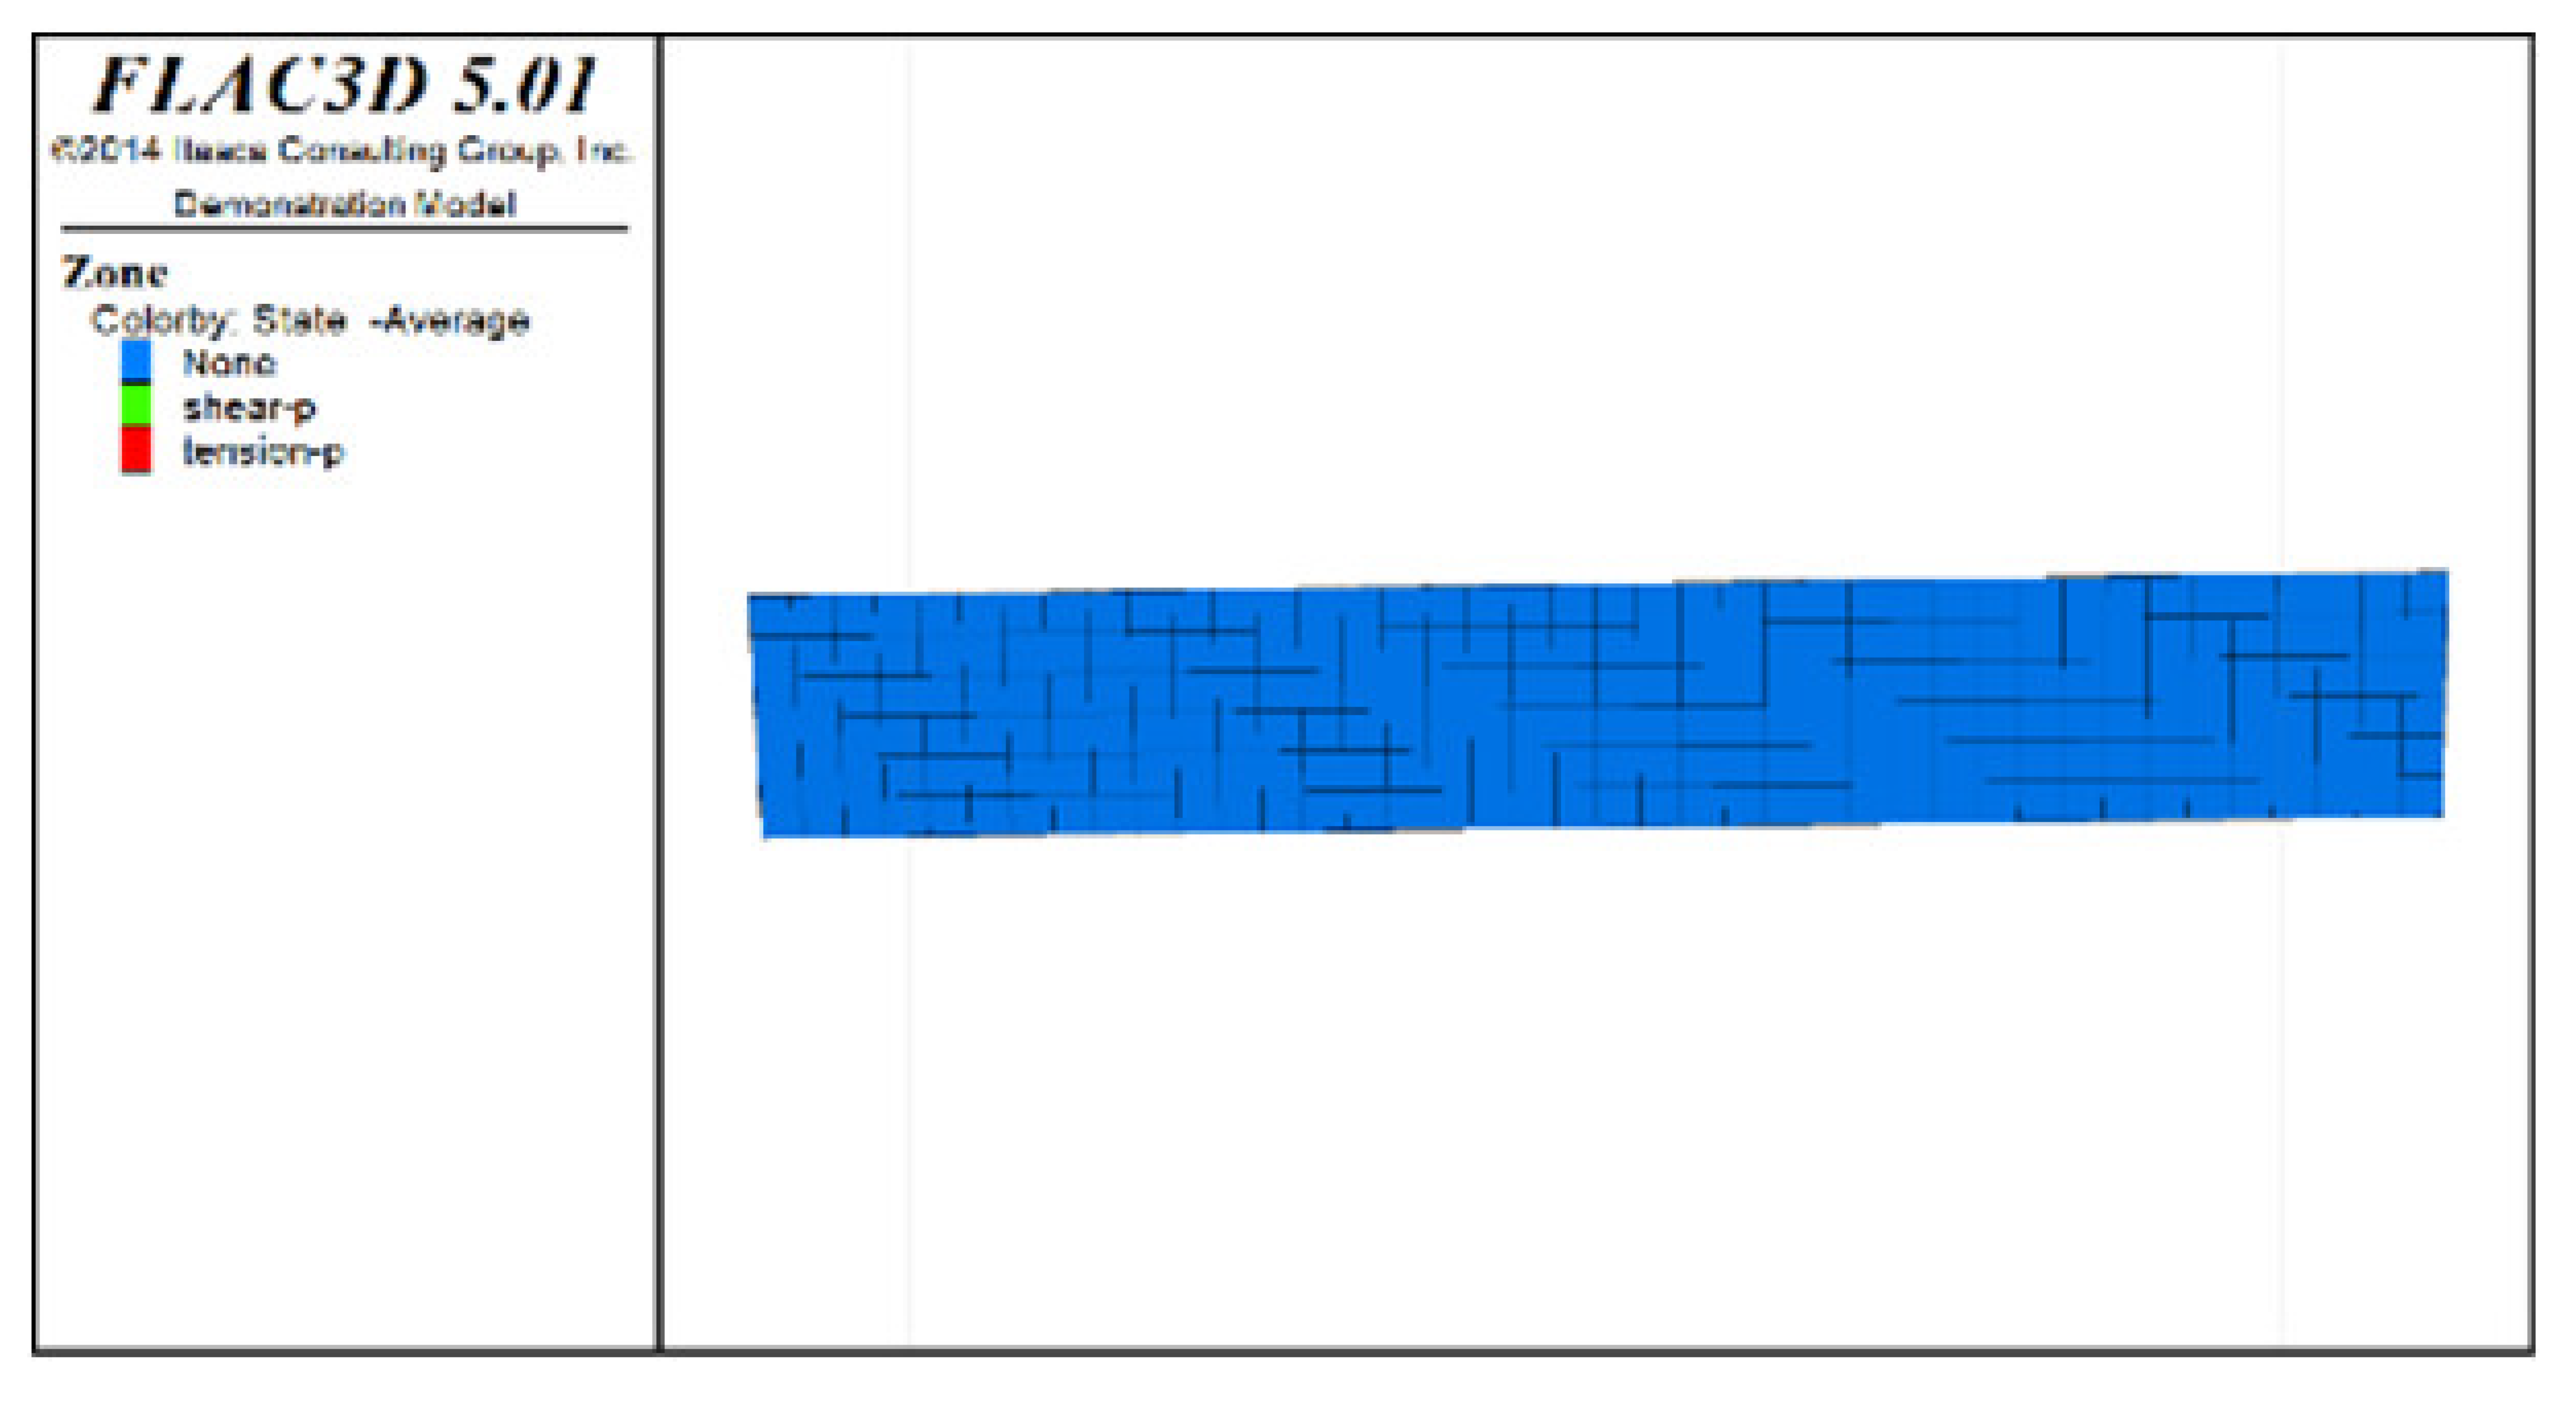 | 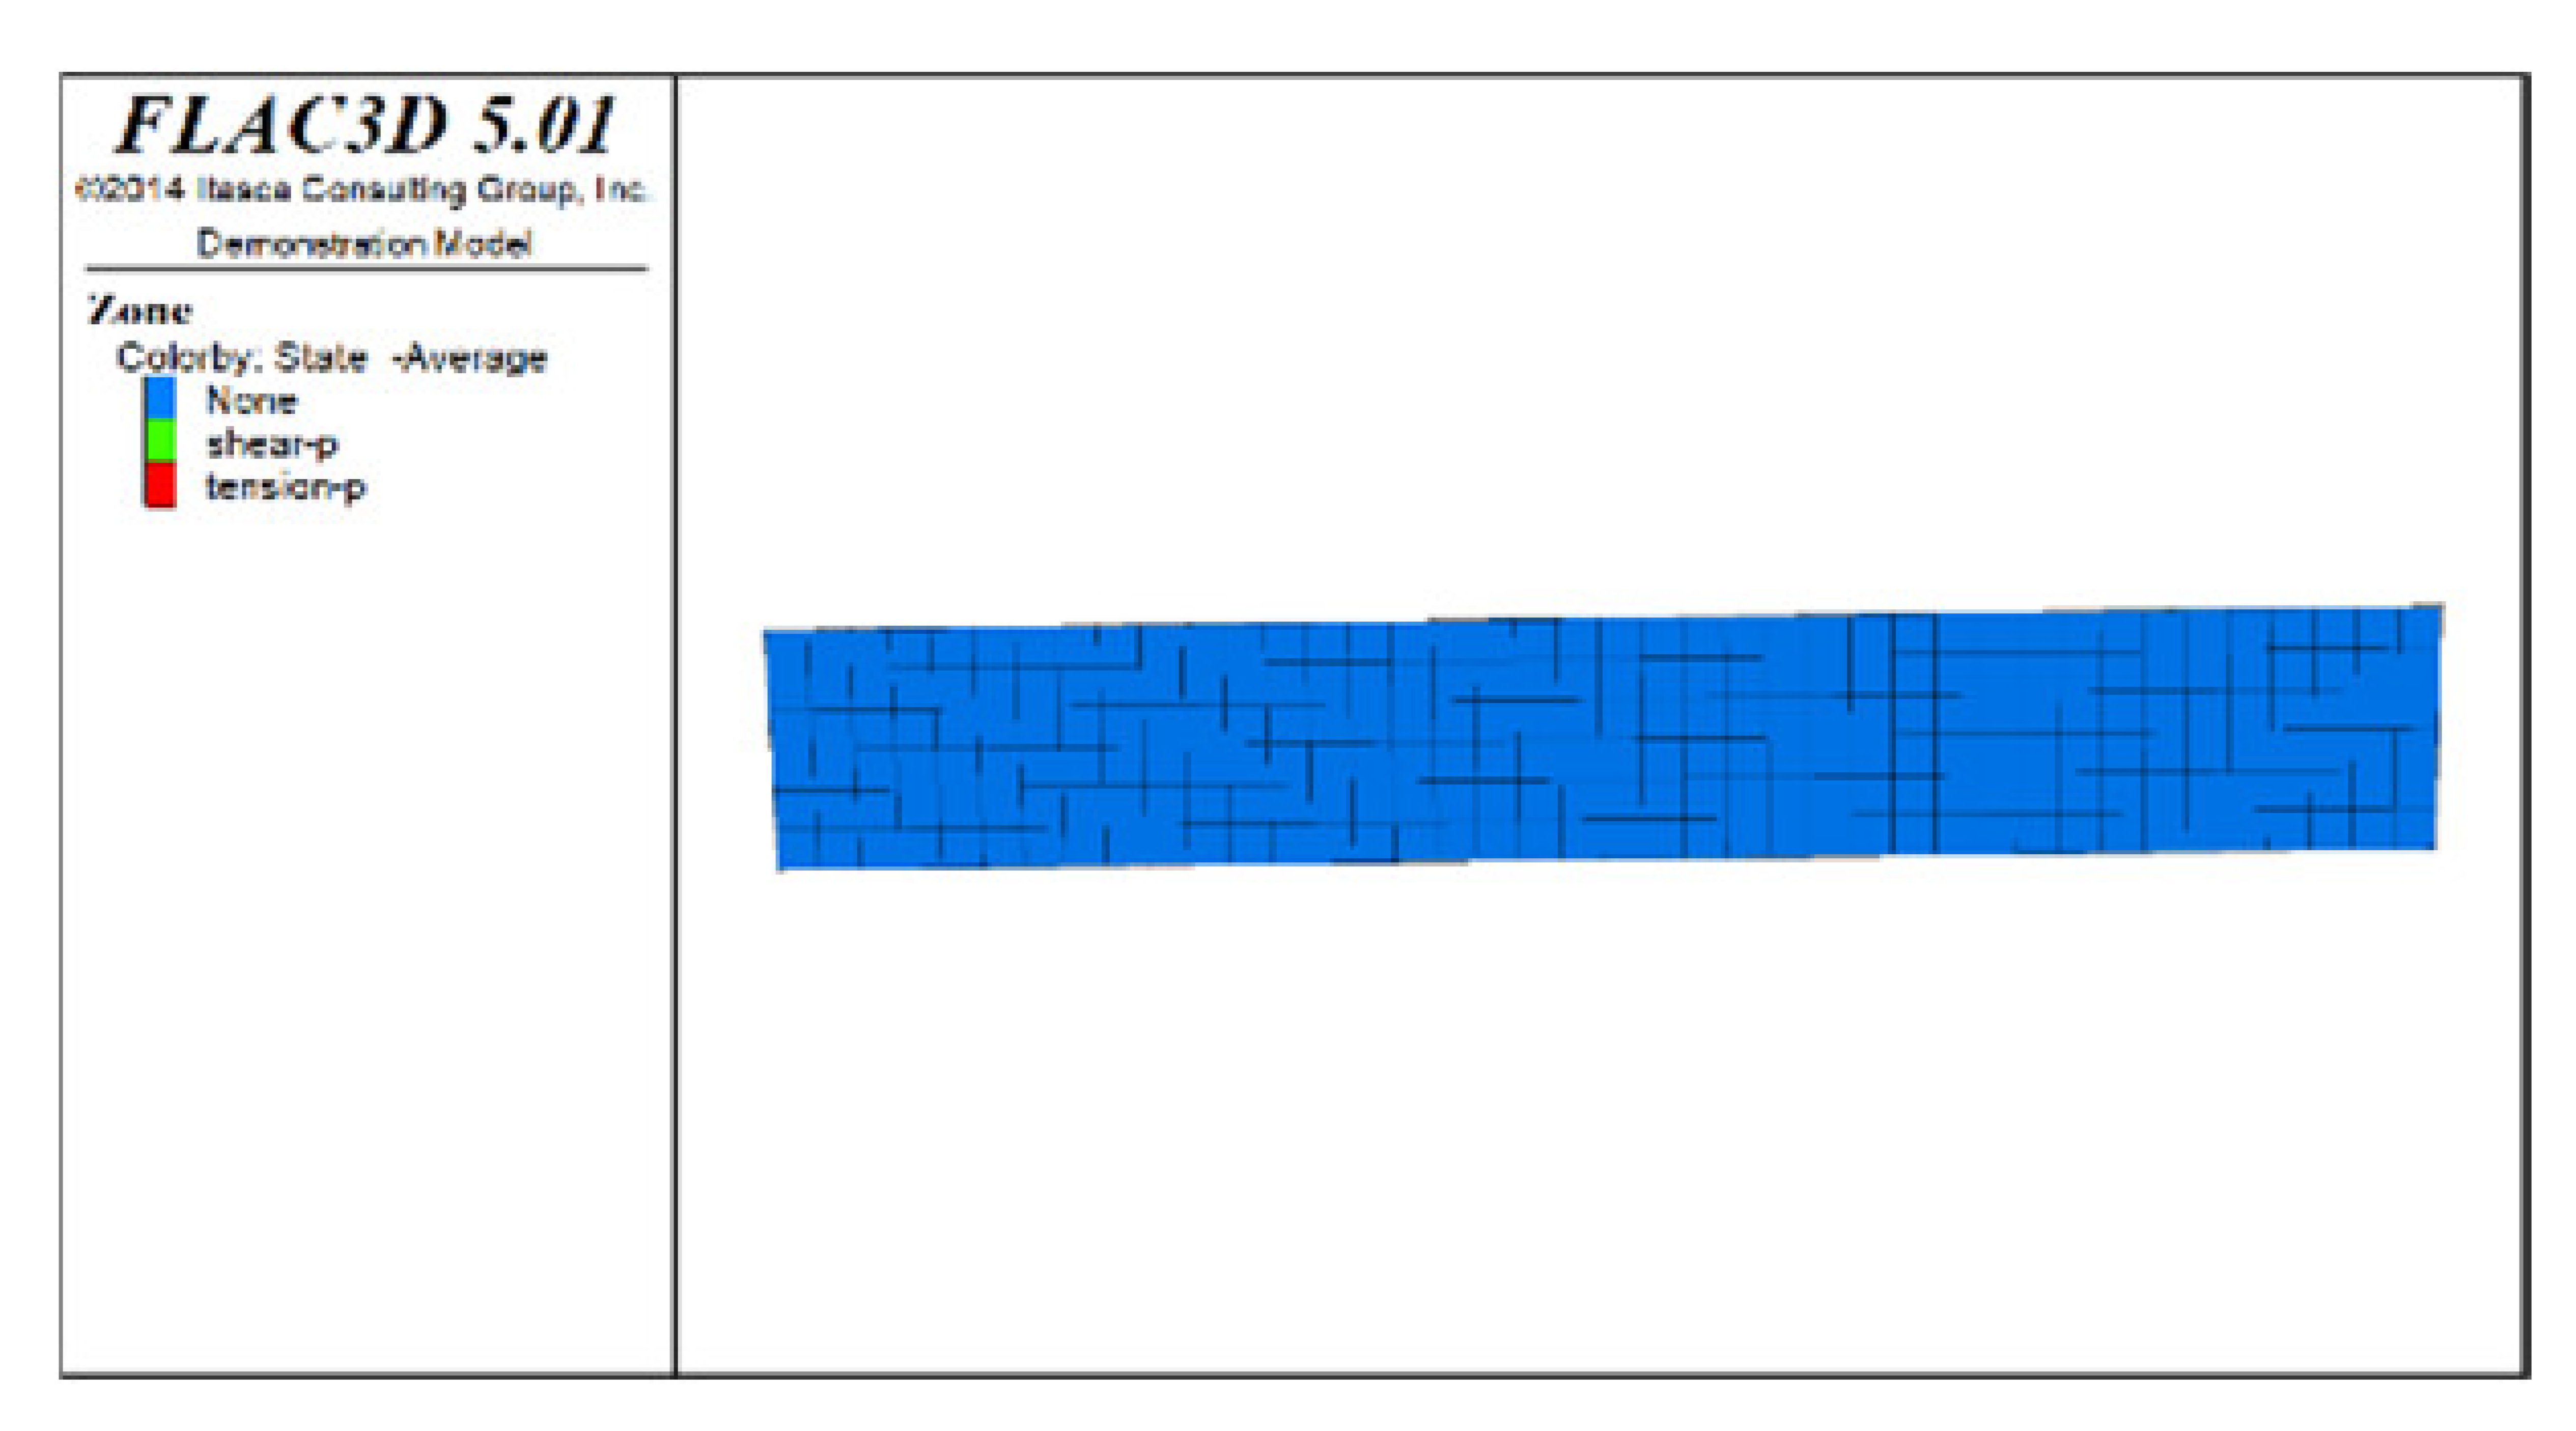 |  | 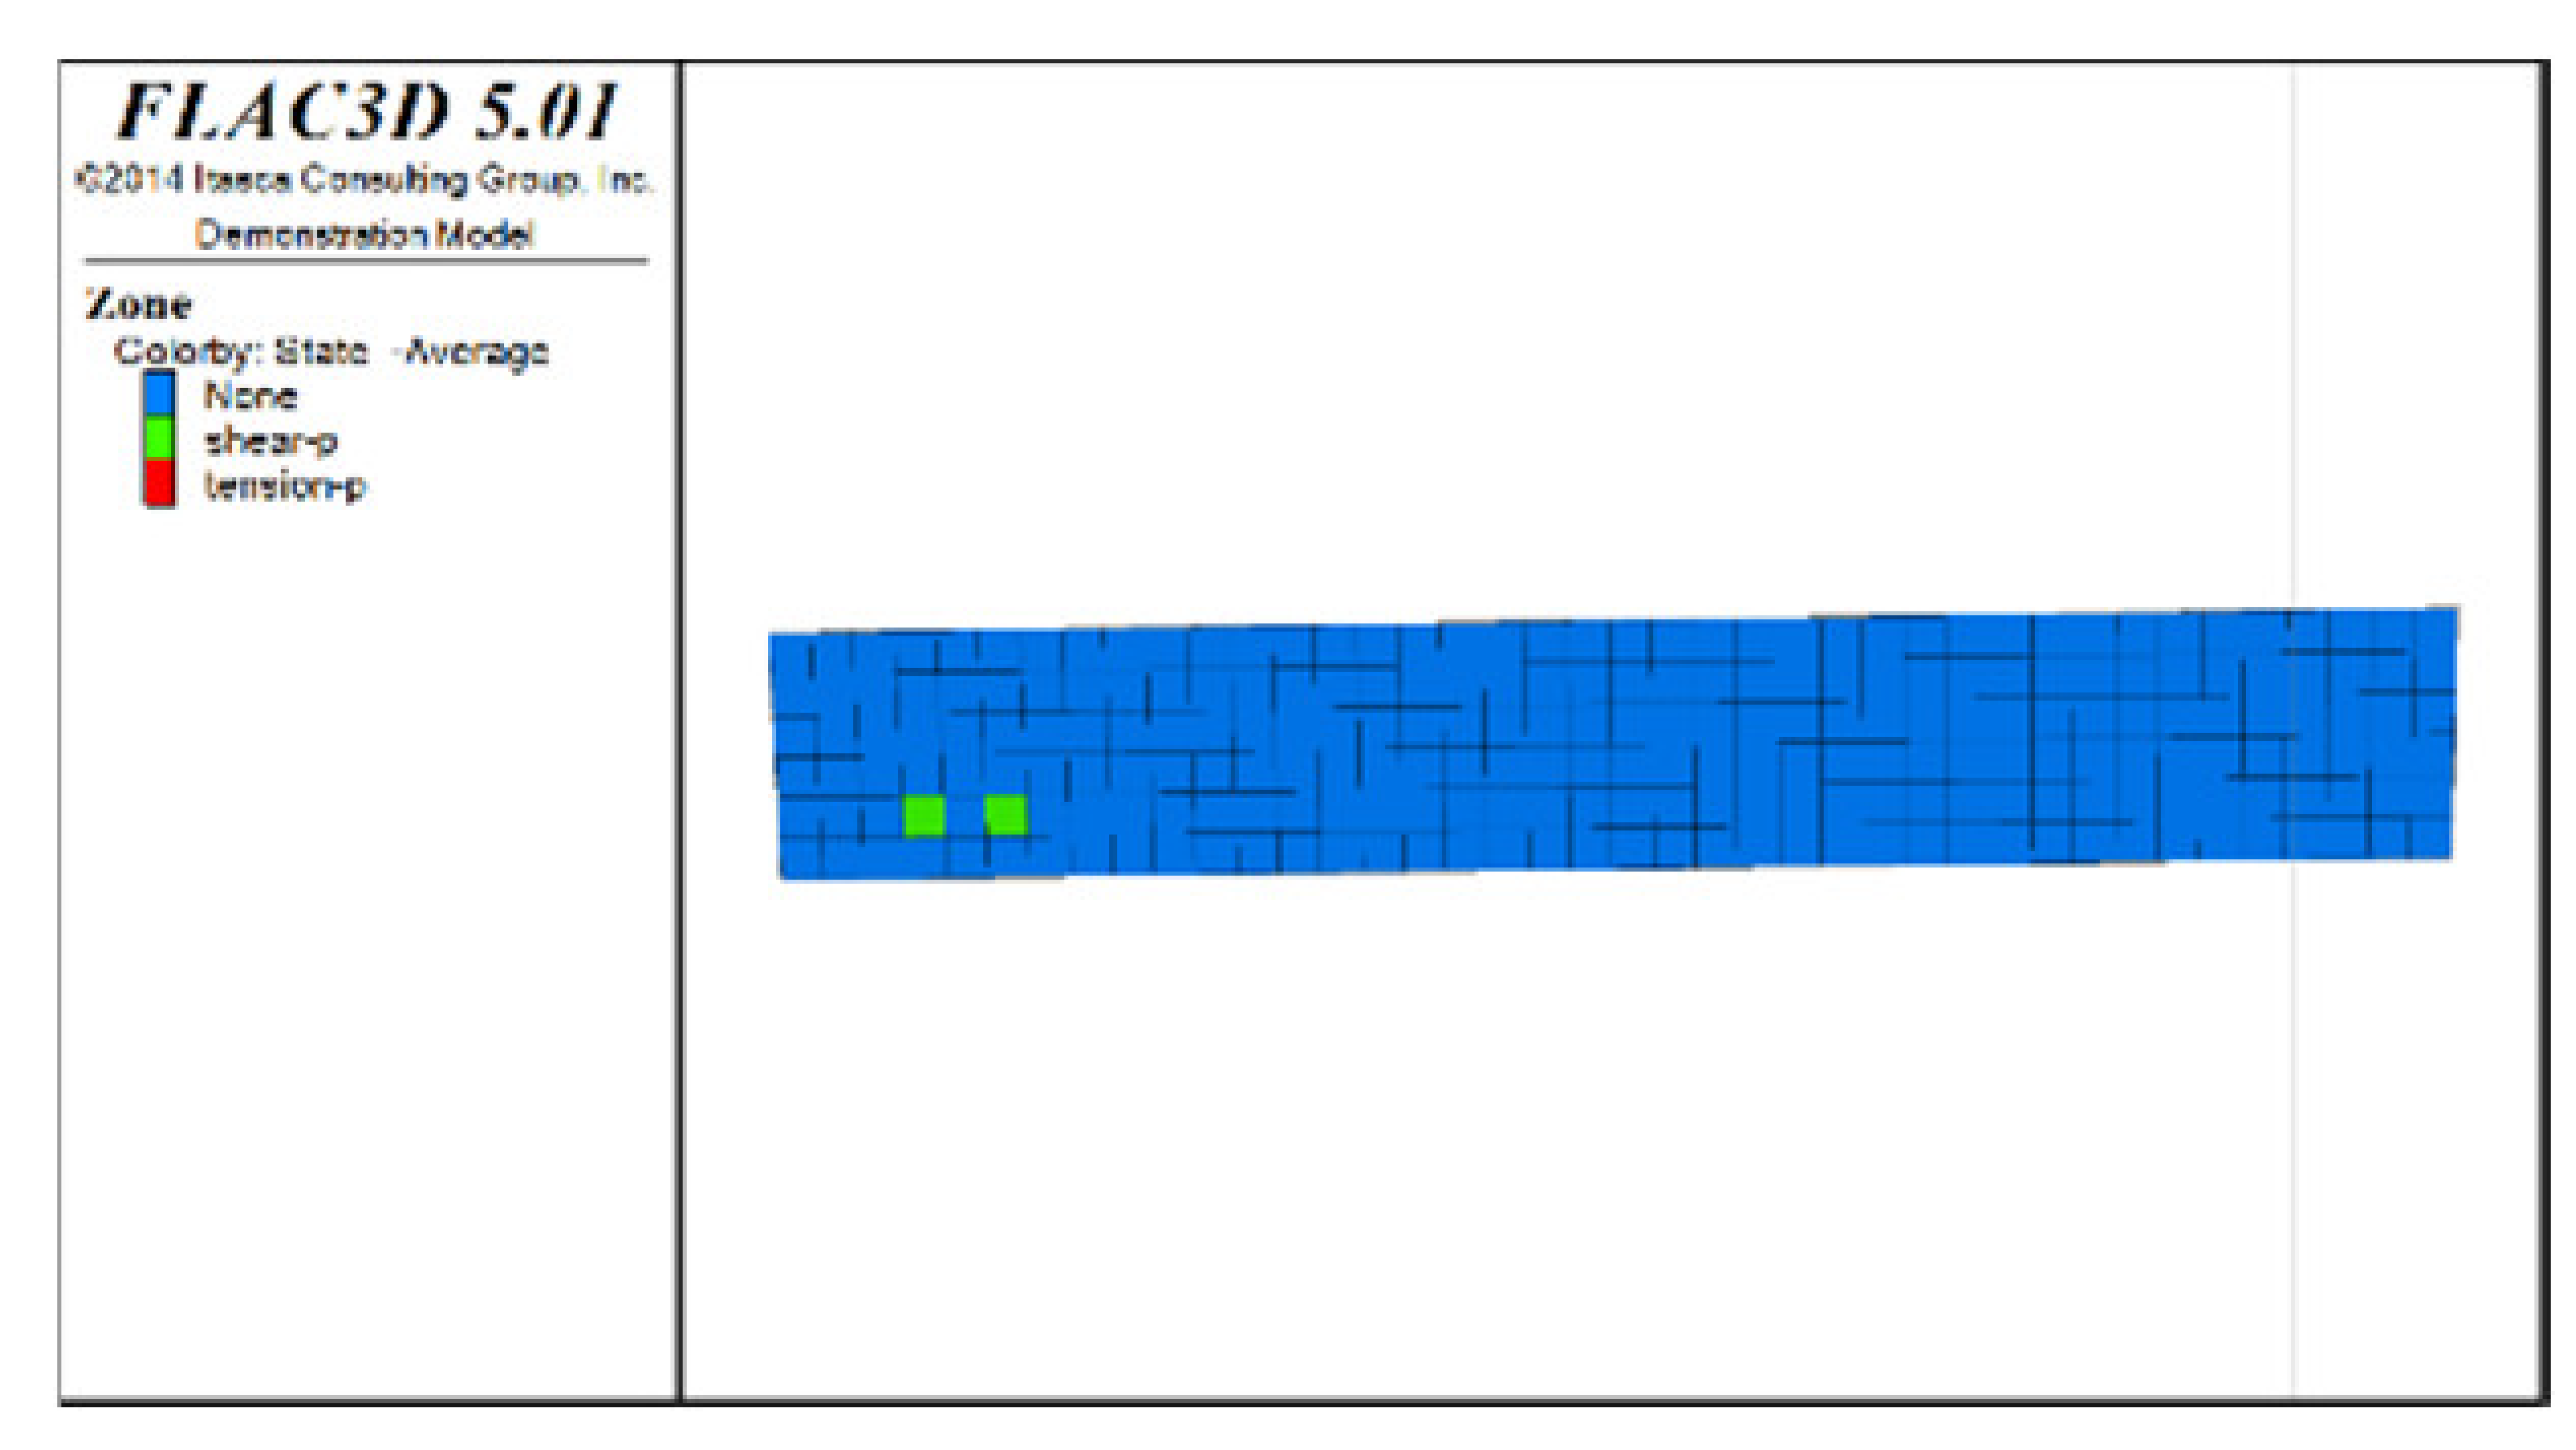 | |
| Scheme D | Distribution diagram of plastic zones in the roof protection layer observed from top to bottom | 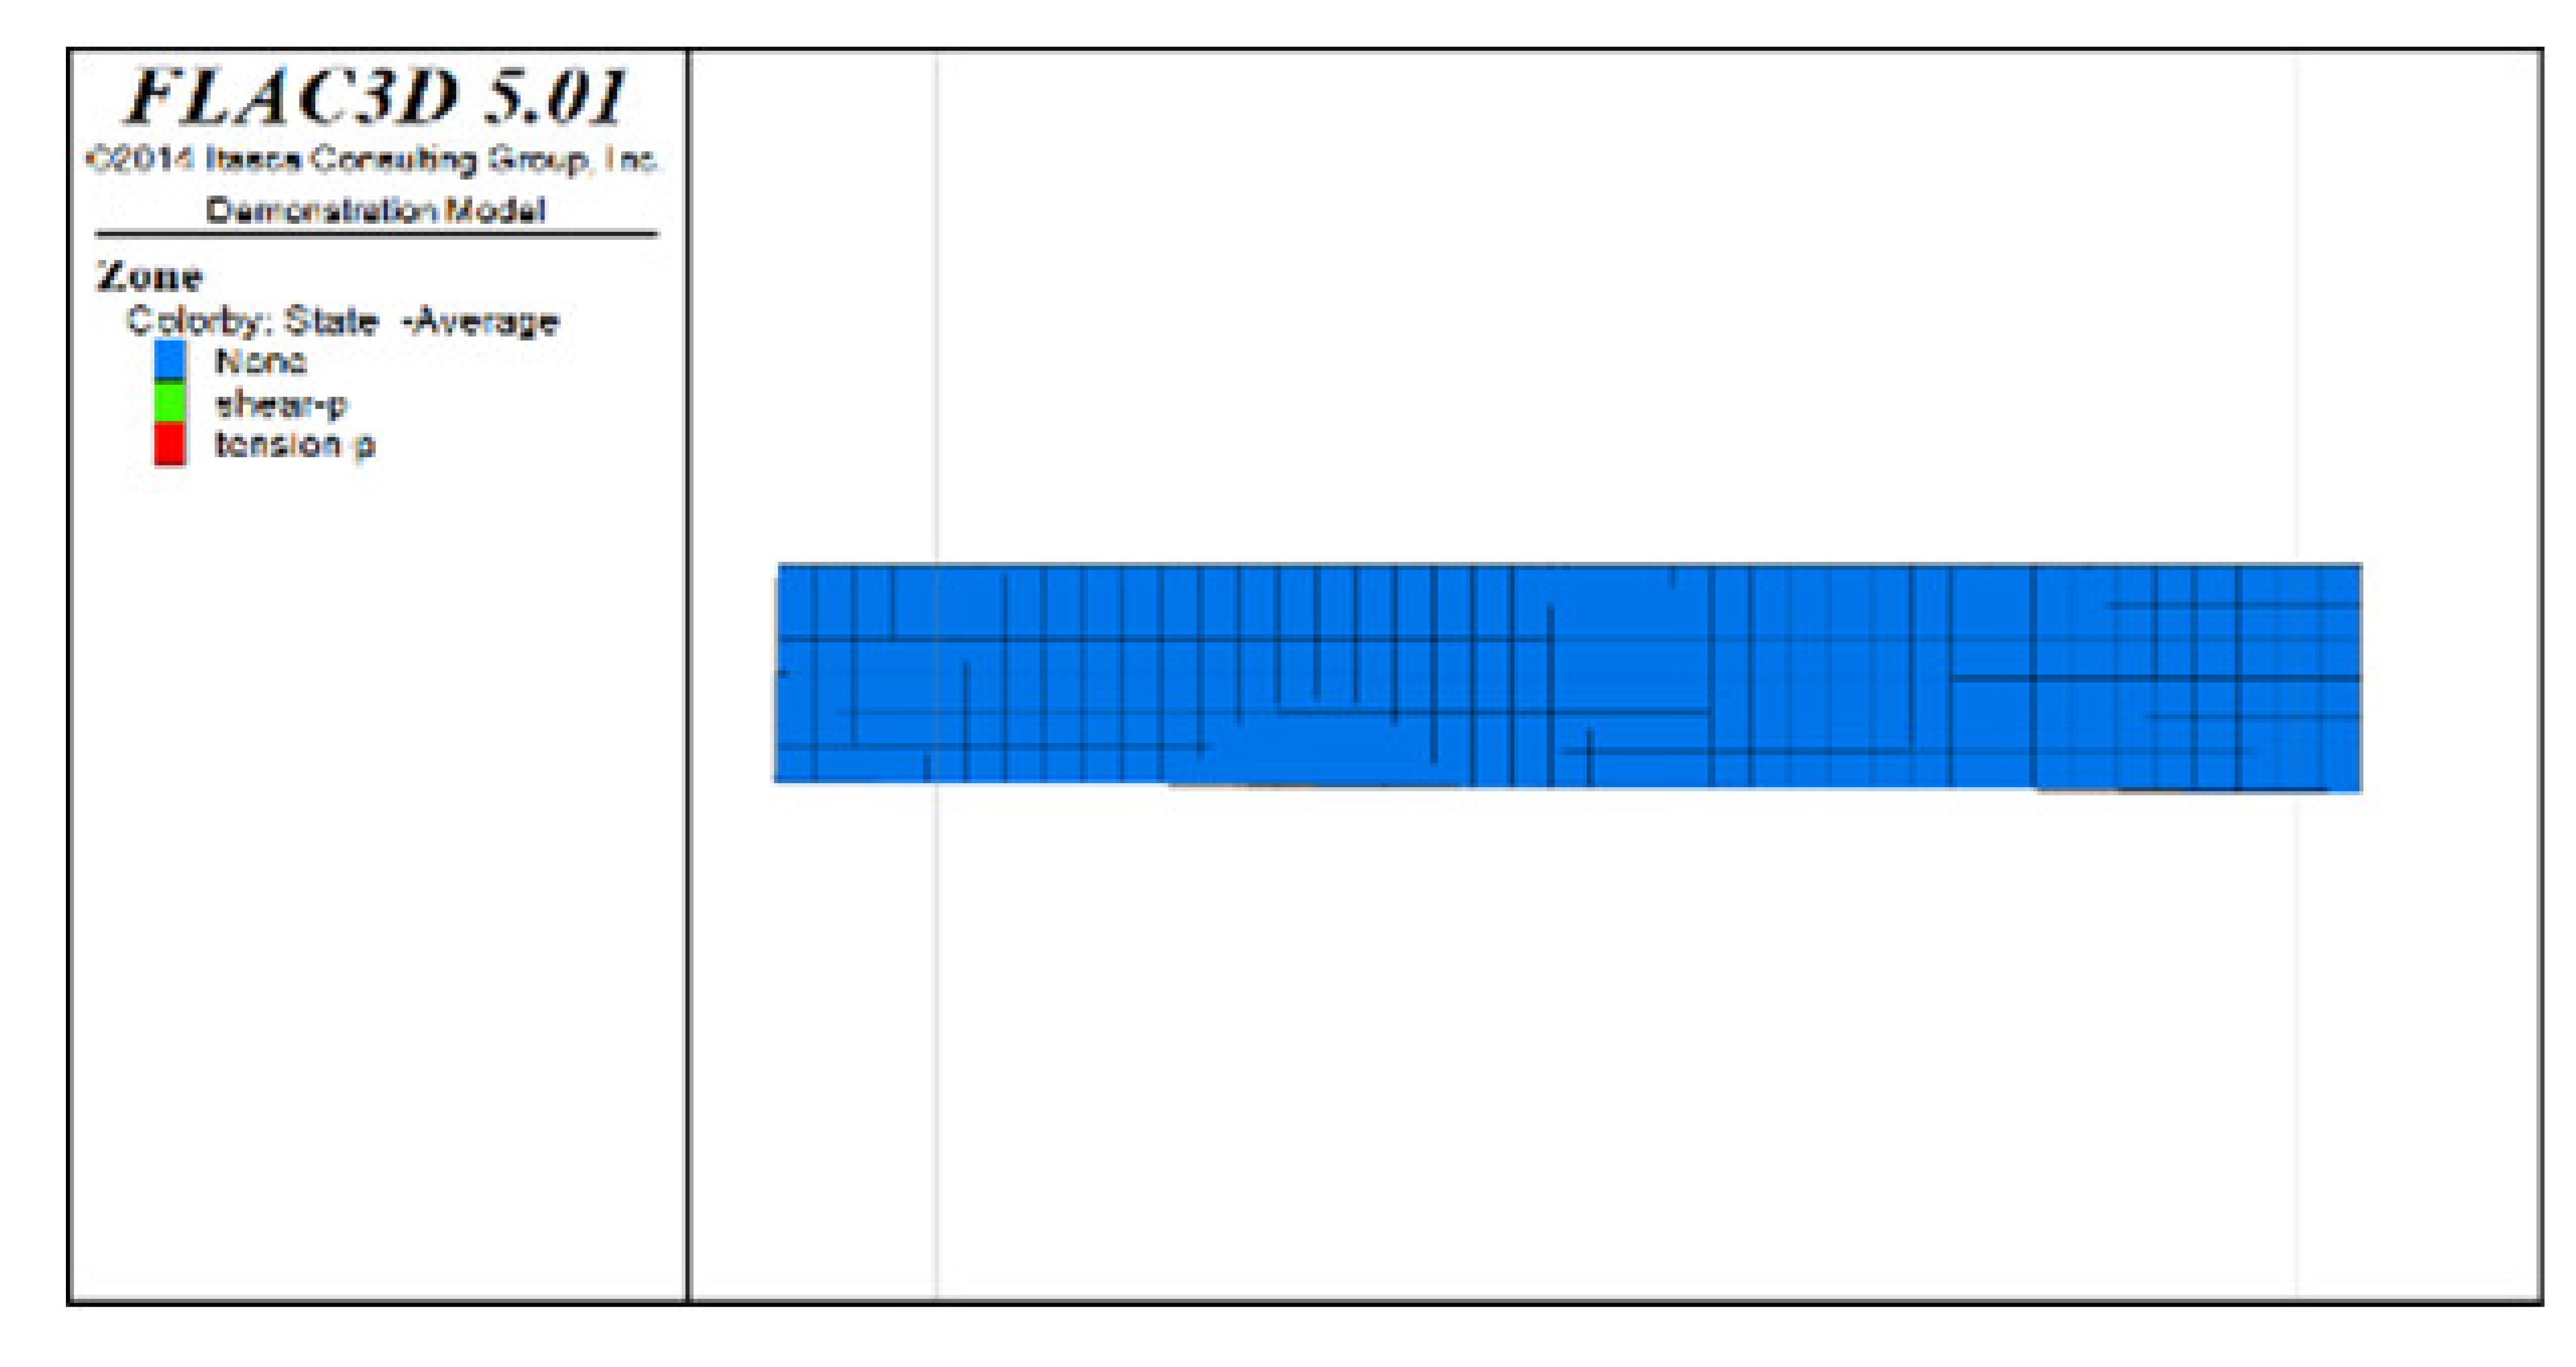 | 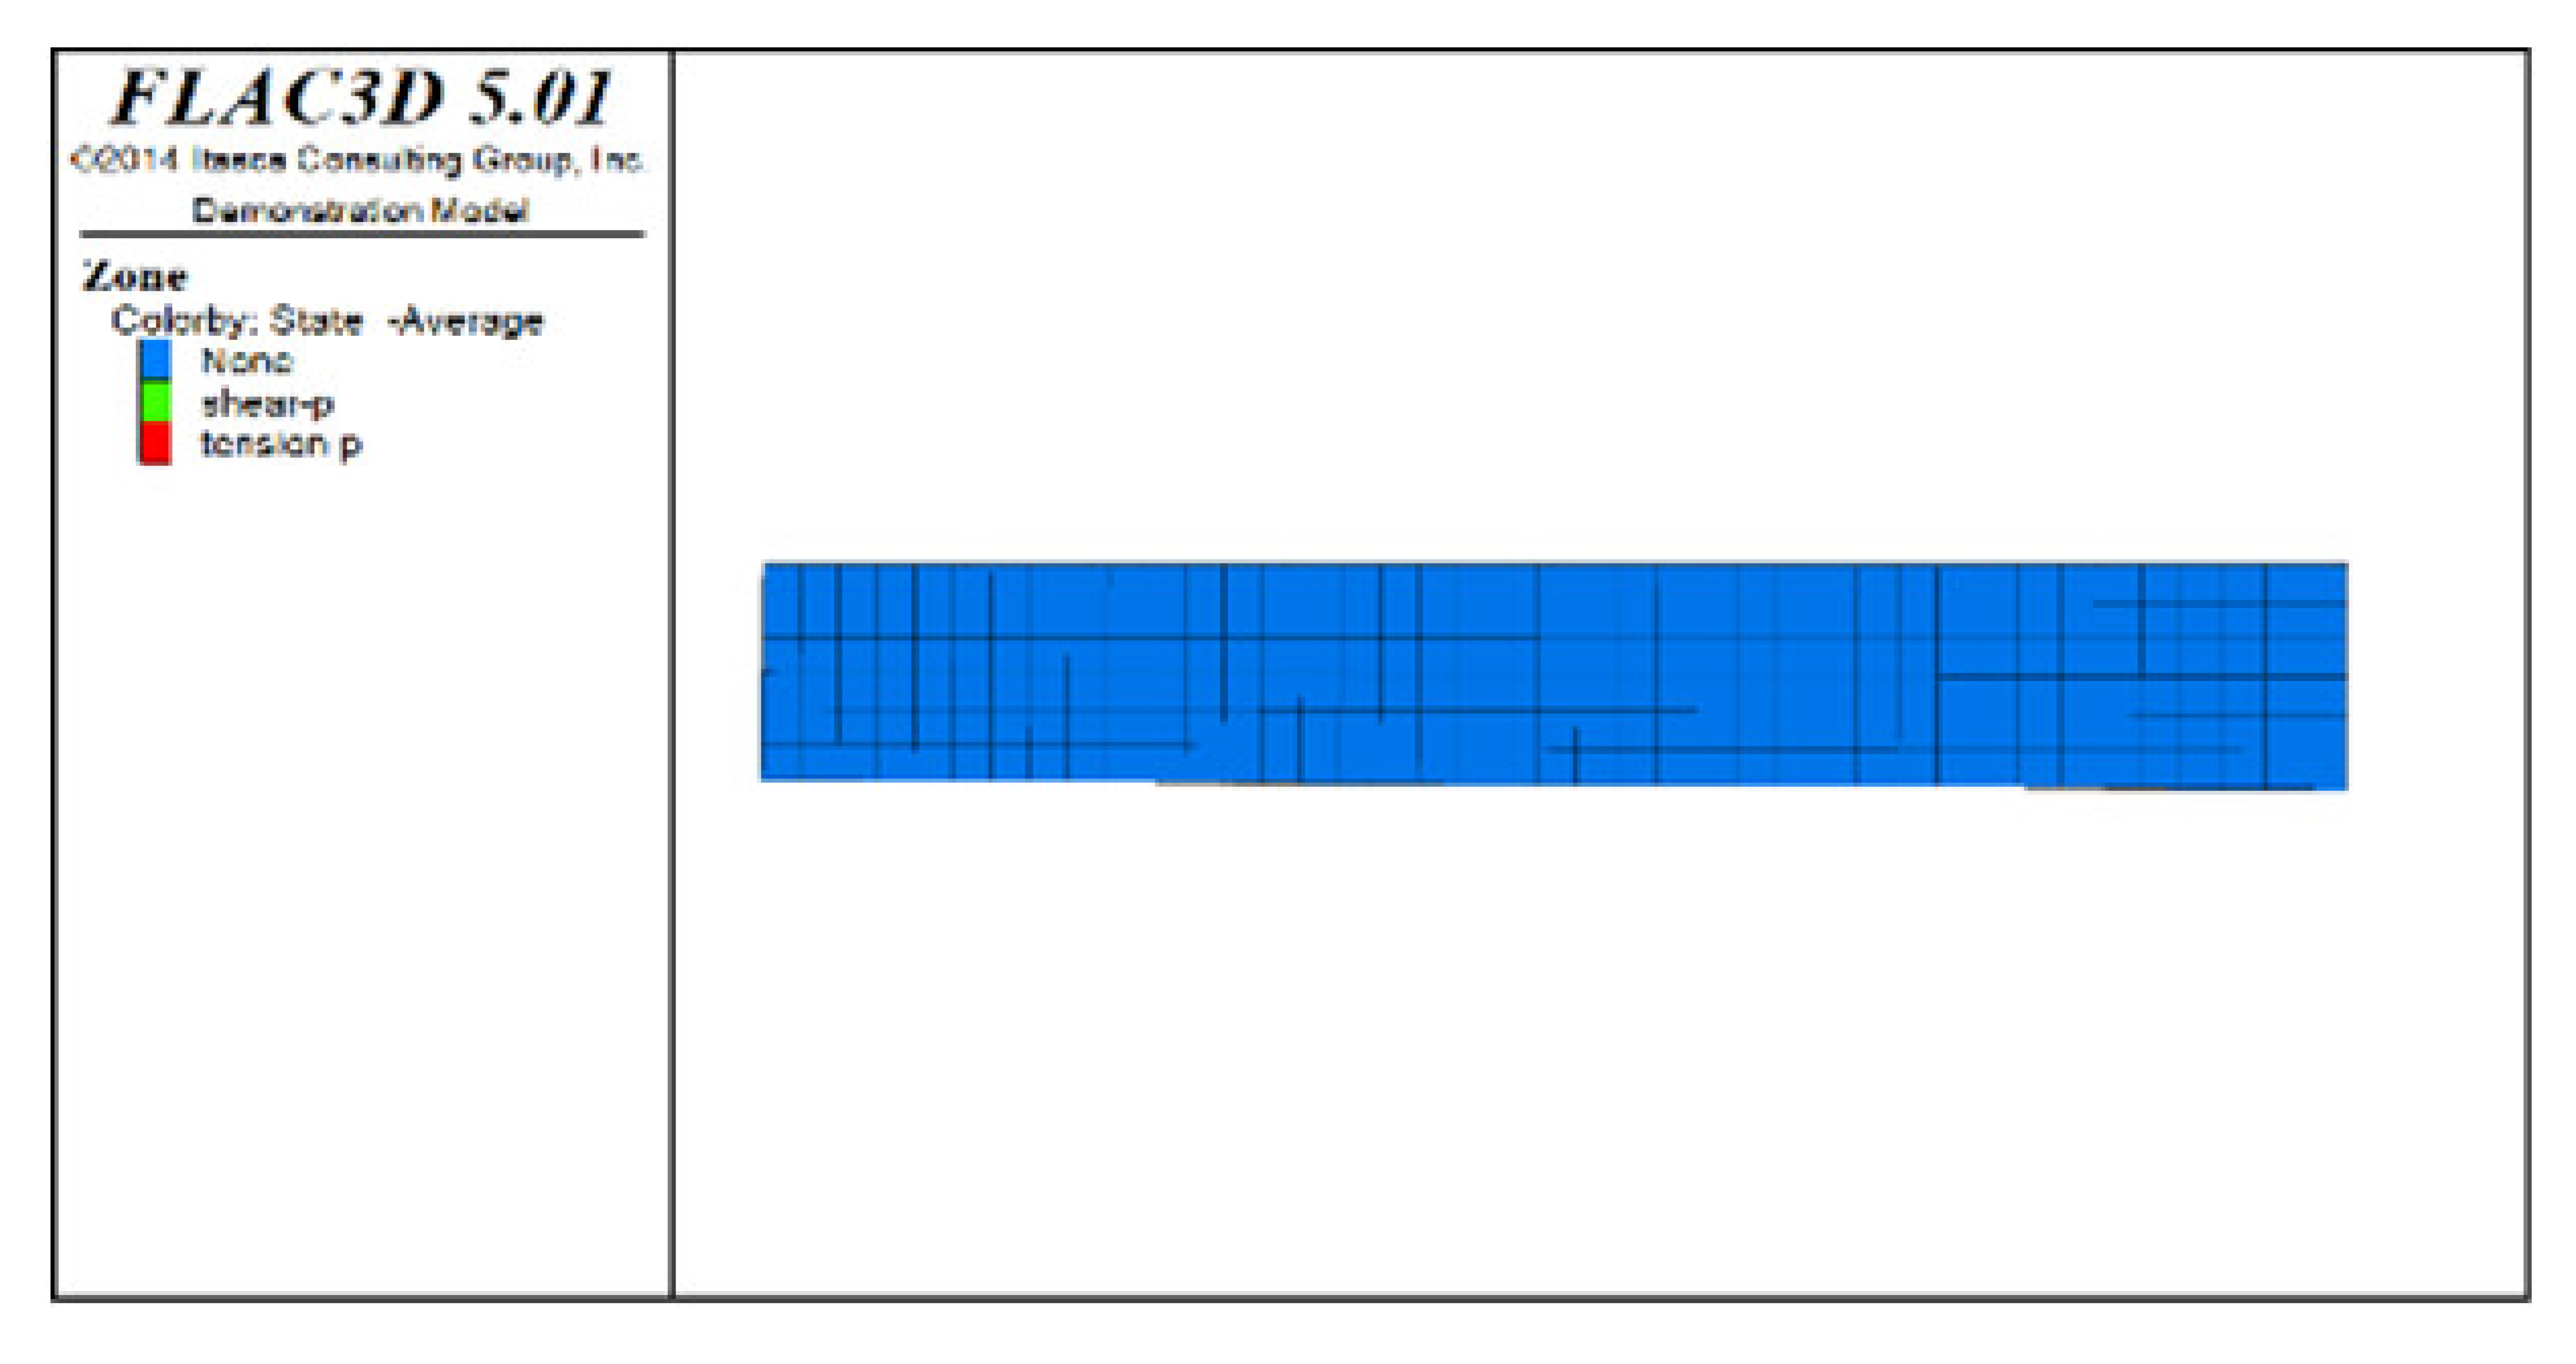 | 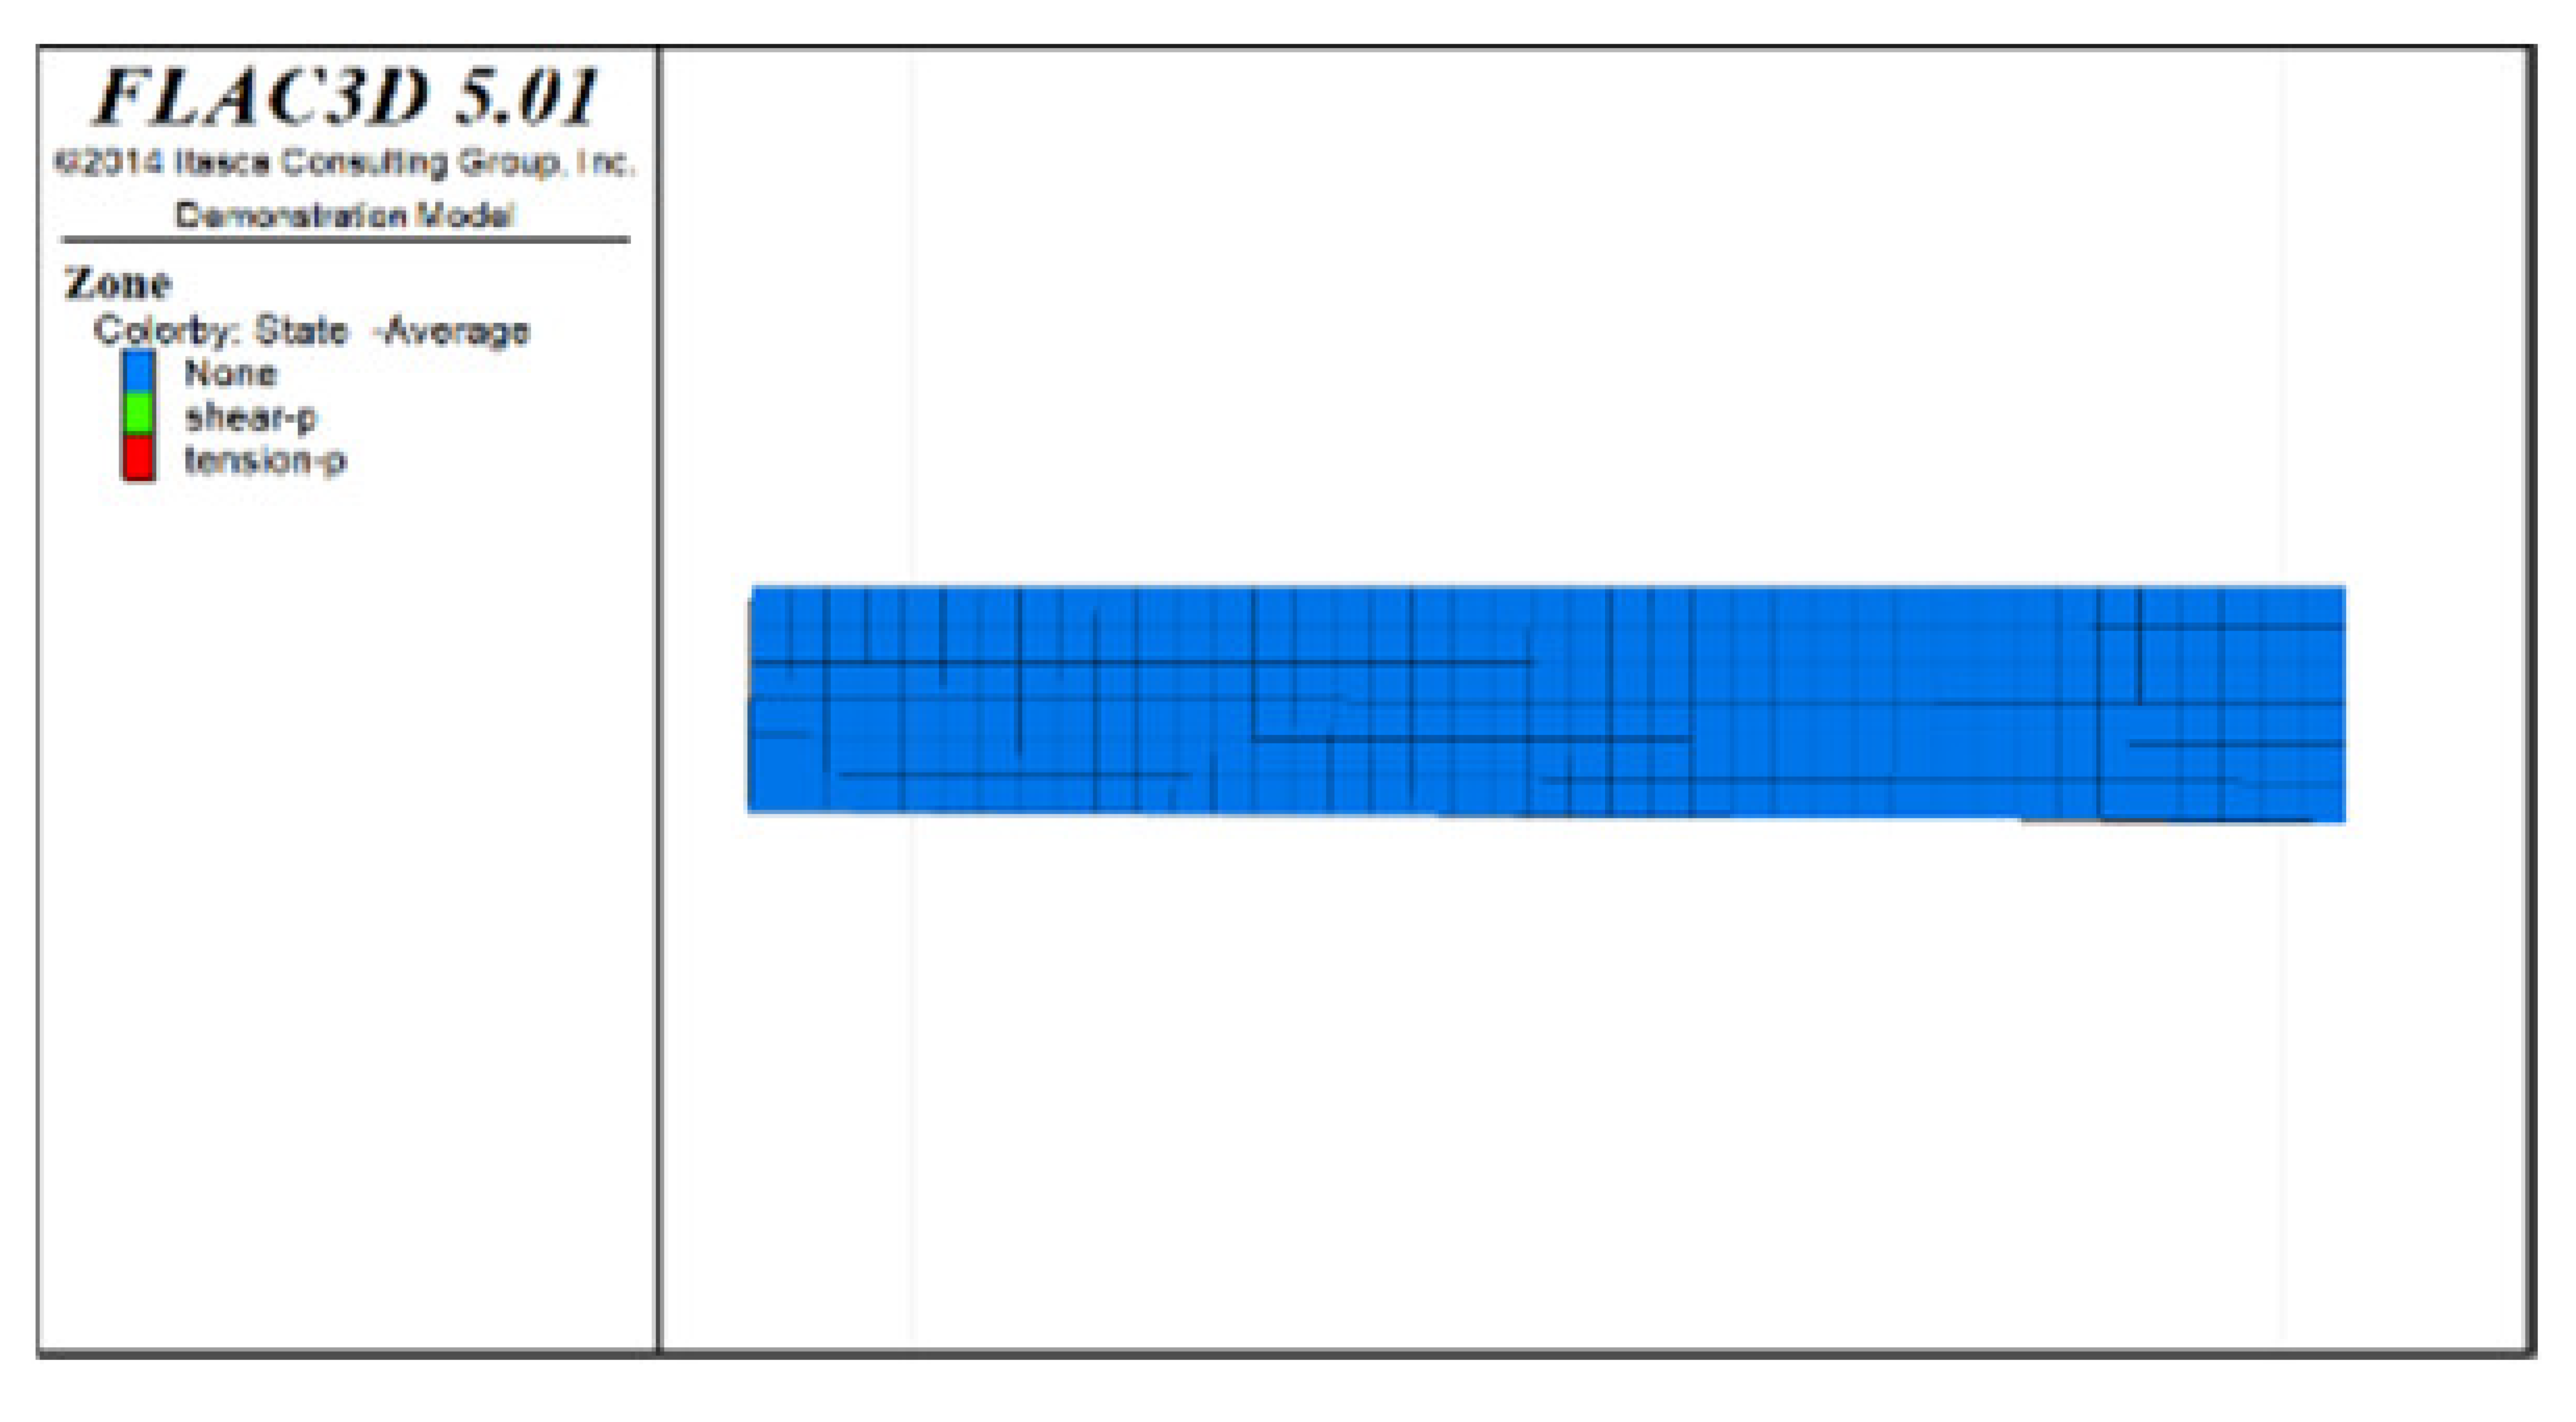 |  |
| Distribution diagram of plastic zones in the roof protection layer observed from bottom to top |  | 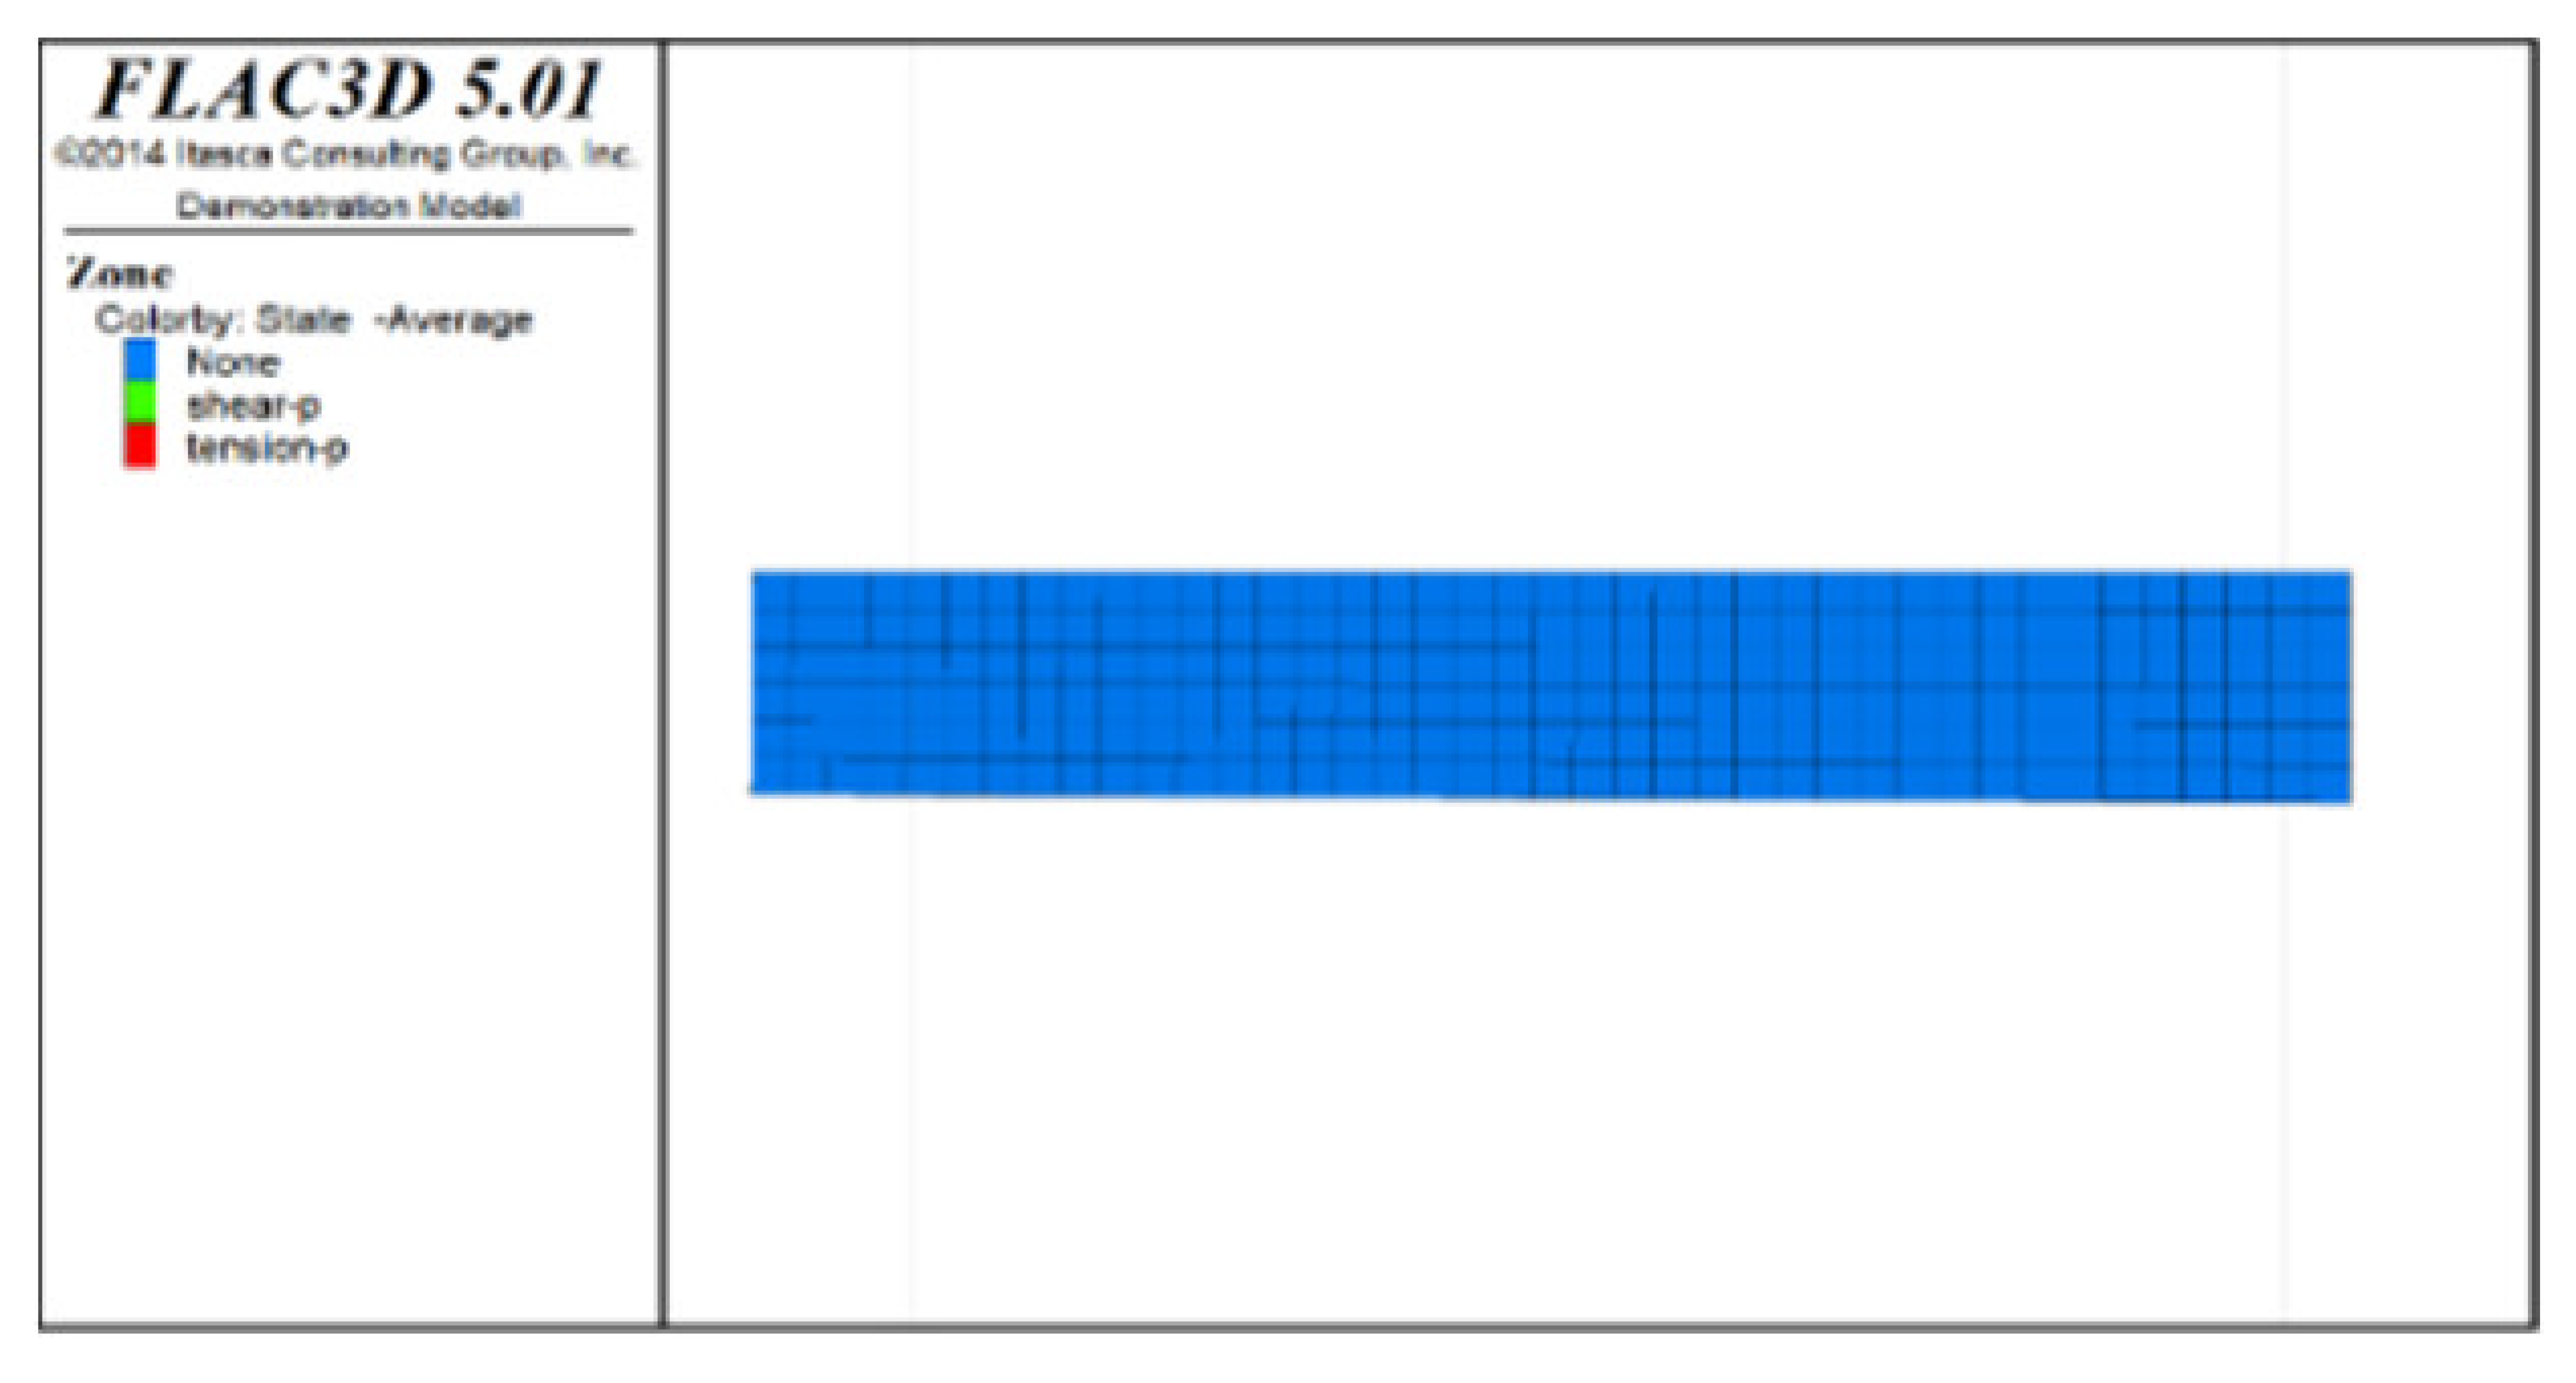 | 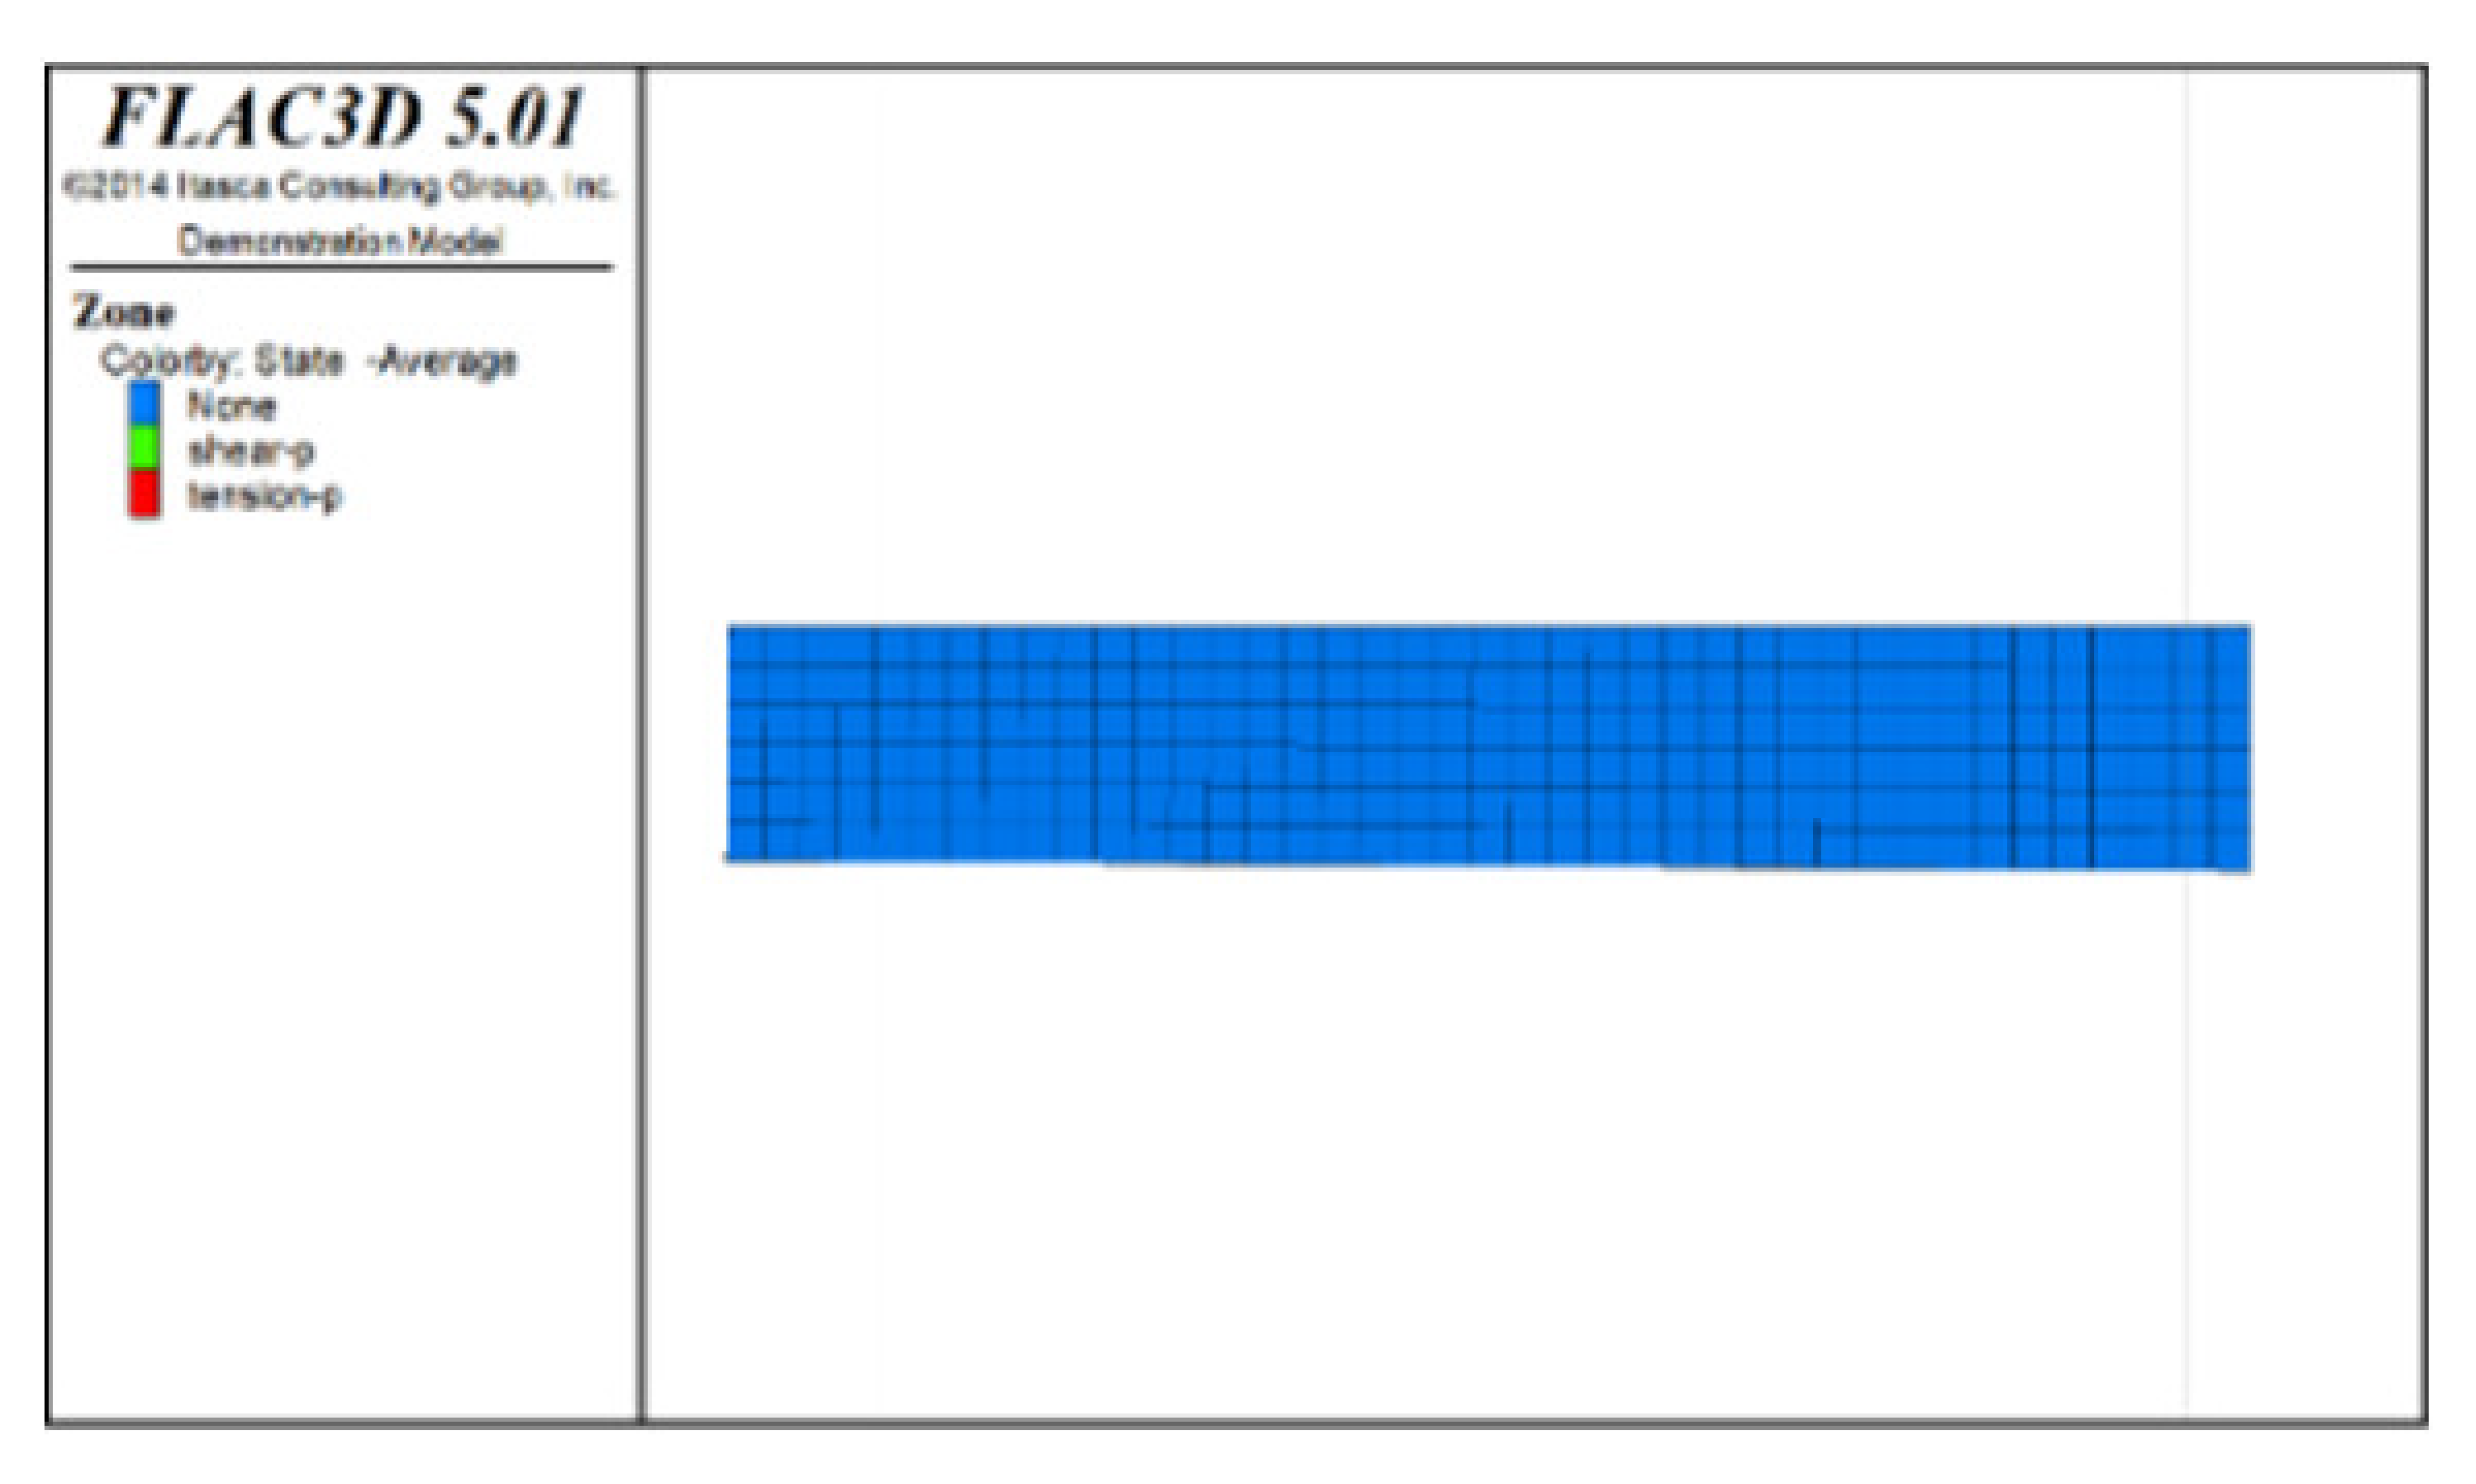 |  | |
| Excavation Stage 5 (Drifts 5, 12 and 19 of Scheme C; and Drifts 2, 4 and 6 of Scheme D) | Backfill Stage 5 (Drifts 5, 12 and 19 of Scheme C; and Drifts 2, 4 and 6 of Scheme D) | Excavation Stage 6 (Drifts 6, 13 and 20 of Scheme C; and Drifts 8, 10 and 12 of Scheme D) | Backfill Stage 6 (Drifts 6, 13 and 20 of Scheme C; and Drifts 8, 10 and 12 of Scheme D) | ||
|---|---|---|---|---|---|
| Scheme C | Distribution diagram of plastic zones in the roof protection layer observed from top to bottom | 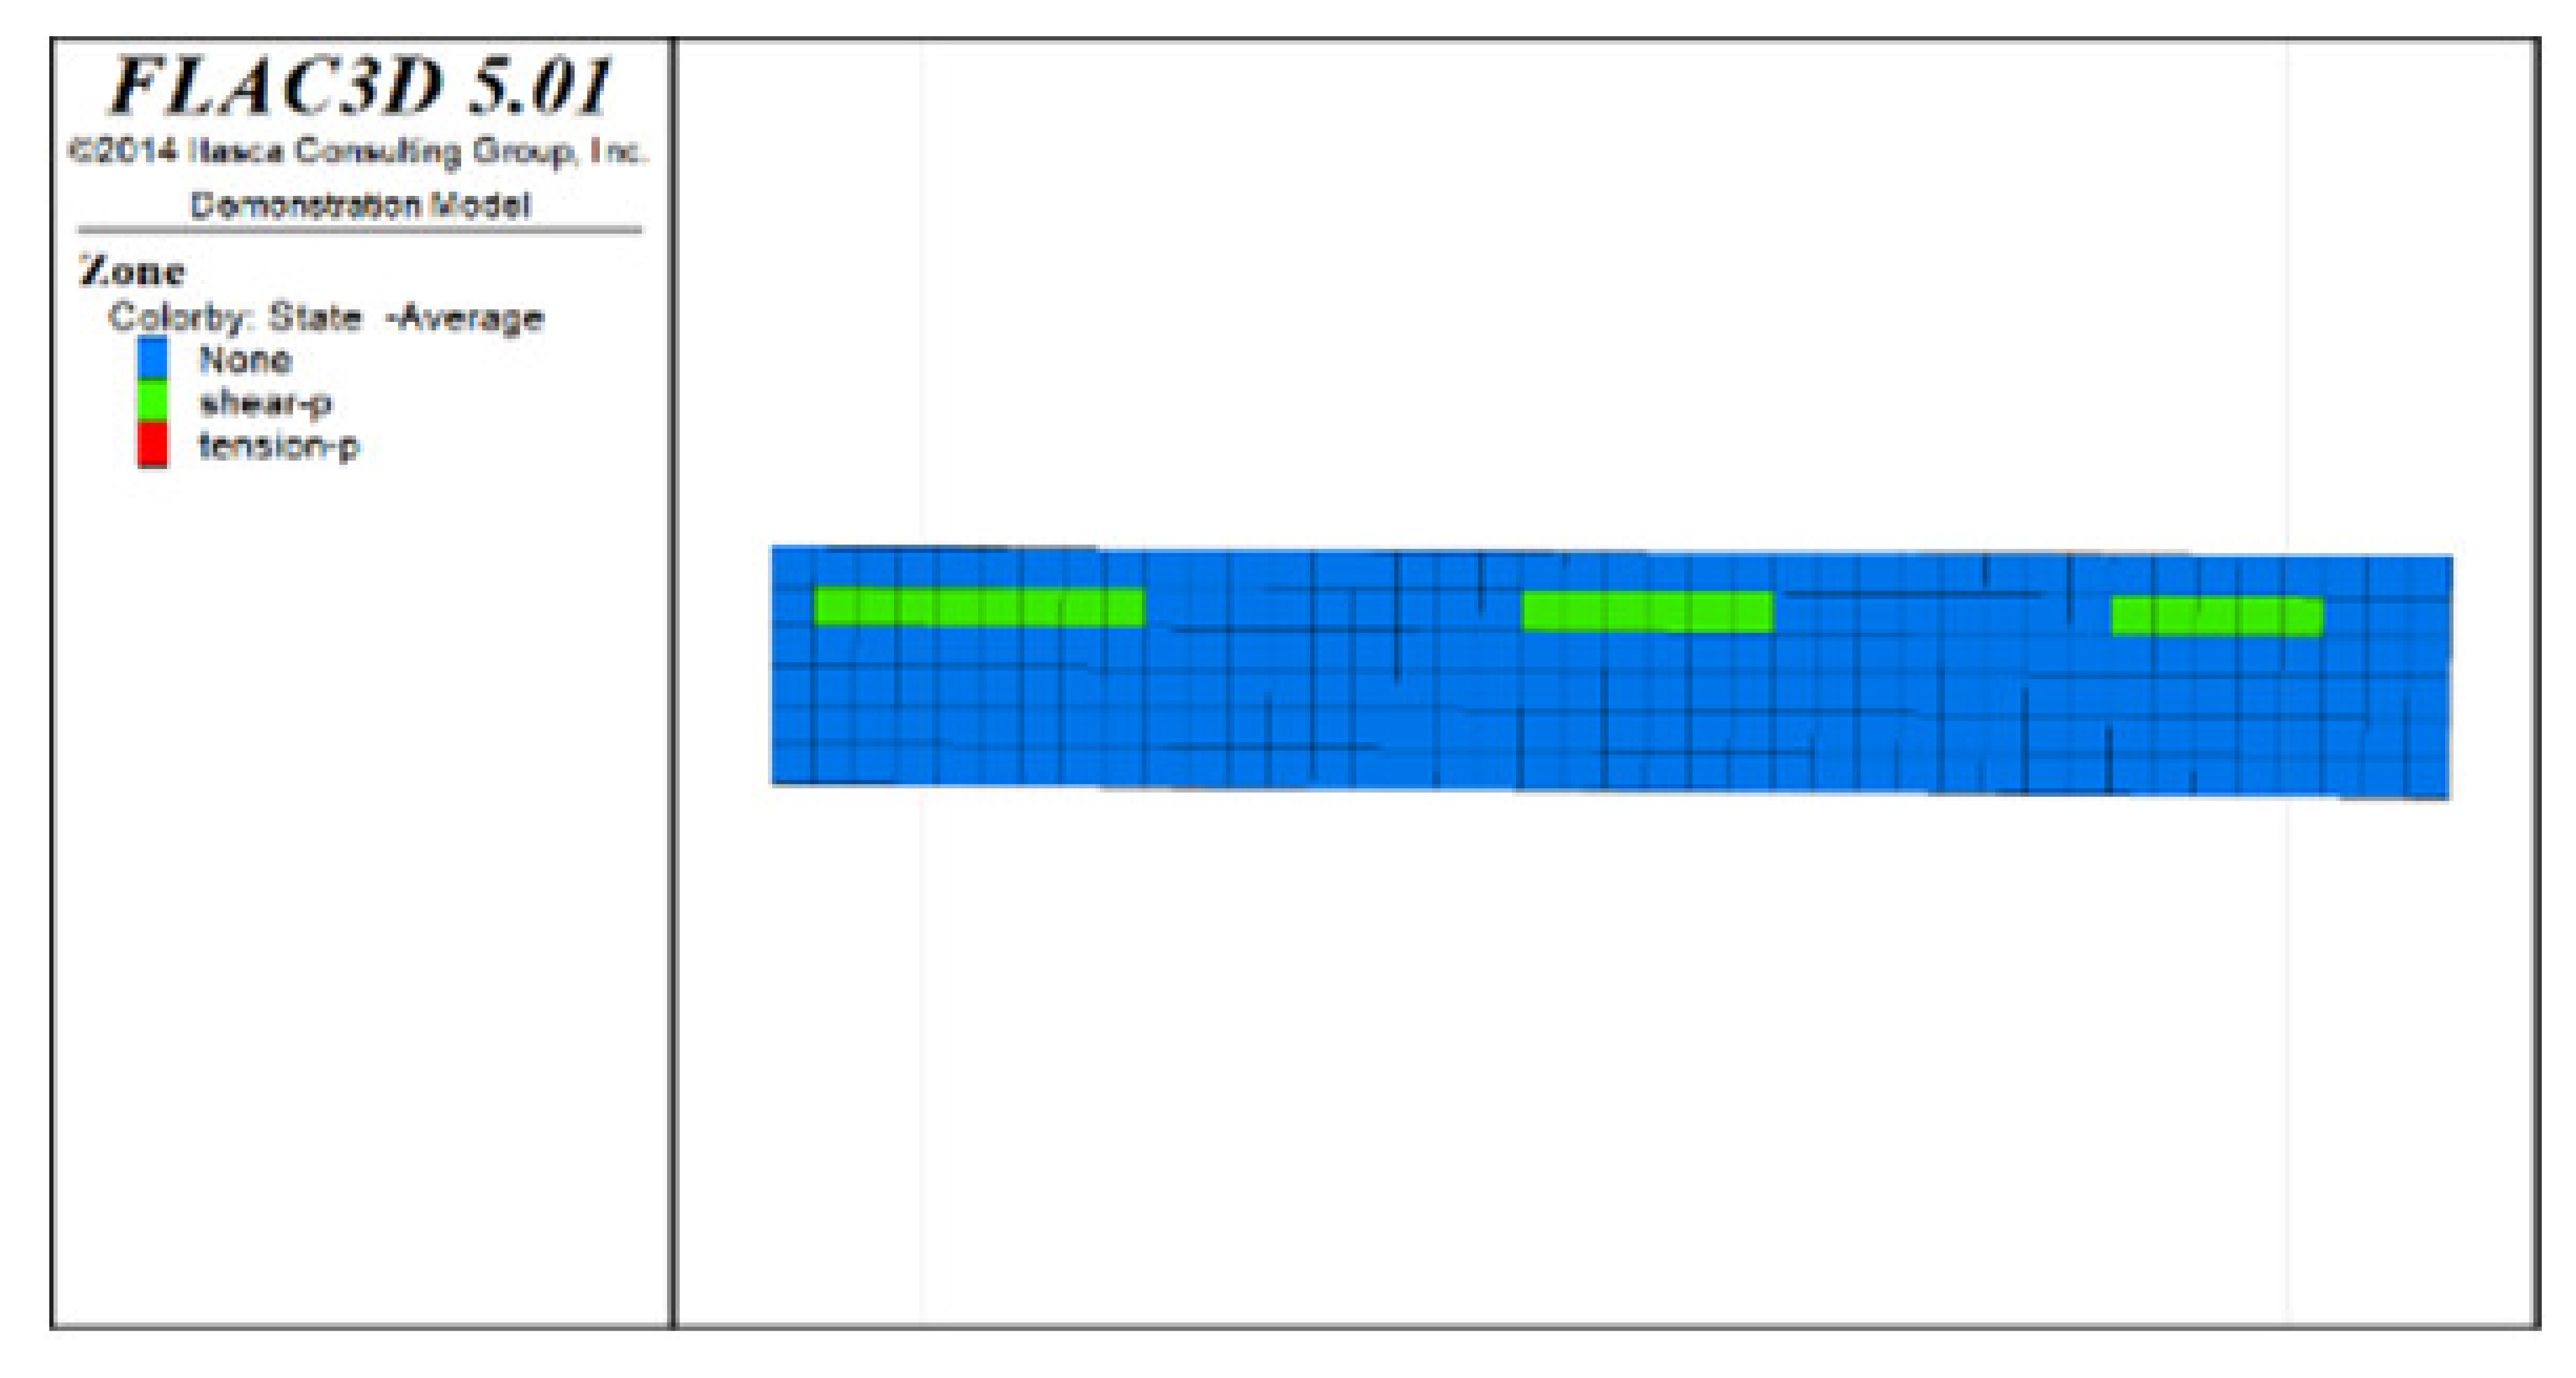 | 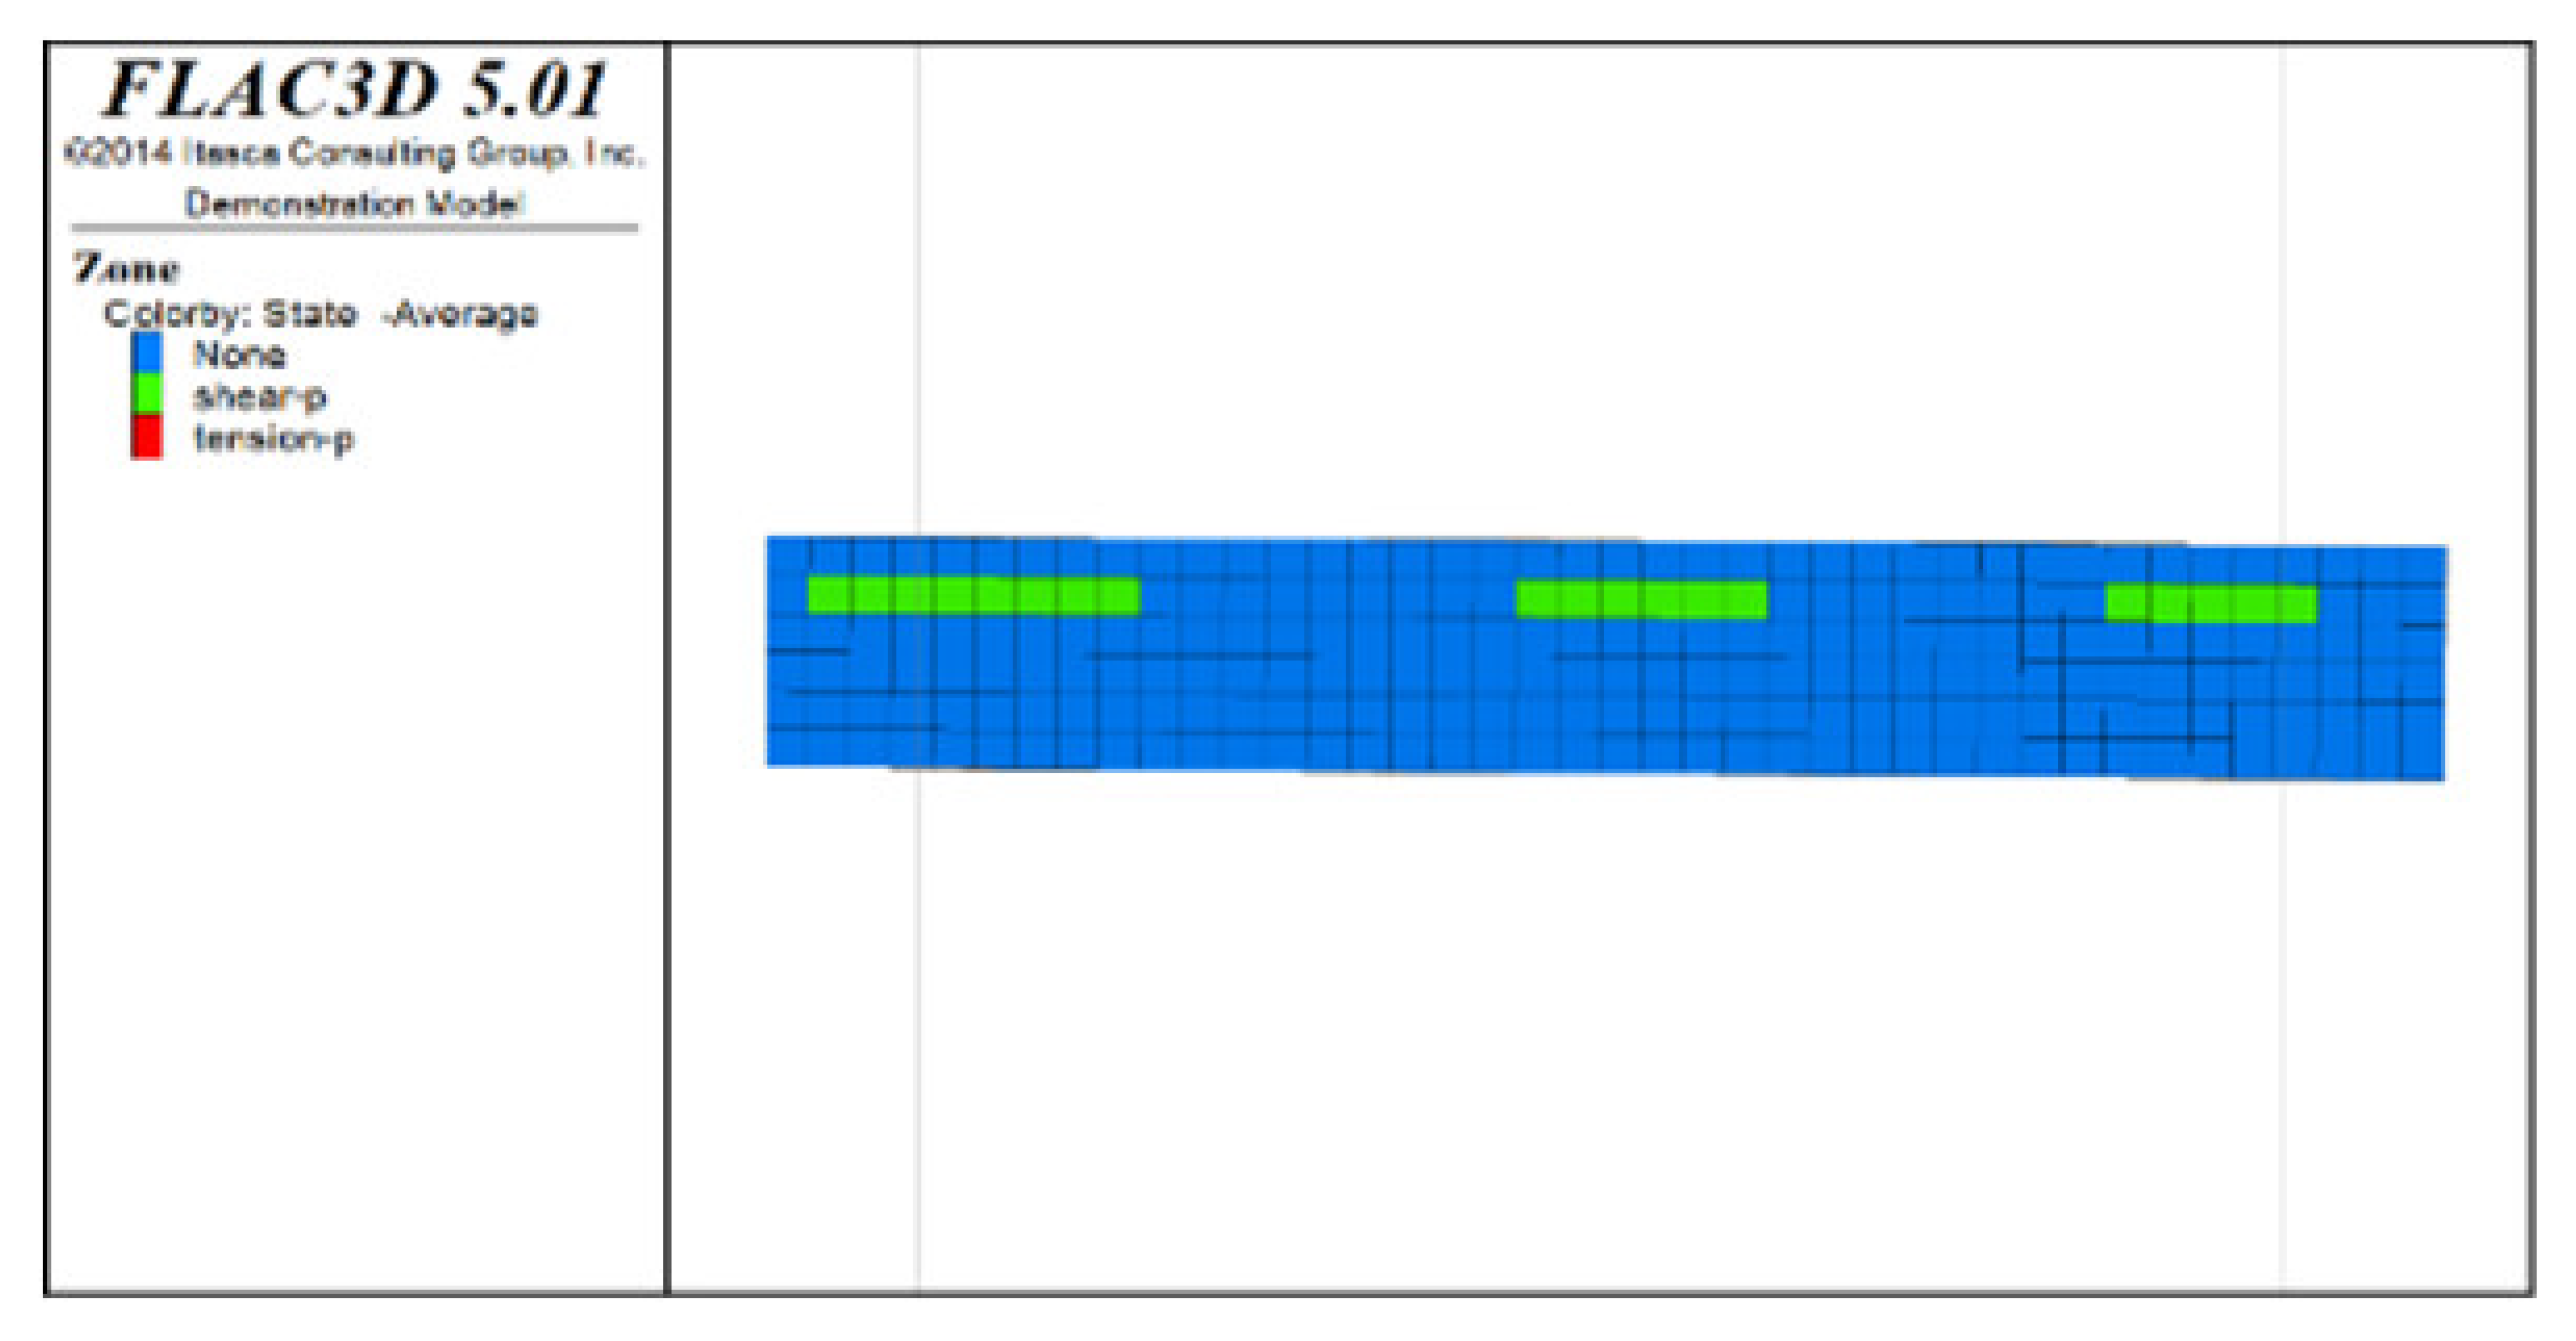 | 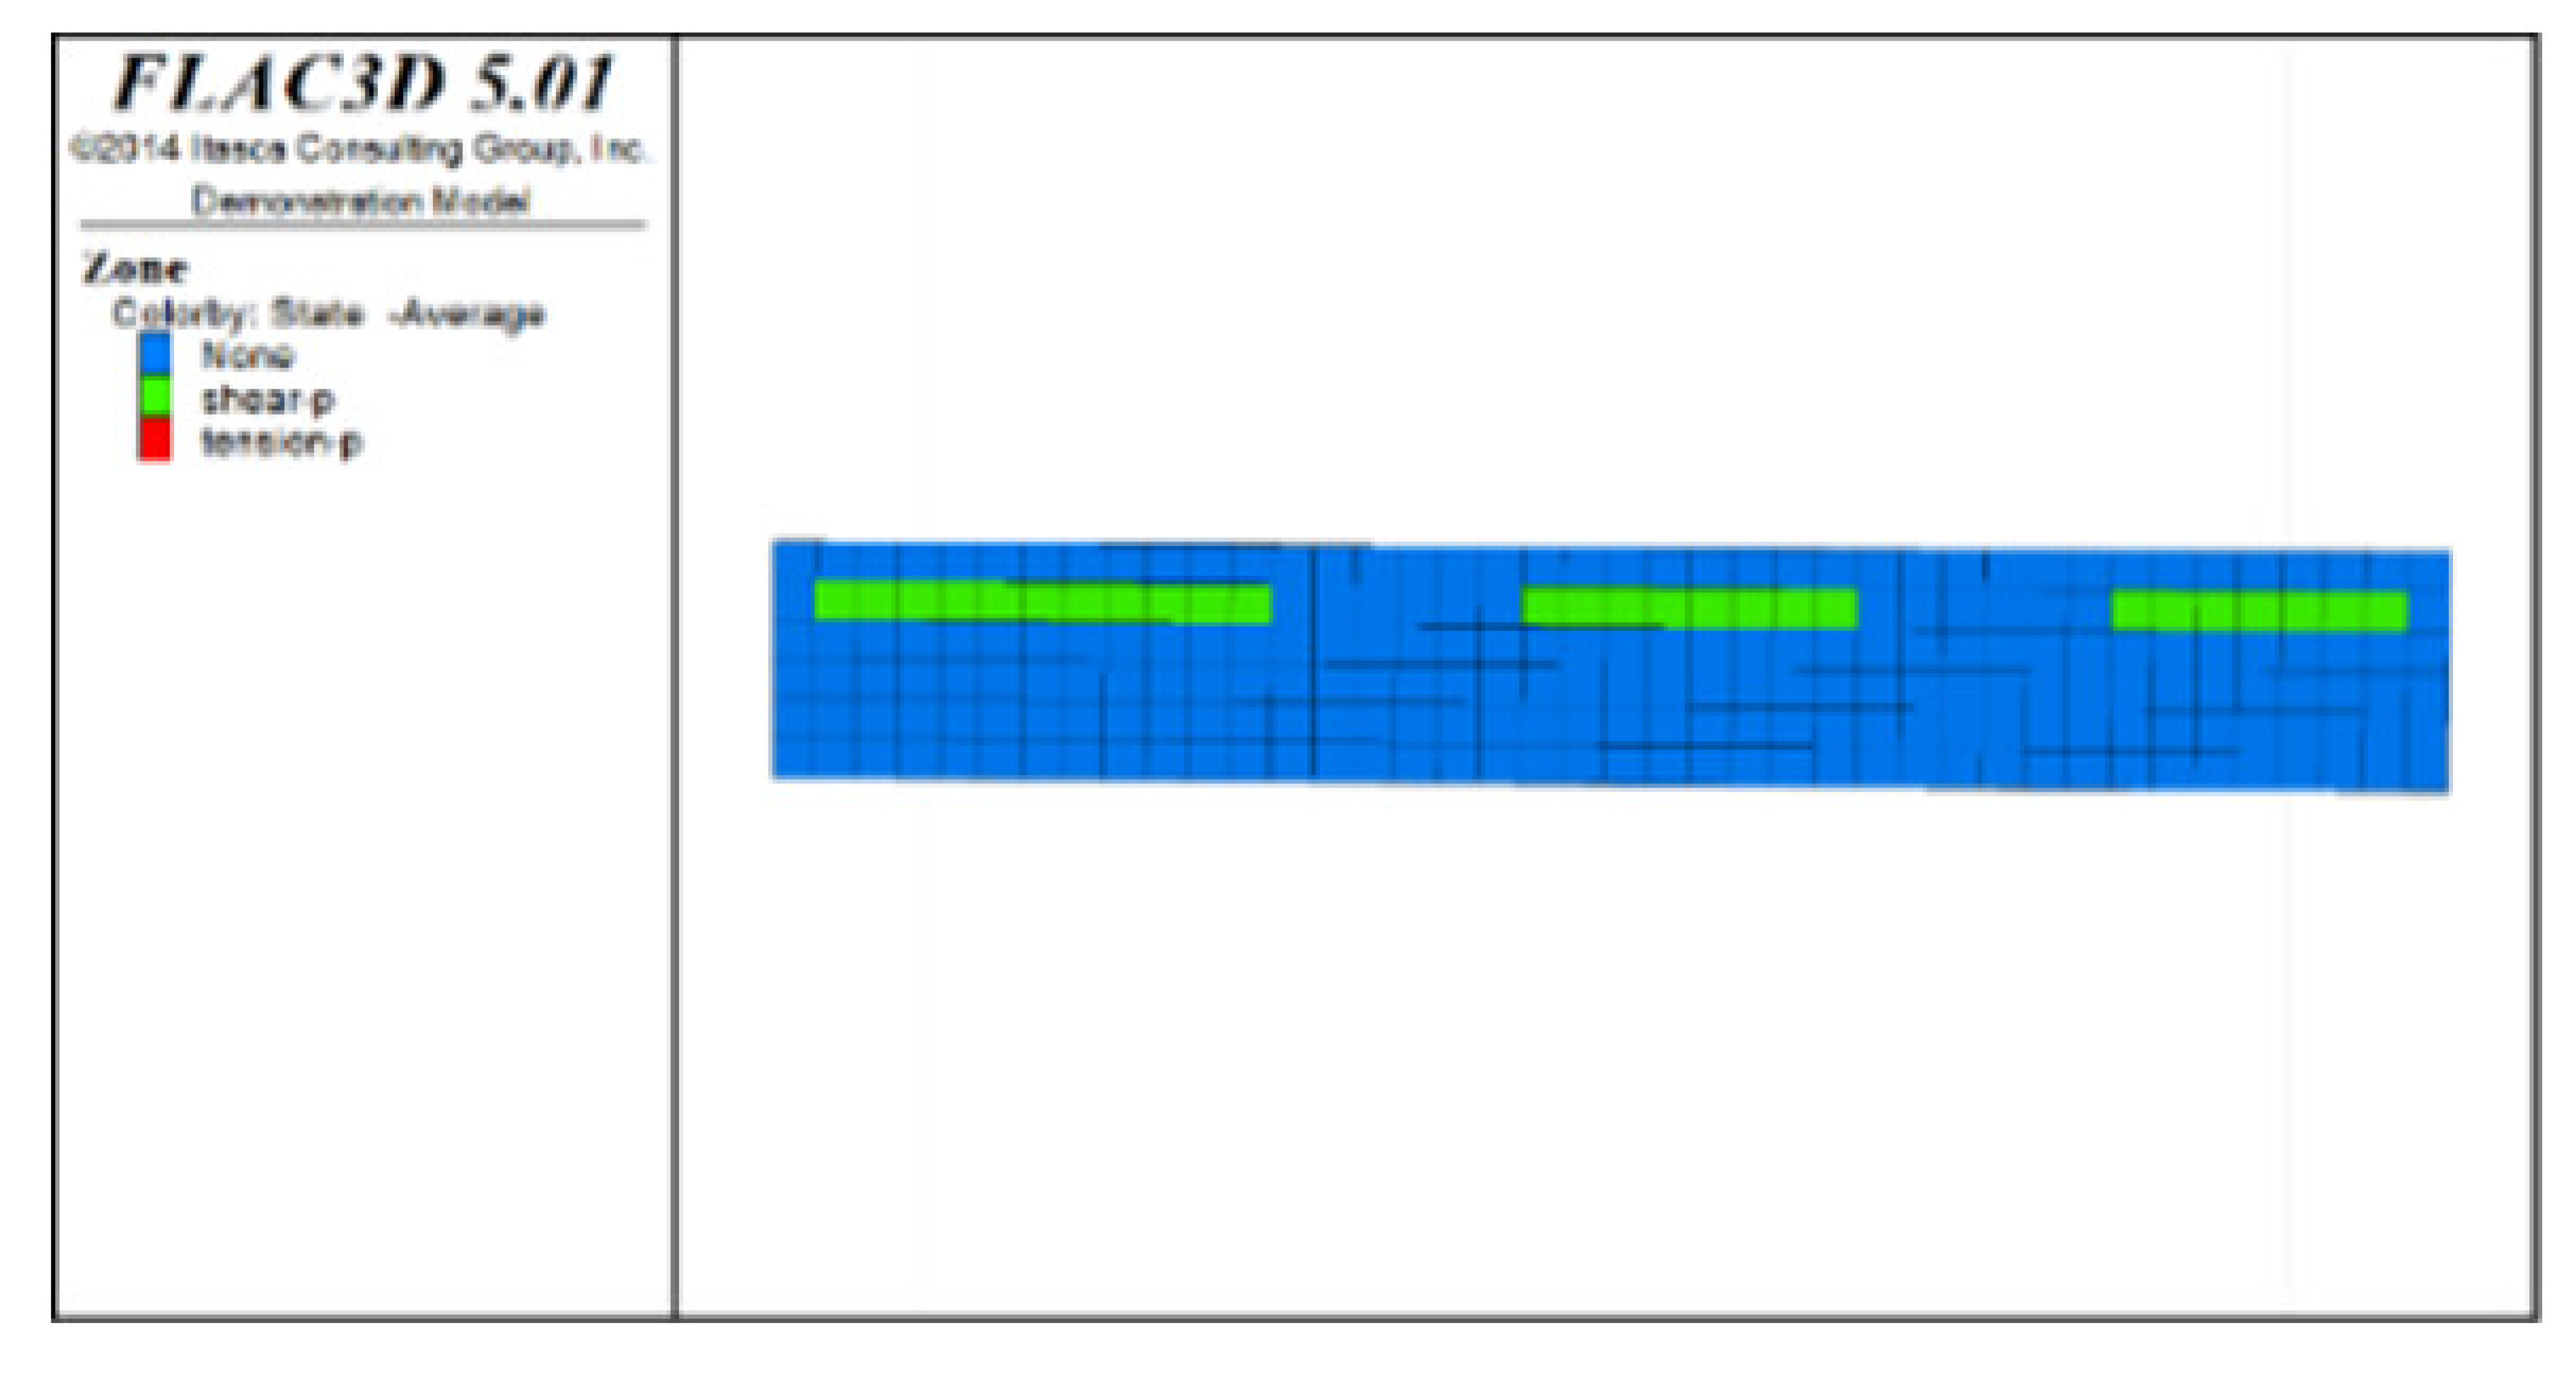 |  |
| Distribution diagram of plastic zones in the roof protection layer observed from bottom to top | 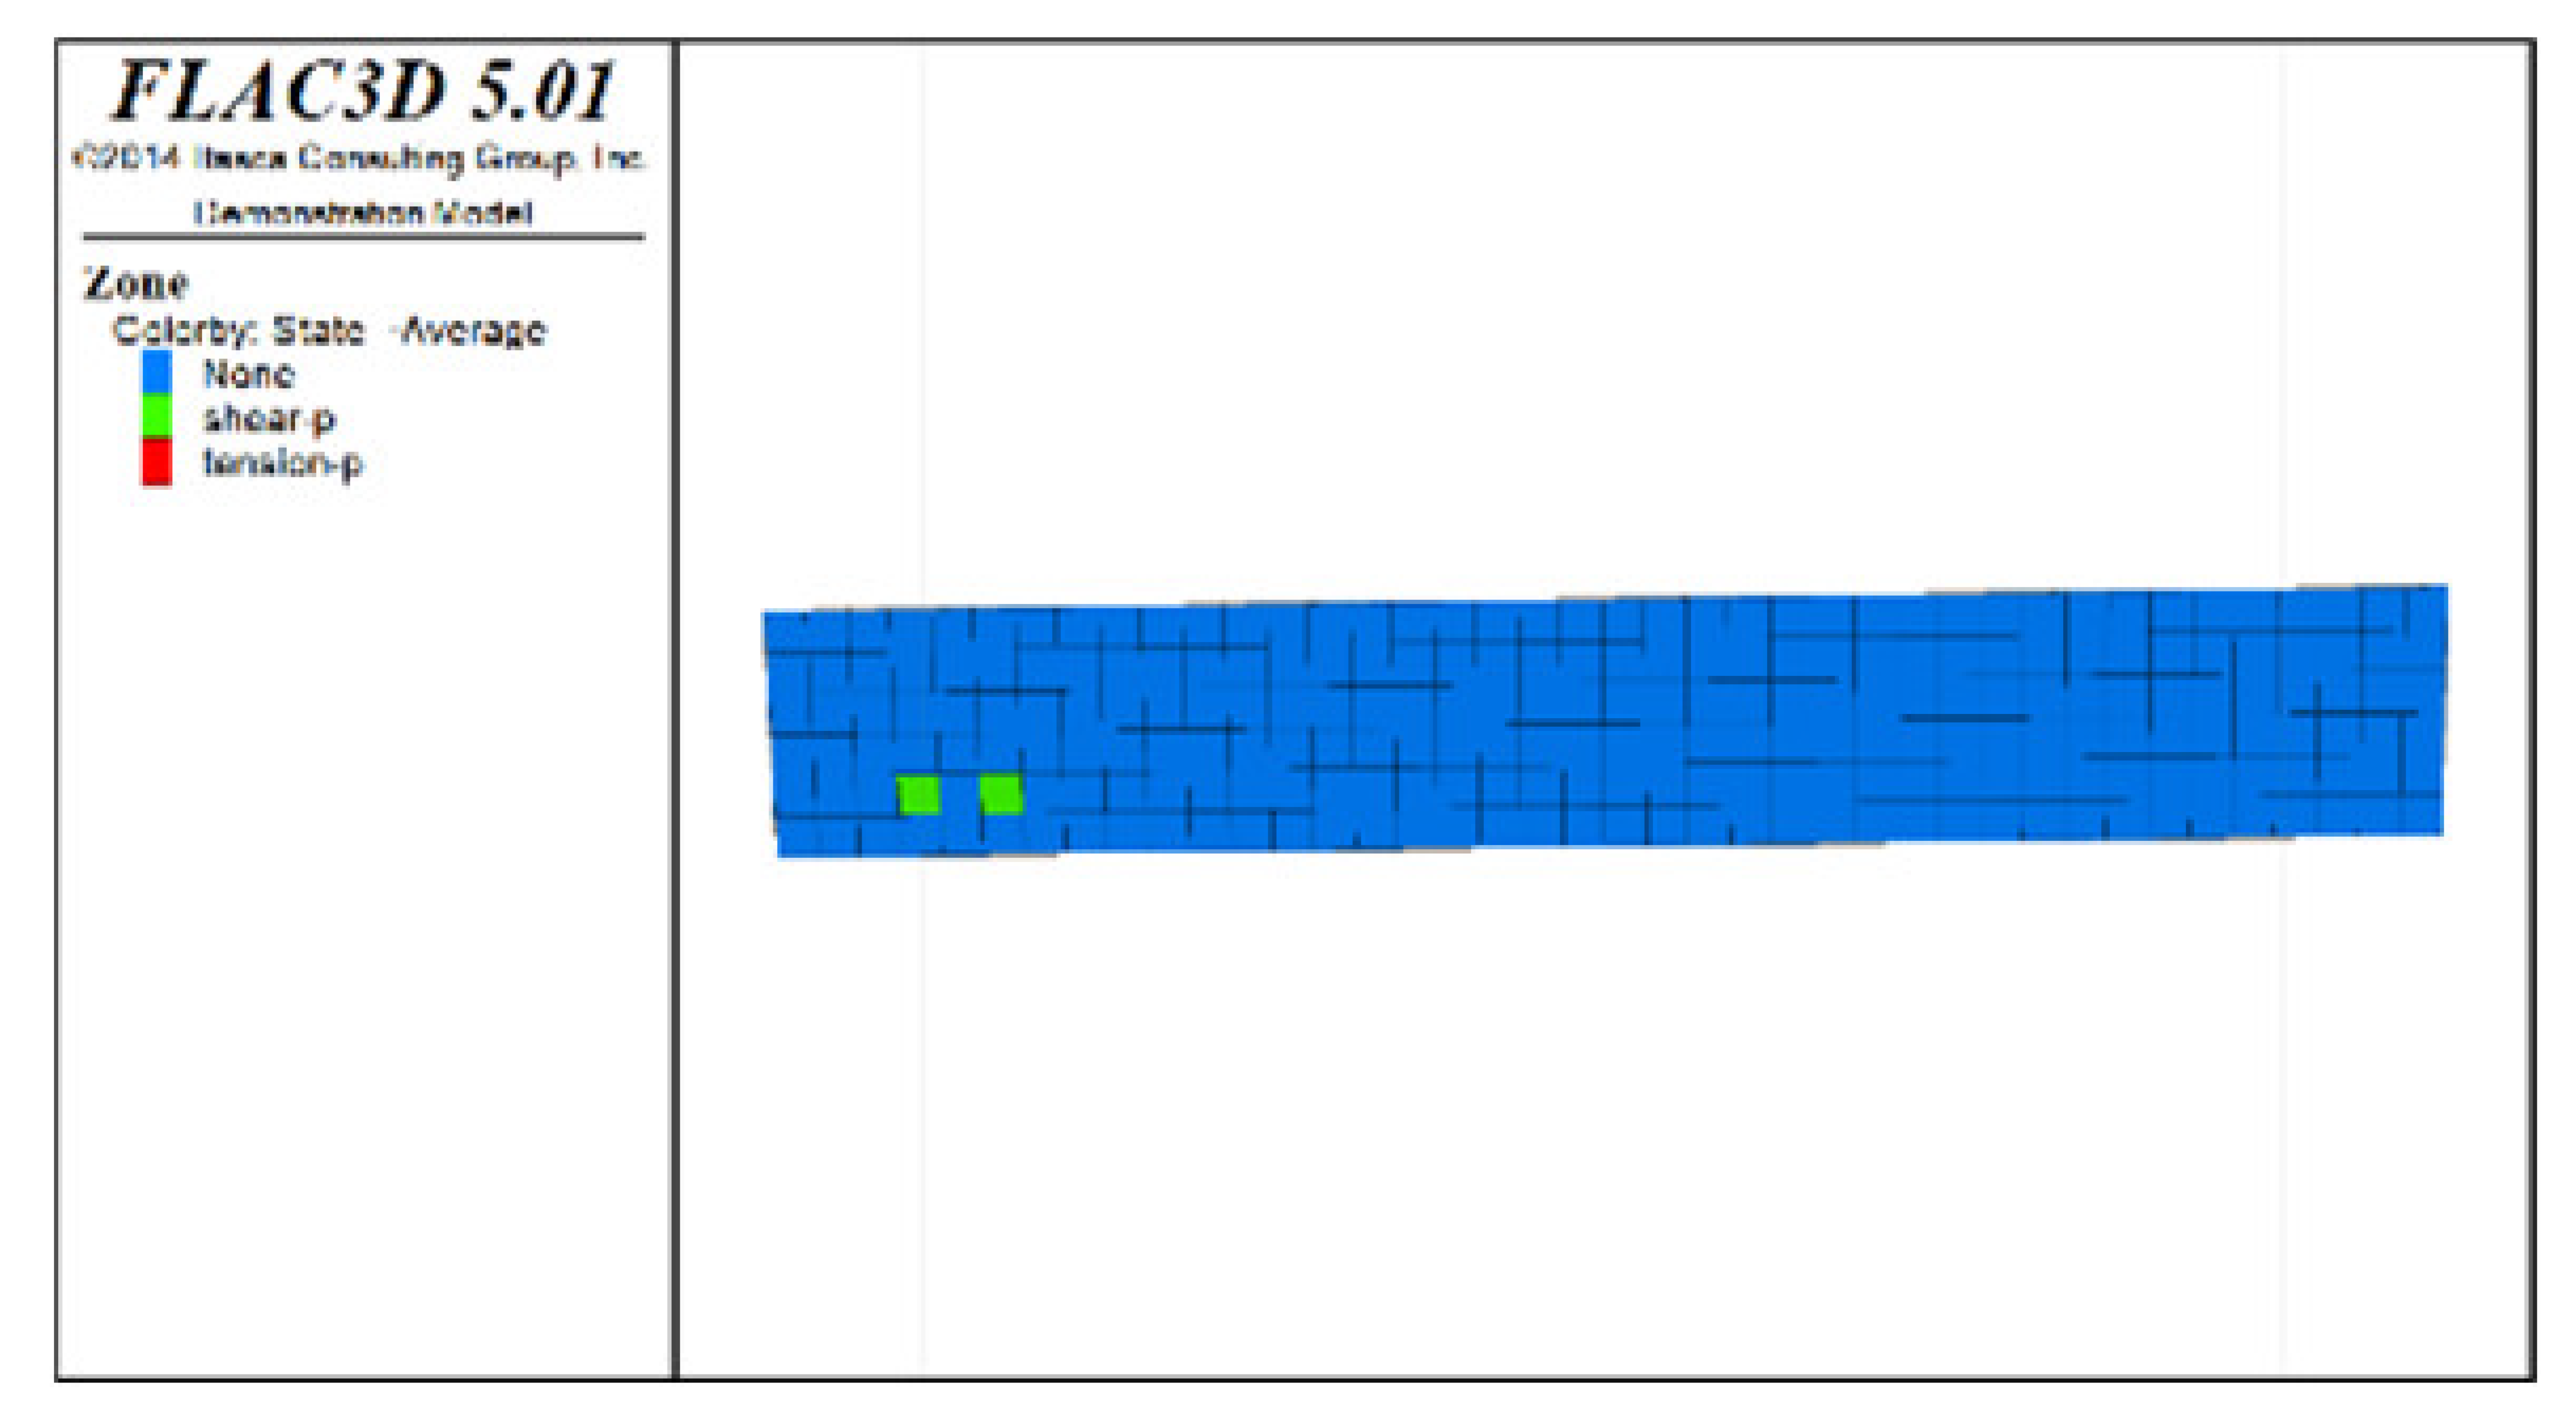 | 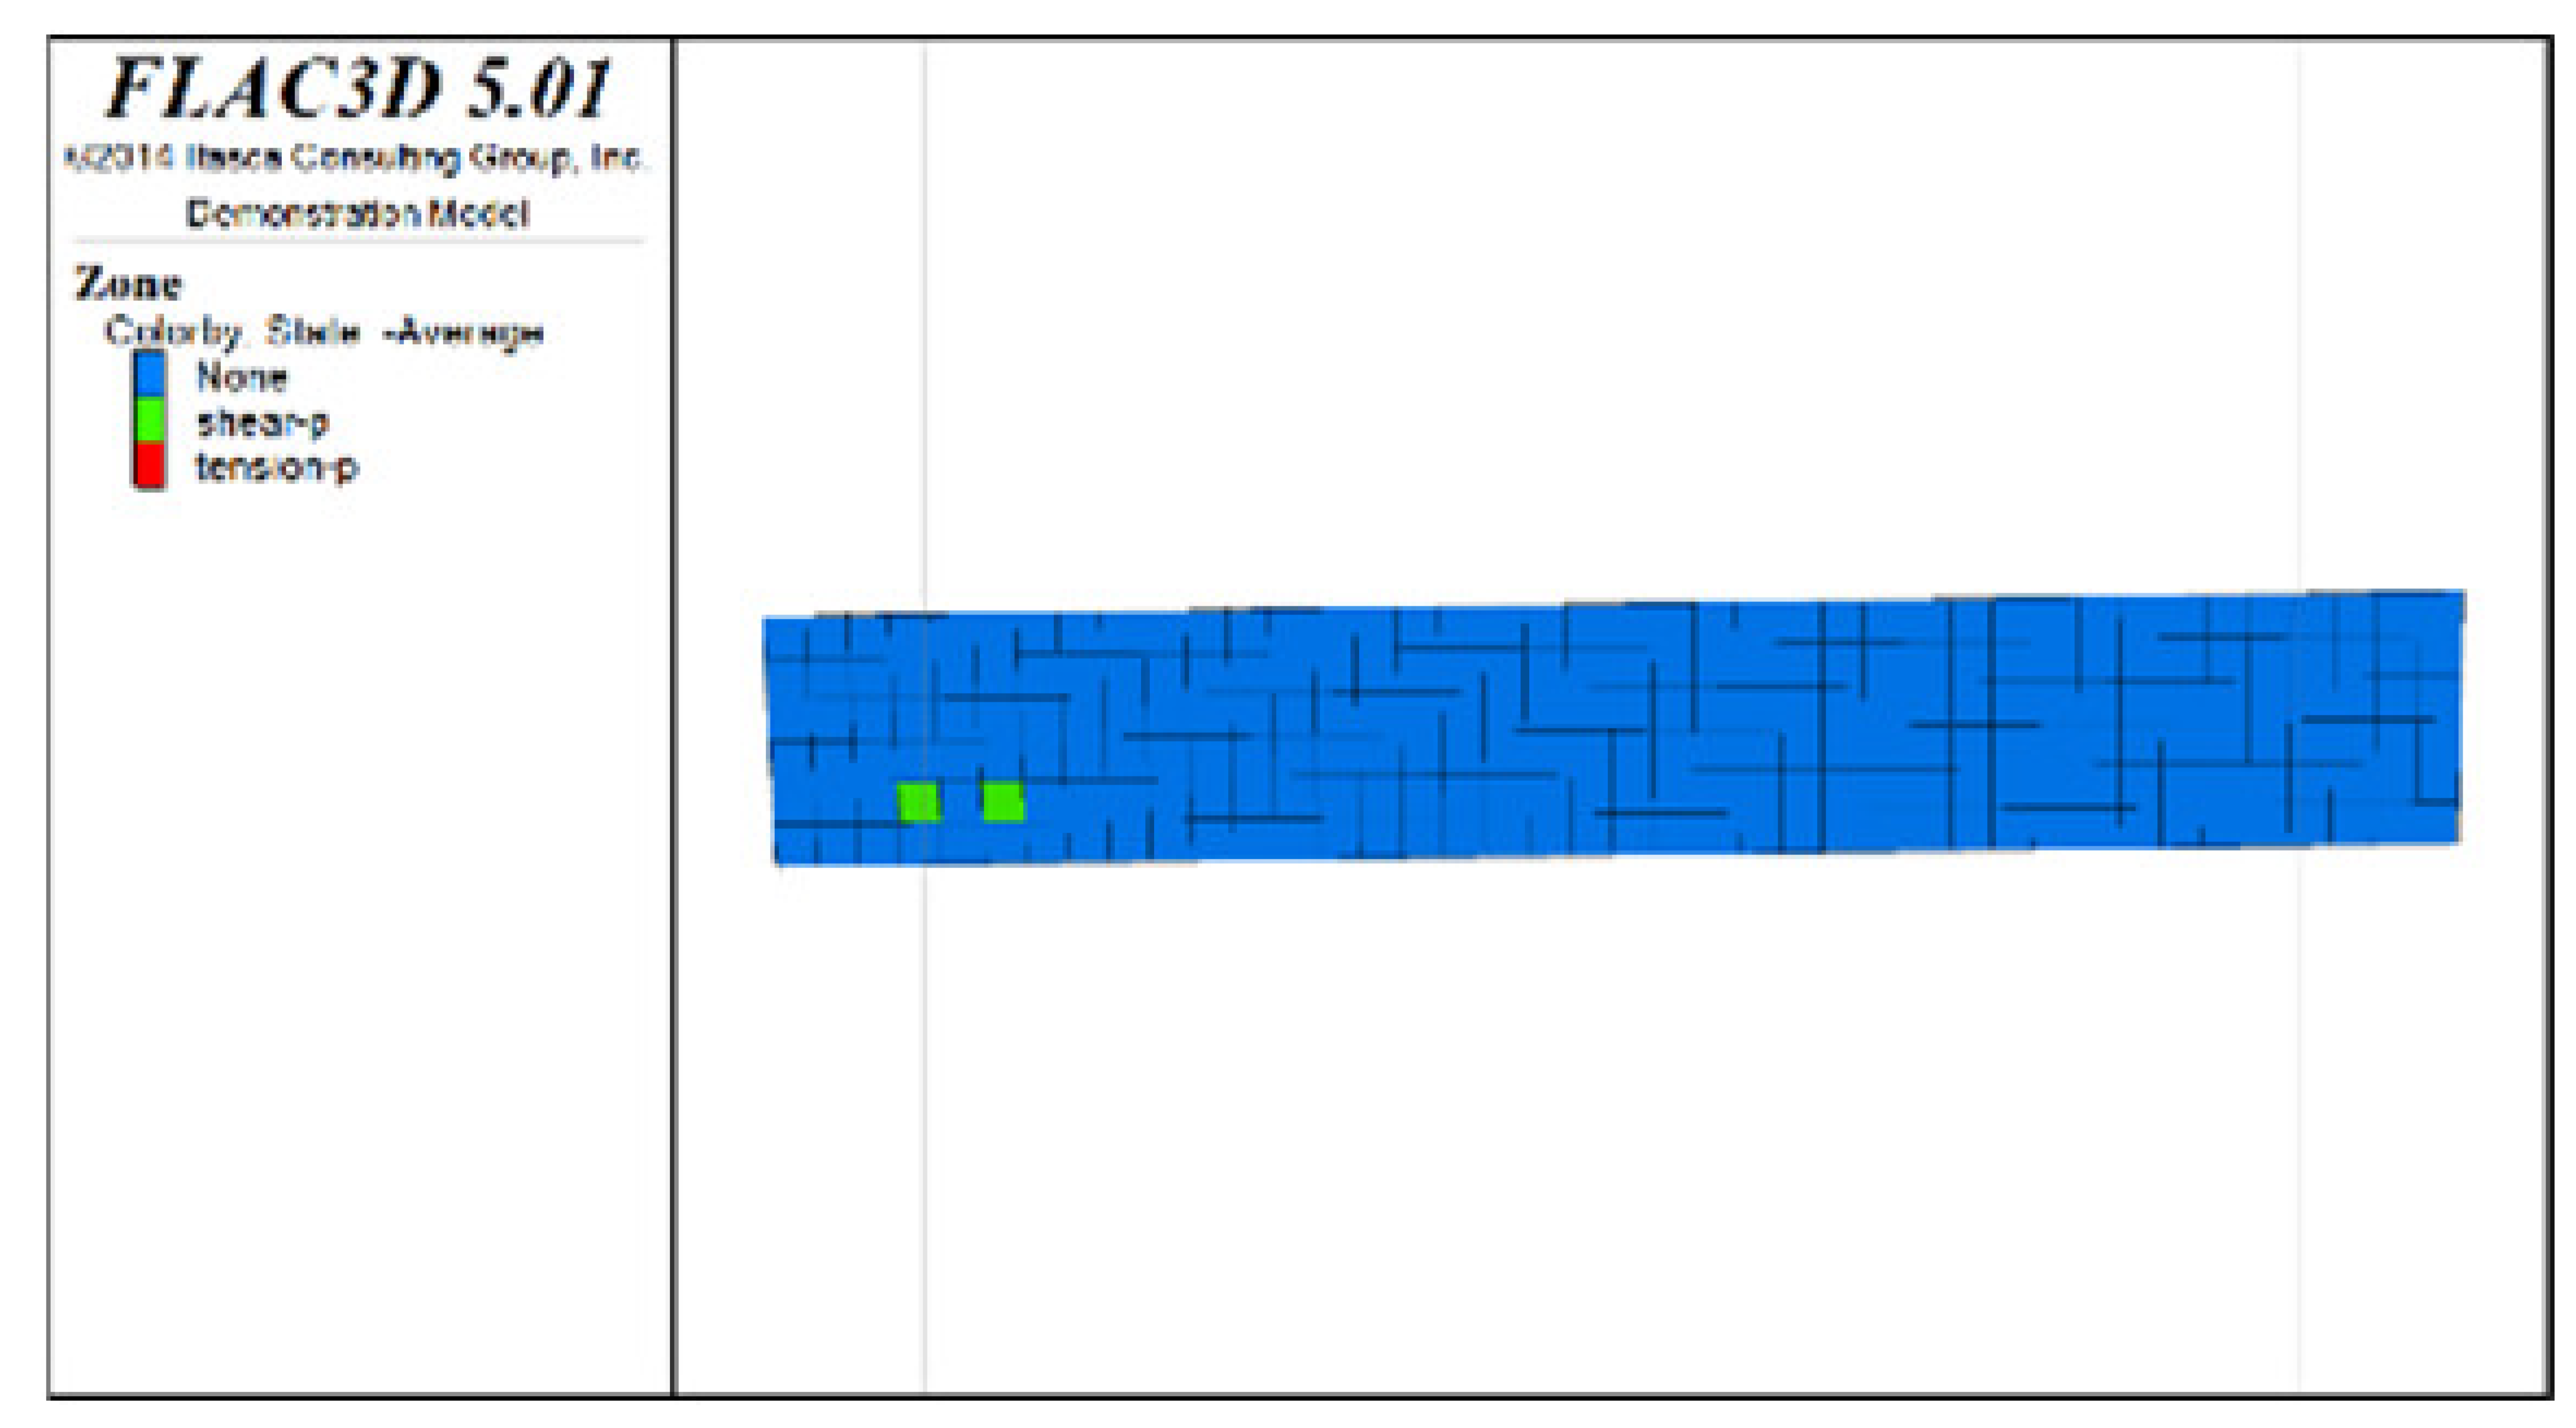 | 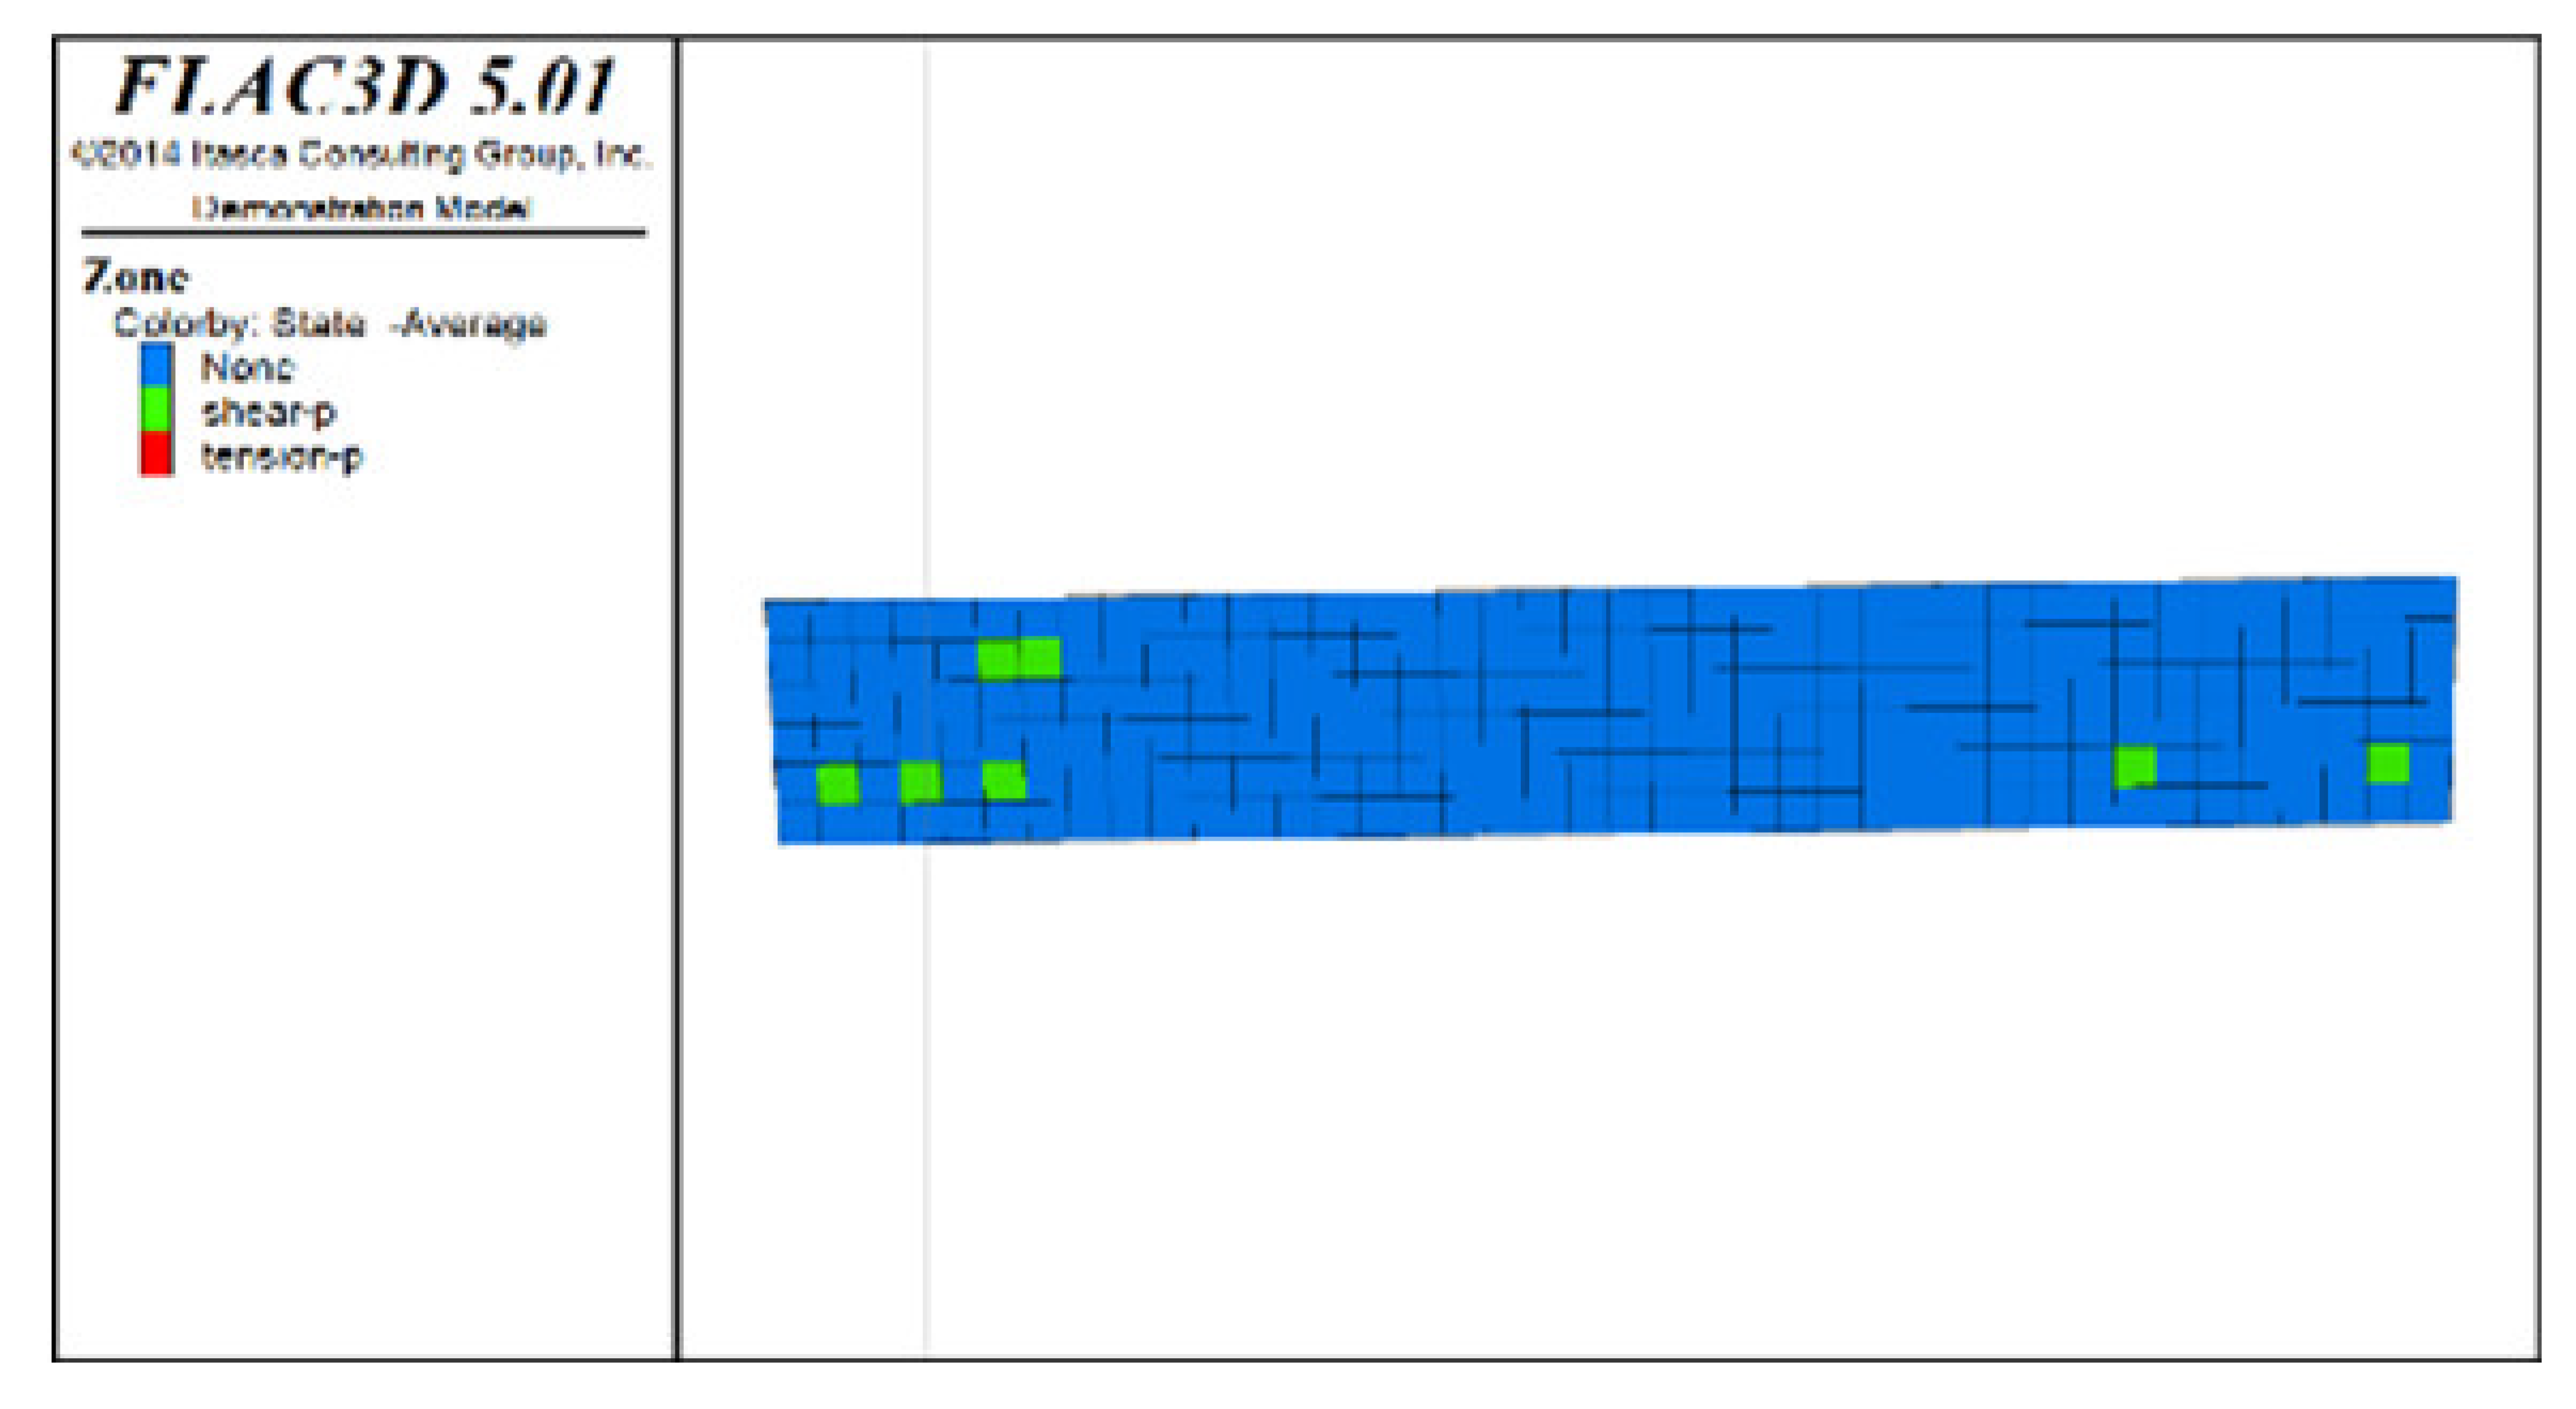 | 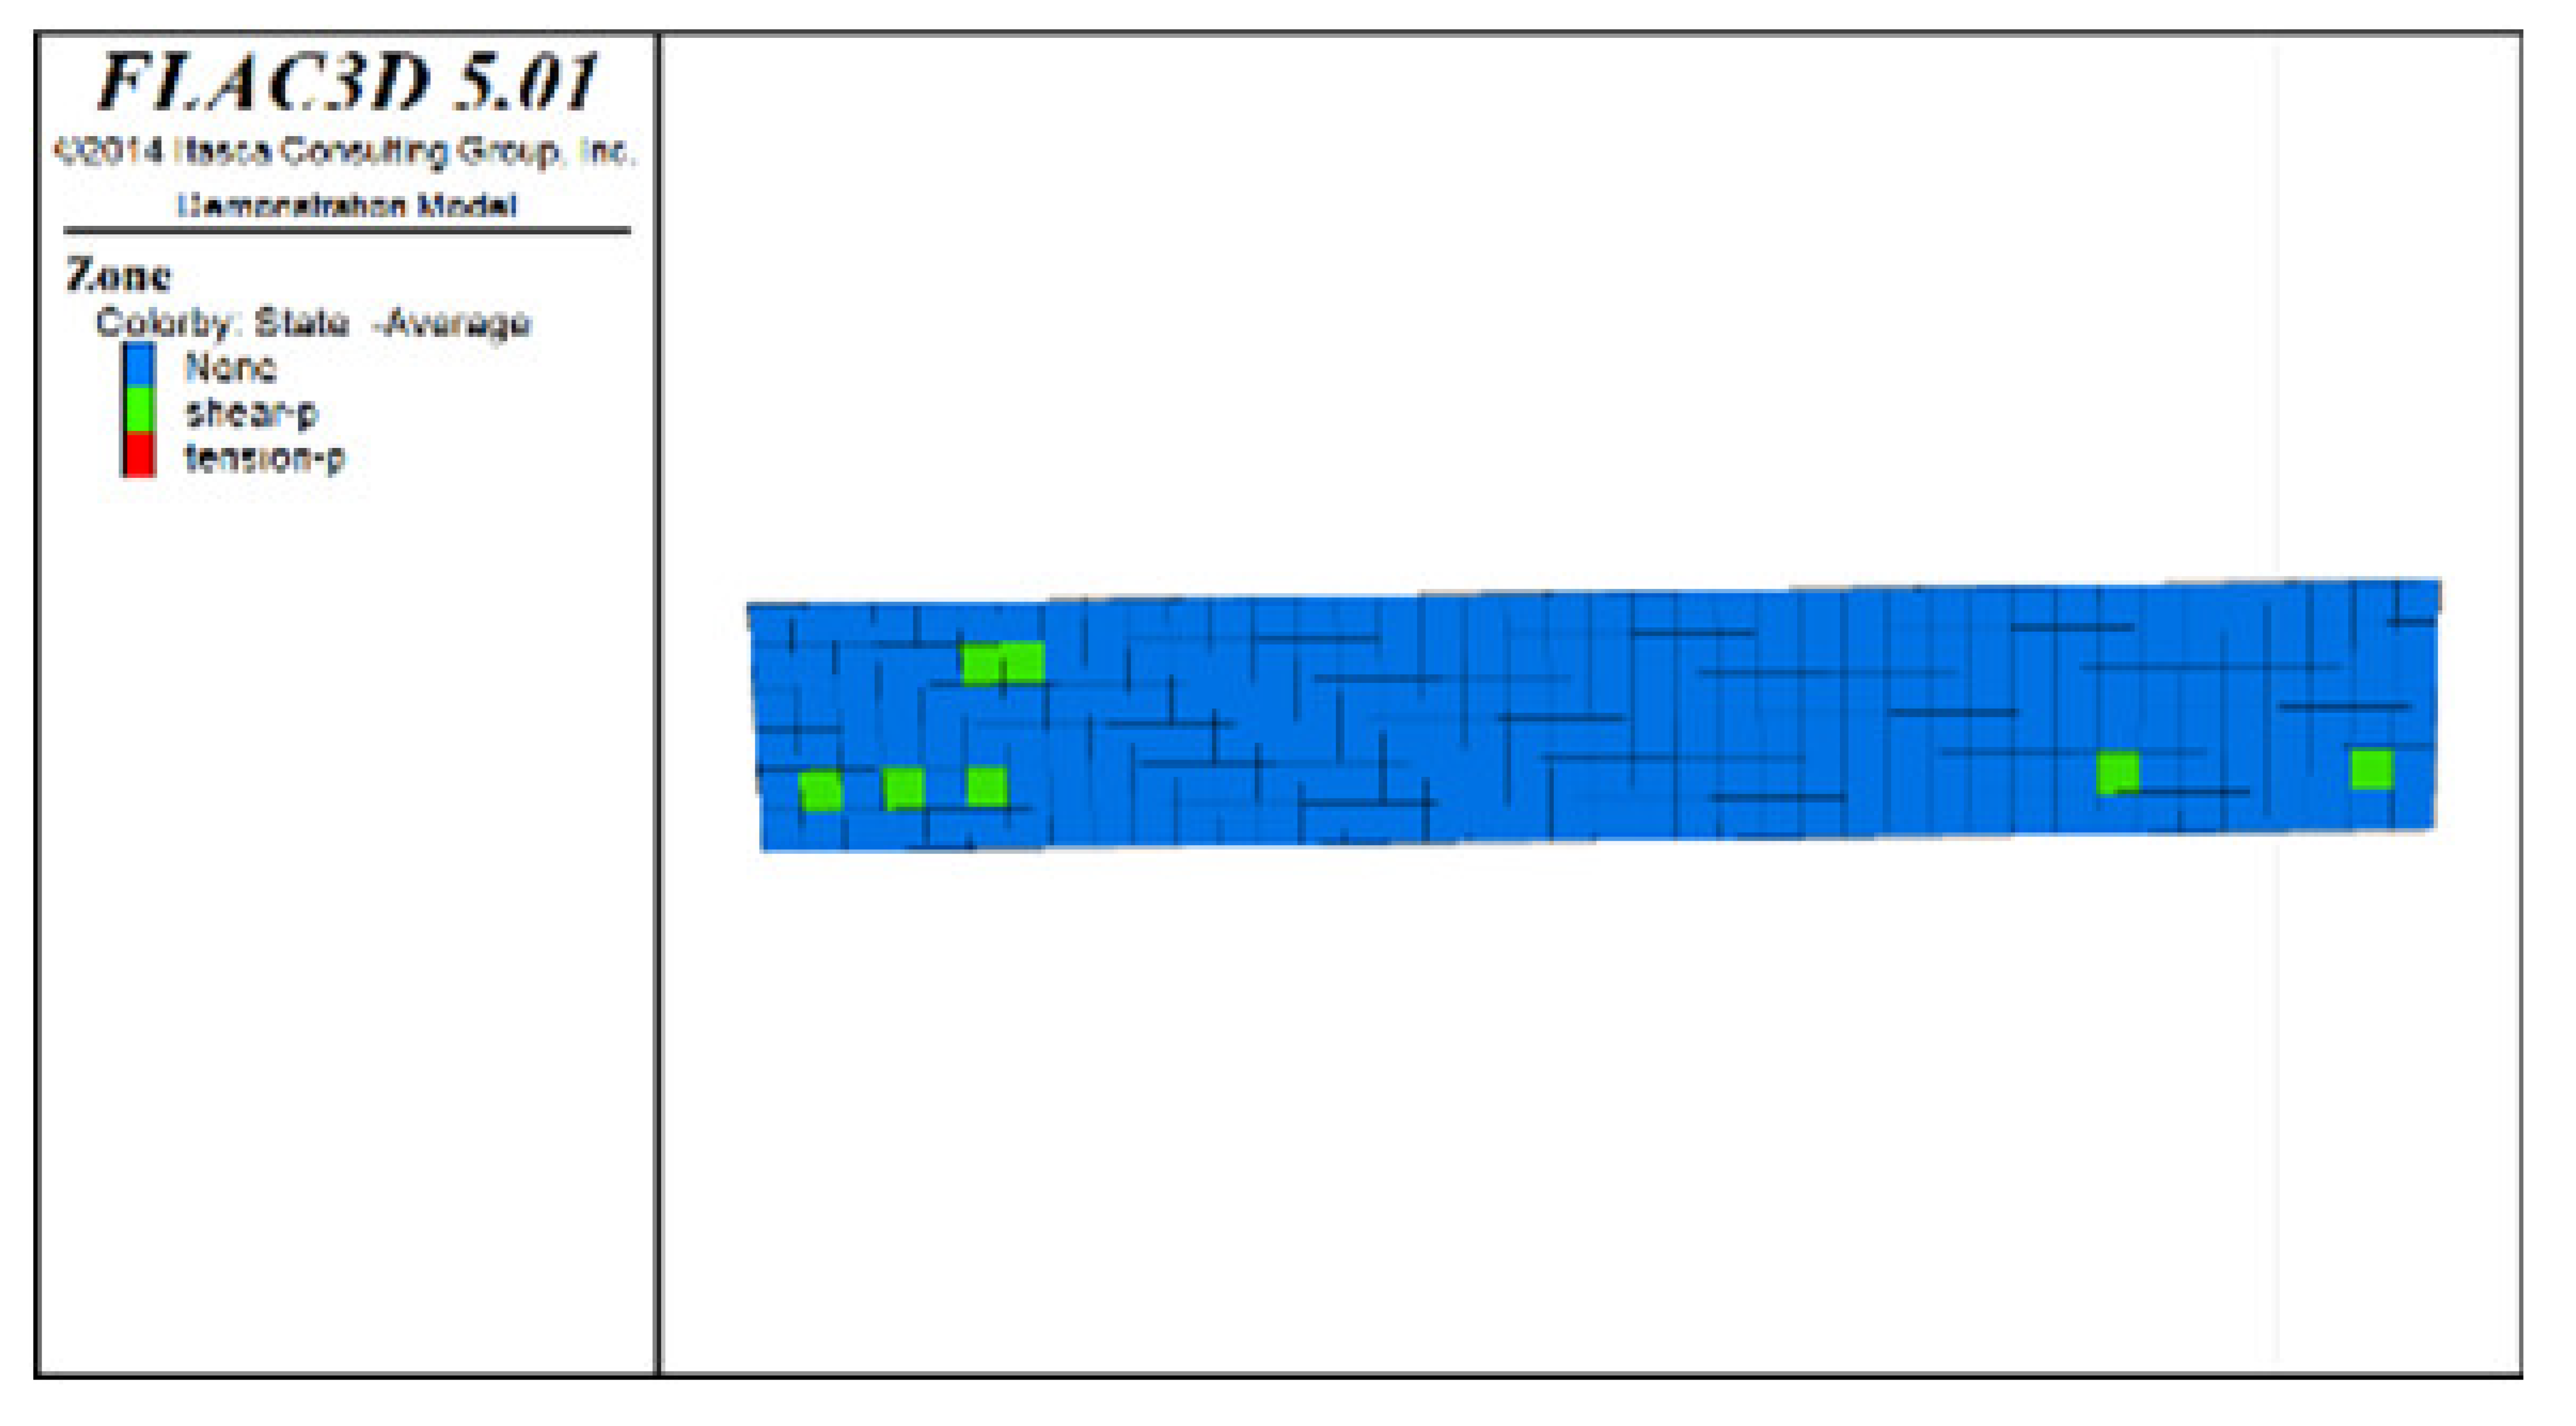 | |
| Scheme D | Distribution diagram of plastic zones in the roof protection layer observed from top to bottom | 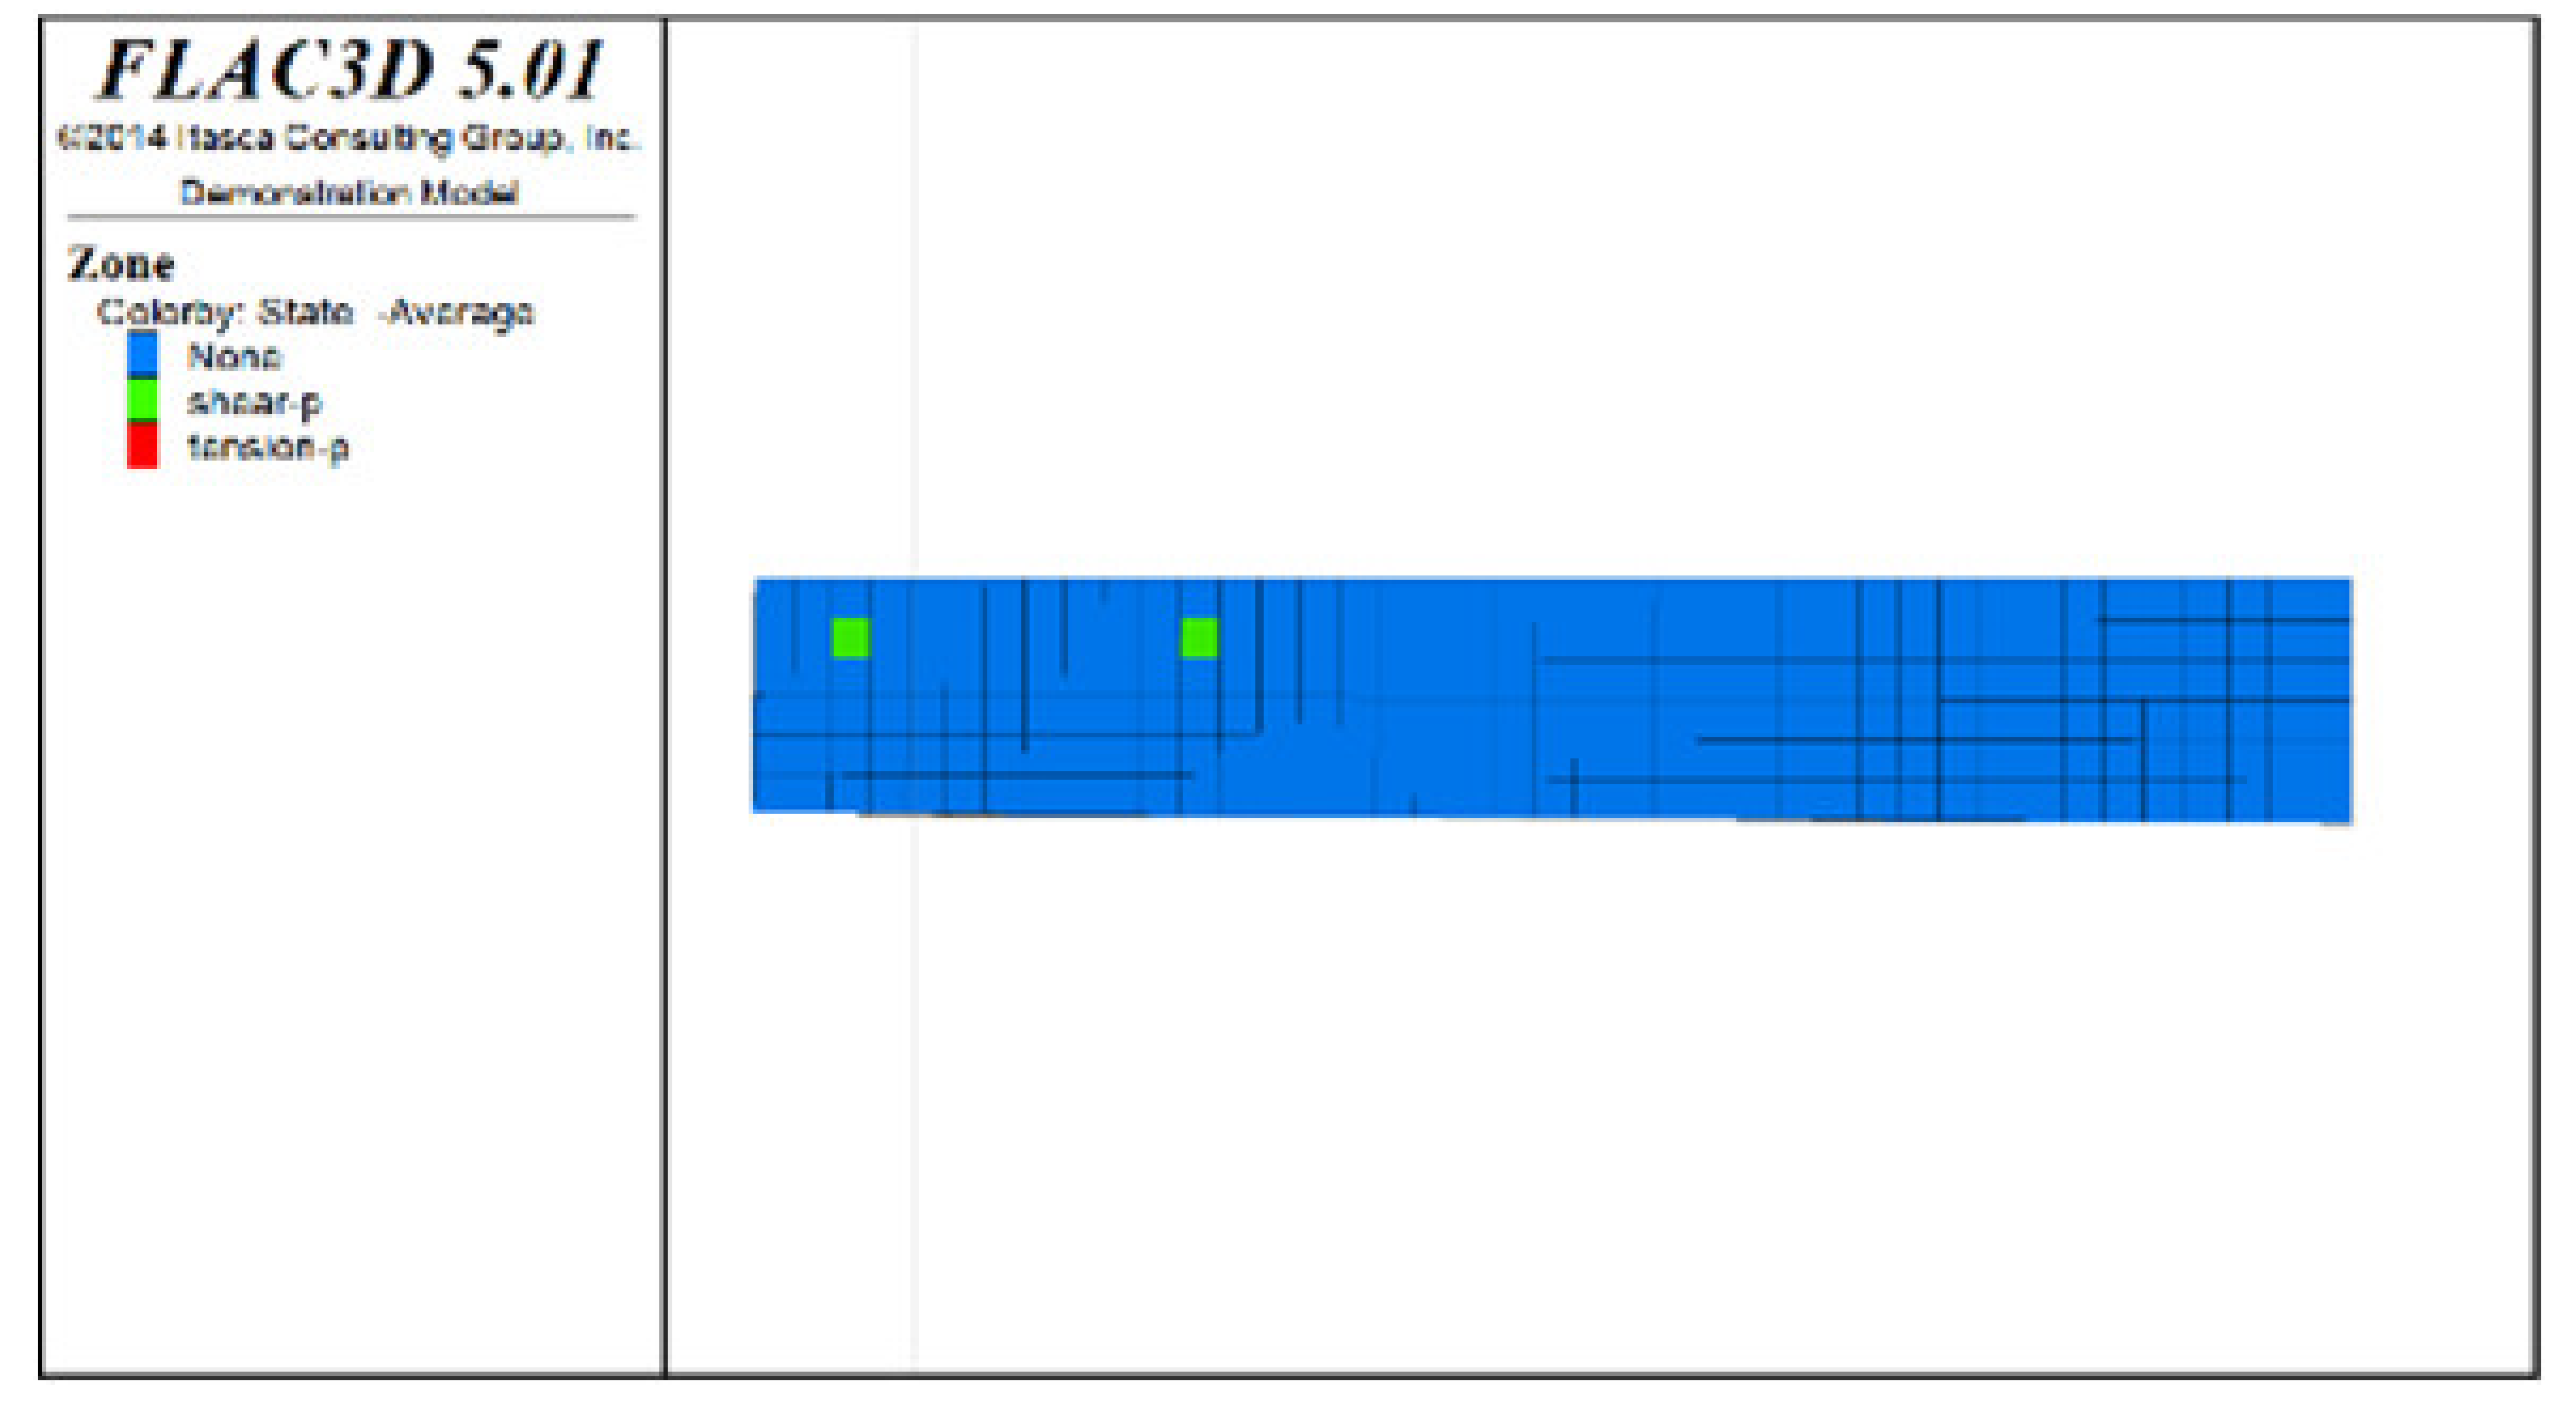 | 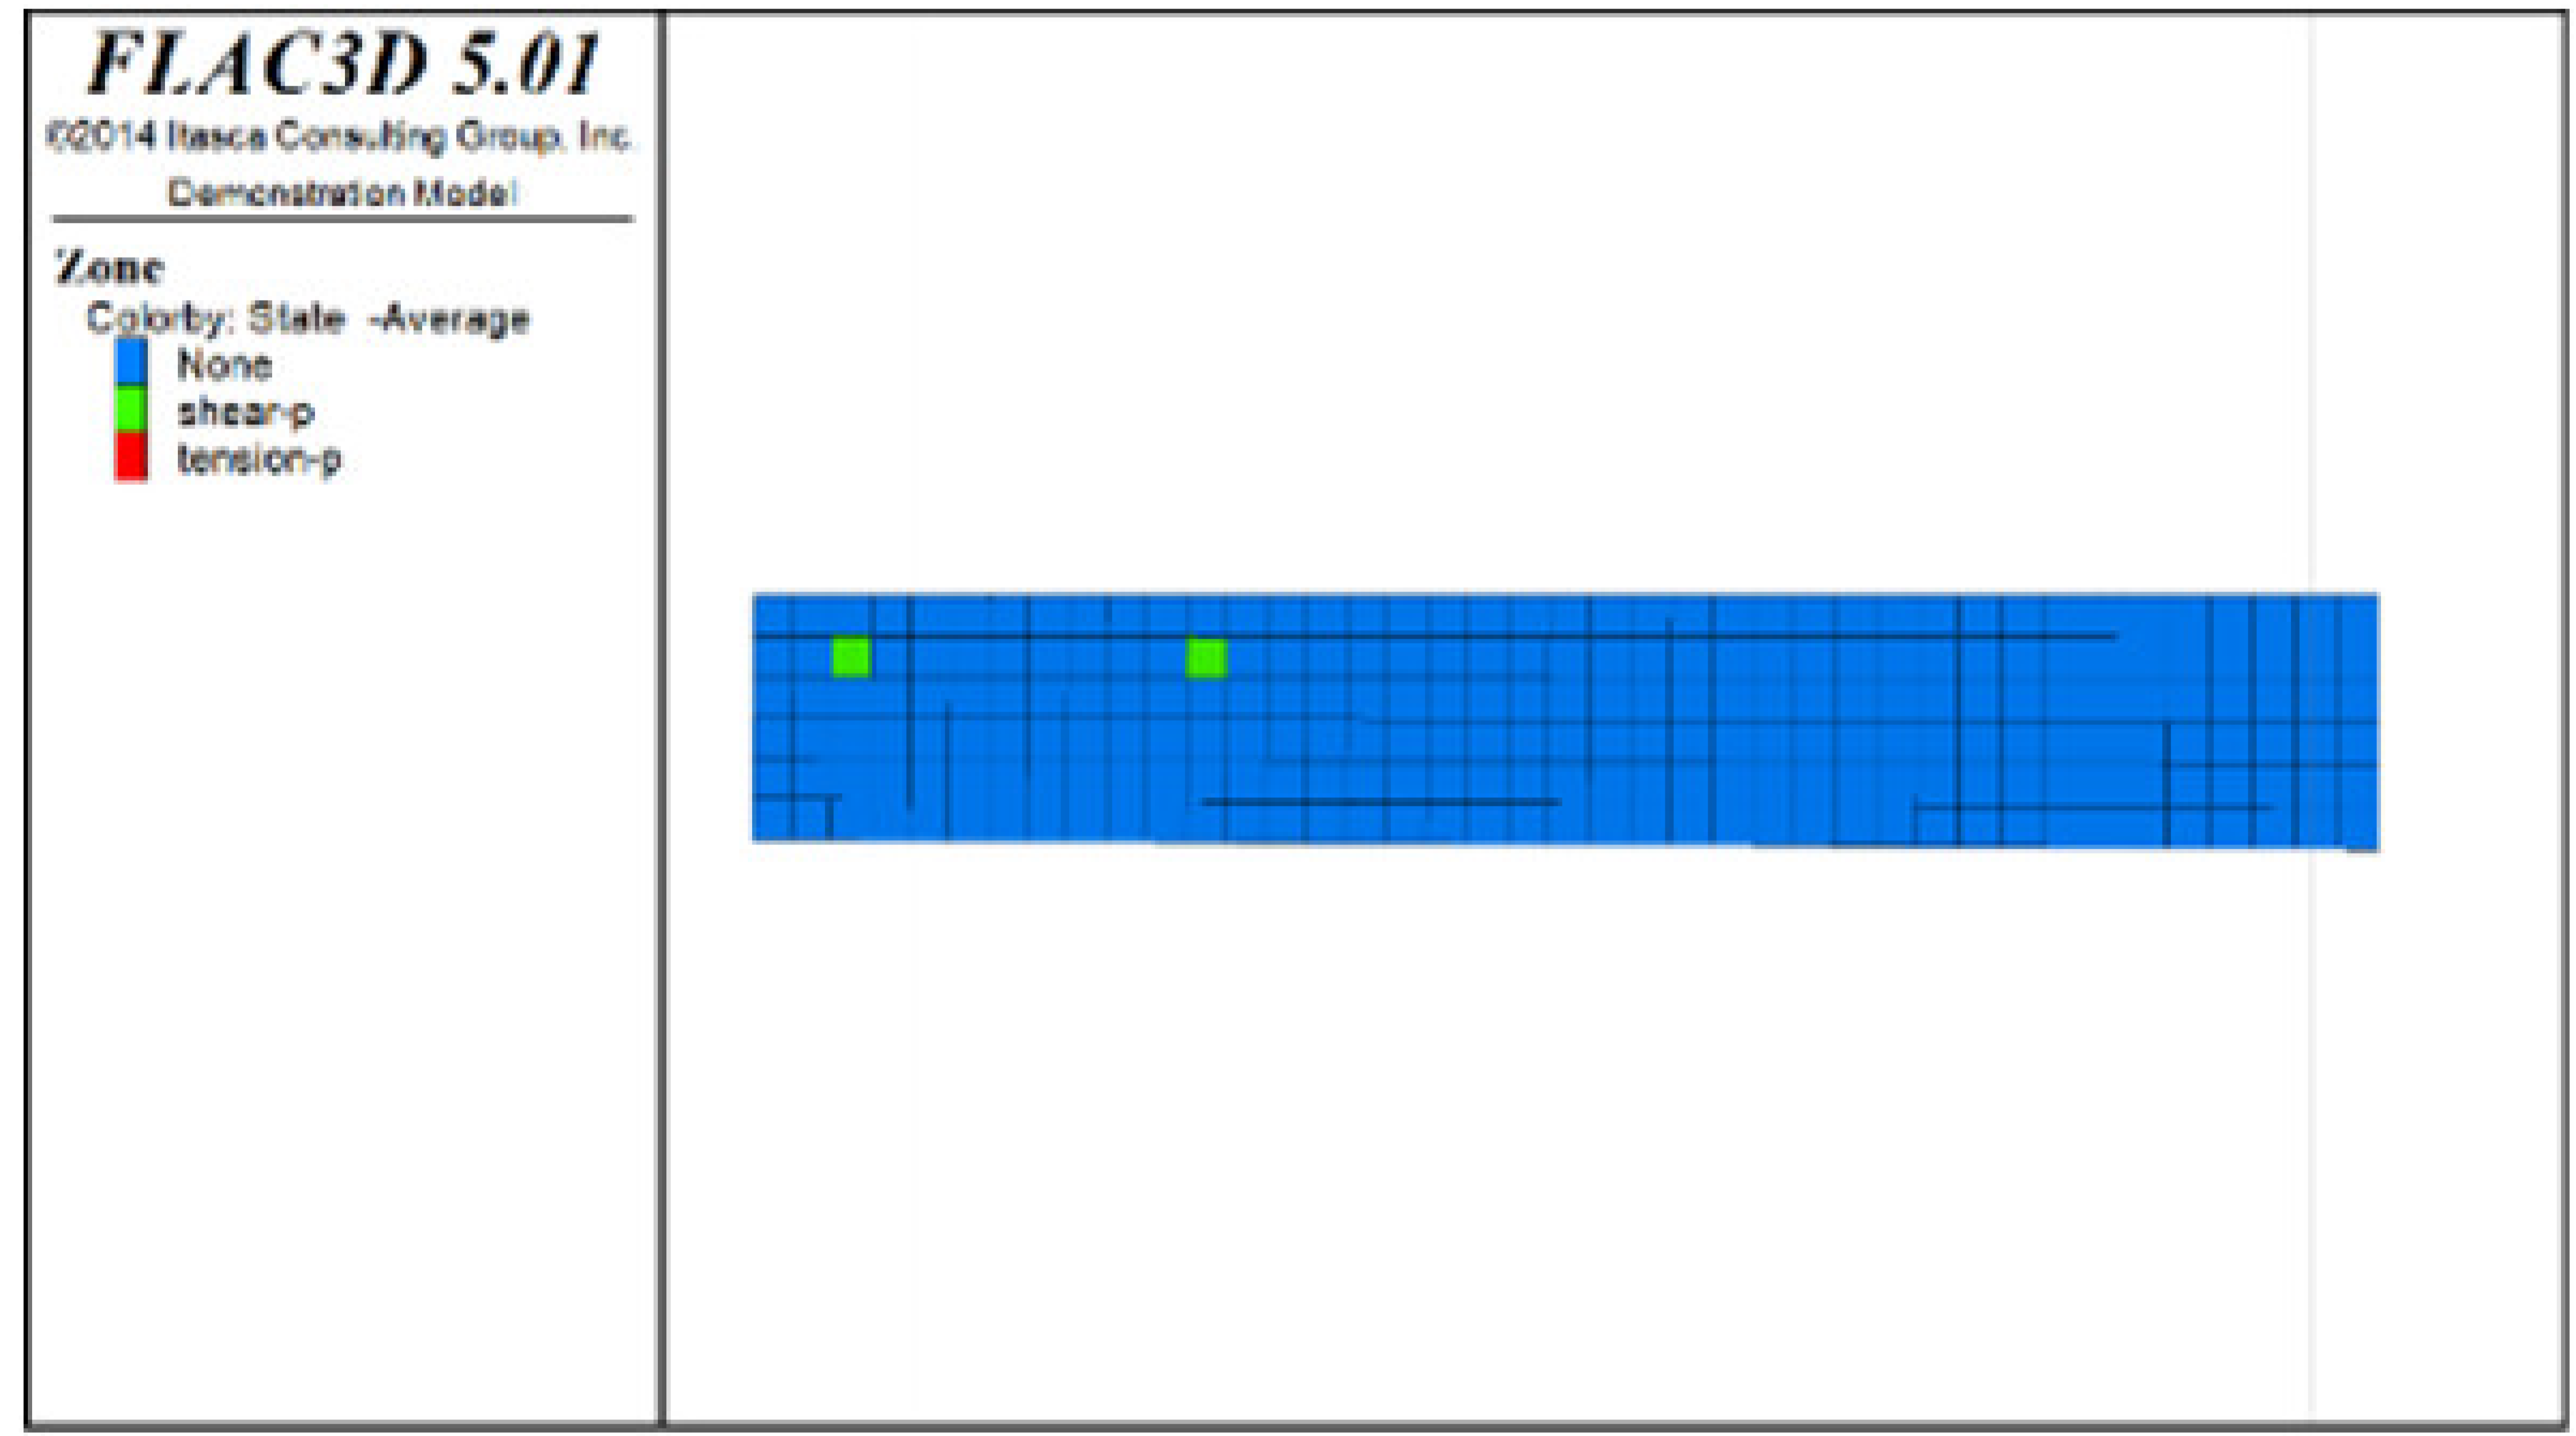 | 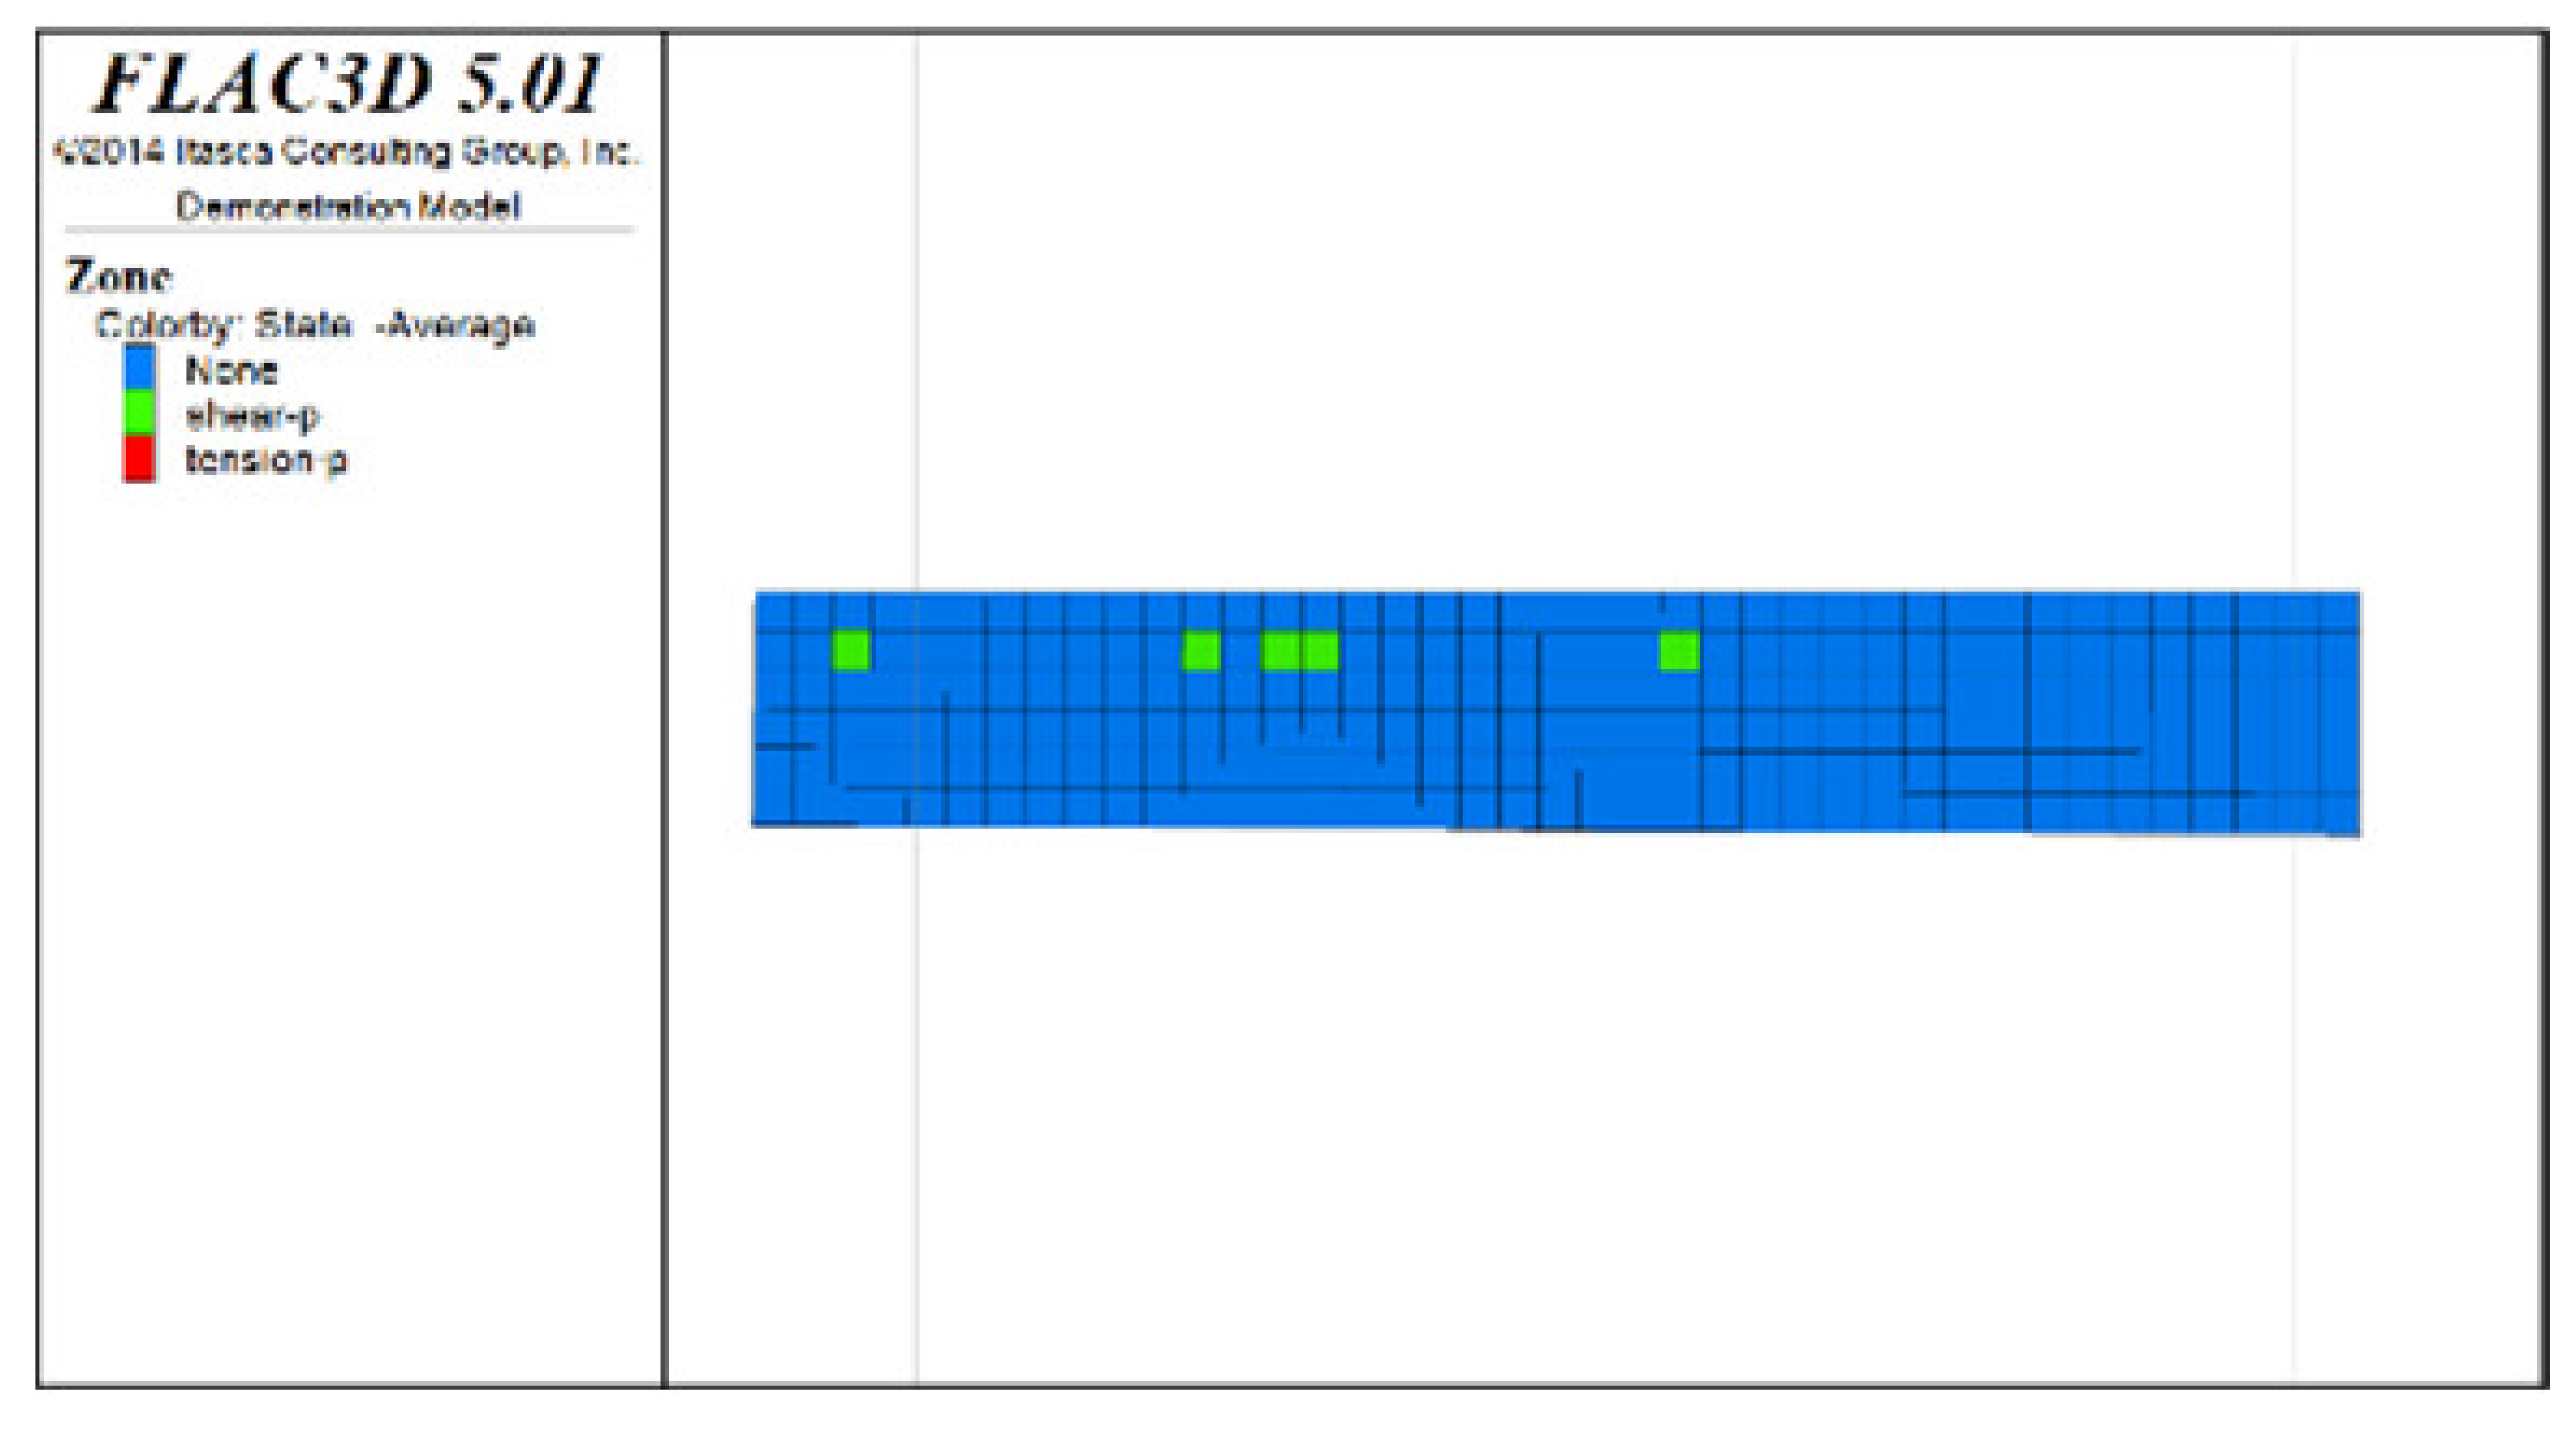 | 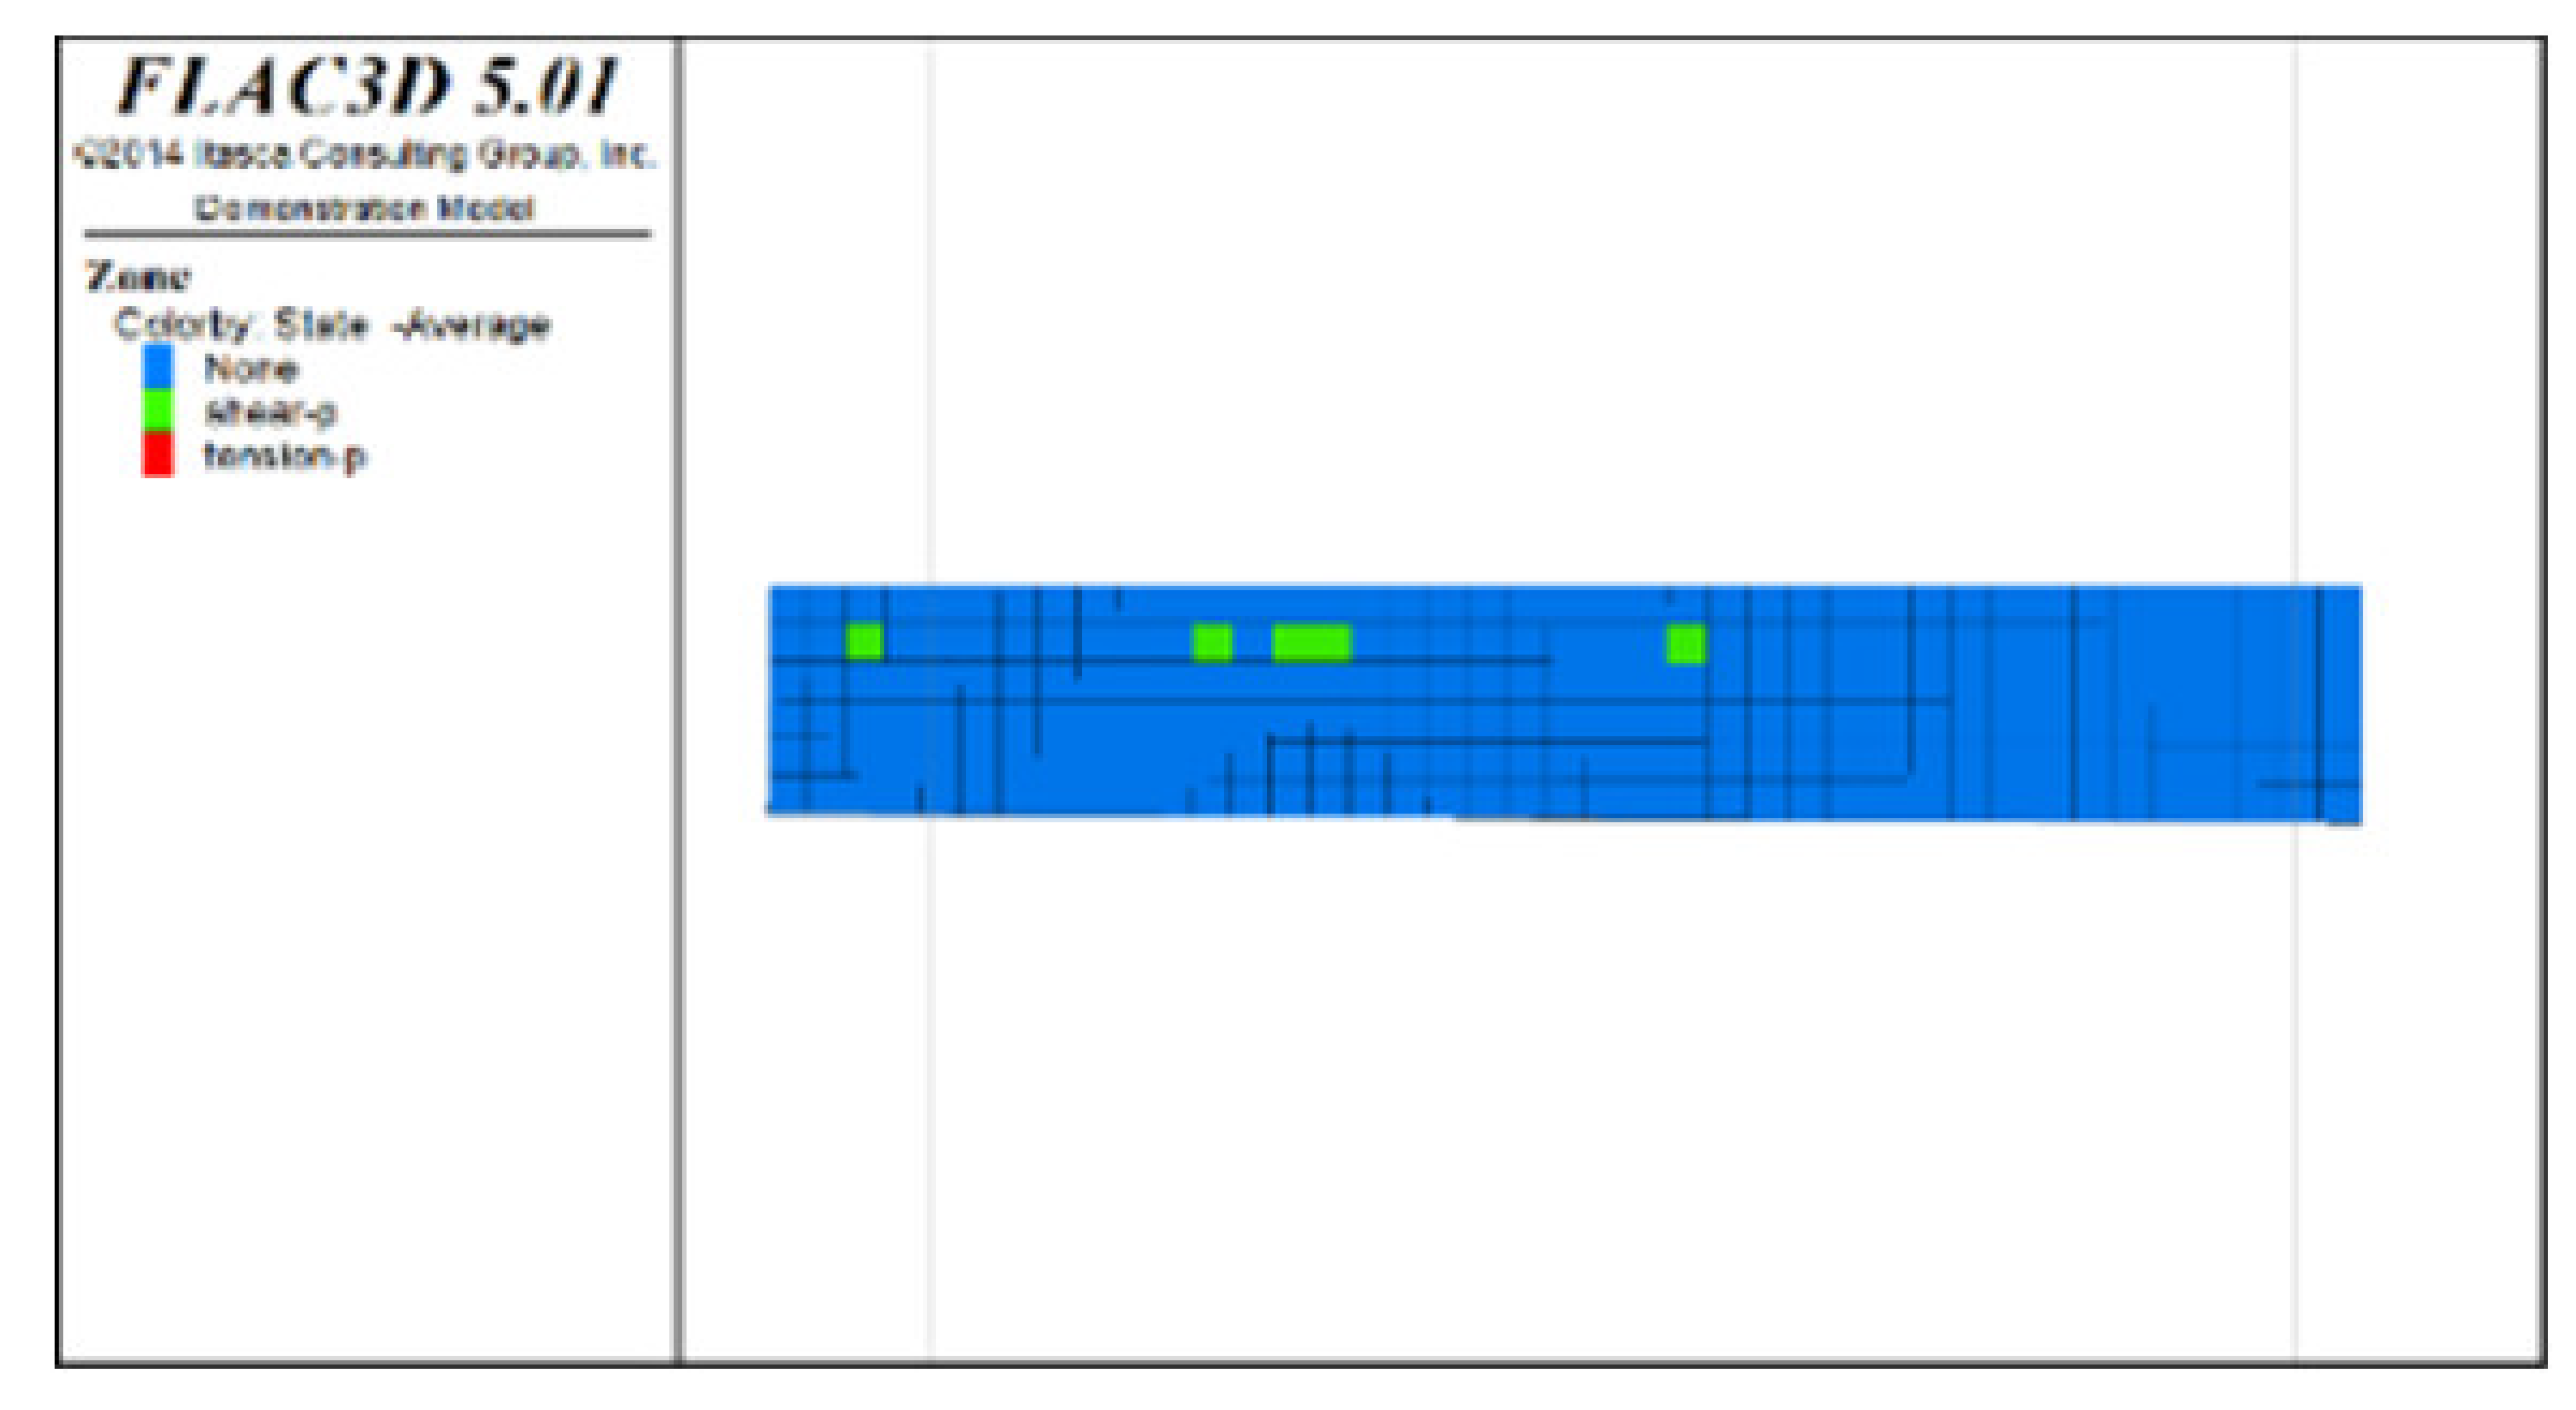 |
| Distribution diagram of plastic zones in the roof protection layer observed from bottom to top | 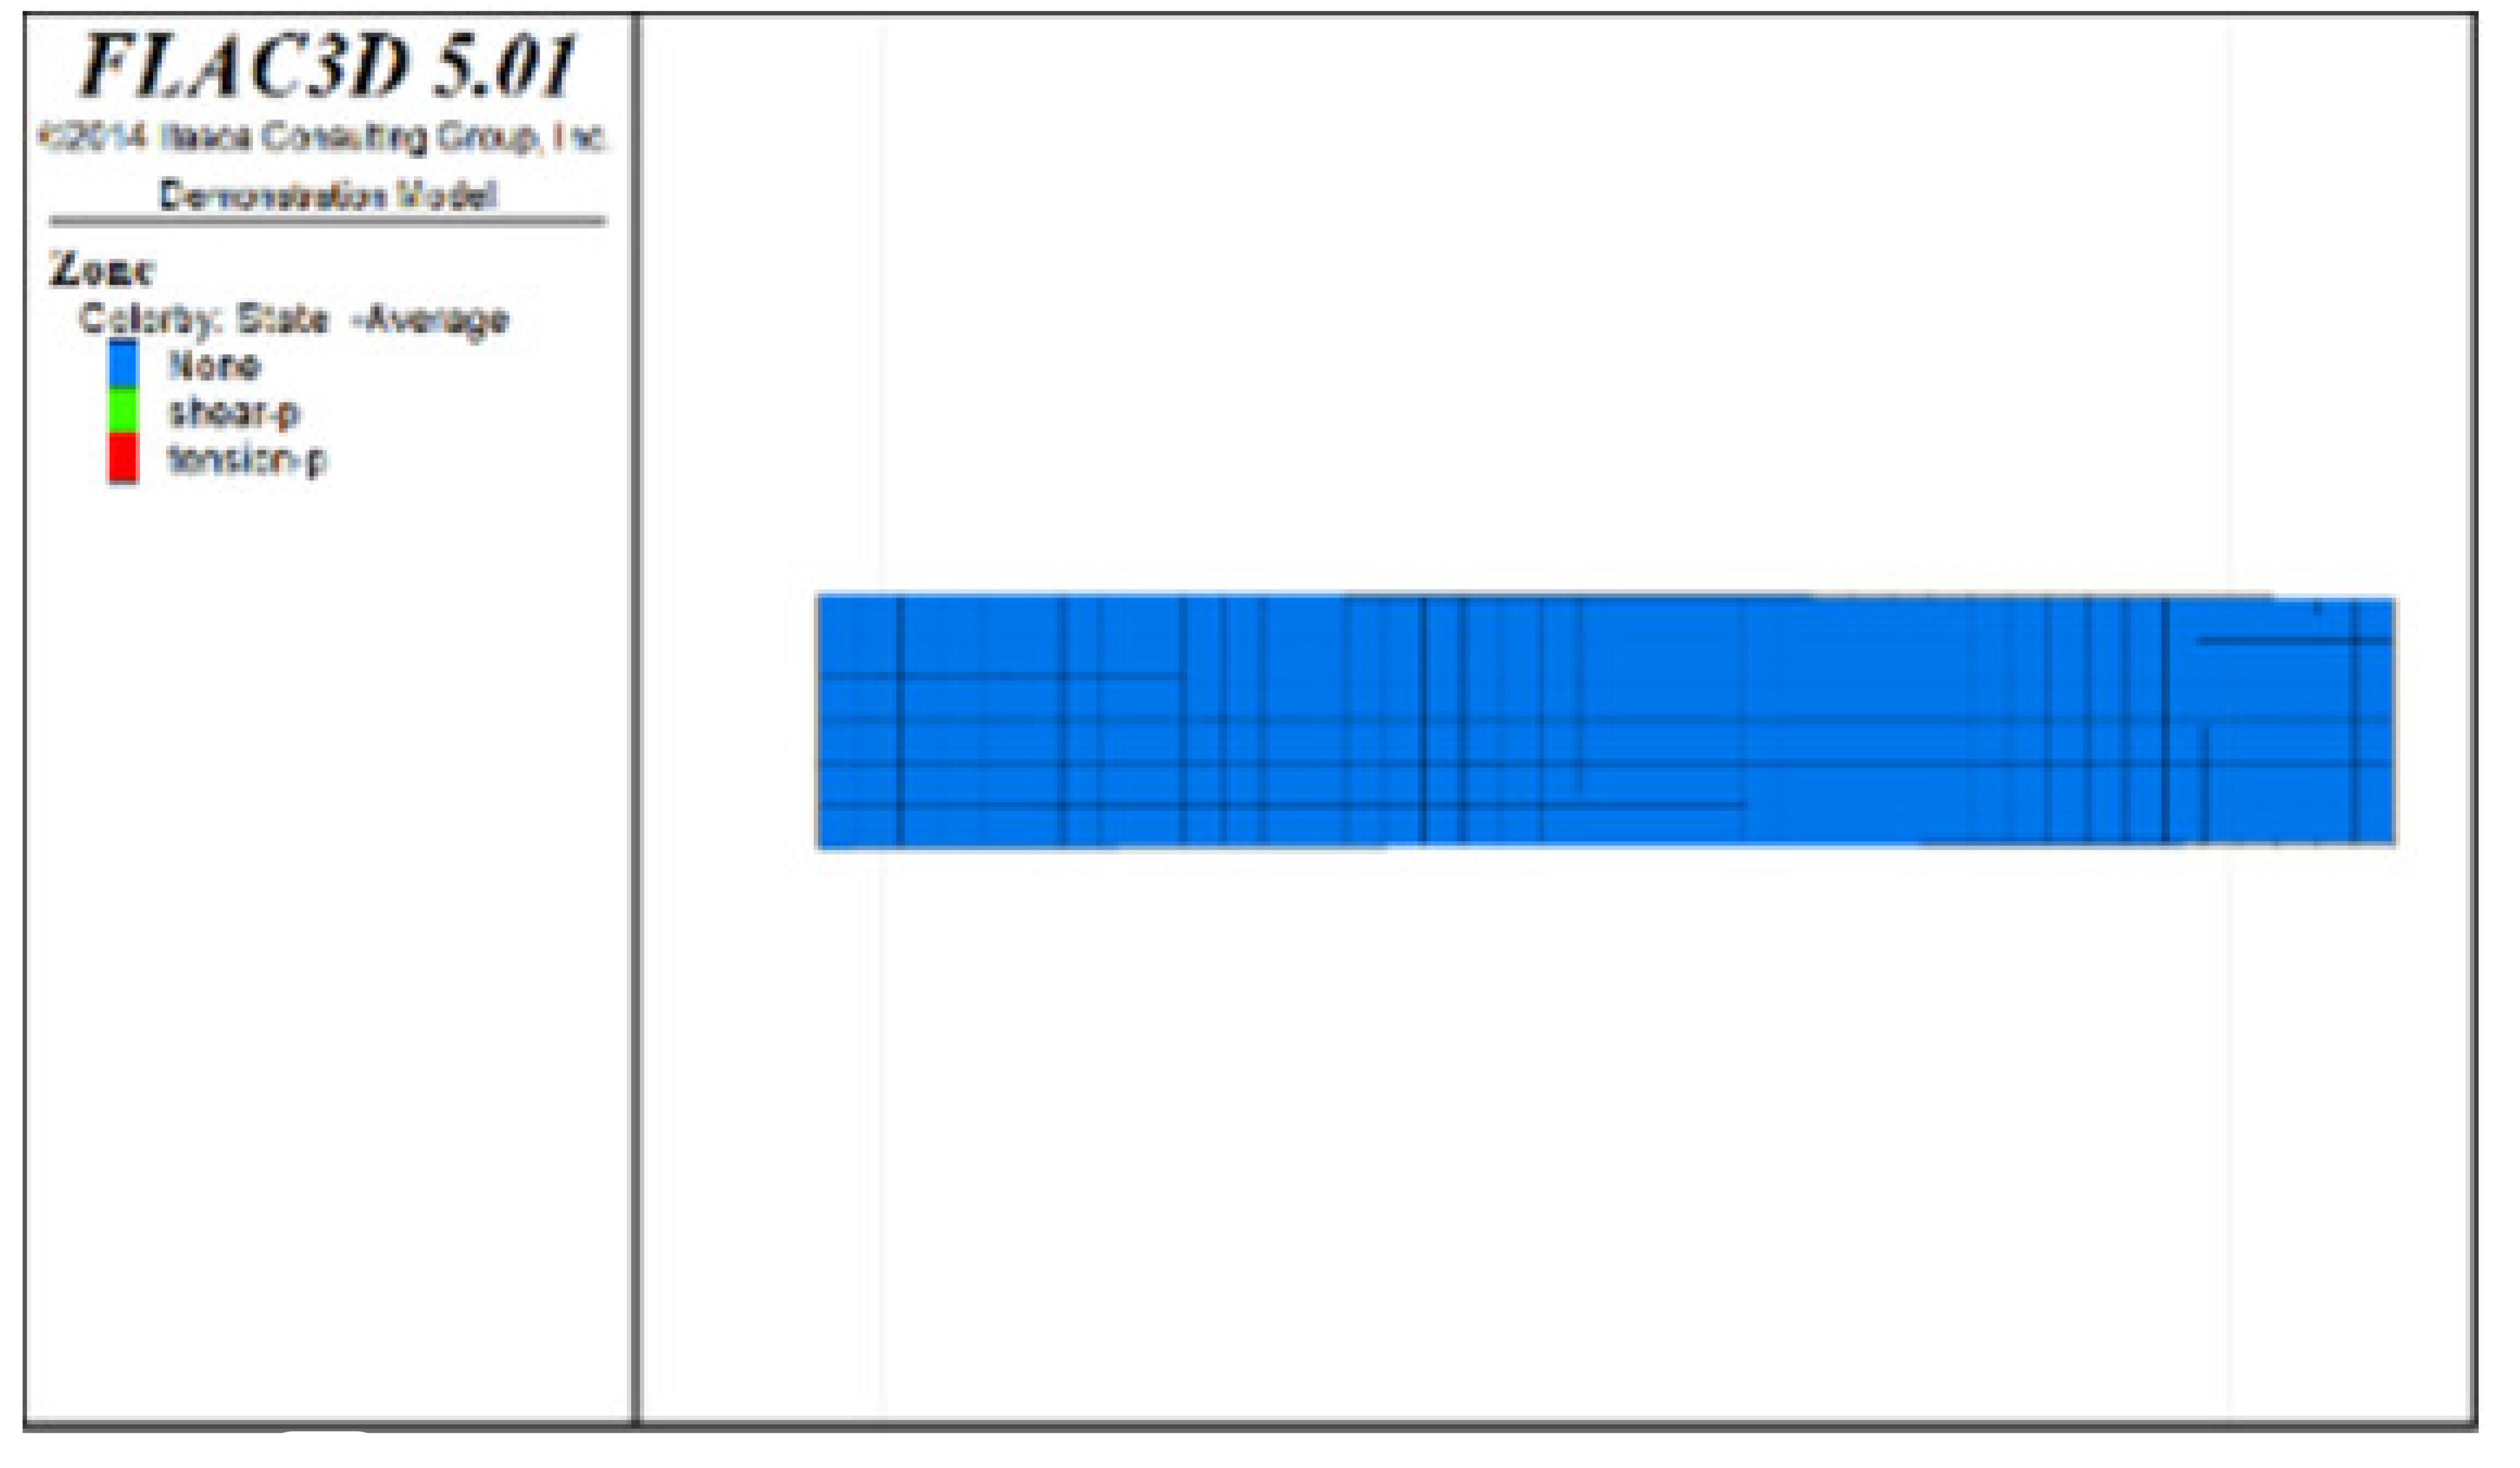 |  | 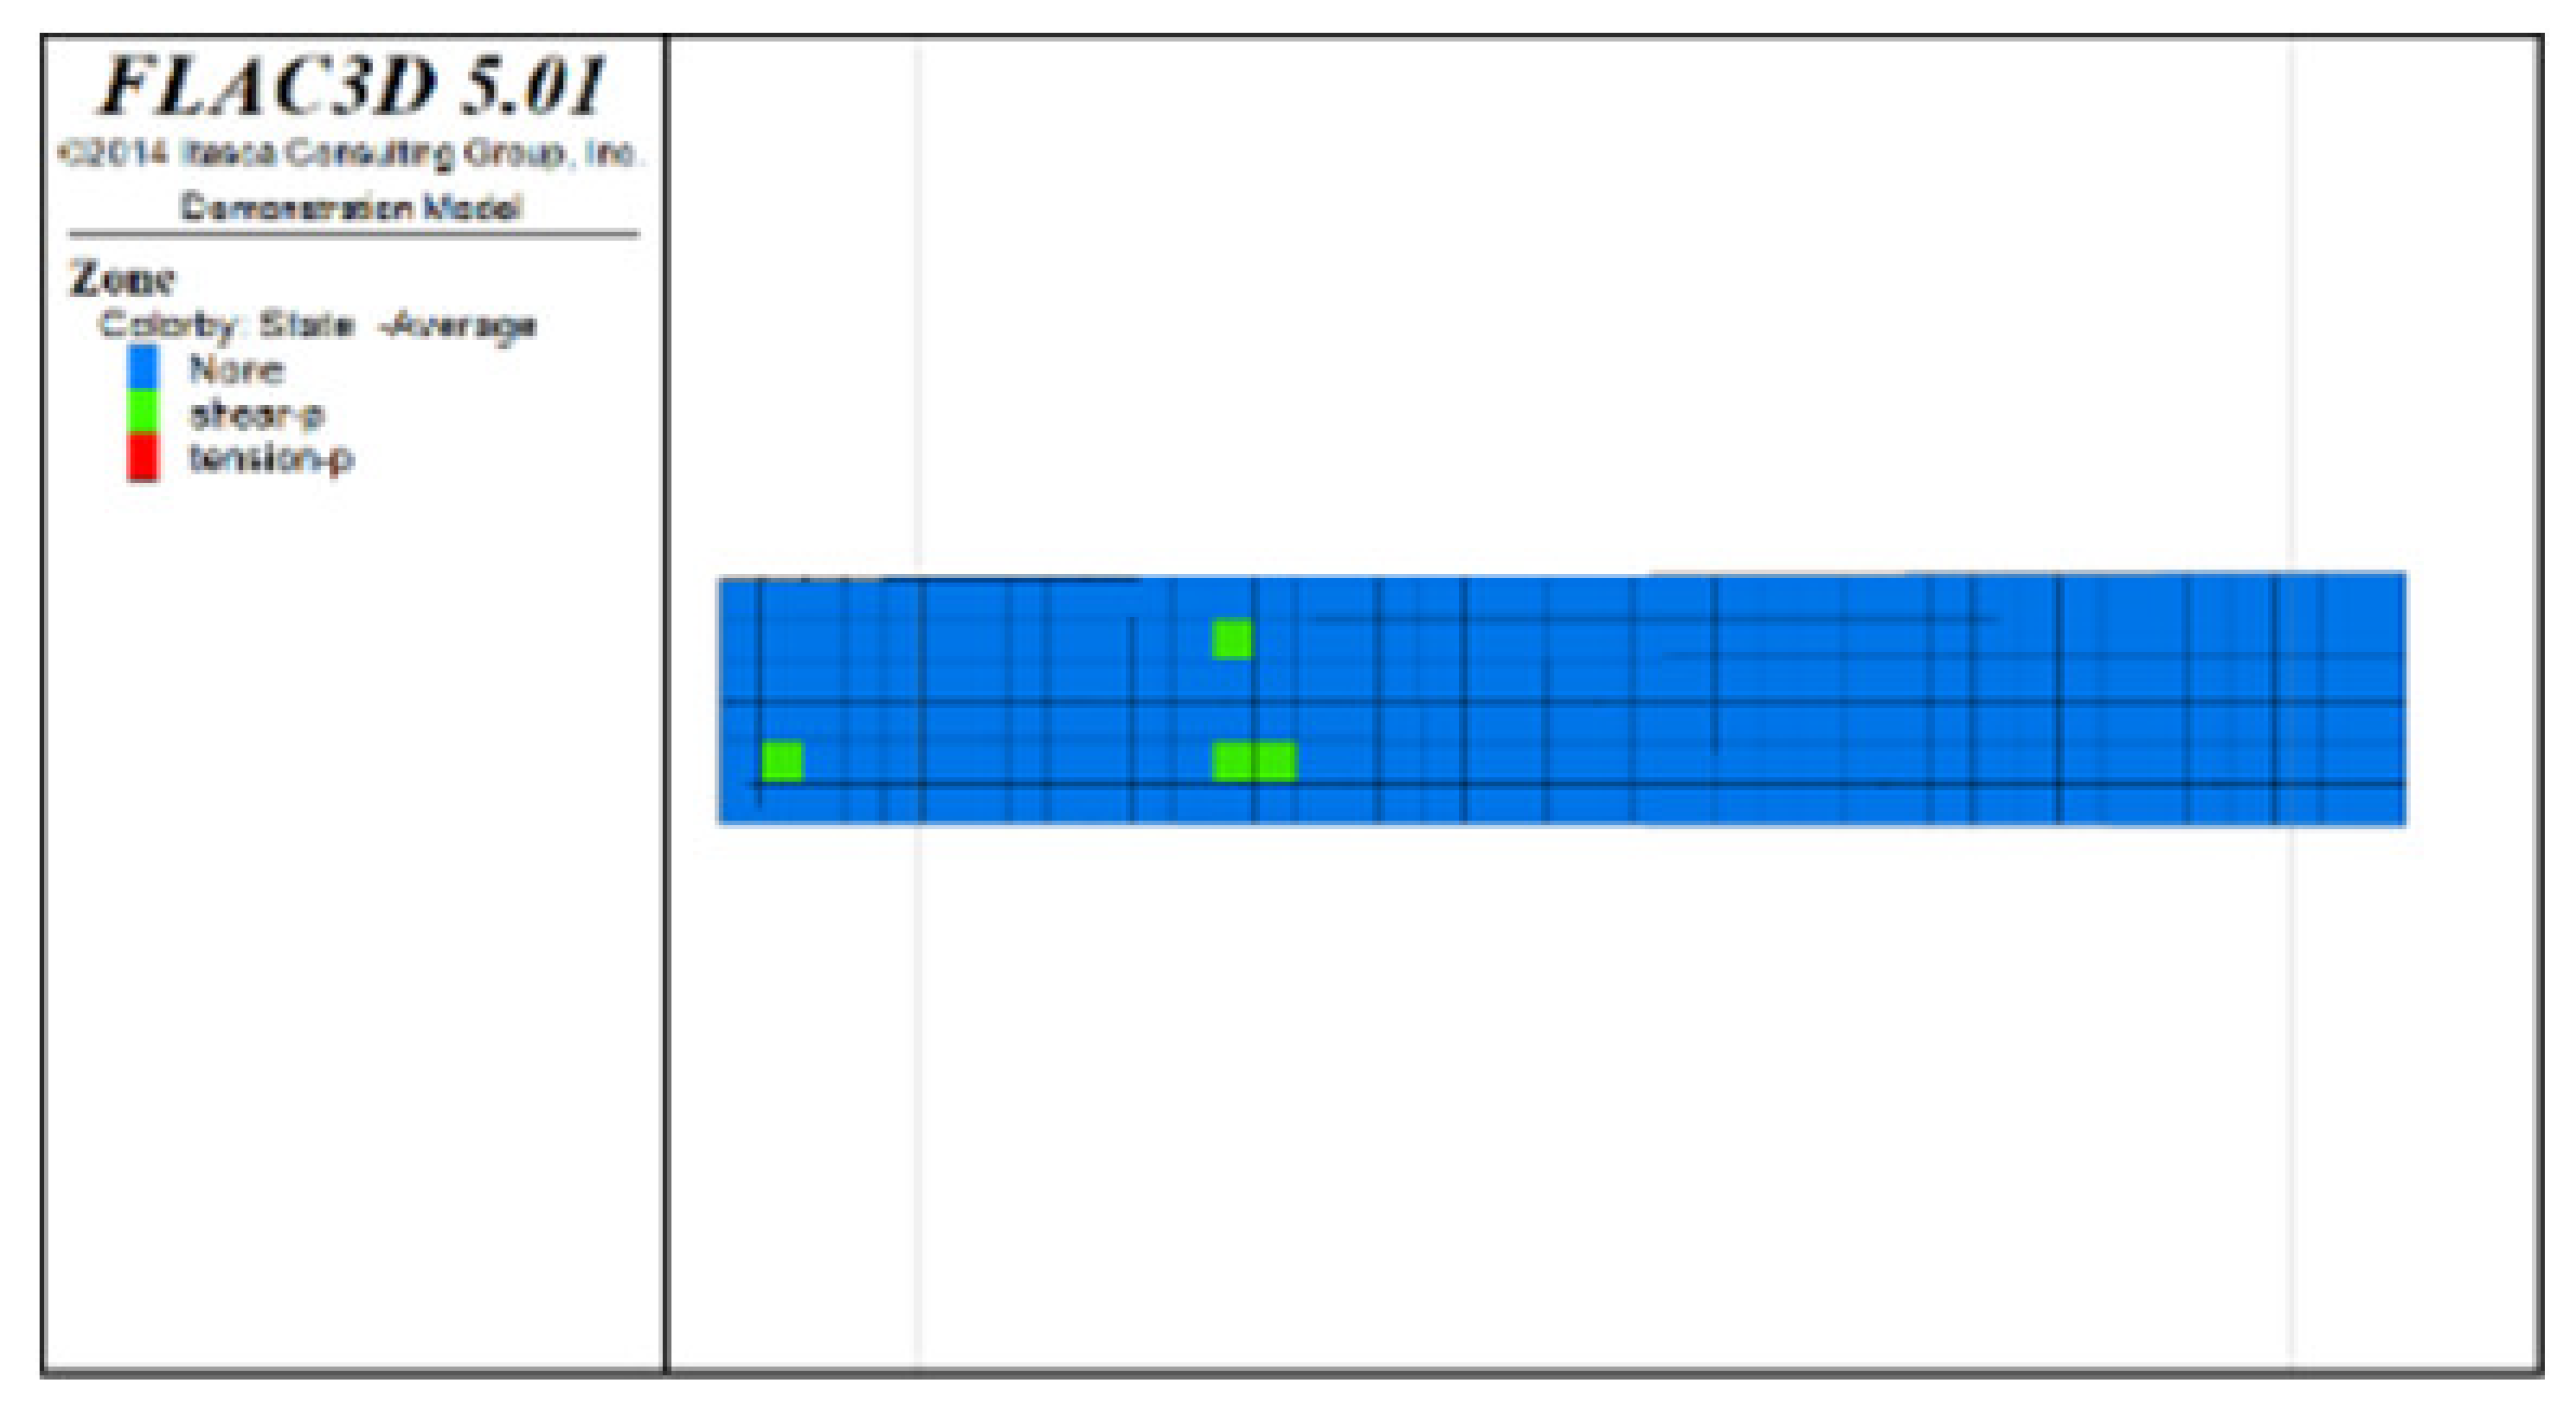 |  | |
| Excavation Stage 7 (Drifts 7 and 14 of Scheme C; and Drifts 14, 16 and 18 of Scheme D) | Backfill Stage 7 (Drifts 7 and 14 of Scheme C; and Drifts 14, 16 and 18 of Scheme D) | Excavation Stage 8 (mining completion in Scheme C; and Drift 20 of Scheme D) | Backfill Stage 8 (mining completion in Scheme C;and Drift 20 of Scheme D) | ||
|---|---|---|---|---|---|
| Scheme C | Distribution diagram of plastic zones in the roof protection layer observed from top to bottom | 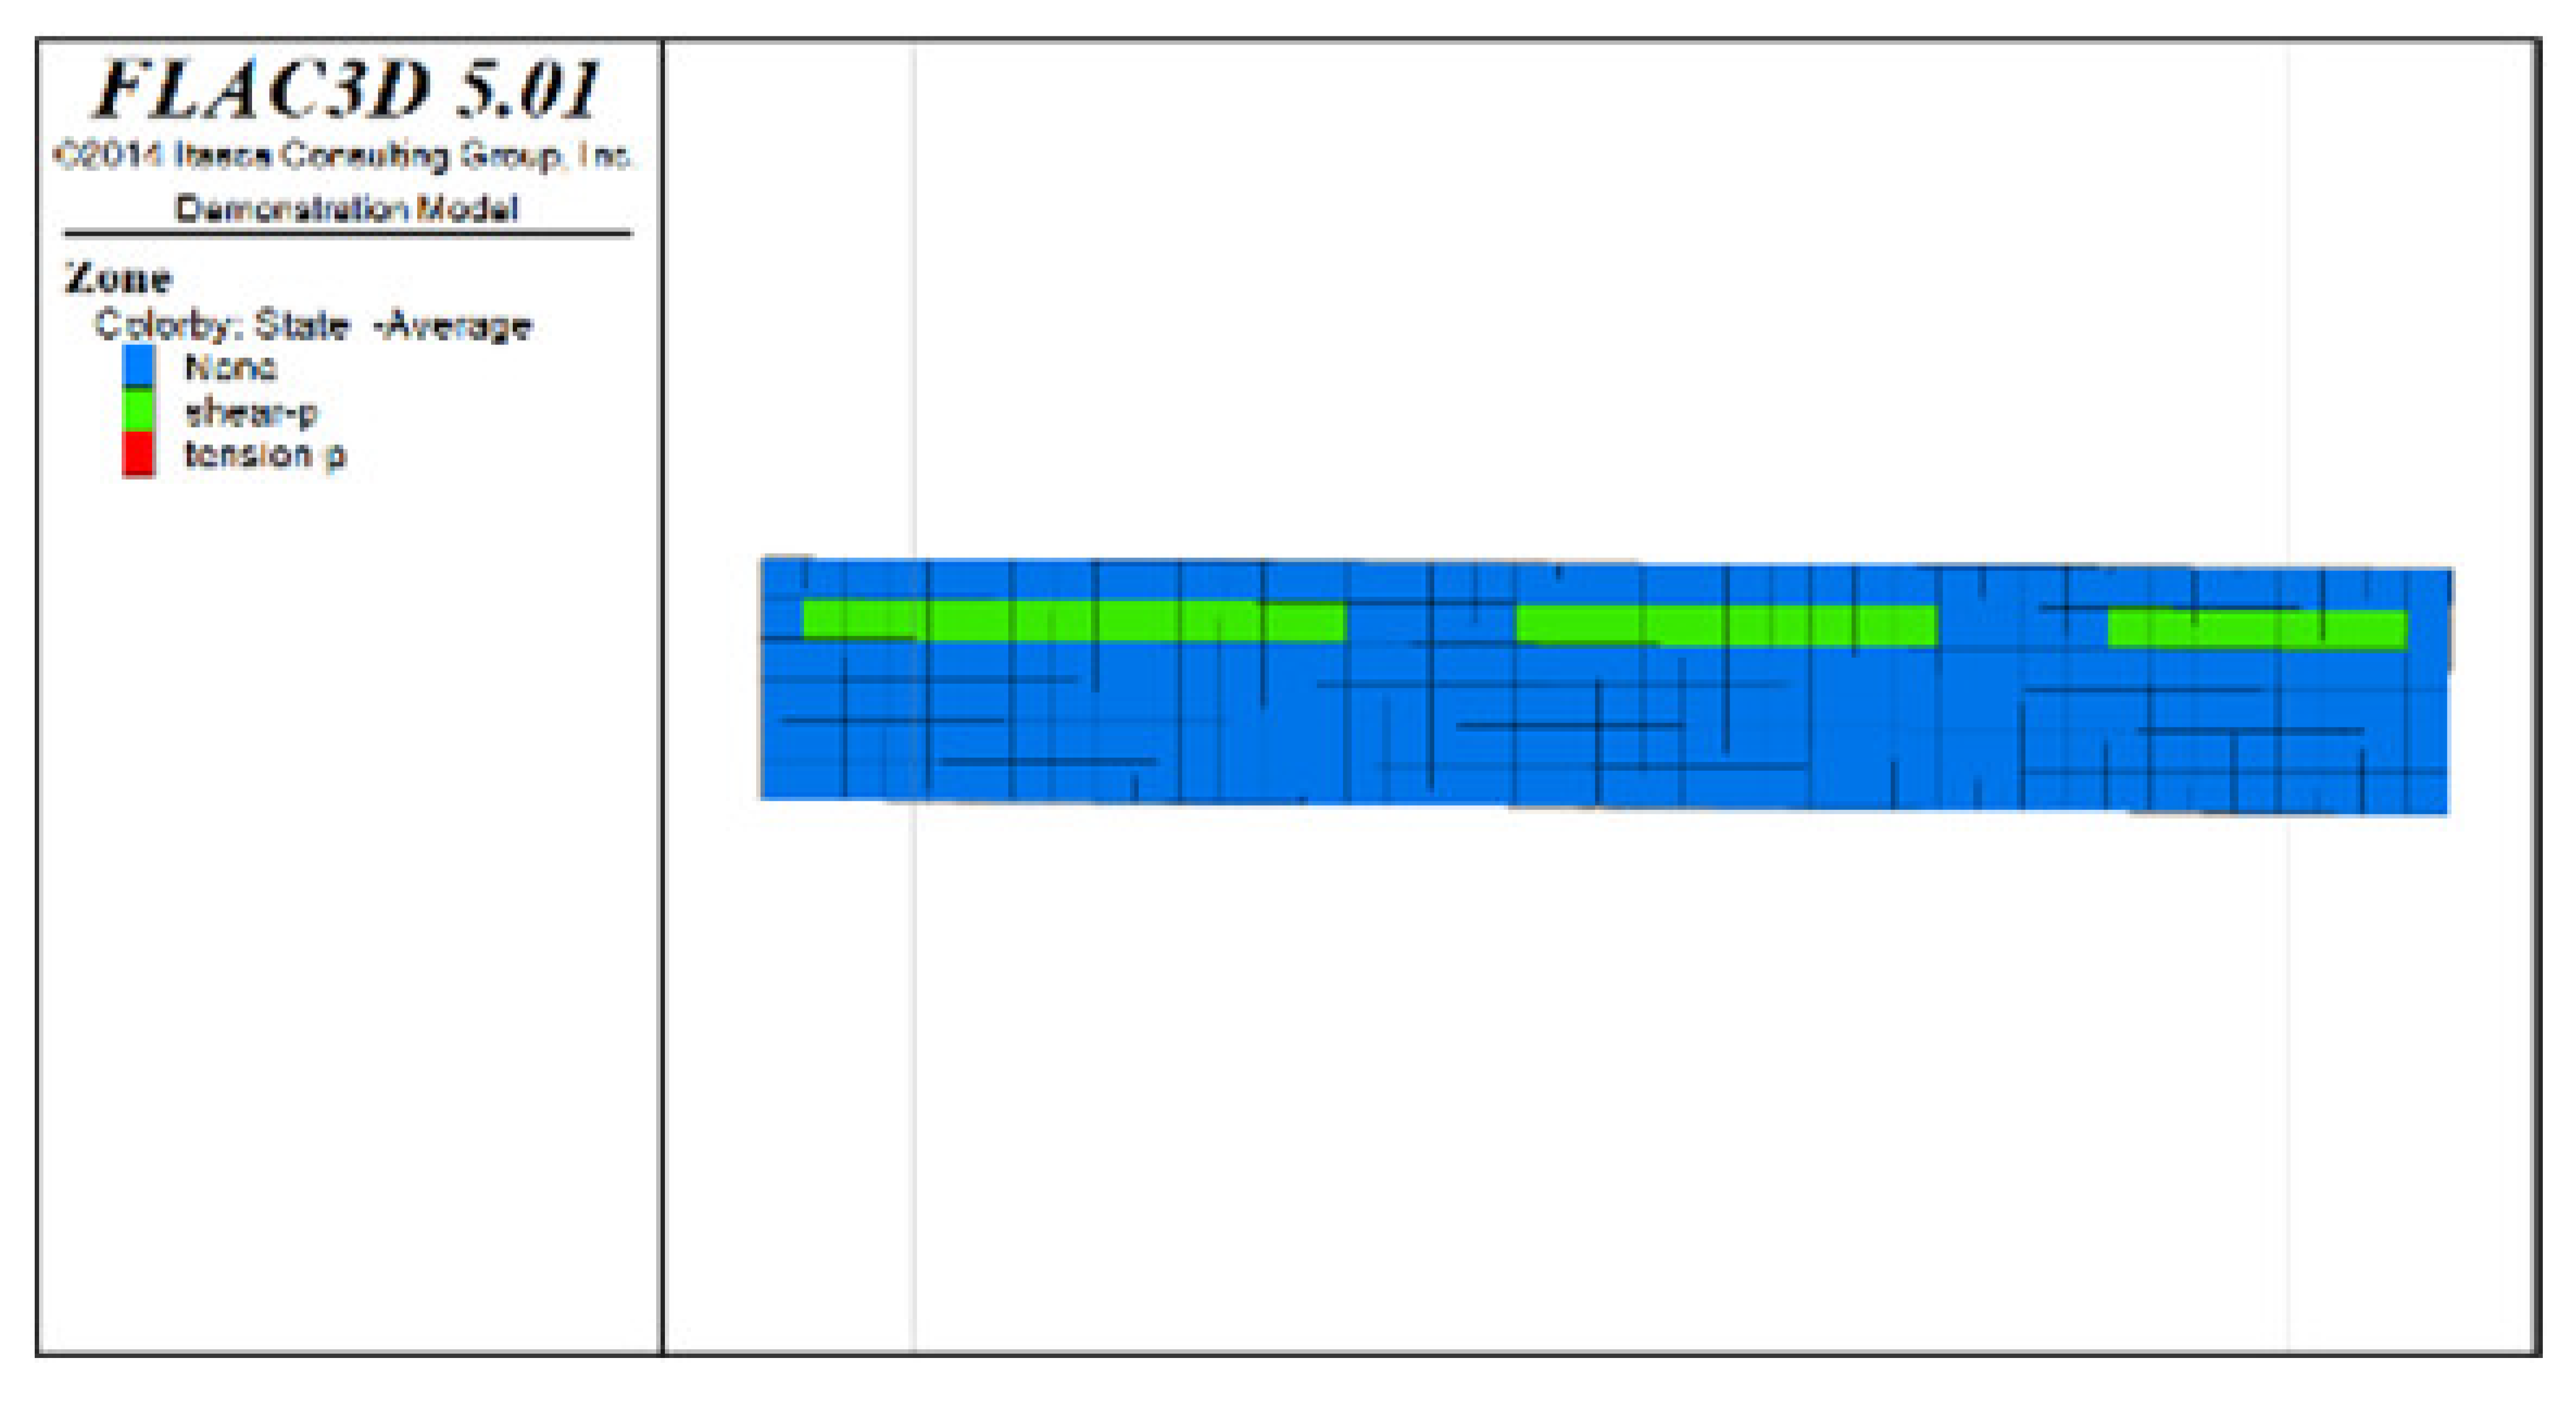 | 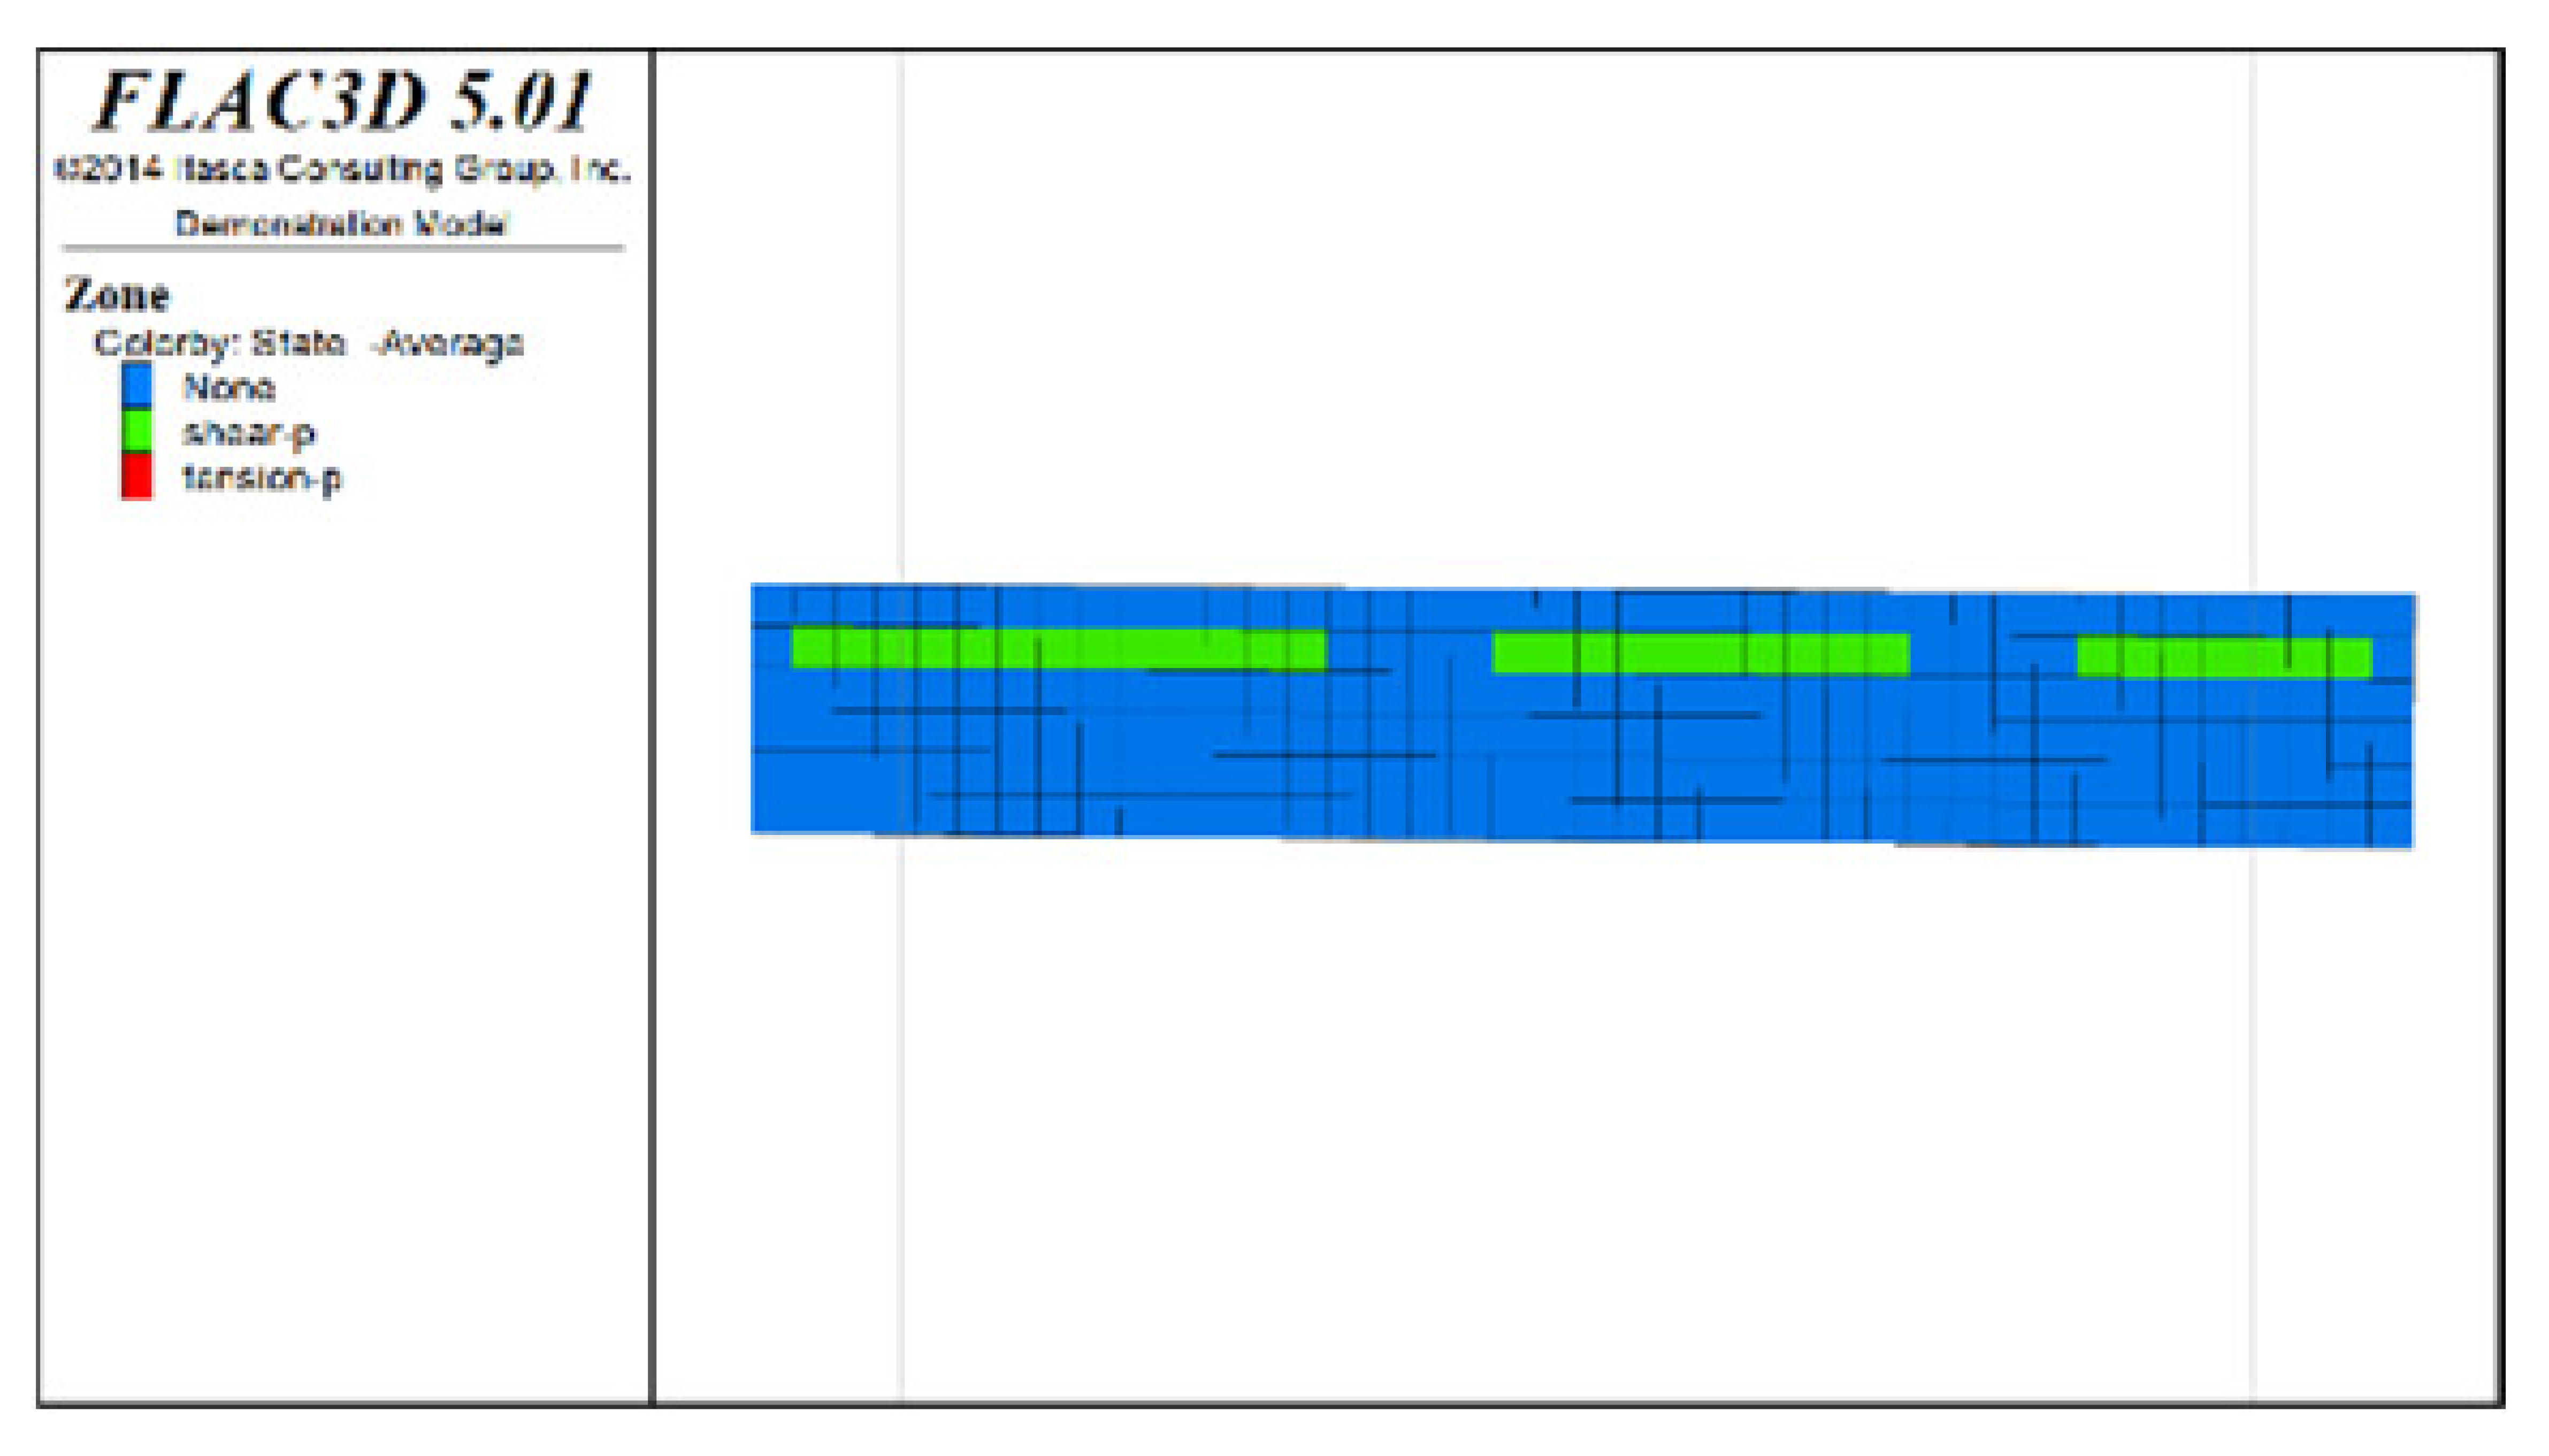 | ||
| Distribution diagram of plastic zones in the roof protection layer observed from bottom to top | 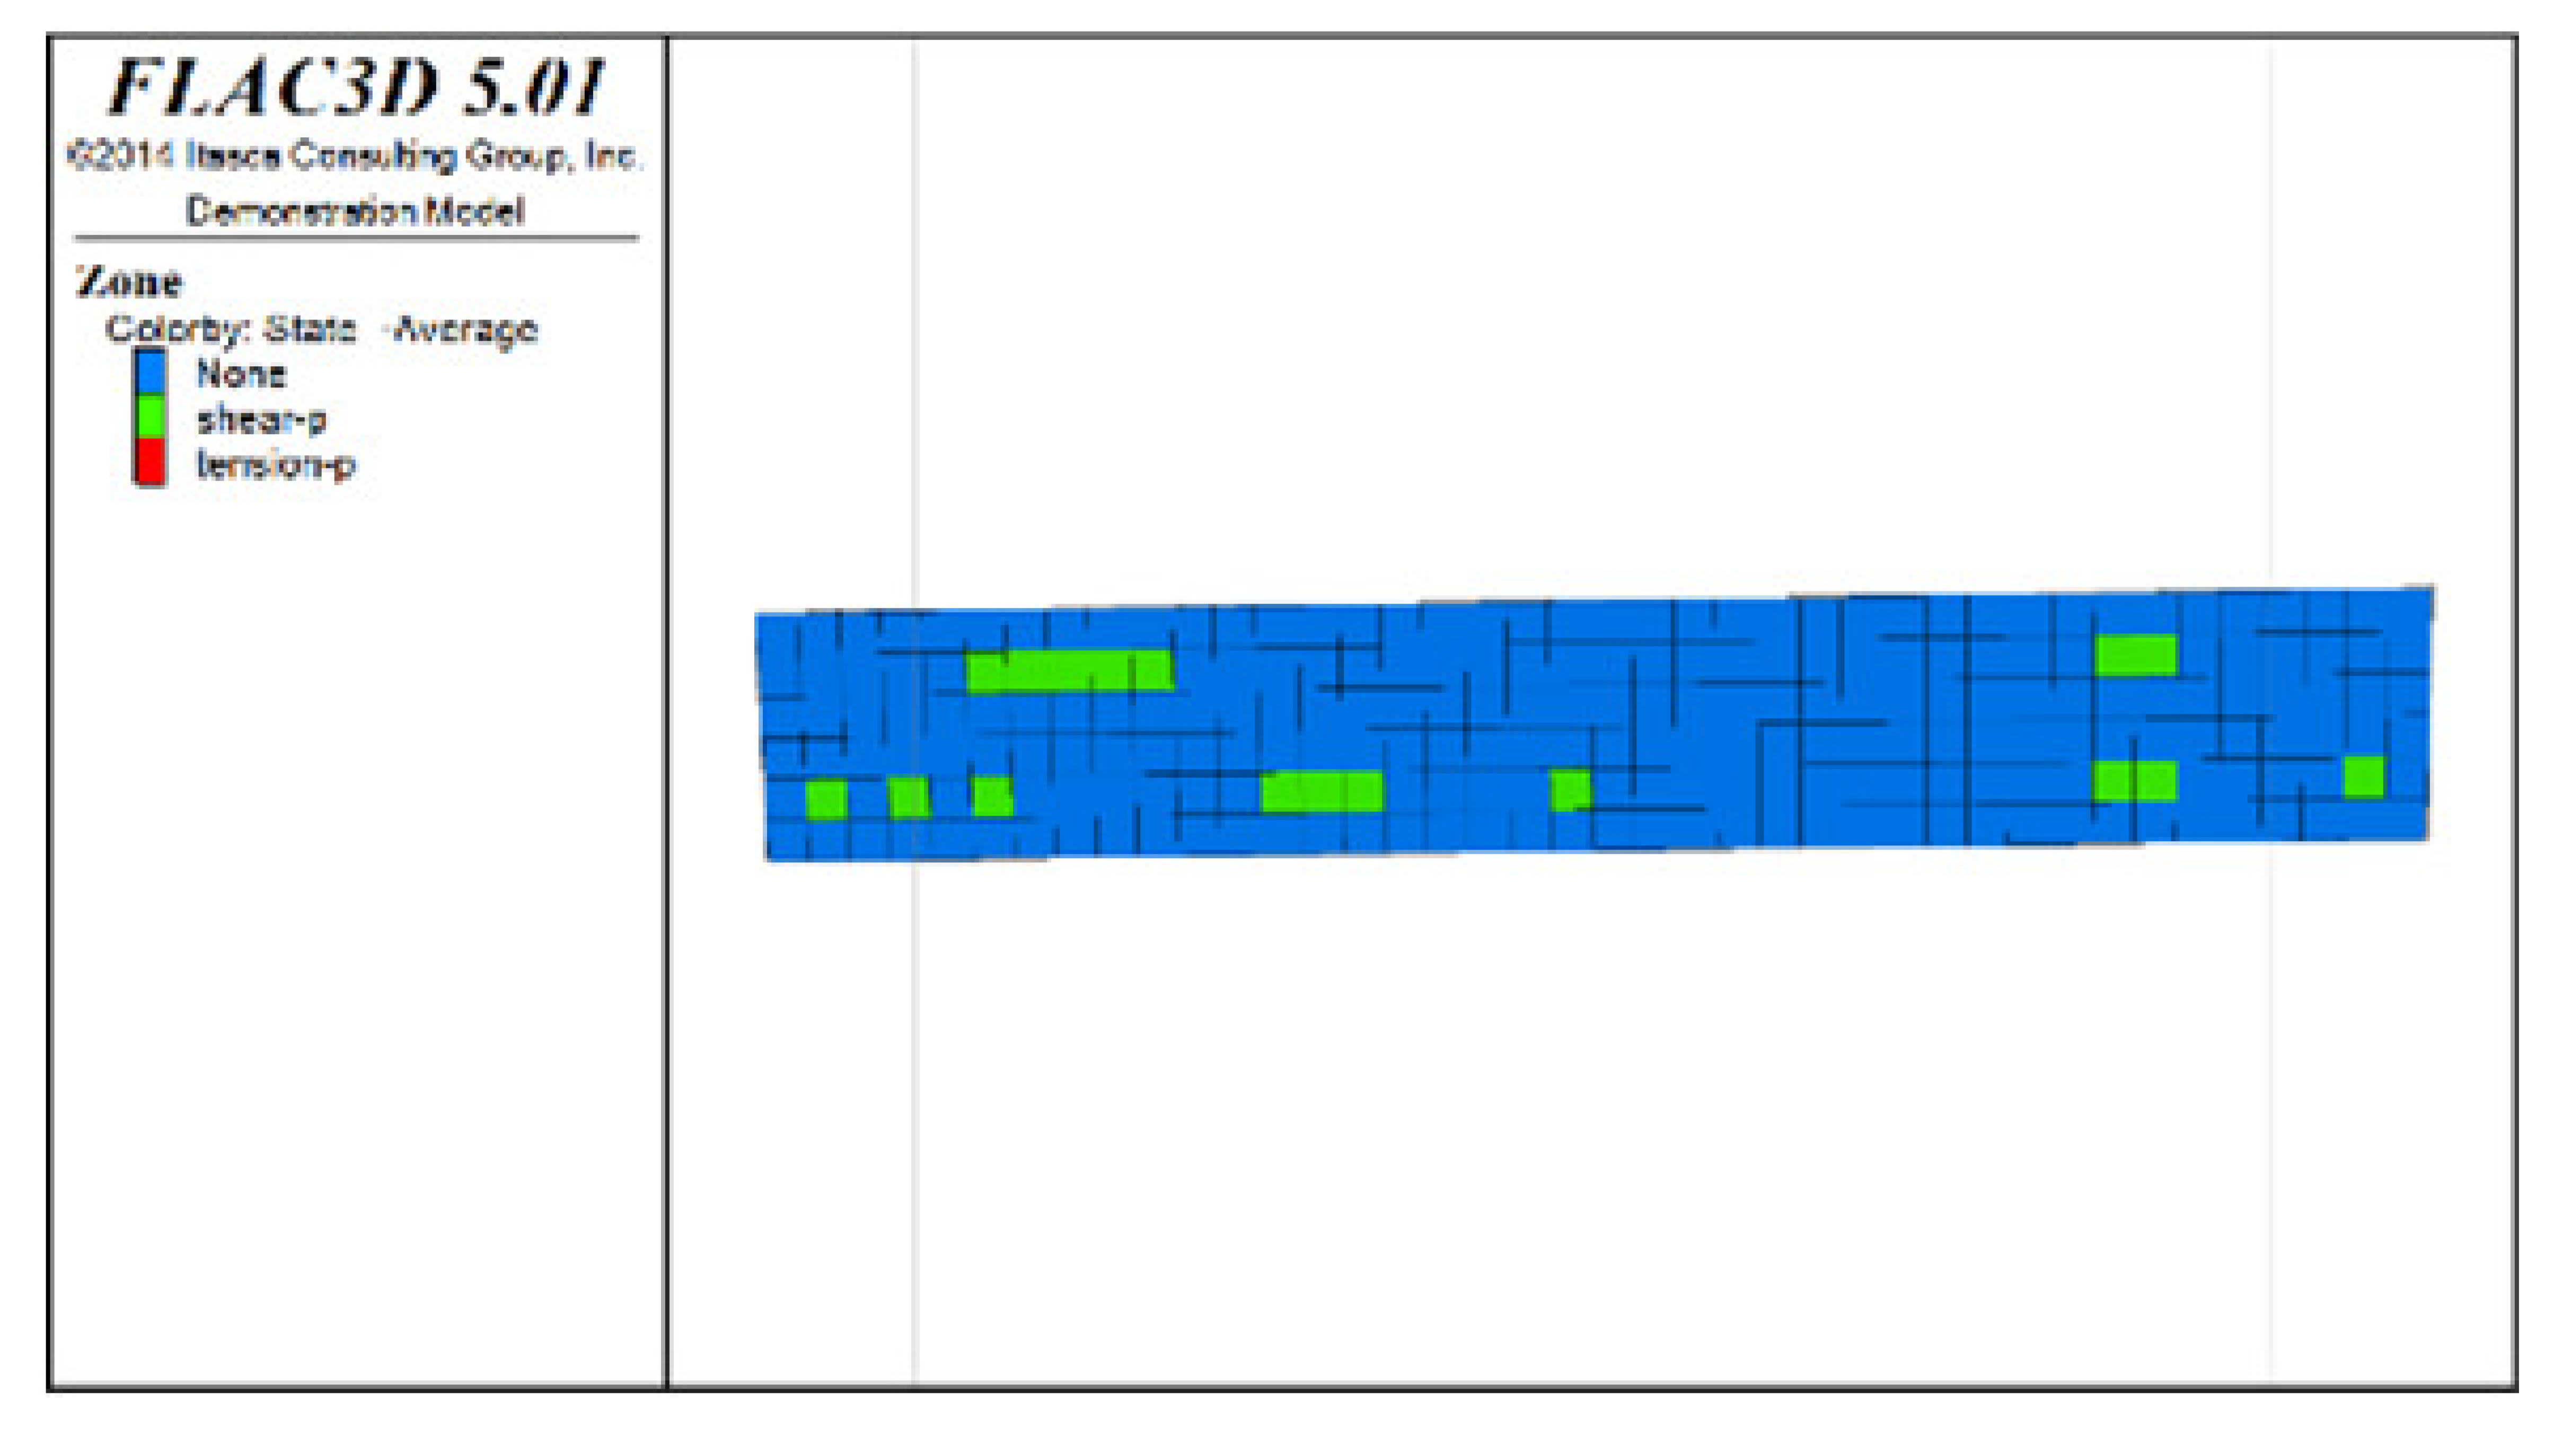 | 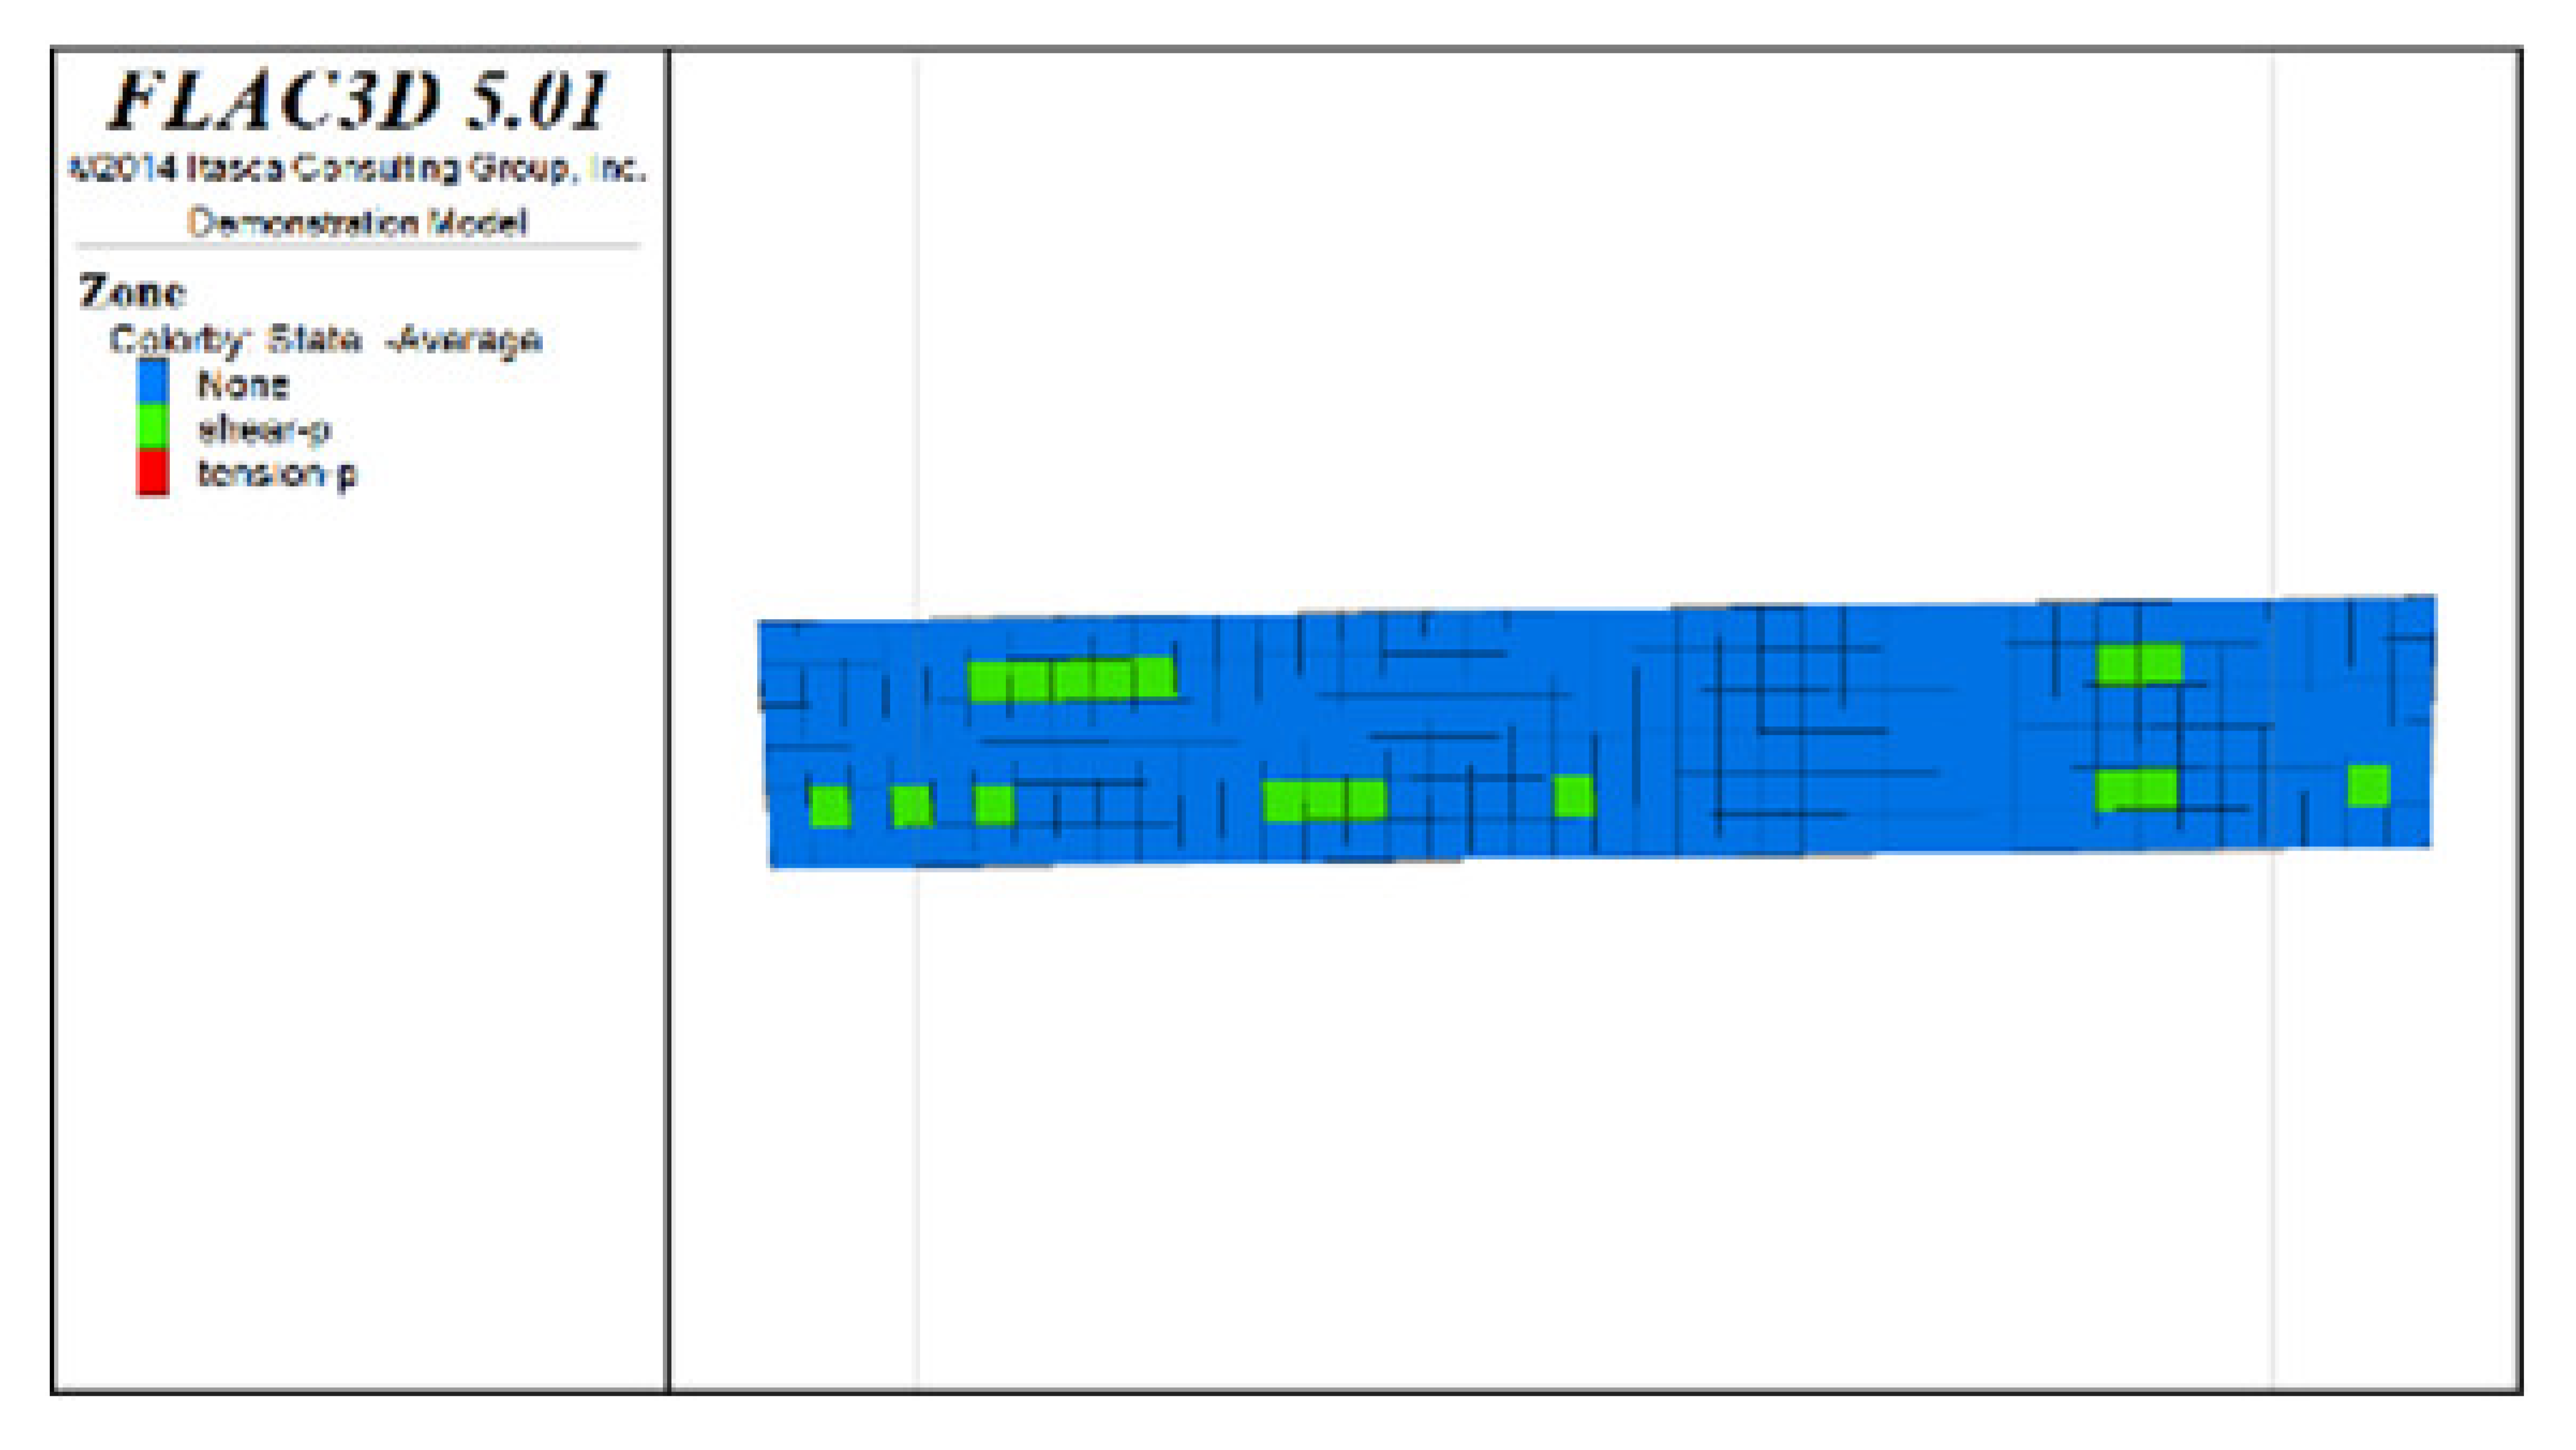 | |||
| Scheme D | Distribution diagram of plastic zones in the roof protection layer observed from top to bottom | 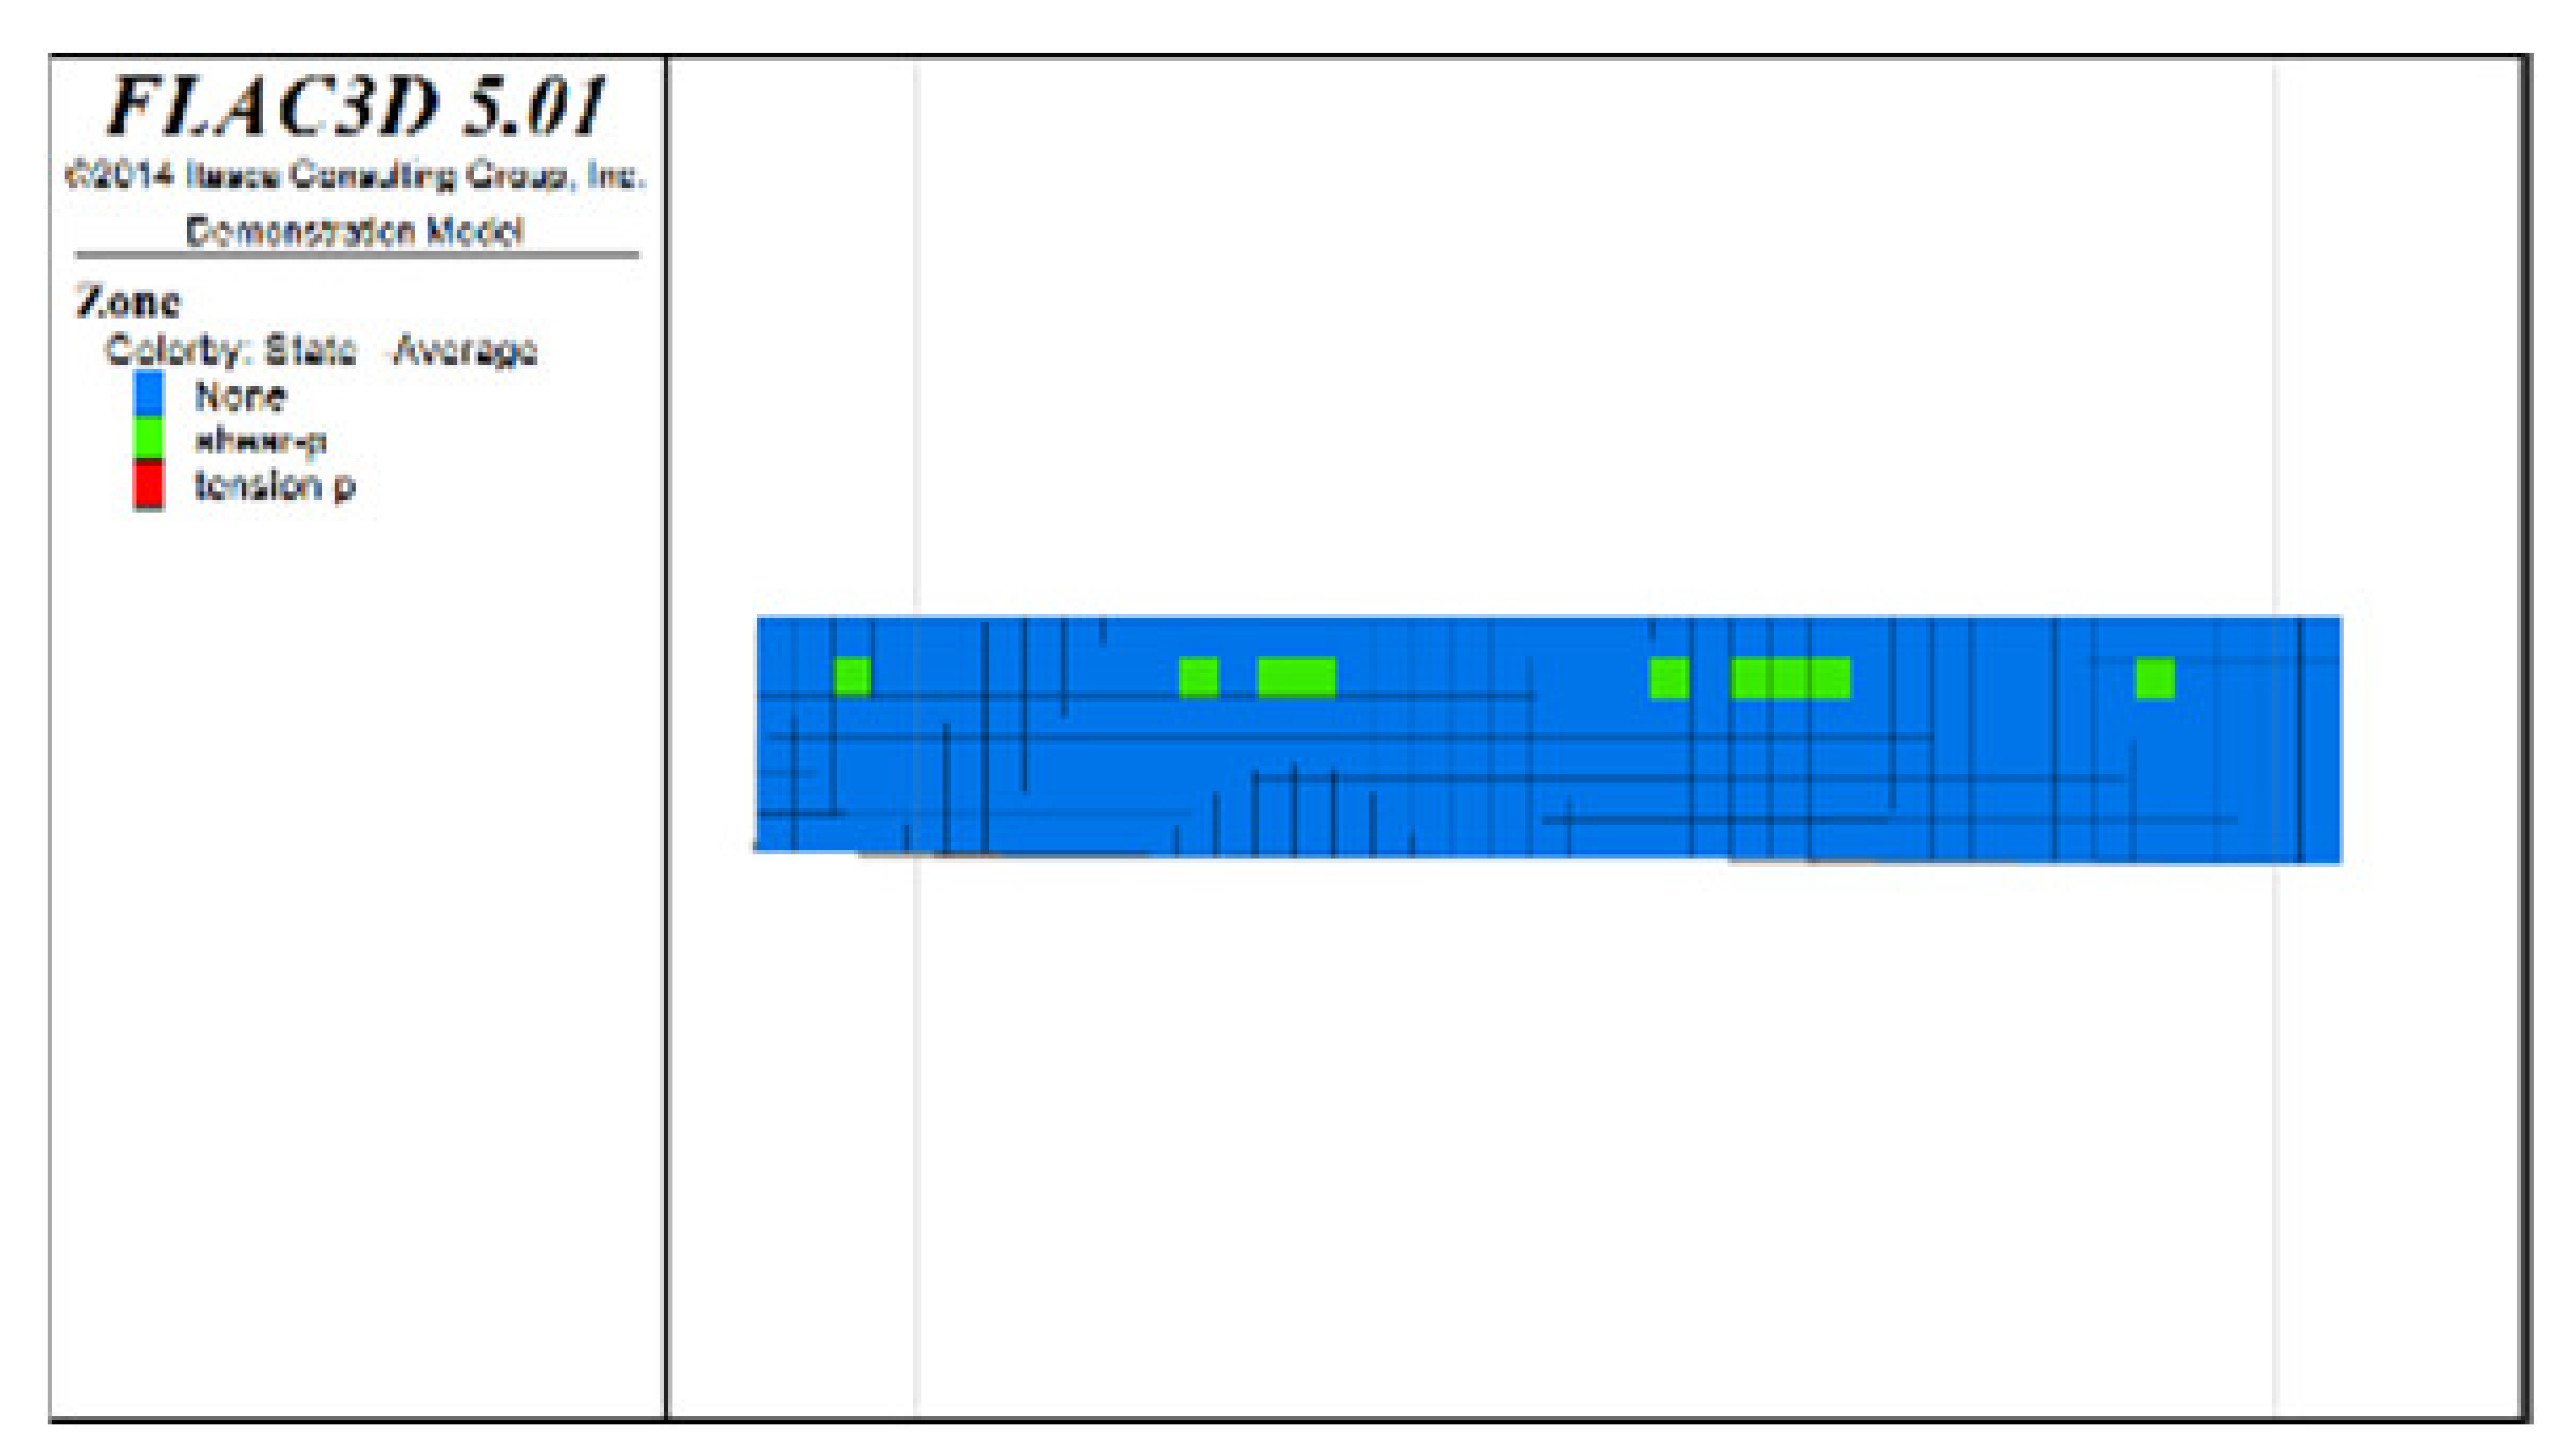 | 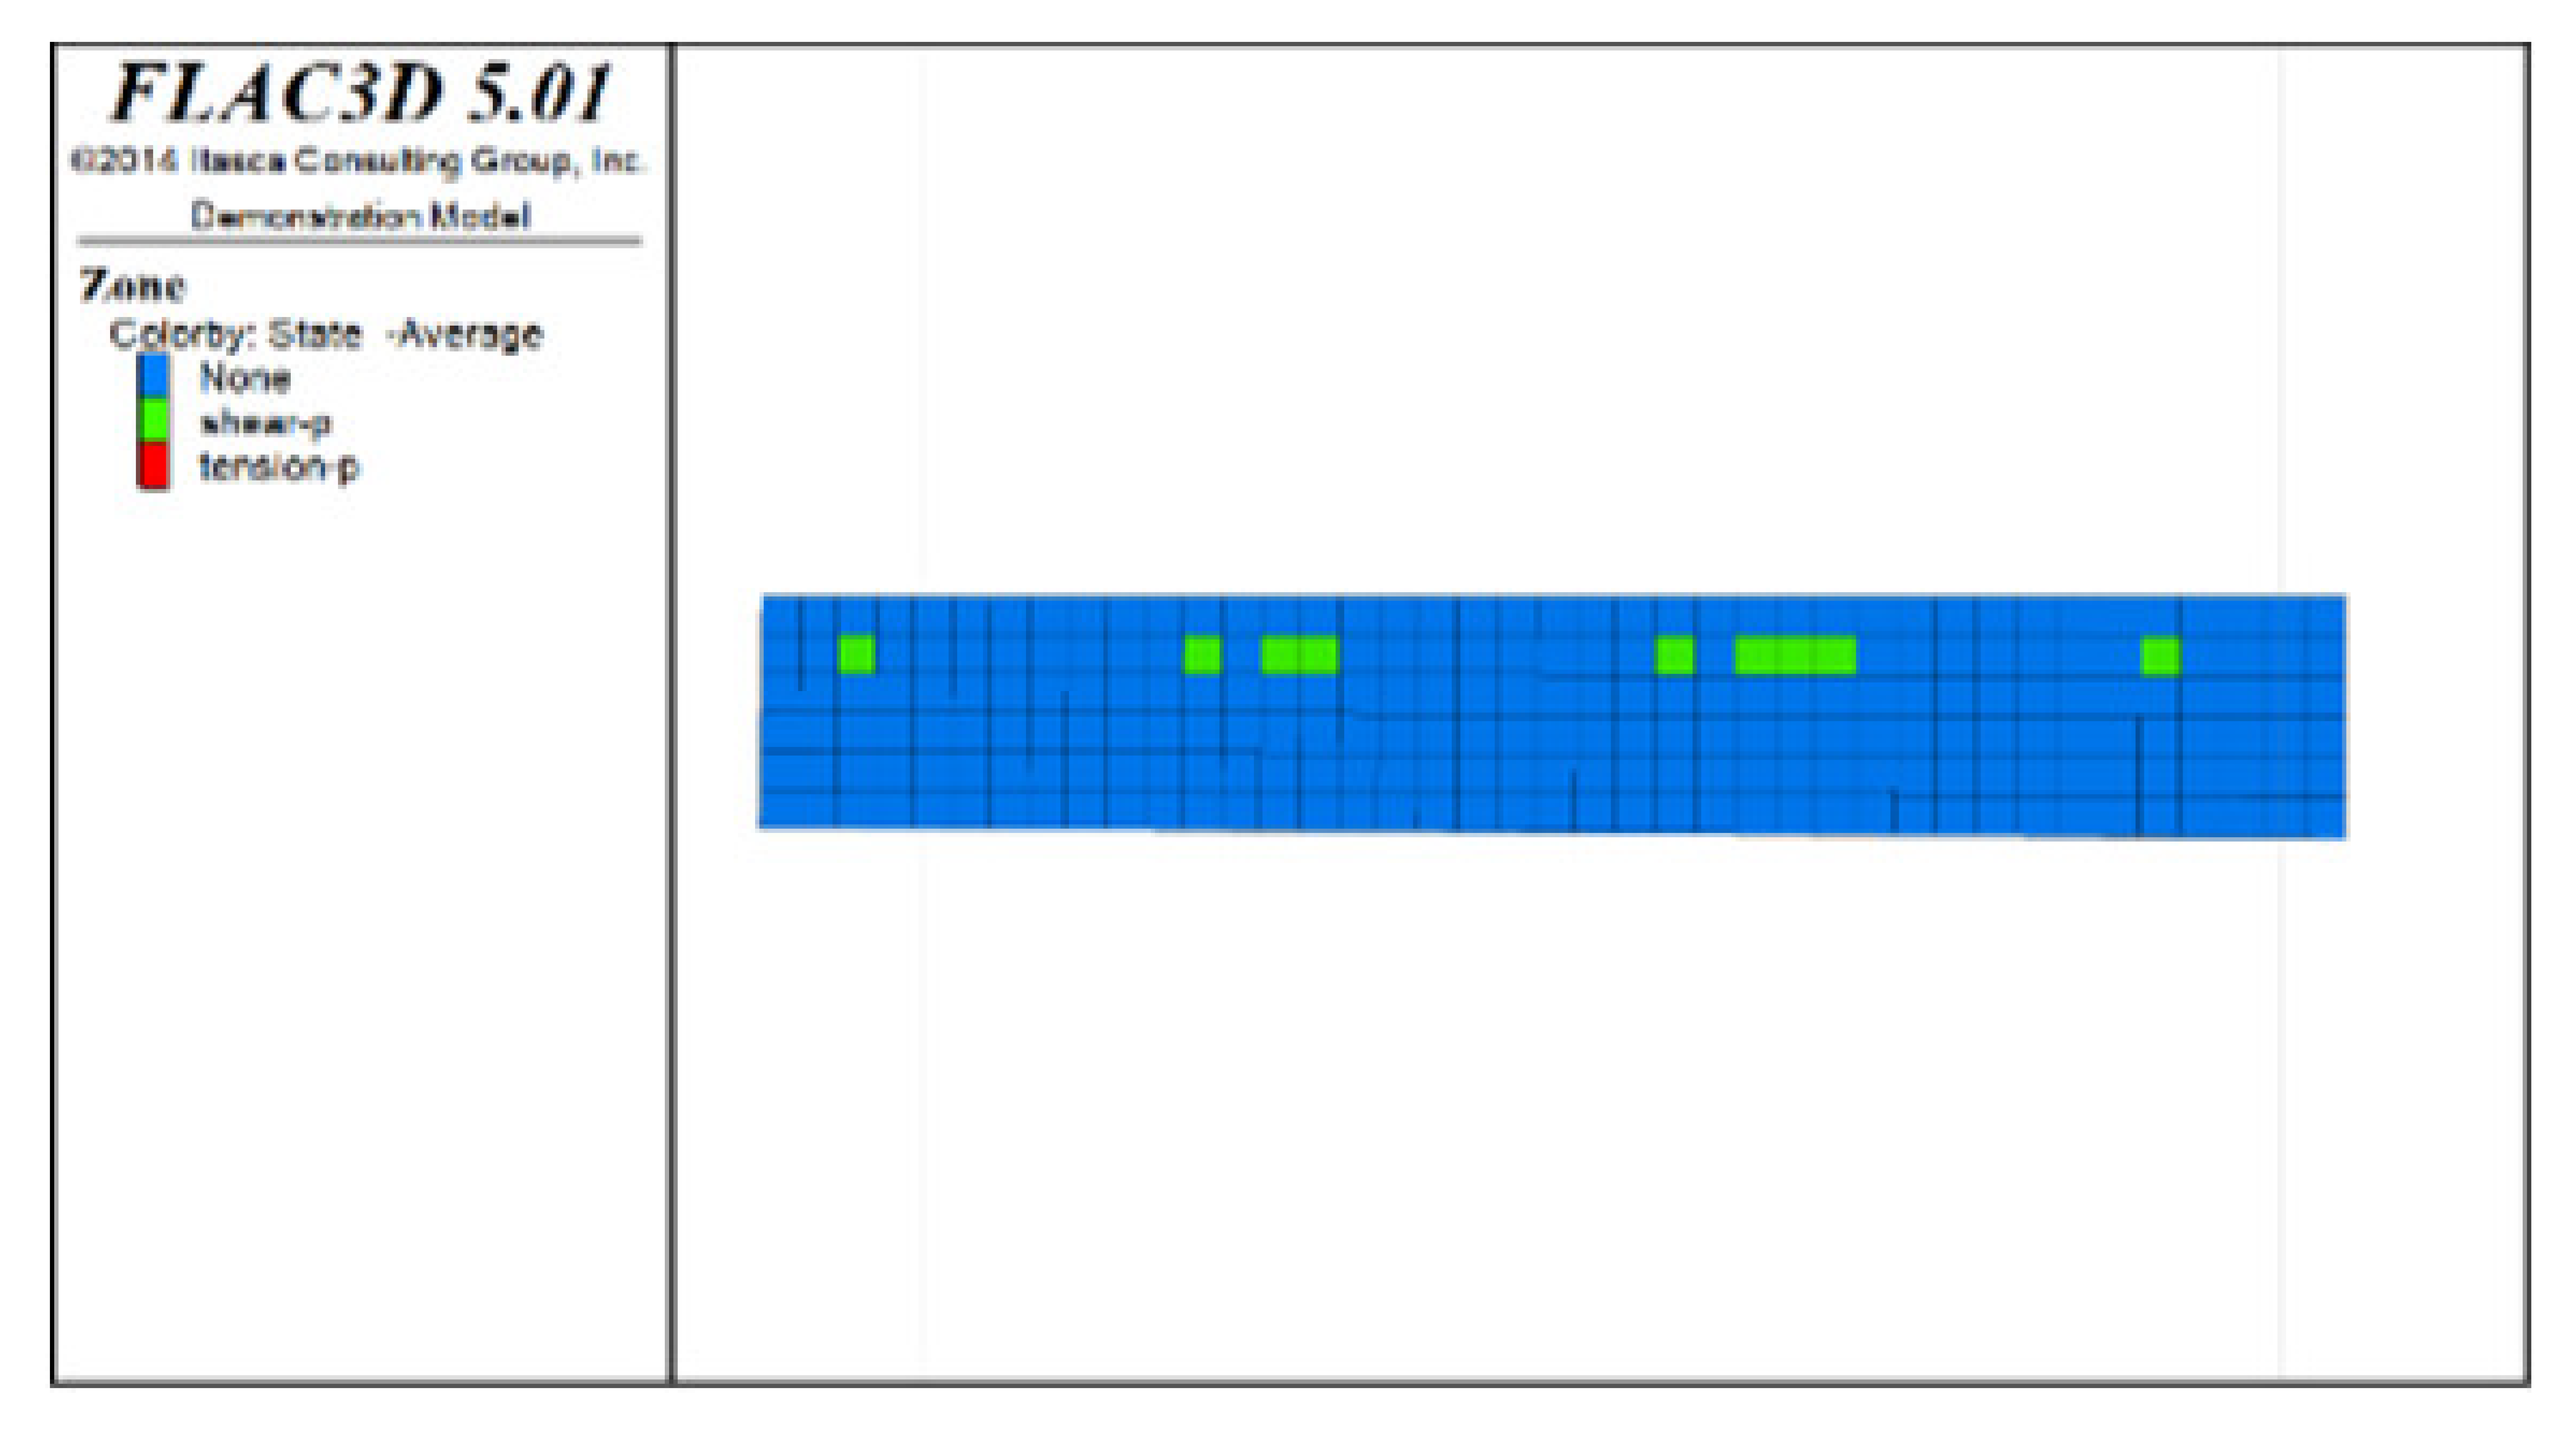 | 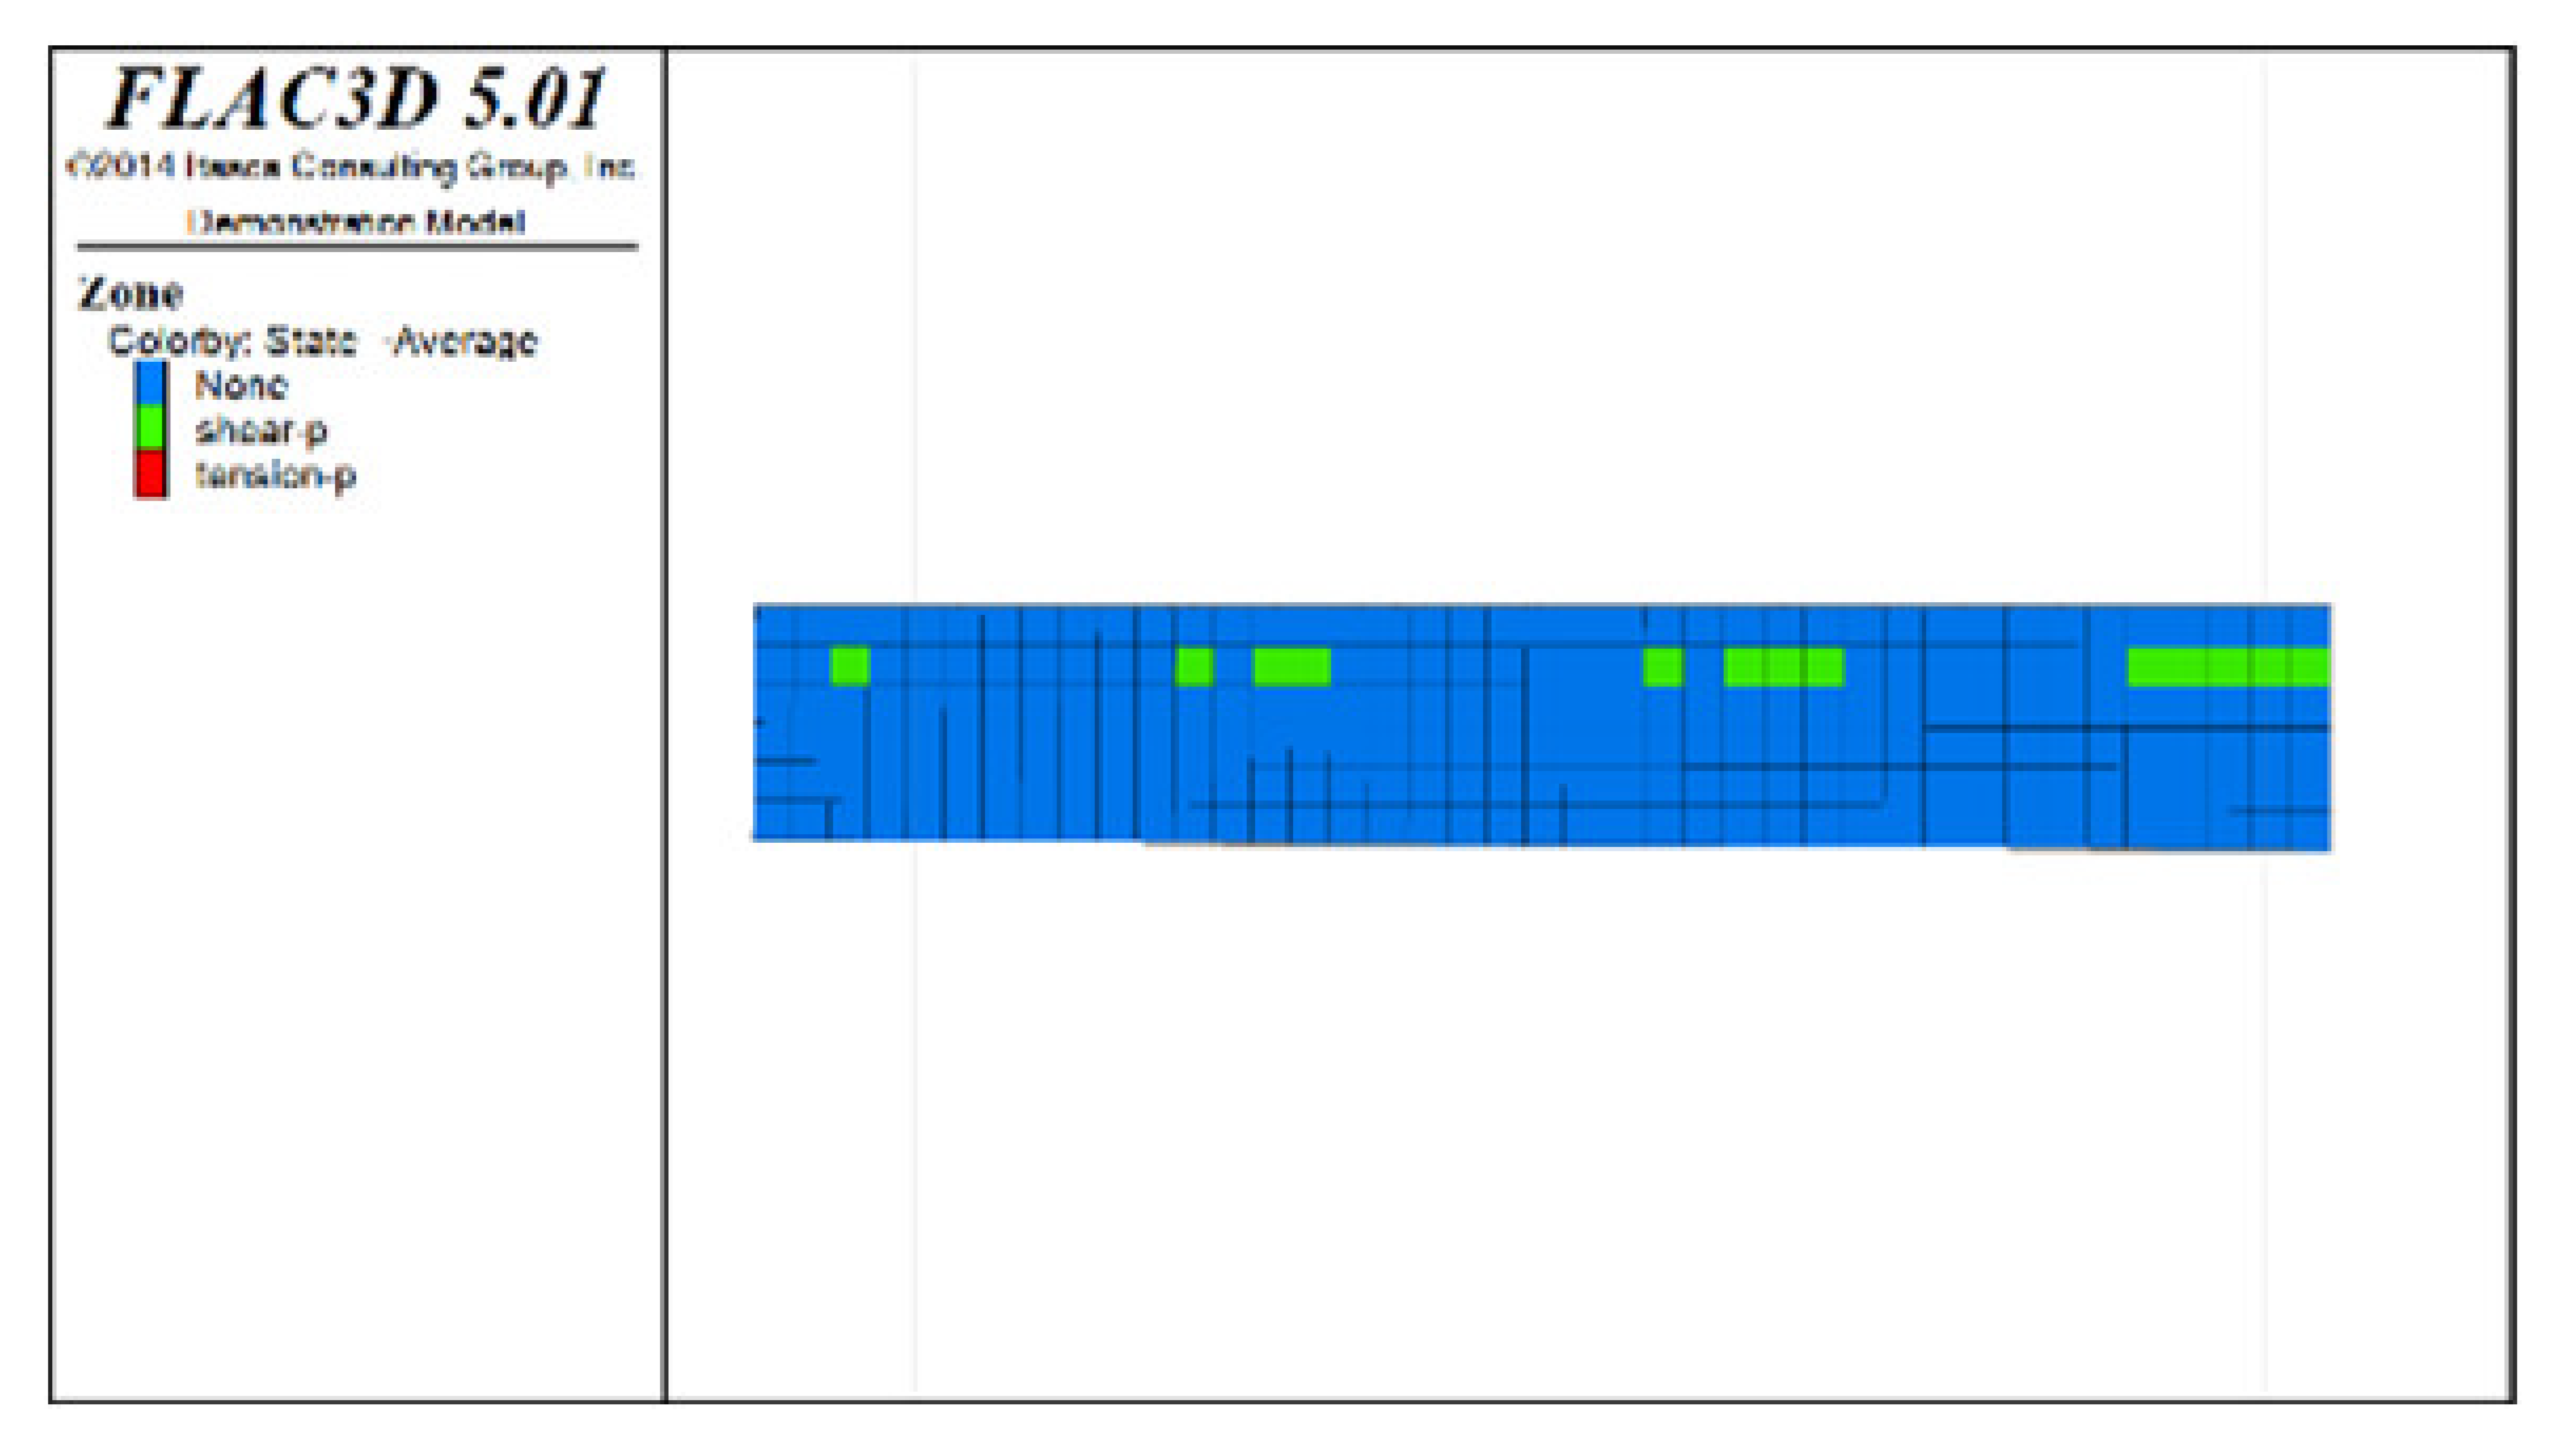 |  |
| Distribution diagram of plastic zones in the roof protection layer observed from bottom to top | 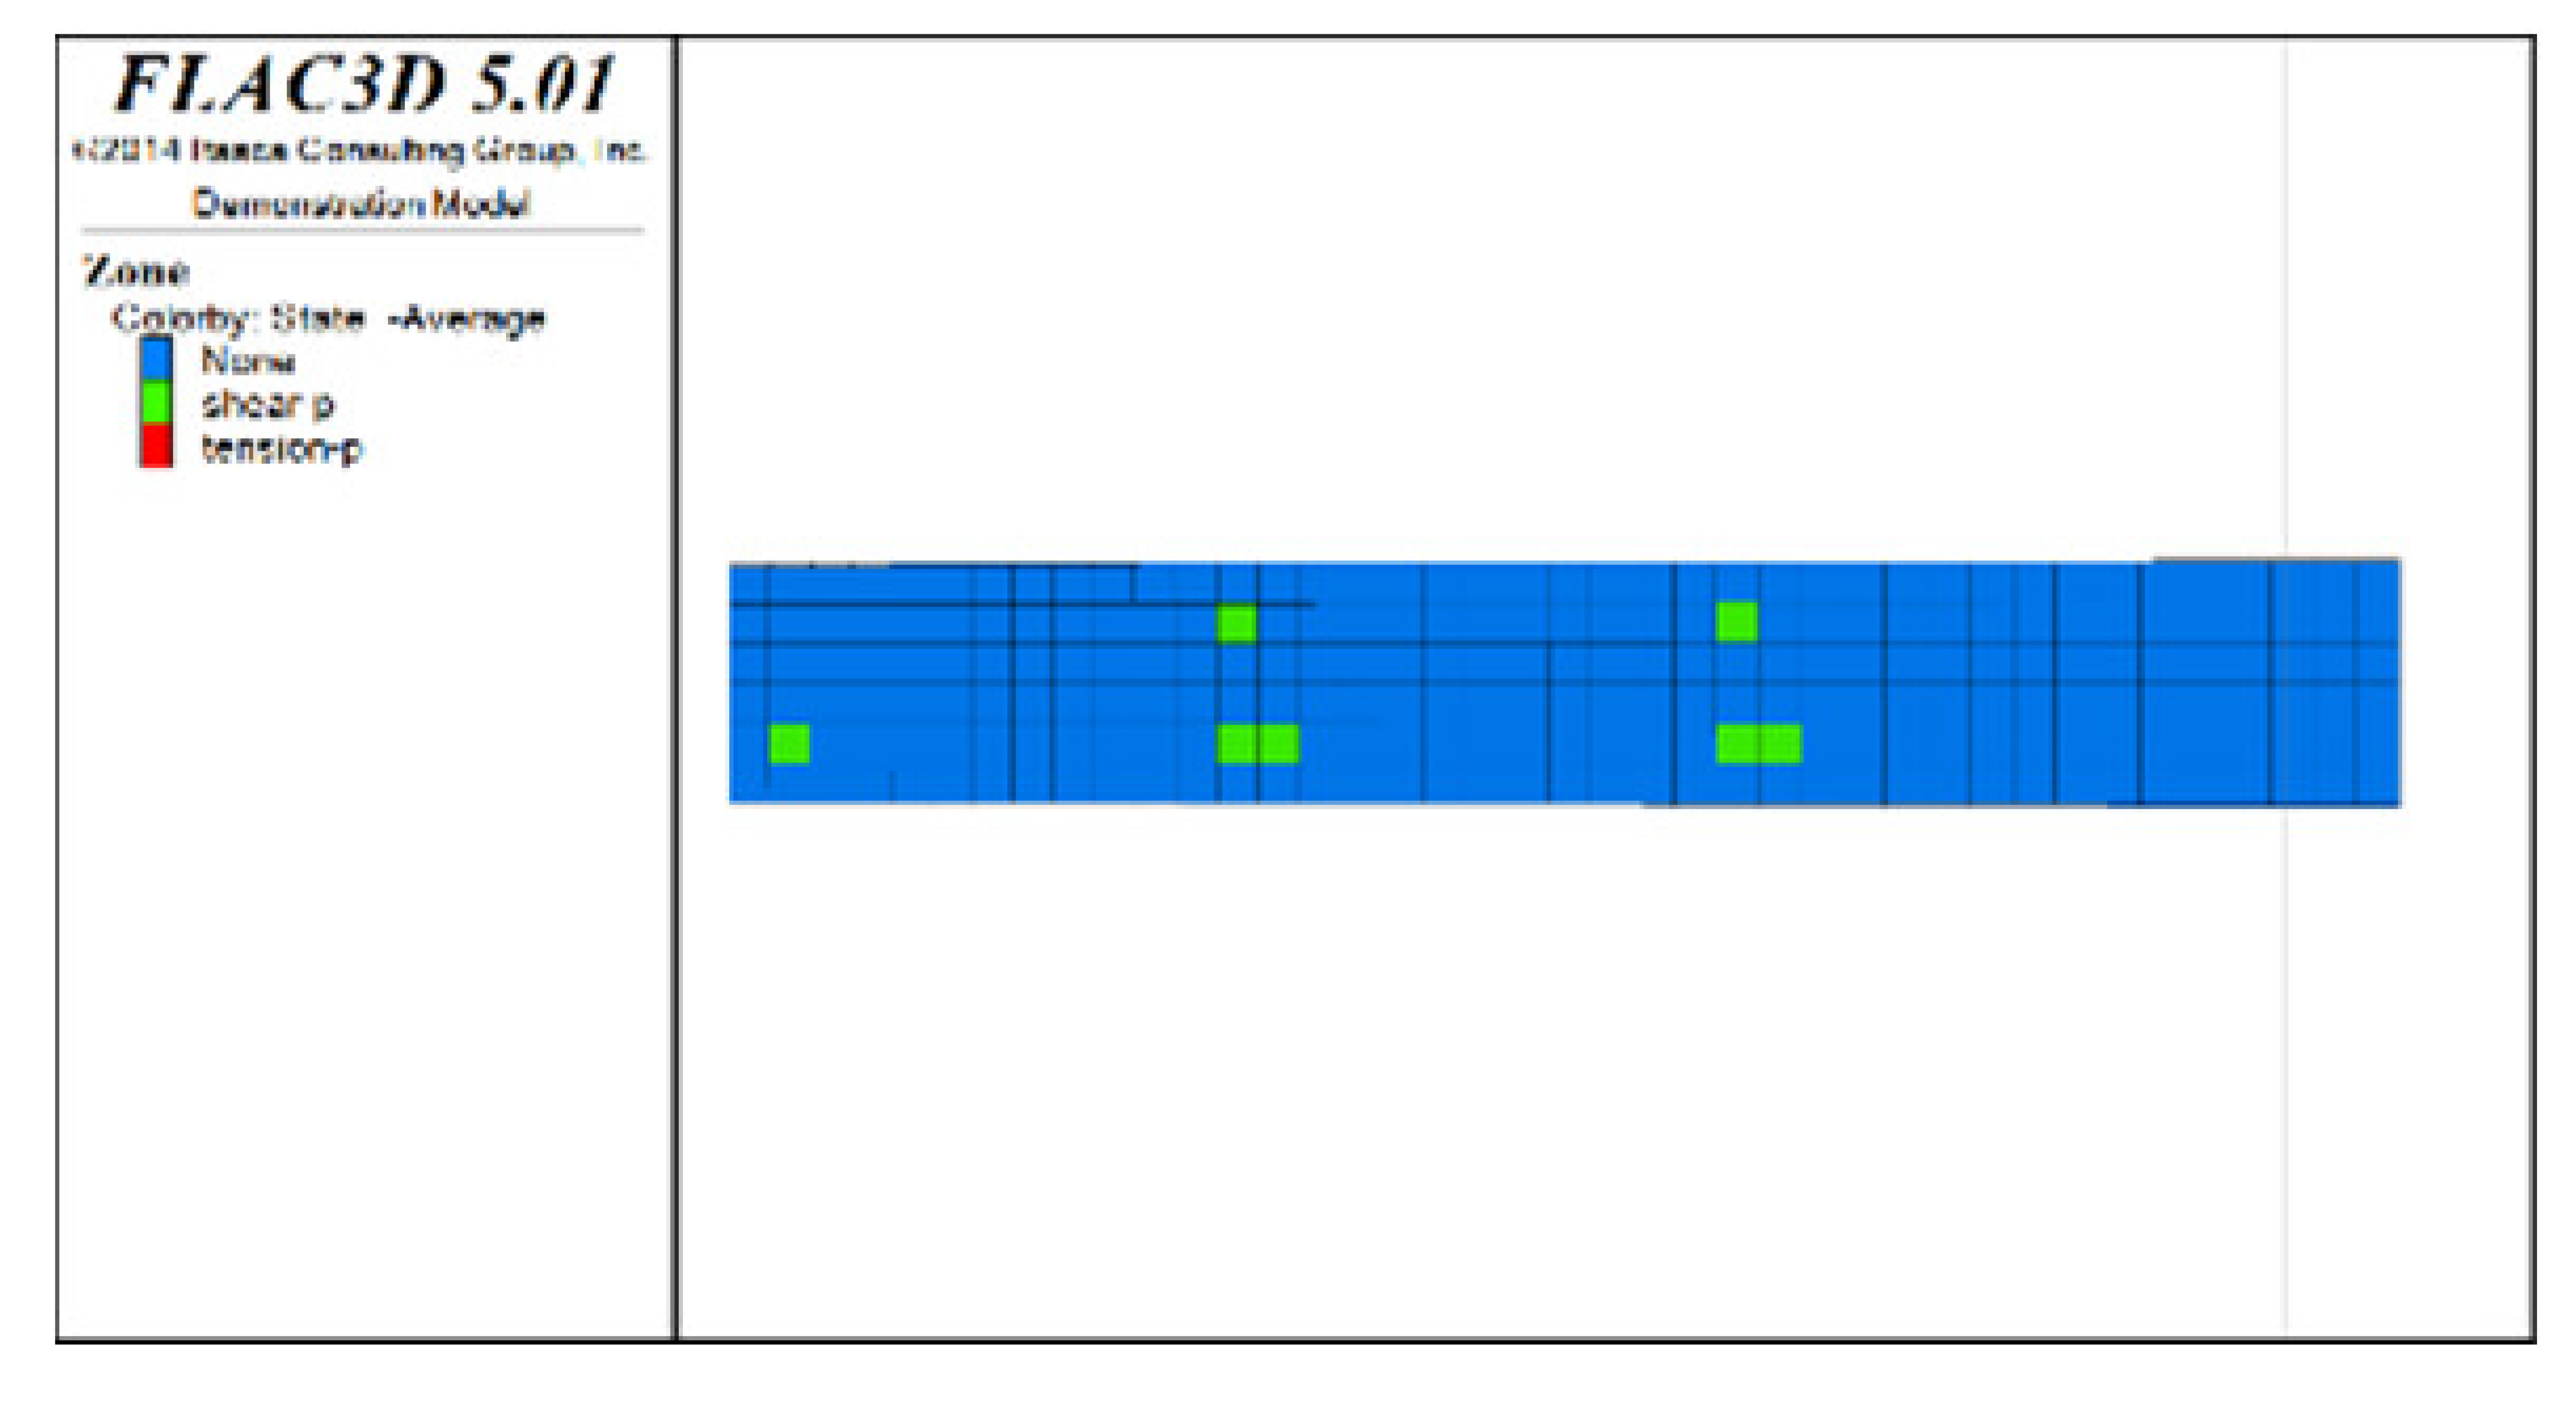 | 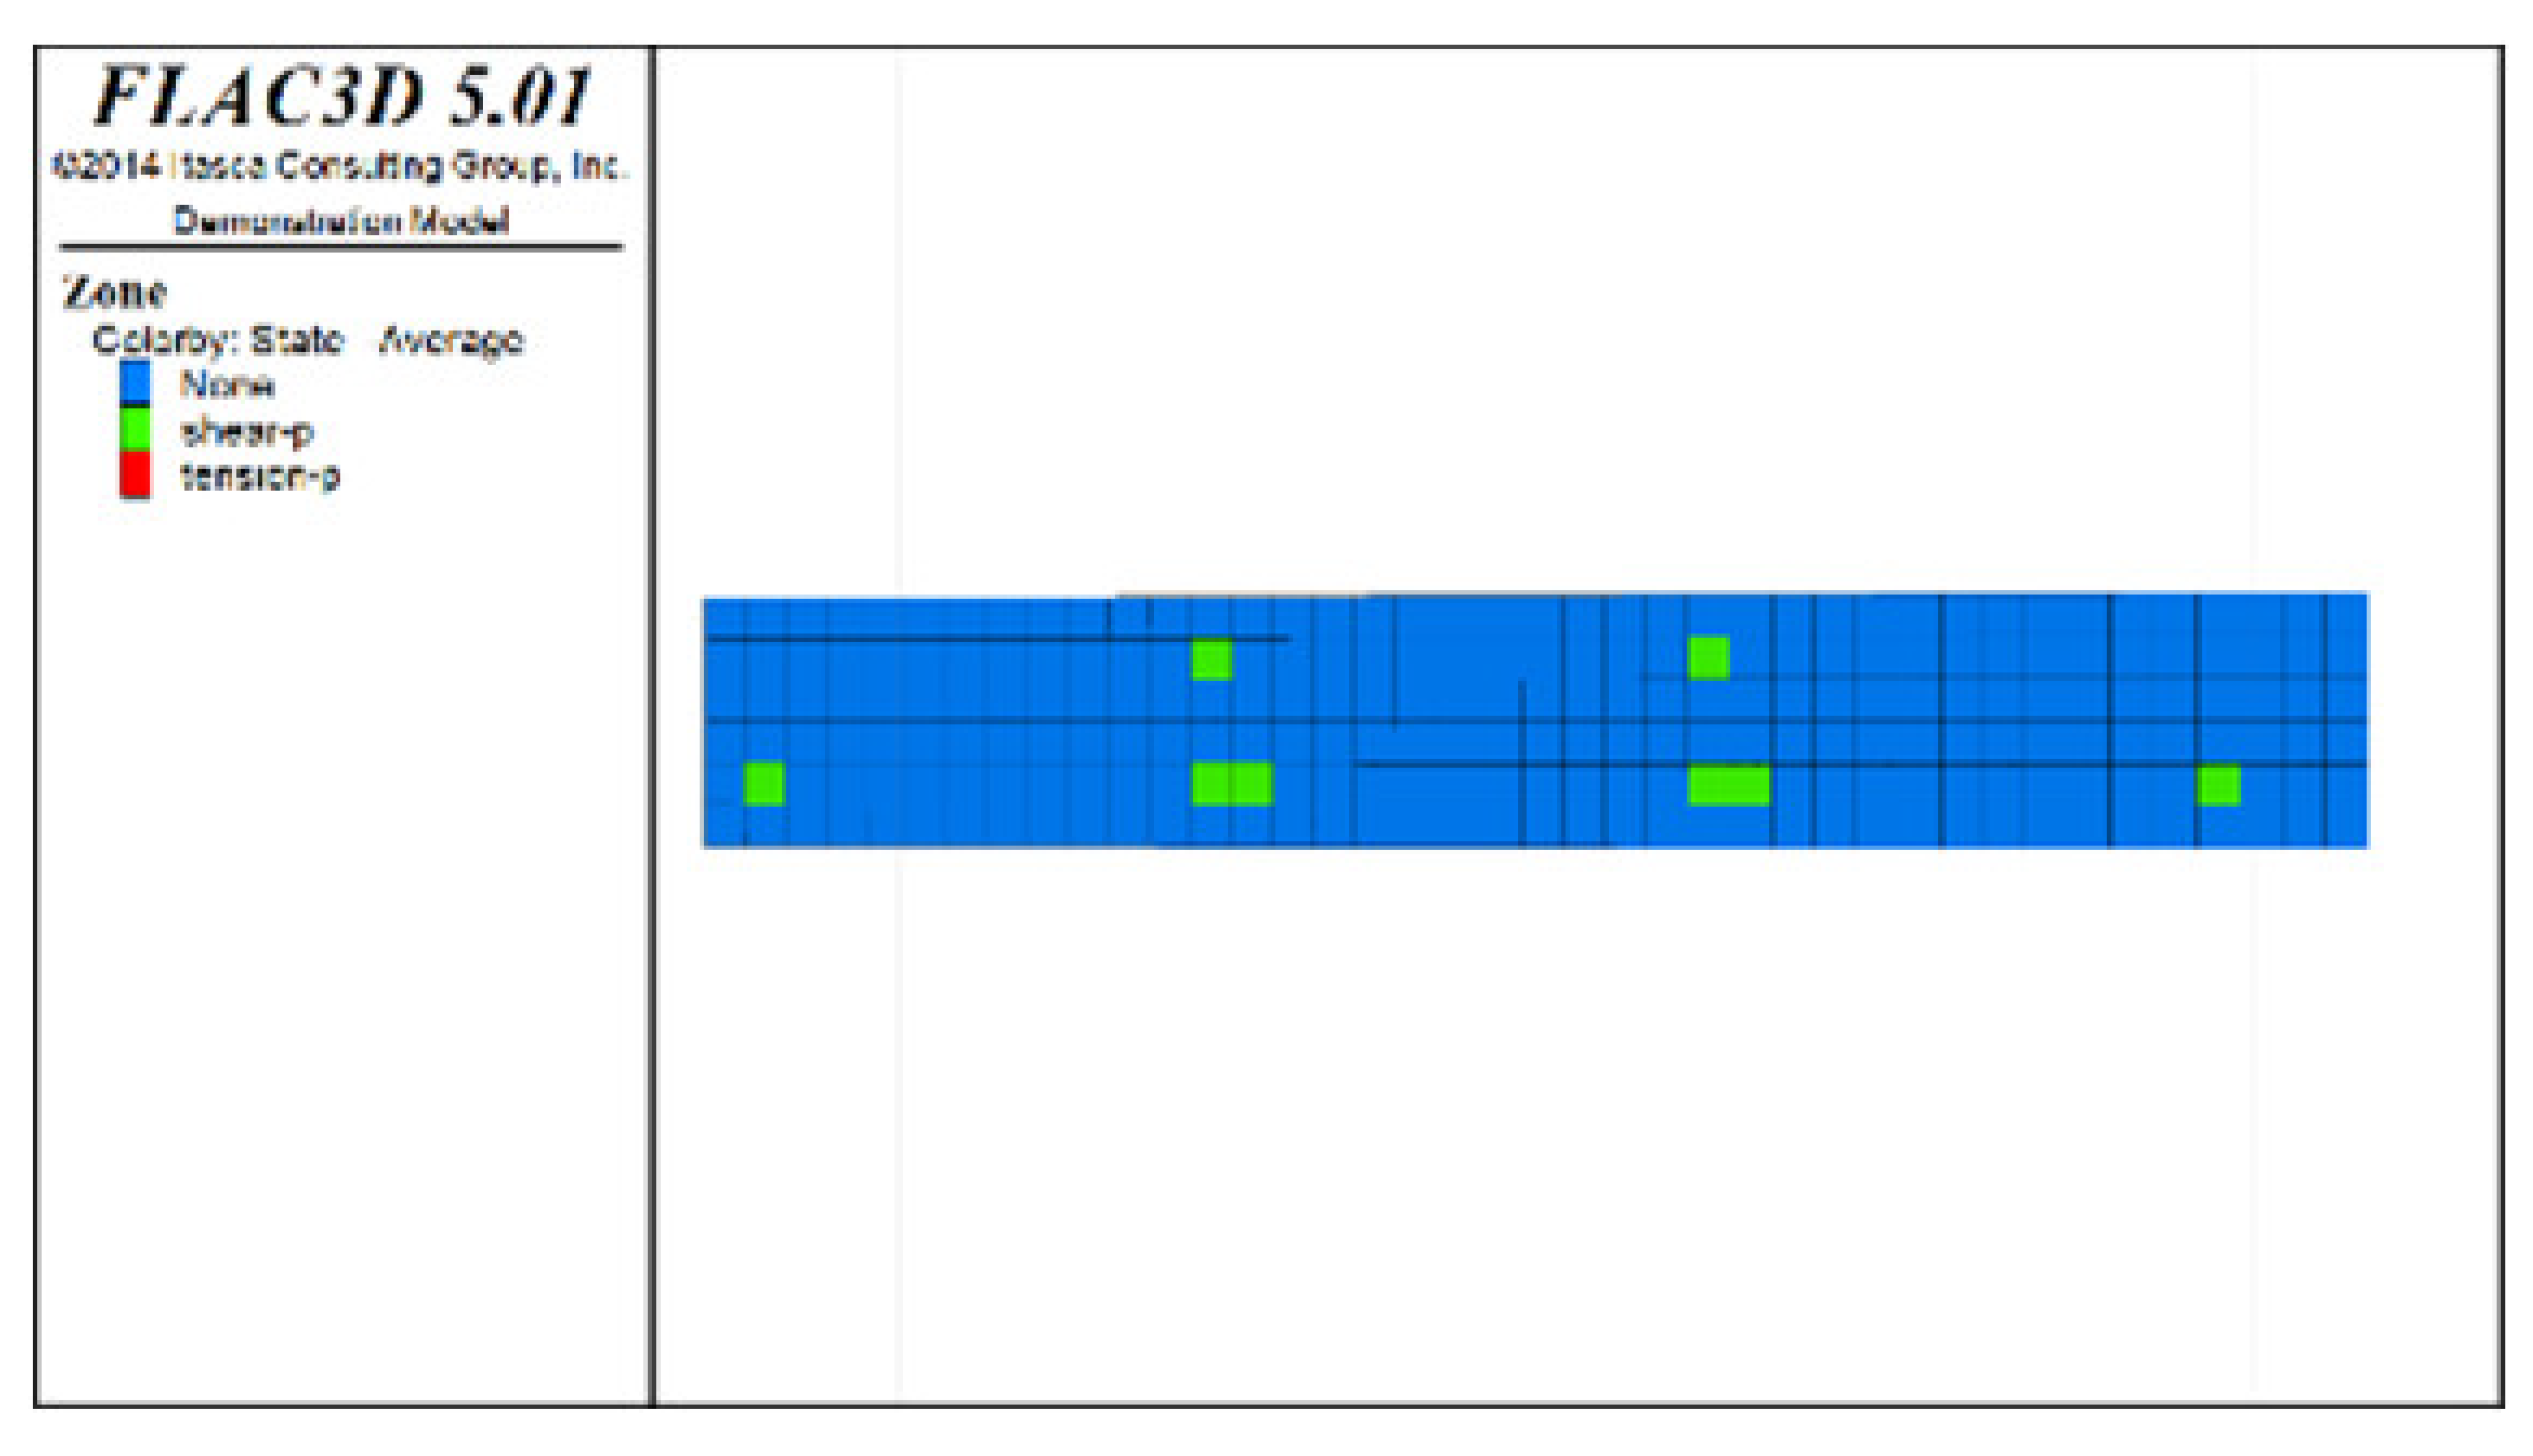 |  | 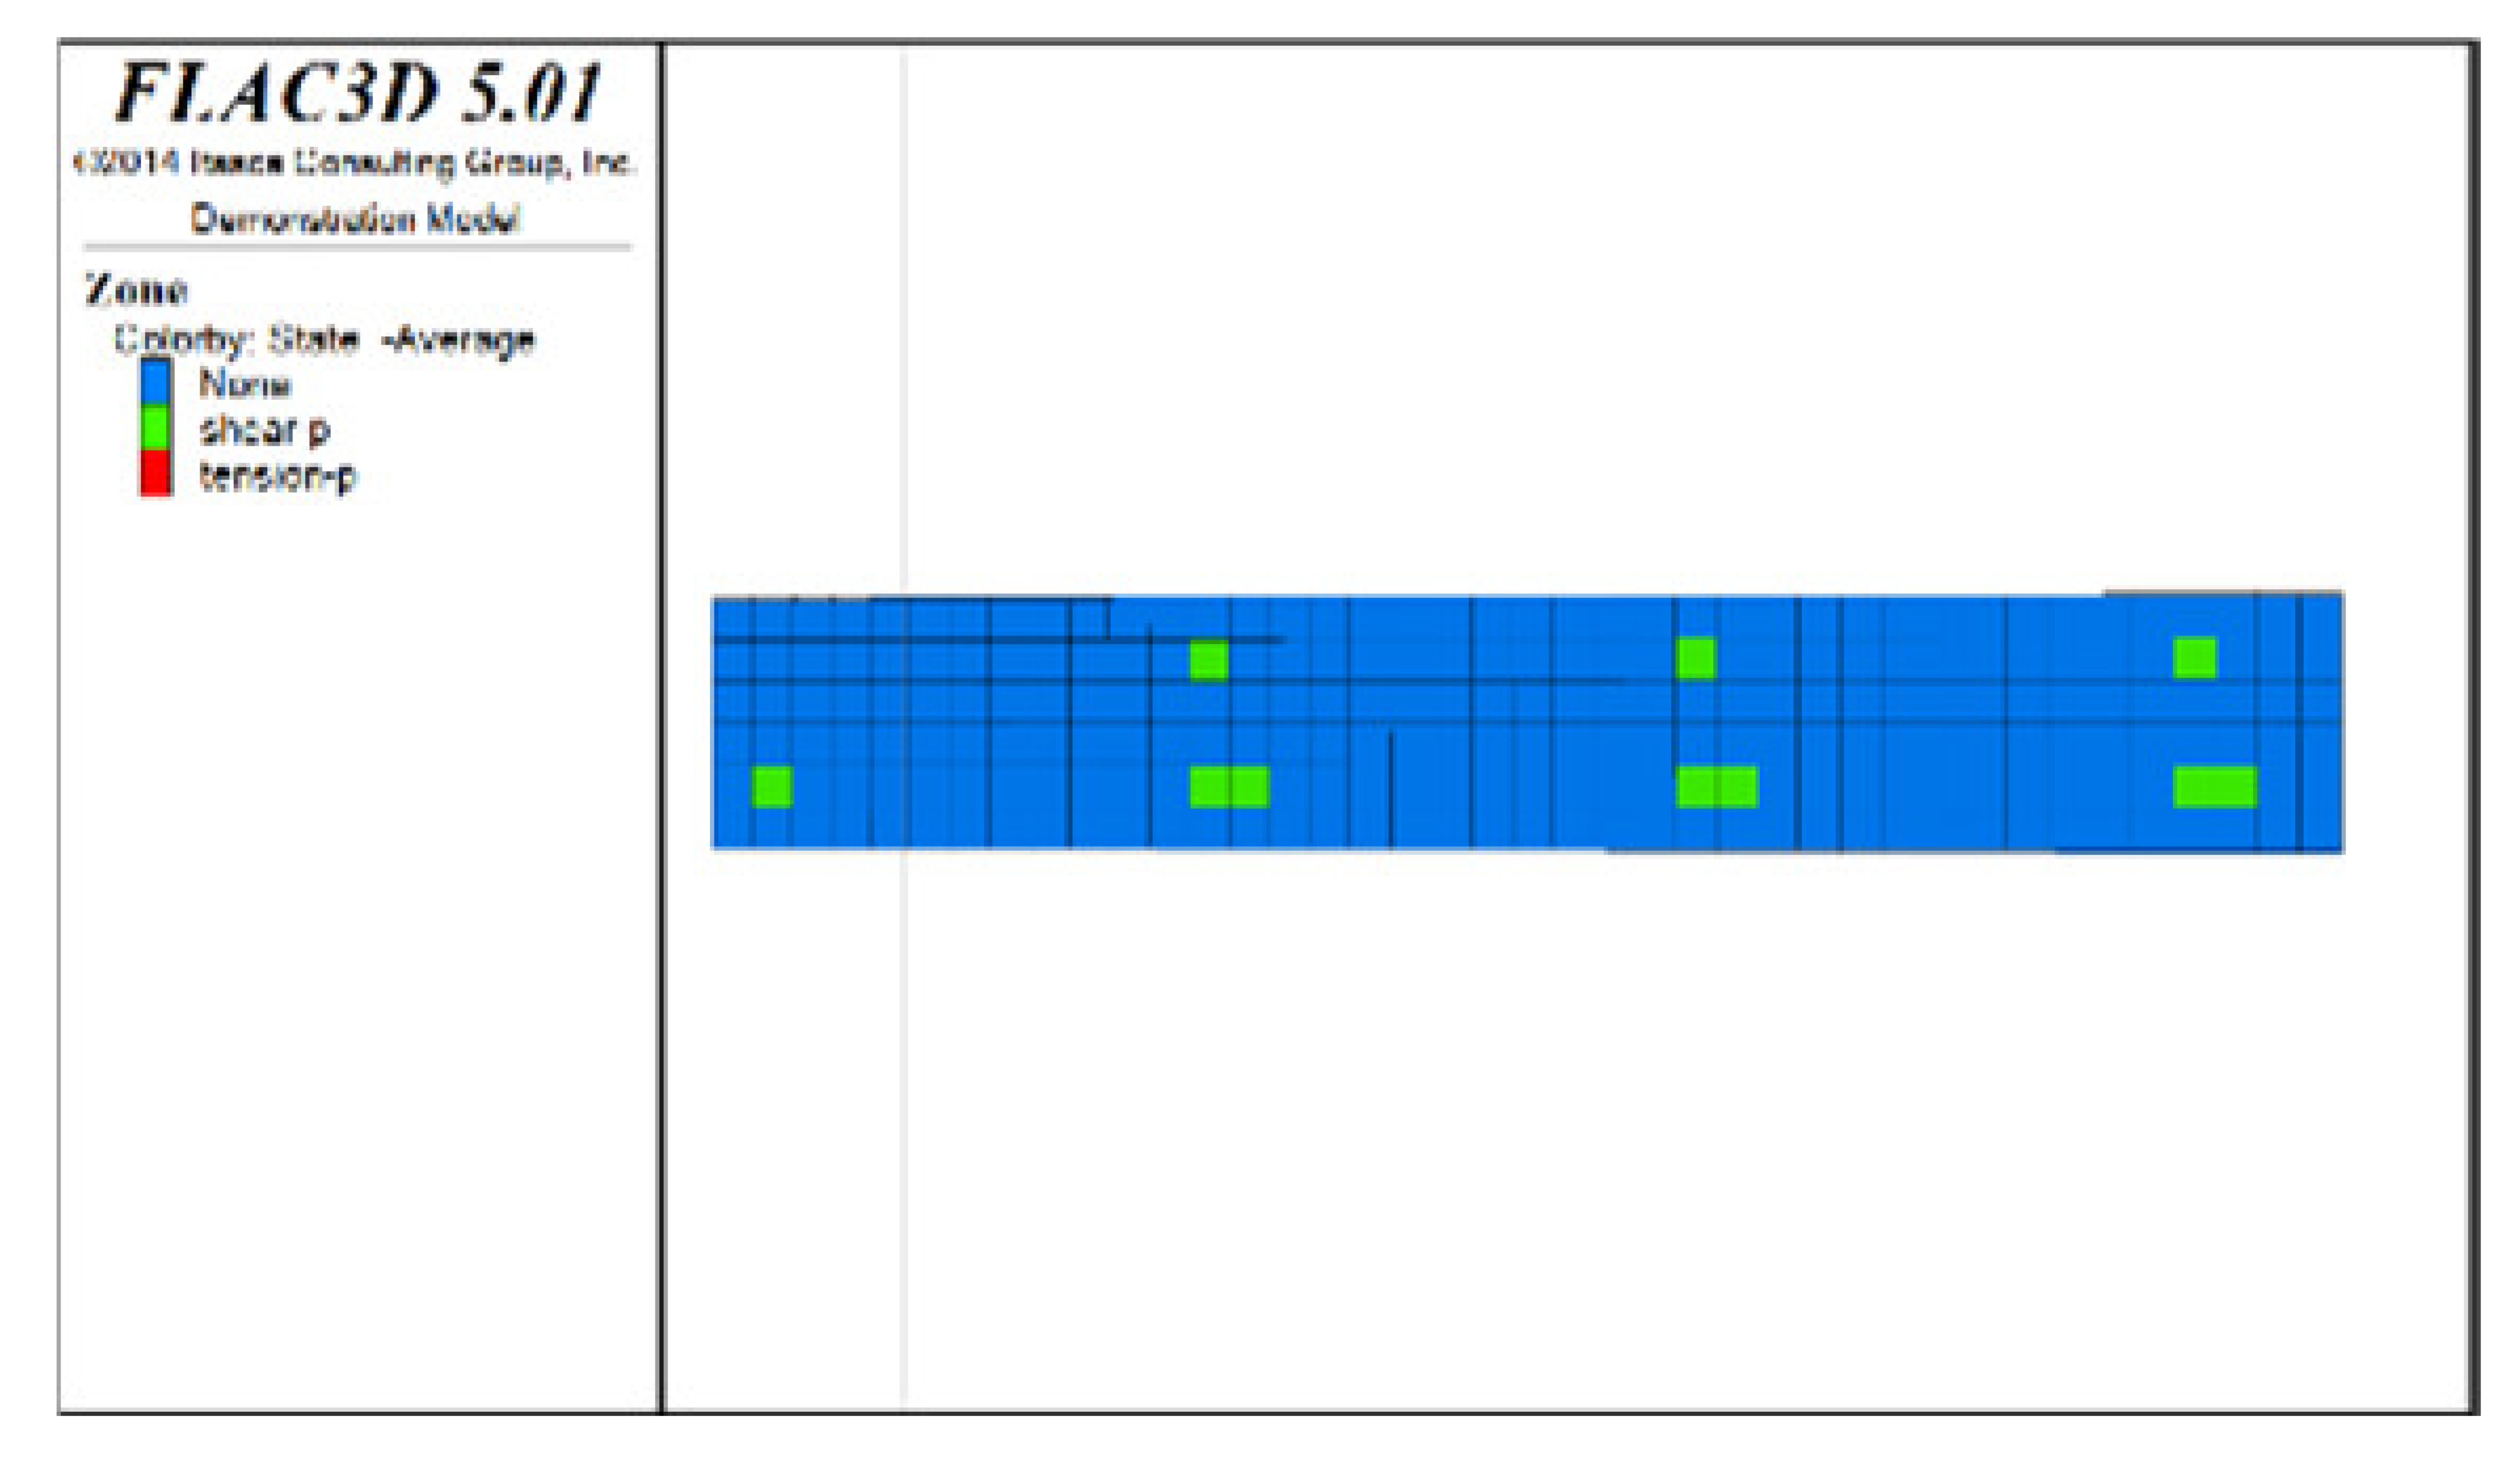 | |
| Scheme A | Scheme B | Scheme C | Scheme D | Scheme E | Scheme F | |
|---|---|---|---|---|---|---|
| Volume of the plastic zones of the roof protection layer (m3) | 615.63 | 456.25 | 146.88 | 71.875 | 18.75 | 12.5 |
| Total volume of pillars (m3) | 750 | 750 | 1500 | 1500 | 2250 | 2250 |
| Percentage of plastic zones (%) | 82 | 60 | 9.8 | 4.8 | 0.8 | 0.5 |
| Scale | Meaning |
|---|---|
| 1 | Indicates that two factors are of equal importance |
| 3 | Indicates that the former factor is slightly more important than the latter |
| 5 | Indicates that the former is significantly more important than the latter |
| 7 | Indicates that the former is strongly more important than the latter |
| 9 | Indicates that the former is more extremely important than the latter |
| 2,4,6 and 8 | Indicate the middle value of the above adjacent judgments |
| Reciprocals | The importance ratio of the latter factor to the former factor is the reciprocal of the importance ratio of the former factor to the latter factor |
| n | 1 | 2 | 3 | 4 | 5 | 6 | 7 | 8 | 9 | 10 | 11 | 12 | 13 | 14 |
|---|---|---|---|---|---|---|---|---|---|---|---|---|---|---|
| RI | 0 | 0 | 0.52 | 0.89 | 1.12 | 1.24 | 1.36 | 1.41 | 1.46 | 1.49 | 1.52 | 1.54 | 1.56 | 1.58 |
| Index Factor | Scheme C | Scheme D | Scheme E | Scheme F |
|---|---|---|---|---|
| Maximum stress mean value in the Z direction of the roof protection layer (MPa) | 4.27 | 4.28 | 4.39 | 4.40 |
| Maximum sedimentation mean value in the Z direction of the roof protection layer (cm) | 1.31 | 1.26 | 1.22 | 1.21 |
| Percentage of plastic failure in the roof protection layer (%) | 9.8 | 4.8 | 0.8 | 0.5 |
| Lost ore tonnage after extraction (%) | 20 | 20 | 30 | 30 |
Publisher’s Note: MDPI stays neutral with regard to jurisdictional claims in published maps and institutional affiliations. |
© 2022 by the authors. Licensee MDPI, Basel, Switzerland. This article is an open access article distributed under the terms and conditions of the Creative Commons Attribution (CC BY) license (https://creativecommons.org/licenses/by/4.0/).
Share and Cite
Feng, F.; Zhang, J.; Yan, Z.; Wu, Y.; Song, Y.; Xie, Z.; Cheng, X. Safe and Efficient Recovery Technique of Horizontal Isolated Pillar under Loose Tailings Backfill; A Case Study in a Zinc-Lead Mine. Minerals 2022, 12, 1066. https://doi.org/10.3390/min12091066
Feng F, Zhang J, Yan Z, Wu Y, Song Y, Xie Z, Cheng X. Safe and Efficient Recovery Technique of Horizontal Isolated Pillar under Loose Tailings Backfill; A Case Study in a Zinc-Lead Mine. Minerals. 2022; 12(9):1066. https://doi.org/10.3390/min12091066
Chicago/Turabian StyleFeng, Fan, Jiqing Zhang, Zhikai Yan, Yedan Wu, Yamin Song, Zhiwei Xie, and Xiang Cheng. 2022. "Safe and Efficient Recovery Technique of Horizontal Isolated Pillar under Loose Tailings Backfill; A Case Study in a Zinc-Lead Mine" Minerals 12, no. 9: 1066. https://doi.org/10.3390/min12091066
APA StyleFeng, F., Zhang, J., Yan, Z., Wu, Y., Song, Y., Xie, Z., & Cheng, X. (2022). Safe and Efficient Recovery Technique of Horizontal Isolated Pillar under Loose Tailings Backfill; A Case Study in a Zinc-Lead Mine. Minerals, 12(9), 1066. https://doi.org/10.3390/min12091066