Article

The Heavy Mineral Map of Australia: Vision and Pilot Project

by
Patrice de Caritat
1,*,
Brent I. A. McInnes
2,
Alexander T. Walker
2,
Evgeniy Bastrakov
1,
Stephen M. Rowins
2 and
Alexander M. Prent
2
1
Geoscience Australia, GPO Box 378, Canberra, ACT 2601, Australia
2
John de Laeter Centre, Curtin University, Bentley, WA 6102, Australia
*
Author to whom correspondence should be addressed.
Minerals 2022, 12(8), 961; https://doi.org/10.3390/min12080961
Submission received: 17 June 2022 / Revised: 23 July 2022 / Accepted: 27 July 2022 / Published: 28 July 2022
(This article belongs to the Special Issue Feature Papers in Mineral Exploration Methods and Applications 2022)

Abstract

:
We describe a vision for a national-scale heavy mineral (HM) map generated through automated mineralogical identification and quantification of HMs contained in floodplain sediments from large catchments covering most of Australia. The composition of the sediments reflects the dominant rock types in each catchment, with the generally resistant HMs largely preserving the mineralogical fingerprint of their host protoliths through the weathering-transport-deposition cycle. Heavy mineral presence/absence, absolute and relative abundance, and co-occurrence are metrics useful to map, discover and interpret catchment lithotype(s), geodynamic setting, magmatism, metamorphic grade, alteration and/or mineralization. Underpinning this vision is a pilot project, focusing on a subset from the national sediment sample archive, which is used to demonstrate the feasibility of the larger, national-scale project. We preview a bespoke, cloud-based mineral network analysis (MNA) tool to visualize, explore and discover relationships between HMs as well as between them and geological settings or mineral deposits. We envisage that the Heavy Mineral Map of Australia and MNA tool will contribute significantly to mineral prospectivity analysis and modeling, particularly for technology critical elements and their host minerals, which are central to the global economy transitioning to a more sustainable, lower carbon energy model.

1. Introduction

Heavy minerals (HMs), i.e., those with a specific gravity greater than 2.9 g/cm3 (e.g., zircon, rutile, phosphates, spinels, and oxides; see Table S1 in Supplementary Materials), generally occur in low abundance in primary igneous and metamorphic rocks [1]. Due to their relative resistance to physical and chemical weathering, many HMs can persist in the sedimentary rock record, where they can be used to determine sediment provenance [2]. Similarly, HMs that occur in unconsolidated sediments collected from modern catchments (watersheds) may be the only proxies available for determining subsurface geology where regolith cover is widespread. The presence or absence of particular HMs, their concentrations and distributions, or the relative makeup of the HM assemblages, can be indicative of geological processes including volcanism, metamorphism, alteration, weathering, and mineralization [1]. For example, co-occurring augite, chrome-spinel, and olivine may indicate a mafic igneous origin; co-occurring garnet, staurolite, and kyanite may indicate a metamorphic source; and presence of gahnite may indicate high-grade metamorphism of zinc mineralization [3]. Thus, particular HMs can be termed indicator minerals. Moreover, HMs are common hosts for technology critical elements, e.g., pegmatite and carbonatite minerals hosting rare earth elements (REEs) [4]. Chemical elements hosted in these particular HMs, termed technology critical minerals, are essential for a cleaner (lower emissions) energy future, as they are used in, e.g., photovoltaic panels, batteries and wind turbines [5,6,7]. Heavy minerals that incorporate elements with stable and radiogenic isotopes into their crystal lattices can be analyzed using in-situ geochemistry/geochronology techniques to interpret the temporal and petrogenetic evolution of the continental crust in the source region.
Heavy minerals are widely used by the minerals and petroleum industries in upstream exploration. In the petroleum industry, HM suites are used to correlate continental stratigraphic successions where there may be a lack of bio-stratigraphic control [8]. Heavy minerals are also used widely in mineral exploration targeting due to their ability to indicate the original formation environments and changes in rock chemistry induced by mantle metasomatism, magmatic crystallization, hydrothermal alteration or mineralization. Published studies of successful mineral exploration-oriented applications of indicator mineral techniques have applied to gold (Au), diamonds, mineral sands, nickel-copper, platinum group elements, volcanogenic massive sulfides, non-sulfide zinc, porphyry copper-molybdenum, uranium, tin-tungsten, and REE mineralization [9,10,11,12,13,14,15,16,17,18]. A recent summary of successes using indicator minerals with soil (till) geochemistry in the Canadian Cordillera is given by Mao et al. (2017) [18] and references therein.
In addition to relative and absolute abundances of indicator minerals in the HM fraction, the trace element chemistry of particular indicator minerals can be useful for discriminating between barren and mineralized rocks, and vectoring towards mineralization using rapid analytical methods such as in-situ electron, proton and laser microprobe techniques. For example, arsenic (As) in pyrite is a proxy for Au in many deposits [19], and REE patterns in apatite can record the hydrothermal evolution of iron-oxide copper gold deposits [20]. Sophisticated statistical methods have been applied to suites of trace elements in indicator minerals data to distinguish fertile (mineralized) from barren (unmineralized) formation environments (e.g., [21,22,23,24,25,26]. Furthermore, in-situ age dating of HMs containing radiogenic isotopes using, e.g., sensitive high-resolution ion microprobe (SHRIMP) or laser ablation-inductively coupled plasma-mass spectrometry (LA-ICP-MS) can lead to establishing precise geochronological and petrogenetic frameworks in detailed investigations, e.g., dating of detrital cassiterite formation relative to adjacent granite (see McInnes (2019) [27]).
The provision of occurrence maps and chemistry data for HMs from sediment catchments and mineral districts in Canada is viewed by industry as a valuable pre-competitive geoscience dataset, and indicator minerals have contributed to the discovery of new mineral deposits [28,29,30]. The exploration industry in Australia carries out proprietary HM surveys at both tenement and regional scales, with a focus on specific commodities (e.g., DeBeers collected 830,000 HM samples across Australia during a 1990s diamond exploration campaign), however, there has been limited release of HM datasets by publicly funded research agencies or universities [31].
No country, let alone continent, is, to our knowledge, covered by regional-scale (over tens of thousands to millions of square km) HM maps and datasets that can enhance geoscience insight and guide mineral exploration. For instance HM (and other mineralogy) datasets can be used in the creation of mineral prospectivity models in addition to the traditional geochemistry, geophysics, and geology datasets (e.g., [32]. The present communication articulates a vision for a HM map (or atlas of maps) of Australia and explores the feasibility of providing such maps and underpinning datasets as pre-competitive assets for promoting new exploration investment in Australia. It does this by quantifying the modal abundances of HMs in a limited number of samples obtained from the National Geochemical Survey of Australia (NGSA; www.ga.gov.au/ngsa, accessed on 28 July 2022 ; Caritat & Cooper [33]), a unique archive of catchment sediments collected on a continental scale (Figure 1). Thus the opportunity identified here, as exploration in areas under cover intensifies, is to analyze the HMs from the sedimentary cover as a novel ‘window’ to bedrock geology and events/processes such as metamorphism, magmatism, alteration and mineralization.
This paper aims to test the following:
  • Are the NGSA samples appropriate for HM identification and quantification using automated mineralogy technologies?
  • Can the bulk samples be used, or must the HM fraction be physically separated first?
  • Is there sufficient mineralogical diversity in the HM assemblages of a few random samples to predict varied and informative HM patterns at the national scale?
  • Importantly, are those preliminary observations on HM extracted from alluvial sediments broadly compatible with the geology of their respective catchment areas?

2. Materials and Methods

The selection, preparation and analysis of NGSA samples for the present study are detailed in the Supplementary Materials. Briefly, 10 NGSA top outlet sediment (TOS) samples (i.e., floodplain sediments collected near the outlet of large catchments from a depth of 0 to 10 cm) were selected across the country from a range of geological regions (west to east, see Figure 1): the Pinjarra (sample ID last four digits 1353), Yilgarn (0602), Birrindudu (1052), Arafura (1337), Adelaide (0115), Murray (0090), Carpentaria (1046), Paleozoic-Qld (0453), and Paleozoic-SE (1067 and 0755) geological regions. The samples were dried sieved to the fraction 75–430 µm, and either mounted ‘as is’ (whole rock or ‘WR’ samples) or after heavy mineral separation by the dense fluid lithium hetero-polytungstate (heavy mineral concentrates or ‘H’ samples) on resin mounts. Note that a few non-heavy or ‘light’ minerals, such as quartz and feldspars, can end up on the mounts due to commonly imperfect process efficiency during the HM concentration workflow. These mounts were then polished, carbon coated, and subjected to automated mineralogy identification and quantification using a TESCAN® (Kohoutovice, Czech Republic) Integrated Mineral Analyzer (TIMA) scanning electron microscope-energy dispersive spectrometer (SEM-EDS) at the John de Laeter Centre (JdLC) at Curtin University [35,36]. Please refer to the Supplementary Materials for further information on methodology.

3. Results and Discussion

3.1. Pilot Project

The pilot project on 10 NGSA samples across the country delivered both whole rock (prefix WR) and HM concentrate (prefix H) data for over 40 different minerals (Figure 2 and Tables S2 and S3 in Supplementary Materials). The WR samples are dominated by quartz (54 to 97 vol%) and matrix silicates (feldspars, clay minerals), rendering them unsuitable to precise and sensitive HM quantification, given the scope of the present study. The HM concentrates, conversely, are generally dominated by dense minerals, including ilmenite (median concentration across all 10 samples = 25.3 vol%), rutile (14.2), zircon (12.7), schorl-dravite (Fe-Mg Na-tourmaline; 1.59), hematite/magnetite (1.18), uvite-feruvite (Mg-Fe Ca-tourmaline; 0.70), pumpellyite (0.70), pseudorutile/leucoxene (0.61), monazite (0.53), followed by minor (<0.5 vol%) lourenswalsite, almandine, punkaruaivite, xenotime, pseudobrookite, etc., and traces (<0.1 vol%) of various other HMs, including staurolite and chromite. Thus, we recommend that HMs be separated and concentrated prior to meaningful and useful identification and quantification. The HMs identified in this pilot project indicate that a diversity of HMs are present, and a variety of HM associations are observed across the continent. (Note that two or three large pyrite grains were added to each mount as navigational markers or reference points for future re-analysis of the mounts and thus the pyrite data cannot be used here.) A national HM map (or, more appropriately, atlas of maps), once generated and made available through a data portal and analyzed with a geographic information systems and/or through mineral network analysis, could reveal a rich, diverse and informative HM ecosystem. Already, the analyzed samples’ HMs show a range of spatial distributions across the continent (Figure 3). Selected individual HM maps are shown in the Supplementary Materials.
The ten pilot NGSA locations display a wide range of minerals indicative of diverse geological environments (www.mindat.org, accessed on 28 July 2022 ), as exemplified by a few observations:
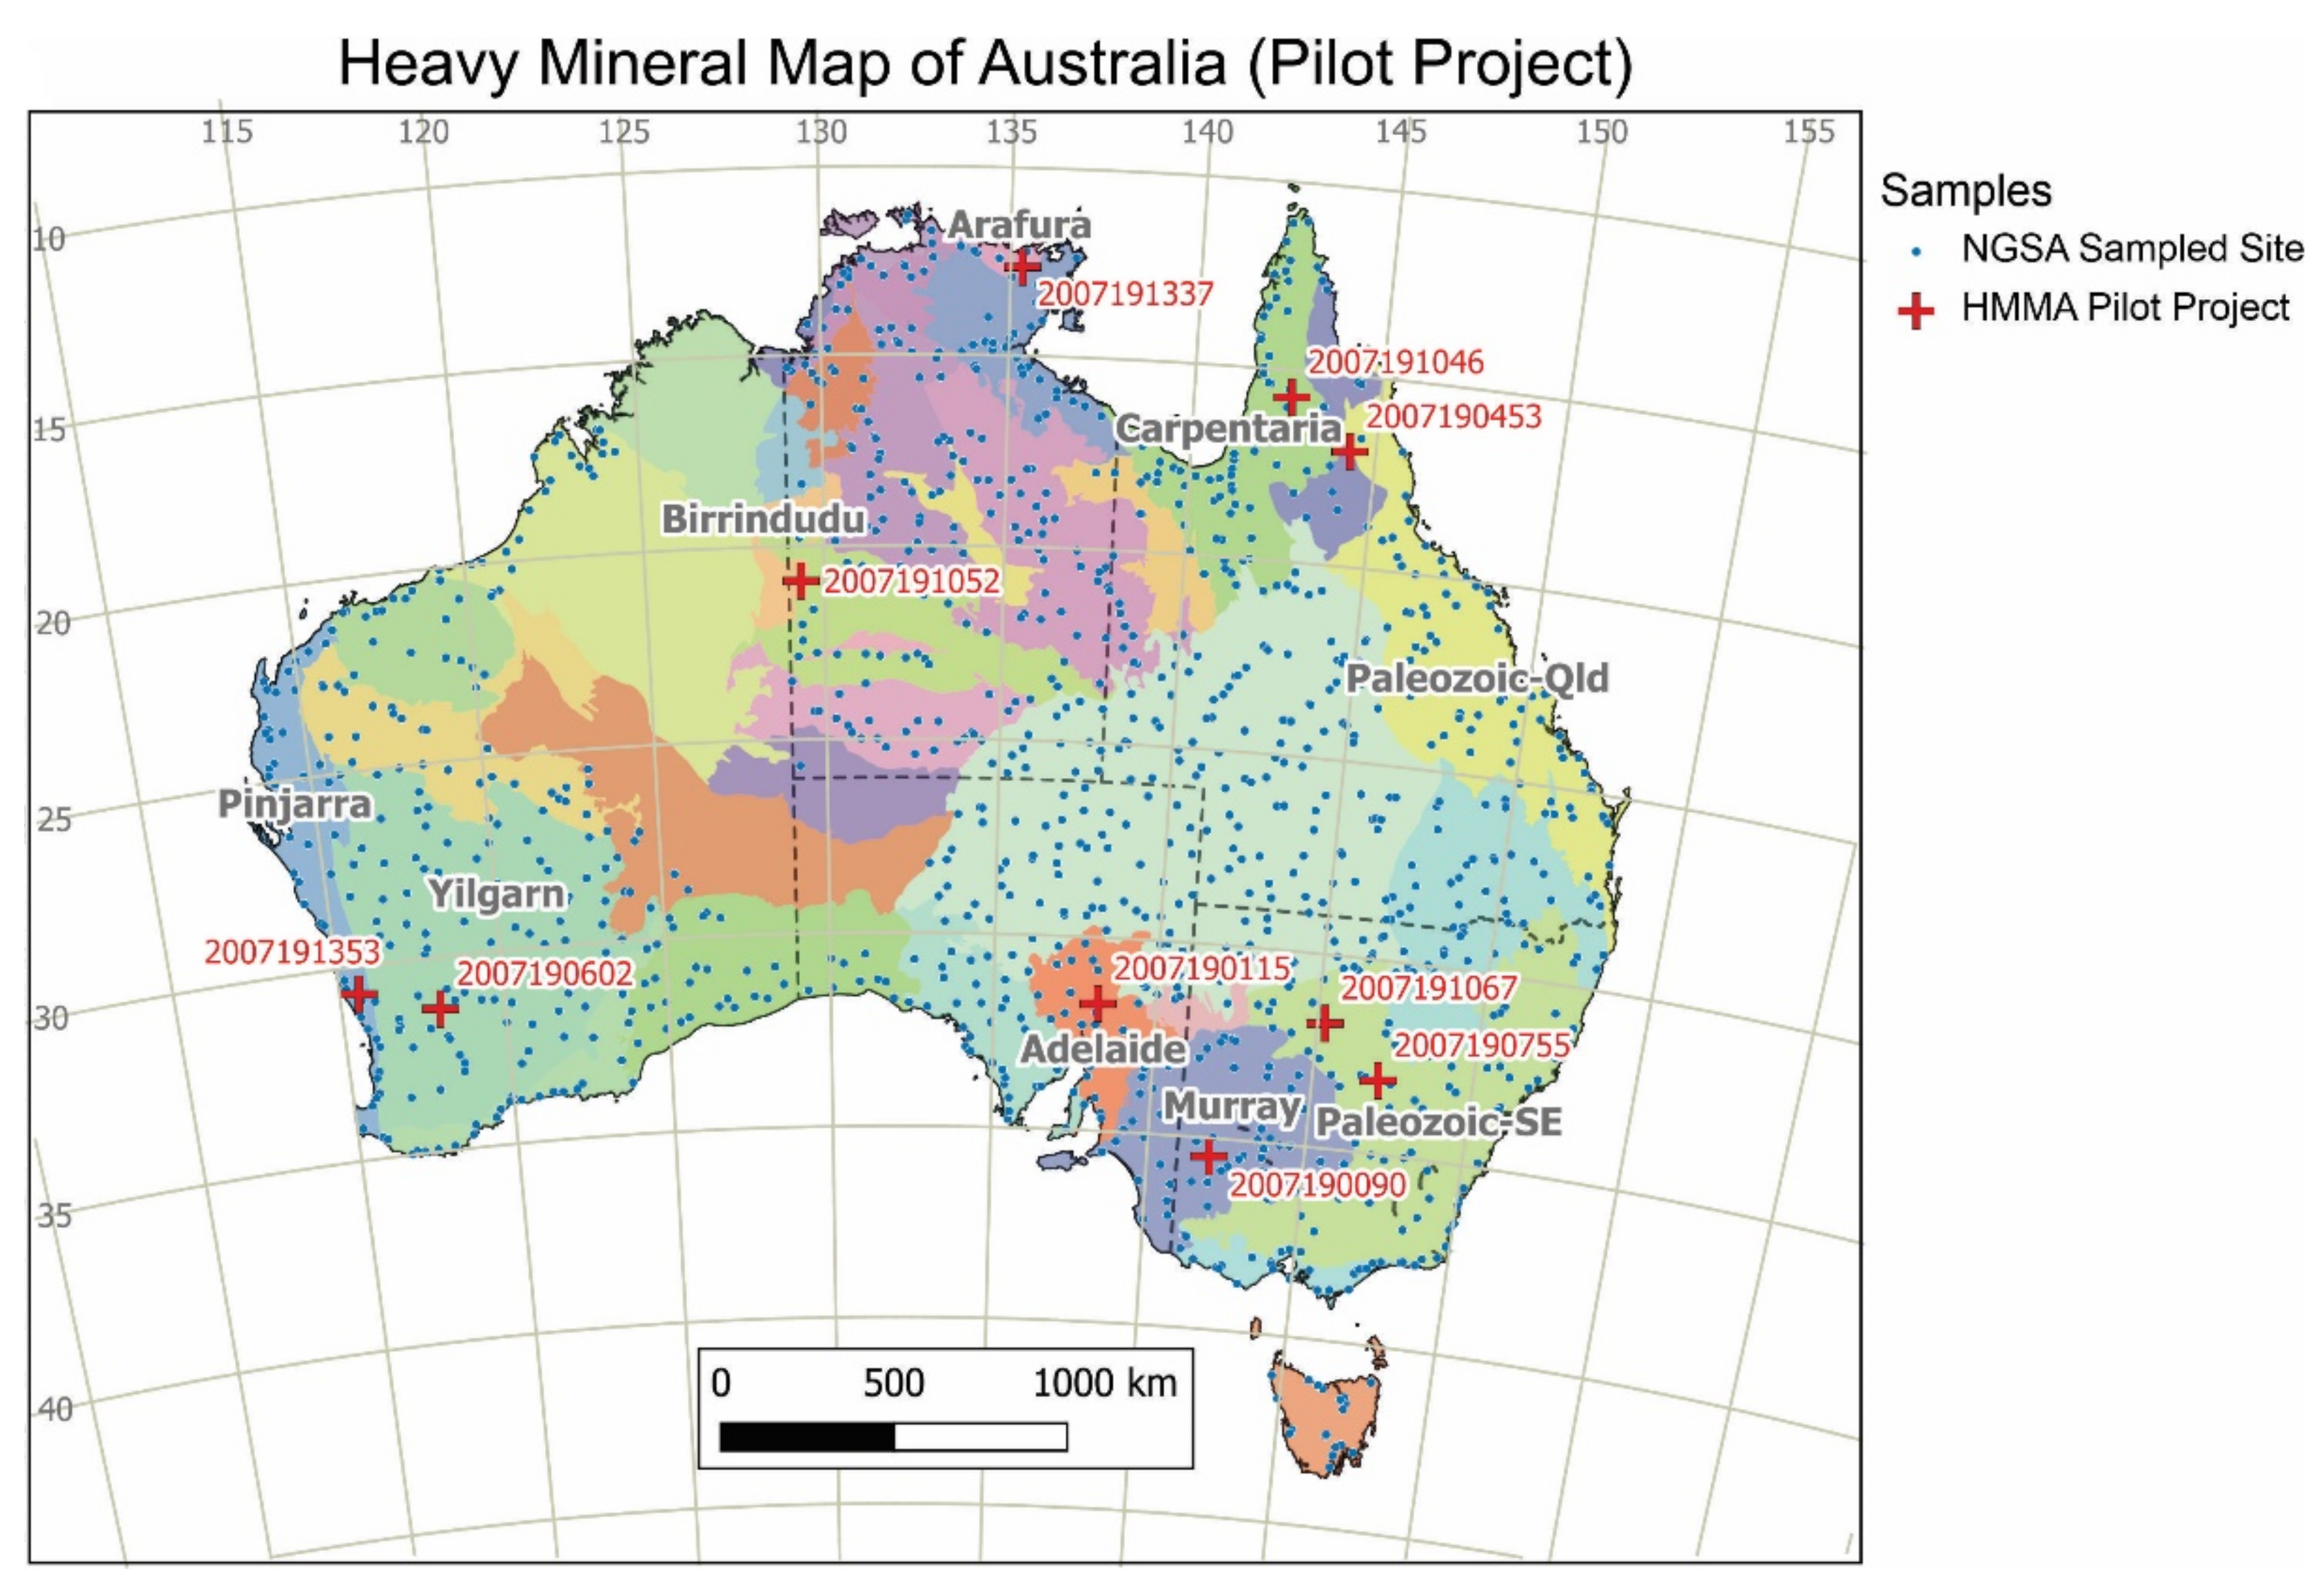
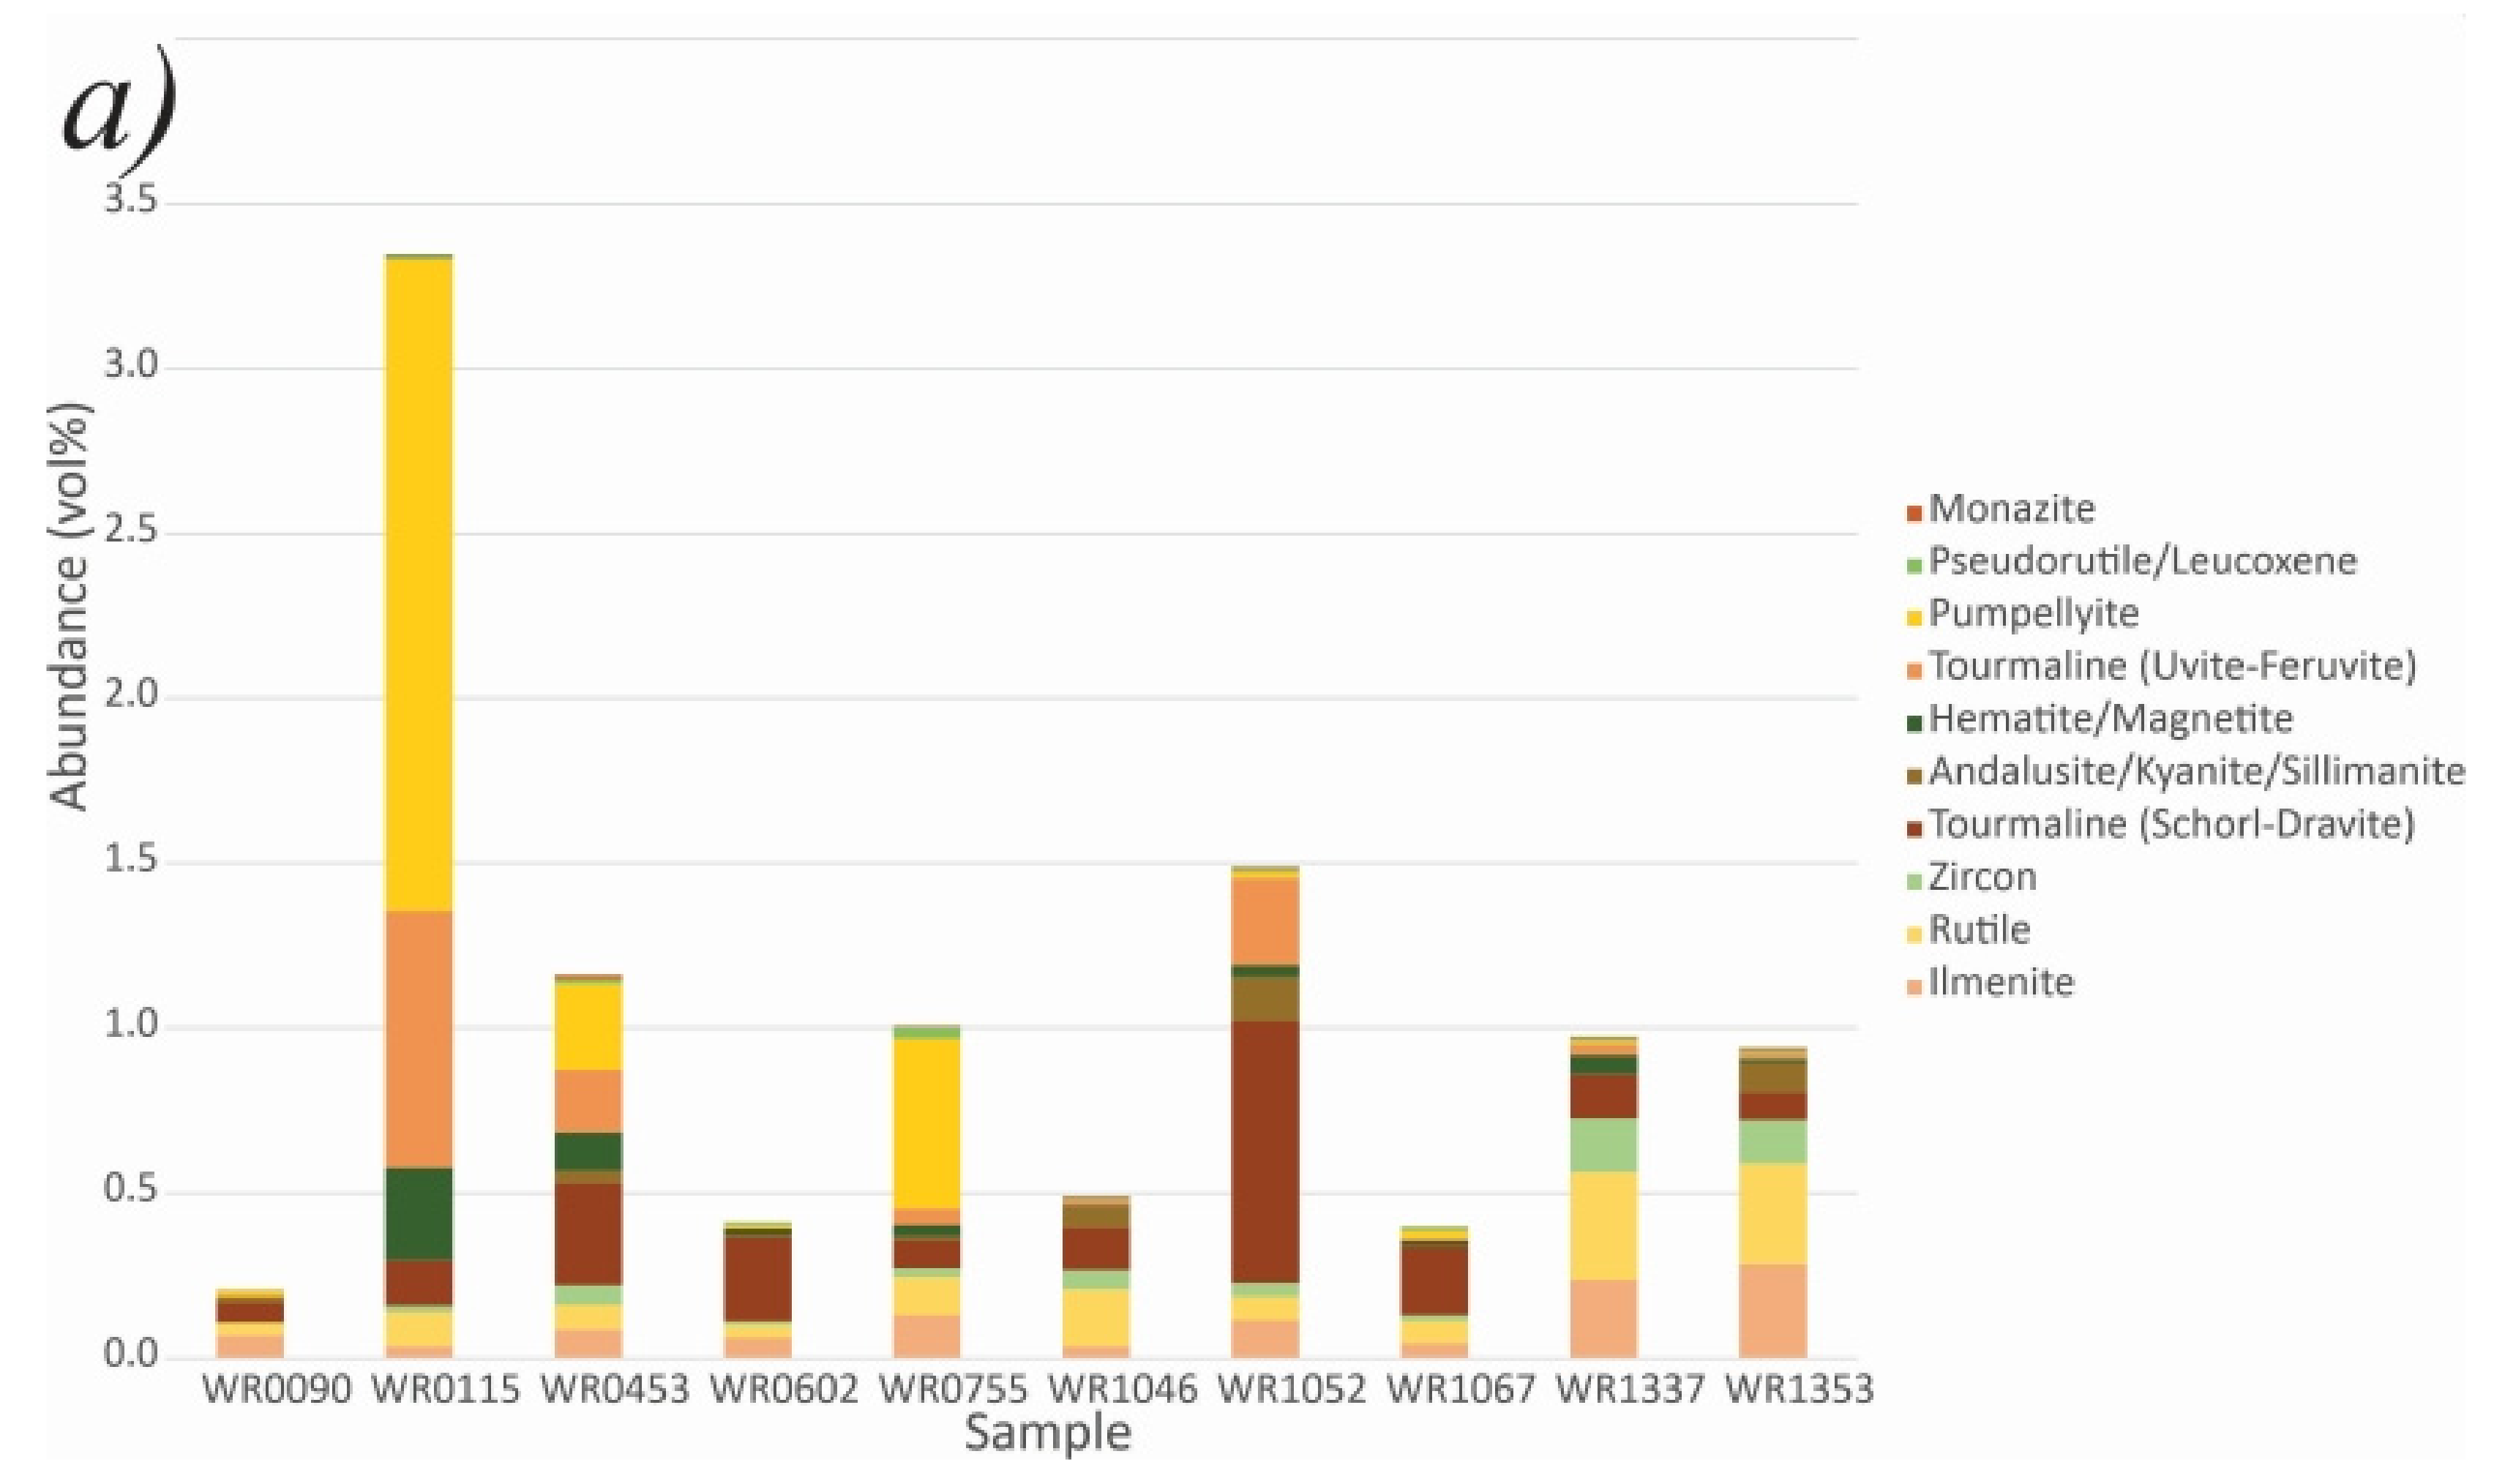
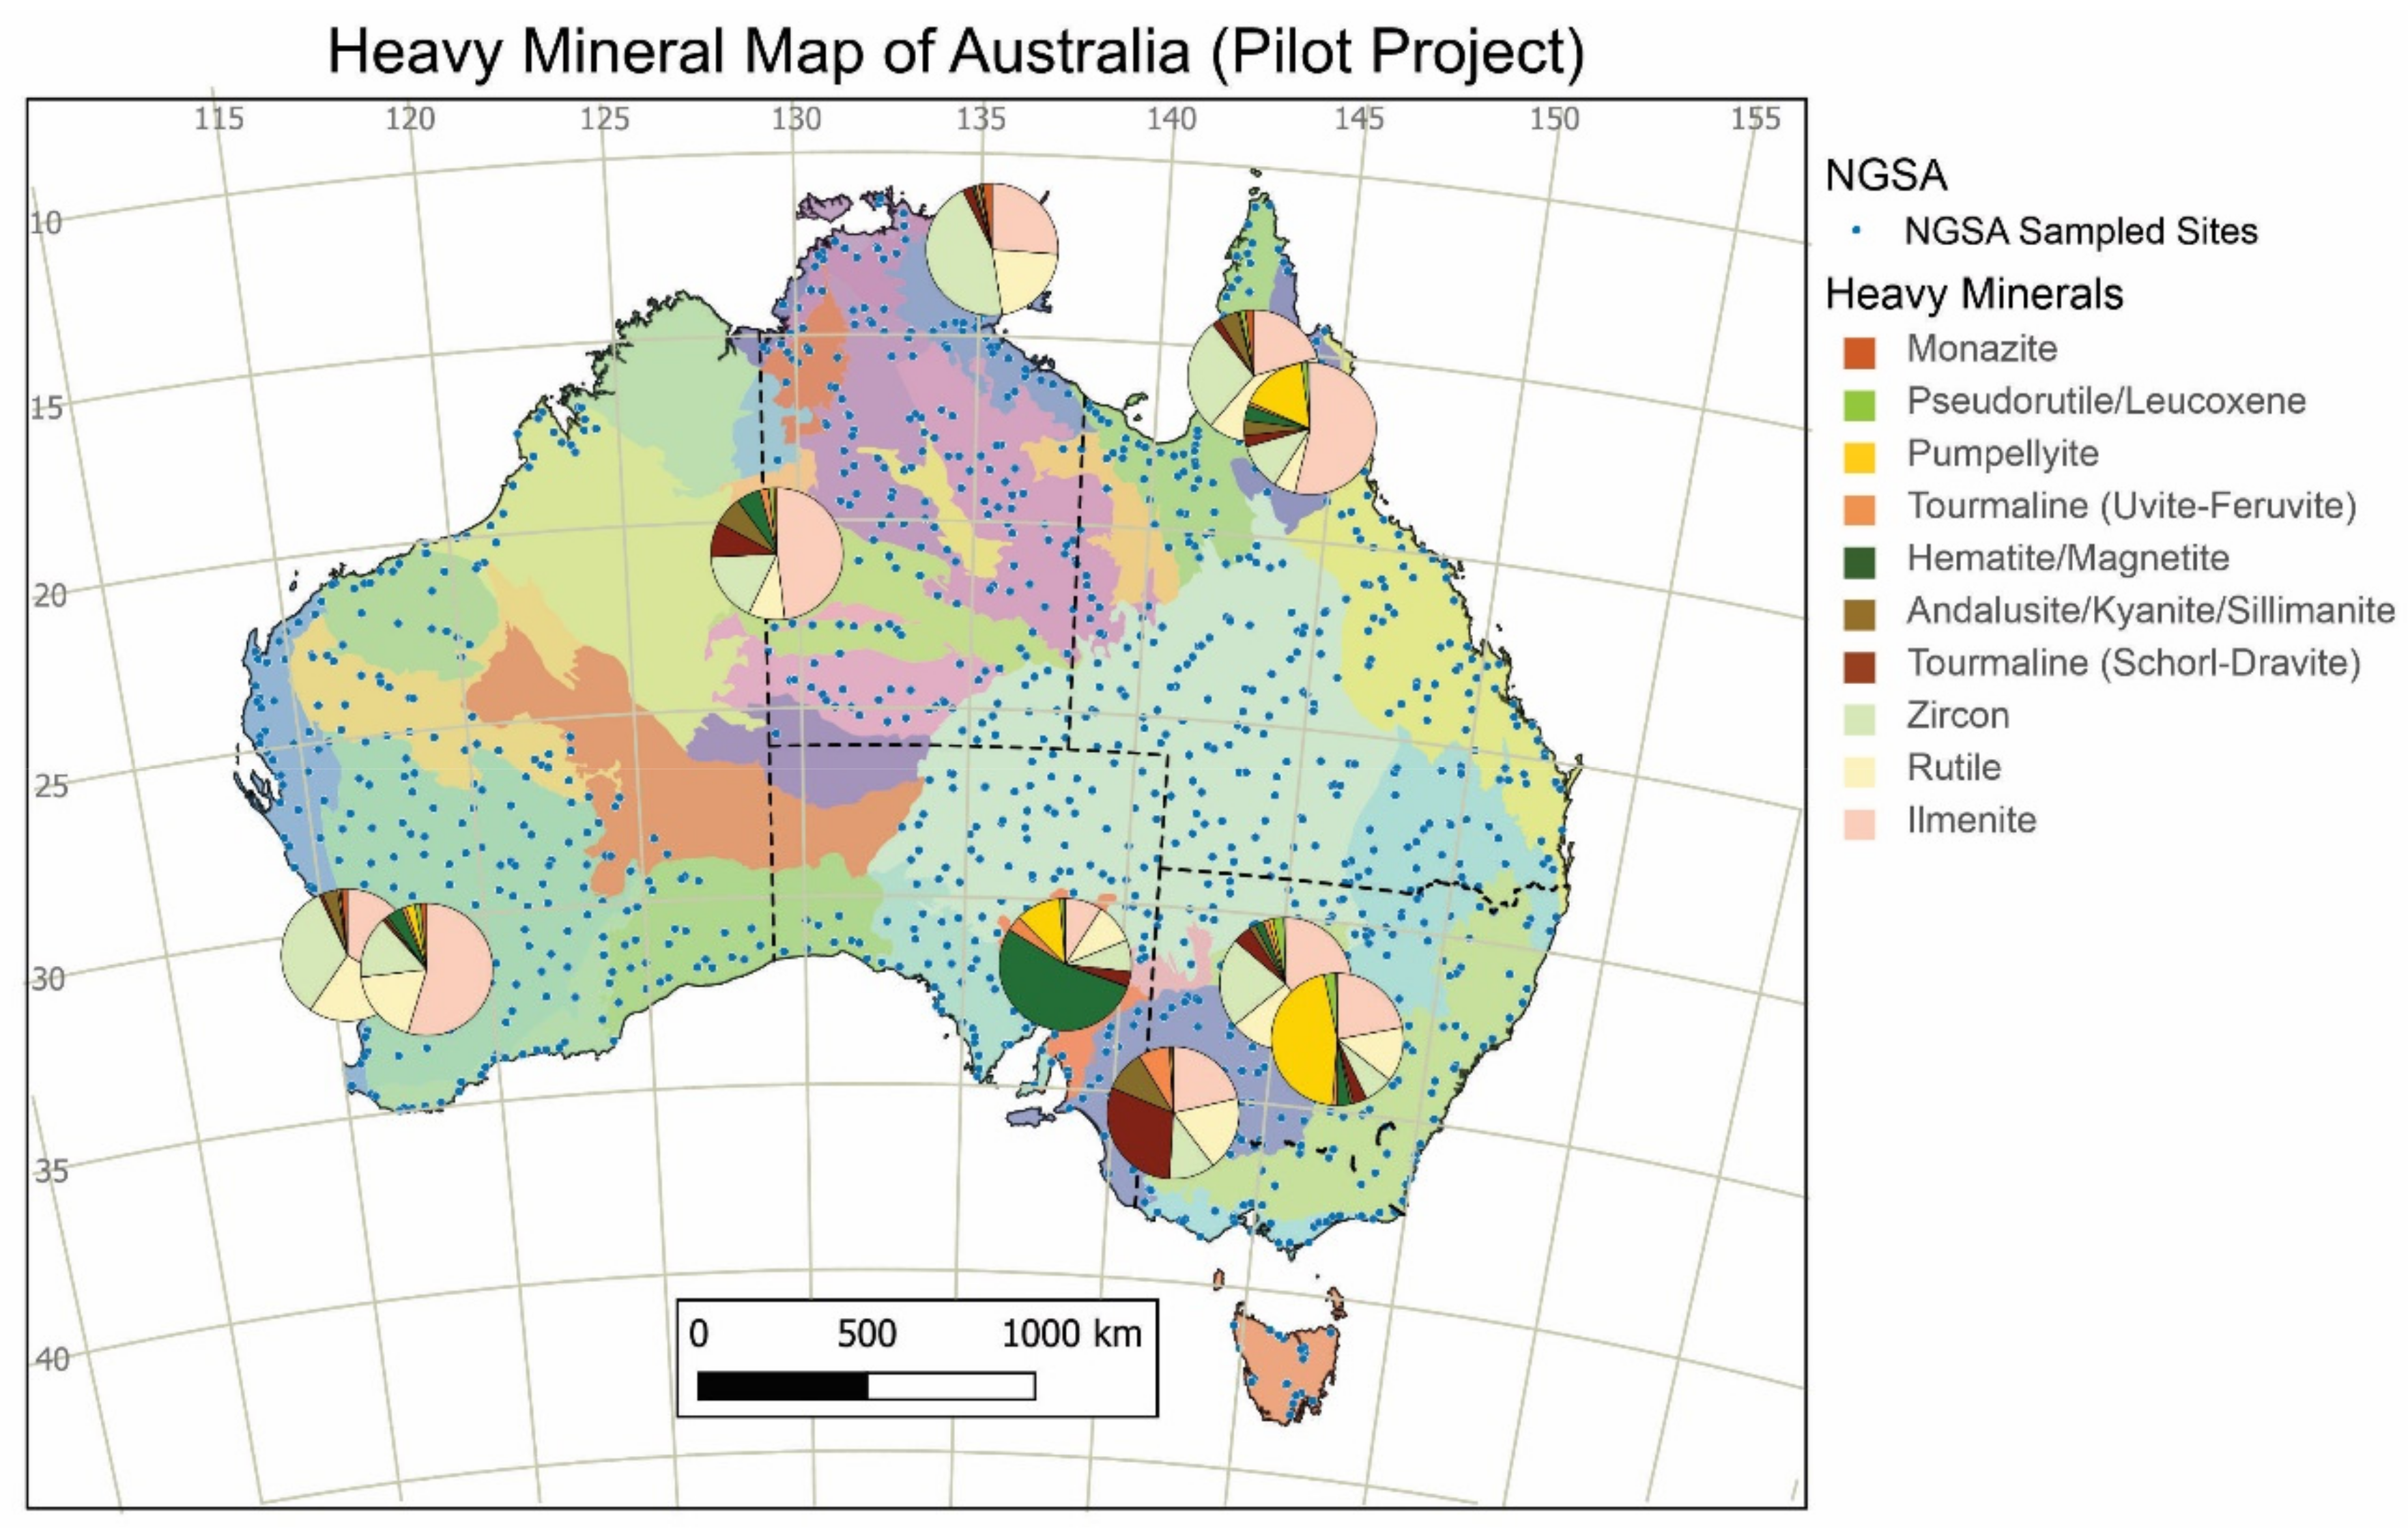
  • H0090 (Murray geological region; see Figure 1) has the highest spinel concentration (0.46 vol%), an accessory mineral found in basalt, peridotite, kimberlite and marble;
  • H0115 (Adelaide) is highest in harkerite (0.22), chlorite (0.28) and hematite/magnetite (10.5), minerals suggesting high-temperature contact metamorphism, low-grade metamorphic rocks, or iron-rich sedimentary or igneous rocks, respectively (thus representing a mixed terrane signature);
  • H0453 (Paleozoic-Qld) is highest in cassiterite (0.16), indicative of medium- to high-temperature magmatic-hydrothermal veins or alluvial placers;
  • H0602 (Yilgarn) and H1052 (Birrindudu) are second highest and highest samples in ilmenite (36.7 and 42.6, respectively), suggestive of igneous rocks or placer deposits;
  • H1046 (Carpentaria) and H1337 (Arafura) are second highest and highest samples in monazite (1.90 and 2.16, respectively), a mineral typically associated with REEs enrichment; and
  • H1337 is highest in zircon (42.2) whilst H1353 (Pinjarra) is second highest in zircon (31.8), a mineral suggesting an igneous or metamorphic rock affinity.
Approximately three quarters of the 40+ HMs identified in this study are found in all 10 samples and can therefore be characterized as most ‘common’ (borrowing terminology from the field of ecology, e.g., [37]). These include the three most abundant minerals ilmenite, rutile and zircon (with the highest recorded median concentrations of 25.3, 14.2 and 12.7 vol%, respectively), but also the much less abundant minerals apatite, pyrope, ferritschermakite and huttonite (with the lowest recorded median concentrations of 0.0052, 0.0037, 0.0022 and 0.0021 vol%, respectively). Conversely, the HMs found in the fewest samples and therefore characterized as the most ‘rare’ (see [37]) are cassiterite, present only in three of the 10 samples (H0453, H0602, H1046), followed by harkerite, found in five samples, making these potentially important indicator minerals of the pilot project (with the caveat that this is a very small dataset at the pilot stage of the project).
Ilmenite is the most ‘dominant’ HM (most abundant of all the recorded HMs; see [37]) in five of the 10 samples (H453, H602, H1052, H1067, H1353); schorl-dravite is the ‘dominant’ HM in H0090; hematite/magnetite in H0115; pumpellyite in H0755; rutile in H1046; and zircon in H1337. These observations augur well for a highly diverse and complex mineralogical ‘ecosystem’ in the Australian regolith, the study of which aims to understand patterns of mineral occurrence and coexistence in the context of their environments [38].
The abundance of HM zircon (vol%) was compared to the concentration of chemical element zirconium (Zr, mg/kg) in the ‘coarse’ fraction (<2 mm) of the same NGSA samples, as determined by ICP-MS following fusion and nitric + hydrofluoric acid digestion [33]. There is a positive correlation between the two variables, both for WR and HM fraction zircon (Figure 4). Such correlations suggest an integrated mineralogical and geochemical approach to data interpretation may afford new knowledge insights hitherto unavailable due to the datasets not being considered in combination. Although the pilot project data are sparse, these preliminary observations suggest that information pertinent to bedrock can be derived from HM samples distributed across continental Australia. Additional knowledge of sediment transport directions and distances (within and beyond the large NGSA catchments) and local geological features will aid in further understanding HM abundances and distributions.
Cassiterite (SnO2) was recorded in sample H0453. This sample is from northern Queensland in the vicinity of the well-known Herberton/Mount Garnet tin mineralized districts [39]. The sample was obtained from a catchment that contains numerous tin mineral occurrences related to Carboniferous igneous rocks [40]. Looking at the geochemistry from the NGSA, this site has the highest total Sn concentration of the ten pilot samples (33.2 mg/kg total Sn vs 3.0 mg/kg or less for the other pilot sites), further supporting the correlation and consistency between mineral and geochemical datasets. In this case the simple presence/absence of a HM is of interest, rather than its abundance, namely that the presence of cassiterite indicates proximity to tin-granite mineralization. The local topography suggests erosion and transport of mineralized rocks located up-catchment, i.e., to the southeast of the sample location. As noted earlier, cassiterite is a HM amenable to in-situ U-Pb dating and follow-up geochronology can be used to test hypotheses around cassiterite temporal evolution and provenance [27].

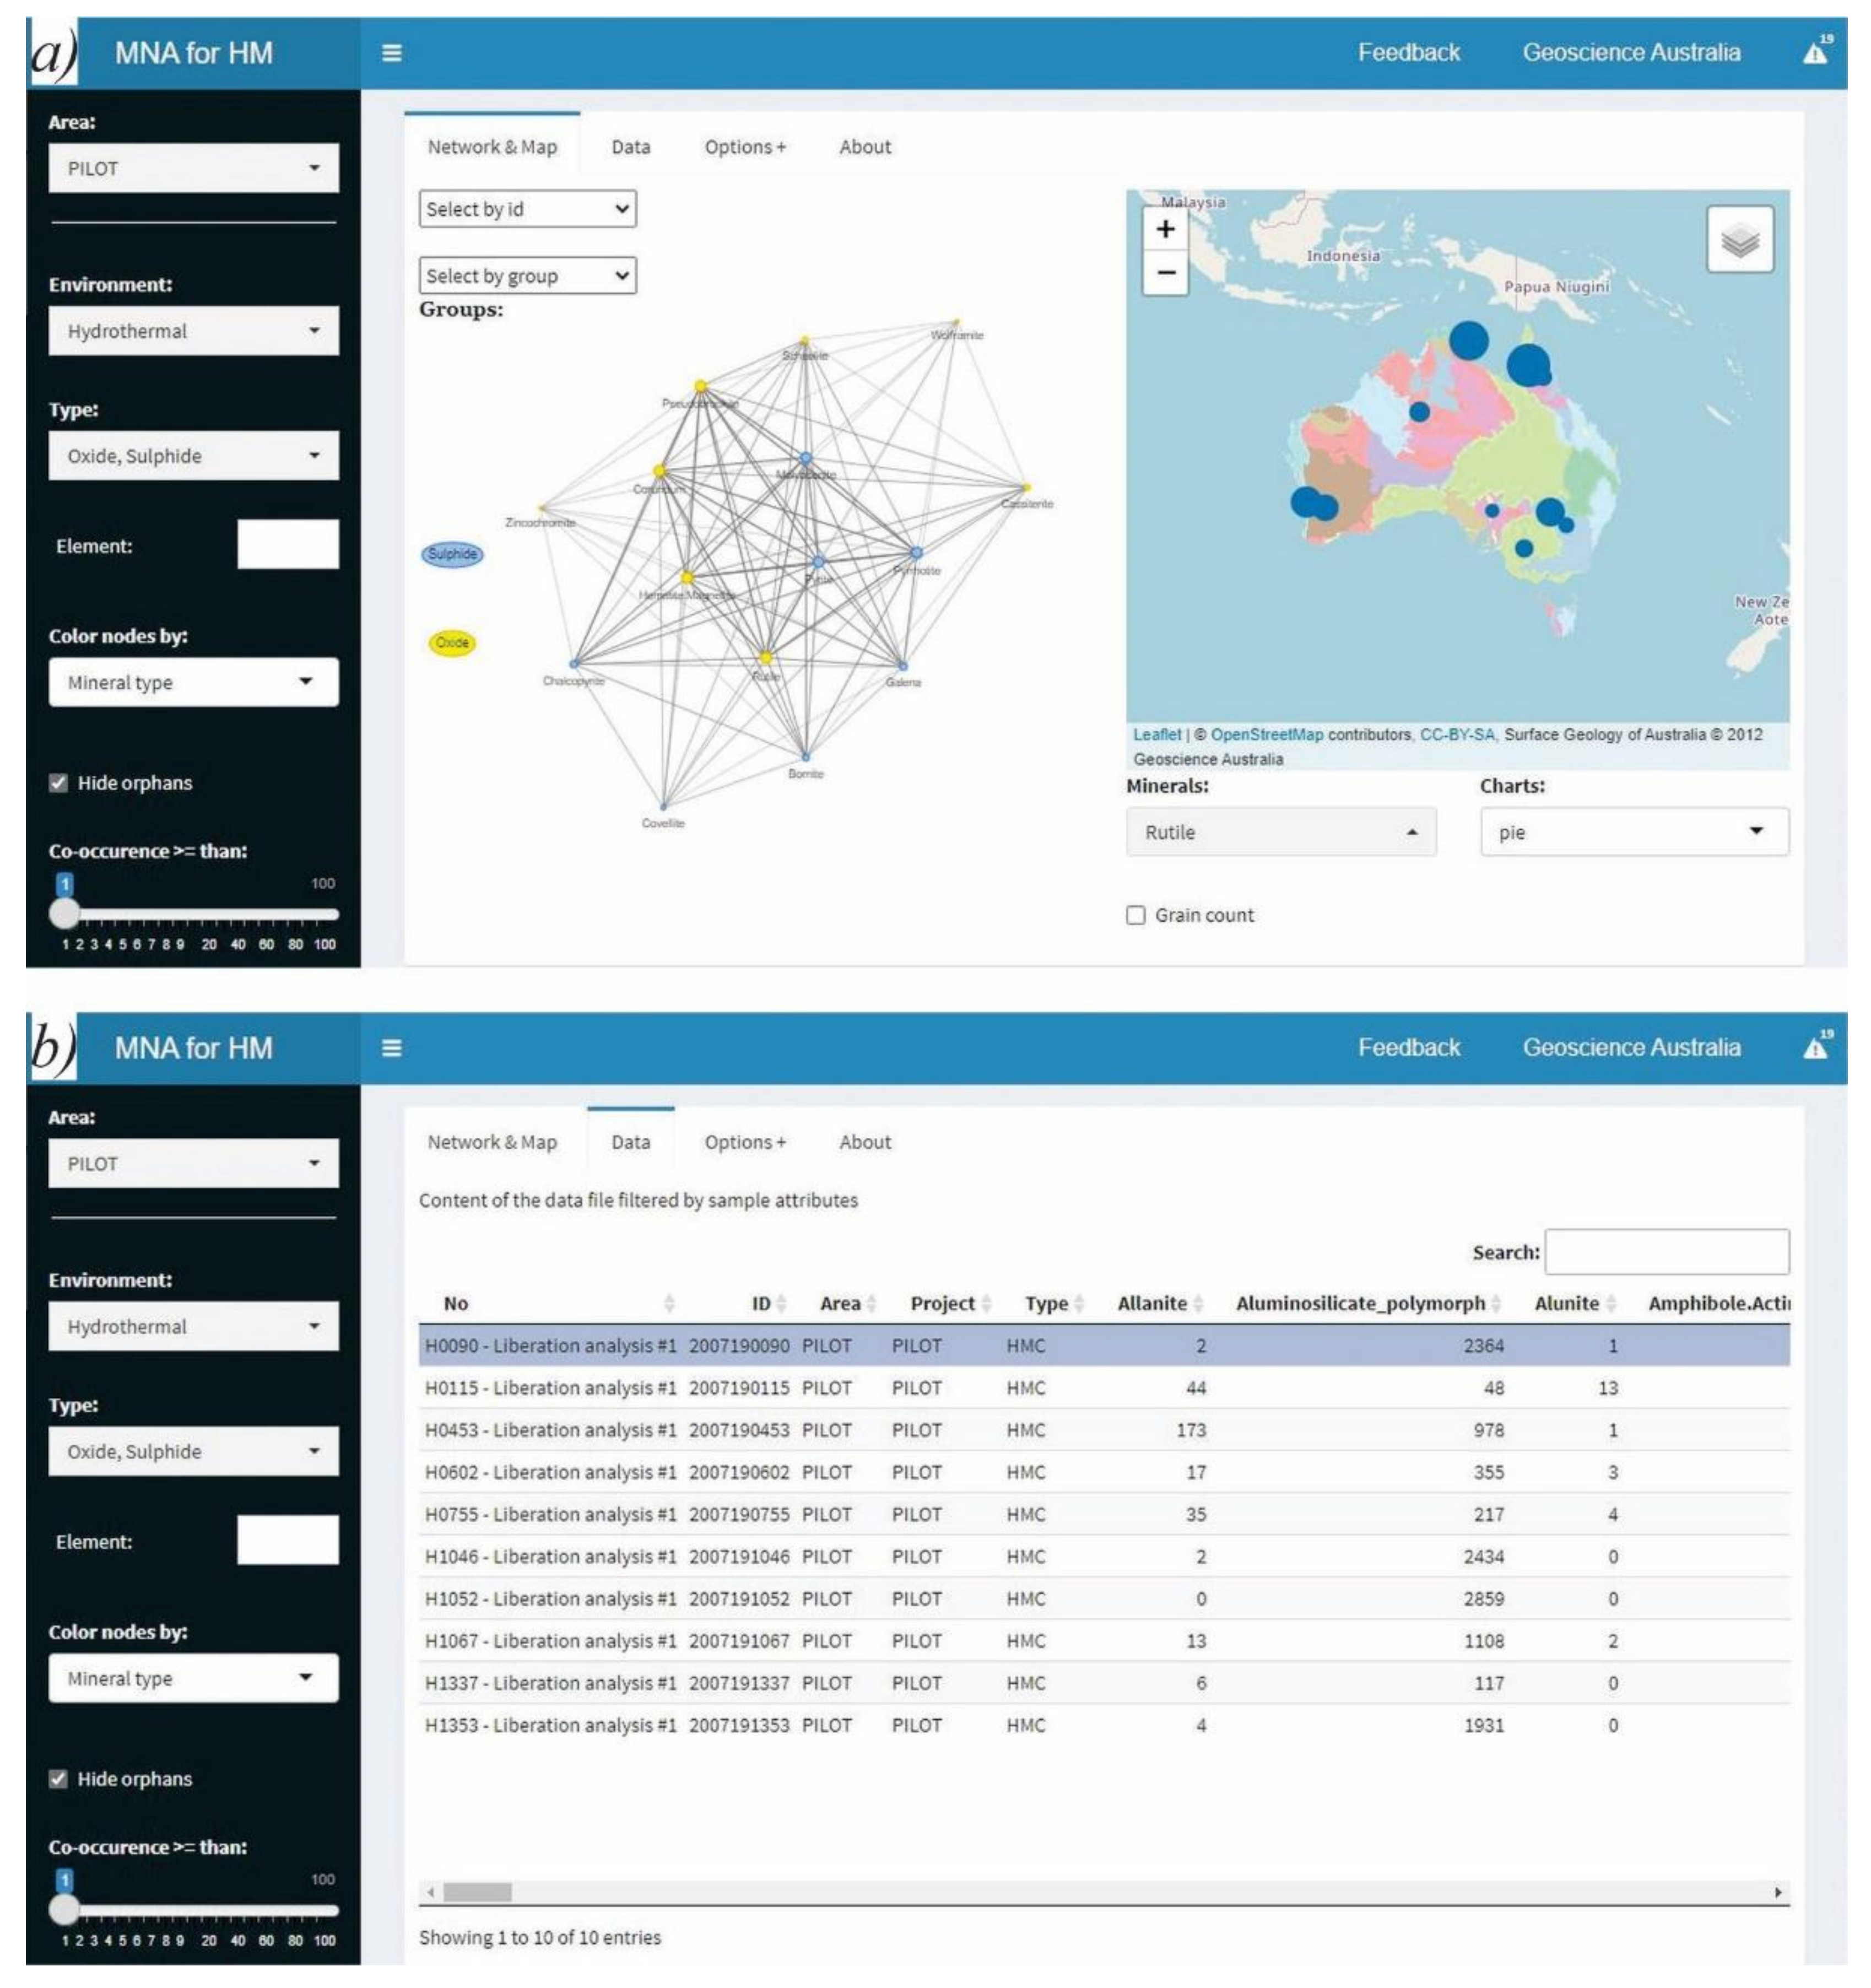
3.2. Mineral Network Analysis

The automated mineralogy workflow generates large amounts of geospatial mineral mineralogy and chemistry data, the analysis of which requires the application of innovative statistical analysis and visualization techniques such as mineral network analysis (MNA). Network analysis is a subfield of graph theory that provides a dynamic, quantitative, and predictive visualization tool to uncover complex and otherwise hidden higher-dimensional patterns of diversity and distribution in mineralogical ‘big data’ [41]. Key parameters that MNA provides for automated mineralogy datasets are:
  • Mineral abundance: every mineral present in a sample is represented by a node (e.g., a circle), the size of which is proportional to the abundance of the mineral within the sample population;
  • Mineral co-occurrence: minerals that co-occur in a sample are linked by lines (edges), the weight (or thickness) of which can be made proportional to the number of samples where this pair of minerals co-occurs.
To integrate MNA in our workflow, we have built a bespoke MNA software tool using the ‘Shiny’ web application framework R package [42]. The Shiny MNA tool, ‘MNA for HM’, is accessible via the https://geoscienceaustralia.shinyapps.io/mna4hm link (accessed on 28 July 2022 ). The main purpose of the application is to interactively reveal persistent associations (co-occurrences) of heavy minerals, their spatial distribution, and relations to the first-order geological and geomorphological features such as geological provinces, mineral deposits, topography and hydrological catchments. Visualization of the mineral network—with the mineral dataset filtered or styled based on mineralogical classes (i.e., ‘Types’), elemental composition, and formation environment—guides minimalistic but meaningful mapping of distribution of minerals typo-morphic for particular geological environment or mineralization. By default, the mineral network is depicted as interactive force-directed graphs created with Fruchterman-Reingold’s algorithm, representing the nodes’ distribution as a dynamic network with balanced spring-like interactions among nodes [43]. The algorithm usually results in edges that are relatively similar in length. Though the edges’ length has no specific meaning in the implemented network visualizations, they tend to be shorter for more commonly occurring minerals. The underpinning R packages are ‘visNetwork’ [44] and ‘igraph’ [45].
The graphical user interface is illustrated in Figure 5. The top bar menu allows users to toggle between a Network & Map, Data, Options, and About tabs. Filters on the left hand side allow selection of samples by Area and of minerals by Environment, Type, and Element. The nodes can be colored by Mineral type or Mineral environment. A toggle box allows to Hide orphans (minerals not associated with any others, given the selection(s) made), and a slider allows setting of the Co-occurrence to a minimum (default = 1).
On the main Network & Map tab (Figure 5a), a mineral network is shown to the left and map to the right. Minerals can be selected by ID and Group on the network, and the map has several layer, mineral selection and chart options. By hovering the cursor over a node, a dialog box appears showing the mineral’s name, chemical formula, and count. By hovering the cursor over a vertex, a dialog box appears showing the number of co-occurrences the two linked minerals display in the database. The map on the right shows the location of the samples under consideration; these can include all the samples selected as per above, or a sub-selection by mineral name; the map can display several background layers and represent the points as growing dot/pie, radial by area/radius, or bar charts. A more detailed description of the MNA-HM tool will be provided separately at the end of the main project (see below).
The Data tab (partially displayed in Figure 5b) displays the filtered data underpinning the Network & Map plots. The data table presents the key sample metadata (including sample identifiers and geographic coordinates) and observations for the complete set of the identified minerals (e.g., the grains counts).
The aspiration is that down the track most of this functionality will be built into Geoscience Australia’s data delivery portal (https://portal.ga.gov.au, accessed on 28 July 2022 ) to support data analysis in combination with other layers and datasets.

4. The Heavy Mineral Map of Australia

The Heavy Mineral Map of Australia (HMMA) project is a collaboration between Geoscience Australia and Curtin University funded under the Australian Government’s Exploring for the Future 2020–2024 initiative (https://www.ga.gov.au/eftf (accessed on 28 July 2022 )). Quantitative mineralogical data and metadata have to-date been acquired for over half of the NGSA sample set. A staged HMMA data release approach is planned with the dataset for a first priority area being launched publicly in late 2022. Whether regionally or nationally, we envisage that ‘background’ HM maps would be used as a baseline datum from which HM anomalies potentially representing prospective mineral systems, or parts thereof, may be identifiable. By integrating HM maps and datasets into mineral prospectivity modeling, a methodology that leverages large and complex datasets (typically geochemistry, geophysics, and geology) to highlight areas of interest for mineral exploration (e.g., [32,46]), areas of Australia that were previously viewed as having little or no potential for hosting Tier 1-mineral deposits may be identified.

5. Conclusions

We introduce the innovative vision of a continental-scale map (or atlas of maps) of heavy minerals (HMs) in Australian floodplain sediments, the Heavy Mineral Map of Australia (HMMA). A pilot project was developed to test this vision on ten National Geochemical Survey of Australia (NGSA) samples spread around Australia. It has established that:
  • The NGSA samples contain sufficient HMs to allow their identification and quantification using automated mineralogy technologies.
  • The HM fraction must be physically separated from the bulk samples prior to automated mineralogical analysis to enhance detection and sensitivity.
  • The HM assemblages display high mineralogical diversity, foreshadowing the discovery of varied and informative HM patterns at the national scale.
  • The identification and quantification of HMs extracted from alluvial sediments are broadly consistent with the geology and geochemistry of their respective catchment areas.
The data, represented for instance by HM presence/absence (1/0), absolute HM abundance (counts), and HM abundance relative to the HM concentrates or to the bulk sediment samples (vol% or wt%), can be displayed as maps using a geographic information system. In addition, the data, represented in terms of mineral co-occurrences, can also be investigated using a cloud-based mineral network analysis (MNA) tool, a prototype of which was developed for the HMMA project. Raw data, maps, and networks, together, provide a powerful environment to uncover mineralogical fingerprints of geodynamic setting, lithotype, magmatism, metamorphic grade, alteration, weathering, or mineralization.
The HMMA project is well underway, with a first data release planned for late 2022. After its full completion in 2024, it is hoped that the new quantitative HM mineralogy will be useful as an input to mineral prospectivity modeling, and that this will enhance mineral discovery, particularly of technology critical elements and minerals, so fundamental to the transition to a more environmentally sustainable, low-carbon economy.

Supplementary Materials

The following supporting information can be downloaded at: https://www.mdpi.com/article/10.3390/min12080961/s1, S1. Materials; S2. Methods; S2.1. Sample Preparation; Figure S1: JCR® table used at the JdLC (left; letters label items discussed in text). Detail (right) shows 117 the heavy minerals (dark grains) accumulated in the top four grooves; S2.2. Automated Mineralogy; Figure S2: TESCAN® Integrated Mineral Analyzer (SEM-EDS) at the JdLC; S3. References [33,34,36,47,48,49,50]; S4. Data Tables; Table S1: Names (sorted alphabetically), formulas, average specific gravity (Ave SG) and common environments of occurrence/host rocks of selected heavy minerals (Source: www.webmineral.com, accessed on 28 July 2022); Table S2: Quantitative mineralogy data (vol%) for the whole-rock (WR) mounts of the ten NGSA pilot project samples; Table S3: Quantitative mineralogy data (vol%) for the heavy mineral (H) mounts of the ten NGSA pilot project samples; S5. Mineral Mount Images; S6. Heavy Mineral Maps.

Author Contributions

Conceptualization, P.d.C. and B.I.A.M.; methodology, B.I.A.M., A.T.W., S.M.R. and A.M.P.; software, E.B.; validation, P.d.C., B.I.A.M., A.T.W. and S.M.R.; formal analysis, P.d.C., B.I.A.M., A.T.W. and S.M.R.; investigation, P.d.C., B.I.A.M., A.T.W. and S.M.R.; resources, P.d.C.; data curation, P.d.C., A.T.W. and A.M.P.; writing—original draft preparation, P.d.C.; writing—review and editing, P.d.C., B.I.A.M., A.T.W., E.B., S.M.R. and A.M.P.; visualization, P.d.C. and E.B.; supervision, P.d.C. and B.I.A.M.; project administration, P.d.C. and B.I.A.M.; funding acquisition, P.d.C. All authors have read and agreed to the published version of the manuscript.

Funding

The National Geochemical Survey of Australia (NGSA) project (http://www.ga.gov.au/ngsa, accessed on 28 July 2022 ) was funded by the Australian Government’s Onshore Energy Security Program (OESP 2007–2011) and Geoscience Australia appropriation. The Heavy Mineral Map of Australia (HMMA) project is funded by the Australian Government’s Exploring for the Future (EFTF 2020–2024) initiative and Geoscience Australia appropriation. The TIMA instrument was funded by a grant from the Australian Research Council (LE140100150) and is operated by the John de Laeter Centre at Curtin University with the support of the Geological Survey of Western Australia, University of Western Australia and Murdoch University.

Data Availability Statement

The dataset and tool presented in this study are freely available from the MNA tool link https://geoscienceaustralia.shinyapps.io/mna4hm/, accessed on 28 July 2022 (set Area to ‘PILOT’ in the left menu bar then click the ‘Download data’ button on the Data tab).

Acknowledgments

We acknowledge all landowners, private, corporate and/or traditional, for granting access to the NGSA sampling sites. We are grateful to the Geoscience Australia and Curtin University laboratory staff for their assistance with sample preparation. We thank Geoscience Australia reviewers Matilda Thomas and Phil Main, journal referees, and the journal editor, for their detailed and constructive critique of our work. P.de.C. and E.B. publish with the permission from the Chief Executive Officer, Geoscience Australia.

Conflicts of Interest

The authors declare no conflict of interest.

References

  1. Morton, A.C. Heavy Minerals. In Encyclopedia of Earth Science, Sedimentology; Springer: Berlin/Heidelberg, Germany, 1978. [Google Scholar]
  2. Joshi, K.B.; Banerji, U.S.; Dubey, C.P.; Oliveira, E.P. Heavy minerals in provenance studies: An overview. Arab. J. Geosci. 2021, 14, 1330. [Google Scholar] [CrossRef]
  3. McClenaghan, M.B.; Spirito, W.A.; Day, S.J.A.; McCurdy, M.W.; McNeil, R.J.; Adcock, S.W. Overview of surficial geochemistry and indicator mineral surveys and case studies from the Geological Survey of Canada’s GEM Program. Geochem. Explor. Environ. Anal. 2022, 22, geochem2021-070. [Google Scholar] [CrossRef]
  4. Mackay, D.A.R.; Simandl, G.J. Pyrochlore and columbite-tantalite as indicator minerals for specialty metal deposits. Geochem. Explor. Environ. Anal. 2015, 15, 167–178. [Google Scholar] [CrossRef]
  5. NRC (National Research Council). Minerals, Critical Minerals, and the U.S. Economy; The National Academies Press: Washington, DC, USA, 2008. [Google Scholar]
  6. Gunn, G. (Ed.) Critical Metals Handbook; American Geophysical Union Publication, British Geological Survey; John Wiley & Sons: Nottingham, UK, 2014. [Google Scholar]
  7. Cobelo-García, A.; Filella, M.; Croot, P.; Frazzoli, C.; Du Laing, G.; Ospina-Alvarez, N.; Rauch, S.; Salaun, P.; Schäfer, J.; Zimmermann, S. COST action TD1407: Network on technology-critical elements (NOTICE)—From environmental processes to human health threats. Environ. Sci. Pollut. Res. 2015, 22, 15188–15194. [Google Scholar] [CrossRef] [Green Version]
  8. Svendsen, J.B.; Hartley, N.R. Synthetic heavy mineral stratigraphy: Applications and limitations. Mar. Pet. Geol. 2002, 19, 389–405. [Google Scholar] [CrossRef]
  9. Zeegers, H.; Leduc, C. Geochemical exploration for gold in temperate, arid, semi-arid, and rain-forest terrains. In Gold Metallogeny and Exploration; Foster, R.P., Ed.; Springer: Dordrecht, The Netherlands, 1993. [Google Scholar] [CrossRef]
  10. Muggeridge, M.T. Pathfinder sampling techniques for locating primary sources of diamond: Recovery of indicator minerals, diamonds and geochemical signatures. J. Geochem. Explor. 1995, 53, 183–204. [Google Scholar] [CrossRef]
  11. Nowicki, T.E.; Moore, R.O.; Gurney, J.J.; Baumgartner, M.C. Diamonds and Associated Heavy Minerals in Kimberlite: A Review of Key Concepts and Applications. Dev. Sedimentol. 2007, 58, 1235–1267. [Google Scholar] [CrossRef]
  12. Barnett, P.J.; Averill, S. Heavy mineral dispersal trains in till in the area of the Lac des Iles PGE deposit, northwestern Ontario, Canada. Geochem. Explor. Environ. Anal. 2010, 10, 391–399. [Google Scholar] [CrossRef]
  13. Evans, N.J.; McInnes, B.I.A.; McDonald, B.J.; Danišík, M.; Jourdan, F.; Mayers, C.; Thern, E.; Corbett, D. Emplacement age and thermal footprint of the diamondiferous Ellendale E9 lamproite pipe, Western Australia. Miner. Deposita 2013, 48, 413–421. [Google Scholar] [CrossRef]
  14. McClenaghan, M.B.; Parkhill, M.A.; Seaman, A.A.; Pronk, A.G.; McCurdy, M.; Kontak, D.J. Overview of Tungsten Indicator Minerals Scheelite and Wolframite with Examples from the Sisson W-Mo deposit, Canada. In Application of Indicator Mineral Methods to Mineral Exploration, Short Course SC07, Proceedings of the 26th Int App Geoch Symp, Rotorua, New Zealand, 18–21 November 2013; Available online: https://www.appliedgeochemists.org/images/stories/IAGS_2013/10-McClenaghan-etal.pdf (accessed on 28 July 2022 ).
  15. O’Brien, J.J.; Spry, P.G.; Teale, G.S.; Jackson, S.E.; Koenig, A.E. Gahnite composition as a means to fingerprint metamorphosed massive sulfide and non-sulfide zinc deposits. J. Geochem. Explor. 2015, 159, 48–61. [Google Scholar] [CrossRef] [Green Version]
  16. Taivalkoski, A.; Sarala, P.; Hulkki, H. Gold exploration using heavy minerals in till and weathered bedrock in Petäjäselkä, northern Finland. Geochem. Explor. Environ. Anal. 2015, 15, 205–221. [Google Scholar] [CrossRef]
  17. Salama, W.; Anand, R.R.; Verrall, M. Mineral exploration and basement mapping in areas of deep transported cover using indicator heavy minerals and paleoredox fronts, Yilgarn Craton, Western Australia. Ore Geol. Rev. 2016, 72, 485–509. [Google Scholar] [CrossRef]
  18. Mao, M.; Rukhlov, A.S.; Rowins, S.M.; Hickin, A.S.; Ferbey, T.; Bustard, A.; Spence, J.; Coogan, L.A. A Novel Approach Using Detrital Apatite and Till Geochemistry to Identify Covered Mineralization in the TREK Area of the Nechako Plateau, British Columbia. In Indicator Minerals in Till and Stream Sediments of the Canadian Cordillera; Ferbey, T., Plouffe, A., Hickin, A.S., Eds.; Topics in Mineral Sciences; Mineral Association Canada: Toronto, ON, Canada, 2017; Volume 47, pp. 191–243. ISBN 978-0-921294-60-3. Available online: https://gac.ca/product/indicator-minerals-in-till-and-stream-sediments-of-the-canadian-cordillera-a-joint-publication-of-gac-and-mac/ (accessed on 28 July 2022 ).
  19. Xing, Y.; Brugger, J.; Tomkins, A.; Shvarov, Y. Arsenic evolution as a tool for understanding formation of pyritic gold ores. Geology 2019, 47, 335–338. [Google Scholar] [CrossRef]
  20. Krneta, S.; Ciobanu, C.L.; Cook, N.J.; Ehrig, K.; Kontonikas-Charos, A. Rare earth element behaviour in apatite from the Olympic Dam Cu-U-Au-Ag deposit, South Australia. Minerals 2017, 7, 135. [Google Scholar] [CrossRef] [Green Version]
  21. Mao, M.; Rukhlov, A.S.; Rowins, S.M.; Spence, J.; Coogan, L.A. Apatite Trace Element Compositions: A Robust New Tool for Mineral Exploration. Econ. Geol. 2016, 111, 1187–1222. [Google Scholar] [CrossRef]
  22. Lu, Y.-J.; Loucks, R.R.; Fiorentini, M.; McCuaig, T.C.; Evans, N.J.; Yang, Z.-M.; Hou, Z.-Q.; Kirkland, C.L.; Parra-Avila, L.A.; Kobussen, A. Zircon compositions as a pathfinder for porphyry Cu ± Mo ± Au deposits. Econ. Geol. 2016, Spec Pub 19, 329–347. [Google Scholar] [CrossRef]
  23. Pisiak, L.K.; Canil, D.; Lacourse, T.; Plouffe, A.; Ferbey, T. Magnetite as an Indicator Mineral in the Exploration of Porphyry Deposits: A Case Study in Till near the Mount Polley Cu-Au Deposit, British Columbia, Canada. Econ. Geol. 2017, 112, 919–940. [Google Scholar] [CrossRef] [Green Version]
  24. Cooke, D.R.; Wilkinson, J.J.; Baker, M.; Agnew, P.; Phillips, J.; Chang, Z.; Chen, H.; Wilkinson, C.C.; Inglis, S.; Hollings, P.; et al. Using Mineral Chemistry to Aid Exploration: A Case Study from the Resolution Porphyry Cu-Mo Deposit, Arizona. Econ. Geol. 2020, 115, 813–840. [Google Scholar] [CrossRef]
  25. Porter, J.K.; McNaughton, N.J.; Evans, N.J.; McDonald, B.J. Rutile as a pathfinder for metals exploration. Ore Geol. Rev. 2020, 120, 103406. [Google Scholar] [CrossRef]
  26. Lee, R.G.; Plouffe, A.; Ferbey, T.; Hart, C.J.R.; Hollings, P.; Gleeson, S.A. Recognizing porphyry copper potential from till zircon composition: A case study from the highland valley porphyry district, south-central British Columbia. Econ. Geol. 2021, 116, 1035–1045. [Google Scholar] [CrossRef]
  27. McInnes, B.I.A. Application of Innovative Geochronology Techniques in Geoscience Mapping and Exploration. Geol. Surv. West Austral. Rec. 2019, 2, 20–22. Available online: https://geodocsget.dmirs.wa.gov.au/api/GeoDocsGet?filekey=f6fbf3db-3ee0-4f2a-8253-c03fdadc1b7b-ogtgkscesv89cmfalodtvwjv3svwe2ioma1zk6ik (accessed on 28 July 2022 ).
  28. Kerr, D.E.; Kjarsgaard, I.M.; Smith, D. Chemical characteristics of kimberlite indicator minerals from the Drybones Bay area (NTS 85I/4), Northwest Territories. Geol. Surv. Can. Open File Rep. 2000, 3942, 29. [Google Scholar] [CrossRef]
  29. McClenaghan, M.B.; McMartin, I.; Plouffe, A. Base and Precious Metal Indicator Mineral Research at the Geological Survey of Canada. Explore 2008, 138, 12–15. Available online: https://www.appliedgeochemists.org/images/Explore/Explore,%20Number%20138%20March%202008.pdf (accessed on 28 July 2022 ).
  30. McClenaghan, M.B.; Plouffe, A.; Paulen, R.C.; Houlé, M.G.; Jackson, S.E.; Peter, J.M. Overview of Indicator Mineral Research at the Geological Survey of Canada—An Update. Explore 2016, 170, 1–15. Available online: https://www.appliedgeochemists.org/images/Explore/Explore_Number_170_March_2016.pdf (accessed on 28 July 2022 ).
  31. Hutchison, M.T. Diamond Exploration and Prospectivity of Western Australia. Geol. Surv. West Austral. Rep. 2018, 179, 70. Available online: https://geodocsget.dmirs.wa.gov.au/api/GeoDocsGet?filekey=71d9f394-cee1-4ce6-b44d-907db17b1d96-fnya03nc0udip8vfxvrilirssm4kxgt6axdga3oy (accessed on 28 July 2022 ). [CrossRef]
  32. Montsion, R.M.; Saumur, B.M.; Acosta-Gongora, P.; Gadd, M.G.; Tschirhart, P.; Tschirhart, V. Knowledge-driven mineral prospectivity modelling in areas with glacial overburden: Porphyry Cu exploration in Quesnellia, British Columbia, Canada. Appl. Earth Sci. 2019, 128, 181–196. [Google Scholar] [CrossRef] [Green Version]
  33. Caritat, P.d.; Cooper, M. National Geochemical Survey of Australia: The Geochemical Atlas of Australia. Geosci. Austral. Rec. 2011, 20, 557. Available online: http://pid.geoscience.gov.au/dataset/ga/71973 (accessed on 28 July 2022 ).
  34. Blake, D.; Kilgour, B. Geological Regions of Australia 1:5,000,000 Scale; Geoscience Australia: Canberra, Australia, 1998. Available online: http://pid.geoscience.gov.au/dataset/ga/32366 (accessed on 28 July 2022 ).
  35. Aylmore, M.G.; Merigot, K.; Quadir, Z.; Rickard, W.D.A.; Evans, N.G.; McDonald, B.J.; Catovic, E.; Spitalny, P. Applications of advanced analytical and mass spectrometry techniques to the characterisation of micaceous lithium-bearing ores. Miner. Eng. 2018, 116, 182–195. [Google Scholar] [CrossRef]
  36. Schulz, B.; Sandmann, D.; Gilbricht, S. SEM-Based Automated Mineralogy and its Application in Geo- and Material Sciences. Minerals 2020, 10, 1004. [Google Scholar] [CrossRef]
  37. Roswell, M.; Dushoff, J.; Winfree, R. A conceptual guide to measuring species diversity. Oikos 2021, 130, 321–338. [Google Scholar] [CrossRef]
  38. Hazen, R.M.; Grew, E.S.; Downs, R.T.; Golden, J.; Hystad, G. Mineral ecology: Chance and necessity in the mineral diversity of terrestrial planets. Can. Miner. 2015, 53, 295–324. [Google Scholar] [CrossRef]
  39. Hughes, A. Australian Operating Mines Map 2019, 20th ed.; Scale 1:7,000,000; Geoscience Australia: Canberra, Australia, 2020. Available online: http://pid.geoscience.gov.au/dataset/ga/133033 (accessed on 28 July 2022 ).
  40. Sexton, M. Australian Mineral Occurrences Collection; Geoscience Australia: Canberra, Australia, 2011. Available online: http://pid.geoscience.gov.au/dataset/ga/73131 (accessed on 28 July 2022 ).
  41. Morrison, S.M.; Liu, C.; Eleish, A.; Prabhu, A.; Li, C.; Ralph, J.; Downs, R.T.; Golden, J.J.; Fox, P.; Hummer, D.R.; et al. Network analysis of mineralogical systems. Am. Miner. 2017, 102, 1588–1596. [Google Scholar] [CrossRef]
  42. Chang, W.; Cheng, J.; Allaire, J.J.; Sievert, C.; Schloerke, B.; Xie, Y.; Allen, J.; McPherson, J.; Dipert, A.; Borges, B. Shiny: Web Application Framework for R; R Package Version 1.7.1. 2021. Available online: https://CRAN.R-project.org/package=shiny (accessed on 28 July 2022 ).
  43. Fruchterman, T.M.J.; Reingold, E.M. Graph drawing by force-directed placement. Softw. Pract. Exp. 1991, 21, 1129–1164. [Google Scholar] [CrossRef]
  44. Almende, B.V.; Thieurmel, B.; Titouan, R. visNetwork: Network Visualization Using ‘vis.js’ Library; R Package Version 2.1.0. 2021. Available online: https://CRAN.R-project.org/package=visNetwork (accessed on 28 July 2022 ).
  45. Csardi, G.; Nepusz, T. The Igraph Software Package for Complex Network Research. InterJ. Complex Syst. 2006, 1695. Available online: https://igraph.org (accessed on 28 July 2022 ).
  46. Skirrow, R.G.; Murr, J.; Schofield, A.; Huston, D.L.; van der Wielen, S.; Czarnota, K.; Coghlan, R.C.; Highet, L.M.; Connolly, D.; Doublier, M.; et al. Mapping iron oxide Cu-Au (IOCG) mineral potential in Australia using a knowledge-driven mineral systems-based approach. Ore Geol. Rev. 2019, 113, 103–120. [Google Scholar] [CrossRef]
  47. Ottesen, R.T.; Bogen, J.; Bølviken, B.; Volden, T. Overbank sediment: A representative sampling medium for regional geochemical mapping. J. Geochem. Explor. 1989, 32, 257–277. [Google Scholar] [CrossRef]
  48. Caritat, P.d.; Cooper, M. A continental-scale geochemical atlas for resource exploration and environmental management: The National Geochemical Survey of Australia. Geoch. Explo. Env. Anal. 2016, 16, 3–13. [Google Scholar] [CrossRef]
  49. Caritat, P.d.; Dosseto, A.; Dux, F. A strontium isoscape of inland southeastern Australia. Earth Syst. Sci. Data Discuss. 2022, 1–23, preprint, in review. [Google Scholar]
  50. Desem, C.U.; Maas, R.; Woodhead, J.; Carr, G.; Caritat, P.d. Towards a Pb isotope regolith map of the Australian continent: A Northern Territory perspective. In Exploring for the Future: Extended Abstracts; Czarnota, K., Roach, I., Abbott, S., Haynes, M., Kositcin, N., Ray, A., Slatter, E., Eds.; Geoscience Australia: Canberra, Australia, 2020. [Google Scholar] [CrossRef]
Figure 1. Distribution of National Geochemical Survey of Australia (NGSA) sample sites (blue dots), including the 10 pilot project sites discussed herein and identified by sample ID (red plusses), overlain on Australia’s geological regions (variable colors; [34]). Relevant geological regions are labelled. Map projection: Albers equal area.
Minerals 12 00961 g001
Figure 2. Stacked bar diagrams of the abundances (vol%) of 10 selected heavy minerals in the whole rock (prefix WR) (a), and heavy mineral (H) (b) fractions of the 10 NGSA samples (identified by last four-digit code). Please refer to Table S2 in Supplementary Materials for the full list of identified minerals.
Minerals 12 00961 g002aMinerals 12 00961 g002b
Figure 3. Distribution map of 10 selected heavy minerals in the heavy mineral (H) fractions of the 10 NGSA samples (pie charts), overlain on Australia’s geological regions (variable colors; [34]). Map projection: Albers equal area.
Minerals 12 00961 g003
Figure 4. Scatterplots and least-square regressions of Zr in the 10 NGSA TOS coarse (<2 mm) fractions vs. zircon concentration in the whole rock (WR) (a) and heavy mineral concentrates (HMC) (b) samples.
Minerals 12 00961 g004
Figure 5. Graphical user interface for the Geoscience Australia MNA cloud-based visualization tool for the pilot project (https://geoscienceaustralia.shinyapps.io/mna4hm, accessed on 28 July 2022 ) showing the Network & Map (a), and the Data (b) screens.
Minerals 12 00961 g005
Publisher’s Note: MDPI stays neutral with regard to jurisdictional claims in published maps and institutional affiliations.

