Article

Modes of Occurrence, Elemental Relationships, and Economic Viability of Rare Earth Elements in West Virginia Coals: A Statistical Approach

Department of Geology and Geography, West Virginia University, Morgantown, WV 26506, USA
*
Author to whom correspondence should be addressed.
Minerals 2022, 12(8), 1060; https://doi.org/10.3390/min12081060
Submission received: 8 July 2022 / Revised: 12 August 2022 / Accepted: 13 August 2022 / Published: 22 August 2022
(This article belongs to the Section Mineral Deposits)

Abstract

:
Rare earth elements and yttrium (REY) are essential for manufacturing technologies vital to economic and national security. As the demand for REY increases and conventional ores become depleted, attention is turning to unconventional resources like coal as a source for these elements. As the nation’s second-largest coal producer, West Virginia (WV) has the potential to transition into producing REY. This study utilizes open-access coal chemistry data from the USGS COALQUAL database in order to assess the potential of WV coal deposits as resources for REY and to gain insight into elemental modes of occurrence and possible enrichment mechanisms. Results suggest that clay minerals dominate the inorganic fraction of most samples and that REY concentrations are primarily proportional to the inorganic content. A few samples deviate from this trend due to mineralogic differences and impacts of post-depositional processes, including possible hydrothermal fluid influences. An ash-basis economic assessment identified 71 promising samples in the data set. The majority of promising samples were sourced from lower to lower-middle Pennsylvanian coal seams in the Kanawha, New River, and Pocahontas formations. Future studies should investigate these deposits using direct analytical methods to better characterize vertical and lateral heterogeneity in REY concentrations and confirm modes of occurrence.

1. Introduction

Rare earth elements are critical for essential technologies used in renewable energy, communication, transportation, and national defense. They include the 15 lanthanide elements and sometimes yttrium and scandium, which are chemically similar to the lanthanides and can occur in the same mineral deposits. This paper assesses rare earth element content in the context of lanthanide elements plus yttrium, which are commonly referred to as “REY”. Scandium was excluded as a rare earth element because, although the element is geochemically similar to REY, it often does not co-occur with REY [1]. There is great interest in developing new domestic resources for REY as conventional ores are being depleted while demand is increasing worldwide [2]. Coal is a good potential resource for these elements because in many cases it contains elevated concentrations of REY, which are comparable to conventional ore deposits. REY in coal occurs in both organic and inorganic associations [2]. The US also has the world’s largest proven coal reserves and mining infrastructure is already in place. Additionally, the combustion of coal for electricity generation produces fly ash as a waste product that may have high concentrations of certain rare earths and can potentially be utilized as a source for REY [3,4,5,6]. Acid mine drainage, another waste product associated with coal mining, has also been found to be enriched in a few critical REY [7,8].
To assess the potential of coal deposits as REY resources, it is imperative to gain insight into REY modes of occurrences and understand the depositional and diagenetic processes responsible for REY distribution. This will help identify promising coal seams and provide valuable insights on the development of targeted REY extraction techniques. Statistical methods are a common indirect approach for determining elemental modes of occurrence and shared provenance in coal. Methods often include linear regression, correlation coefficients, and hierarchical clustering algorithms [9,10,11,12]. REY in coal can have varying degrees of organic or inorganic associations due to variations in depositional environments, sediment sources, synchronous volcanic inputs, redox conditions, seawater influx, and processes including metamorphism, infiltration, groundwater leaching, and hydrothermal influences that can occur during or after any stage of coalification [4,13,14,15,16,17]. Elements with organic associations can be bonded directly to the organic matter, adsorbed to organic compounds, dissolved in pore water, or appear within microscopic mineral grains in macerals. Elements with inorganic associations appear as crystalline minerals (e.g., phosphates), non-crystalline mineraloids, or, in some cases, adsorbed to the surfaces of clay minerals in coal [18,19,20,21].
REY modes of occurrence are often investigated in terms of atomic mass and ionic radius, with the elements partitioned into light (LREY—La, Ce, Pr, Nd, Sm), medium (MREY—Eu, Gd, Tb, Dy, Y), and heavy groups (HREY—Ho, Er, Tm, Yb, Lu). Although the atomic mass of Y should place it into the light group, it has an ionic radius similar to Ho, so its chemical properties are transitional between the medium and heavy rare earth elements [4,19,22]. Although REY are typically assessed as multi-element groups, it is vital to consider individual REY when possible, as some elements can exhibit unique behavior under certain conditions. For example, Ce and Eu are sensitive to variations in redox conditions, and Y anomalies can occur when coals are subjected to seawater influence [23]. Elemental anomalies and REY fractionation patterns can sometimes be used to infer depositional conditions or post-depositional processes that have affected a coal seam [22,23]. Investigating individual elements is also crucial because not all REY have an equal value to society. Seredin [24] classified individual REY as critical, uncritical, or excessive based upon current and forecasted consumption and production. The critical REY are those whose demand in the world market exceeds their production and supply. Critical REY include Nd, Eu, Tb, Dy, Er, and Y. Excessive REY are those with production that exceeds their demand and include Ce, Ho, Tm, Yb, and Lu. The remaining elements, La, Pr, Sm, and Gd, are classified as uncritical based on their production and consumption balance. An outlook coefficient, calculated as the ratio of critical to excessive elements in the REY sum, can be used to comparatively evaluate the marketability of potential REY resources, including coal [24].
With one of the largest coal reserves in the country, West Virginia (WV) can play a crucial role in maintaining the nation’s supply of REY. First, however, it is important to understand patterns of REY occurrence and enrichment to identify coal seams that can serve as economically viable REY sources. To assess the potential of WV coals to be used as a source of REY, we need to identify coal seams with economically valuable REY concentrations and their modes of occurrence to inform prospecting and extraction techniques. This study represents a first attempt at using open-access coal chemistry data and statistical analysis to assess elemental modes of occurrence and identify economically promising coals in WV. Data were downloaded from the US Geological Survey’s (USGS) COALQUAL database. Samples used in this study are Pennsylvanian-aged coals from the northern and central portions of the Appalachian Basin (Figure 1). The Northern Appalachian Basin contains upper-middle to late Pennsylvanian coals from the Allegheny Formation, Conemaugh Group, Monongahela Formation, and Dunkard Group. Coals in the Central Appalachian Basin occur in the lower to middle Pennsylvanian Pocahontas, New River, and Kanawha formations. Central Appalachian Basin coals are generally lower in ash and sulfur than those in the northern portion of the basin. These older coal seams developed from ombrogenous palaeomires in a wet, tropical climate, while the younger northern seams were generated during more seasonal conditions in topogenous mires [25].

2. Materials & Methods

Coal chemistry data for the state of WV were downloaded from the USGS COALQUAL (version 3.0) database (https://ncrdspublic.er.usgs.gov/coalqual/) (accessed on 24 February 2021). The database contains measurements for major, minor, and trace elements, ash yield, and other characteristics for unweathered, full-bed US coal samples. Methodologies for determining elemental concentrations may vary based on when and where the sample was analyzed, potentially leading to inconsistencies in accuracy and precision [26]. Additionally, the WV data set is biased toward bituminous coals sourced from stratigraphically older coal seams within the Central Appalachian Basin in the southern portion of the state, where the majority of mining takes place. Regardless, the COALQUAL database is the largest publicly-available resource for WV coal chemistry data. At the time of download, the COALQUAL database contained 609 sample records for the state of WV. Seven samples with blank seam names, one sample with coordinates falling outside state boundaries, and thirty-two samples with incomplete sets of REY measurements were removed, resulting in a data set containing 569 samples. Sample locations are shown in Figure 1.

2.1. Data Substitutions

The presence of data below detection limits (BDL) presents a challenge when using COALQUAL data for analyses. The database shows all BDL data at 0.7 times the detection limit with an “L” indicator in the qualifier column. The use of the 0.7 multipliers was suggested by Connor et al. [27] and supported by Gluskoter et al. [28] as a way to create a fully quantitative dataset when a majority of samples are above the detection limit (ADL), since substituting values between 0–1 times the detection limit for a small number of samples has little overall effect on statistical analyses.
For correlation and cluster analyses, the data set was modified by removing elements with greater than 20% of data BDL or with a large number of missing observations. Then, an additional 102 records with missing observations were deleted, leaving a data set containing 467 samples. All remaining BDL data were substituted at 0.7 times the detection limit.
Data for the economic assessment was modified slightly differently because the calculation relies on the concentration of all REY but no other elements. This part of the analysis uses the original 569 samples with substitutions made for all BDL data using a methodology developed by Lin et al. [29], which uses different multipliers (Q factors) for each REY. Summary statistics were generated separately for BDL and ADL data to help with determining appropriate Q factors and are shown in Table 1.
To evaluate how different Q factors and subsequent substitutions for BDL data influence statistical analysis, mean REY values were calculated using a series of Q factors between 0–1, and then the relative standard deviation (RSD) of the means was assessed. For each element with BDL data, the detection limit was multiplied by the following Q factors: 0, 0.1, 0.2, 0.3, 0.4, 0.5, 0.6, 0.7, 0.8, 0.9, and 1.0. Mean values were calculated for each Q factor iteration and were used to calculate the RSD for each element. Smaller RSD percentages indicate that the values are more tightly clustered around the mean, while larger percentages indicate more dispersion. Results for individual elements, total REY (TREY), and the concentration of both critical and excessive REY (as defined by Seredin [24]) are shown in Figure 2. The elements La, Ce, Sm, and Y have no BDL data, so no substitutions were necessary. The effect of substituting with Q factors was minimal (<12.4%) for Nd, Eu, Tb, Yb, Lu, TREY, critical, and excessive elements. RSD for Gd was 19.4%, Er was 37%, and for Pr, Dy, Ho, and Tm, it was >50%. Figure 3 shows that individual REY results are largely correlated with the percentage of BDL data, with larger BDL proportions resulting in higher RSD. For elements with RSD below 12.4% and BDL proportions less than 25%, a Q factor of 0.7 was used. For the remaining elements, Q factors were chosen based on the mean values of the ADL data. Q factors and summary statistics for the adjusted data are shown in Table 1.

2.2. Pearson Correlation

To assess the strength of inorganic association for elements in WV coals, Pearson correlation coefficients were calculated progressively for all samples through the full range of ash yields (in ascending order) using the cor() function in R. Pearson correlation measures the strength of linear correlation between two variables, producing a coefficient between −1 to 1. A coefficient of zero indicates no correlation, a coefficient of 1 indicates a strong positive correlation, and −1 indicates a strong negative correlation. Matrix correlation was also performed to generate Pearson correlation coefficients for each element versus every other element in the data set to provide further insight into elemental modes of occurrence. Before performing matrix correlation, the data were transformed using symmetric pivot coordinates, which have been shown to provide more robust results when working with compositional data, including coal geochemistry data [12,30]. Pivot coordinates were created using the pivotCoord() function (robCompositions package) and then matrix correlation was performed using the cor() function in R.

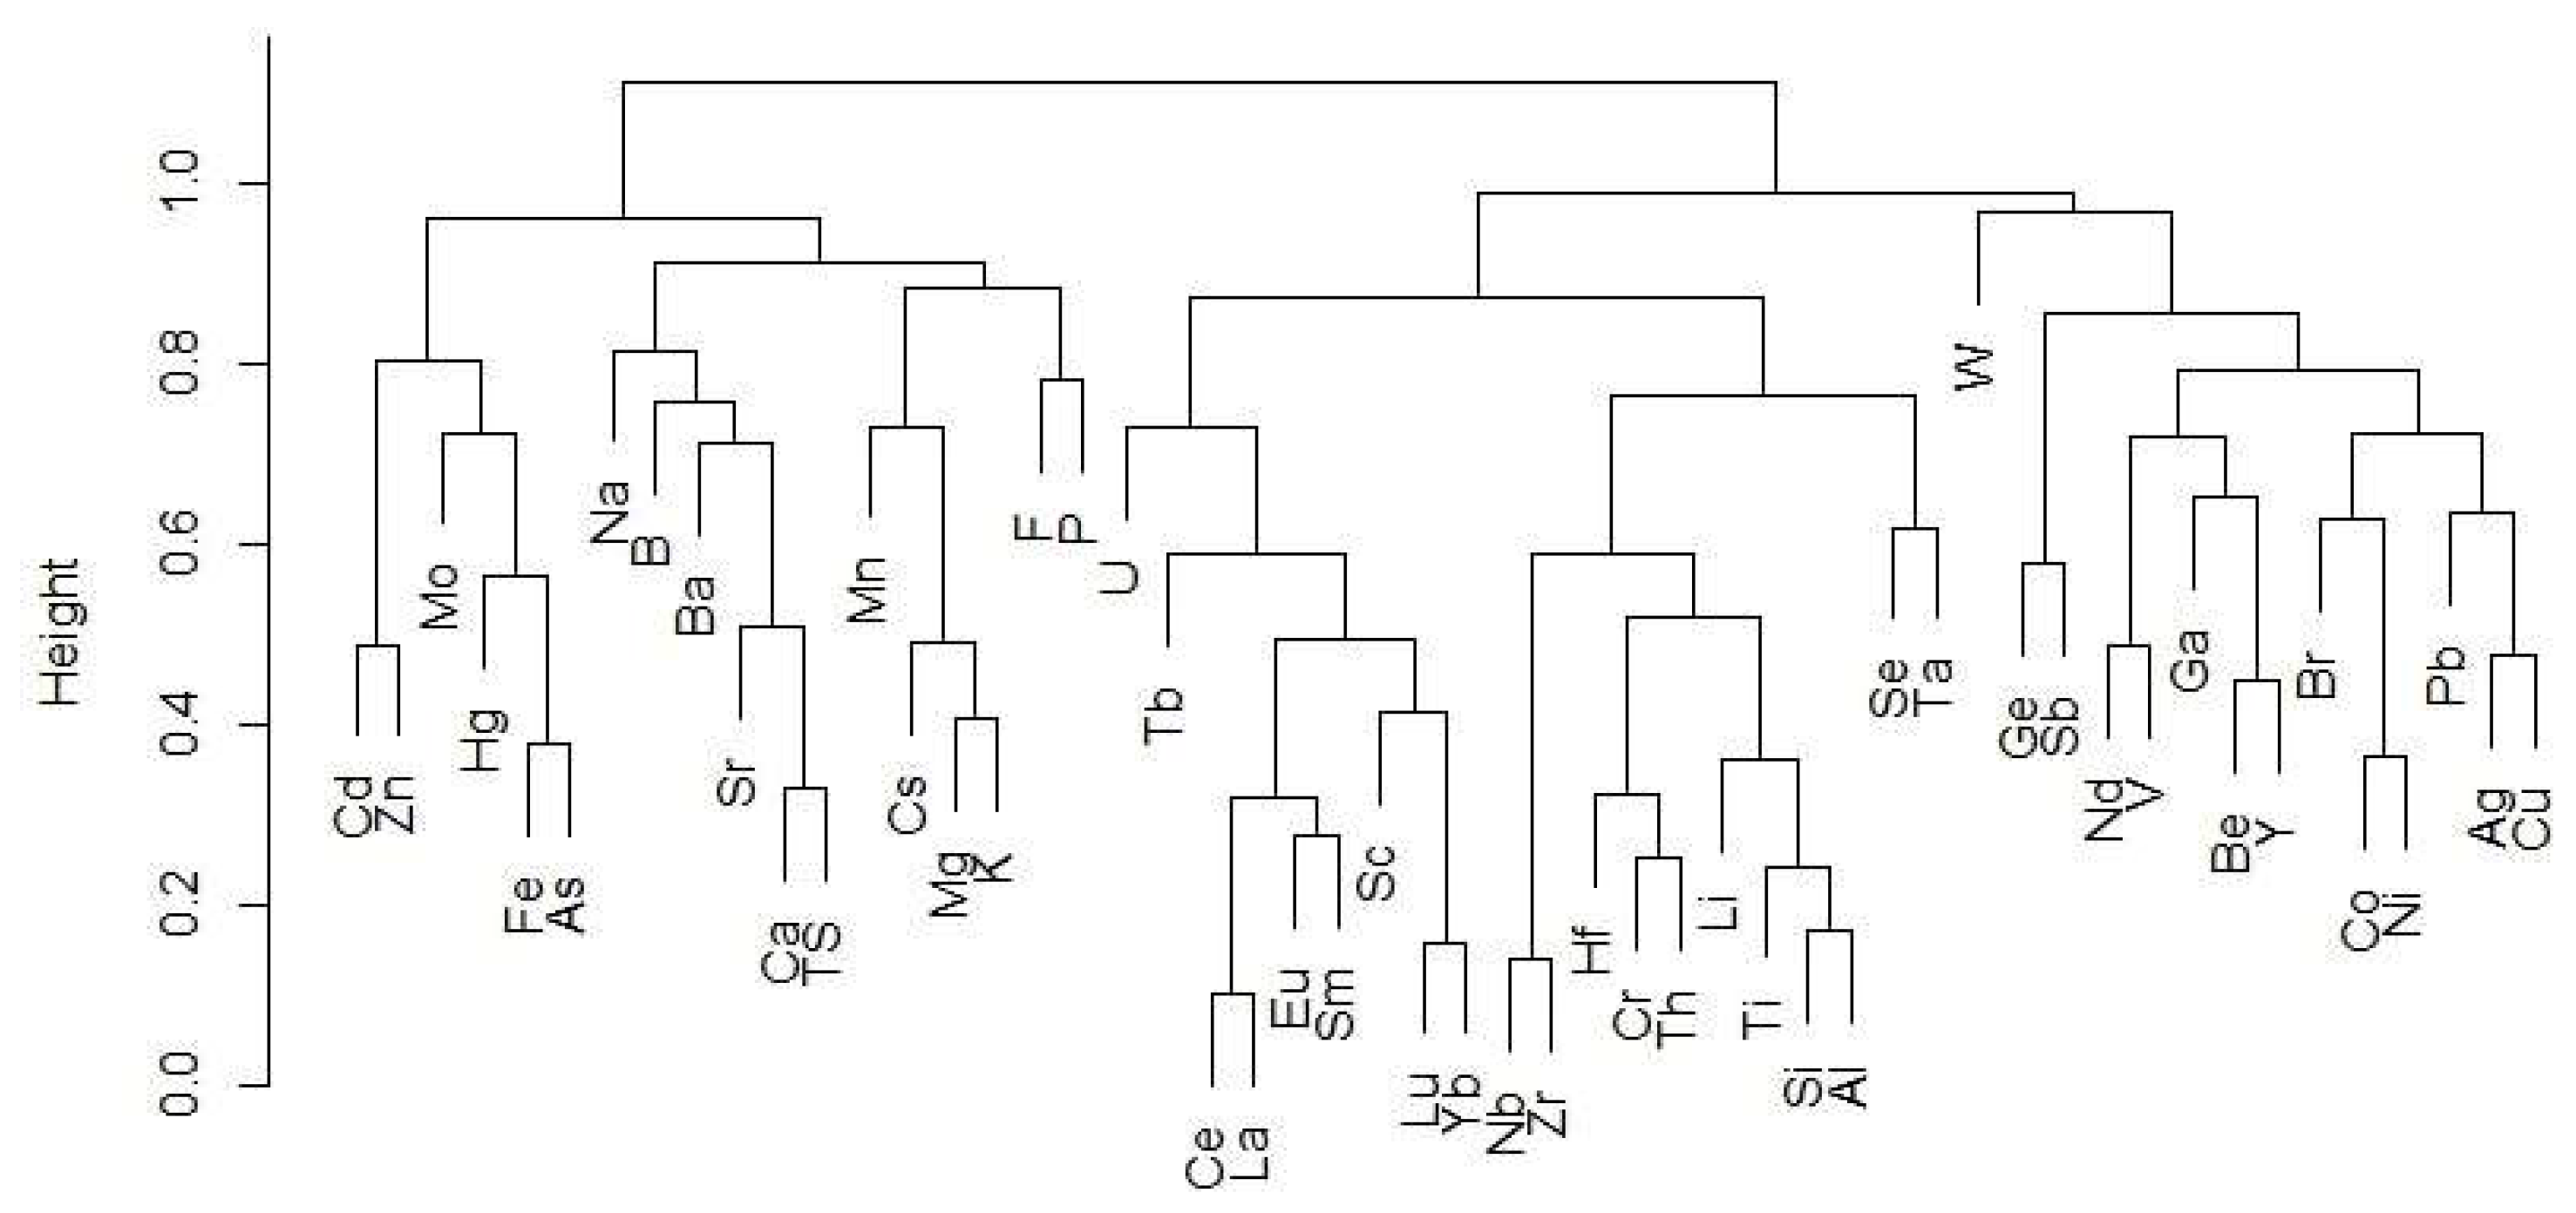
2.3. Hierarchical Clustering

Agglomerative hierarchical clustering was used to provide additional insight into elemental relationships and modes of occurrence. Hierarchical clustering provides information on the degree of affinity between elements in coal [11,12]. The height at which elements are joined in the resulting dendrogram indicates the degree of similarity, with greater heights indicating less similarity. Hierarchical clustering was performed with the hclust() function in R, using the average-linkage method and Pearson correlation as the measure of dissimilarity. These methods have been shown to be robust when working with coal geochemistry data [11,12].

2.4. K-Means Clustering

K-means cluster analysis is a type of unsupervised machine learning algorithm used to identify underlying patterns in a data set and to partition data points into a series of clusters based on certain similarities by reducing the intra-cluster sum of squares. In this analysis, K-means was used to identify elemental patterns and chemical similarities between coal samples. The analysis was performed using the kmeans() function (stats package) in R. Data were scaled using the scale() function and the optimal number of clusters was determined using the elbow method with the fviz_nbclust() function (factoextra package). Coal samples were assigned to eight unique clusters. Effect sizes to determine relative enrichment between clusters were calculated by dividing the difference between the cluster mean and the full population mean by the standard deviation of the population.

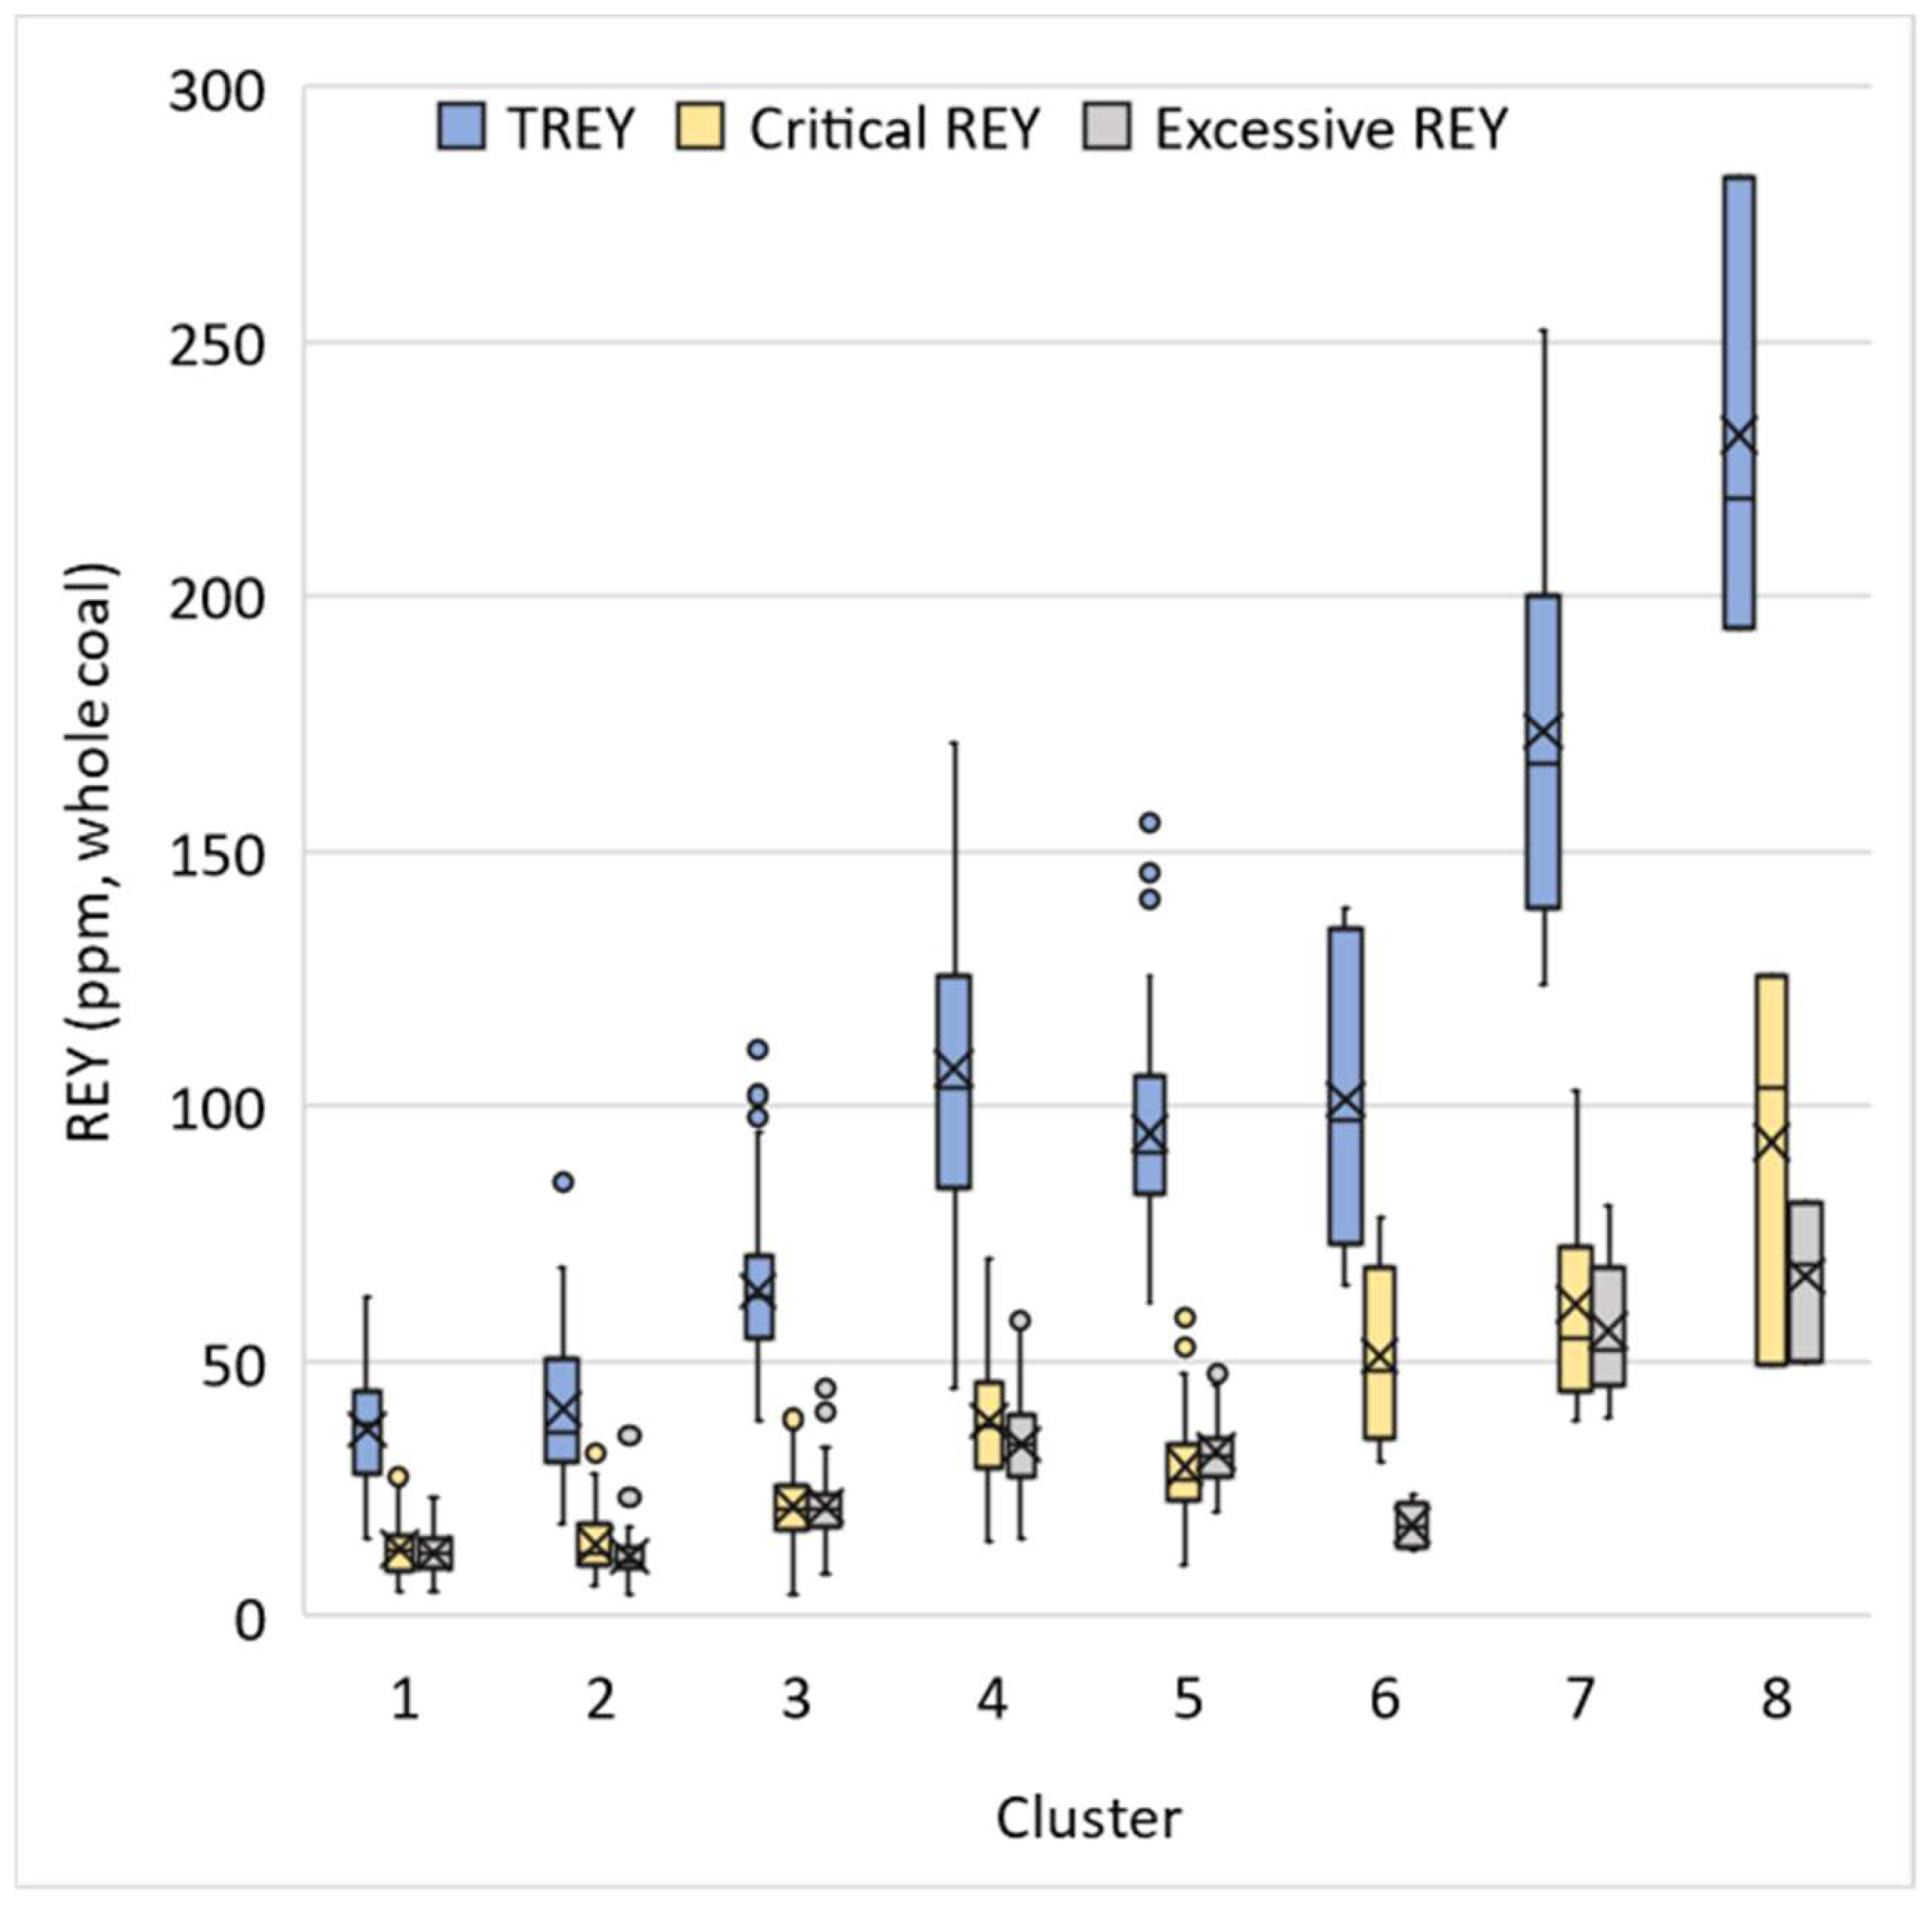
2.5. REY Economic Assessment

To help identify coal seams that can potentially serve as REY resources, a methodology proposed by Seredin and Dai [4] was used to evaluate each sample in the dataset. Ash-basis rare earth oxide (REO) concentrations for each sample were calculated using the formula (REY)2O3. Market outlook (Coutl) coefficients were calculated using ash-basis REY concentrations by dividing the ratio of critical REY to TREY by the ratio of excessive REY to TREY. Samples were designated as highly promising, promising, and unpromising based on the following criteria developed by Seredin and Dai [4]: highly promising if REO concentration is at least 1000 ppm and Coutl is greater than 2.4, promising if REO concentration is at least 1000 ppm and Coutl is between 0.7 and 2.4, and unpromising if REO concentration is less than 1000 ppm or Coutl is less than 0.7.

3. Results and Discussion

3.1. Pearson Correlation

Previous studies have established that positive correlations with ash yield generally indicate that an element has an inorganic association in coal, while negative correlations may indicate an organic association [10,31]. Calculating Pearson correlations between each element and progressively increasing ash yield produced a few notable trends. For most elements, correlation coefficients were either weakly positive or oscillated between weak positive and weak negative values throughout the full ash range, possibly due to mixed organic-inorganic relationships. However, Al and Si produced strong positive coefficients for the full range of ash values, indicating that these elements are inorganically associated and are the main ash-forming components in WV coals. This is in line with previous studies that have suggested clay minerals constitute the majority of mineral matter in most coal seams [32,33]. Two elements, Br and total sulfur (TS), produced negative correlation coefficients for the full range of ash yields. Although the correlations were relatively weak, results suggest these two elements may have organic associations in high and low ash coals. An organic association for Br is supported by a study on Pennsylvanian age coals from nearby eastern Kentucky [34]. Elements with weak correlations in low ash ranges but high correlations across higher ash samples include Ti, Cr, K, Li, Mg, Th, V, Ga, Pb, Sc, and the light rare earths Ce, La, and Nd. Weak correlation in the low ash range may indicate that the elements are more likely to have organic or mixed organic-inorganic associations in low ash samples but strong inorganic associations in higher ash samples. Figure 4 shows correlation coefficient trends for REY across the range of ash yields. The REY form noticeable groups, with Ce, La, and Nd trending together and representing the strongest correlations with ash yield. Tb trends by itself with the poorest correlation and the remaining REY trend in a loose group where Y and the heavy rare earths, Lu and Yb, have a stronger correlation than Sm and Eu.
Results of progressive ash yield correlation were expanded upon by matrix correlation, which provided insight into the specific inorganic associations of elements in coal. Matrix correlation results are shown in Figure 5. Unsurprisingly, Al and Si were strongly correlated with each other as well as with Ti and moderately with K. These elements are known to be primarily associated with clay minerals in coal [19,35,36]. Ti also strongly correlates with Nb (0.68), which is most commonly associated with zircon in coal [19]. The correlation between Nb and Zr in this analysis was 0.86, suggesting that zircon is a major mode of occurrence for Nb. However, Nb can also be present in TiO2 minerals (e.g., anatase/rutile or ilmenite), often finely dispersed among clays minerals [36,37]. Caesium does not correlate well with Si or Al, but has a moderately strong correlation with K. Previous studies have shown that Cs occurs in potassium-rich clay forming minerals such as feldspar and mica, as well as within illite and mixed-layer clays [19,38]. Likewise, Mg correlates moderately well with K, but not with Si and Al in this analysis. Magnesium can be present in illite and mixed-layer clays, but may also be present in chlorite and various carbonates (e.g., calcite, ankerite, and dolomite) or may have organic associations [19,39,40] Lithium, which is most commonly found in aluminosilicates in coal [19], has a strong to moderately strong correlation with Si, Al, and Ti in this analysis. Thorium and Cr have moderate correlations with Si and Ti and a strong correlation with each other. Thorium also has a moderate correlation with Sc and a strong correlation with Hf, Ce, and La. These elemental associations are in agreement with previous studies that have found Th in aluminosilicates, zircon, monazite, and xenotime in coal [19,41,42]. Compared to Th, Cr has slightly weaker correlations with Si, Ti, Hf, Ce, and La, but a stronger correlation with Sc. This may suggest that Cr and Th have some similar modes of occurrence, however published literature indicates that Cr is most commonly found in spinel-group minerals (e.g., chromite), aluminosilicates (e.g., Cr-bearing clays), and in association with organic matter [15,19,40,41,43]. Scandium has also most commonly been associated with aluminosilicates and organic matter, but can occur as a trace element in zircon and xenotime [19,44]. Weak correlations with Si and Al in this analysis suggest that aluminosilicates may not be a major mode of occurrence for Sc in WV coals.
Several elements in this analysis correlate with only one other element. For example, Fe and As correlate only with each other (correlation coefficient of 0.62). The dominant mode of occurrence in coal for both of these elements is the mineral pyrite, although they can also be present in other sulfides, aluminosilicates, carbonates, and in association with organic matter [19,39,40]. Zinc and Cd share a moderate correlation and are predominately associated with sphalerite in the literature, but they have also been found in pyrite and silicates in coal [19,39]. Moreover, Zn has also been found in the organic fraction of low-rank coals [19]. Cobalt and Ni also share a moderate correlation in this analysis. Both of these elements are known to have a variety of modes of occurrence in coal, but are primarily associated with sulfides, organic matter, and aluminosilicates [19]. Lead and Ag each have a moderate correlation with Cu. Copper is most commonly found in sulfides (e.g., pyrite and chalcopyrite) in coal, but may also occur in association with clay minerals and organic matter [19,40]. Silver has also been found in sulfide minerals and the organic fraction of coal, as well as in the native metal form [19]. Likewise, Pb is primarily associated with sulfides (e.g., pyrite and galena) and organics in coal, but can be present in numerous mineral phases including selenides (e.g., clausthalite), sulfates, carbonates, phosphates, and aluminosilicates [19]. Vanadium has a moderate correlation with Nd, but does not correlate with any other element. Vanadium is mainly associated with organic matter and aluminosilicates in coal [19,39]. Tantalum has a moderate correlation with Hf. Both of these elements are primarily associated with zircon in coal, although they have been identified in anatase, aluminosilicates, and (rarely) in association with organic matter [19]. Correlation between Hf, Th, and Ti does suggest possible associations with anatase and zircon. Beryllium has a moderate correlation with Y, but does not correlate with any other element. Modes of occurrence for beryllium are not well defined in the literature, but most studies have found either organic or silicate associations [19,39]. A very weak negative correlation with Si may indicate significant organic associations for Be in WV coals. Manganese has a moderate correlation with Mg and is most commonly found in carbonates including calcite, siderite, and ankerite, all of which have been identified in Appalachian Basin coals [19,37]. However, Mn has also been identified in silicates and in association with organic matter [19]. Strontium has a moderate correlation with Ca, but Ca also has a strong correlation with TS. All three of these elements can be introduced into a coal seam by circulating groundwater and TS and Ca are also connected to the original peat-forming plants [11,19]. Sulfur can be present in several forms in coal, but primarily occurs in sulfide minerals (e.g., pyrite) or in an organic form [19]. Organic S is thought to be the dominant form in low-S coals [19] like those used in this analysis. This is supported by a moderate negative correlation between TS and the major ash-forming elements, Si and Al. Like TS, Ca and Sr can have organic associations in coal and the three elements have also been identified in sulfate minerals, including gypsum [11,19]. Calcium and Sr are also commonly found in carbonate minerals and crandallite [19,45]. However, Sr can occur in a variety of other minerals including goyazite, celestine, barite, and aluminosilicates, while Ca has also been identified in apatite in coal [19,41,45,46,47,48].
Elements that do not correlate well with any other element used in this analysis include Na, B, Ba, Br, F, Ga, Ge, Hg, Mo, P, Sb, Se, U, W, and Zn. These elements likely have mixed organic/inorganic associations, are present in a multitude of inorganic phases, or are present in a very low, narrow range of concentrations.
The REY form noticeable groups in terms of correlation with each other and with other elements. The lightest REY, La and Ce, have a strong correlation with each other and Th and a moderate correlation with Sm, Eu, Cr, and Sc. Lanthanum and Ce, along with Sm, Eu, Sc, and Th have been identified in phosphate minerals (e.g., monazite, crandallite, and apatite), zircon, carbonates, and aluminosilicates [19,39,45,47]. Samarium and Eu have a moderate to strong correlation with all other REY, except Nd and Y, and a moderate correlation with Sc. As previously noted, these elements have been found accompanying other LREY in phosphates and other minerals. The heaviest REY, Yb and Lu, have a strong correlation with each other, a moderately strong correlation with Sm and Eu, and a moderate correlation with Sc. The HREY are commonly associated with phosphate minerals (e.g., xenotime), organic matter, and aluminosilicates [19,39,45,47]. Ytterbium has also been identified in pyrite cement in a Central Appalachian Basin coal seam underclay [45]. Previous studies have suggested that HREY are more likely to form stable complexes with organic matter or to be adsorbed to clay mineral surfaces than the LREY [4,19,21,47]. Ytterbium and Lu correlations with ash yield are slightly weaker than ash yield correlations for La and Ce, possibly suggesting more organic affinity for the HREY in WV coals. Interestingly, Nd and Y moderately correlate with each other, but do not correlate with any other REY. Nd also has a moderate correlation with V and Y has a moderate correlation with Be. These correlations could suggest that Nd and Y might be associated with organic matter or silicates, but it is unclear whether these relationships are real or if they are spurious correlations. Neodymium is generally assumed to have modes of occurrence similar to La and Ce and has been observed co-occurring with those elements in phosphate minerals (e.g., apatite and monazite) and aluminosilicates [39,45,47]. Yttrium has been observed in phosphate minerals (e.g., xenotime and crandallite) and zircon, but may also occur in association with organic matter and aluminosilicates [19,39,45,49]. Terbium has a moderate correlation with Sm and Eu but does not correlate with any other element. It has been detected in chalcopyrite in a Northern Appalachian Basin underclay, co-occurring with Dy and Er [47]. Published literature suggests that Tb has modes of occurrence similar to HREY [19,39].
Previous studies from within the Appalachian Basin have found REY associated with phosphate minerals, zircon, clay minerals, and organic matter [20,45,47,49,50]. Hower et al. [49,50] investigated the high-REY Fire Clay coal seam in eastern Kentucky, a seam that contains a volcanic-ash-fall tonstein. The authors identified REY in zircon, monazite, and crandallite [49,50]. Using particle size and density separations, Lin et al. [20] determined that REY had both organic and inorganic associations in a Central Appalachian Basin coal sample. REY-bearing minerals have also been directly observed within underclays associated with Appalachian Basin coal seams. Montross et al. [45] identified several REY-bearing phosphate minerals (e.g., apatite, monazite, and crandallite) in four coal seam underclay samples from WV. These minerals were present as discrete, detrital grains housed in the clay matrix and authigenic pore-filling minerals. Individual REY were detected as components of a clay coating on framboidal pyrite and in various types of cement. Yang et al. [47] also examined Appalachian Basin underclay samples. They found that REY primarily occurred within detrital phosphate minerals embedded in the clay matrix or as authigenic phosphates filling pore spaces. The pore-filling phosphates were presumed to have been formed during diagenesis or epigenetic infiltration events. However, baseline REY content was generally attributed to the original detrital input of REY-bearing minerals. The authors suggest that the post-depositional remobilization and redistribution of REY may also lead to a portion of the REY being adsorbed onto mineral surfaces [47]. REY concentration in coal seams is likely to be governed by similar processes. Detrital mineral sources remained similar throughout the Pennsylvanian subperiod, as source terrain and sediment distribution patterns remained relatively unchanged [51]. Therefore, the types of REY-bearing minerals initially introduced into the palaeomires should be the same as those contained in the underclays. However, the mechanisms controlling remobilization and redistribution of REY in coal would be influenced by differences in the depositional environment and the larger organic fraction within the resulting coal. Direct analytical methods should be applied to Appalachian coals in future studies to confirm individual REY modes of occurrence.

3.2. Hierarchical Clustering

An agglomerative hierarchical clustering algorithm was used to gain further insight into elemental relationships and modes of occurrence. The dendrogram shown in Figure 6 provides a visual representation of the degree of affinity between elements. At the highest level of the dendrogram the elements are split into two major clusters, one of which contains the REY (right side of diagram). All of the REY used in the analysis appear together in a subcluster, except for Nd and Y. This subcluster also contains Sc, which appears more closely related to the heaviest REY (Yb and Lu) than to the LREY, and U at the highest level of the subcluster, indicating less similarity. This subcluster of REY is part of a higher-level cluster containing Nb, Zr, Si, Al, Ti, Li, Th, Cr, and Hf, elements that are commonly associated with zircon, clay minerals, TiO2 minerals (e.g., anatase and rutile), and phosphate minerals including monazite and crandallite. Yttrium and Nd are part of a small subcluster that also contains V, Be, and Ga. The latter three elements are mainly associated with organic matter and silicates (clay minerals in the case of V and Ga) in coal [19]. However, although these elements are clustered together, they do not have a very high degree of similarity. The subcluster containing Y and Nd is also part of a higher-level cluster containing W, Ge, Sb, Br, Co, Ni, Pb, Ag, and Cu. Many of these elements can be found in a variety of minerals, including sulfides and aluminosilicates, but all have been shown to have at least some association with organic matter [19].
The major (non-REY containing) cluster on the left side of the dendrogram contains several subclusters. The first contains Cd, Zn, Fe, As, Hg, and Mo, all elements that are primarily associated with sulfide minerals in coal [19]. The second subcluster contains Ca, TS, Sr, Ba, B, and Na. Sulfur, B, Sr, and Ba have been used as indicators for the depositional environment of the coal forming peat (e.g., marine or freshwater influences) [19]. All of these elements have been identified in association with organic matter, but may also be present in a variety of minerals in coal [19]. Potassium, Mg, Cs, and Mn are also clustered together, although K, Mg, and Cs are more similar to each other than they are to Mn. The former three elements are most commonly found in aluminosilicates (e.g., illite, mixed-layer clays, feldspar, and mica), although Mg can also be present in carbonates and organic associations. Manganese has been identified in aluminosilicates as well, but is more common in carbonates, and sometimes organic matter [19].

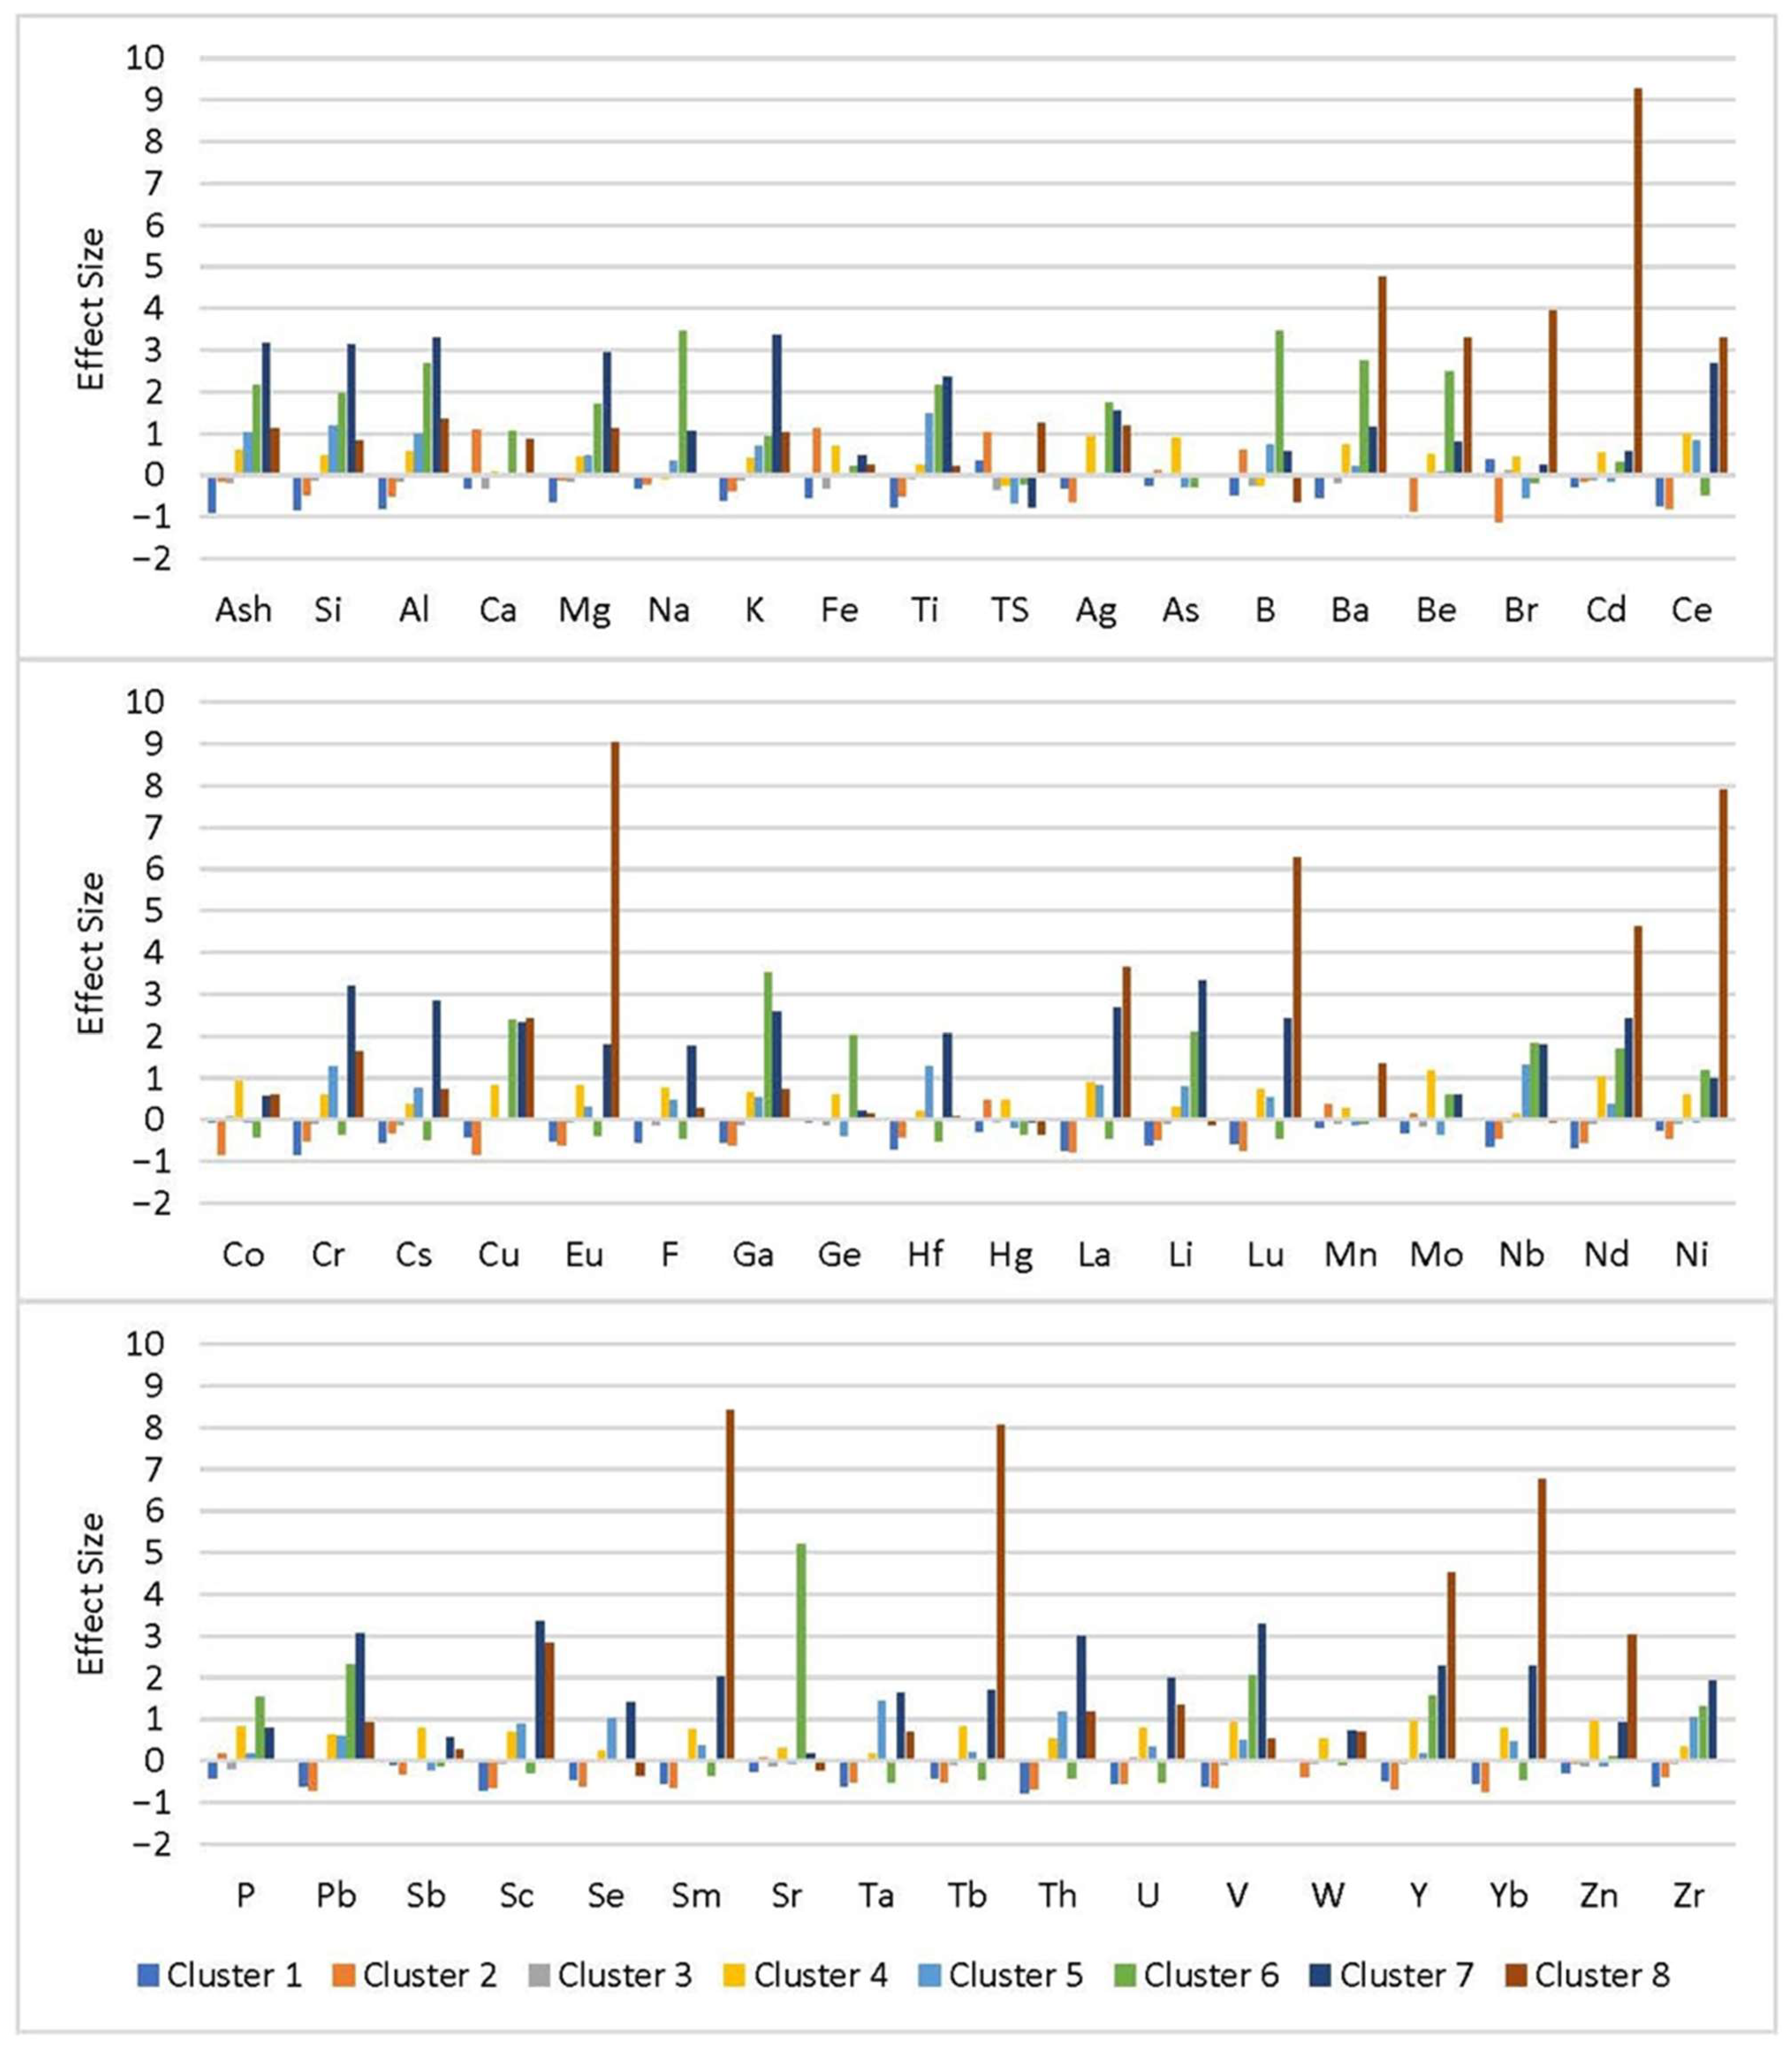
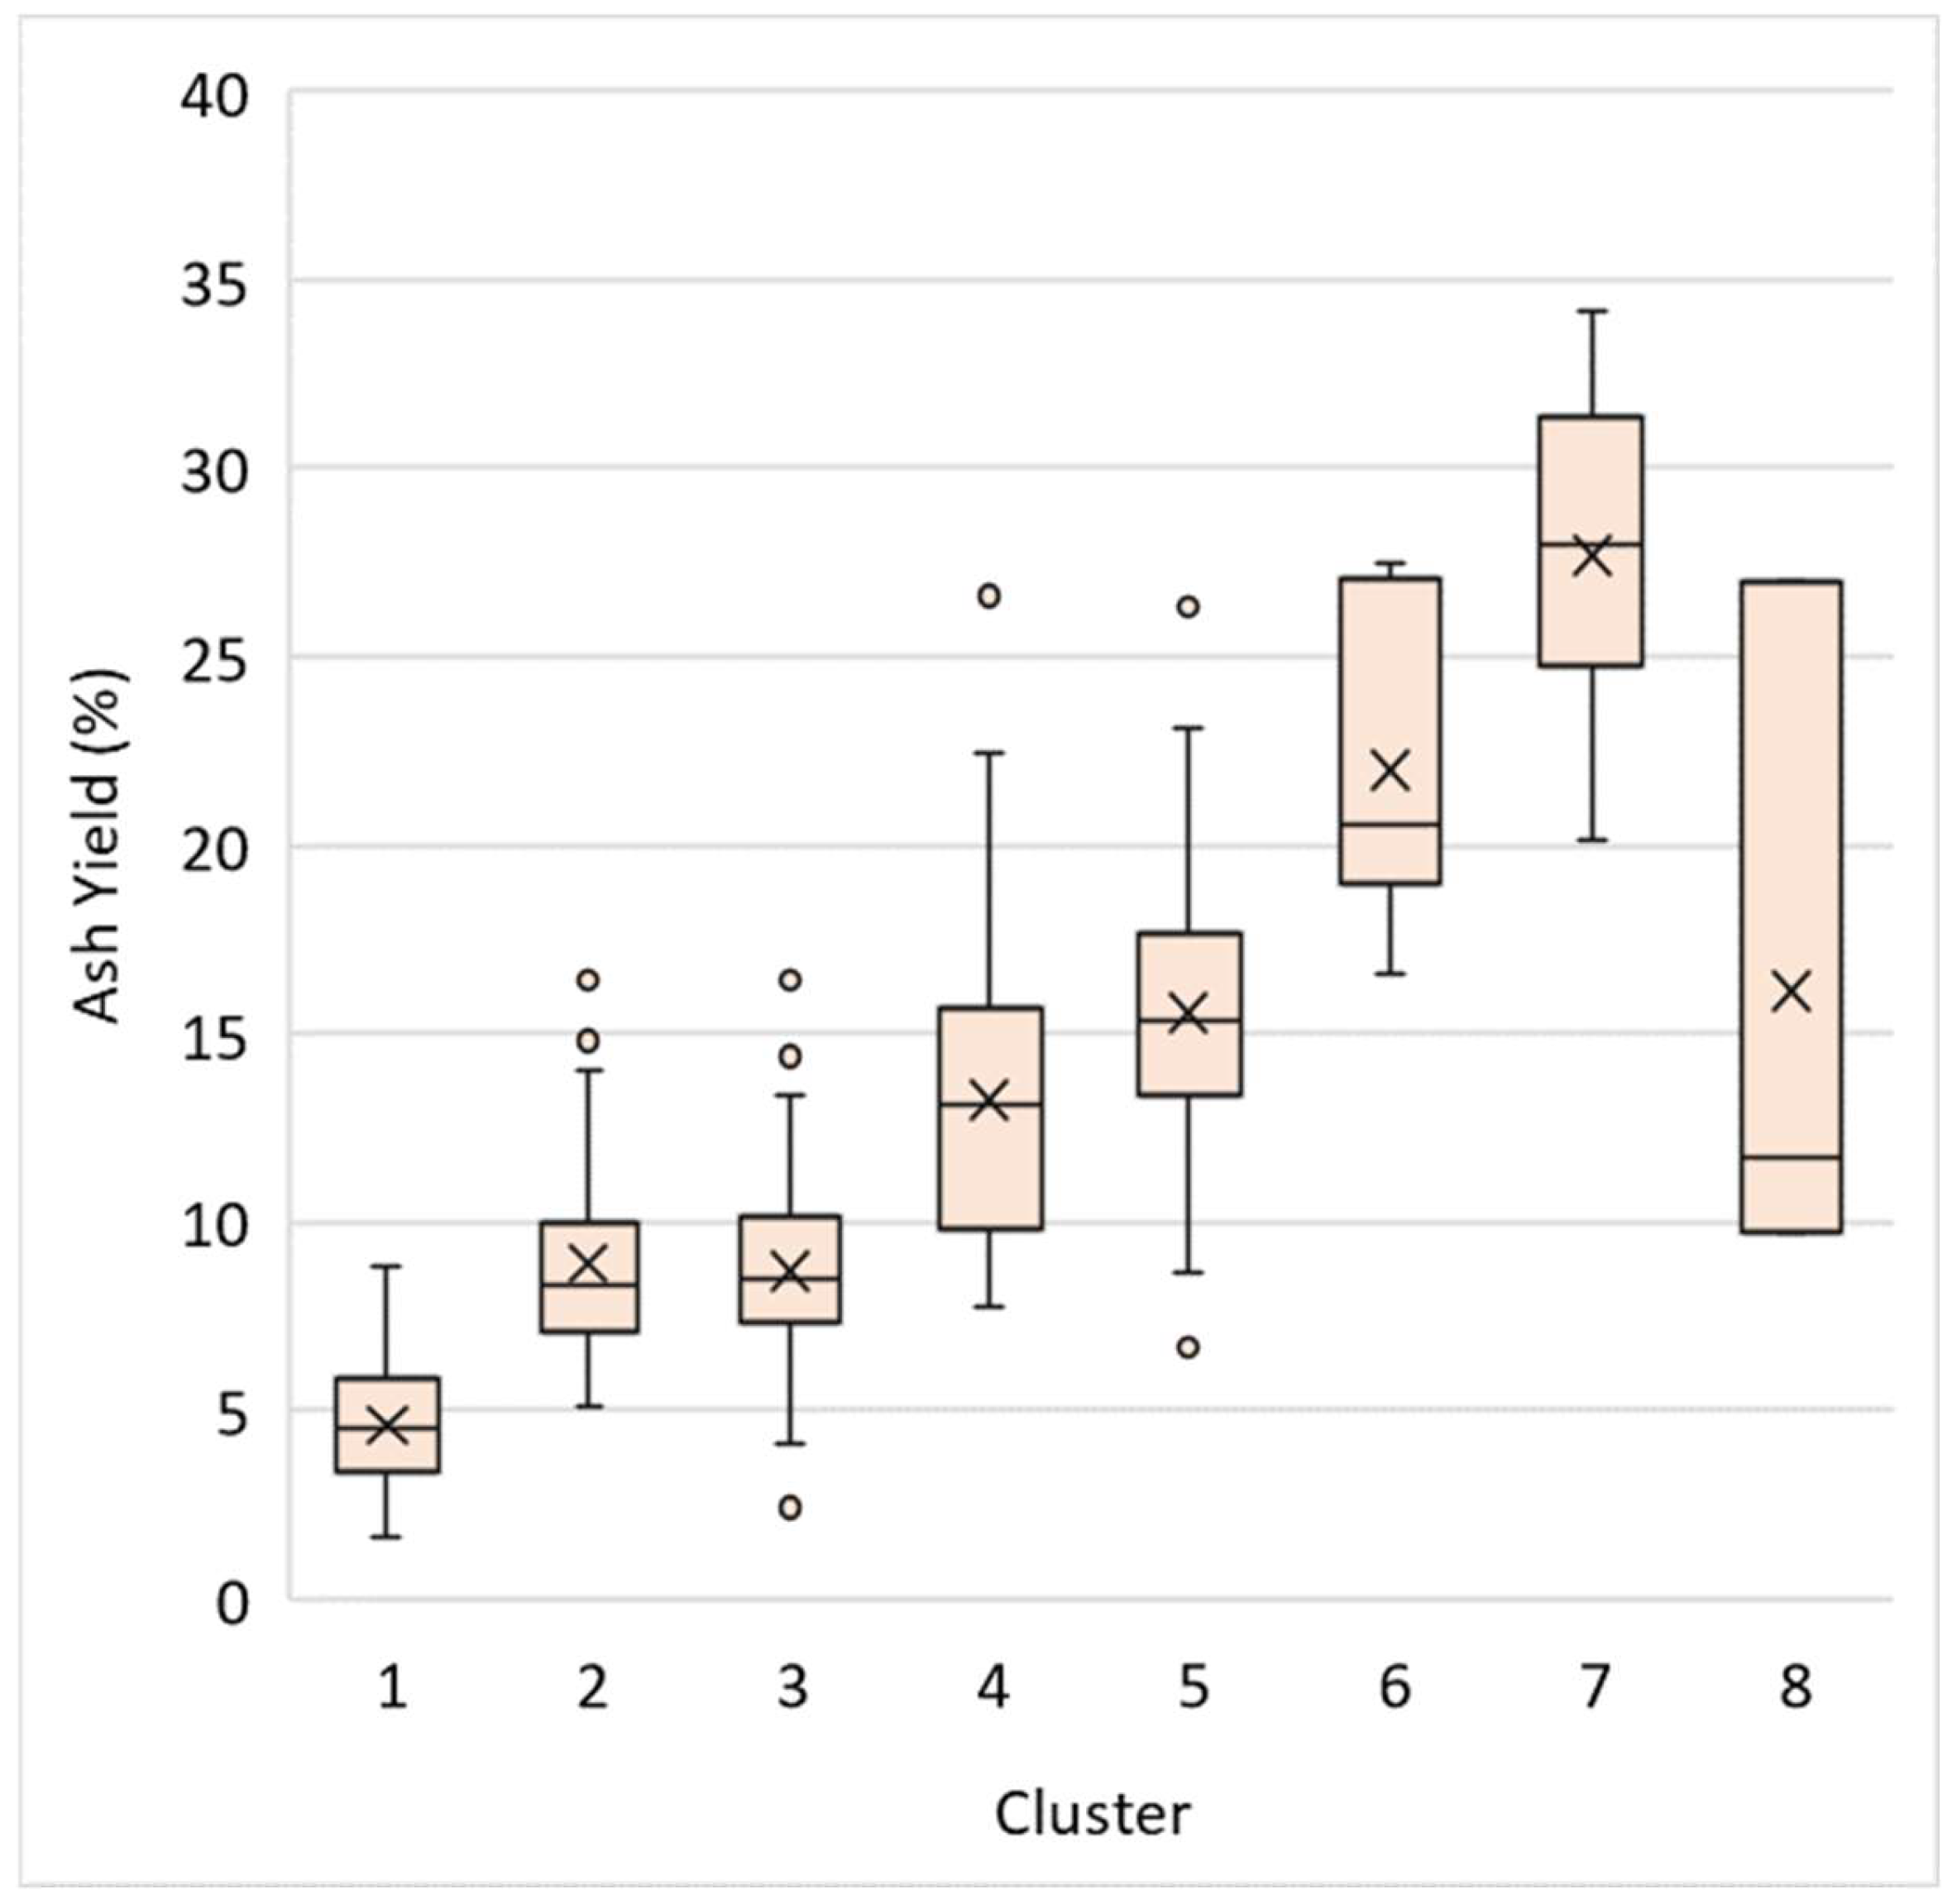
3.3. K-Means Clustering

K-means cluster analysis was used to assign coal samples to eight clusters based on geochemical patterns to identify samples that may have similar elemental modes of occurrence. These similarities may be due to common depositional conditions or the influence of similar post-depositional processes. The algorithm assigned 120, 65, 162, 45, 50, 6, 16, and 3 samples to Clusters 1 through 8, respectively. Figure 7 shows the relative enrichment (effect size) between clusters for each element used in the analysis. For most Clusters, Si and Al enrichment is proportional to enrichment in ash, except for Cluster 4 where the elements are more depleted than ash content, and Cluster 6, where Al is slightly more enriched than ash and Si. Enrichment patterns for the elements Mg, K, and Ti, which appear to be primarily associated with clay minerals in this analysis and in previous studies, also generally follow the same pattern as ash yield, Si, and Al. The enrichment pattern of Li mimics that of ash yield and the primary clay forming elements for all clusters except Cluster 8, where Li is slightly depleted while ash, Si, and Al are enriched. Likewise, the enrichment patterns of Cr, Cs, Sc, and Th mimic ash yield, for all clusters except Cluster 6, where those elements are depleted. Moreover, the enrichment patterns for many REY follow the general trend of ash yield across clusters, with some apparent exceptions. In Cluster 6, the elements Ce, Eu, La, Lu, Sm, Tb, and Yb are depleted even though the cluster is enriched in ash. In Cluster 2, REY are noticeably more depleted than ash, while in Cluster 8, REY are enriched far beyond the level of ash. Enrichment patterns for elements that do not have a significant association with the inorganic fraction are more complex. The trend for TS is contrary to ash in Clusters 1, 2, 4, 5, 6, and 7, indicating the presence of significant organic associations for sulfur. The trend for Br is contrary to ash in Clusters 1, 3, 5, and 6, again indicating the presence of organic associations in these clusters.
It is evident that samples from Clusters 2, 6, and 8 have influences that set them apart from the general elemental trends. Compared to other clusters, Cluster 6 is highly enriched in Na, B, Ba, Be, Ga, Ge, and Sr. Compared to other ash-enriched clusters, Cluster 6 is depleted in all of the rare earth elements except for Nd and Y. Enrichment in Na, Sr, and Ba suggest a seawater influence during the depositional or post-depositional periods. Sr and Ba have been shown to occur in certain coals as carbonate and sulfate minerals, including calcite, barite, celestine, and gypsum that can be of detrital, syngenetic, or epigenetic origin [19,39,41,48]. Cluster 6 is one of only three clusters in this analysis to show a relative enrichment in calcium, possibly indicating the presence of carbonates, which are usually authigenic in coal [19,39,51]. Calcium may also be present in LREE-bearing phosphate minerals including apatite and crandallite [45,46,47]. The six samples constituting Cluster 6 are high volatile bituminous coals from seams in the Kanawha Formation, located along the Kanawha River and its tributaries in the northwestern section of the Kanawha-New River Basin. It is known that this region is affected by saline brines of marine origin flowing upward under artesian pressure from Mississippian-age and older formations [52]. It is possible that the coal samples in Cluster 6 were influenced by these brines post-deposition. The Mississippian brines, in particular, are known to be highly enriched in Sr, which would explain the excessive relative enrichment in this cluster [53]. Although accessory B-bearing minerals (e.g., tourmaline or mica), illite, or intra-basinal brines could elevate B concentrations [15,54,55,56,57], Goodarzi and Swaine [58] suggested that B concentrations between 50–110 ppm in coal indicate a mildly-brackish water influence during or shortly after deposition. The B content in the Cluster 6 samples ranges from 45–226 ppm, possibly suggesting the influence of brackish groundwater. Although B content is sometimes used as an indicator of depositional conditions, an influx of seawater-derived brines after deposition could introduce a significant source of the element into the coal seam. Further, in seawater and related precipitates, Y/Ho and Zr/Hf ratios are high, with seawater ratios ranging from 44 to 74 and 85 to 130, respectively. Precipitated minerals contain similar but usually slightly lower ratios [59]. Holmium measurements for Cluster 6 are all below the detection limit, so they cannot be used to assess Y/Ho ratios, but the Zr/Hf ratios range from 53.2 to 138.6, which is further evidence of a seawater influence. This may explain why Y is one of only two REY enriched in this cluster since an influx of brines with anomalous Y concentrations may have mobilized and leached the other REY. In contrast, excess Y could have been incorporated into mineral precipitates or adsorbed onto mineral or organic matter. A post-depositional brine influence is also supported by Mastalerz and Drobniak [60], who suggested that in Ga-enriched coal, the element may be adsorbed onto coal surfaces within pore spaces during the post-depositional flow of Ga-enriched fluids.
Cluster 8 is highly enriched in REY compared to other clusters. Dai et al. [18] indicate that in high-REY coal, the elements are often hosted within aluminum-phosphate-sulfate minerals of the alunite supergroup. These minerals are formed by the chemical weathering of sulfides [61]. Enrichment in TS, Ni, and Cd in Cluster 8 indicates the presence of sulfide minerals [10]. As sulfides are oxidized and dissolved in an aqueous solution during coalification or post-coalification weathering, they produce acidic groundwater that can dissolve additional mineral species and mobilize REY [61]. Water and sediments impacted by acidic coal mine waters often exhibit elevated REY concentrations and, when normalized to shale or the upper continental crust (UCC), present a concave pattern indicating relative enrichment in the middle REY [22,62]. UCC normalized Tb/La and Lu/Tb ratios in Cluster 8 range from 1.88 to 5.98 and 0.52 to 0.72, respectively, signifying medium REY enrichment. It appears likely that the Cluster 8 samples were impacted by acid mine waters. This is supported by significant enrichment in elements commonly associated with Appalachian coal mine drainage, including Mn, Ni, Cd, Zn, and TS. REY would have been transported within the fluid, and precipitated from solution, adsorbed onto clay minerals or organic material, or trapped within pore spaces in the Cluster 8 coal samples [63,64]. The REY are enriched far beyond ash content, suggesting that they may have some organic association in Cluster 8 samples. However, it is difficult to draw strong conclusions about this cluster because it only contains 3 samples.
Cluster 2 is depleted in Si, Al, and other clay-associated elements but has an average ash yield close to the population mean. Enrichment in Ca may indicate the presence of calcium carbonates, while Fe enrichment most likely indicates the presence of pyrite or possibly siderite [19,51]. These authigenic minerals appear to make up a significant portion of the mineral matter in Cluster 2 samples. About 85% of samples in this group come from the Monongahela formation, which is known to contain abundant lacustrine carbonates, including micrites interbedded with argillaceous limestone and calcareous shale [65]. Since calcium carbonates in coal are not typically enriched in REY [51], a lack of detrital REY-bearing minerals in the original peat mire probably accounts for the relatively depleted status of these elements. Calcium in Appalachian coal is thought to be primarily sourced from groundwater [51], so it is possible that some of the existing REY leached out of the coal bed. This may explain why some of the REY in this cluster are slightly more depleted than those in Cluster 1, even though Cluster 1 is more depleted in ash.
Clusters 1 and 3 are the largest clusters and have elemental enrichment patterns that appear to be largely controlled by the ash, or inorganic, content of the coal samples. Cluster 1 is the most depleted in ash, Si, Al, and clay-associated elements, K, Ti, Cr, Cs, Li, and Sc. It is also depleted in other elements most commonly associated with the inorganic fraction of coal, including Ca, Fe, Ga, Th, V, Nb, Hf, Ta, and Zr, but is slightly enriched in TS and Br, which supports a high organic content in these samples. REY are depleted in this cluster due to the low inorganic content since mineral matter is the original primary source of REY in coal. Cluster 3 has an ash yield range similar to that of Cluster 2, but is slightly depleted in Ca, Fe, and TS. Silicon and Al contents are close to the population means and proportional to ash enrichment, suggesting that clay minerals likely make up a significant portion of the inorganic fraction. The average concentration of most elements in this cluster, including REY, are also close to the population means and proportional to ash yield.
Cluster 4 is the only cluster with an effect size greater than 1 for Mo and is the most enriched in As, both of which are most often associated with sulfide minerals and organic matter in coal [19,40]. The most common sulfide association for As is pyrite, where it can substitute for S22– or, in some cases, for Fe [19]. In the present analysis, the correlation between As and Fe in Cluster 4 samples is 0.66, indicating some likely association with pyrite. The correlation between Mo and Fe, however, is very poor. Finkelman et al. [39] suggested that Mo may have a variety of associations in coal, including sulfides, silicates, and organics. Molybdenum is easily mobilized and redistributed due to high solubility even in low-oxygen conditions, resulting in highly concentrated subsurface deposits [66]. A study by Diehl et al. [67] found that most As in Appalachian coals is found in epigenetic pyrite, and enrichment is associated with late-stage precipitation from hydrothermal fluids [67]. In addition to mobilizing Mo, hydrothermal fluids can also be responsible for REY mobilization and redistribution [4]. Most of the REY in Cluster 4 are enriched to a slightly higher degree than ash yield, which could potentially be explained by a hydrothermal influence. The cluster is also enriched in P, but no clear correlation exists with REY. If hydrothermal processes were at play, the REY may have multiple modes of occurrence in this cluster, including organic and inorganic.
Cluster 5 has a higher average ash yield and is more enriched in most clay-associated elements than Cluster 4 but is less enriched in REY. Additionally, it is also more depleted in sulfide-related elements, including Fe, TS, Cd, Cu, Co, Ni, As, and Sb. However, it is the second most Se-enriched cluster. According to the West Virginia Geologic and Economic Survey, the highest Se concentrations in WV are present in coals of the Allegheny and upper Kanawha formations, particularly in the south-central part of the state [68]. Seventy-eight percent of samples in Cluster 5 come from these formations. A portion of Se in these samples may exist in the form of lead selenides, as the correlation between Pb and Se is 0.65. Lead selenides, such as clausthalite, are a common trace mineral in Appalachian Basin coal and have been identified within partings and filling organic matter pore space in WV samples [37]. However, some Se is likely to be directly bound or adsorbed to organics and could also occur in sulfide minerals [37,69]. Yudovich & Ketris [69] proposed two types of Se accumulation in coal: a mostly syngenetic accumulation of Se in high sulfur coals under reducing conditions or mostly epigenetic accumulation under the influence of oxidized, Se-rich waters. The coals of Cluster 5 are low-S, with TS values ranging from 0.136 to 1.87 ppm. An influx of oxidized water and subsequent leaching could explain enrichment in Se and depletion of sulfide-related elements. At low temperatures, selenides are more stable than sulfides in oxidizing conditions and are a common feature of low-temperature hydrothermal systems [70]. Oxidized fluid flow may also partially explain the REY distribution in Cluster 5. Cerium and La are more enriched than the other REY used in the analysis. Ce3+ can be oxidized to Ce4+, leading to an accumulation of Ce in oxidized zones, while the remaining REY are leached to new accumulation zones [71]. However, this does not explain why La is enriched similarly to Ce.
Cluster 7 is also enriched in Se, but unlike Cluster 5, it is also enriched in some common sulfide-related elements, including Fe, Cd, Cu, Co, Ni, Sb, and Zn. However, TS is depleted. Cluster 7 is also notable because it is highly enriched in K relative to the other clusters. As the most ash-enriched group, samples would contain a significant amount of clay minerals. Closer inspection reveals that the high cluster mean for K is largely driven by the stratigraphically older samples (lower to lower-middle Pennsylvanian). However, K concentrations for all samples in the cluster are within the top 7% of values for the entire WV data set. A mineralogical study of underclays associated with central Appalachian coal seams found that illite is more common and well-crystallized in lower and lower-middle Pennsylvanian age underclays than in stratigraphically younger clays. However, poorly-crystallized illite was found in a few samples from younger formations, including the Allegheny, which is also represented in Cluster 7. The authors concluded that illite in the lower to lower-middle Pennsylvanian underclays primarily represents the original sediments, with little to no alteration. In contrast, the younger underclays likely experienced in-situ alteration by post-depositional acid leaching during peat accumulation [25]. High concentrations of illite in Cluster 7 samples would explain enrichment in K, as well as the relatively high enrichment in Mg and Cs, as these elements are readily adsorbed onto the surface of or incorporated into the molecular structure of illite [19,72]. Potassium-rich clay could also serve as a host of Cr, Cd, Cu, Co, Ni, Pb, and Zn in this cluster of samples. Previous research has shown that heavy metal ions can be adsorbed onto alkaline clay mineral surfaces or, in some cases, bound within the clay minerals [19,73]. Like Cluster 5, samples in Cluster 7 may have experienced an influx of oxidizing, Se-rich waters. But unlike Cluster 5, there is no correlation between Pb and Se. Instead, Se may be adsorbed to the large clay fraction, as Se has been shown to exist in a sorbed selenate state in oxidized coals [69]. Furthermore, Se may also be associated with organic matter, sulfides, or selenides [19,37,69]. REY enrichment in Cluster 7 generally appears proportional to enrichment in ash. Zircon is a potential host of Y in this cluster, as the correlation coefficient for Zr and Y is 0.68.
Ash yield, or the inorganic content of coals, plays a role in determining the REY concentration of samples. It is generally assumed that TREY concentration should correlate well with ash yield [33]. This assumption proves to be accurate when performing correlation with the WV dataset as a whole. However, K-means cluster analysis identified groups of samples that did not necessarily follow this trend. As shown in Figure 8, Clusters 2 and 3 have similar ranges of ash yield, but they have different ranges of TREY concentration (Figure 9). This is due to differences in the specific type of mineral matter present in these samples. Cluster 2 appears to be dominated by authigenic minerals like carbonates, while Cluster 3 likely had a more significant detrital input, which allowed allogenic REY-bearing minerals to accumulate. Likewise, Cluster 5 samples are generally higher in ash than Cluster 4, but Cluster 4 samples are more enriched in TREY. These results indicate that the relationship between REY and ash yield can vary due to differences in depositional environments and post-depositional processes within a coal basin.

3.4. Economic Assessment of REY in WV Coals

In many cases, higher ash coal samples have higher whole coal REY concentrations than lower ash samples. But, when REY concentration is considered on an ash basis, the opposite is often true- high ash coals can end up with lower concentrations than their low ash counterparts. Therefore, when assessing the economic viability of coal as a source of REY, it is crucial to consider the type of coal product being used. If REY are being extracted directly from whole coal, it is evident that the most valuable coals would be those with the highest in-situ REY content. Additionally, materials co-produced during coal mining and use, such as overburden rocks, refuse, and underclays, are often enriched in REY relative to the associated coal seam [74], so coals with the highest whole coal REY concentration would likely also have associated refuse containing high REY concentrations. However, if coal ash is to be used as a raw material for extracting REY, one needs to identify coals with the highest ash basis REY concentrations. Seredin and Dai [4] developed a method to assess the economic viability of coal using the ash-basis REO sum and market outlook coefficients (Coutl) based on the ratio of critical to excessive REY. To identify economically promising samples, they proposed a total REO cutoff of 1000 ppm and a Coutl of >0.7.
Coal ash is a promising resource for REY because they are non-volatile elements that become concentrated in ash during coal combustion, and vast quantities of ash are generated as a byproduct of electricity generation. In 2019 alone, the US produced 29,319,239 short tons of fly ash and 9,150,680 short tons of bottom ash [75,76], meaning coal ash is an abundant potential resource. Market outlook coefficients for WV COALQUAL samples ranged from 0.12 to 4.03, and total ash-basis REO concentration ranged from 317.0 ppm to 2825.01 ppm. Using the criteria established by Seredin and Dai [4], 68 samples fell in the promising range and 3 in the highly promising range. However, for the purposes of this discussion, all 71 samples will be referred to as promising. These samples represent 12.5% of the entire WV data set. The samples were sourced from 30 different coal seams (Table S1), almost entirely located within the Central Appalachian Basin in the southern half of the state (Figure 10). Based on the proportion of promising to unpromising samples, lower to lower-middle Pennsylvanian coals appear to be the most promising (Figure 11). In particular, the New River formation had the largest proportion of promising samples (28.10%), followed by the Pocahontas formation (20.75%), and the Kanawha formation (9.65%). However, the COALQUAL sample distribution is skewed toward stratigraphically older coal seams in the southern part of the state. While this may have resulted in a less accurate economic viability assessment for stratigraphically younger coals in northern WV, these coals are not mined as intensively as those in southern WV.
The promising samples are split between four of the eight K-means clusters. Cluster 1 has 31 promising samples, followed by Cluster 3 with 20 promising samples, Cluster 4 with 12 samples, and Cluster 8 with 2 samples. The remaining 6 promising samples were not used during cluster analysis due to a high proportion of missing values for various non-REY elements. Although Clusters 1 and 3 have relatively low whole coal TREY, they are low in ash, so the REY are not diluted by an abundance of other inorganic materials when converted to an ash basis concentration. 99% of Cluster 1 samples and 87% of Cluster 3 samples come from coal seams in the New River, Pocahontas, or Kanawha formations. REY enrichment in these clusters is generally proportional to inorganic content and does not appear to be greatly affected by post-depositional processes. About 89% of samples in Cluster 4 also come from the New River, Pocahontas, and Kanawha formations. Hydrothermal fluids may have enhanced REY enrichment in these samples. Although Clusters 1 and 3 have a higher total number of promising samples, Cluster 4 has a higher proportion of samples that are considered promising (27%, compared to 26% and 12% for Clusters 1 and 3). Cluster 8 has the highest proportion of promising samples (about 67%), but with only 3 total samples, the cluster itself is anomalous.
Although Seredin and Dai [4] set the ash-basis REO cutoff grade at 1000 ppm, they suggested that the cutoff could be reduced to 800–900 ppm in coal seams greater than 5 m thick. It can be argued that the cutoff grade could also be reduced for other reasons, including advances in REY extraction efficiency and the use of coal seams already being mined for electricity generation, resulting in reduced costs associated with acquiring the REY. If REO cutoff grade were reduced to 800 ppm in this analysis, it would increase the number of promising samples from 71 to 181 (about 31.8% of total WV samples). Future research should focus on assessing the economic implications of new REY extraction technologies and utilizing existing coal ash deposits or coal seams currently mined for power generation to determine whether potential cost reductions would justify lowering the REO cutoff grade.
The economic assessment methodology can also be applied to evaluate samples on a whole coal basis using an REO cut-off of 300 ppm, the concentration currently considered viable by the US Department of Energy [77]. Using this cutoff, the WV COALQUAL data set yields only 1 sample in the promising range- a Cluster 8 sample from the New River formation with an REO concentration of 320.05 ppm. Two other samples have REO concentrations greater than 270 ppm and Coutl values in the promising range. Both of these samples are from Cluster 7 and are located in the New River and “New River-Kanawha” formations. Cluster 7 samples have the highest range of ash yields and may host some of their REY in zircon.
Although Cluster 6 did not yield any promising samples, it is interesting that this cluster has the highest Coutl values, ranging from 2.40 to 4.03. This is due to the fact that Nd and Y, both critical REY, are relatively enriched while the remaining REY are depleted. These coals and others along the Kanawha River and tributaries may be worth investigating as a source of Nd and Y, since excessive REY and the radioactive elements Th and U are present in relatively low proportions.

4. Conclusions

The results of Pearson correlation and K-means cluster analysis suggest that clay minerals dominate the inorganic fraction of most WV COALQUAL samples and that REY concentrations are generally proportional to inorganic content. However, in samples that appear to be dominated by authigenic minerals, such as calcium carbonates, REY are more depleted than clay-dominated samples with similar ash yields.
Based on published literature and results of matrix correlation and hierarchical clustering, REY in WV coals are likely to be associated with phosphate minerals (e.g., monazite, xenotime, and crandallite), zircon, and possibly aluminosilicates. Yttrium and Nd may have modes of occurrence that differ from the remaining REY, possibly including organic affiliations.
An ash basis economic assessment found 71 economically promising samples in the WV data set. The majority of promising samples came from coal seams in the Kanawha, New River, and Pocahontas formations in the Central Appalachian Basin.
While statistics are a standard indirect method to assess elemental modes of occurrence, there are limitations to this type of analysis. Coal geochemical data are compositional in nature and can produce misleading results when traditional statistical methods (e.g., correlation or hierarchical clustering) relying on Euclidean geometry are applied [12,30]. This problem can be overcome by first transforming the coal chemistry data using log-ratio transformation techniques including symmetric pivot coordinates, which are used in this study [12,30]. Further, statistical methods can only provide information about possible mineral phase associations (e.g., sulfides or aluminosilicates) and cannot be used to discern an element’s presence within a specific mineral (e.g., pyrite or calcite) [19]. Elements in coal can have unexpected mineral associations (e.g., Pb and Se occurring in clausthalite rather than sulfides) and can be present in very different concentrations even within the same mineral (e.g., As being enriched in epigenetic pyrite relative to syngenetic pyrite) [19,67]. Mixed organic-inorganic associations can also complicate results and the degree of these associations can be influenced by coal rank or ash yield [10,39]. Therefore, statistical results must be interpreted using careful consideration of geochemical principles and can only be verified using direct analytical methods including transmission electron microscopy (TEM), scanning electron microscopy—energy dispersive X-ray spectroscopy (SEM-EDS), and X-ray diffraction (XRD).
The COALQUAL database is comprised of full-bed coal samples, that do not reflect vertical heterogeneity. These samples were collected at different times, for various purposes, and were analyzed using methods with varying degrees of precision and accuracy. Only broad inferences regarding bulk samples can be made during statistical analysis of COALQUAL data. The WV data set is biased against stratigraphically younger samples, so these coal seams are underrepresented in the analyses. However, the COALQUAL database is the largest publicly-accessible source of coal chemistry data in WV and was leveraged in this study to obtain insight into possible REY modes of occurrence and identify coals that may serve as promising REY resources.
To fully understand the potential of WV coals as a resource for REY, samples should be investigated through direct methods such as TEM, SEM-EDS, and XRD, to accurately quantify REY content and modes of occurrence and to characterize the vertical variations within samples. Waste products related to the mining and utilization of these coals, including coal ash and abandoned mine discharge, should be located, cataloged, and analyzed to identify existing refuse that may serve as valuable REY resources.

Supplementary Materials

The following supporting information can be downloaded at: https://www.mdpi.com/article/10.3390/min12081060/s1, Table S1: Coal seams with economically promising samples (ash basis).

Author Contributions

Conceptualization, R.Y., S.S.; Data curation, R.Y.; Formal analysis, R.Y.; Investigation, R.Y.; Methodology, R.Y., S.S. and A.E.M.; Project administration, R.Y., S.S.; Resources, R.Y.; Software, R.Y.; Supervision, S.S.; Validation, R.Y.; Visualization, R.Y.; Writing—original draft, R.Y.; Writing—review & editing, R.Y., S.S. and A.E.M. All authors have read and agreed to the published version of the manuscript.

Funding

This research received no external funding.

Data Availability Statement

Publicly available datasets were analyzed in this study. This data can be found here: https://ncrdspublic.er.usgs.gov/coalqual/, accessed on 24 February 2021.

Acknowledgments

This research was supported by the IsoBioGem Laboratory at West Virginia University. We would like to thank Jim Britton and Richard Binns at the West Virginia Geological and Economic Survey for providing insight on West Virginia coals and corresponding data sets.

Conflicts of Interest

The authors declare no conflict of interest.

References

  1. Williams-Jones, A.E.; Vasyukova, O.V. The Economic Geology of Scandium, the Runt of the Rare Earth Element Litter. Econ. Geol. Bull. Soc. Econ. Geol. 2018, 113, 973–988. [Google Scholar] [CrossRef]
  2. Dai, S.; Finkelman, R.B. Coal as a promising source of critical elements: Progress and future prospects. Int. J. Coal Geol. 2018, 186, 155–164. [Google Scholar] [CrossRef]
  3. US Environmental Protection Agency. Rare Earth Elements: A Review of Production, Processing, Recycling, and Associated Environmental Issues; Engineering Technical Support Center, Land Remediation and Pollution Control Division, National Risk Management Research Laboratory, Office of Research and Development: Cincinnati, OH, USA, 2012. [Google Scholar]
  4. Seredin, V.V.; Dai, S. Coal deposits as potential alternative sources for lanthanides and yttrium. Int. J. Coal Geol. 2012, 94, 67–93. [Google Scholar] [CrossRef]
  5. Franus, W.; Wiatros-Motyka, M.M.; Wdowin, M. Coal fly ash as a resource for rare earth elements. Environ. Sci. Pollut. Res. 2015, 22, 9464–9474. [Google Scholar] [CrossRef]
  6. Balaram, V. Rare earth elements: A review of applications, occurrence, exploration, analysis, recycling, and environmental impact. Geosci. Front. 2019, 10, 1285–1303. [Google Scholar] [CrossRef]
  7. Ayora, C.; Macías, F.; Torres, E.; Lozano, A.; Carrero, S.; Nieto, J.M.; Pérez-López, R.; Fernández-Martínez, A.; Castillo-Michel, H. Recovery of Rare Earth Elements and Yttrium from Passive-Remediation Systems of Acid Mine Drainage. Environ. Sci. Technol. 2016, 50, 8255–8262. [Google Scholar] [CrossRef]
  8. Vass, C.R.; Noble, A.; Ziemkiewicz, P.F. The Occurrence and Concentration of Rare Earth Elements in Acid Mine Drainage and Treatment Byproducts. Part 2: Regional Survey of Northern and Central Appalachian Coal Basins. Min. Met. Explor. 2019, 36, 917–929. [Google Scholar] [CrossRef]
  9. Eskanazy, G.; Finkelman, R.B.; Chattarjee, S. Some considerations concerning the use of correlation coefficients and cluster analysis in interpreting coal geochemistry data. Int. J. Coal Geol. 2010, 83, 491–493. [Google Scholar] [CrossRef]
  10. Xu, N.; Finkelman, R.B.; Xu, C.; Dai, S. What do coal geochemistry statistics really mean? Fuel 2020, 267, 117084. [Google Scholar] [CrossRef]
  11. Eminagaoglu, M.; Oskay, R.G.; Karayigit, A.I. Evaluation of Elemental Affinities in Coal Using Agglomerative Hierarchical Clustering Algorithm: A Case Study in a Thick and Mineable Coal Seam (KM2) from Soma Basin (W. Turkey). Int. J. Coal Geol. 2022, 259, 104045. [Google Scholar] [CrossRef]
  12. Xu, N.; Xu, C.; Finkelman, R.B.; Engle, M.A.; Li, Q.; Peng, M.; He, L.; Huang, B.; Yang, Y. Coal Elemental (Compositional) Data Analysis with Hierarchical Clustering Algorithms. Int. J. Coal Geol. 2022, 249, 103892. [Google Scholar] [CrossRef]
  13. Crowley, S.S.; Stanton, R.W.; Ryer, T.A. The effects of volcanic ash on the maceral and chemical composition of the C coal bed, Emery Coal Field, Utah. Org. Geochem. 1989, 14, 315–331. [Google Scholar] [CrossRef]
  14. Fiket, Ž.; Medunić, G.; Turk, M.F.; Kniewald, G. Rare Earth Elements in Superhigh-Organic-Sulfur Raša Coal Ash (Croatia). Int. J. Coal Geol. 2018, 194, 1–10. [Google Scholar] [CrossRef]
  15. Karayigit, A.I.; Yerin, Ü.O.; Oskay, R.G.; Bulut, Y.; Córdoba, P. Enrichment and Distribution of Elements in the Middle Miocene Coal Seams in the Orhaneli Coalfield (NW Turkey). Int. J. Coal Geol. 2021, 247, 103854. [Google Scholar] [CrossRef]
  16. Mastalerz, M. Rare Earth Elements and Yttrium in Pennsylvanian Coals and Shales in the Eastern Part of the Illinois Basin. Int. J. Coal Geol. 2020, 20, 103620. [Google Scholar] [CrossRef]
  17. Arbuzov, S.I.; Spears, D.A.; Vergunov, A.V.; Ilenok, S.S.; Mezhibor, A.M.; Ivanov, V.P.; Zarubina, N.A. Geochemistry, Mineralogy and Genesis of Rare Metal (Nb-Ta-Zr-Hf-Y-REE-Ga) Coals of the Seam XI in the South of Kuznetsk Basin, Russia. Ore Geol. Rev. 2019, 113, 103073. [Google Scholar] [CrossRef]
  18. Dai, S.; Hower, J.C.; Finkelman, R.B.; Graham, I.T.; French, D.; Ward, C.R.; Eskenazy, G.; Wei, Q.; Zhao, L. Organic Associations of Non-Mineral Elements in Coal: A Review. Int. J. Coal Geol. 2020, 218, 103347. [Google Scholar] [CrossRef]
  19. Dai, S.; Finkelman, R.B.; French, D.; Hower, J.C.; Graham, I.T.; Zhao, F. Modes of Occurrence of Elements in Coal: A Critical Evaluation. Earth-Sci. Rev. 2021, 222, 103815. [Google Scholar] [CrossRef]
  20. Lin, R.; Bank, T.L.; Roth, E.A.; Granite, E.J.; Soong, Y. Organic and Inorganic Associations of Rare Earth Elements in Central Appalachian Coal. Int. J. Coal Geol. 2017, 179, 295–301. [Google Scholar] [CrossRef]
  21. Laudal, D.A.; Benson, S.A.; Addleman, R.S.; Palo, D. Leaching Behavior of Rare Earth Elements in Fort Union Lignite Coals of North America. Int. J. Coal Geol. 2018, 191, 112–124. [Google Scholar] [CrossRef]
  22. Fernández-Caliani, J.C.; Grantcharova, M.M. Enrichment and Fractionation of Rare Earth Elements in an Estuarine Marsh Soil Receiving Acid Discharges from Legacy Sulfide Mine Wastes. Soil Syst. 2021, 5, 66. [Google Scholar] [CrossRef]
  23. Dai, S.; Graham, I.T.; Ward, C.R. A Review of Anomalous Rare Earth Elements and Yttrium in Coal. Int. J. Coal Geol. 2016, 159, 82–95. [Google Scholar] [CrossRef]
  24. Seredin, V.V. A New Method for Primary Evaluation of the Outlook for Rare Earth Element Ores. Geol. Ore Depos. 2010, 52, 428–433. [Google Scholar] [CrossRef]
  25. Dulong, F.T.; Cecil, C.B. Stratigraphic Variation in Bulk Sample Mineralogy of Pennsylvanian Underclays from the Central Appalachian Basin. In Paleoclimate Controls on Carboniferous Sedimentation and Cyclic Stratigraphy in the Appalachian Basin; US Geological Survey Open File Report; US Geological Survey: Williamsport, PA, USA, 1998. [Google Scholar]
  26. Palmer, C.A.; Oman, C.L.; Park, A.J.; Luppens, J.A. The US Geological Survey Coal Quality (COALQUAL) Database Version 3.0; US Geological Survey Open-file Report; US Geological Survey: Reston, VA, USA, 2015. [Google Scholar]
  27. Connor, J.J.; Keith, J.R.; Anderson, B.M. Trace-Metal Variation in Soils and Sagebrush in the Powder River Basin, Wyoming and Montana. J. Res. US Geol. Surv. 1976, 4, 49–59. [Google Scholar]
  28. Gluskoter, H.J.; Ruch, R.R.; Miller, W.G.; Cahill, R.A.; Dreher, G.B.; Kuhn, J.K. Trace Elements in Coal: Occurrence and Distribution; Illinois State Geological Survey: Champaign, IL, USA, 1977. [Google Scholar]
  29. Lin, R.; Soong, Y.; Granite, E.J. Evaluation of Trace Elements in U.S. Coals Using the USGS COALQUAL Database Version 3.0. Part I: Rare Earth Elements and Yttrium (REY). Int. J. Coal Geol. 2018, 192, 1–13. [Google Scholar] [CrossRef]
  30. Kynčlová, P.; Hron, K.; Filzmoser, P. Correlation Between Compositional Parts Based on Symmetric Balances. Math. Geosci. 2017, 49, 777–796. [Google Scholar] [CrossRef]
  31. Dai, S.; Ren, D.; Tang, Y.; Yue, M.; Hao, L. Concentration and Distribution of Elements in Late Permian Coals from Western Guizhou Province, China. Int. J. Coal Geol. 2005, 61, 119–137. [Google Scholar] [CrossRef]
  32. Spears, D. Role of Clay Minerals in UK Coal Combustion. Appl. Clay Sci. 2000, 16, 87–95. [Google Scholar] [CrossRef]
  33. Bryan, R.C.; Richers, D.; Andersen, H.T.; Gary, T. Assessment of Rare Earth Elemental Contents in Selected United States Coal-Basins; Document; Leonardo Technologies Inc.: St. Clairsville, OH, USA, 2015. [Google Scholar]
  34. Bragg, L.J.; Oman, J.K.; Tewalt, S.J.; Oman, C.L.; Rega, N.H.; Washington, P.M.; Finkelman, R.B. US Geological Survey Coal Quality (COALQUAL) Database: Version 2.0; US Geological Survey Open-file Report; US Geological Survey: Reston, VA, USA, 1998. [Google Scholar]
  35. Spiro, C.L.; Wong, J.; Maylotte, D.H.; Lamson, S.H.; Lytle, F.W.; Greegor, R.B. Forms of Potassium in Coal and Its Combustion Products. Fuel 1986, 65, 327–336. [Google Scholar] [CrossRef]
  36. Steinmetz, G.L.; Mohan, M.S.; Zingaro, R.A. Characterization of Titanium in United States Coals. Energy Fuels 1988, 2, 684–692. [Google Scholar] [CrossRef]
  37. Finkelman, R.B. Modes of Occurrence of Trace Elements in Coal; US Geological Survey Open-File Report; US Geological Survey: Reston, VA, USA, 1981. [Google Scholar]
  38. Palmer, C.A.; Filby, R.H. Distribution of Trace Elements in Coal from the Powhatan No. 6 Mine, Ohio. Fuel 1984, 63, 318–328. [Google Scholar] [CrossRef]
  39. Finkelman, R.B.; Palmer, C.A.; Wang, P. Quantification of the Modes of Occurrence of 42 Elements in Coal. Int. J. Coal Geol. 2018, 185, 138–160. [Google Scholar] [CrossRef]
  40. Finkelman, R.B.; Dai, S.; French, D. The Importance of Minerals in Coal as the Hosts of Chemical Elements: A Review. Int. J. Coal Geol. 2019, 212, 103251. [Google Scholar] [CrossRef]
  41. Sutcu, E.C.; Karayigit, A.I. Mineral Matter, Major and Trace Element Content of the Afşin–Elbistan Coals, Kahramanmaraş, Turkey. Int. J. Coal Geol. 2015, 144–145, 111–129. [Google Scholar] [CrossRef]
  42. Querol, X.; Klika, Z.; Weiss, Z.; Finkelman, R.; Alastuey, A.; Juan, R.; López-Soler, A.; Plana, F.; Kolker, A.; Chenery, S.R. Determination of Element Affinities by Density Fractionation of Bulk Coal Samples. Fuel 2001, 80, 83–96. [Google Scholar] [CrossRef]
  43. Ruppert, L.; Finkelman, R.; Boti, E.; Milosavljevic, M.; Tewalt, S.; Simon, N.; Dulong, F. Origin and Significance of High Nickel and Chromium Concentrations in Pliocene Lignite of the Kosovo Basin, Serbia. Int. J. Coal Geol. 1996, 29, 235–258. [Google Scholar] [CrossRef]
  44. Arbuzov, S.I.; Volostnov, A.V.; Mezhibor, A.M.; Rybalko, V.I.; Ilenok, S.S. Scandium (Sc) Geochemistry in Coals (Siberia, Russian Far East, Mongolia, Kazakhstan, and Iran). Int. J. Coal Geol. 2014, 125, 22–35. [Google Scholar] [CrossRef]
  45. Montross, S.N.; Yang, J.; Britton, J.; McKoy, M.; Verba, C. Leaching of Rare Earth Elements from Central Appalachian Coal Seam Underclays. Minerals 2020, 10, 577. [Google Scholar] [CrossRef]
  46. Davis, B.A.; Rodrigues, S.; Esterle, J.S.; Rintoul, L.; Duxbury, A.J.; Golding, S.D. In Situ Techniques for Classifying Apatite in Coal. Int. J. Coal Geol. 2020, 230, 103572. [Google Scholar] [CrossRef]
  47. Yang, J.; Montross, S.; Verba, C.; Britton, J.; Stuckman, M.; Lopano, C. Microanalytical Approaches to Characterizing REE in Appalachian Basin Underclays. Minerals 2020, 10, 546. [Google Scholar] [CrossRef]
  48. Spiro, B.F.; Liu, J.; Dai, S.; Zeng, R.; Large, D.; French, D. Marine Derived 87Sr/86Sr in Coal, A New Key to Geochronology and Palaeoenvironment: Elucidation of the India-Eurasia and China-Indochina Collisions in Yunnan, China. Int. J. Coal Geol. 2019, 215, 103304. [Google Scholar] [CrossRef]
  49. Hower, J.C.; Ruppert, L.F.; Eble, C.F. Lanthanide, Yttrium, and Zirconium Anomalies in the Fire Clay Coal Bed, Eastern Kentucky. Int. J. Coal Geol. 1999, 39, 141–153. [Google Scholar] [CrossRef]
  50. Hower, J.C.; Eble, C.F.; Dai, S.; Belkin, H.E. Distribution of Rare Earth Elements in Eastern Kentucky Coals: Indicators of Multiple Modes of Enrichment? Int. J. Coal Geol. 2016, 160–161, 73–81. [Google Scholar] [CrossRef]
  51. Schatzel, S.J.; Stewart, B.W. A Provenance Study of Mineral Matter in Coal from Appalachian Basin Coal Mining Regions and Implications Regarding the Respirable Health of Underground Coal Workers: A Geochemical and Nd Isotope Investigation. Int. J. Coal Geol. 2012, 94, 123–136. [Google Scholar] [CrossRef]
  52. Messinger, T. Water-Quality Assessment of the Kanawha-New River Basin, West Virginia, Virginia, and North Carolin-Review of Water-Quality Literature Through 1996; US Geological Survey Water-Resources Investigations Report; US Geological Survey: Reston, VA, USA, 1997. [Google Scholar]
  53. McNutt, R.H.; Frape, S.K.; Dollar, P. A Strontium, Oxygen and Hydrogen Isotopic Composition of Brines, Michigan and Appalachian Basins, Ontario and Michigan. Appl. Geochem. 1987, 2, 495–505. [Google Scholar] [CrossRef]
  54. Beaton, A.P.; Goodarzi, F.; Potter, J. The Petrography, Mineralogy and Geochemistry of a Paleocene Lignite from Southern Saskatchewan, Canada. Int. J. Coal Geol. 1991, 17, 117–148. [Google Scholar] [CrossRef]
  55. Boyd, R.J. The Partitioning Behaviour of Boron from Tourmaline during Ashing of Coal. Int. J. Coal Geol. 2002, 53, 43–54. [Google Scholar] [CrossRef]
  56. Karayigit, A.I.; Atalay, M.; Oskay, R.G.; Córdoba, P.; Querol, X.; Bulut, Y. Variations in Elemental and Mineralogical Compositions of Late Oligocene, Early and Middle Miocene Coal Seams in the Kale-Tavas Molasse Sub-Basin, SW Turkey. Int. J. Coal Geol. 2020, 218, 103366. [Google Scholar] [CrossRef]
  57. Çelik, Y.; Karayiğit, A.İ.; Querol, X.; Oskay, R.G.; Mastalerz, M.; Kayseri Özer, M.S. Coal Characteristics, Palynology, and Palaeoenvironmental Interpretation of the Yeniköy Coal of Late Oligocene Age in the Thrace Basin (NW Turkey). Int. J. Coal Geol. 2017, 181, 103–123. [Google Scholar] [CrossRef]
  58. Goodarzi, F.; Swaine, D.J. Paleoenvironmental and Environmental Implications of the Boron Content of Coals; Geological Survey of Canada: Ottawa, ON, Canada, 1994. [Google Scholar]
  59. Bau, M. Controls on the Fractionation of Isovalent Trace Elements in Magmatic and Aqueous Systems: Evidence from Y/Ho, Zr/Hf, and Lanthanide Tetrad Effect. Contrib. Mineral. Petrol. 1996, 123, 323–333. [Google Scholar] [CrossRef]
  60. Mastalerz, M.; Drobniak, A. Gallium and Germanium in Selected Indiana Coals. Int. J. Coal Geol. 2012, 94, 302–313. [Google Scholar] [CrossRef]
  61. Bladh, K.W. The Formation of Goethite, Jarosite, and Alunite during the Weathering of Sulfide-Bearing Felsic Rocks. Econ. Geol. Bull. Soc. Econ. Geol. 1982, 77, 176–184. [Google Scholar] [CrossRef]
  62. Grawunder, A.; Merten, D.; Büchel, G. Origin of Middle Rare Earth Element Enrichment in Acid Mine Drainage-Impacted Areas. Environ. Sci. Pollut. Res. 2014, 21, 6812–6823. [Google Scholar] [CrossRef]
  63. Merovich, G.T.; Stiles, J.M.; Petty, J.T.; Ziemkiewicz, P.F.; Fulton, J.B. Water Chemistry-Based Classification of Streams and Implications for Restoring Mined Appalachian Watersheds. Environ. Toxicol. Chem. 2007, 26, 1361–1369. [Google Scholar] [CrossRef]
  64. Hedin, B.C.; Hedin, R.S.; Capo, R.C.; Stewart, B.W. Critical Metal Recovery Potential of Appalachian Acid Mine Drainage Treatment Solids. Int. J. Coal Geol. 2020, 231, 103610. [Google Scholar] [CrossRef]
  65. Cecil, C.B. Paleoclimate Controls on Carboniferous Sedimentation and Cyclic Stratigraphy in the Appalachian Basin; US Geological Survey Open File Report; US Geological Survey: Knoxville, TN, USA, 1998. [Google Scholar]
  66. Greber, N.D.; Mäder, U.; Nägler, T.F. Experimental Dissolution of Molybdenum-Sulphides at Low Oxygen Concentrations: A First-Order Approximation of Late Archean Atmospheric Conditions. Earth Space Sci. 2015, 2, 173–180. [Google Scholar] [CrossRef]
  67. Diehl, S.F.; Goldhaber, M.B.; Koenig, A.E.; Lowers, H.A.; Ruppert, L.F. Distribution of Arsenic, Selenium, and Other Trace Elements in High Pyrite Appalachian Coals: Evidence for Multiple Episodes of Pyrite Formation. Int. J. Coal Geol. 2012, 94, 238. [Google Scholar] [CrossRef]
  68. West Virginia Geological and Economic Survey Selenium (Se). Available online: http://www.wvgs.wvnet.edu/www/datastat/te/sehome.htm (accessed on 8 May 2022).
  69. Yudovich, Y.E.; Ketris, M.P. Selenium in Coal: A Review. Int. J. Coal Geol. 2006, 67, 112–126. [Google Scholar] [CrossRef]
  70. Belogub, E.V.; Ayupova, N.R.; Novoselov, K.A.; Blinov, I.A.; Krivovichev, V.G.; Charykova, M.V. Se Minerals in the Continental and Submarine Oxidation Zones of the South Urals Volcanogenic-Hosted Massive Sulfide Deposits: A Review. Ore Geol. Rev. 2020, 122, 103500. [Google Scholar] [CrossRef]
  71. Borst, A.M.; Smith, M.P.; Finch, A.A.; Estrade, G.; Villanova-de-Benavent, C.; Nason, P.; Marquis, E.; Horsburgh, N.J.; Goodenough, K.M.; Xu, C.; et al. Adsorption of Rare Earth Elements in Regolith-Hosted Clay Deposits. Nat. Commun. 2020, 11, 4386. [Google Scholar] [CrossRef]
  72. Fuller, A.J.; Shaw, S.; Ward, M.B.; Haigh, S.J.; Mosselmans, J.F.W.; Peacock, C.L.; Stackhouse, S.; Dent, A.J.; Trivedi, D.; Burke, I.T. Caesium Incorporation and Retention in Illite Interlayers. Appl. Clay Sci. 2015, 108, 128–134. [Google Scholar] [CrossRef]
  73. Lukman, S.; Essa, M.H.; Bukhari, A.; Mu’azu, N.D.; Basheer, C. Adsorption and Desorption of Heavy Metals onto Natural Clay Material: Influence of Initial PH. J. Environ. Sci. Technol. 2013, 6, 1–15. [Google Scholar] [CrossRef]
  74. Rozelle, P.L.; Khadilkar, A.B.; Pulati, N.; Soundarrajan, N.; Klima, M.S.; Mosser, M.M.; Miller, C.E.; Pisupati, S.V. A Study on Removal of Rare Earth Elements from US Coal Byproducts by Ion Exchange. Metall. Mater. Trans. E Mater. Energy Syst. 2016, 3, 6–17. [Google Scholar]
  75. US Department of Energy. Report on Rare Earth Elements from Coal and Coal Byproducts; US Department of Energy: Washington, DC, USA, 2017. [Google Scholar]
  76. American Coal Ash Association. 2019 Coal Combustion Product (CCP) Production & Use Survey Report. 2019. Available online: https://acaa-usa.org/wp-content/uploads/coal-combustion-products-use/2019-Survey-Results.pdf (accessed on 5 June 2022).
  77. Bagdonas, D.A.; Enriquez, A.J.; Coddington, K.A.; Finnoff, D.C.; McLaughlin, J.F.; Bazilian, M.D.; Phillips, E.H.; McLing, T.L. Rare Earth Element Resource Evaluation of Coal Byproducts: A Case Study from the Powder River Basin, Wyoming. Renew. Sustain. Energy Rev. 2022, 158, 112148. [Google Scholar] [CrossRef]
Figure 1. West Virginia (WV) COALQUAL sample locations.
Minerals 12 01060 g001
Figure 2. Relative standard deviation (RSD) results.
Minerals 12 01060 g002
Figure 3. RSD vs. percent of BDL data.
Minerals 12 01060 g003
Figure 4. Progressively calculated correlation coefficients between rare earth elements and yttrium (REY) and increasing ash yield (%).
Minerals 12 01060 g004
Figure 5. Matrix correlation coefficients represented by a color scale. White represents a correlation coefficient of zero, while darker blues represent stronger positive correlations, and darker reds represent stronger negative correlations.
Minerals 12 01060 g005
Figure 6. Dendrogram depicting results of agglomerative hierarchical clustering of coal chemistry data.
Minerals 12 01060 g006
Figure 7. Enrichment trends between K-means clusters based on standard deviation from the population mean.
Minerals 12 01060 g007
Figure 8. Boxplot showing ash yields for K-means clusters. Mean values are represented by an “X”.
Minerals 12 01060 g008
Figure 9. Boxplot showing whole coal total REY, critical REY, and excessive REY for K-means clusters. Mean values are represented by an “X”.
Minerals 12 01060 g009
Figure 10. Locations of economically promising samples.
Minerals 12 01060 g010
Figure 11. Total ash-basis promising and unpromising samples by geologic formation.
Minerals 12 01060 g011
Table 1. Summary statistics for below detection limit (BDL), above detection limit (ADL), and Q factor-adjusted data. Minimum (Min.), mean, and maximum (Max.) values in ppm (whole coal-basis). S.D. is standard deviation; n/a means not applicable.
Data below Detection LimitData above Detection LimitAdjusted Data
ElementNo. of SamplesPercent of DataMin.MeanMax.S.D.No. of SamplesMin.MeanMax.S.D.Q FactorMin.MeanMax.S.D.
La00.00n/an/an/an/a5691.0410.1545.406.54n/a1.0410.1545.406.54
Ce00.00n/an/an/an/a5693.0418.5675.0010.98n/a3.0418.5675.0010.98
Pr49687.171.108.2943.005.83730.433.6828.004.060.300.433.57282.74
Nd13423.551.607.3430.004.564351.1810.2062.107.370.701.189.5362.106.92
Sm00.00n/an/an/an/a5690.101.7014.301.28n/a0.101.7014.301.28
Eu20.350.510.610.710.145670.100.373.220.280.700.100.373.220.28
Gd21437.610.371.778.901.273550.281.7213.401.450.700.281.7413.401.38
Tb569.840.260.936.100.945130.020.303.060.240.700.020.366.100.41
Dy48885.760.233.2220.002.55810.452.459.981.740.500.162.3214.291.81
Y00.00n/an/an/an/a5690.927.8444.305.52n/a0.927.8444.305.52
Ho53093.150.120.868.000.74390.190.642.240.480.500.090.615.710.52
Er37766.260.211.276.200.811920.281.265.130.840.700.211.276.200.82
Tm56198.590.070.523.000.3680.100.360.930.250.500.050.372.140.26
Yb10.180.420.420.42n/a5680.190.875.000.560.700.190.875.000.56
Lu315.450.080.350.710.175380.010.130.800.090.700.010.150.800.10
Publisher’s Note: MDPI stays neutral with regard to jurisdictional claims in published maps and institutional affiliations.

