
Corded Ware and Contemporary Hunter-Gatherer Pottery from Southeast Lithuania: Technological Insights through Geochemical and Mineralogical Approaches

 ,
, 
 ,
,  ,
, 
Abstract
1. Introduction
2. Study Area, Materials, and Methods
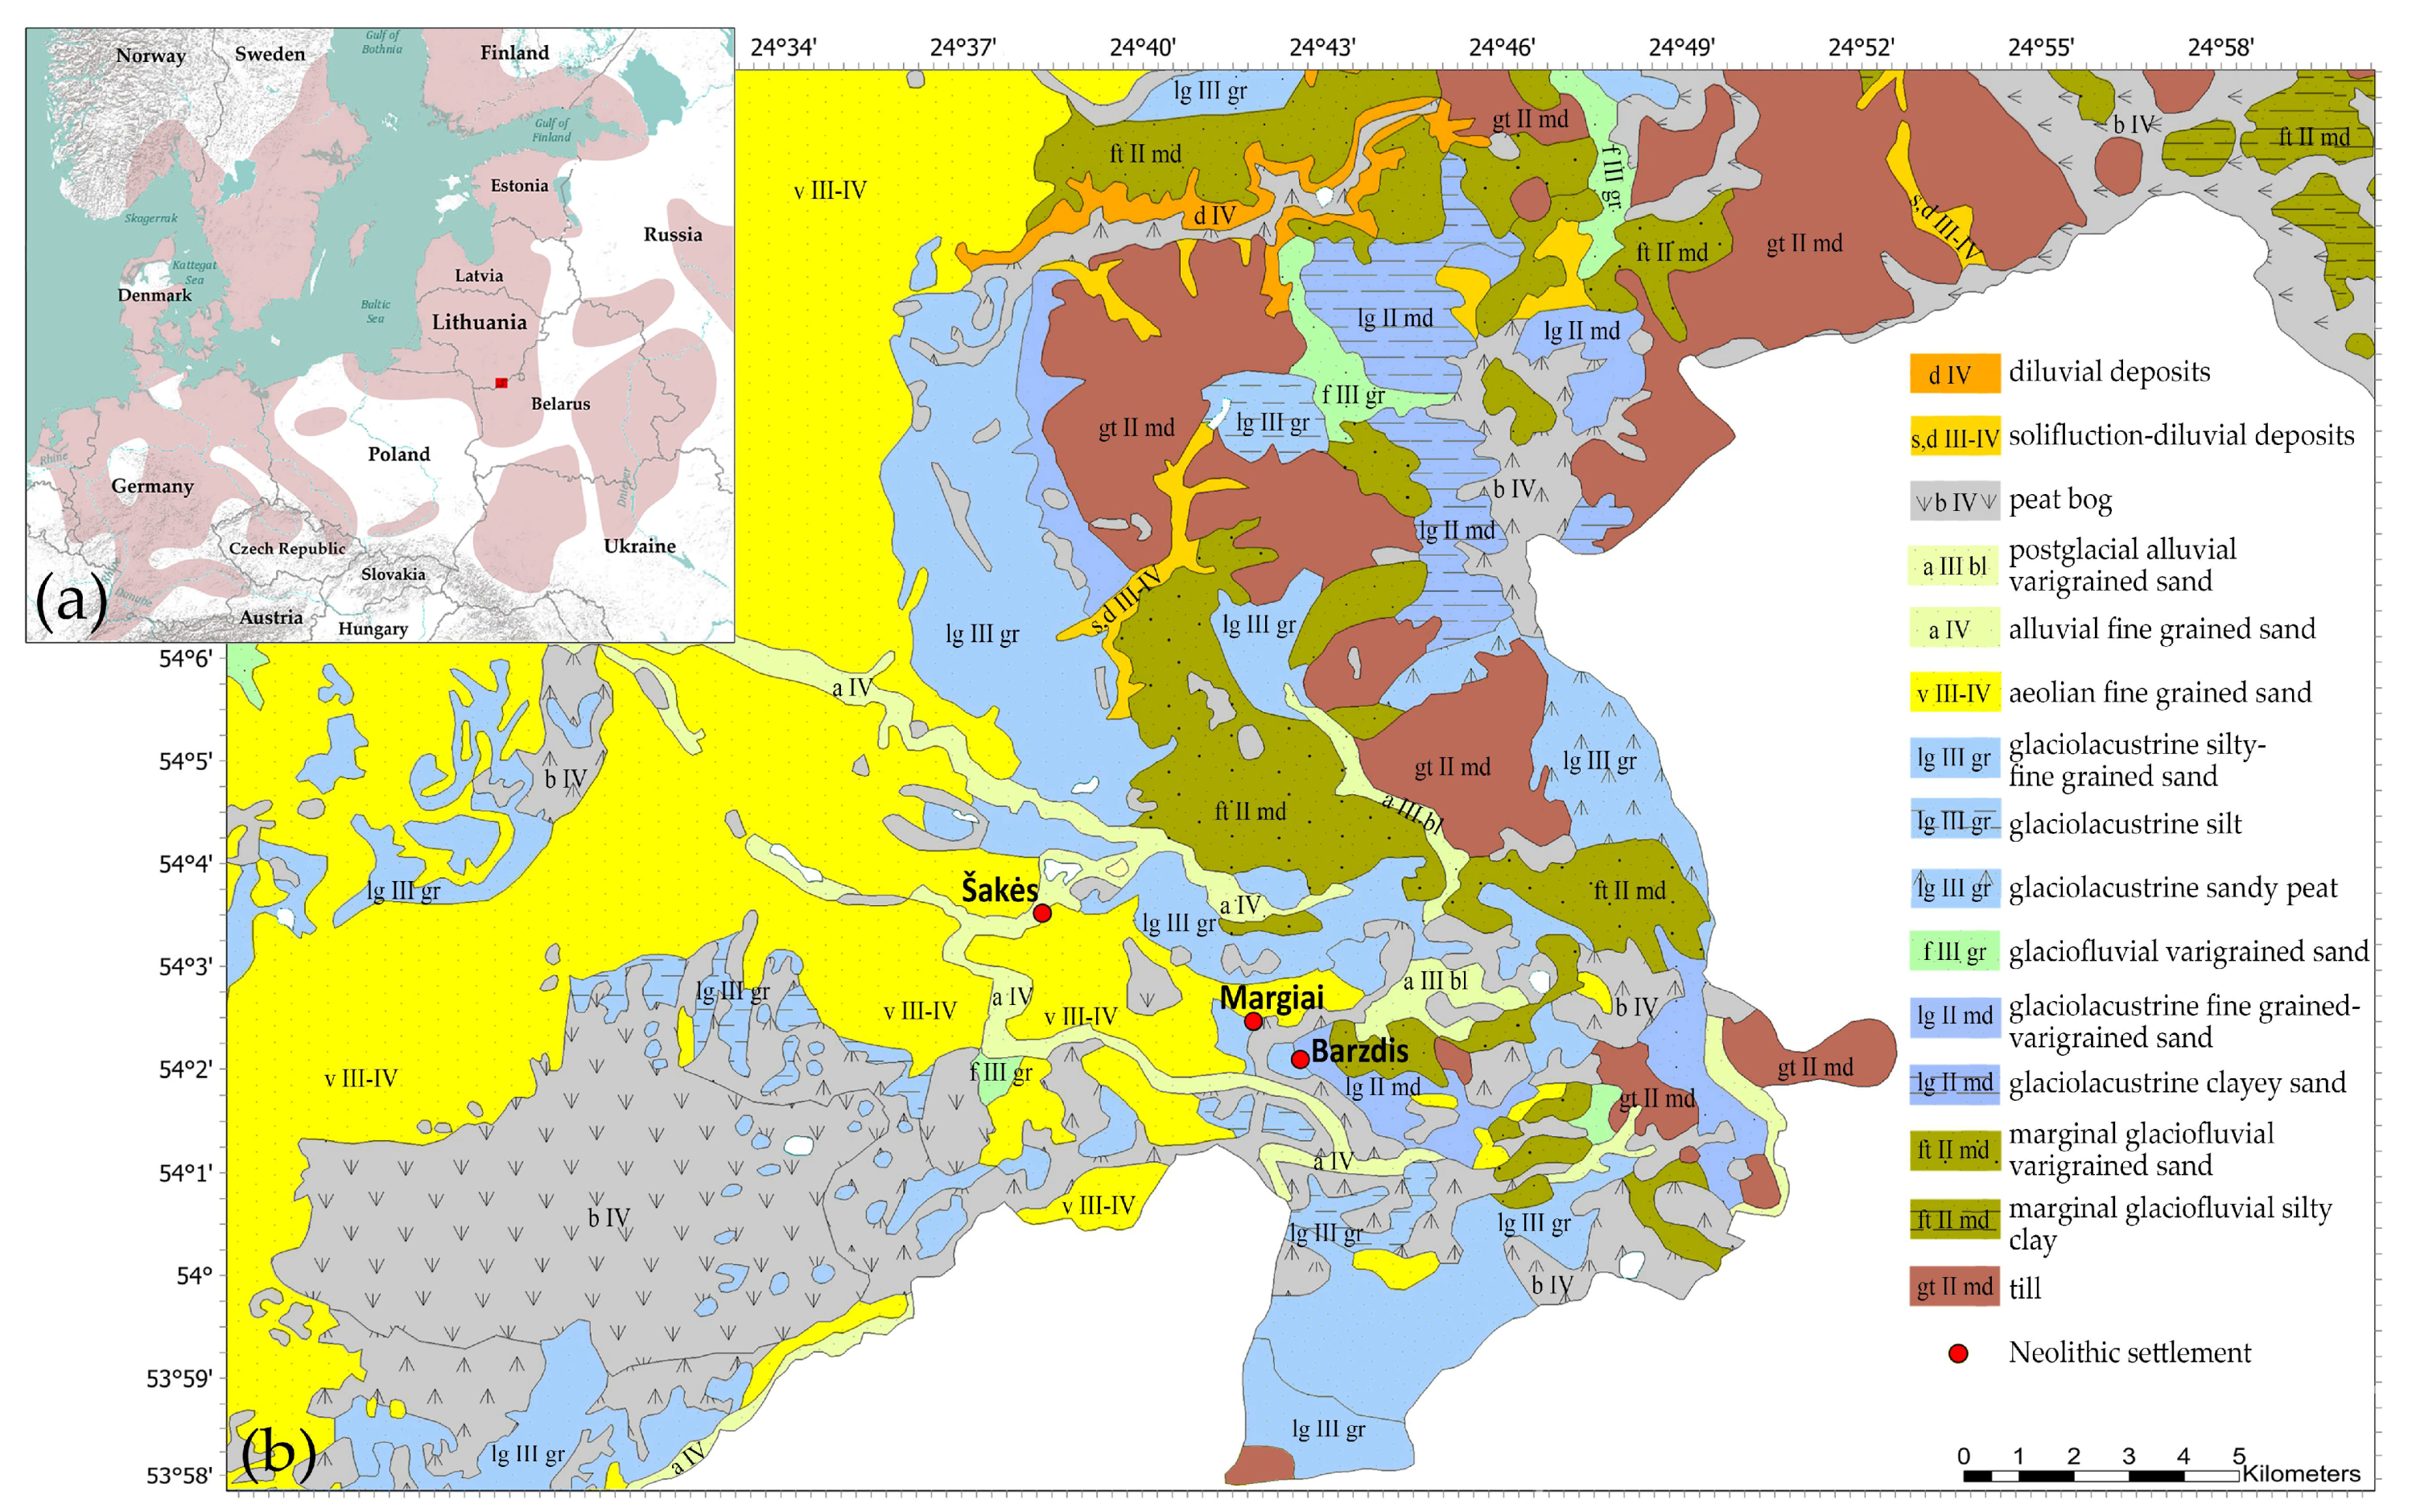
2.1. Study Area
2.2. Materials
2.3. Methods
3. Results and Discussion
3.1. Main Geochemical Peculiarities of the Pottery
3.2. Elemental Clusters of Selected Data Sets
3.3. Evaluation of the Influence of Potential Distribution Characteristics for Geochemical Peculiarities
3.3.1. The Effect of Elemental Composition for Lighter and Darker Shades of Clay Matrix
3.3.2. The Effect of Clay Matrix and Bulk Compositions Differences
3.3.3. Geochemical Proxies of the Effect of Cultural Peculiarity
3.4. Clustering and Conditional Formatting of the Geochemical Data for Linking Ceramics
- There are only two FLCs representing the same culture, i.e., {HG-L_B3~HG-E_M5} and {CW-L_M4~CW-E_M2}. However, both clusters include pottery finds from different periods (‘E’ or ‘L’ (early or late)), whereas only one of them (representing Corded Ware) was collected in the same location.
- None of the pottery samples forming an FLC group have any ‘chaining effect’ (term used in [38]) occurring in at least one of the two finds ‘from the same culture’ or ‘from the same location’.
- Linkage distances between any samples, joined in an FLC, in general, have larger values than bulk composition samples.
- Three FLC groups forming pairs of samples from the same cultures, i.e., {HG-L_B4~HG-L_B3}, {CW-L_S2~CW-L_S1}, and {CW-E_M3~CW-E_M2}, characterized by not only the same period (‘E’ or ‘L’ (early or late)) but also the same locations. Moreover, the first and third groups include identical (from the same period and location) pottery samples HG-L_B3 and CW-E_M2, which are connected as a ‘chain’.
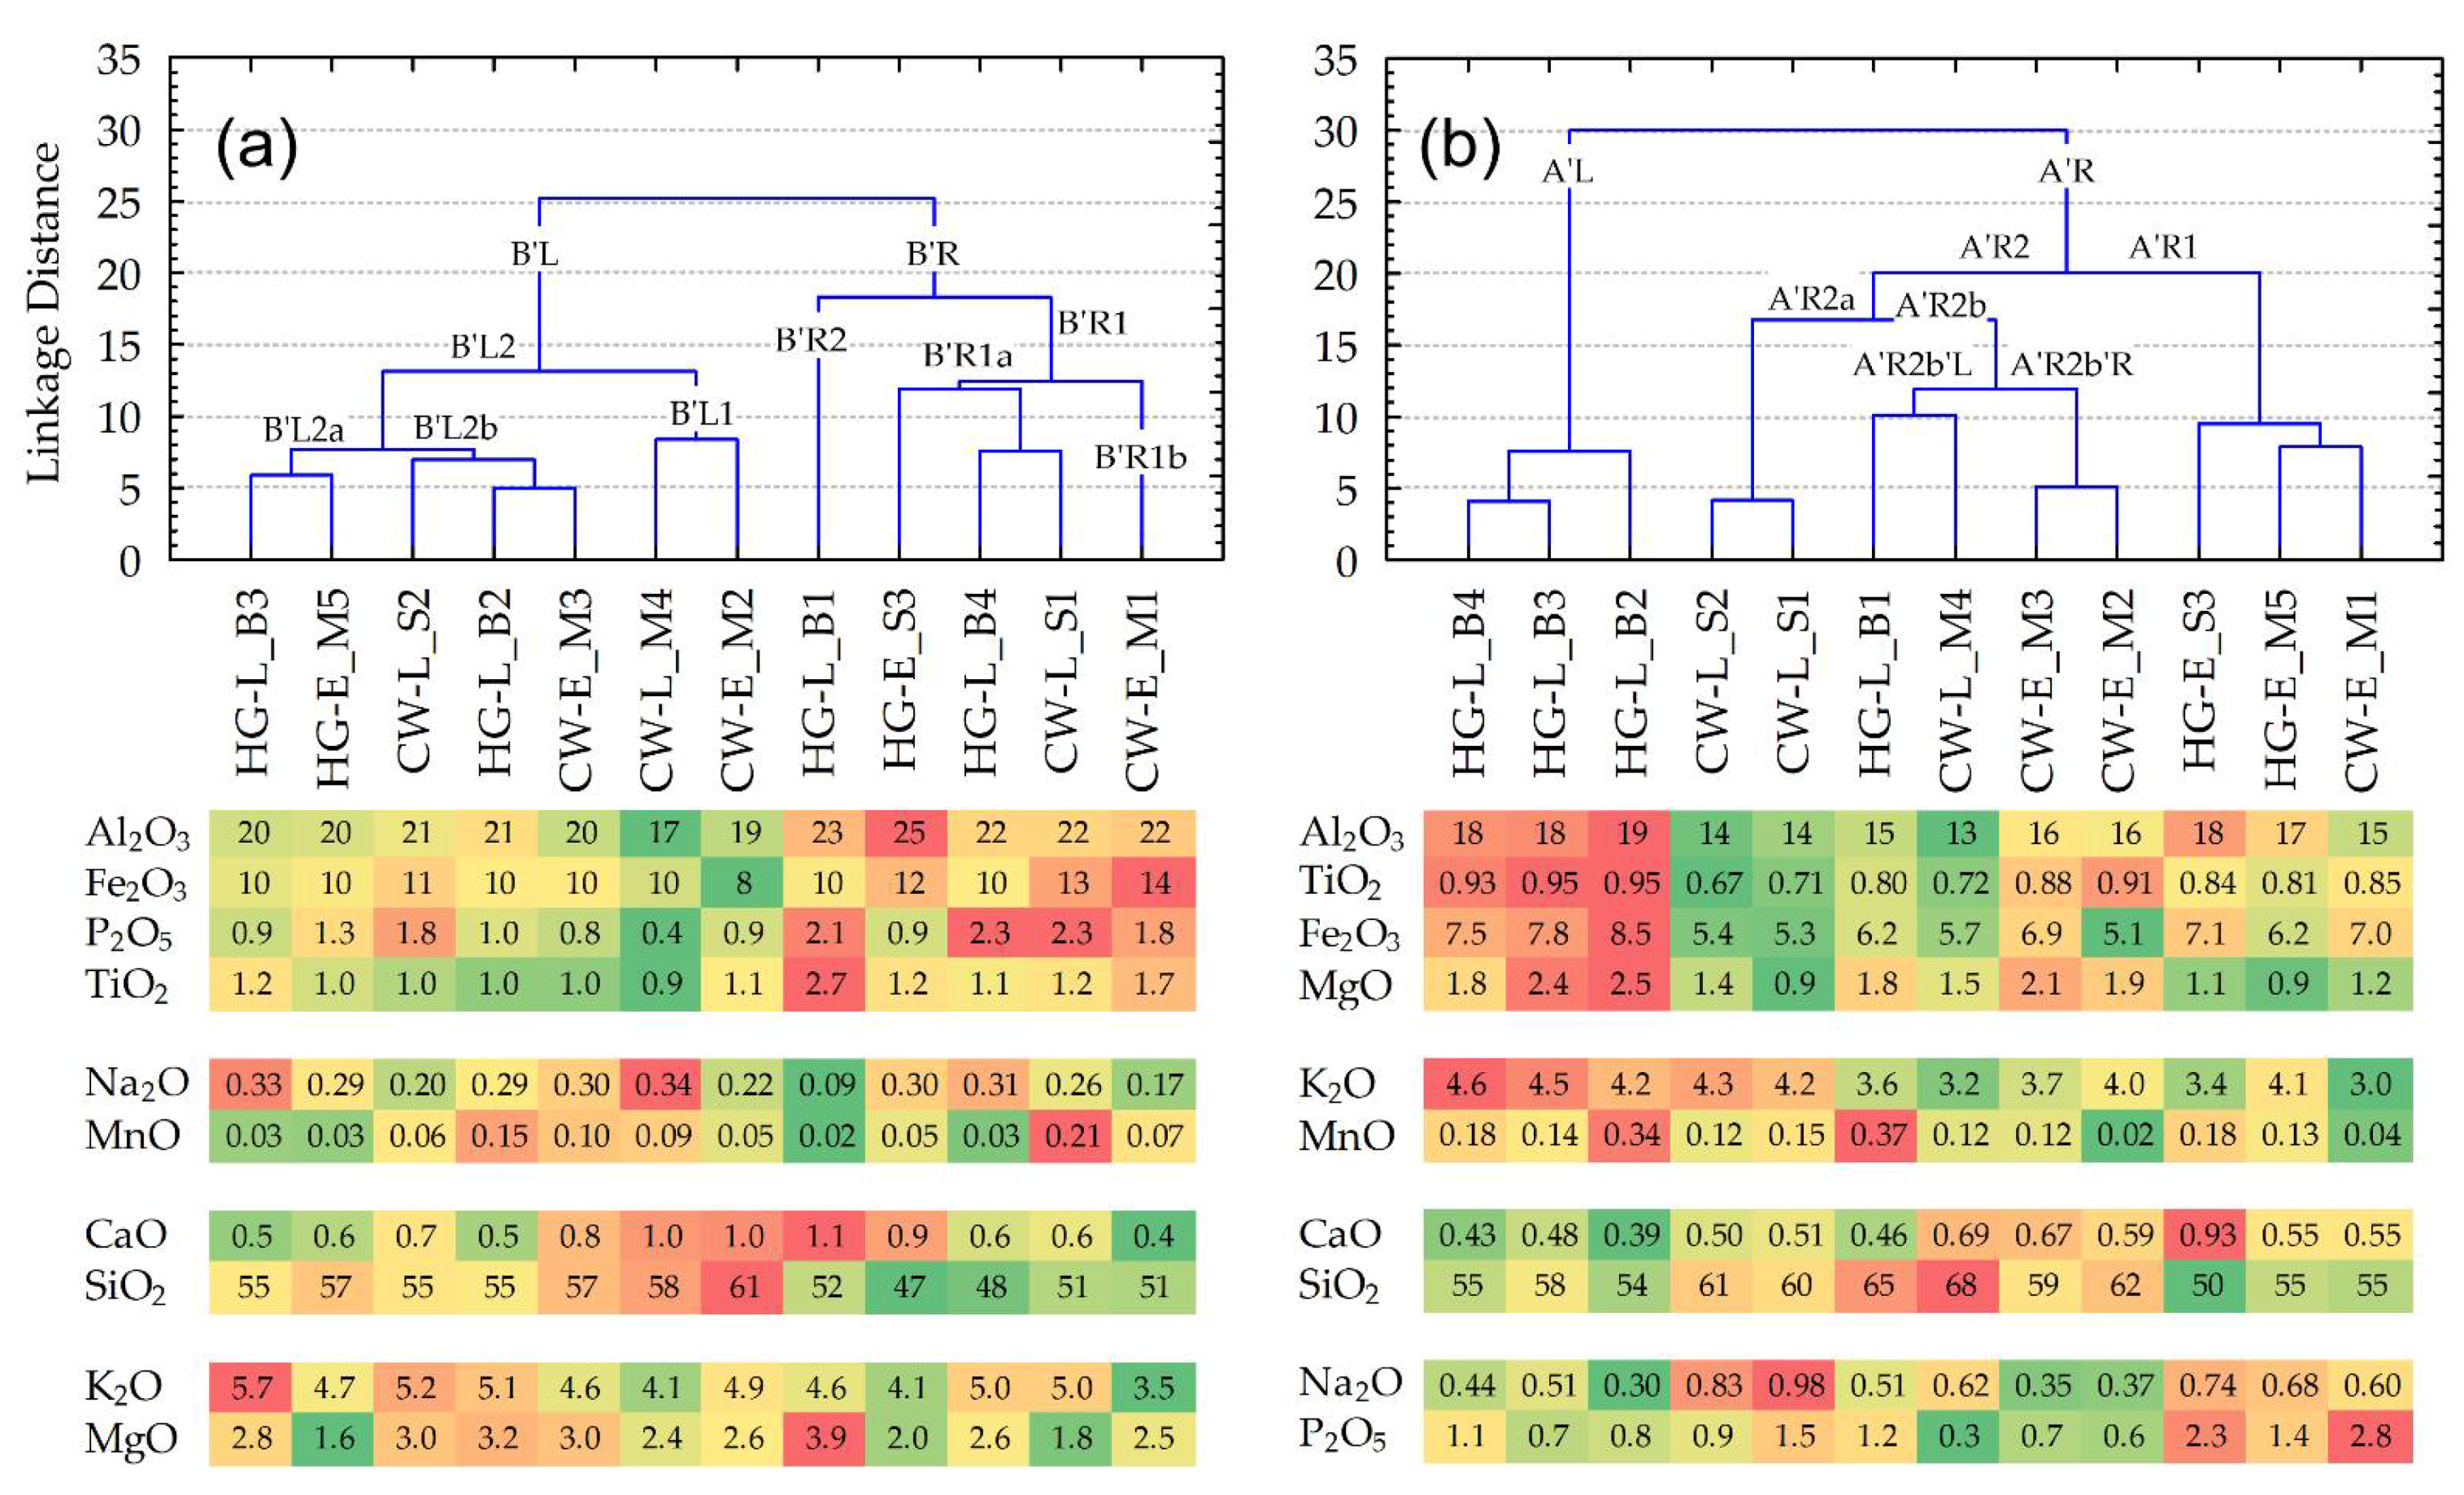
- Ten of the twelve samples formed by the FLC consist of finds from the same location, i.e., three (of the four) ‘B’ samples (from the Barzdis settlement) are closely connected in the left major branch A’L: {{HG-L_B4~HG-L_B3}~HG-L_B2}; two (of the three) ‘S’ samples (from the Šakės settlement) are in the A’R2a sub-branch {CW-L_S2~CW-L_S1}; four of the five ‘M’ samples (from the Margiai settlement) form pairs: samples {CW-E_M3~CW-E_M2} are in sub-branch A’R2b’R, {HG-E_M5 ~ CW-E_M1} in subbranch A’R1.
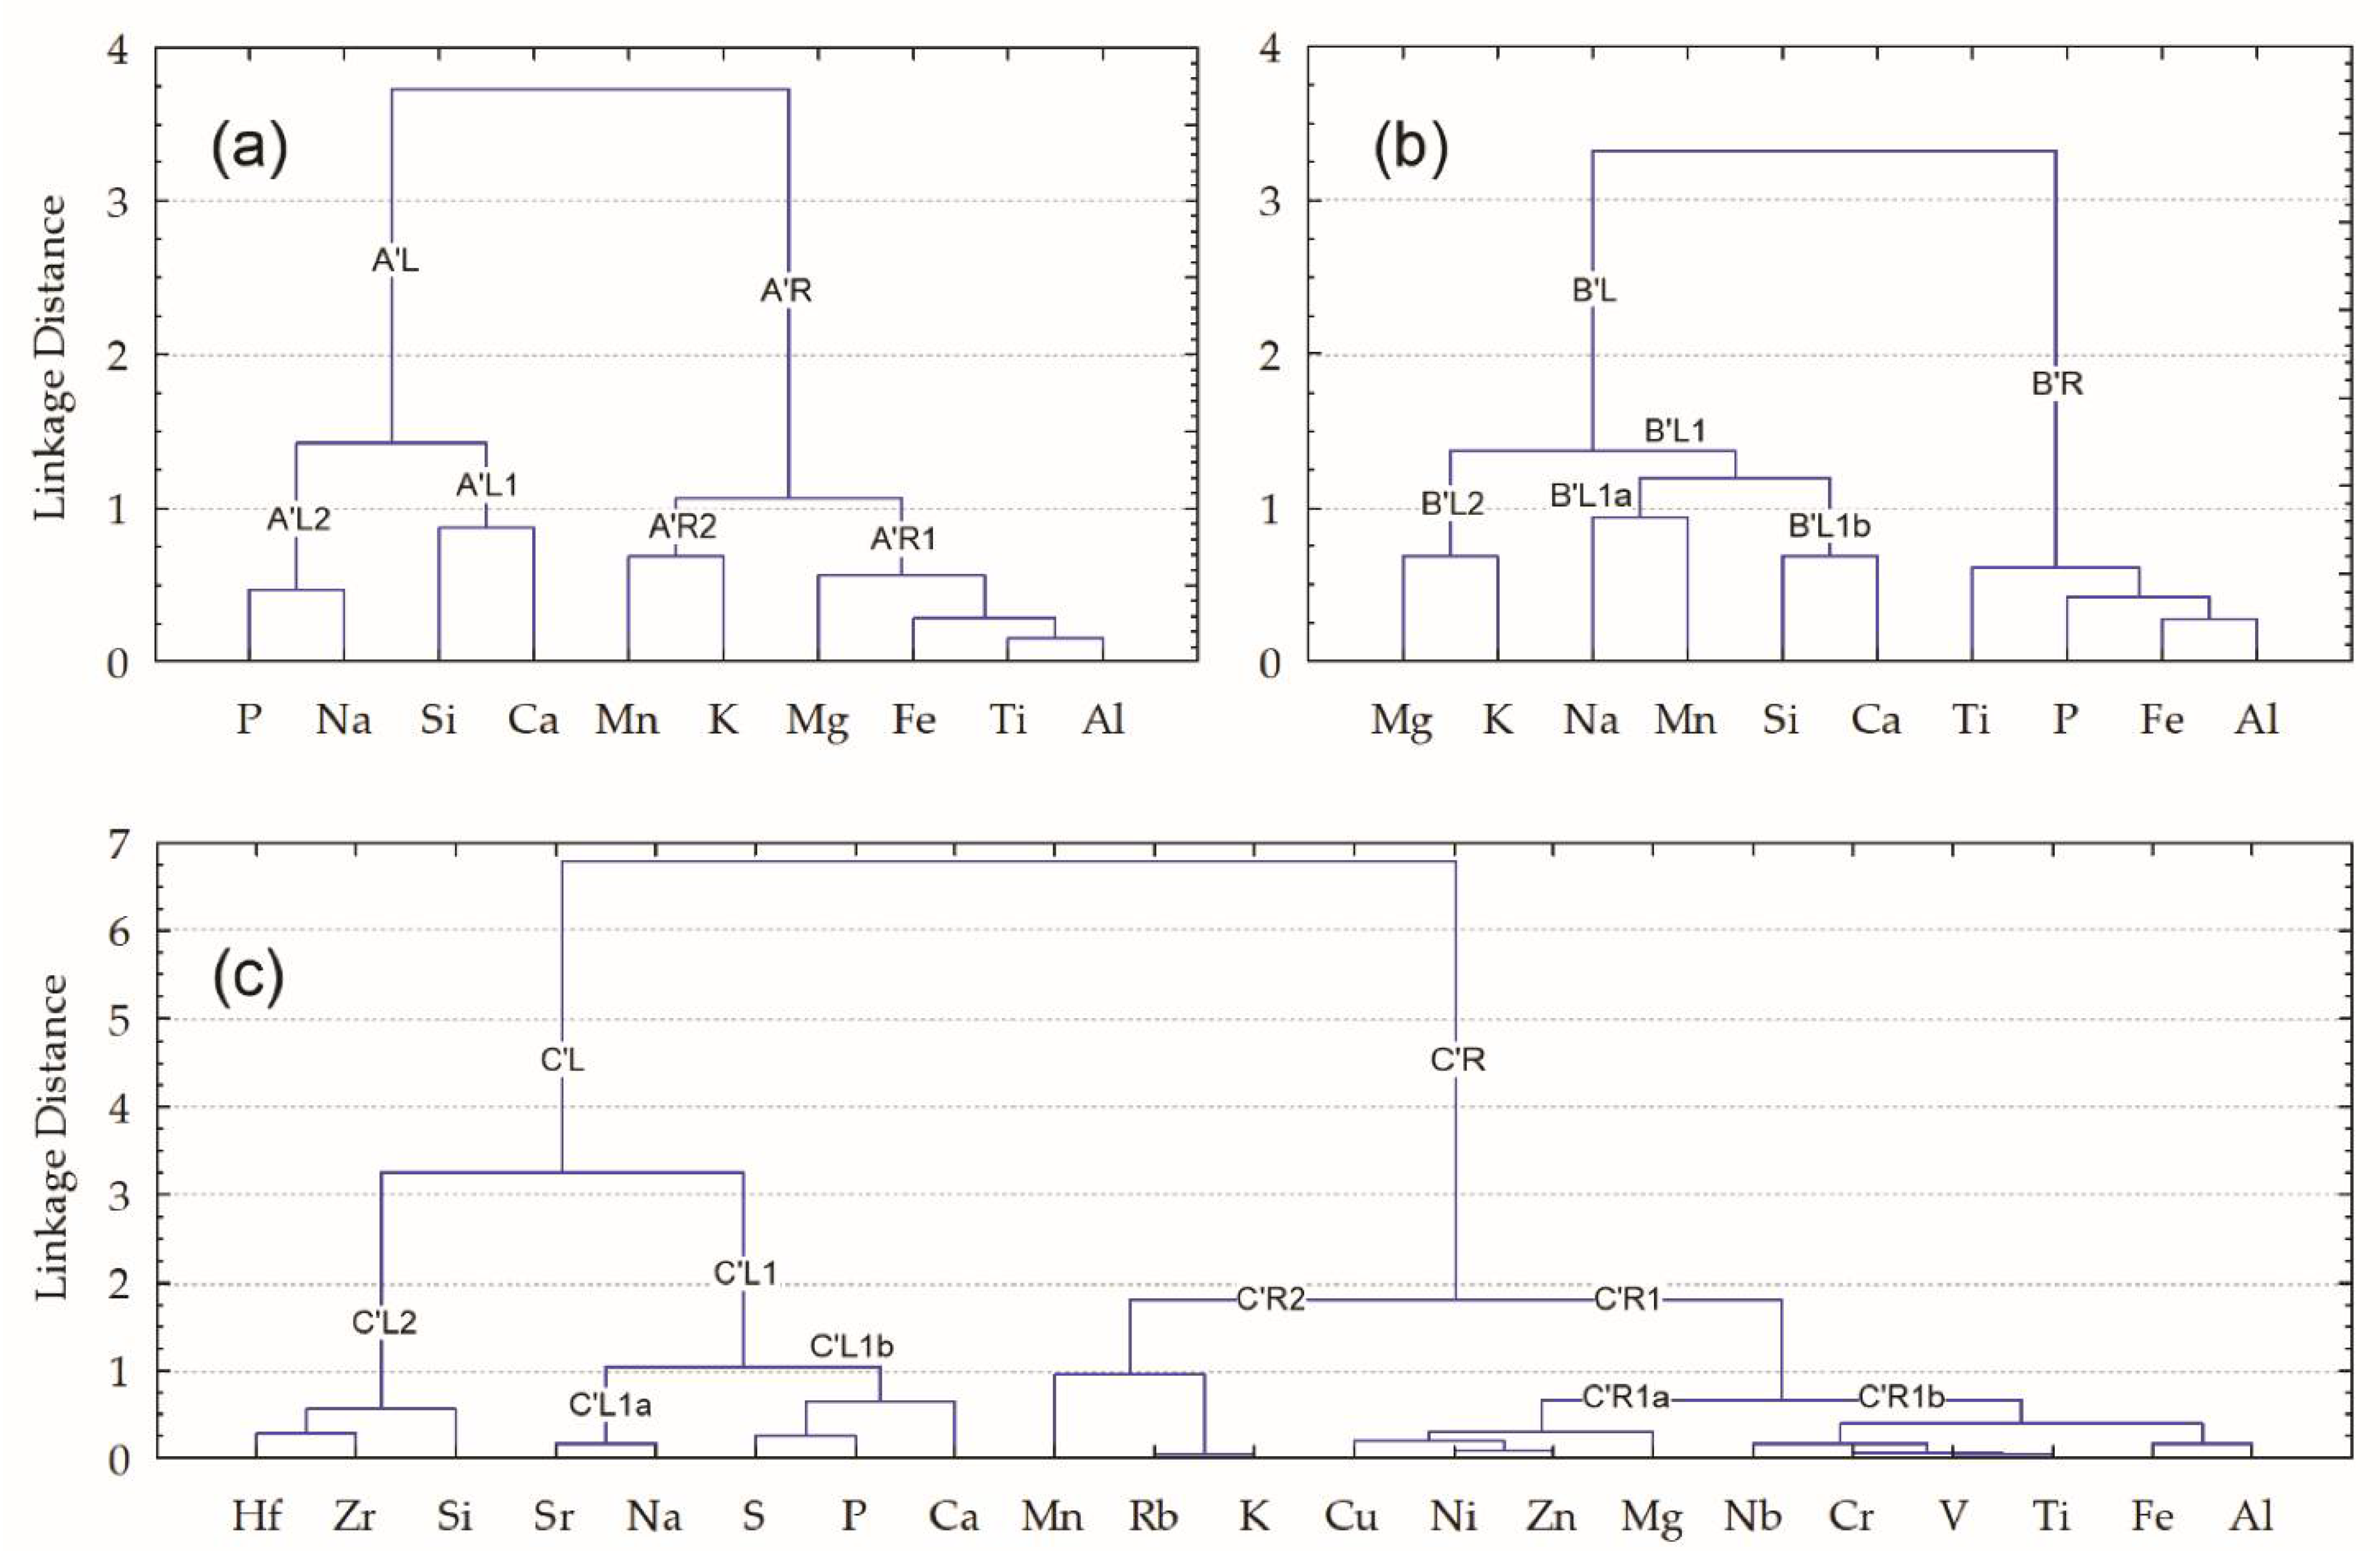
- Two samples of hunter-gatherer pottery, i.e., HG-L_B3 and HG-E_M5, joined in sub-branch B’L2a, have some of the highest mean amounts of Ti, and the biggest of K, and Na, whereas the amounts of Mn and Ca are regarded as the smallest. Despite the fact that Mg has the highest coefficient of variations (CV = 38%), its mean value is also one of the lowest.
- Three samples of different cultures, i.e., HG-L_B2, CW-E_M4, and CW-L_S2, joined in sub-branch B’L2b, have the largest mean amounts of Mg, whereas amounts of Ti and Na are the lowest. The most variable amounts are found for Ca (CV = 22%).
- Two samples of Corded Ware, i.e., CW-L_M4 and CW-E_M2, joined in sub-branch B’L1, have the largest mean amounts of Ca and Si. The amounts of Al, Fe, P, and K are the lowest, whereas Ti is among the lowest. All five analytes have the biggest CV values, respectively (%): 9, 17, 59, 13, and 11.
- Two samples of different cultures, i.e., HG-L_B4 and CW-L_S1, found in sub-branch B’R1, have the largest mean amounts of Al, Fe, P, Ti, and Mn (even though their variability exceeds 100%), whereas amounts of Si and Mg are considered the lowest.
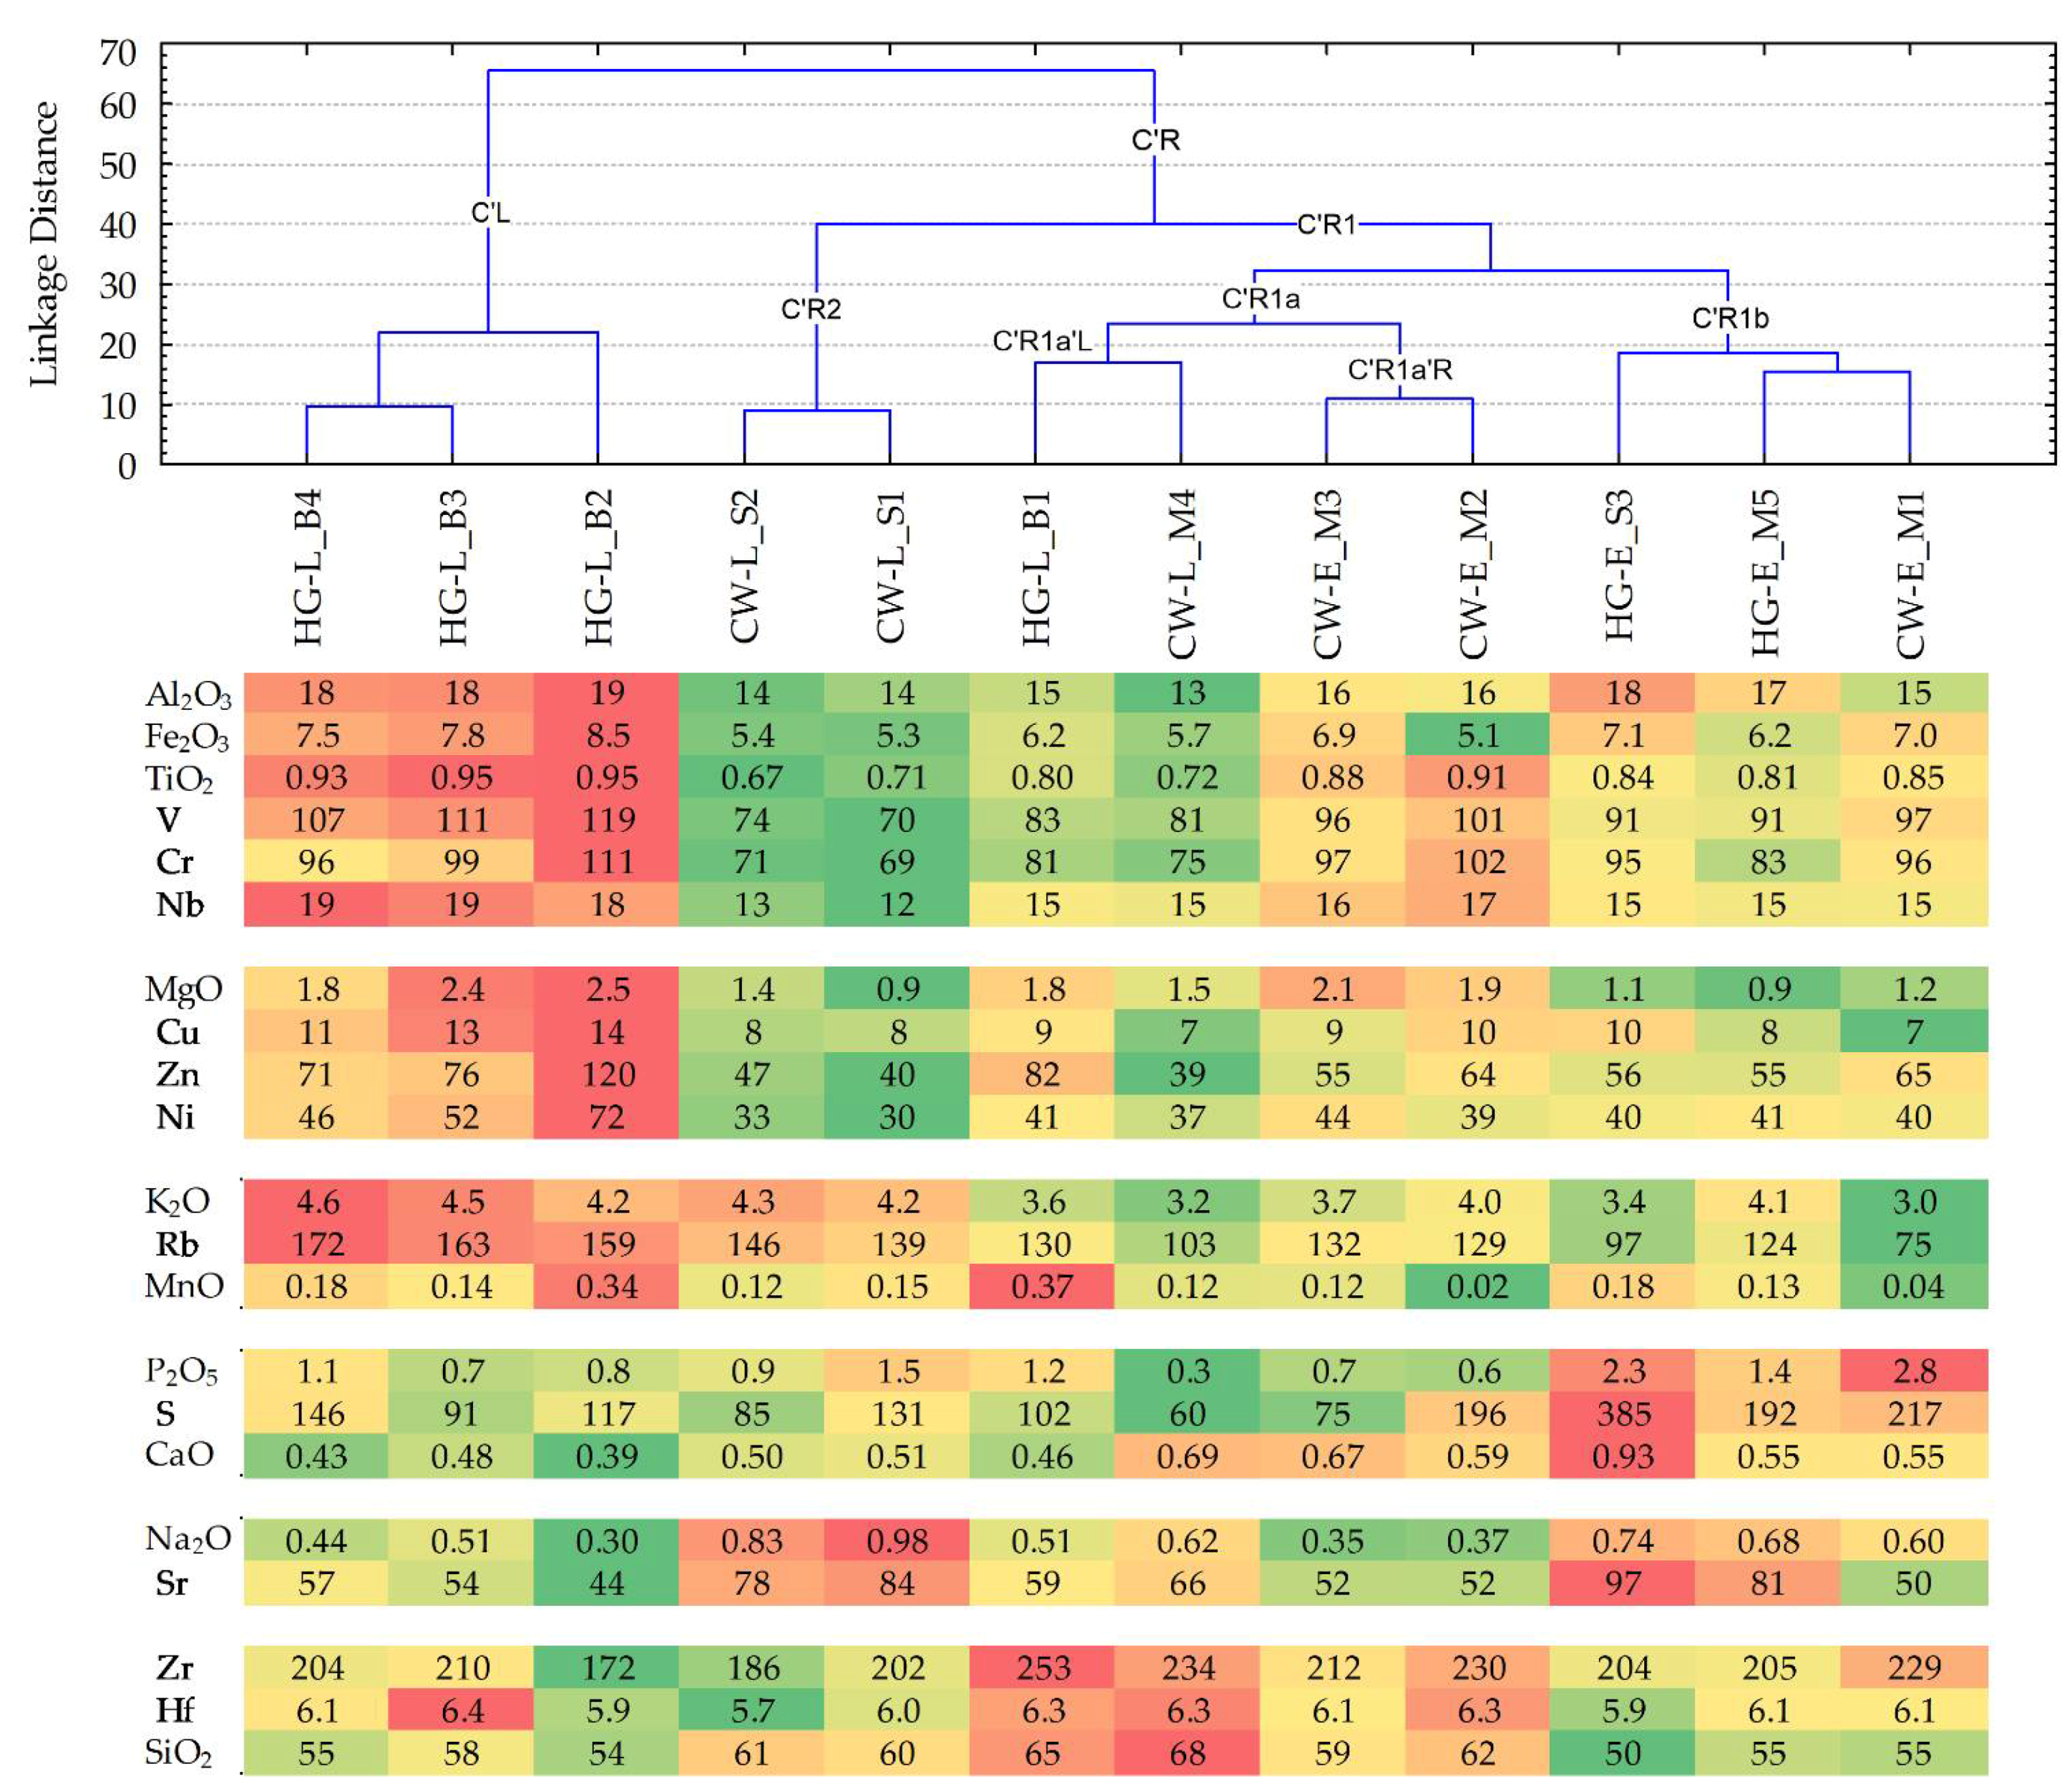
- The three samples of hunter-gatherer pottery, within the same period and location, i.e., HG-L_B4, HG-L_B3, and HG-L_B2, joined in sub-branch C’L, are characterized by high mean quantities of Al, Fe, Ti, Mg, K, and Mn, and lower amounts of Ca, Na, and Si, among the ten major elements. Higher than average amounts among the eleven trace elements are typical for V, Cr, Nb, Cu, Zn, Ni, and Rb, whereas Sr and Zr have two of the lower amounts.
- Two samples of Corded Ware, within the same period and location, i.e., CW-L_S2 and CW-L_S1, joined in sub-branch C’R2, are characterized by high mean quantities of Na and K, whereas Al, Fe, and Ti occur in some of the lower quantities among the ten major elements. Sr has one of the higher average amounts among the trace elements set, whereas V, Cr, Nb, Cu, Zn, Ni, Zr, and Hf have some of the lower amounts.
- Two samples from different cultural groups, i.e., HG-L_B1 and CW-L_M4, joined in sub-branch C’R1a’L, are characterized by higher mean amounts of Mn and Si, whereas Al and K occur in two of the lower quantities among the ten major elements. Among the eleven trace elements, Zr and Hf have two of the higher average amounts, whereas S has one of the lower amounts.
- Two samples of Corded Ware, within the same period and location, i.e., CW-E_M3 and CW-E_M2, found in sub-branch C’R1a’R, are characterized by lower quantities of Mn, P, and Na among the ten major elements. Cr, Nb, and Hf have some of the higher average amounts of the trace elements set, whereas Sr has one of the lowest amounts;
- Two samples of hunter-gatherer pottery, joined by the nearest chain, and one sample of cord-decorated pottery, within the same period ‘E’ (early) for all of them and the same location for two (‘M’—the Margiai settlement), i.e., HG-E_S3, HG-E_M5, and CW-E_M1, that are joined in sub-branch C’R1b, are characterized by one of the highest mean quantities of P and Ca, whereas Mg, K, and Si occur in some of the lowest quantities among the ten major elements. S and Sr have two of the highest average amounts among the eleven trace elements set, whereas Rb and Hf have two of the lower quantities.
- The layers of raw clay used, although being quite sparse, may have been the same over the centuries and their locations may have been known to potters for both cultural groups, or may have even been exploited over a period of time. Such an assumption arises not only from the insignificant differences in the amounts of major analytes in the hunter-gatherer pottery and Corded Ware, but also from the differentiation of the relationship between the clay matrix samples, expressed in relatively larger linkage distances between closely joint samples. It is possible that the most important selection criterion was the plasticity of the raw clay.
- Bulk geochemical compositions of pottery, due to the temper additives, are more variable than the clay matrix, reflecting the expected characteristic differences in the technological features occurring at different periods in the Late Neolithic (‘E’ and ‘L’, and early and late) and at different ceramic production locations (‘M’, ‘B’, and ‘S’—the Margiai, Barzdis, and Šakės settlements) and different cultural features (hunter-gatherers (HG) or Corded Ware Culture (CW)). However, although these geochemical features of ‘period’, ‘location’, and ‘culture’ are more easily distinguished by cluster methods due to the use of identical or different temper additives, we believe that the proportions of raw clay, which were chosen deliberately (by the potters of the day), could have helped to create such a division.
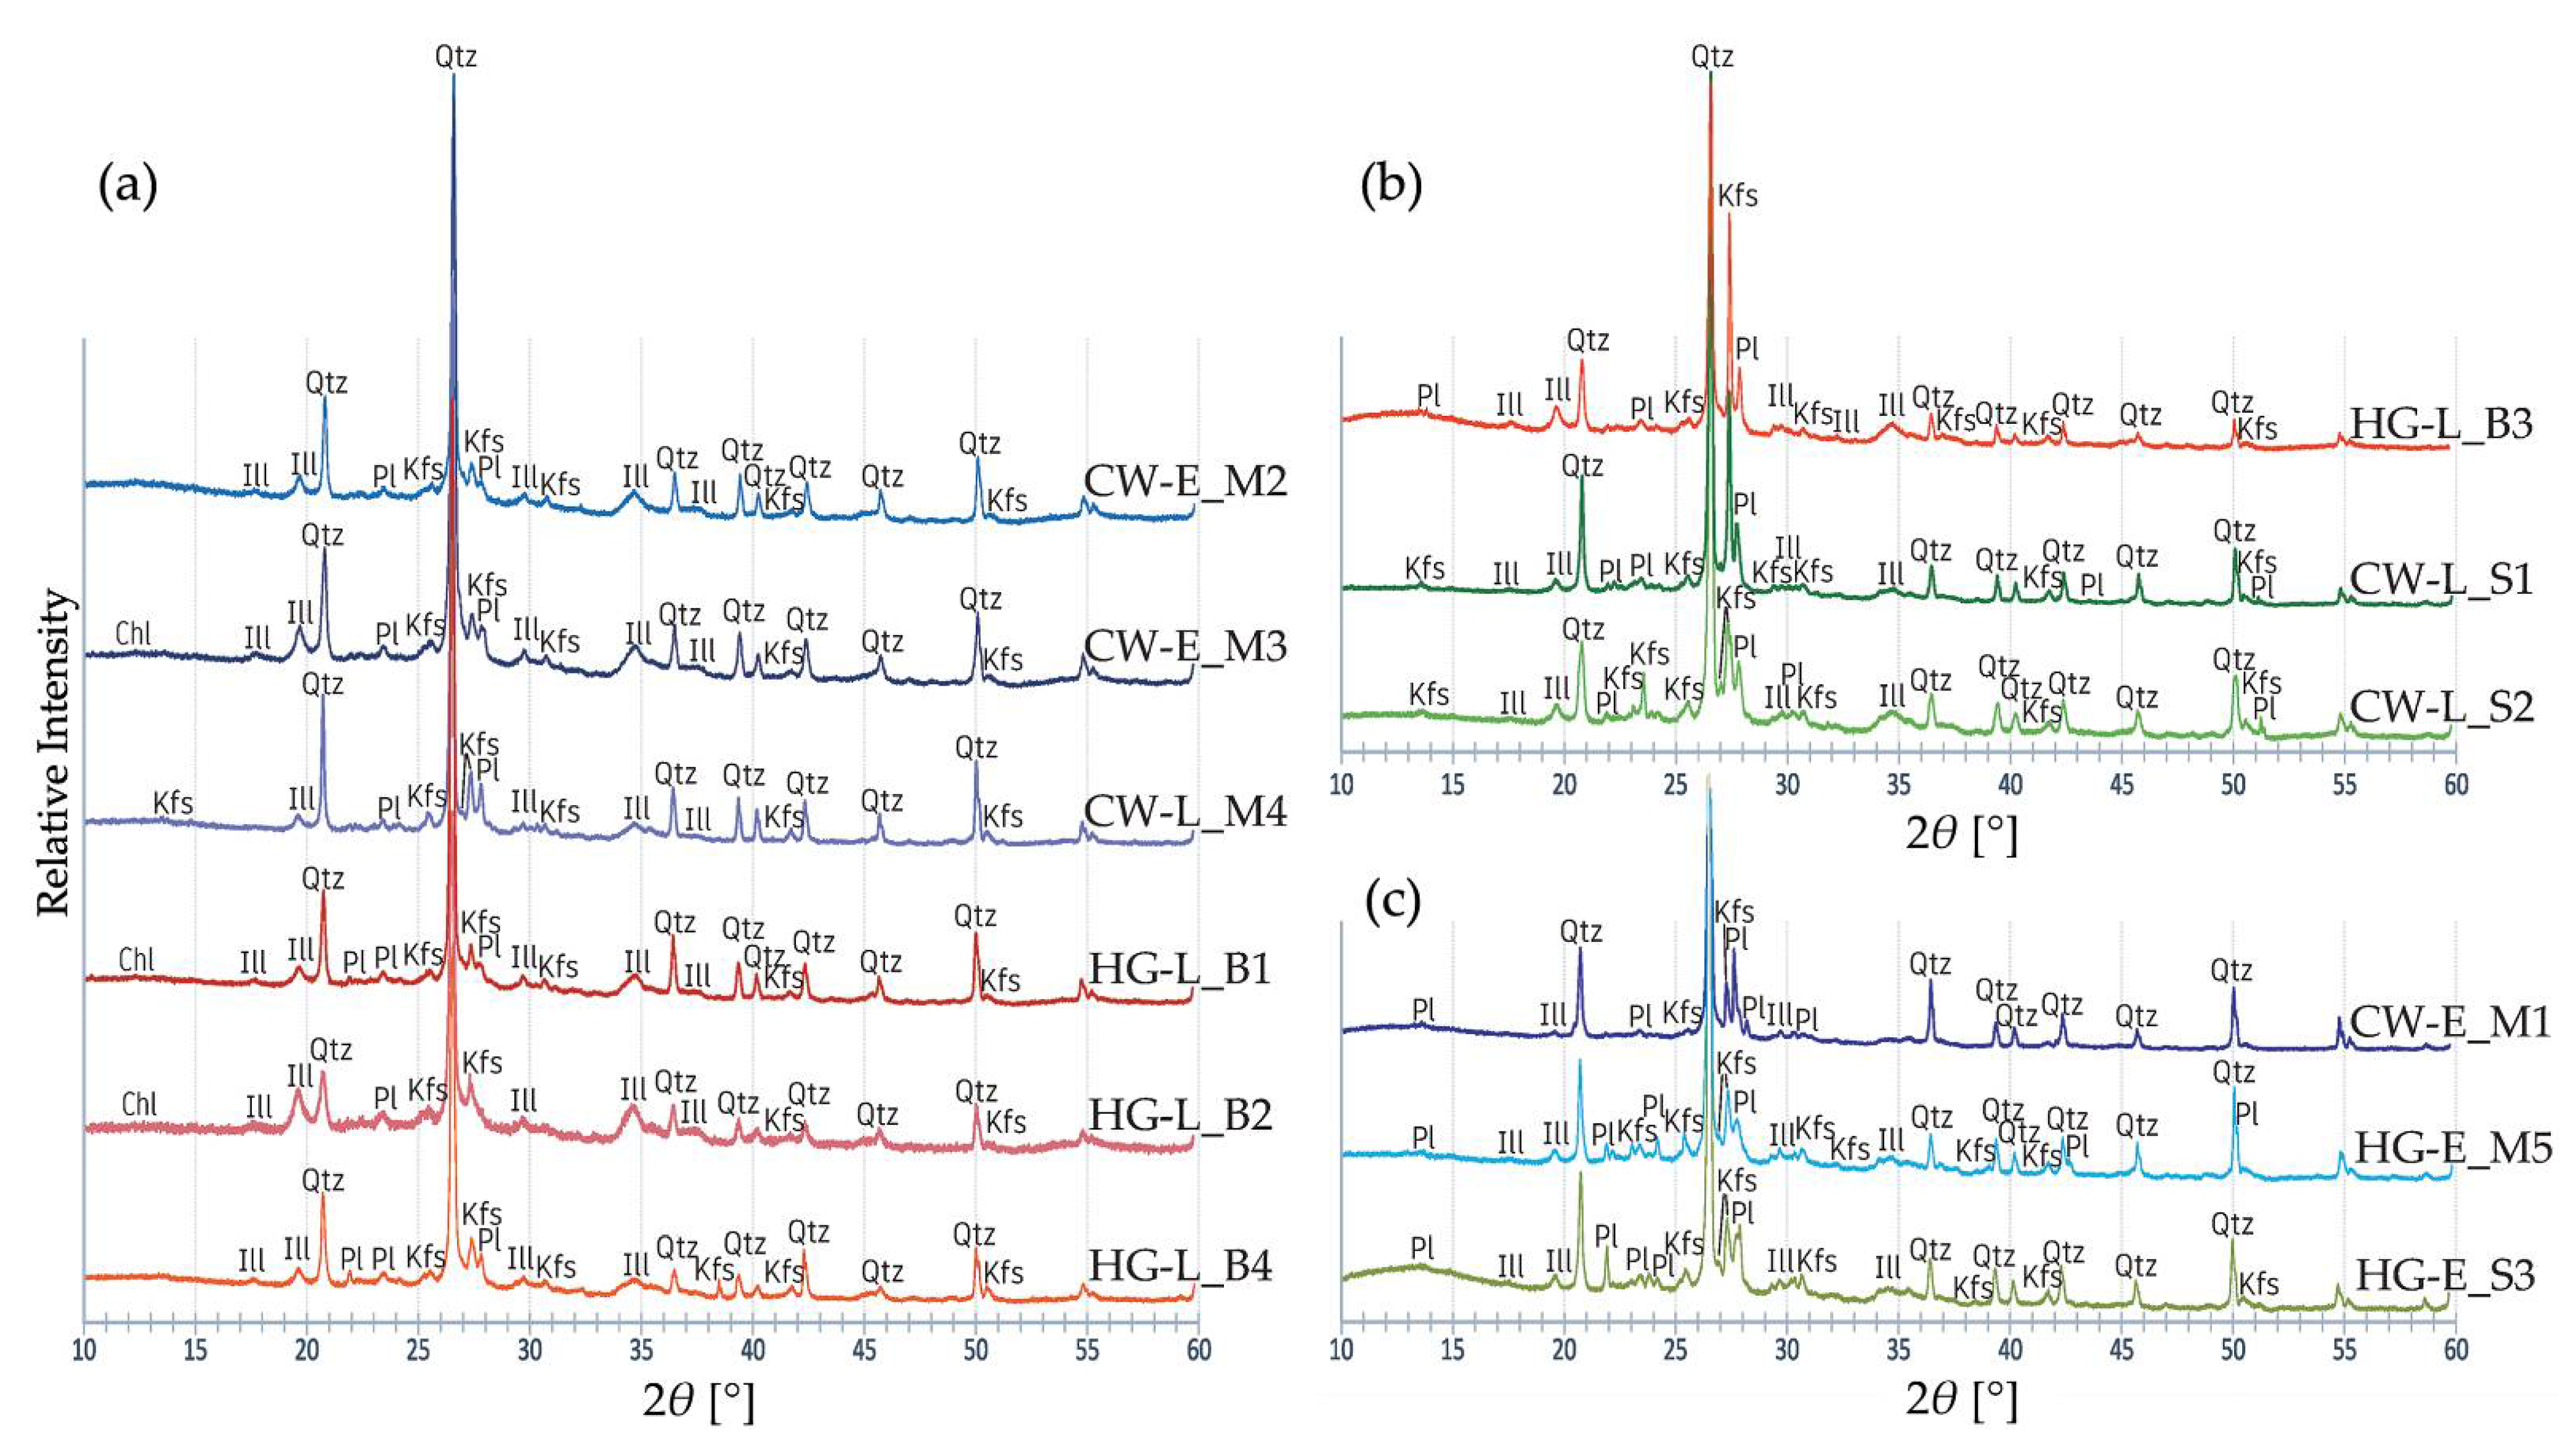
3.5. Mineralogical Characterisation Using X-ray Diffraction (XRD)
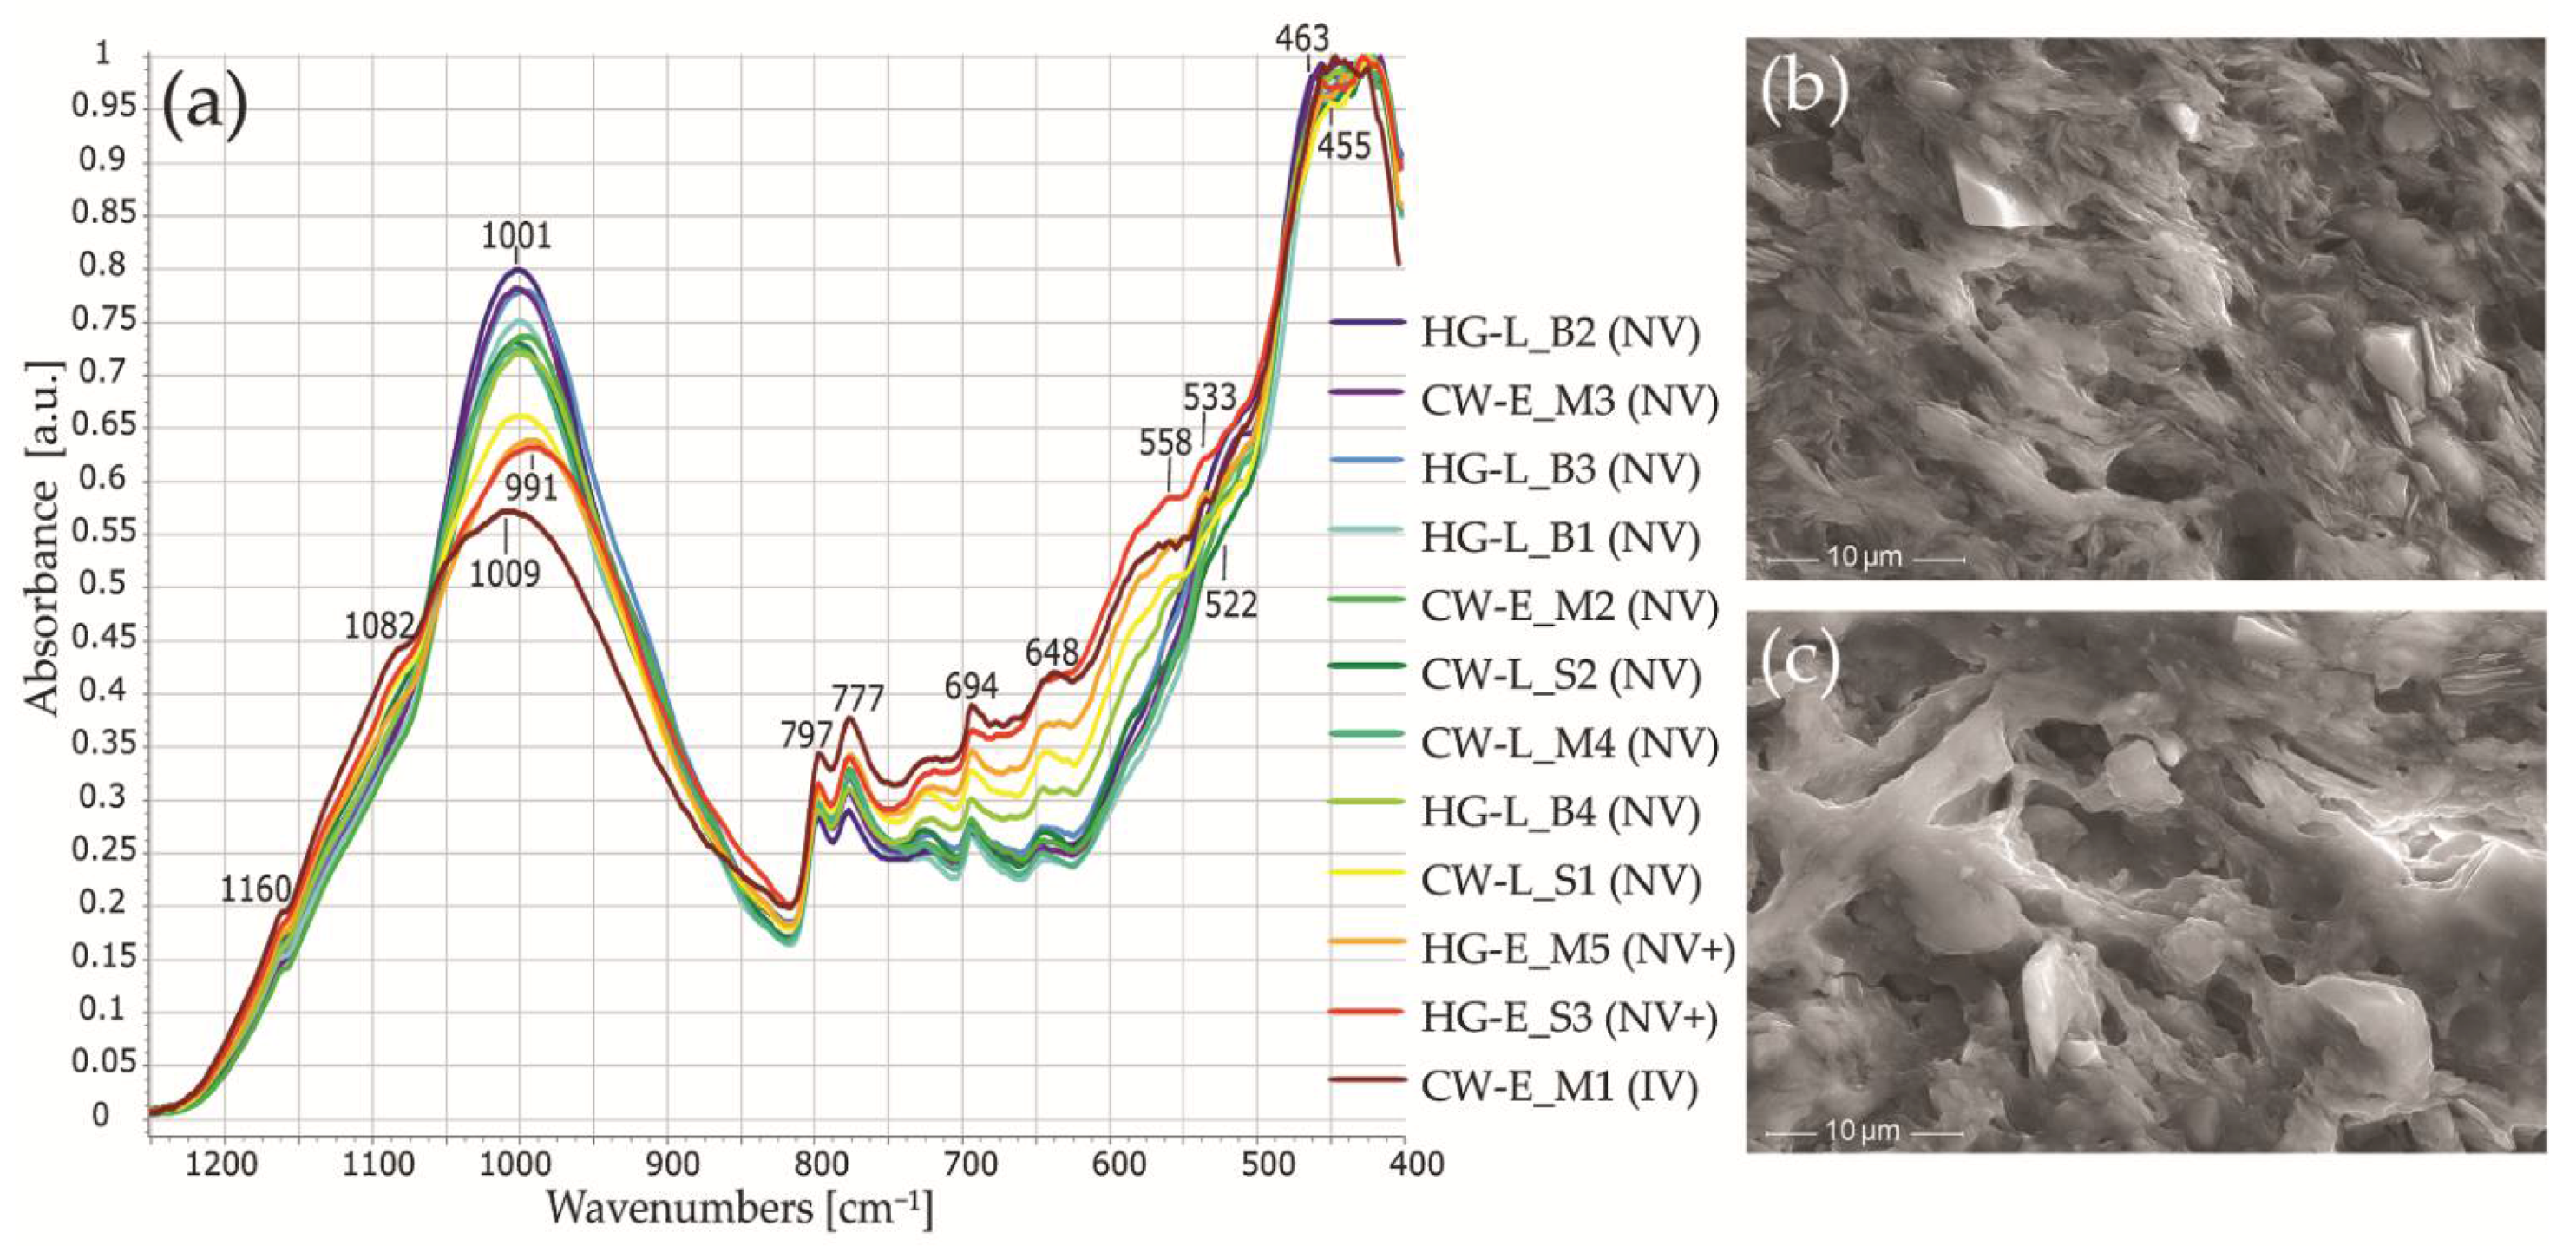
3.6. Examination of Minerals and Firing Temperatures Using Fourier Transform Infrared Spectroscopy (FTIR) Data
3.7. Mineralogical Analysis Using Scanning Electron Microscopy with Energy-Dispersive X-ray Spectroscopy (SEM-EDS)
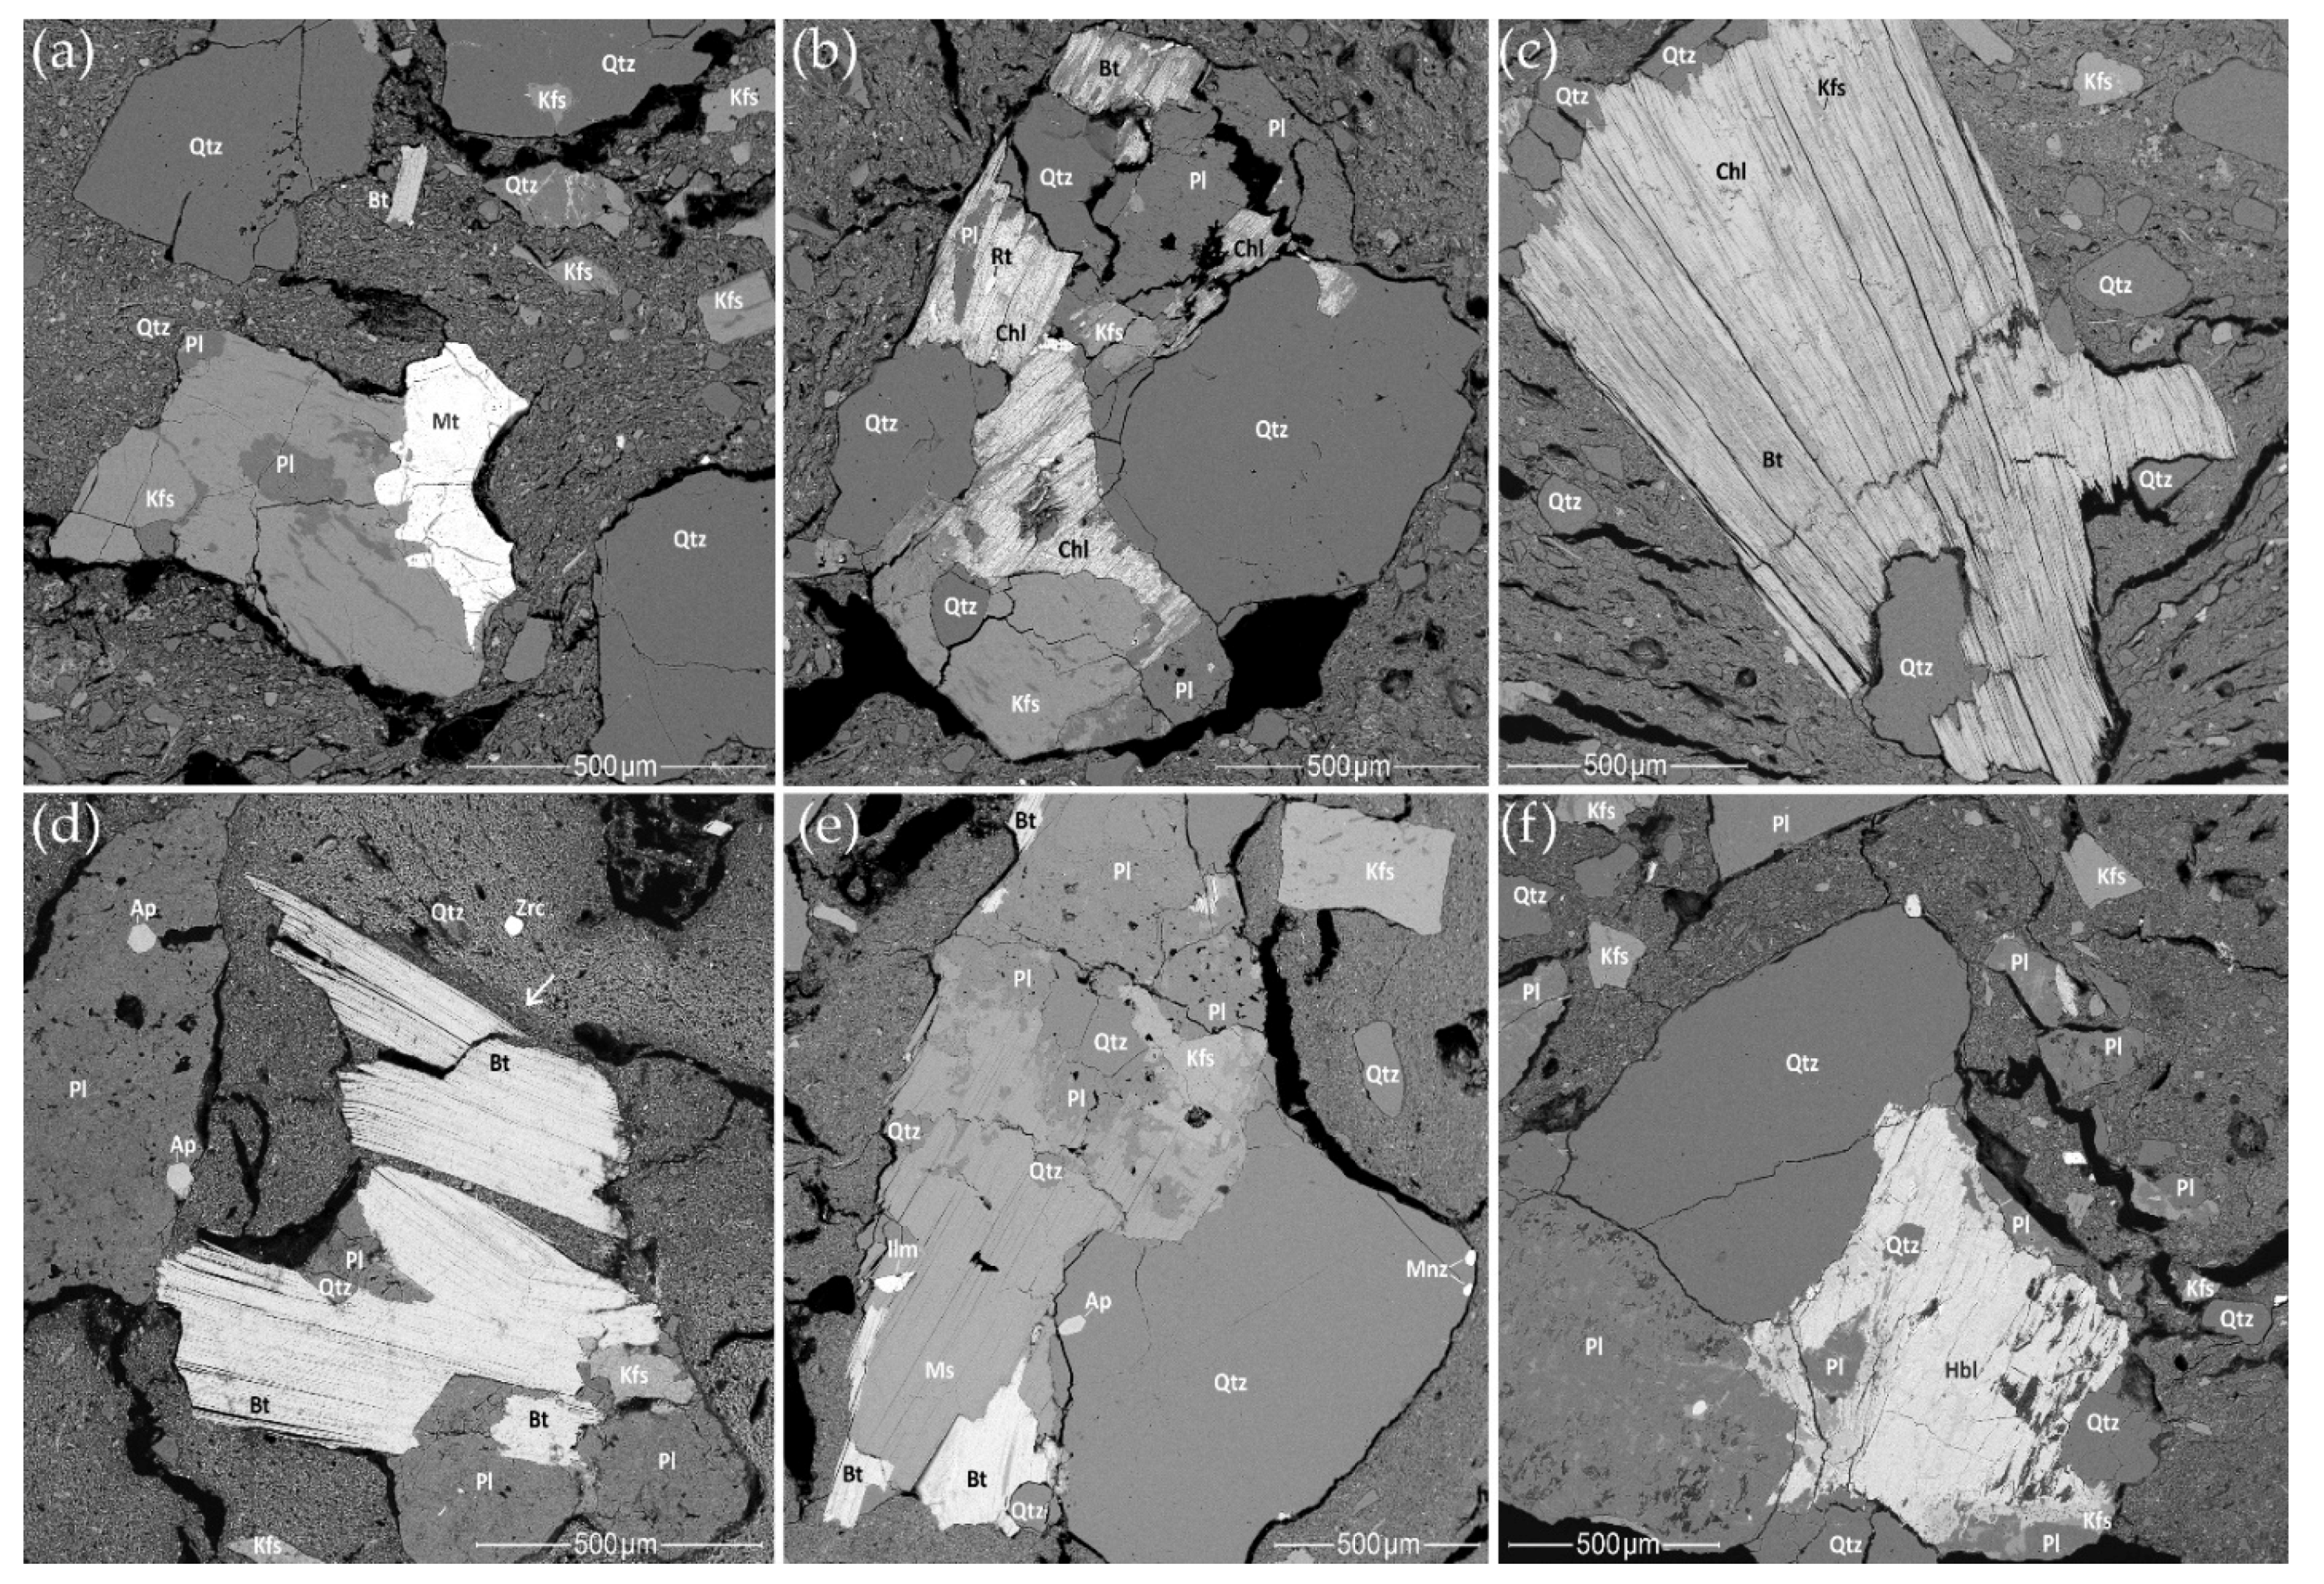
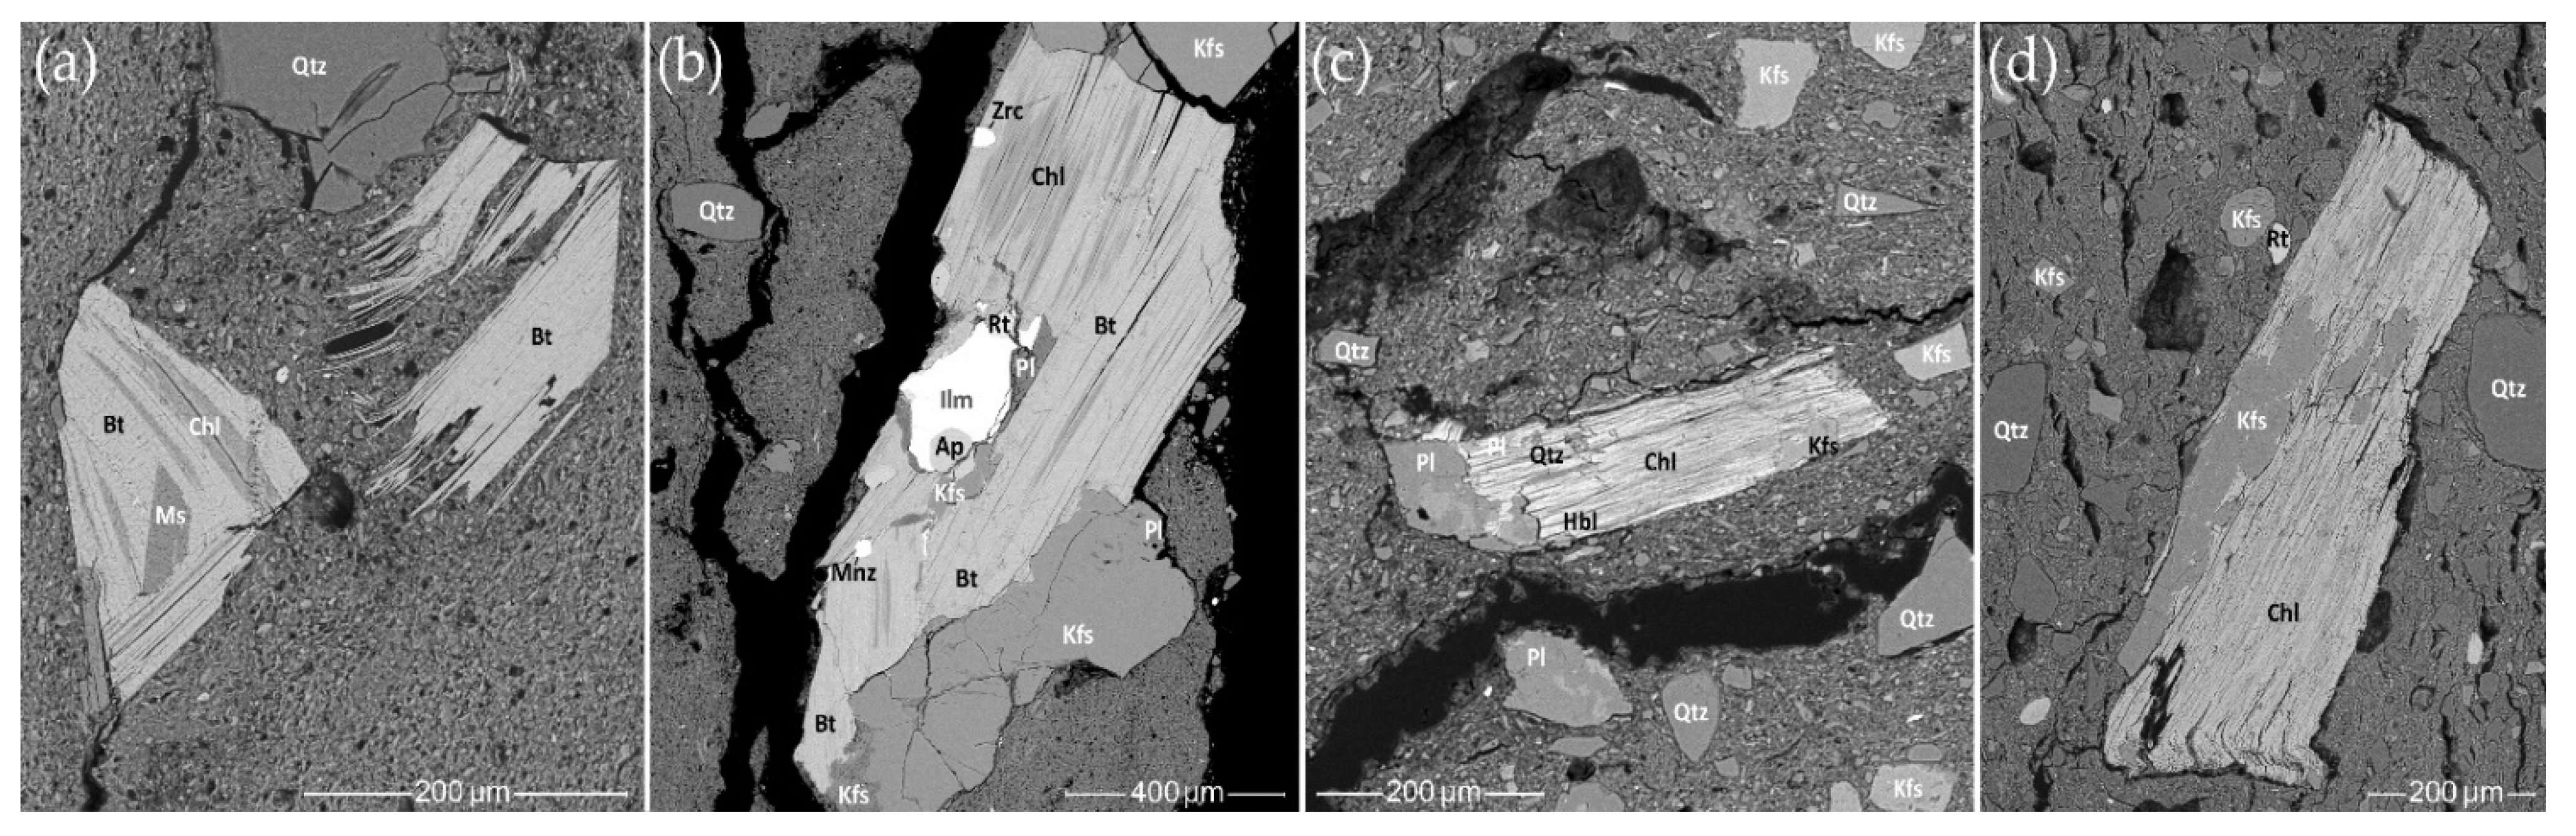
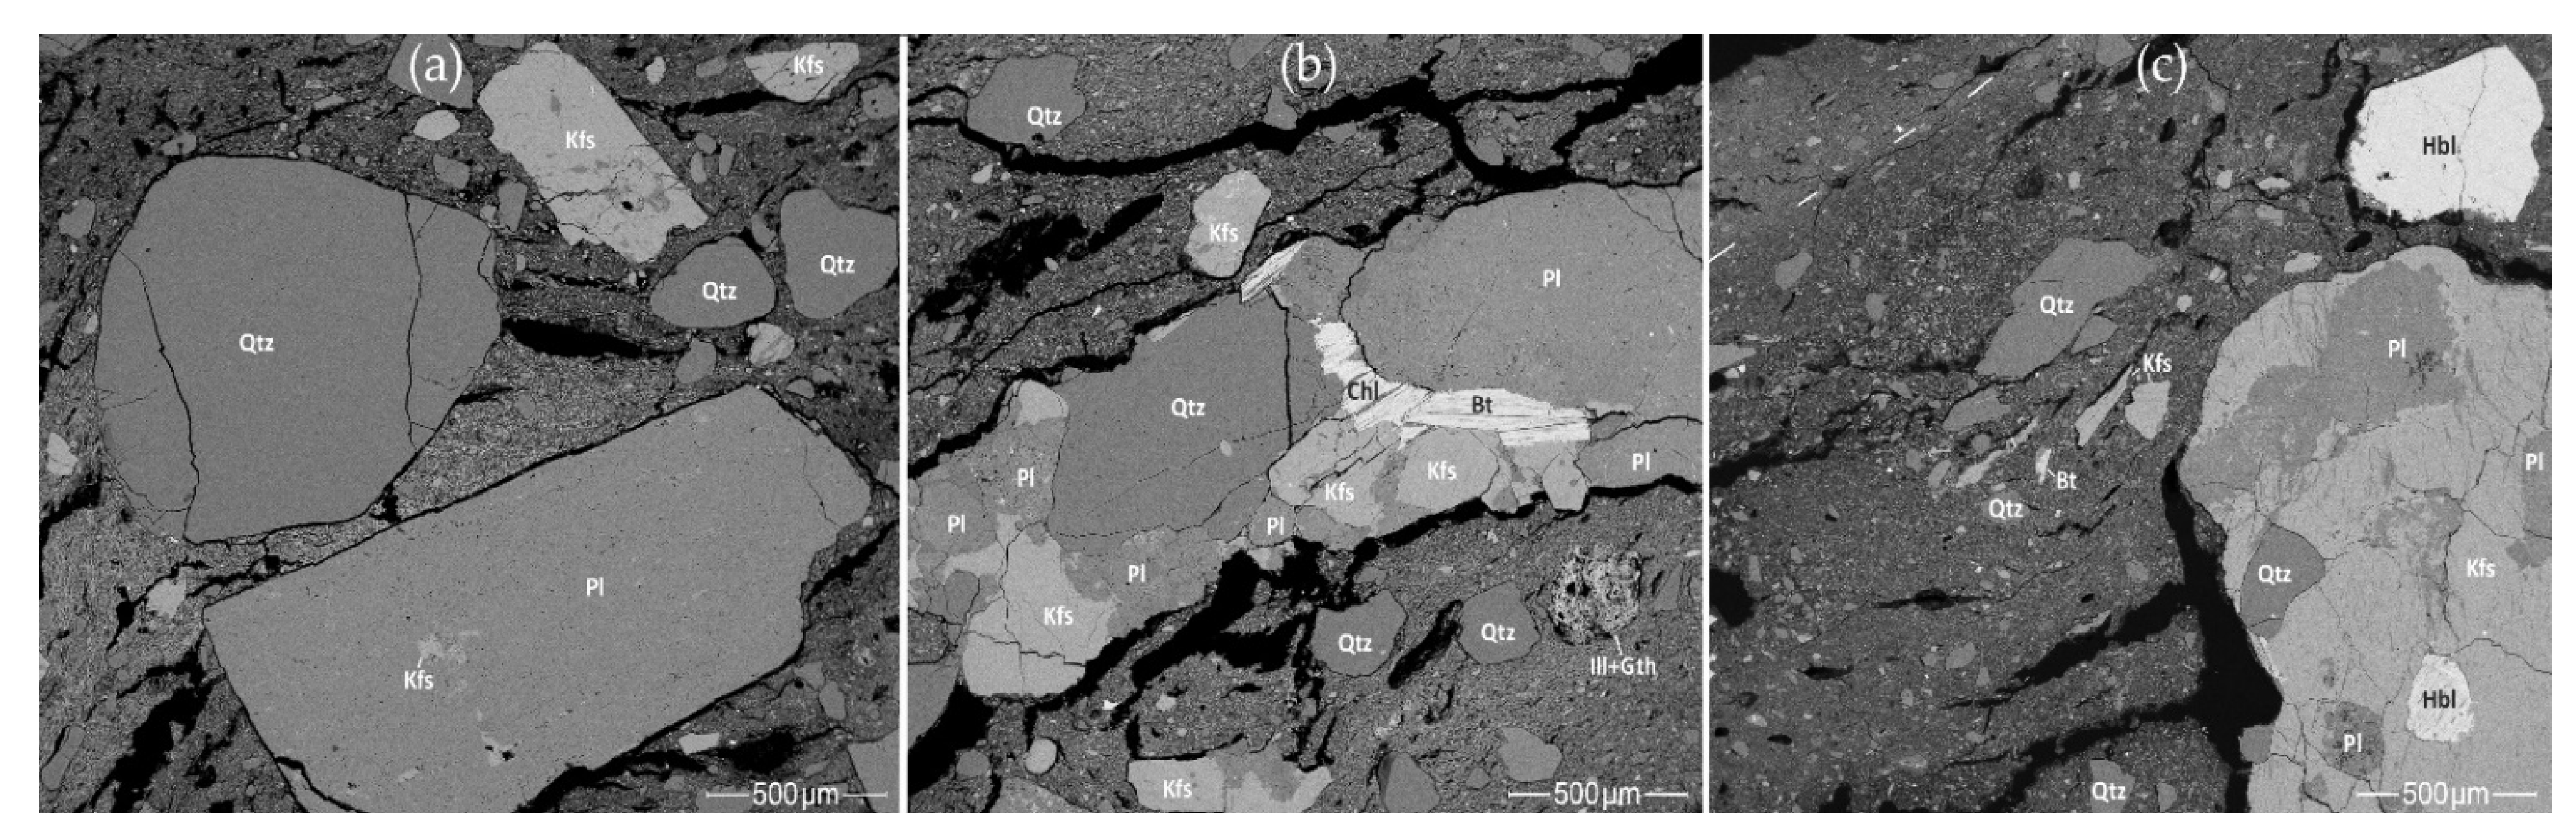
3.7.1. Rock Fragments and Mineral Inclusions
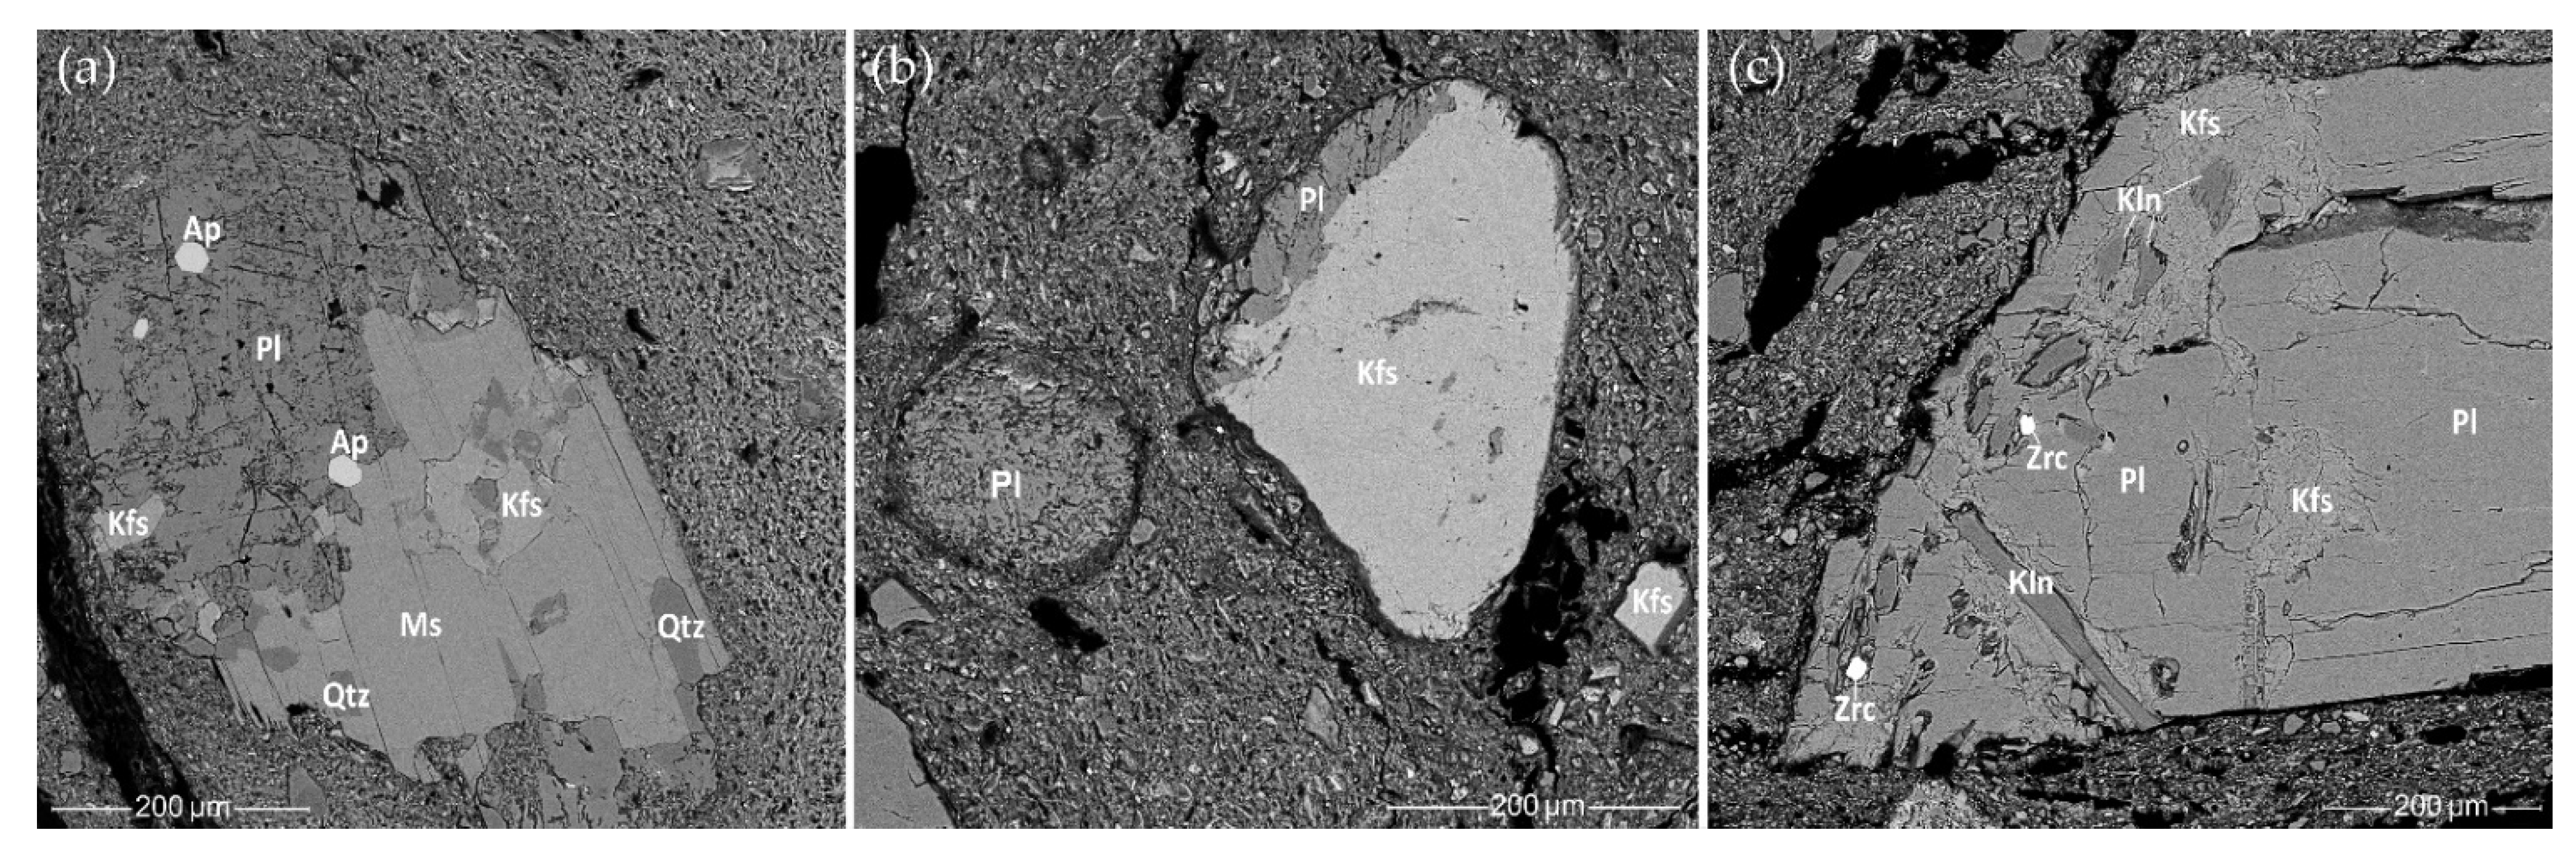
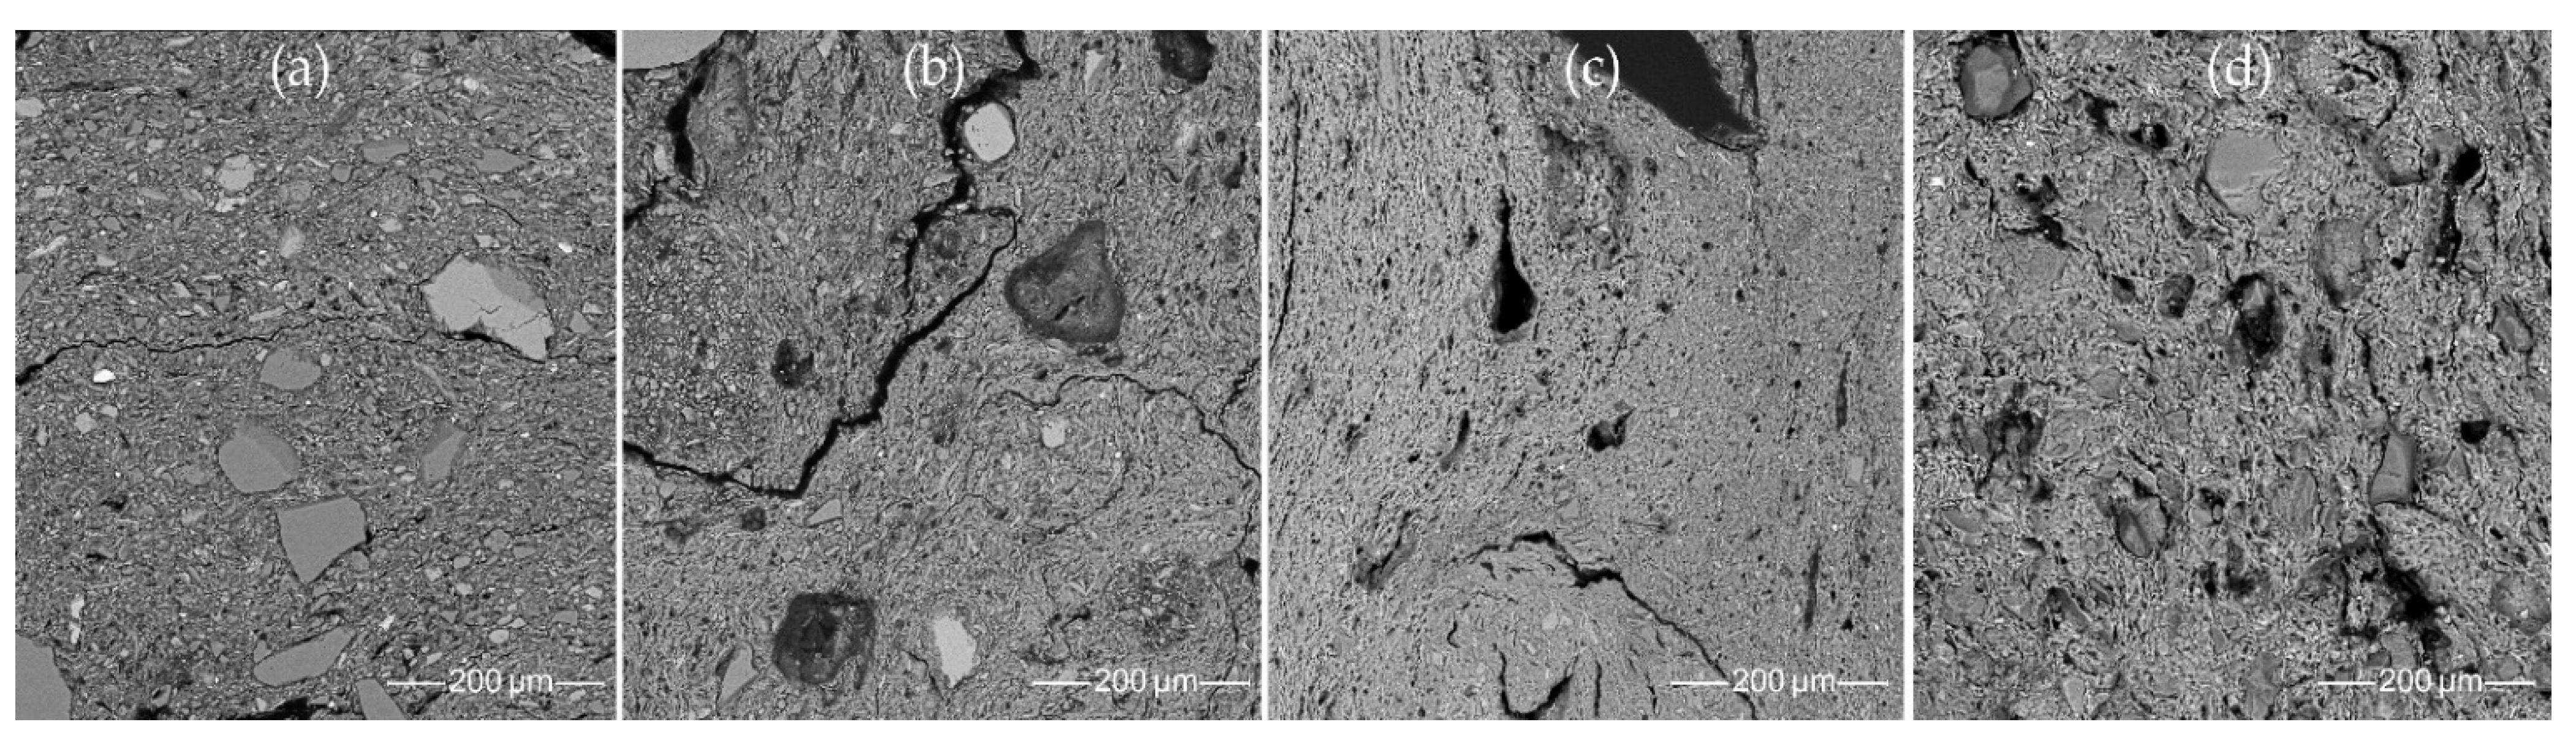
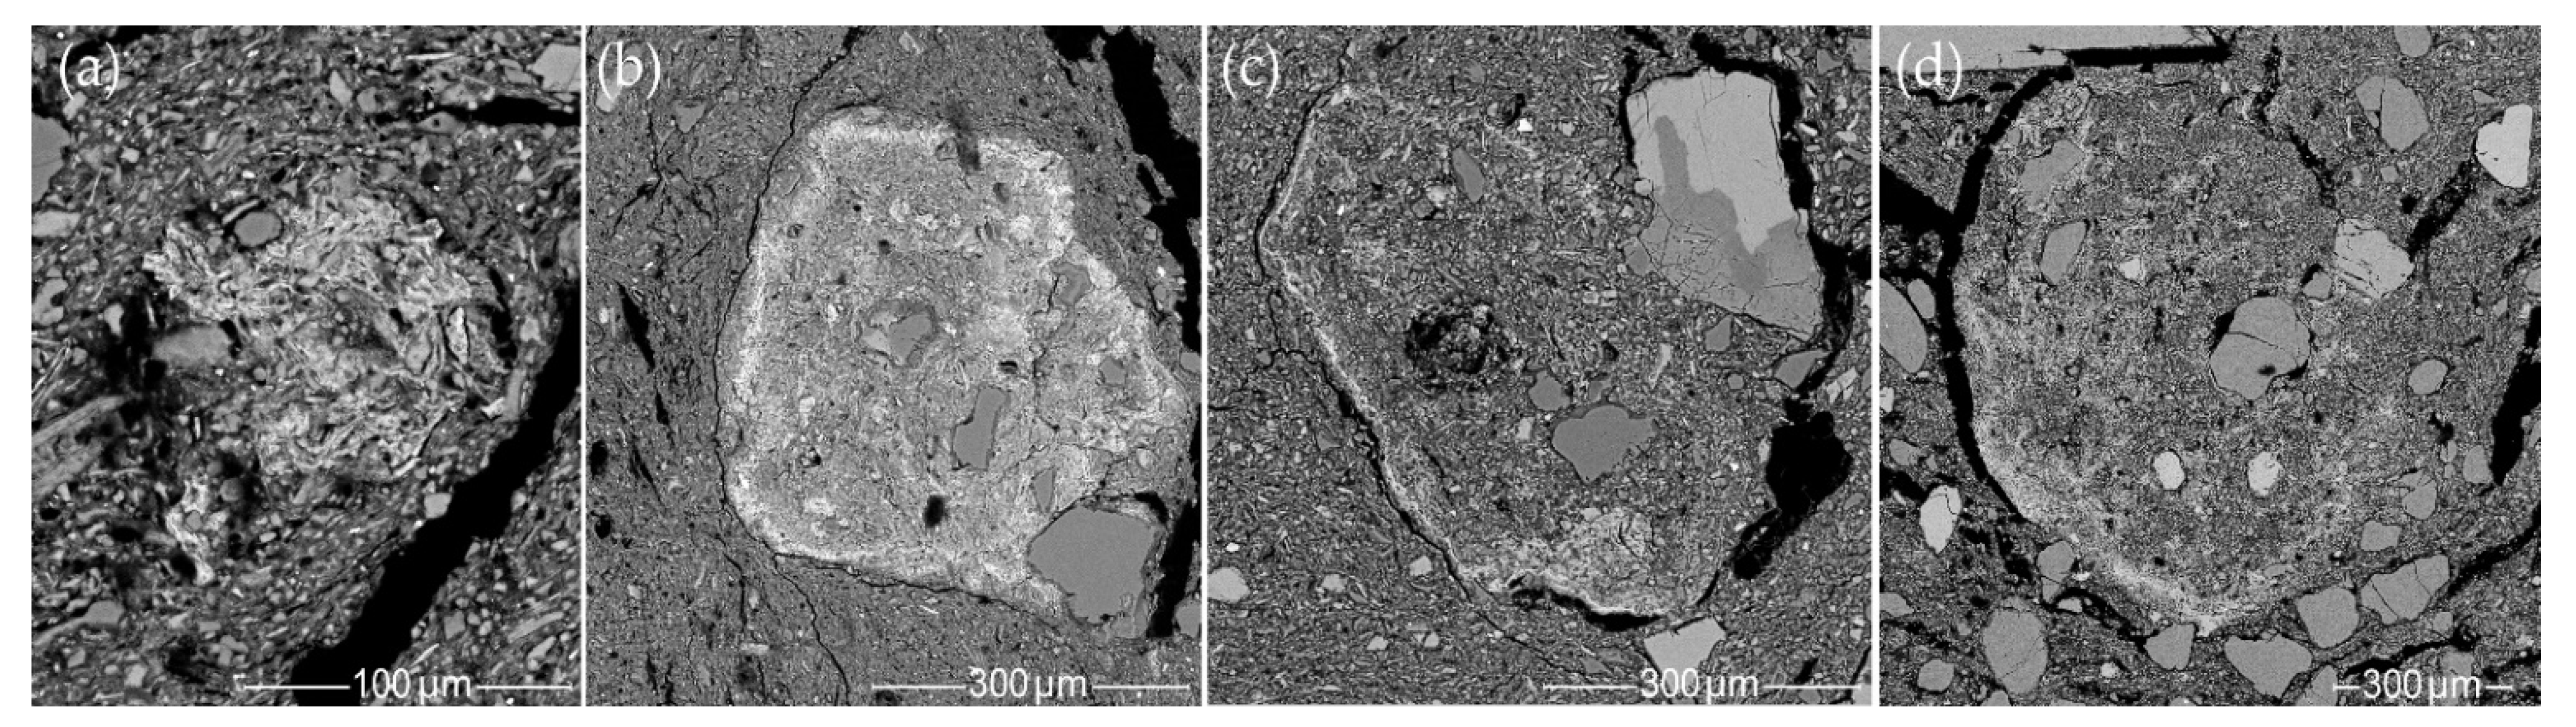
3.7.2. Mineralogical Composition of the Clay Matrix
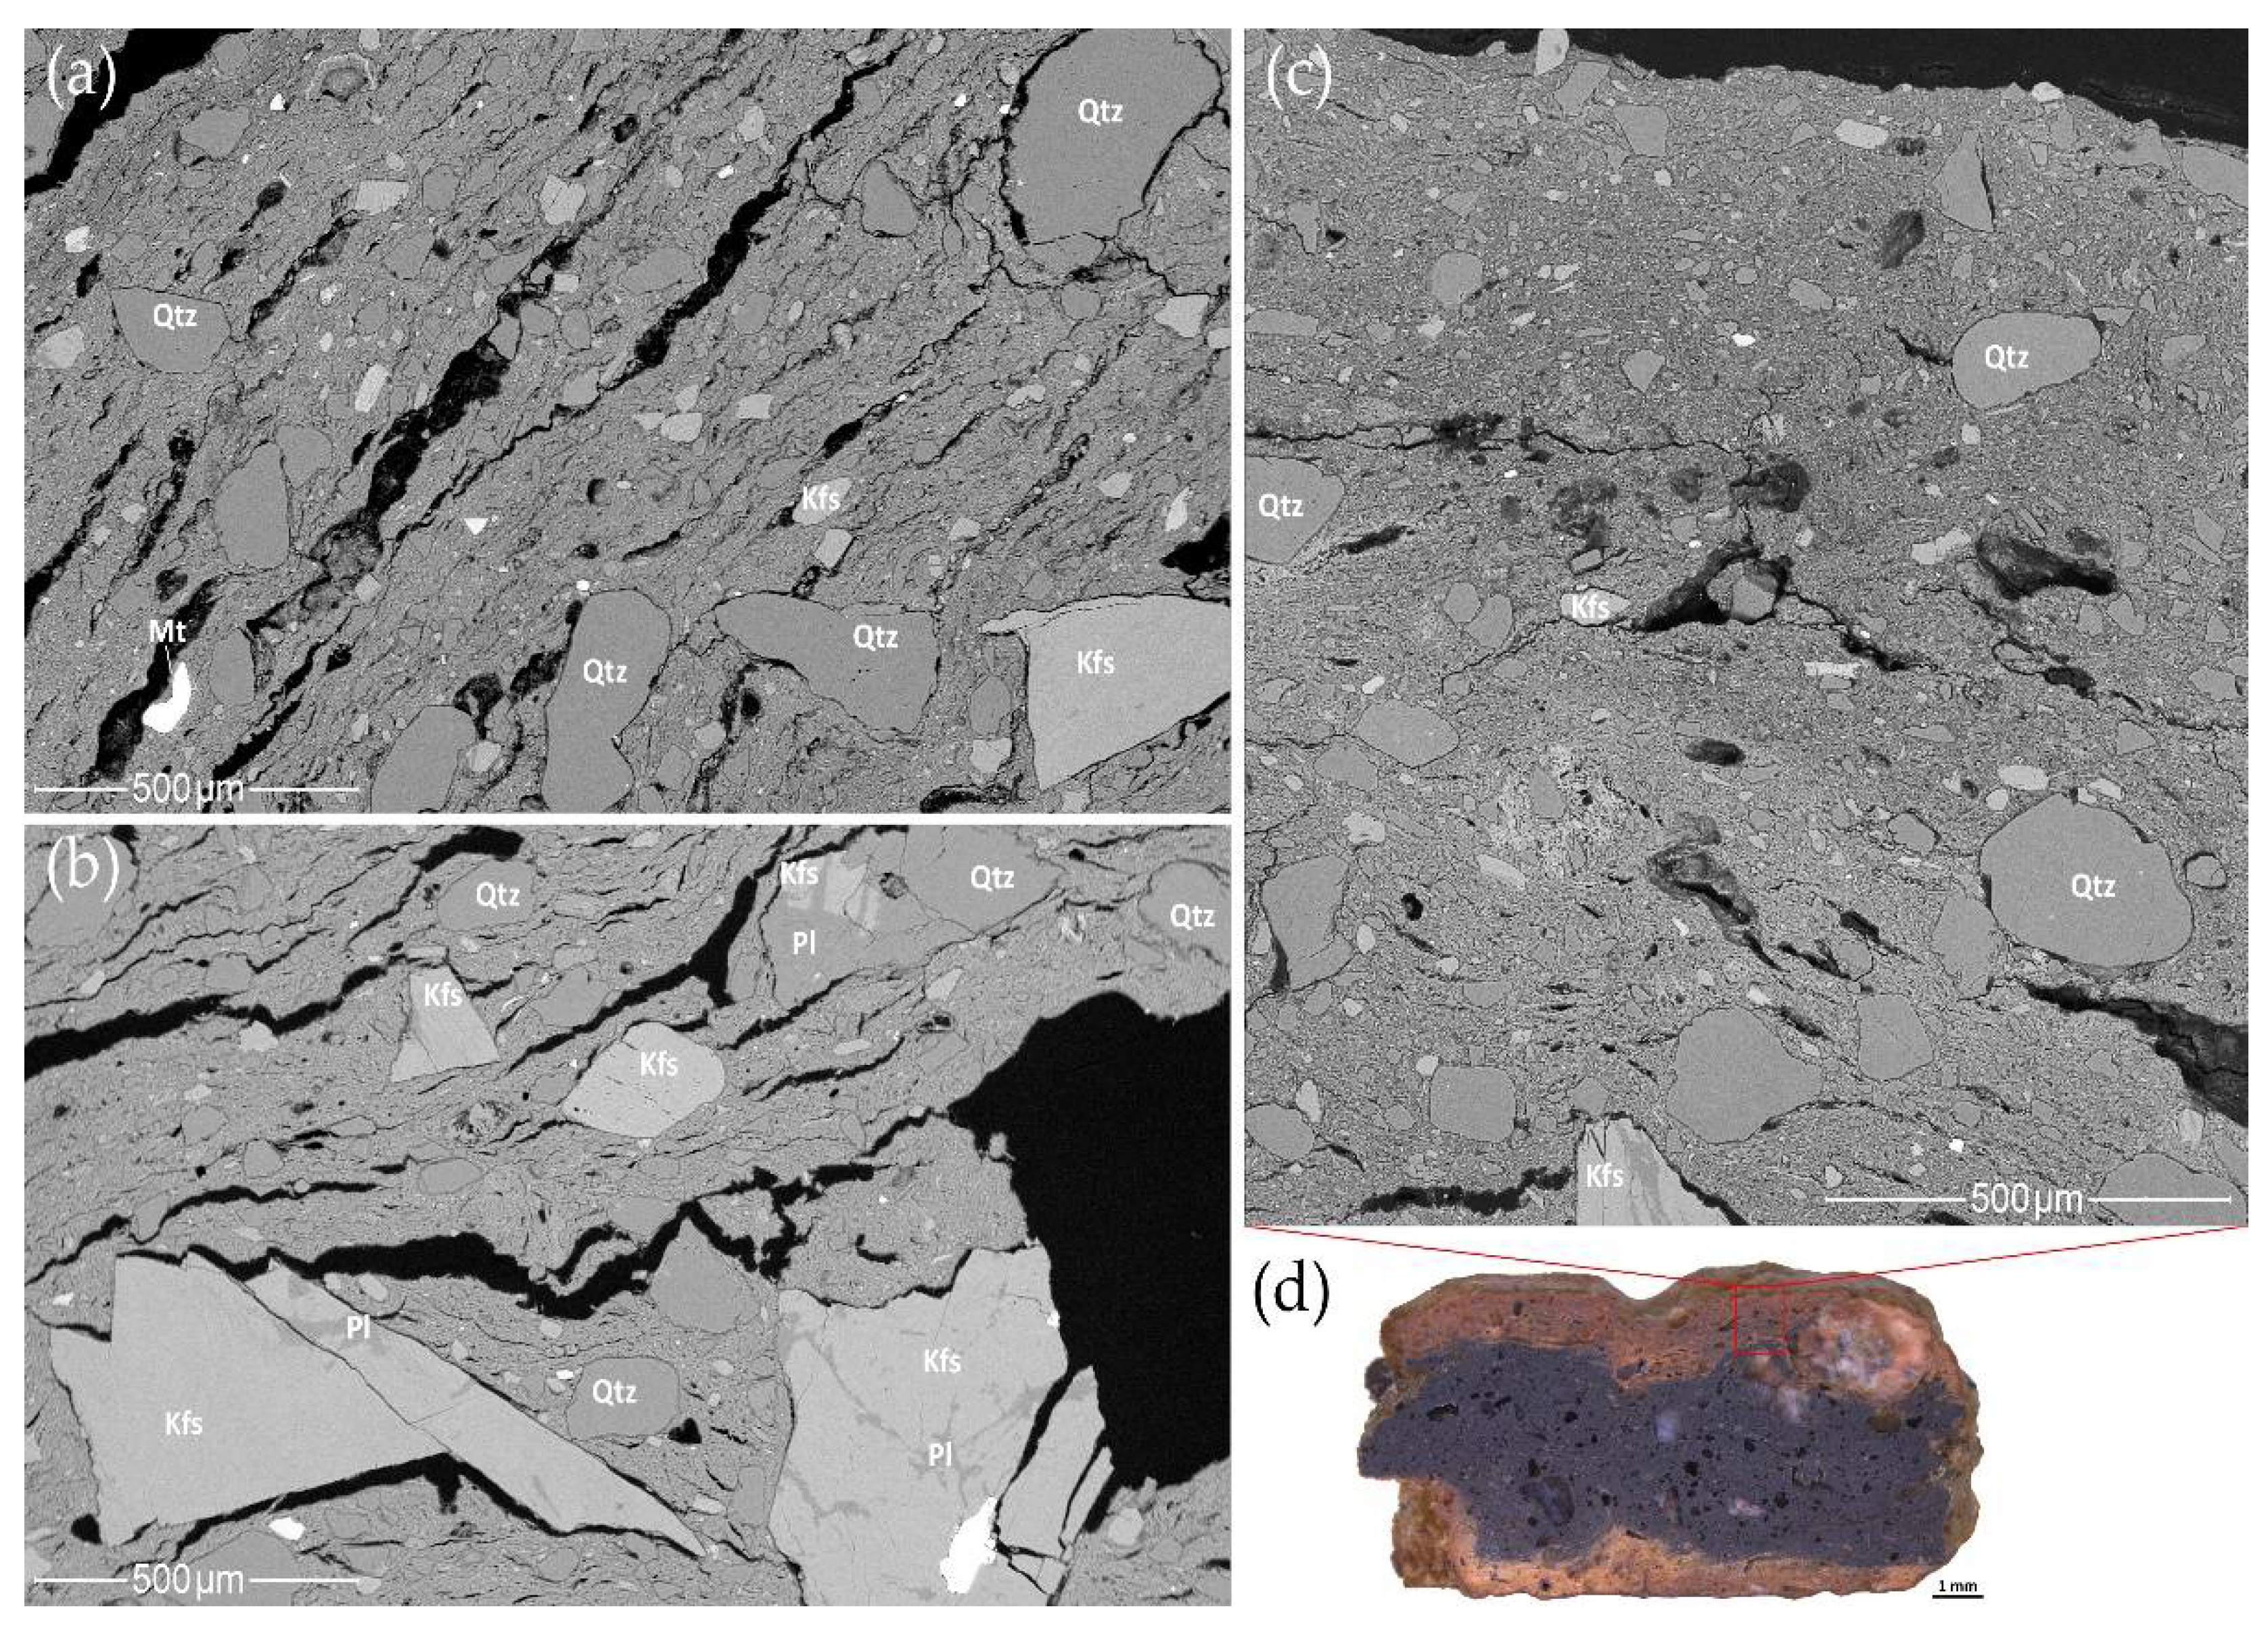
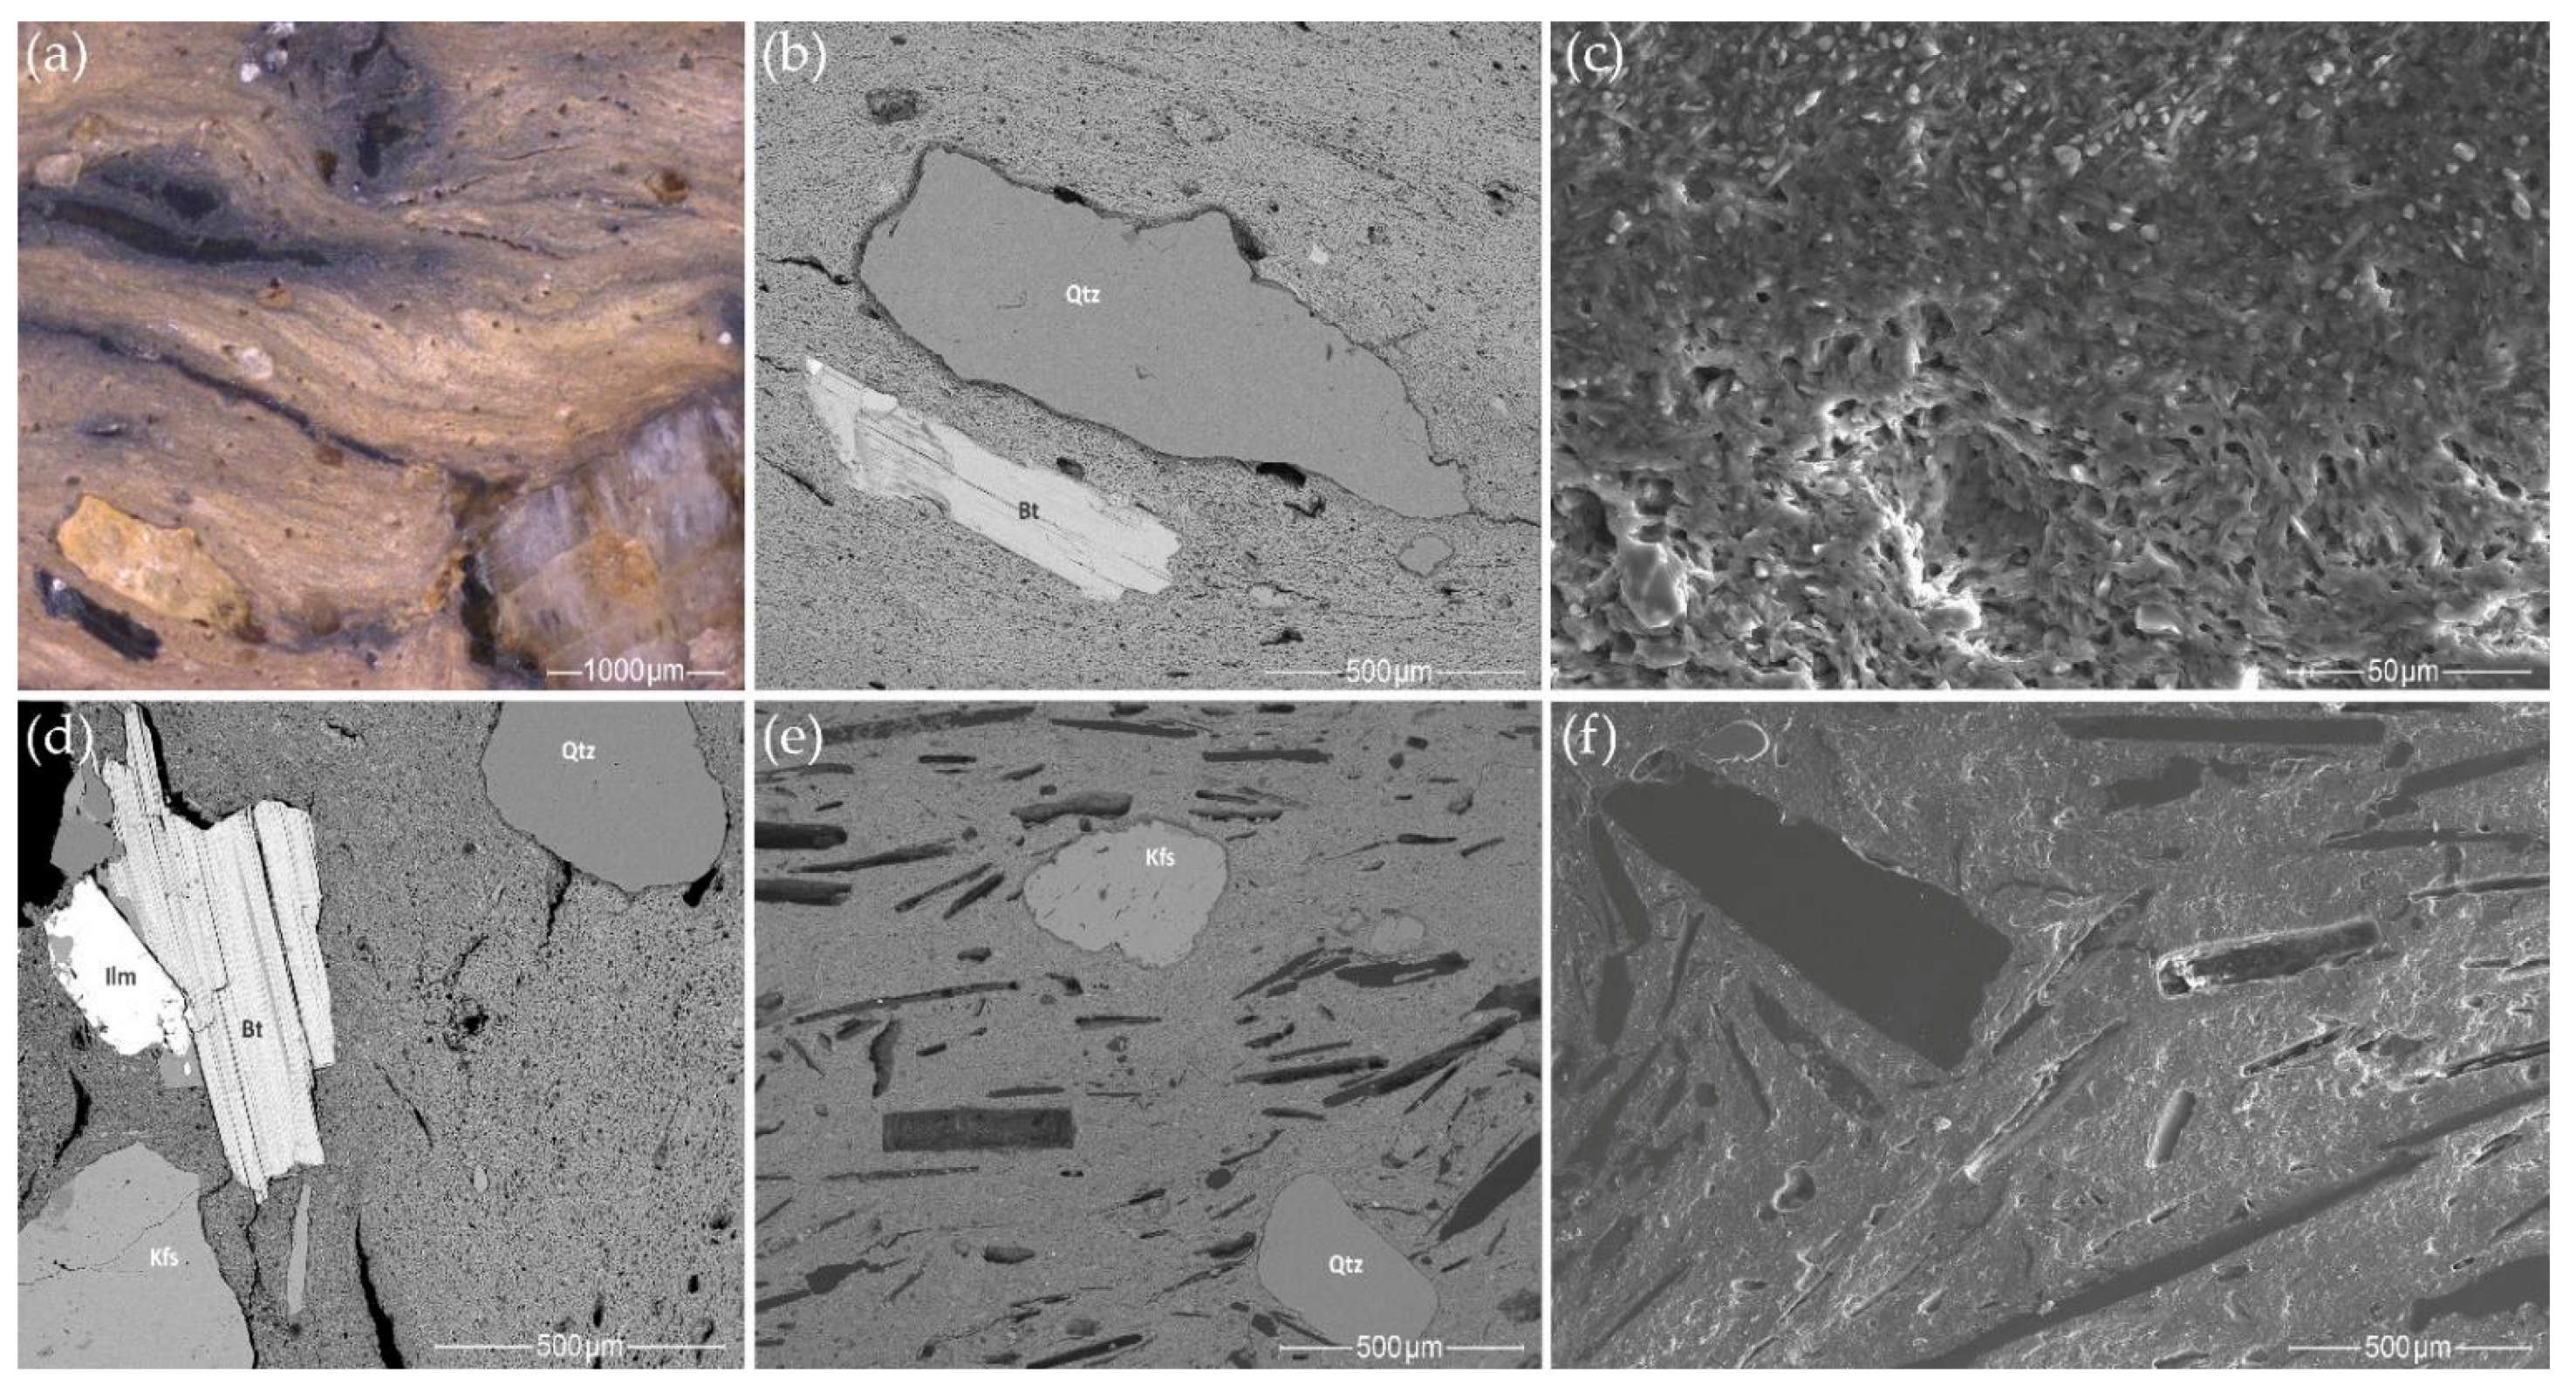
- Most samples from the Margiai and Šakės settlements (CW-E_M1, CW-E_M2, CW-E_M3, HG-E_M5, CW-L_S1, CW-L_S2, HG-E_S3) consist of poorly weathered micaceous silty clay with abundant clay–silt size, mainly felsic and accompanying minerals (magnetite, zircon, ilmenite) (Figure 15a,b). The clay matrix is characterized by low to good adhesion and high variability of chemical composition. Such variegated residual clays [24] should be characteristic of glacial till sediments [113].
- The samples from the Barzdis settlement (HG-L_B2, HG-L_B3, HG-L_B4) contain mature, highly weathered fine clay with a spongy texture of lath-like illite minerals [93] and show very good adhesion (Figure 15c). The chemical composition of the clay matrix is the closest to the typical illite (Tables S13 and S14) [78]. Such sedimentary clays [24] may be characteristic of glaciolacustrine sediments [114]. Despite the high proportion of silt and very fine sand-sized quartz grains, samples CW-L_M4 (Figure 15d) and HG-L_B1 may be assigned to the same type based on the spongy texture of the highly weathered mature clay. It is difficult to determine whether these water-worn quartz grains, probably from lacustrine or alluvial sediments, are of natural or intentional temper, but this homogenous distribution argues in favor of a natural origin for the quartz grains in the clay.
3.8. Identification of Technological Styles through a Geochemical and Mineralogical Approach
3.8.1. Early Coarse Pottery
3.8.2. Classic Corded Ware
3.8.3. Late Fine Pottery
3.8.4. Late Corded Ware
3.8.5. Late Coarse Pottery
4. Conclusions
- A comparative analysis of the elemental amounts in the clay matrix (via SEM-EDS detection of ten major elements) and the bulk composition (via XRF of the same ten major elements and an additional eleven trace microelements) revealed the following geochemical features:
- (i)
- Compared to the mean content in the upper continental crust, the clay matrix and the bulk geochemical composition displays a marked enrichment of P. Slightly lower enrichment was observed for K, Ti, Fe, and Al. However, the ceramic samples are characterized by lower amounts of Ca, Na, and Si.
- (ii)
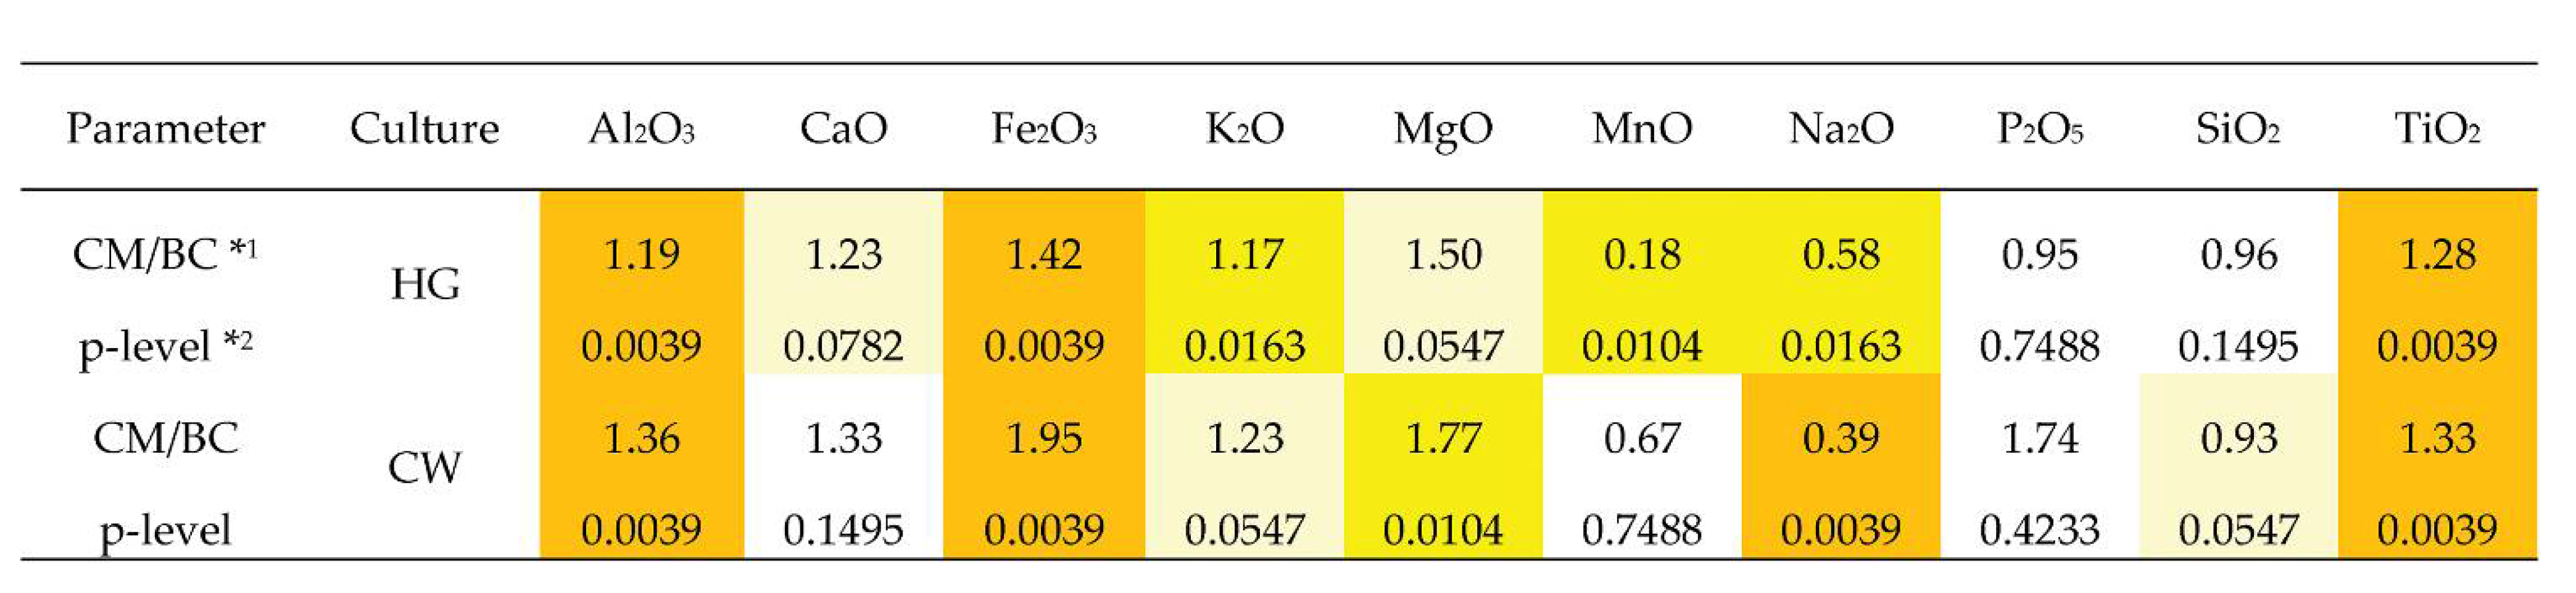
- A statistically strong difference (at a p < 0.01 significance level) was confirmed for the higher enrichment of Mg, Fe, Ti, Ca, Al, and K in the clay matrix compared to the bulk composition and lower amounts of Na, Si (p < 0.01), and Mn (0.01 < p < 0.05).
- (iii)
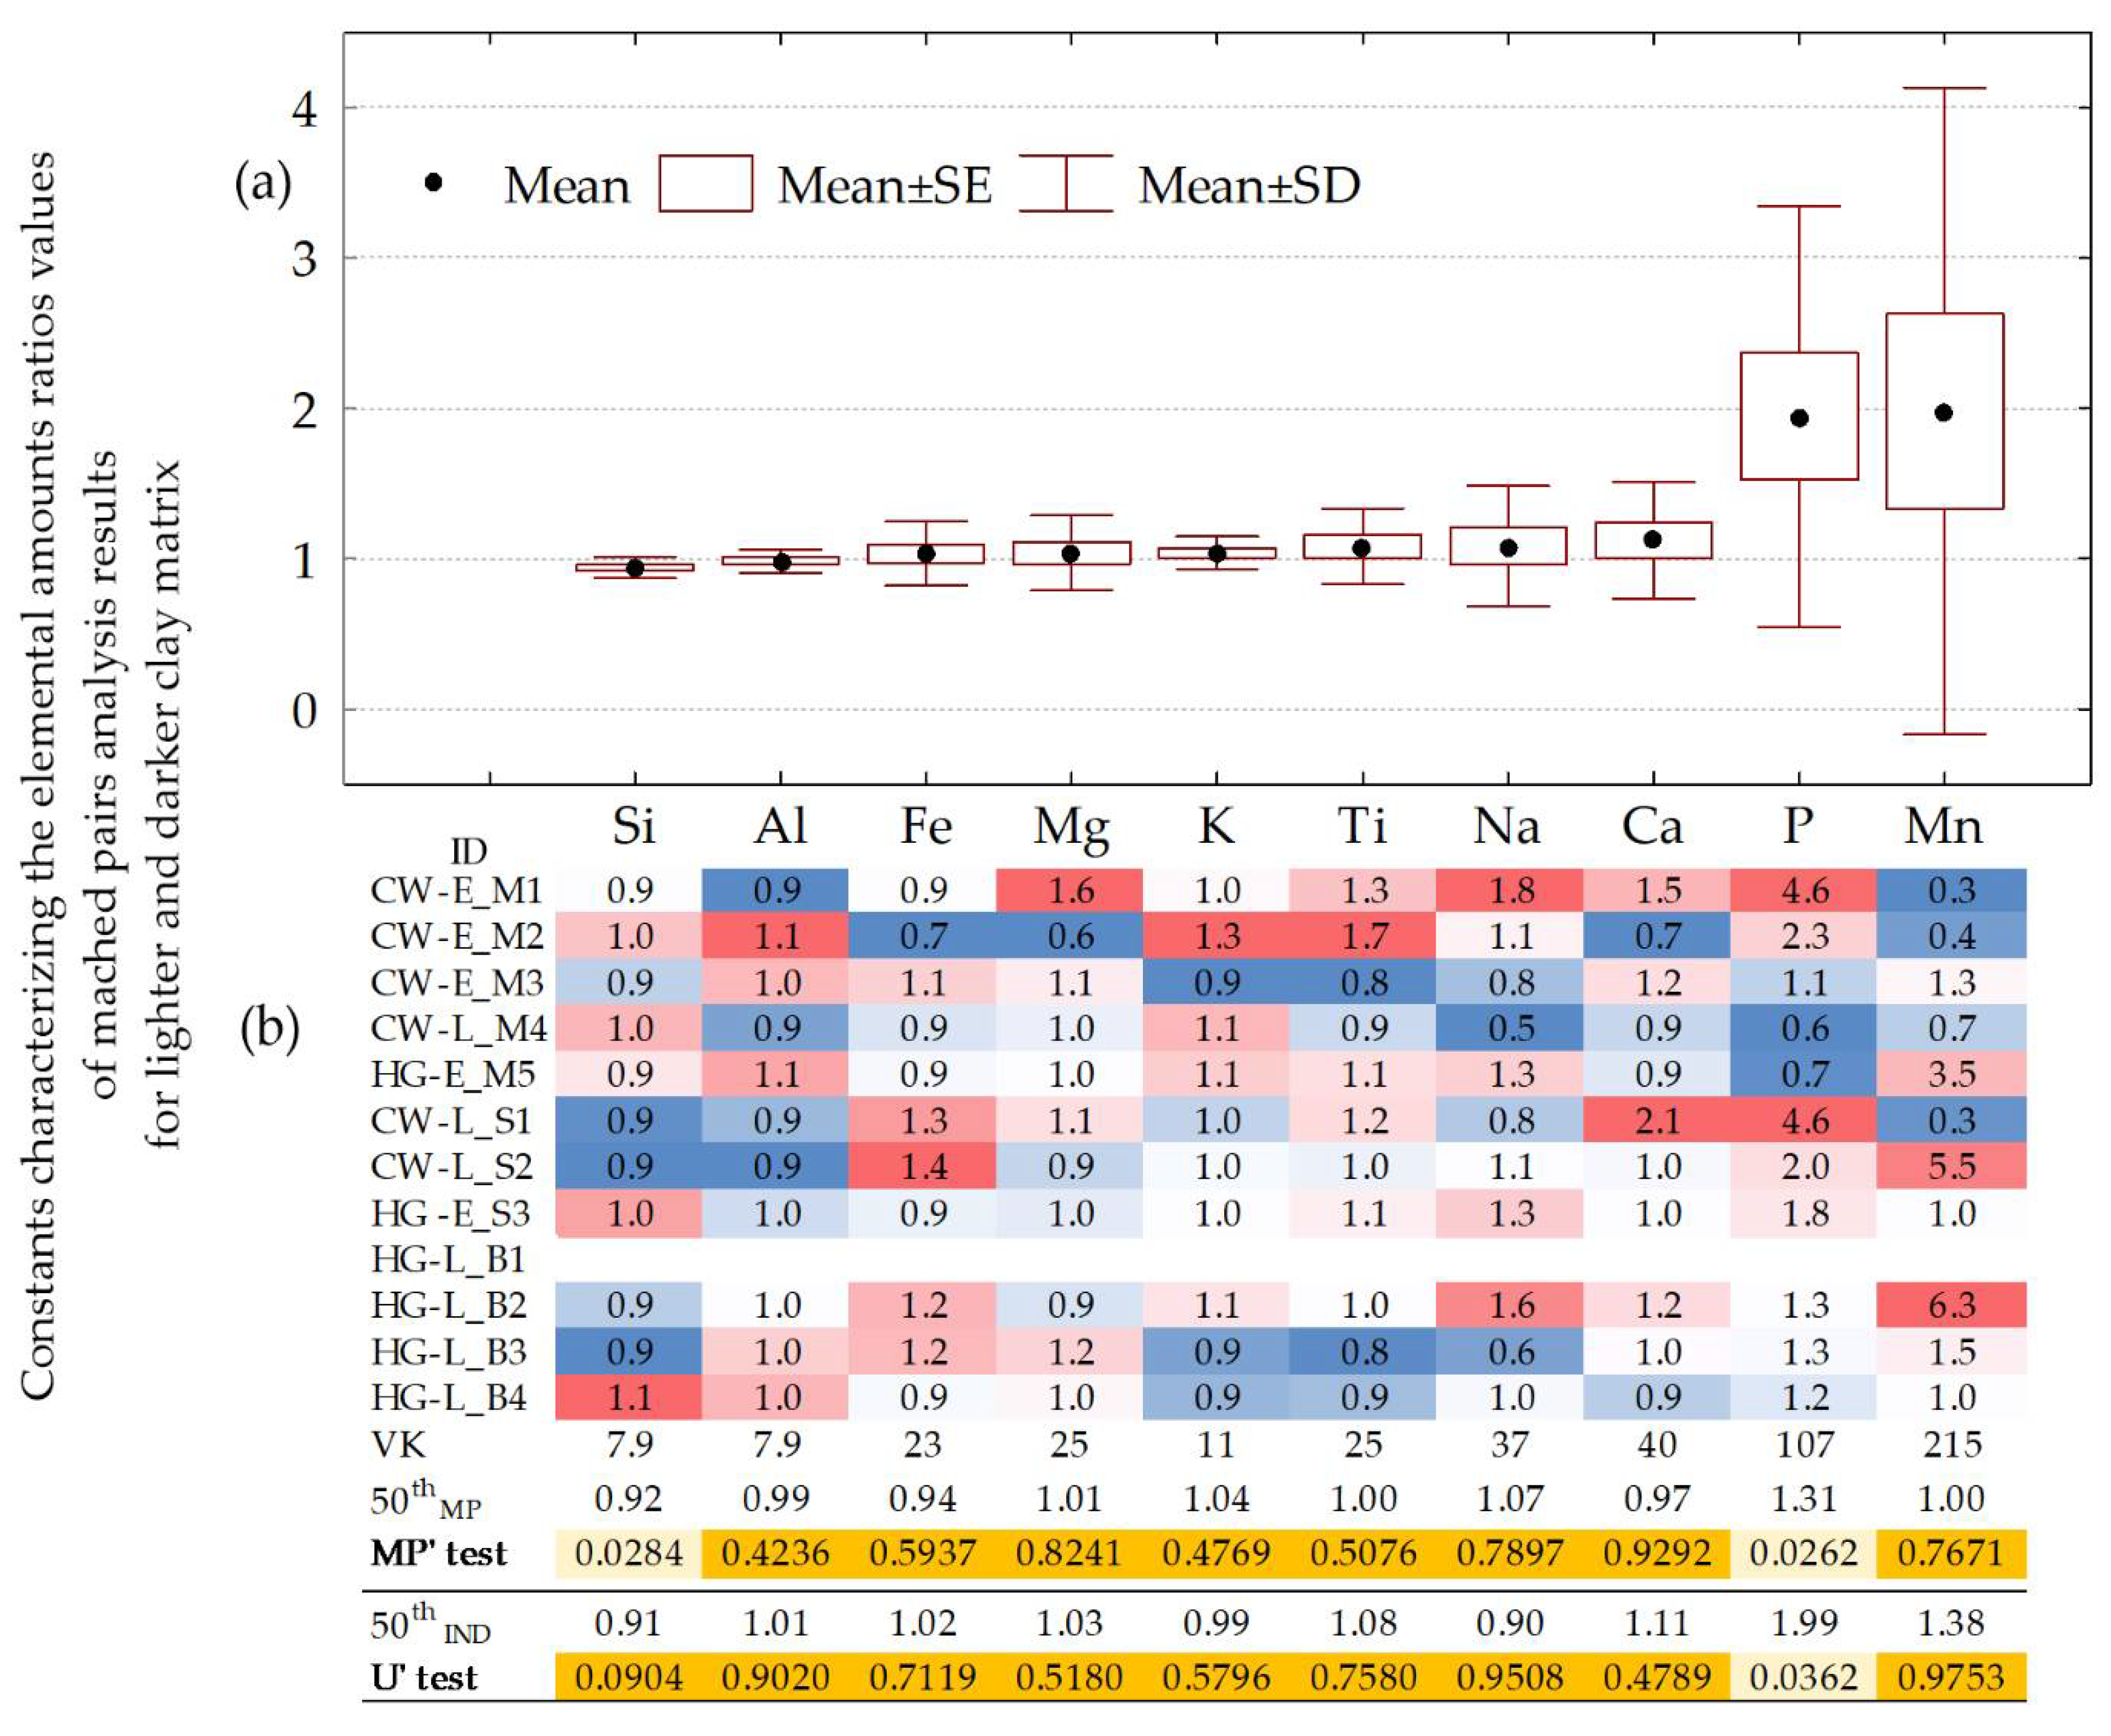
- No strong difference (p < 0.01) was found for any of the ten major elements, compared to their amounts in the composition of the lighter and darker material of the clay matrix. Only at the 0.01 < p < 0.05 significance level was it confirmed that the lighter clay matrix is richer in P but poorer in Si.
- (iv)
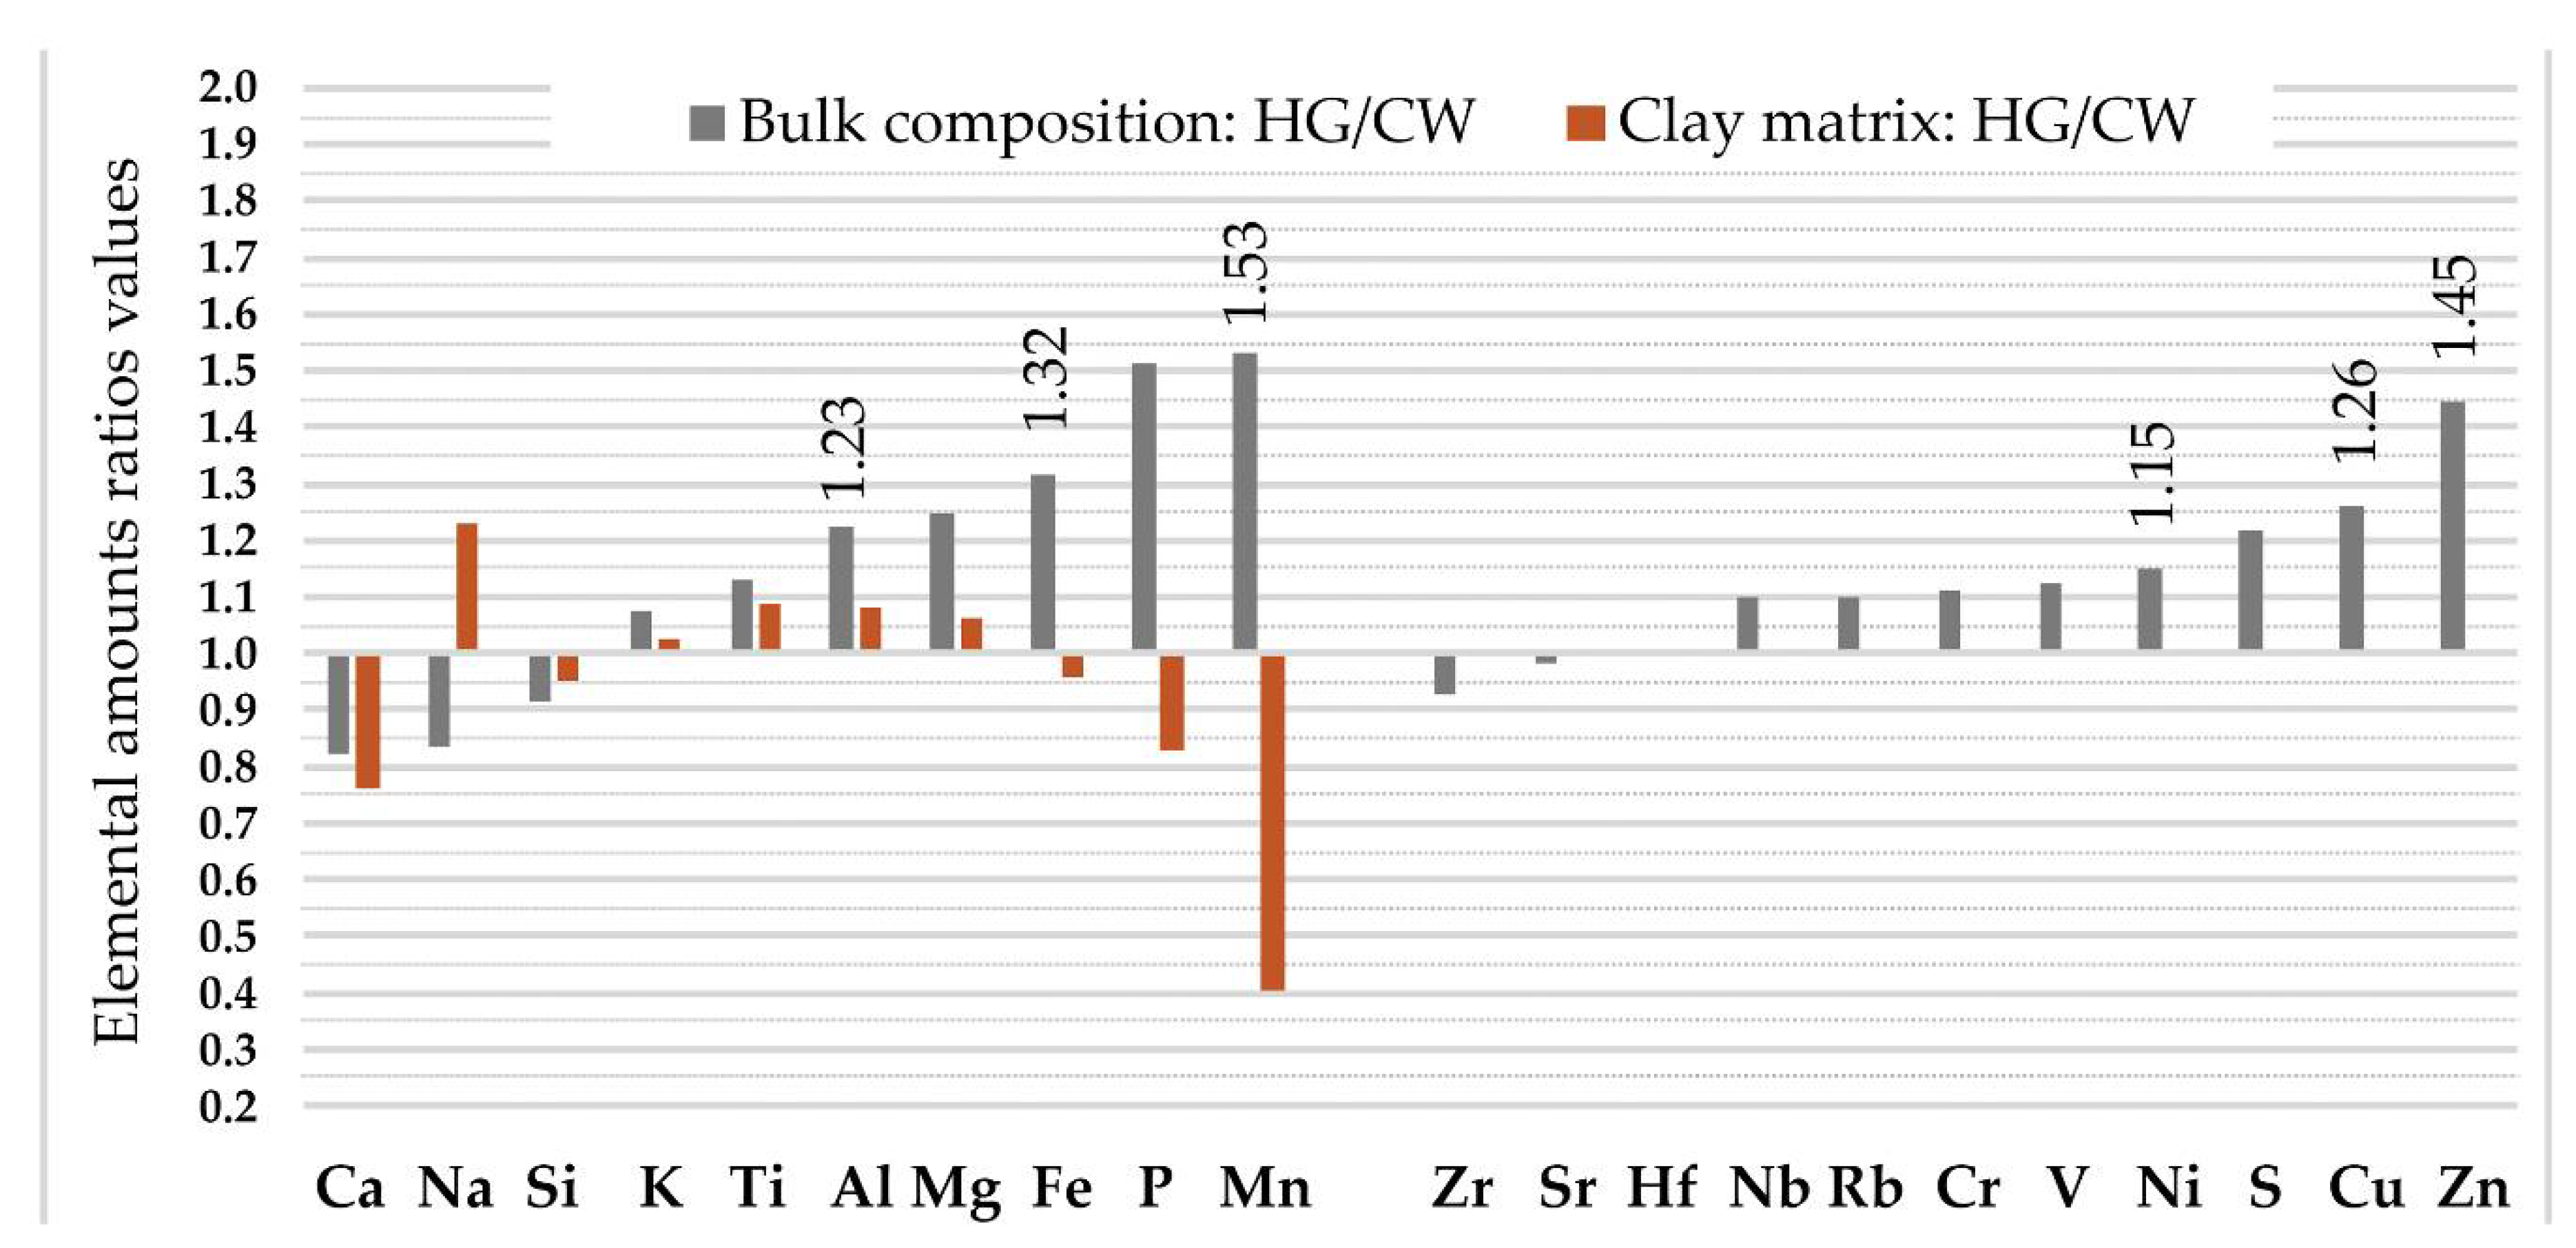
- No valid difference (p < 0.05) was observed for any elemental amounts in the clay matrix from the Corded Ware and hunter-gatherer pottery. However, the amount of Al, Fe, Mn, Cu, Ni, and Zn in the bulk composition of the hunter-gatherer pottery was found to be significantly higher than that in the Corded Ware pottery.
- Cluster analysis showed different identification possibilities for using the results of the clay matrix and bulk composition geochemical research:
- (i)
- In the case of the clay matrix results, the clustering of samples belonging to the same culture is exceptionally rare. In the case of the bulk composition results, a completely different picture can be seen: the clustered pottery samples not only belong to the same culture, but are also similar in respect to their attribution to one period and location. Moreover, the clusters of the clay matrix results display greater linkage distances compared to the samples analyzed for bulk composition.
- (ii)
- Conditionally formatted color scaling is shown and proposed for further use as an effective tool for highlighting characteristic analytes. Clay and other accompanying minerals containing Al, Fe, Ti, and Mg can be additionally indicated by Cr, V, Nb, Cu, and Zn, while slightly different ceramic bulk compositions richer in K and Mn are also represented by Rb. Sr is important for identifying differences caused by the pottery sample’s location. The characteristic geochemical indicator of sand, Si, is linked to Zr and Hf. The organic component, mostly represented by P and accompanied by Ca, can in some cases also be successfully characterized by a link with S.
- The geochemical data and its statistical treatment allowed us to hypothesize that:
- (i)
- The layers of raw clay, although sparse, may have been the same for centuries, and their locations may have been known to potters of both cultures. This is shown not only by the insignificant differences between the amounts of the major analytes in the clay matrix of the Corded Ware and the hunter-gatherer pottery, but also by the scattering of the relationships between the clustered clay matrix samples. It is probable that the most important selection criterion was the workability of the raw clay.
- (ii)
- Due to temper additives, the bulk composition, far better than the clay matrix, reflects the different technological choices, especially in relation to periods, more than places of manufacture and cultural traditions. The geochemical features of ‘periods’, ‘locations’, and ‘cultural traditions’ are more easily distinguished using cluster methods.
- The XRD and FTIR analyses indicated a predominance of iron-rich illite clay, quartz, and alkali feldspar raw materials. Early coarse pottery was fired at low to medium temperatures. The studied ceramic samples show that the emergence of the classic Corded Ware traditions is accompanied by a decrease in the firing temperature of both the cord-decorated and hunter-gatherer pottery. Despite the black cores of the potsherds, FTIR and XRD results are not indicative of firing in a reducing atmosphere.
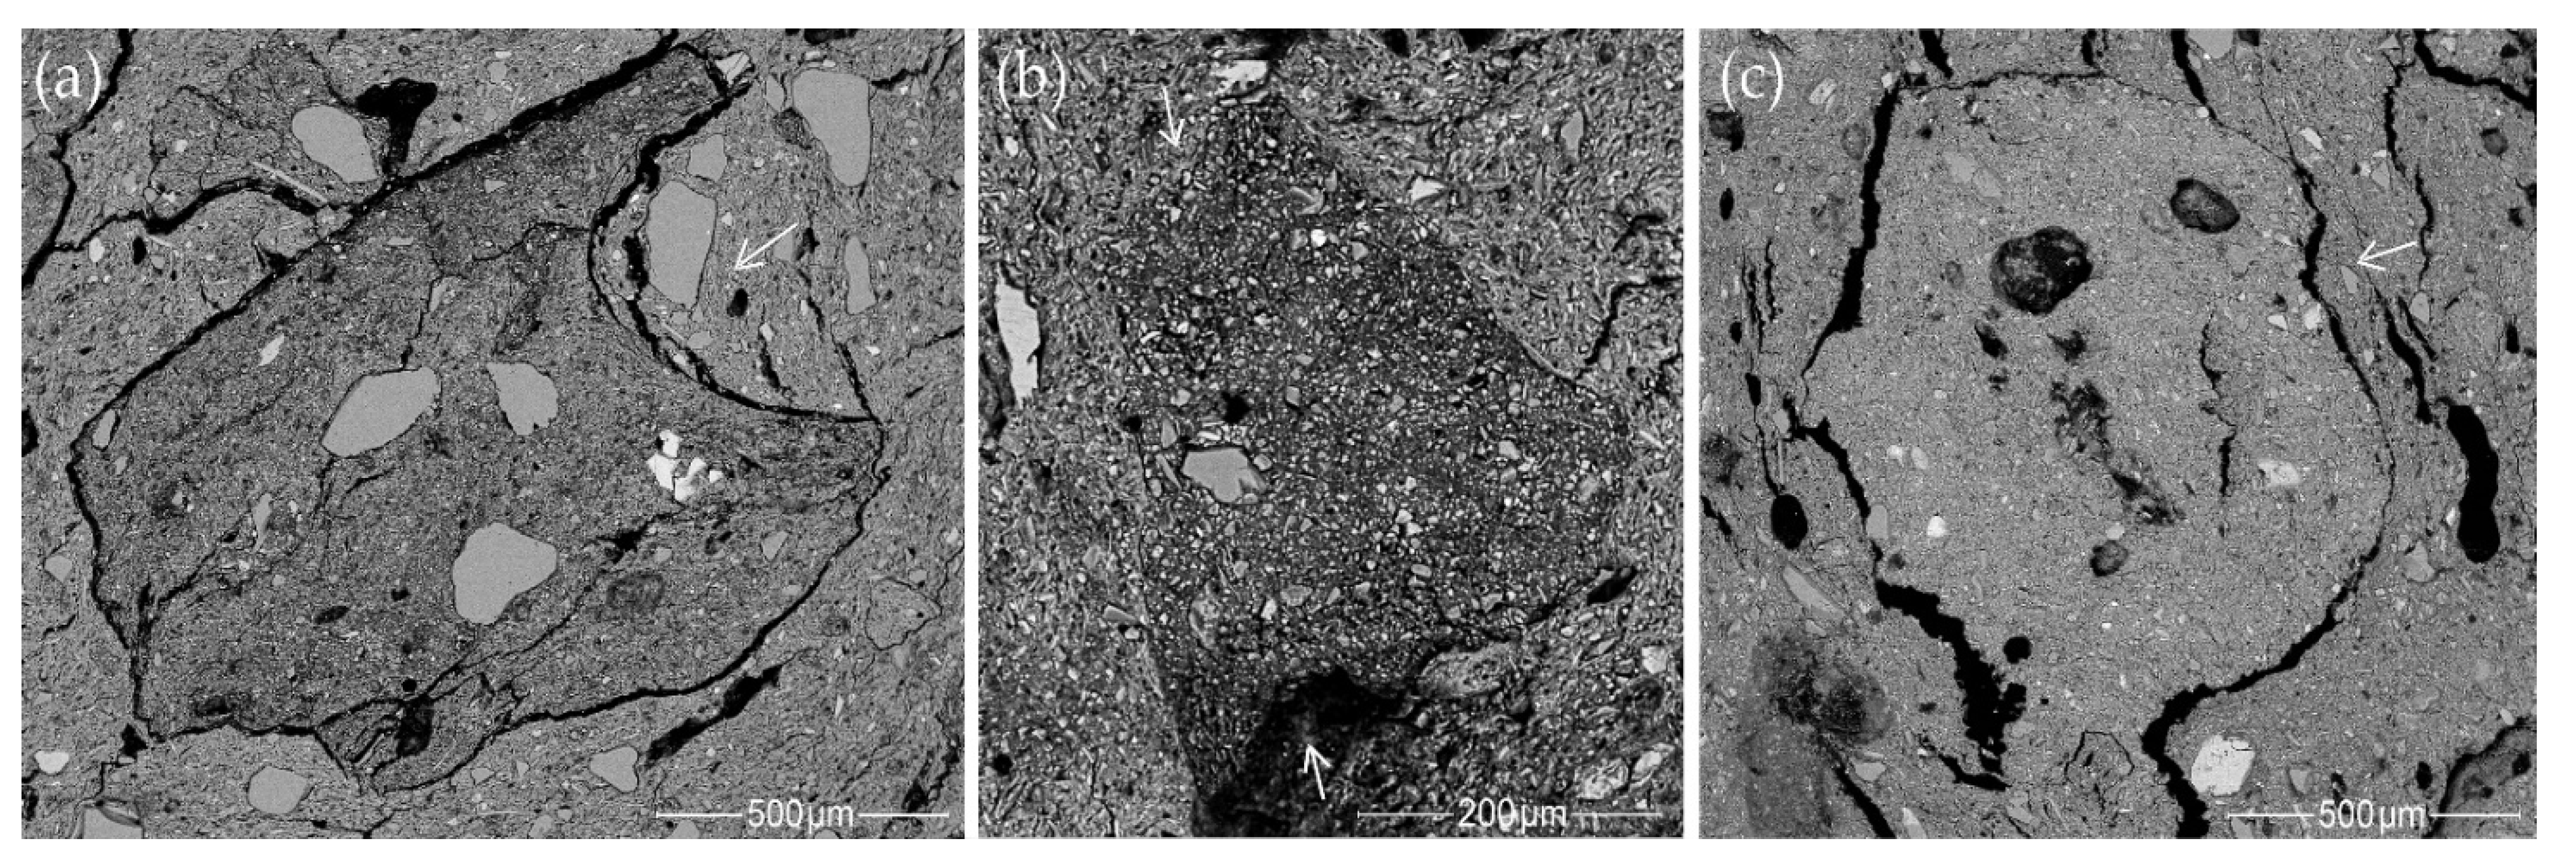
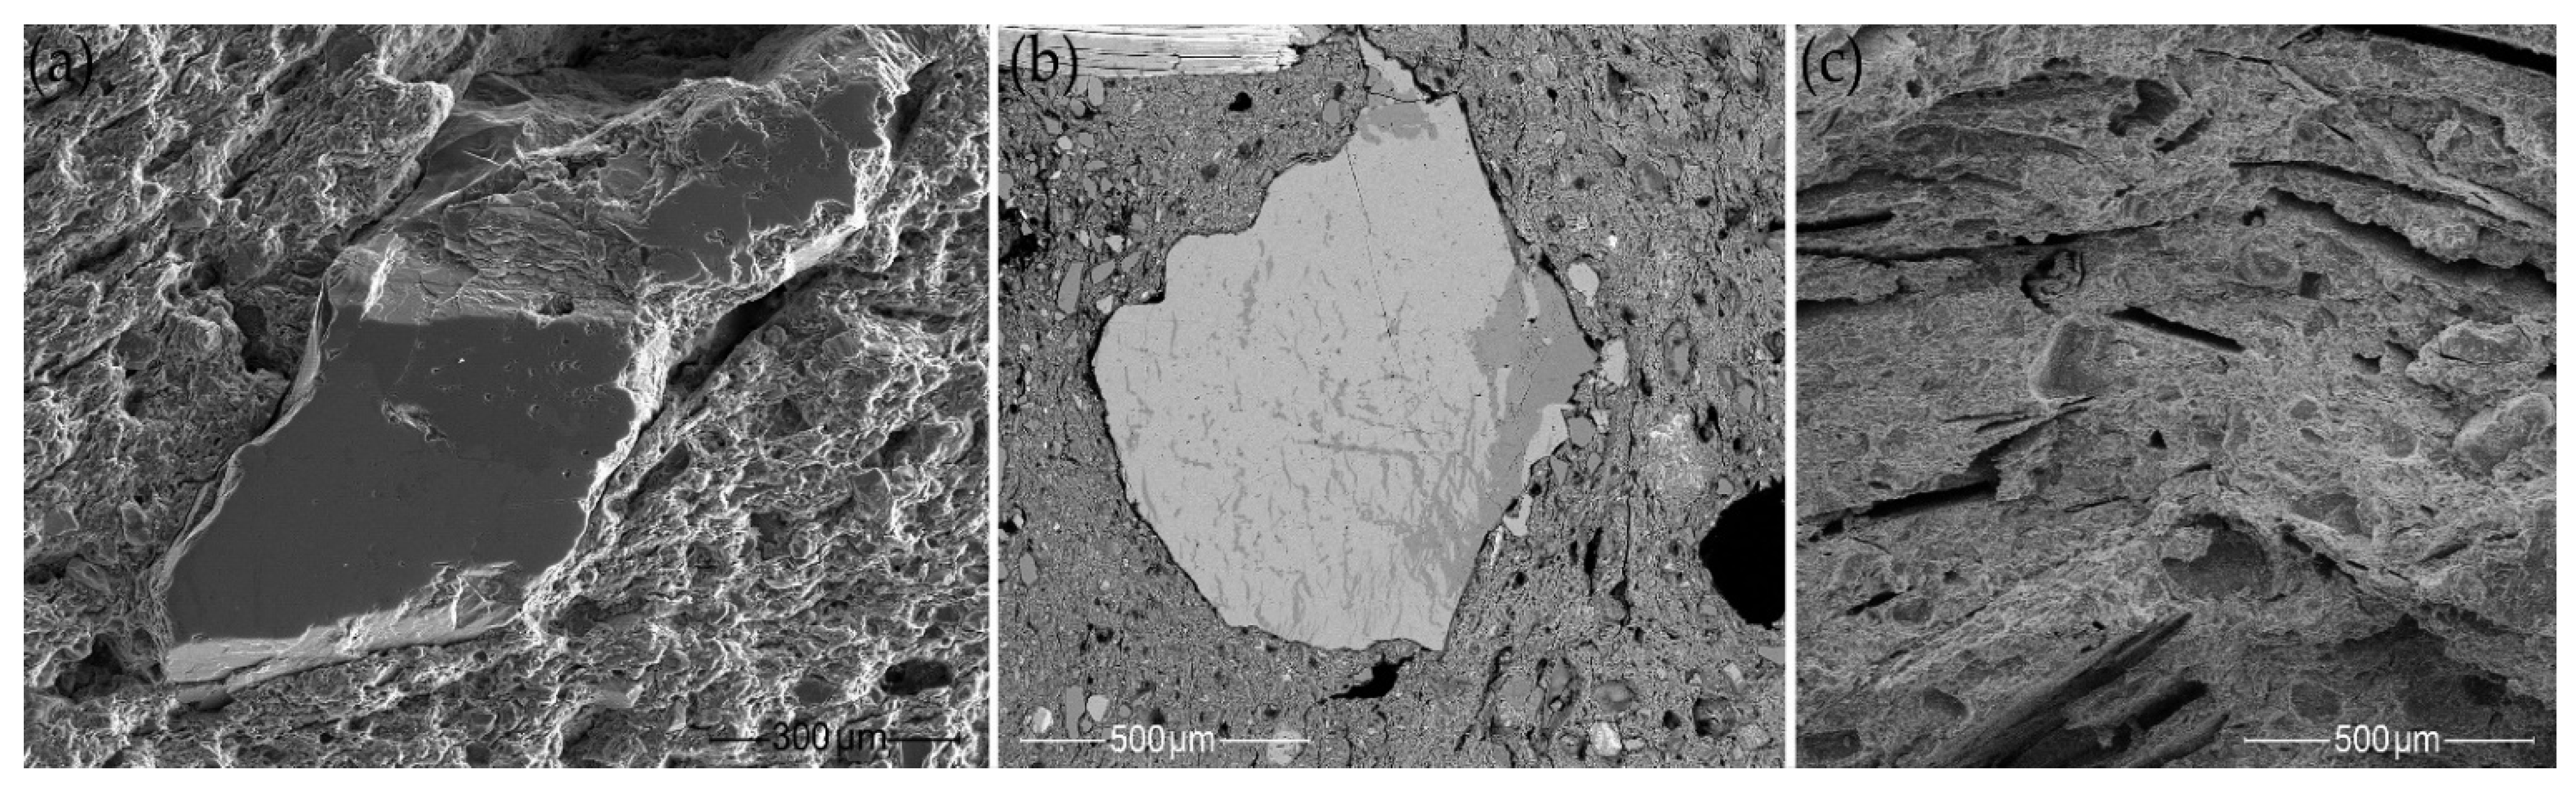
- SEM-EDS with SE and BSE imaging were conducted to determine the detailed mineralogical and petrographic composition of the ceramic pastes. The SEM SE and BSE images showed textural differences in the clay matrix, some of which may be explained by intentionally mixing the clay or a specific pottery surface treatment. No grog temper characteristic of classic Corded Ware was detected, only clay pellets and weathered minerals, which may look like grog to the naked eye. The SEM-EDS point analysis allowed us to investigate the gradual changes in the chemical composition of the clay matrix. Both the Corded Ware and the local hunter-gatherer pottery were made from the same hydromicaceous variegated clay from the local Quaternary glacial sediments, which contain weathered granitoid fragments, but display different technological choices for the clay paste preparation, surface treatment, and firing strategies.
- The main clusters of major and trace elements in the bulk compositions reflect the five technological styles identified by the ceramic raw material’s manipulation, shaping, and firing conditions. The combination of research methods not only allowed a bulk chemical and mineralogical characterization, but also the acquisition for the pottery samples of the microstructural composition and the variables that affect the pottery’s bulk chemical signature. The diversity of the pottery-making techniques reflects the potters’ decisions as influenced by environmental and cultural factors.
Supplementary Materials
Author Contributions
Funding
Data Availability Statement
Acknowledgments
Conflicts of Interest
References
- Buchvaldek, M. Zum gemeineuropäischen Horizont der Schnurkeramik. Praehist. Z. 1986, 61, 129–151. [Google Scholar] [CrossRef]
- Furholt, M. Mobility and Social Change: Understanding the European Neolithic Period after the Archaeogenetic Revolution. J. Archaeol. Res. 2021, 29, 481–535. [Google Scholar] [CrossRef]
- Kristiansen, K.; Allentoft, M.E.; Frei, K.M.; Iversen, R.; Johannsen, N.N.; Kroonen, G.; Pospieszny, Ł.; Price, T.D.; Rasmussen, S.; Sjögren, K.-G.; et al. Re-theorising mobility and the formation of culture and language among the Corded Ware Culture in Europe. Antiquity 2017, 91, 334–347. [Google Scholar] [CrossRef]
- Gimbutas, M. The three waves of kurgan people into old Europe, 4500–2500 BC. Arch. Suisses D’Anthropol. Genérale 1979, 43, 113–137. [Google Scholar]
- Müller, J.; Seregély, T.; Becker, C.; Christensen, A.M.; Fuchs, M.; Kroll, H.; Mischka, D.; Schüssler, U. A Revision of Corded Ware settlement pattern–new results from the Central European Low Mountain Range. Proc. Prehist. Soc. 2009, 75, 125–142. [Google Scholar] [CrossRef]
- Robson, H.K.; Skipitytė, R.; Piličiauskienė, G.; Lucquin, A.; Heron, C.; Craig, O.E.; Piličiauskas, G. Diet, cuisine and consumption practices of the first farmers in the Southeastern Baltic. Archaeol. Anthropol. Sci. 2019, 11, 4011–4024. [Google Scholar] [CrossRef] [PubMed]
- Sjögren, K.G.; Price, T.D.; Kristiansen, K. Diet and mobility in the Corded Ware of Central Europe. PLoS ONE 2016, 11, e0155083. [Google Scholar] [CrossRef]
- Beckerman, S.M. Corded Ware Coastal Communities. Using Ceramic Analysis to Reconstruct Third Millennium BC Societies in the Netherlands. Ph.D. Thesis, University of Groningen, Groningen, The Netherlands, 2015. [Google Scholar]
- Holmqvist, E.; Larsson, Å.M.; Kriiska, A.; Palonen, V.; Pesonen, P.; Mizohata, K.; Kouki, P.; Räisänen, J. Tracing grog and pots to reveal Neolithic Corded Ware Culture contacts in the Baltic Sea region (SEM-EDS, PIXE). J. Archaeol. Sci. 2018, 91, 77–91. [Google Scholar] [CrossRef]
- Kroon, E.J.; Huisman, D.J.; Bourgeois, Q.P.J.; Braekmans, D.J.G.; Fokkens, H. The introduction of Corded Ware culture at a local level: An exploratory study of cultural change during the Late Neolithic of the Dutch west coast through ceramic technology. J. Archaeol. Sci. Rep. 2019, 26, 101873. [Google Scholar] [CrossRef]
- Larsson, Å.M. Making and Breaking Bodies and Pots. Material and Ritual Practices in Sweden in the Third Millennium BC; Department of Archaeology and Ancient History, Uppsala University: Uppsala, Sweden, 2009. [Google Scholar]
- Rauba-Bukowska, A. Microscopic analysis of pottery fragments from the Corded Ware Culture at Sites 11, 15 and 20 in Święte, Jarosław District. Balt.-Pontic Stud. 2018, 23, 163–177. [Google Scholar] [CrossRef][Green Version]
- Kriiska, A.; Nordqvist, K. Estonian Corded Ware culture (2800–2000 cal. BC): Defining a regional group in the eastern Baltic. In Yamnaya Interactions: Proceedings of the International Workshop Held in Helsinki, 25–26 April 2019; Heyd, V., Kulcsár, G., Preda-Bălănică, B., Eds.; Archaeolingua: Budapest, Hungary, 2021; pp. 463–485. [Google Scholar]
- Rimantienė, R. The Neolithic of the eastern Baltic. J. World Prehist. 1992, 6, 97–143. [Google Scholar] [CrossRef]
- Šatavičė, E. Neolithic societies and their pottery in South-eastern Lithuania. Liet. Archeol. 2020, 46, 111–145. [Google Scholar] [CrossRef]
- Guobytė, R. Quaternary Geological Map of Lithuania, Scale 1: 200,000; Geol. Surv. Lithuania: Vilnius, Lithuania, 1999; Available online: https://www.lgt.lt/epaslaugos/elpaslauga.xhtml (accessed on 5 May 2022).
- Balakauskas, L.; Taminskas, J.; Mažeika, J.; Stančikaitė, M. Lateglacial and early-Holocene palaeohydrological changes in the upper reaches of the Ūla River: An example from southeastern Lithuania. Holocene 2013, 23, 117–126. [Google Scholar] [CrossRef]
- Stančikaitė, M.; Kabailienė, M.; Ostrauskas, T.; Guobytė, R. Environment and man around Lakes Dūba and Pelesa, SE Lithuania, during the Late Glacial and Holocene. Geol. Q. 2002, 46, 391–409. [Google Scholar]
- Rimantienė, R. Dūbos ežero apylinkės. In Stone Age in South Lithuania (According to Geological, Palaeogeographical and Archaeological Data); Baltrūnas, V., Ed.; Institute of geology: Vilnius, Lithuania, 2001; pp. 167–174. (In Lithuanian) [Google Scholar]
- Rimantienė, R. Margių 1-oji gyvenvietė. Liet. Archeol. 1999, 16, 109–170. (In Lithuanian) [Google Scholar]
- Rimantienė, R. Barzdžio miško gyvenvietė. Liet. Archeol. 1999, 16, 171–208. (In Lithuanian) [Google Scholar]
- Rimantienė, R. Šakės—Neolito gyvenvietė. Liet. Archeol. 1992, 8, 16–34. (In Lithuanian) [Google Scholar]
- Ionescu, C.; Hoeck, V. Ceramic technology. How to investigate surface finishing. Archaeol. Anthropol. Sci. 2020, 12, 204. [Google Scholar] [CrossRef]
- Quinn, P.S. Ceramic Petrography: The Interpretation of Archaeological Pottery and Related Artefacts in Thin Section; Archaeopress: Oxford, UK, 2013. [Google Scholar]
- Whitbread, I.K. Fabric Description of Archaeological Ceramics. In The Oxford Handbook of Archaeological Ceramic Analysis; Hunt, A., Ed.; Oxford University Press: Oxford, UK, 2016; pp. 199–216. [Google Scholar]
- Roux, V. Ceramics and Society. A Technological Approach to Archaeological Assemblages; Springer International: Cham, Switzerland, 2019. [Google Scholar]
- Thér, R. Ceramic technology. How to reconstruct and describe pottery-forming practices. Archaeol. Anthropol. Sci. 2020, 12, 172. [Google Scholar] [CrossRef]
- Arnold, D.E.; Neff, H.; Bishop, R.L. Compositional analysis and ‘sources’ of pottery: An ethnoarchaeological approach. Am. Anthropol. 1991, 93, 70–90. [Google Scholar] [CrossRef]
- Tite, M. Ceramic production, provenance and use: A review. Archaeometry 2008, 50, 216–231. [Google Scholar] [CrossRef]
- Buxeda i Garrigós, J. Alteration and Contamination of Archaeological Ceramics: The Perturbation Problem. J. Archaeol. Sci. 1999, 26, 295–313. [Google Scholar] [CrossRef]
- Maritan, L. Ceramic abandonment. How to recognise post-depositional transformations. Archaeol. Anthropol. Sci. 2020, 12, 199. [Google Scholar] [CrossRef]
- Hunt, A. On the origin of ceramics: Moving toward a common understanding on provenance. Archaeol. Rev. Camb. 2012, 27, 85–97. [Google Scholar]
- Schramm, R.; Heckel, J. Fast analysis of traces and major elements with ED(P)XRF using polarized X-rays: TURBOQUANT. J. Phys. IV 1998, 8, Pr5-335–Pr5-342. [Google Scholar] [CrossRef]
- Introducing a New Era in Analytical Performance. Available online: https://www.spectro.com/products/xrf-spectrometer/xepos-xrf-spectrometer (accessed on 17 May 2022).
- Analyzing Trace Elements in Pressed Pellets of Geological Materials Using ED-XRF. Available online: https://extranet.spectro.com/-/media/5C512E72-682D-45D8-AE56-6740529341BC.pdf (accessed on 17 May 2022).
- Van Dijk, D. Wageningen Evaluating Programmes for Analytical Laboratories (Wepal): A World of Experience. Commun. Soil Sci. Plant Anal. 2002, 33, 2457–2465. [Google Scholar] [CrossRef]
- Taraškevičius, R.; Zinkutė, R.; Stakėnienė, R.; Radavičius, M. Case Study of the Relationship between Aqua Regia and Real Total Contents of Harmful Trace Elements in Some European Soils. J. Chem. 2013, 2013, 678140. [Google Scholar] [CrossRef]
- Taraškevičius, R.; Kazakauskas, V.; Sarcevičius, S.; Zinkutė, R.; Suzdalev, S. Case study of geochemical clustering as a tool for tracing sources of clays for archaeological and modern bricks. Baltica 2019, 32, 139–155. [Google Scholar] [CrossRef]
- Maggetti, M. Phase analysis and its significance for technology and origin. In Archaeological Ceramics; Olin, J.S., Franklin, A.D., Eds.; Smithsonian Institution Press: Washington, DC, USA, 1982; pp. 121–133. [Google Scholar]
- Heimann, R.B.; Maggetti, M. Ancient and Historical Ceramics: Materials, Technology, Art and Culinary Traditions; Schweizerbart Science Publishers: Stuttgart, Germany, 2014. [Google Scholar]
- Quinn, P.S.; Benzonelli, A. X-ray diffraction and archaeological materials analysis. In The SAS Encyclopedia of Archaeological Sciences, 1st ed.; López Varela, S.L., Ed.; Wiley Blackwell: Hoboken, NJ, USA, 2018. [Google Scholar]
- Kareiva, A.; Kiuberis, J.; Merkevičius, A. Analytical characterization of Baltic amber and pottery. Archaeol. Litu. 2011, 12, 25–35. [Google Scholar] [CrossRef]
- Maritan, L.; Nodari, L.; Mazzoli, C.; Milano, A.; Russo, U. Influence of firing conditions on ceramic products: Experimental study on clay rich in organic matter. Appl. Clay Sci. 2006, 31, 1–15. [Google Scholar] [CrossRef]
- Shoval, S. Fourier transform infrared spectroscopy (FT-IR) in archaeological ceramic analysis. In The Oxford Handbook of Archaeological Ceramic Analysis; Hunt, A.M.W., Ed.; University Press: Oxford, UK, 2017; pp. 509–530. [Google Scholar]
- Mentesana, R.; Kilikoglou, V.; Todaro, S.; Day, P.M. Reconstructing change in firing technology during the Final Neolithic–Early Bronze Age transition in Phaistos, Crete. Just the tip of the iceberg? Archaeol. Anthropol. Sci. 2019, 11, 871–894. [Google Scholar] [CrossRef]
- Park, K.S.; Milke, R.; Efthimiopoulos, I.; Pausewein, R.R.; Reinhold, S. Pyrometamorphic process of ceramic composite materials in pottery production in the Bronze/Iron Age of the Northern Caucasus (Russia). Sci. Rep. 2019, 9, 10725. [Google Scholar] [CrossRef]
- Yan, B.; Liu, S.; Chastain, M.L.; Yang, S.; Chen, J. A new FTIR method for estimating the firing temperature of ceramic bronze-casting moulds from early China. Sci. Rep. 2021, 11, 3316. [Google Scholar] [CrossRef] [PubMed]
- Menges, F. Spectragryph—Optical Spectroscopy Software. Version 1.2.16. Available online: http://www.effemm2.de/spectragryph/ (accessed on 5 May 2022).
- GabbroSoft. 2011. Available online: http://www.gabbrosoft.org (accessed on 5 May 2022).
- Middleton, A.P.; Freestone, I.C.; Leese, M.N. Textural analysis of ceramic thin sections: Evaluation of grain sampling procedures. Archaeometry 1985, 27, 64–74. [Google Scholar] [CrossRef]
- Reedy, C.L. Review of Digital Image Analysis of Petrographic Thin Sections in Conservation Research. J. Am. Inst. Conserv. 2006, 45, 127–146. [Google Scholar] [CrossRef]
- Druc, I.C. Atlas of Ceramic Pastes: Components, Texture and Technology; Deep Education Press: Blue Mounds, WI, USA, 2015. [Google Scholar]
- Roduit, N. JMicroVision: Image Analysis Toolbox for Measuring and Quantifying Components of High-Definition Images. Version 1.3.4. Available online: https://jmicrovision.github.io (accessed on 5 May 2022).
- Wentworth, C.K. A scale of grade and class terms for clastic sediments. J. Geol. 1922, 30, 377–392. [Google Scholar] [CrossRef]
- Kretz, R. Symbols of rock-forming minerals. Am. Mineral. 1983, 68, 277–279. [Google Scholar]
- Clarke, F.W. The Relative Abundance of the Chemical Elements. Bull. Philos. Soc. Wash. 1889, 11, 135–143. [Google Scholar]
- Rudnick, R.L.; Gao, S. Composition of the Continental Crust. In Treatise on Geochemistry; Elsevier: Amsterdam, The Netherlands, 2003; pp. 1–64. [Google Scholar]
- Jasiewicz, J.; Niedzielski, P.; Krueger, M.; Hildebrandt-Radke, I.; Michałowski, A. Elemental variability of prehistoric ceramics from postglacial lowlands and its implications for emerging of pottery traditions—An example from the pre-Roman Iron Age. J. Archaeol. Sci. Rep. 2021, 39, 103177. [Google Scholar] [CrossRef]
- Borowski, M.P.; Golitko, M.; Furmanek, M.; Nowak, M.; Szczepara, N. Addressing the issue of the Early Neolithic pottery exchange through a combined petrographic and geochemical approach: A case study on LBK ware from Dzielnica (Upper Silesia, southern Poland). Archaeol. Anthropol. Sci. 2021, 13, 5. [Google Scholar] [CrossRef]
- Middleton, M.; Närhi, P.; Kuosmanen, V.; Sutinen, R. Quantification of glacial till chemical composition by reflectance spectroscopy. Appl. Geochem. 2011, 26, 2215–2225. [Google Scholar] [CrossRef]
- De Vos, W.; Tarvainen, T.; Salminen, R.; Reeder, S.; De Vivo, B.; Demetriades, A.; Pirc, S.; Batista, M.J.; Marsina, K.; Ottesen, R.T.; et al. Geochemical Atlas of Europe. Part 2. Interpretation of Geochemical Maps, Additional Tables, Figures, Maps, and Related Publications; Geological Survey of Finland: Espoo, Finland, 2006. [Google Scholar]
- Maggetti, M. Chemical Analyses of Ancient Ceramics: What for? Chimia 2001, 55, 923–930. [Google Scholar]
- Santos Rodrigues, S.F.; Lima da Costa, M. Phosphorus in archaeological ceramics as evidence of the use of pots for cooking food. Appl. Clay Sci. 2016, 123, 224–231. [Google Scholar] [CrossRef]
- Drob, A.; Vasilache, V.; Bolohan, N. The Interdisciplinary Approach of Some Middle Bronze Age Pottery from Eastern Romania. Appl. Sci. 2021, 11, 4885. [Google Scholar] [CrossRef]
- Taraškevičius, R.; Stančikaitė, M.; Bliujienė, A.; Stakėnienė, R.; Zinkutė, R.; Kusiak, J. Search for geochemical indicators of pre-urban habitation sites: Case study from the Skomantai hill-fort and settlement, western Lithuania. Geochem. Explor. Environ. Anal. 2012, 12, 265–275. [Google Scholar] [CrossRef]
- Taraškevičius, R.; Bliujienė, A.; Karmaza, B.; Merkevičius, A.; Nemickienė, R.; Račkevičius, G.; Sarcevičius, S.; Stakėnienė, R.; Strazdas, D.; Širvydaitė, S.; et al. Geocheminiai tyrimų metodai archeologijoje—Taikymo galimybės. In Metodai Lietuvos Archeologijoje. Mokslas ir Technologijos Praeičiai Pažinti; Merkevičius, A., Ed.; Vilniaus Universiteto Leidykla: Vilnius, Lithuania, 2013; pp. 249–304. (In Lithuanian) [Google Scholar]
- Eramo, G.; Mangone, A. Archaeometry of ceramic materials. Phys. Sci. Rev. 2019, 4, 20180014. [Google Scholar] [CrossRef]
- Mirti, P.; Davit, P. New developments in the study of ancient pottery by colour measurement. J. Archaeol. Sci. 2004, 31, 741–751. [Google Scholar] [CrossRef]
- Eramo, G. Ceramic technology: How to recognize ceramic processing. Archaeol Anthr. Sci. 2020, 12, 164. [Google Scholar] [CrossRef]
- Albero Santacreu, D. Materiality, Techniques and Society in Pottery Production: The Technological Study of Archaeological Ceramics through Paste Analysis; Walter de Gruyter GmbH & Co KG: Berlin, Germany; Boston, MA, USA, 2014. [Google Scholar]
- Ho, J.W.I.; Quinn, P.S. Intentional clay-mixing in the production of traditional and ancient ceramics and its identification in thin section. J. Archaeol. Sci. Rep. 2021, 37, 102945. [Google Scholar] [CrossRef]
- Whitbread, I.K. The characterisation of argillaceous inclusions in ceramic thin sections. Archaeometry 1986, 28, 79–88. [Google Scholar] [CrossRef]
- Sakalis, A.J.; Kazakis, N.A.; Merousis, N.; Tsirliganis, N.C. Study of Neolithic pottery from Polyplatanos (Imathia) using micro X-ray fluorescence spectroscopy, stereoscopic microscopy and multivariate statistical analysis. J. Cult. Herit. 2013, 14, 485–498. [Google Scholar] [CrossRef]
- Freestone, I.C.; Middleton, A.P.; Meeks, N.D. Significance of phosphate in ceramic bodies: Discussion of paper by Bollong et al. J. Archaeol. Sci. 1994, 21, 425–426. [Google Scholar] [CrossRef]
- Ionescu, C.; Hoeck, V.; Ghergari, L. Electron microprobe analysis of ancient ceramics: A case study from Romania. Appl. Clay Sci. 2011, 53, 466–475. [Google Scholar] [CrossRef]
- Giurgiu, A.; Ionescu, C.; Hoeck, V.; Tămaş, T.; Roman, C.; Crandell, O.N. Insights into the raw materials and technology used to produce Copper Age ceramics in the Southern Carpathians (Romania). Archaeol. Anthropol. Sci. 2017, 9, 1259–1273. [Google Scholar] [CrossRef]
- Kurosawa, M.; Semmoto, M.; Shibata, T. Mineralogical Characterization of Early Bronze Age Pottery from the Svilengrad-Brantiite Site, Southeastern Bulgaria. Minerals 2022, 12, 79. [Google Scholar] [CrossRef]
- Wilson, M.J. Sheet Silicates: Clay Minerals, Rock-Forming Minerals; The Geological Society of London: London, UK, 2013; Volume 3C. [Google Scholar]
- Brorsson, T.; Blank, M.; Bakunic Fridén, I. Mobility and exchange in the Middle Neolithic: Provenance studies of Pitted Ware and Funnel Beaker pottery from Jutland, Denmark and the west coast of Sweden. J. Archaeol. Sci. Rep. 2018, 20, 662–674. [Google Scholar] [CrossRef]
- Michałowski, A.; Niedzielski, P.; Kozak, L.; Teska, M.; Jakubowski, K.; Żółkiewski, M. Archaeometrical studies of prehistoric pottery using portable ED-XRF. Measurement 2020, 159, 107758. [Google Scholar] [CrossRef]
- Papakosta, V.; Lopez-Costas, O.; Isaksson, S. Multi-method (FTIR, XRD, PXRF) analysis of Ertebølle pottery ceramics from Scania, Southern Sweden. Archaeometry 2020, 62, 677–693. [Google Scholar] [CrossRef]
- Buxeda i Garrigós, J.; Kilikoglou, V. Total variation as a measure of variability in chemical data sets. In Patterns and Process; Van Zelst, L., Bishop, R.L., Henderson, J., Eds.; Smithsonian Institution Press: Washington, DC, USA, 2003; pp. 185–198. [Google Scholar]
- Quinn, P.; Day, P.; Kilikoglou, V.; Faber, E.; Katsarou-Tzeveleki, S.; Sampson, A. Keeping an eye on your pots: The provenance of Neolithic ceramics from the Cave of the Cyclops, Youra, Greece. J. Archaeol. Sci. 2010, 37, 1042–1052. [Google Scholar] [CrossRef]
- Hein, A.; Kilikoglou, V. Ceramic raw materials: How to recognize them and locate the supply basins: Chemistry. Archaeol. Anthropol. Sci. 2020, 12, 180. [Google Scholar] [CrossRef]
- Luneau, E.; Martínez Ferreras, V.; Abdykanova, A.; Tabaldiev, K.; Motuzaite Matuzeviciute, G. The first combined archaeological and archaeometric analyses on Bronze Age pottery from Kyrgyzstan (Uch Kurbu site). J. Archaeol. Sci. Rep. 2020, 31, 102302. [Google Scholar] [CrossRef]
- Kulkova, M.; Mazurkevich, A.; Dolbunova, E. Paste recipes and raw material sources for pottery-making in hunter-gatherer communities in the forest zone of Eastern Europe (Dnepr-Dvina region, 7–6th millennia BC). J. Archaeol. Sci. Rep. 2018, 21, 962–972. [Google Scholar] [CrossRef]
- Šegvić, B.; Ugarković, M.; Süssenberger, A.; Mählmann, R.F.; Moscariello, A. Compositional Properties and Provenance of Hellenistic Pottery from the Necropolis of Issa with Evidences on the Cross-Adriatic and the Mediterranean-scale Trade. Mediterr. Archaeol. Archaeom. 2016, 16, 23–52. [Google Scholar]
- Gualtieri, A.F.; Ferrari, S.; Leoni, M.; Grathoff, G.; Hugo, R.; Shatnawi, M.; Paglia, G.; Billinge, S. Structural characterization of the clay mineral illite-1M. J. Appl. Crystallogr. 2008, 41, 402–415. [Google Scholar] [CrossRef]
- Wang, G.; Wang, H.; Zhang, N. In situ high temperature X-ray diffraction study of illite. Appl. Clay Sci. 2017, 146, 254–263. [Google Scholar] [CrossRef]
- Ionescu, C.; Höck, V.; Simon, V. Effect of the temperature and the heating time on the composition of an illite-rich clay: An XRPD study. Babes-Bolyai Phys. 2011, 56, 69–70. [Google Scholar]
- Amicone, S.; Forte, V.; Solard, B.; Berthold, C.; Memmesheimer, A.; Mirković-Marić, N. Playing with fire: Exploring ceramic pyrotechnology in the Late Neolithic Balkans through an archaeometric and experimental approach. J. Archaeol. Sci. Rep. 2021, 37, 102878. [Google Scholar] [CrossRef]
- Contani Barbaro, C.; Forte, V.; Muntoni, I.M.; Eramo, G. A Multidisciplinary Approach to the Study of Early Neolithic Pyrotechnological Structures. The Case Study of Portonovo (Marche, Italy). Open Archaeol. 2021, 7, 1160–1175. [Google Scholar] [CrossRef]
- Drits, V.A.; Beson, G.; Muller, F. An improved model for structural transformations of heat-treated aluminous dioctahedral 2:1 layer silicates. Clays Clay Miner. 1995, 43, 718–731. [Google Scholar] [CrossRef]
- Marsh, A.; Heath, A.; Patureau, P.; Evernden, M.; Walker, P. Alkali activation behaviour of un-calcined montmorillonite and illite clay minerals. Appl. Clay Sci. 2018, 166, 250–261. [Google Scholar] [CrossRef]
- Giraitis, R.; Bliujienė, A.; Selskienė, A.; Pakštas, V. Investigations of potsherds of miniature cups and household pots from the first millennium AD (the case study on the Western Lithuanian ceramics). Chemija 2019, 30, 154–167. [Google Scholar] [CrossRef]
- Moon, D.-H.; Kim, S.-J.; Nam, S.-W.; Cho, H.-G. X-ray Diffraction Analysis of Clay Particles in Ancient Baekje Black Pottery: Indicator of the Firing Parameters. Minerals 2021, 11, 1239. [Google Scholar] [CrossRef]
- Maniatis, Y.; Simopoulos, A.; Kostikas, A.; Perdikatsis, V. Effect of Reducing Atmosphere on Minerals and Iron Oxides Developed in Fired Clays: The Role of Ca. J. Am. Ceram. Soc. 1983, 66, 773–781. [Google Scholar] [CrossRef]
- Maggetti, M.; Neururer, C.; Ramseyer, D. Temperature evolution inside a pot during experimental surface (bonfire) firing. Appl. Clay Sci. 2011, 53, 500–508. [Google Scholar] [CrossRef]
- Müller, C.; Pejcic, B.; Esteban, L.; Piane, C.D.; Raven, M.; Mizaikoff, B. Infrared Attenuated Total Reflectance Spectroscopy: An Innovative Strategy for Analyzing Mineral Components in Energy Relevant Systems. Sci. Rep. 2014, 4, 6764. [Google Scholar] [CrossRef] [PubMed]
- Shoval, S.; Beck, P. Thermo-FTIR spectroscopy analysis as a method of characterizing ancient ceramic technology. J. Therm. Anal. Calorim. 2005, 82, 609–616. [Google Scholar] [CrossRef]
- Maniatis, Y.; Katsanos, A.; Caskey, M.E. Technological examination of low-fired Terra cotta statues from Ayia Irene Keos. Archaeometry 1982, 24, 191–198. [Google Scholar] [CrossRef]
- Murad, E.; Wagner, U. The thermal behaviour of an Fe-rich illite. Clay Miner. 1996, 31, 45–52. [Google Scholar] [CrossRef]
- Zviagina, B.B.; Drits, V.A.; Dorzhieva, O.V. Distinguishing Features and Identification Criteria for K-Dioctahedral 1M Micas (Illite-Aluminoceladonite and Illite-Glauconite-Celadonite Series) from Middle-Infrared Spectroscopy Data. Minerals 2020, 10, 153. [Google Scholar] [CrossRef]
- Oancea, A.V.; Bodi, G.; Nica, V.; Ursu, L.E.; Drobota, M.; Cotofana, C.; Vasiliu, A.L.; Simionescu, B.C.; Olaru, M. Multi-analytical characterization of Cucuteni pottery. J. Eur. Ceram. Soc. 2017, 37, 5079–5098. [Google Scholar] [CrossRef]
- Šontevska, V.; Jovanovski, G.; Makreski, P.; Raškovska, A.; Šoptrajanova, B. Minerals from Macedonia. XXI. Vibrational spectroscopy as identificational tool for some phyllosilicate minerals. Acta Chim. Slov. 2008, 55, 757–766. [Google Scholar]
- Stevenson, C.M.; Gurnick, M. Structural collapse in kaolinite, montmorillonite and illite clay and its role in the ceramic rehydroxylation dating of low-fired earthenware. J. Archaeol. Sci. 2016, 69, 54–63. [Google Scholar] [CrossRef]
- Theodosoglou, E.; Koroneos, A.; Soldatos, T.; Zorba, T.; Paraskevopoulos, K.M. Comparative Fourier transform infrared and X-ray powder diffraction analysis of naturally occurred K-feldspars. Bull. Geol. Soc. Greece 2010, 43, 2752–2761. [Google Scholar] [CrossRef]
- Maniatis, Y.; Tite, M.S. Technological Examination of Neolithic-Bronze Age Pottery from Central and Southeast Europe and from the Near East. J. Archaeol. Sci. 1981, 8, 59–76. [Google Scholar] [CrossRef]
- Amicone, S.; Radivojević, M.; Quinn, P.S.; Berthold, C.; Rehren, T. Pyrotechnological connections? Re-investigating the link between pottery firing technology and the origins of metallurgy in the Vinča Culture, Serbia. J. Archaeol. Sci. 2020, 11, 105123. [Google Scholar] [CrossRef]
- Deer, W.A.; Howie, R.A.; Zussman, J. An Introduction to the Rock-Forming Minerals, 3rd ed.; Mineralogical Society of Great Britain and Ireland: London, UK, 2013. [Google Scholar]
- Smith, J.V.; Brown, W.L. Feldspar Minerals. Crystal Structures, Physical, Chemical, and Microtextural Properties, 2nd ed.; Springer: Berlin Heidelberg, Germany, 1988; Volume 1. [Google Scholar]
- Wilson, M.J. Weathering of the primary rock-forming minerals: Processes, products and rates. Clay Miner. 2004, 39, 233–266. [Google Scholar] [CrossRef]
- Menzies, J.; Meer, J.J.M. Past Glacial Environments, 2nd ed.; Elsevier: Amsterdam, The Netherlands, 2018. [Google Scholar]
- Długosz, J.; Orzechowski, M.; Kobierski, M.; Smólczyński, S.; Zamorski, R. Clay minerals from Weichselian glaciolimnic sediments of the Sępopolska Plain (NE Poland). Geol. Carpath. 2009, 60, 263–267. [Google Scholar] [CrossRef]
- Enea-Giurgiu, A.; Ionescu, C.; Hoeck, V.; Tămaş, T.; Roman, C. An archaeometric study of early Copper Age pottery from a cave in Romania. Clay Miner. 2019, 54, 255–268. [Google Scholar] [CrossRef]
- Zhou, J.M.; Huang, P.M. Kinetics of potassium release from illite as influenced by different phosphates. Geoderma 2007, 138, 221–228. [Google Scholar] [CrossRef]
- Maggetti, M. Mineralogisch-petrographische Untersuchung des Scherbenmaterials der urnenfelderzeitlichen Siedlung Elchinger Kreuz, Ldkr. Neu-Ulm/Donau. Kat. Prähistorische Staatssamml. München 1979, 19, 141–172. [Google Scholar]
- Aspandiar, M.F.; Eggleton, R.A. Weathering of Chlorite: I. Reactions and Products in Microsystems Controlled by the Primary Mineral. Clays Clay Miner. 2002, 50, 685–698. [Google Scholar] [CrossRef]
- Arnold, D.E. Linking Society with the Compositional Analyses of Pottery: A Model from Comparative Ethnography. In Pottery Manufacturing Processes: Reconstitution and Interpretation; Smith, A.L., Bosquet, D., Martineau, R., Eds.; Archaeopress: Oxford, UK, 2005; pp. 15–21. [Google Scholar]
- Rice, P.M. Pottery Analysis: A Sourcebook, 1st ed.; The University of Chicago Press: Chicago, IL, USA, 1987. [Google Scholar]
- Lechtman, H. Style in technology: Some early thoughts. In Material Culture: Style, Organization and Dynamics of Technology; Lechtman, H., Merrill, R.S., Eds.; West Publishing Company: St. Paul, MN, USA, 1977; pp. 3–20. [Google Scholar]
- Gosselain, O.P. Social and technical identity in a clay crystal ball. In The Archaeology of Social Boundaries; Stark, M.T., Ed.; Smithsonian Institution Press: Washington, DC, USA, 1998; pp. 78–100. [Google Scholar]
- Sillar, B.; Tite, M.S. The Challenge of ‘Technological Choices’ for Materials Science Approaches in Archaeology. Archaeometry 2000, 42, 2–20. [Google Scholar] [CrossRef]
- Rye, O.S. Keeping your temper under control: Materials and manufacture of Papuan pottery. Archeol. Phys. Anthropol. Ocean. 1976, 11, 106–137. [Google Scholar]
- McReynolds, T.E.; Skaggs, S.A.; Schroeder, P.A. Feldspar and clay mineralogy. In Woodland Pottery Sourcing in the Carolina Sandhills. Research Report 29; Herbert, J.M., McReynolds, T.E., Eds.; University of North Carolina at Chapel Hill: Chapel Hill, NC, USA, 2008; pp. 108–121. [Google Scholar]
- Kudelić, A. Preparation and Composition of Clay Paste in Bronze Age Pottery from North-Western Croatia: The Role of Experiments. Old Potter’s Alm. 2017, 22, 2–14. [Google Scholar]
- Daszkiewicz, M.; Maritan, L. Experimental Firing and Re-firing. In The Oxford Handbook of Archaeological Ceramic Analysis; Hunt, A., Ed.; Oxford University Press: Oxford, UK, 2016; pp. 487–508. [Google Scholar]
- Kabailienė, M. Ežerų bei pelkių sandara ir raida. In Stone Age in South Lithuania (According to Geological, Palaeogeographical and Archaeological Data; Baltrūnas, V., Ed.; Institute of geology: Vilnius, Lithuania, 2001; pp. 121–125. (In Lithuanian) [Google Scholar]
- Rye, O.S. Pottery Technology, Principles and Reconstruction (Manuals on Archaeology); Taraxacum: Washington, WA, USA, 1981. [Google Scholar]


| Sample ID | Settlement | Typological Classification | Vessel, Fragment | Thickness, mm | Weight, g | Temper |
|---|---|---|---|---|---|---|
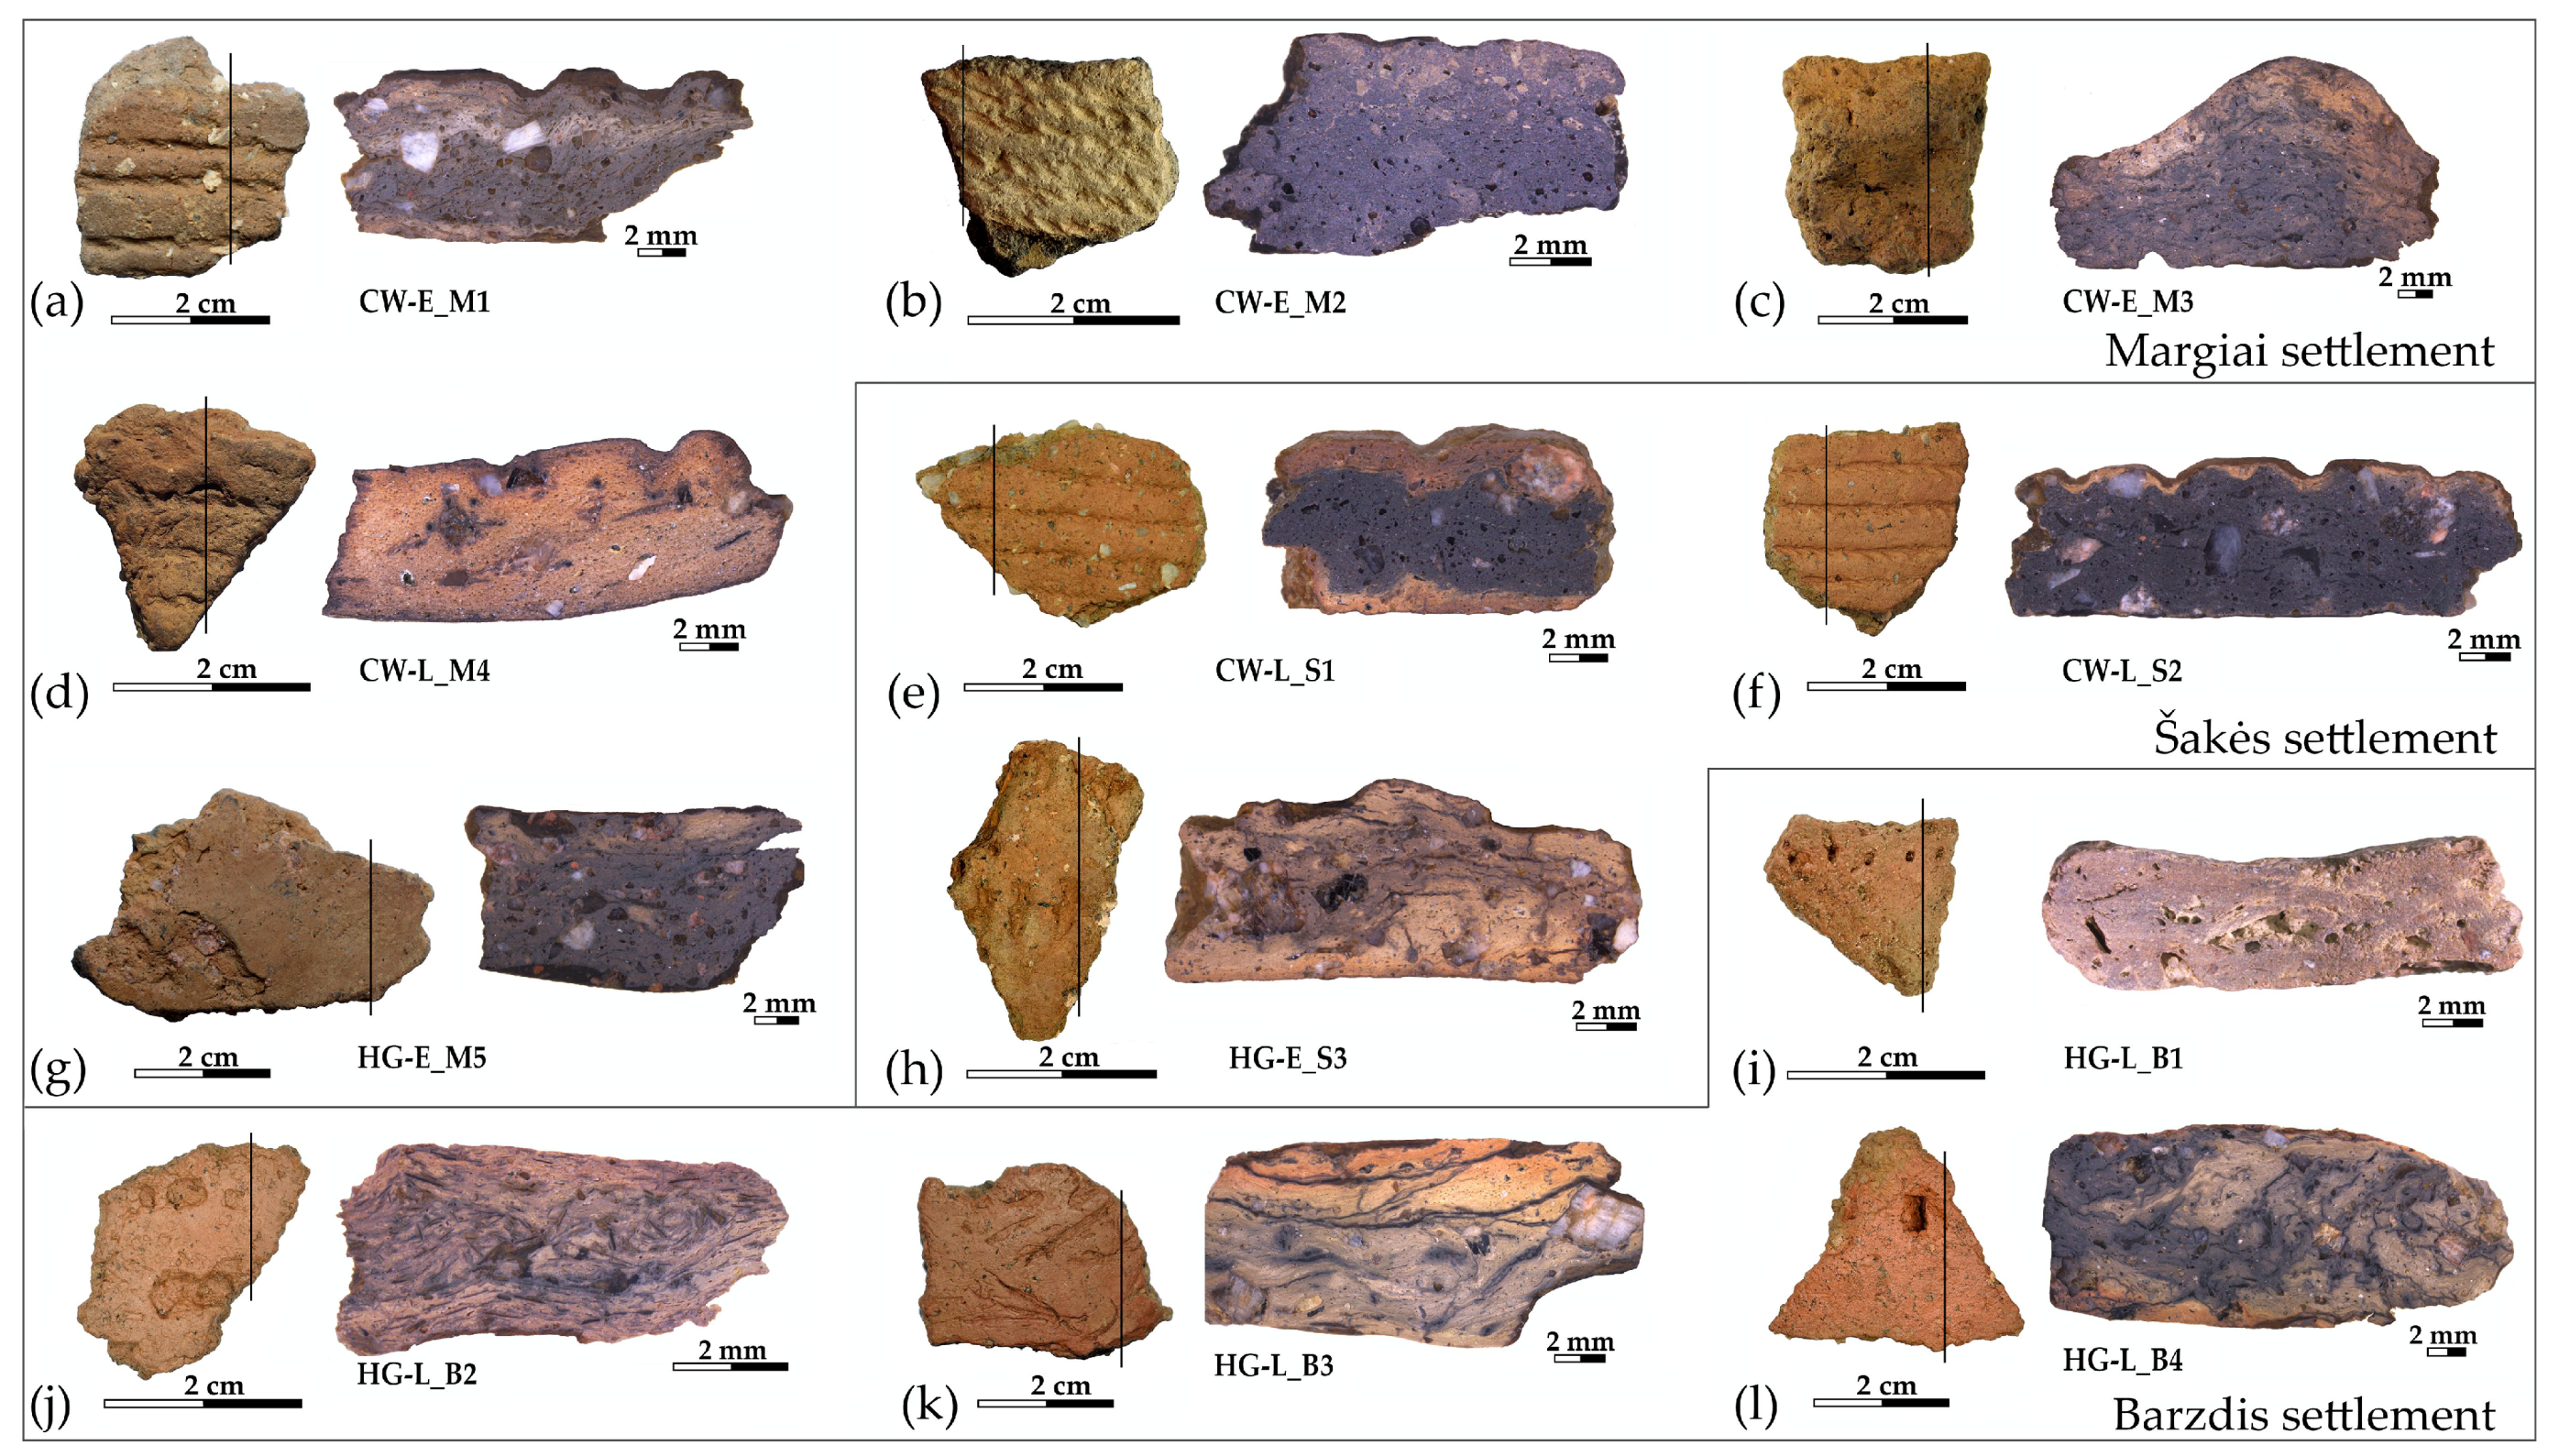
| CW-E_M1 | Margiai | 3000–2700 BCE, Globular Amphora Culture | Pot, body | 7.30 | 6.46 | Crushed granite |
| CW-E_M2 | Margiai | 2800–2500 BCE, Corded Ware Culture | Beaker, neck | 5.18 | 2.62 | Sand, grog (?) |
| CW-E_M3 | Margiai | 2800–2500 BCE, Corded Ware Culture | Short-wave molded pot, rim | 7.61 | 6.85 | Crushed granite, grog (?) |
| CW-L_M4 | Margiai | 2500–2000 BCE, Late Corded Ware Culture | Beaker, rim | 6.02 | 2.92 | Sand, crushed granite |
| HG-E_M5 | Margiai | 3000–2500 BCE, Neman Hunter-Gatherer | Pot, body | 9.11 | 14.98 | Crushed granite |
| CW-L_S1 | Šakės | 2500–2000 BCE, Late Corded Ware Culture | Beaker, body | 6.36 | 6.28 | Crushed granite |
| CW-L_S2 | Šakės | 2500–2000 BCE, Late Corded Ware Culture | Beaker, body | 6.18 | 4.01 | Crushed granite |
| HG-E_S3 | Šakės | 3000–2500 BCE, Neman Hunter-Gatherer | Pot, body | 7.70 | 3.90 | Crushed granite |
| HG-L_B1 | Barzdis | 2500–2000 BCE, Narva Hunter-Gatherer | Cup, rim | 5.08 | 1.56 | Straw, sand |
| HG-L_B2 | Barzdis | 2500–2000 BCE, Narva Hunter-Gatherer | Pot, neck | 7.20 | 2.38 | Straw |
| HG-L_B3 | Barzdis | 2500–2000 BCE, Neman Hunter-Gatherer | Pot, body | 8.35 | 9.54 | Crushed granite |
| HG-L_B4 | Barzdis | 2500–2000 BCE, Neman Hunter-Gatherer | Pot, body | 11.73 | 8.60 | Crushed granite |
Publisher’s Note: MDPI stays neutral with regard to jurisdictional claims in published maps and institutional affiliations. |
© 2022 by the authors. Licensee MDPI, Basel, Switzerland. This article is an open access article distributed under the terms and conditions of the Creative Commons Attribution (CC BY) license (https://creativecommons.org/licenses/by/4.0/).
Share and Cite
Šatavičė, E.; Skridlaitė, G.; Grigoravičiūtė-Puronienė, I.; Kareiva, A.; Selskienė, A.; Suzdalev, S.; Žalūdienė, G.; Taraškevičius, R. Corded Ware and Contemporary Hunter-Gatherer Pottery from Southeast Lithuania: Technological Insights through Geochemical and Mineralogical Approaches. Minerals 2022, 12, 1006. https://doi.org/10.3390/min12081006
Šatavičė E, Skridlaitė G, Grigoravičiūtė-Puronienė I, Kareiva A, Selskienė A, Suzdalev S, Žalūdienė G, Taraškevičius R. Corded Ware and Contemporary Hunter-Gatherer Pottery from Southeast Lithuania: Technological Insights through Geochemical and Mineralogical Approaches. Minerals. 2022; 12(8):1006. https://doi.org/10.3390/min12081006
Chicago/Turabian StyleŠatavičė, Eglė, Gražina Skridlaitė, Inga Grigoravičiūtė-Puronienė, Aivaras Kareiva, Aušra Selskienė, Sergej Suzdalev, Gailė Žalūdienė, and Ričardas Taraškevičius. 2022. "Corded Ware and Contemporary Hunter-Gatherer Pottery from Southeast Lithuania: Technological Insights through Geochemical and Mineralogical Approaches" Minerals 12, no. 8: 1006. https://doi.org/10.3390/min12081006
APA StyleŠatavičė, E., Skridlaitė, G., Grigoravičiūtė-Puronienė, I., Kareiva, A., Selskienė, A., Suzdalev, S., Žalūdienė, G., & Taraškevičius, R. (2022). Corded Ware and Contemporary Hunter-Gatherer Pottery from Southeast Lithuania: Technological Insights through Geochemical and Mineralogical Approaches. Minerals, 12(8), 1006. https://doi.org/10.3390/min12081006