Article

Prospective Evaluation of Geothermal Resources in the Shangqiu Uplift of the Southern North China Basin with Magnetotelluric Detection

1
Key Laboratory of Exploration Technologies for Oil and Gas Resources, Ministry of Education, Yangtze University, Wuhan 430100, China
2
College of Geophysics and Petroleum Resources, Yangtze University, Wuhan 430100, China
3
Tianjin Geothermal Exploration and Development-Designing Institute, Tianjin 300250, China
4
School of Geophysics and Information Technology, China University of Geosciences, Beijing 100083, China
*
Authors to whom correspondence should be addressed.
Minerals 2022, 12(7), 811; https://doi.org/10.3390/min12070811
Submission received: 13 April 2022 / Revised: 26 May 2022 / Accepted: 22 June 2022 / Published: 25 June 2022
(This article belongs to the Special Issue Electromagnetic Exploration: Theory, Methods and Applications)

Abstract

:
The magnetotelluric sounding (MT) method is used to detect and study the deep stratigraphic structure and hidden faults in the Shangqiu Uplift. A total of 4 MT profiles are arranged, and 97 stations are collected. The nonlinear conjugate gradient (NLCG) two-dimensional inversion method is used to jointly invert data from both the TE and TM modes after a dimensionality analysis and impedance tensor decomposition; reliable two-dimensional resistivity models are produced since the data quality is excellent. Three-dimensional inversion is carried out to full impedance tensor as well to produce a three-dimensional resistivity model of the study area, which shows good consistency with the two-dimensional models. The results show that the electrical structure of the Shangqiu Uplift has typical layered characteristics, which can be divided into three layers from top to bottom, namely low-, medium-to-high-, and high-resistivity layers. According to the resistivity models and in combination with the gravity, aeromagnetic, seismic, and regional geological data of the study area, a geological map of the basement rock of the Shangqiu Uplift is produced. Two prospective geothermal anomaly areas are proposed according to the distribution of the high-resistivity anomaly formed by the basement uplift, which has a good corresponding relationship with the high-value area of the regional geothermal field. A geothermal exploration well (SR-1) is constructed in one of the inferred prospective geothermal anomaly areas. The well is 1702 m deep, with a water output of 1500 m3/day and a wellhead water temperature of 51.5 °C. This is the geothermal well with the largest water yield in the Shangqiu area at present, which provides a new basis for future geothermal exploration, development, and utilization.

1. Introduction

The magnetotelluric sounding method is a natural field source frequency-domain electromagnetic method. The electromagnetic field signal is observed on the surface, and the distribution of the resistivity of the underground medium is obtained according to the different penetration depths of the signals of different frequencies [1]. It is a very effective geophysical method for geothermal field exploration and has been widely and successfully used in various kinds of geothermal fields [2,3]. The principle of geothermal field exploration is mainly based on inferring the buried depth of the underground strata and the location of the fault structure and its trend by analyzing the resistivity anomaly, with the ultimate purpose of exploring the deep underground thermal storage structure. In fact, the electrical resistivity of rocks depends largely on the aqueous solution in the rock pores or fissures, which makes low resistivity an indicator of the existence of underground fluids. This results in lower-resistivity anomalies in the thermal storage structure than the surrounding rocks. In this way, it is possible to directly predict the spatial location of thermal storage structures in geothermal fields according to low-resistivity anomalies.
The application of the MT method in a geothermal investigation is mainly meant to find out the deep geological features and the distribution of underground fluids so as to delineate the geothermal prospect [4]. This kind of usage has been carried out in many places in China. Geothermal exploration with the MT method in the Tianjin area started in 2001, and geothermal surveys have been completed in Wanjia, Ninghe-Panzhuang, Zhouliangzhuang, Southwest Tianjin, Baodi City, and Binhai district [5,6,7]. Many achievements have been made in using low-resistivity anomalies to delineate geothermal anomaly areas [8]. In the geothermal survey of the Yinchuan Basin, which used the MT method combined with geothermal gradient data, it was speculated that the thermal storage area is a deep, low-resistivity area with resistivity values lower than 20 Ωm [9]. During the geothermal investigation of the Kaifeng Depression, the strata were electrically stratified by the MT method, and the area with a resistivity value less than 45 Ωm was delineated as the high-resistivity basement, which was inferred to be the main geothermal anomaly area [10].
Based on the resistivity models obtained from four MT profiles arranged in the Shangqiu Uplift and the adjacent areas, and combined with the gravity, aeromagnetic, seismic, and regional geological data of the study area, this paper discusses the electrical characteristics of the deep structure and the faults of the Shangqiu Uplift. Finally, the geothermal prospect is delineated to provide new evidence and information for the subsequent evaluation and utilization of geothermal resources. The prospect is based on the high-resistivity anomaly formed by the basement uplift, which has a good corresponding relationship with the high-value area of the regional geothermal field.

2. Geological Backgrounds

The Taikang Uplift is located in the central and eastern part of Henan Province and is a secondary structural unit in the northern part of the southern North China Basin [11]. It is sandwiched by the Kaifeng Depression in the north and the Zhoukou Depression in the south (Figure 1) and connects the Songji Uplift in the west and the Huaibei Uplift in the east. The overall structural pattern is “two depressions and one uplift” from south to north. The Taikang Uplift trends in the NWW direction and can be further divided into some secondary structural units such as the Yanling Uplift, the Zhuanlou Depression, the Tongxu Uplift, the Xingkou Depression, and the Shangqiu Uplift (Figure 1a) [12]. In its early stages, it was mainly affected by the strong north–south compression of the Qinling–Dabie Orogenic Belt in the Indosinian period, which formed an NWW-trending fold-thrust nappe structure that was roughly consistent with its main trend. In the later stages, it was affected by the Tanlu strike-slip fault zone; the NE–NNE-trending structures were superimposed [13].
The Shangqiu Uplift is located in the eastern part of the Taikang uplift. It is bounded by the Jiaozuo-Shangqiu fault in the north and is adjacent to the Huangkou depression, which belongs to the Kaifeng Depression. It is also bounded by the Suixian fault in the west and is adjacent to the Xingkou Depression. Regionally, it is located in the area extending from Suixian County to Shangqiu City in Henan Province, with an area of about 2500 km2. Its surface is covered by Quaternary sediments, while Neogene, Carboniferous–Permian, Ordovician and Cambrian strata, and Archaean crystalline basement developed under the covering. Archaean strata are ancient metamorphic rocks that are the main ore-bearing strata for regional metamorphic magnetite. The Cambrian–Ordovician strata are ancient, buried mountain areas that generally experienced weathering erosion. They are overlain by the Carboniferous–Permian strata, which are the main coal-bearing strata in the region. Many previous studies have been carried out in the Shangqiu Uplift, but most of them focused on the exploration and development of petroleum, iron ore, and coal [14,15,16,17]. The necessary research work for geothermal resource investigation is lacking, and further understanding and evaluation of the thermal resource potential in this region are needed.

3. Data Collecting, Processing, Analysis, and Inversion

3.1. Colleting and Processing

The distribution of MT stations in the study area is shown in Figure 2. A total of 97 broadband MT stations with an average station spacing of 1 km were collected, forming four profiles (L1, L2, L3, and L4). As shown in Figure 2, the L1 profile was distributed in the near EW direction with 25 stations, and the other three profiles, L2, L3, and L4, were basically arranged perpendicularly to the Jiaozuo-Shangqiu fault in the SW-NE direction, from west to east, with a line spacing of around 15 km and with 27, 27, and 18 stations, respectively. The data were collected by Tianjin Geothermal Exploration and Development Designing Institute from September to October 2017, with the use of MTU-5 instruments produced by Phoenix-Geophysics, Canada. At least three hours of two horizontal electrical field components (Ex and Ey) and two horizontal magnetic field components (Hx and Hy) were acquired at each station, with the coordinate system defined as true north (x) and true east (y). To collect strong electrical signals, the length of the dipoles was 100 m.
The study area starts from Suixian County in the west and extends to Shangqiu City in the east. This area has undergone medium development. Thus, noise sources such as high-voltage power lines, highways, railways, and mobile communication facilities are very common, and the near-field noise is serious. Through a comparative analysis of noise distribution, we time-synchronously collected the stations of the L1 and L3 profiles and those of the L2 and L4 profiles in order to achieve remote reference processing [19]. The MT data were processed with the SSMT2000 package, which integrates a robust estimation of the impedance tensor [20]. Noisy data were deleted using the MTEditor package. Data quality greatly benefits from these processing techniques, and with a relatively long acquisition time in a frequency range of 320~0.01 Hz, most stations could produce good data. Figure 3 shows the apparent resistivity and phase curves of the station L3-6 before and after the remote reference processing using SSMT2000. It can be seen in the left panel that the apparent resistivity curve is smooth and reliable when the frequency is greater than 10 Hz. Then, the apparent resistivity curves of the yx-mode (red) and the xy-mode (blue) rise or fall with an asymptote trend at around 45°, which means that they are badly influenced by typical near-source interference from electrical and magnetic noises, respectively. The right panel shows the apparent resistivity and phase curves of the same station processed with remote magnetic field exponents. Both apparent resistivity and phase curves show that the electrical and magnetic noises are effectively removed.

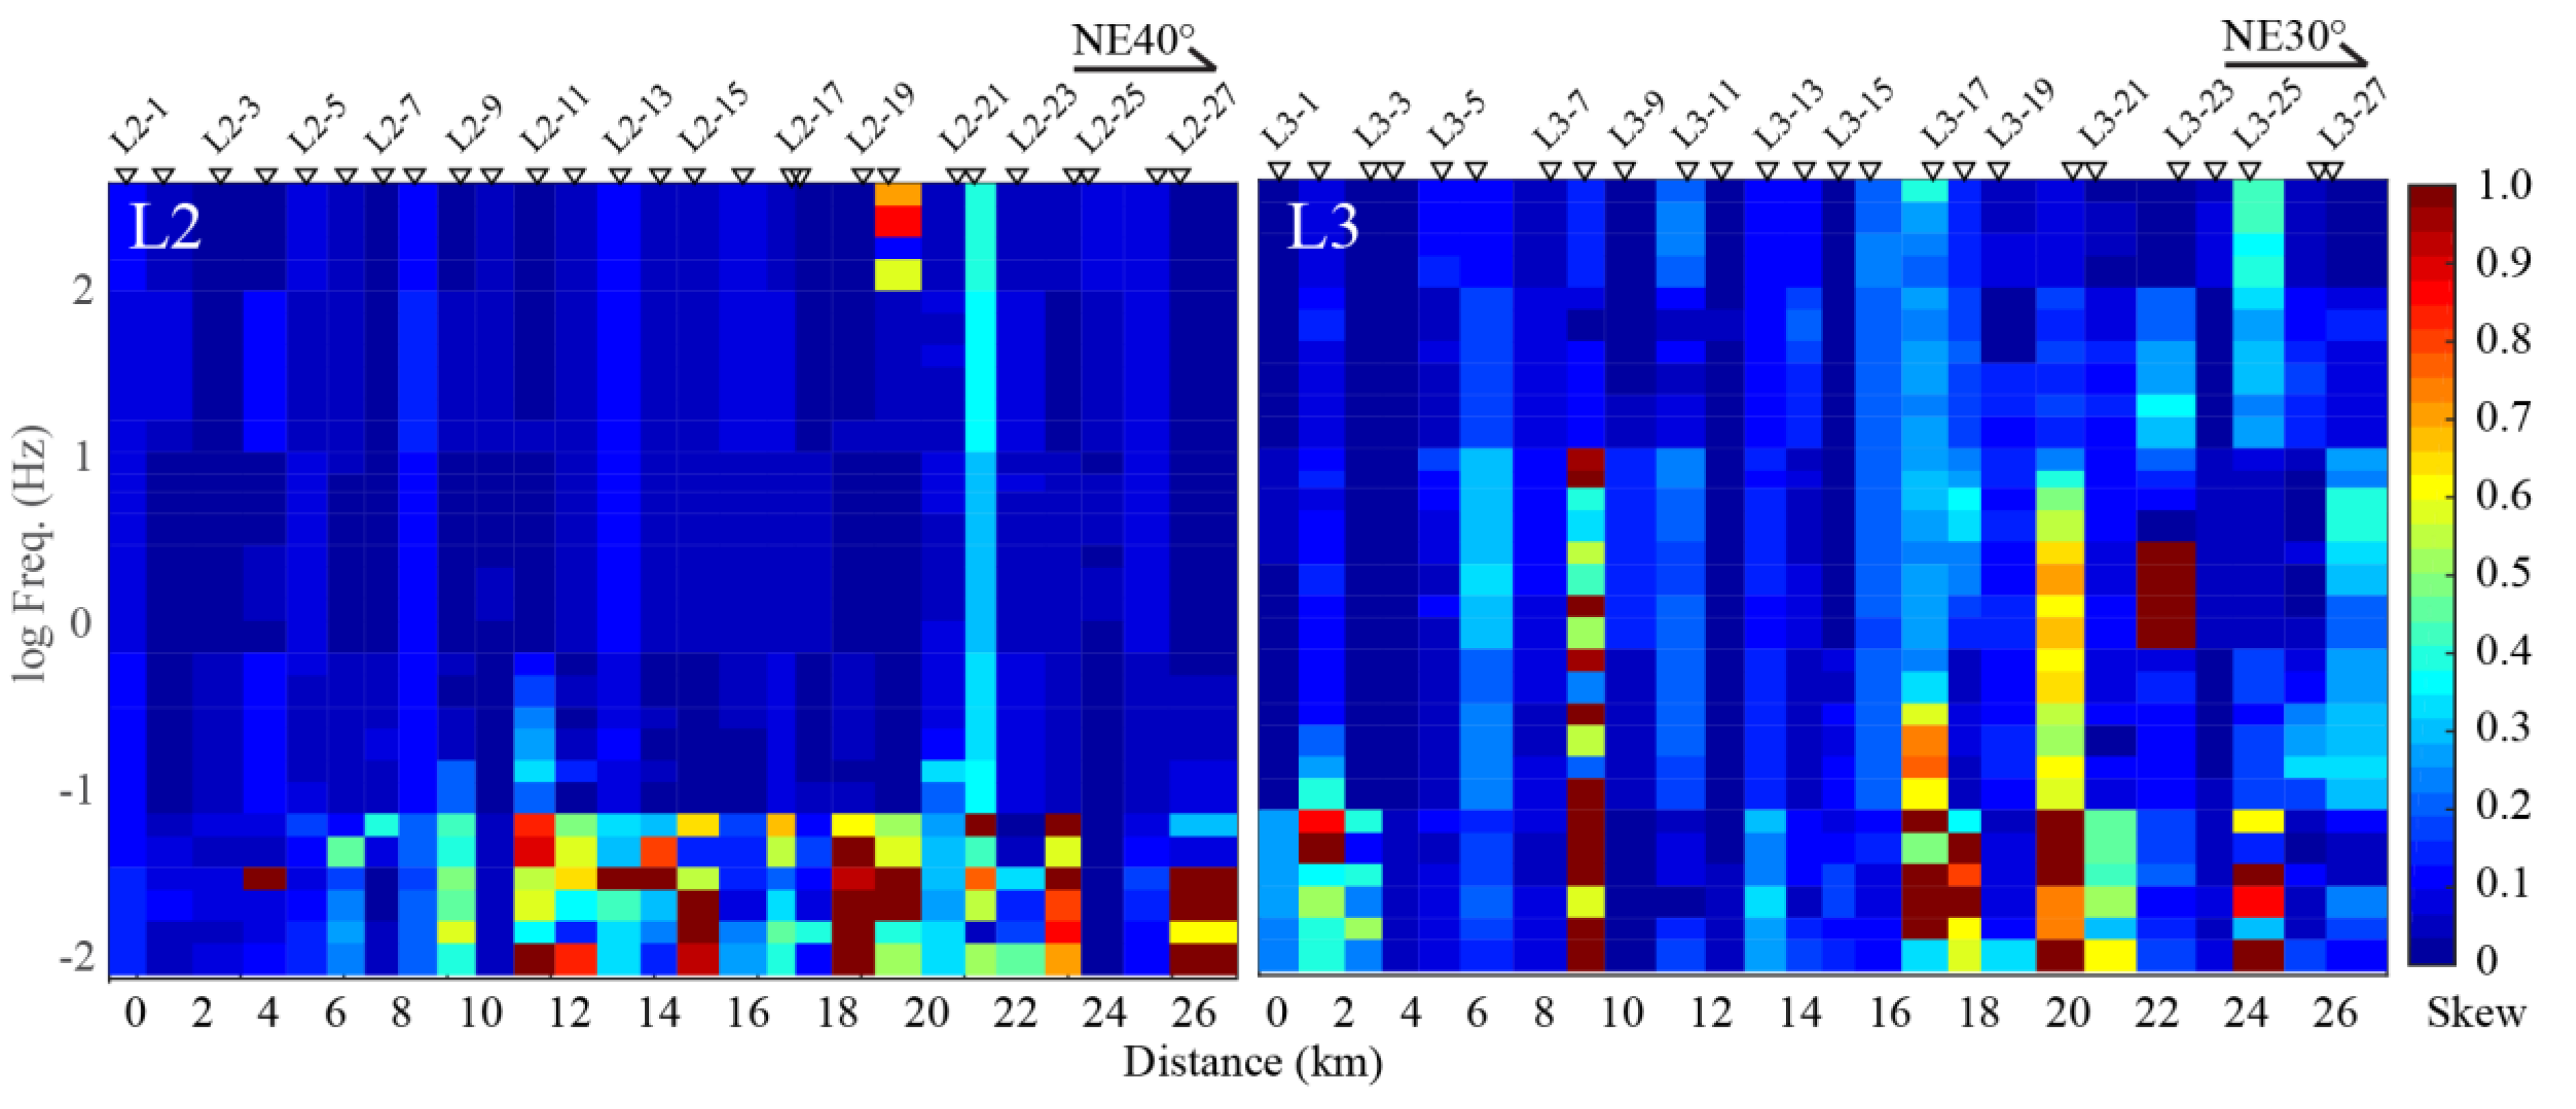
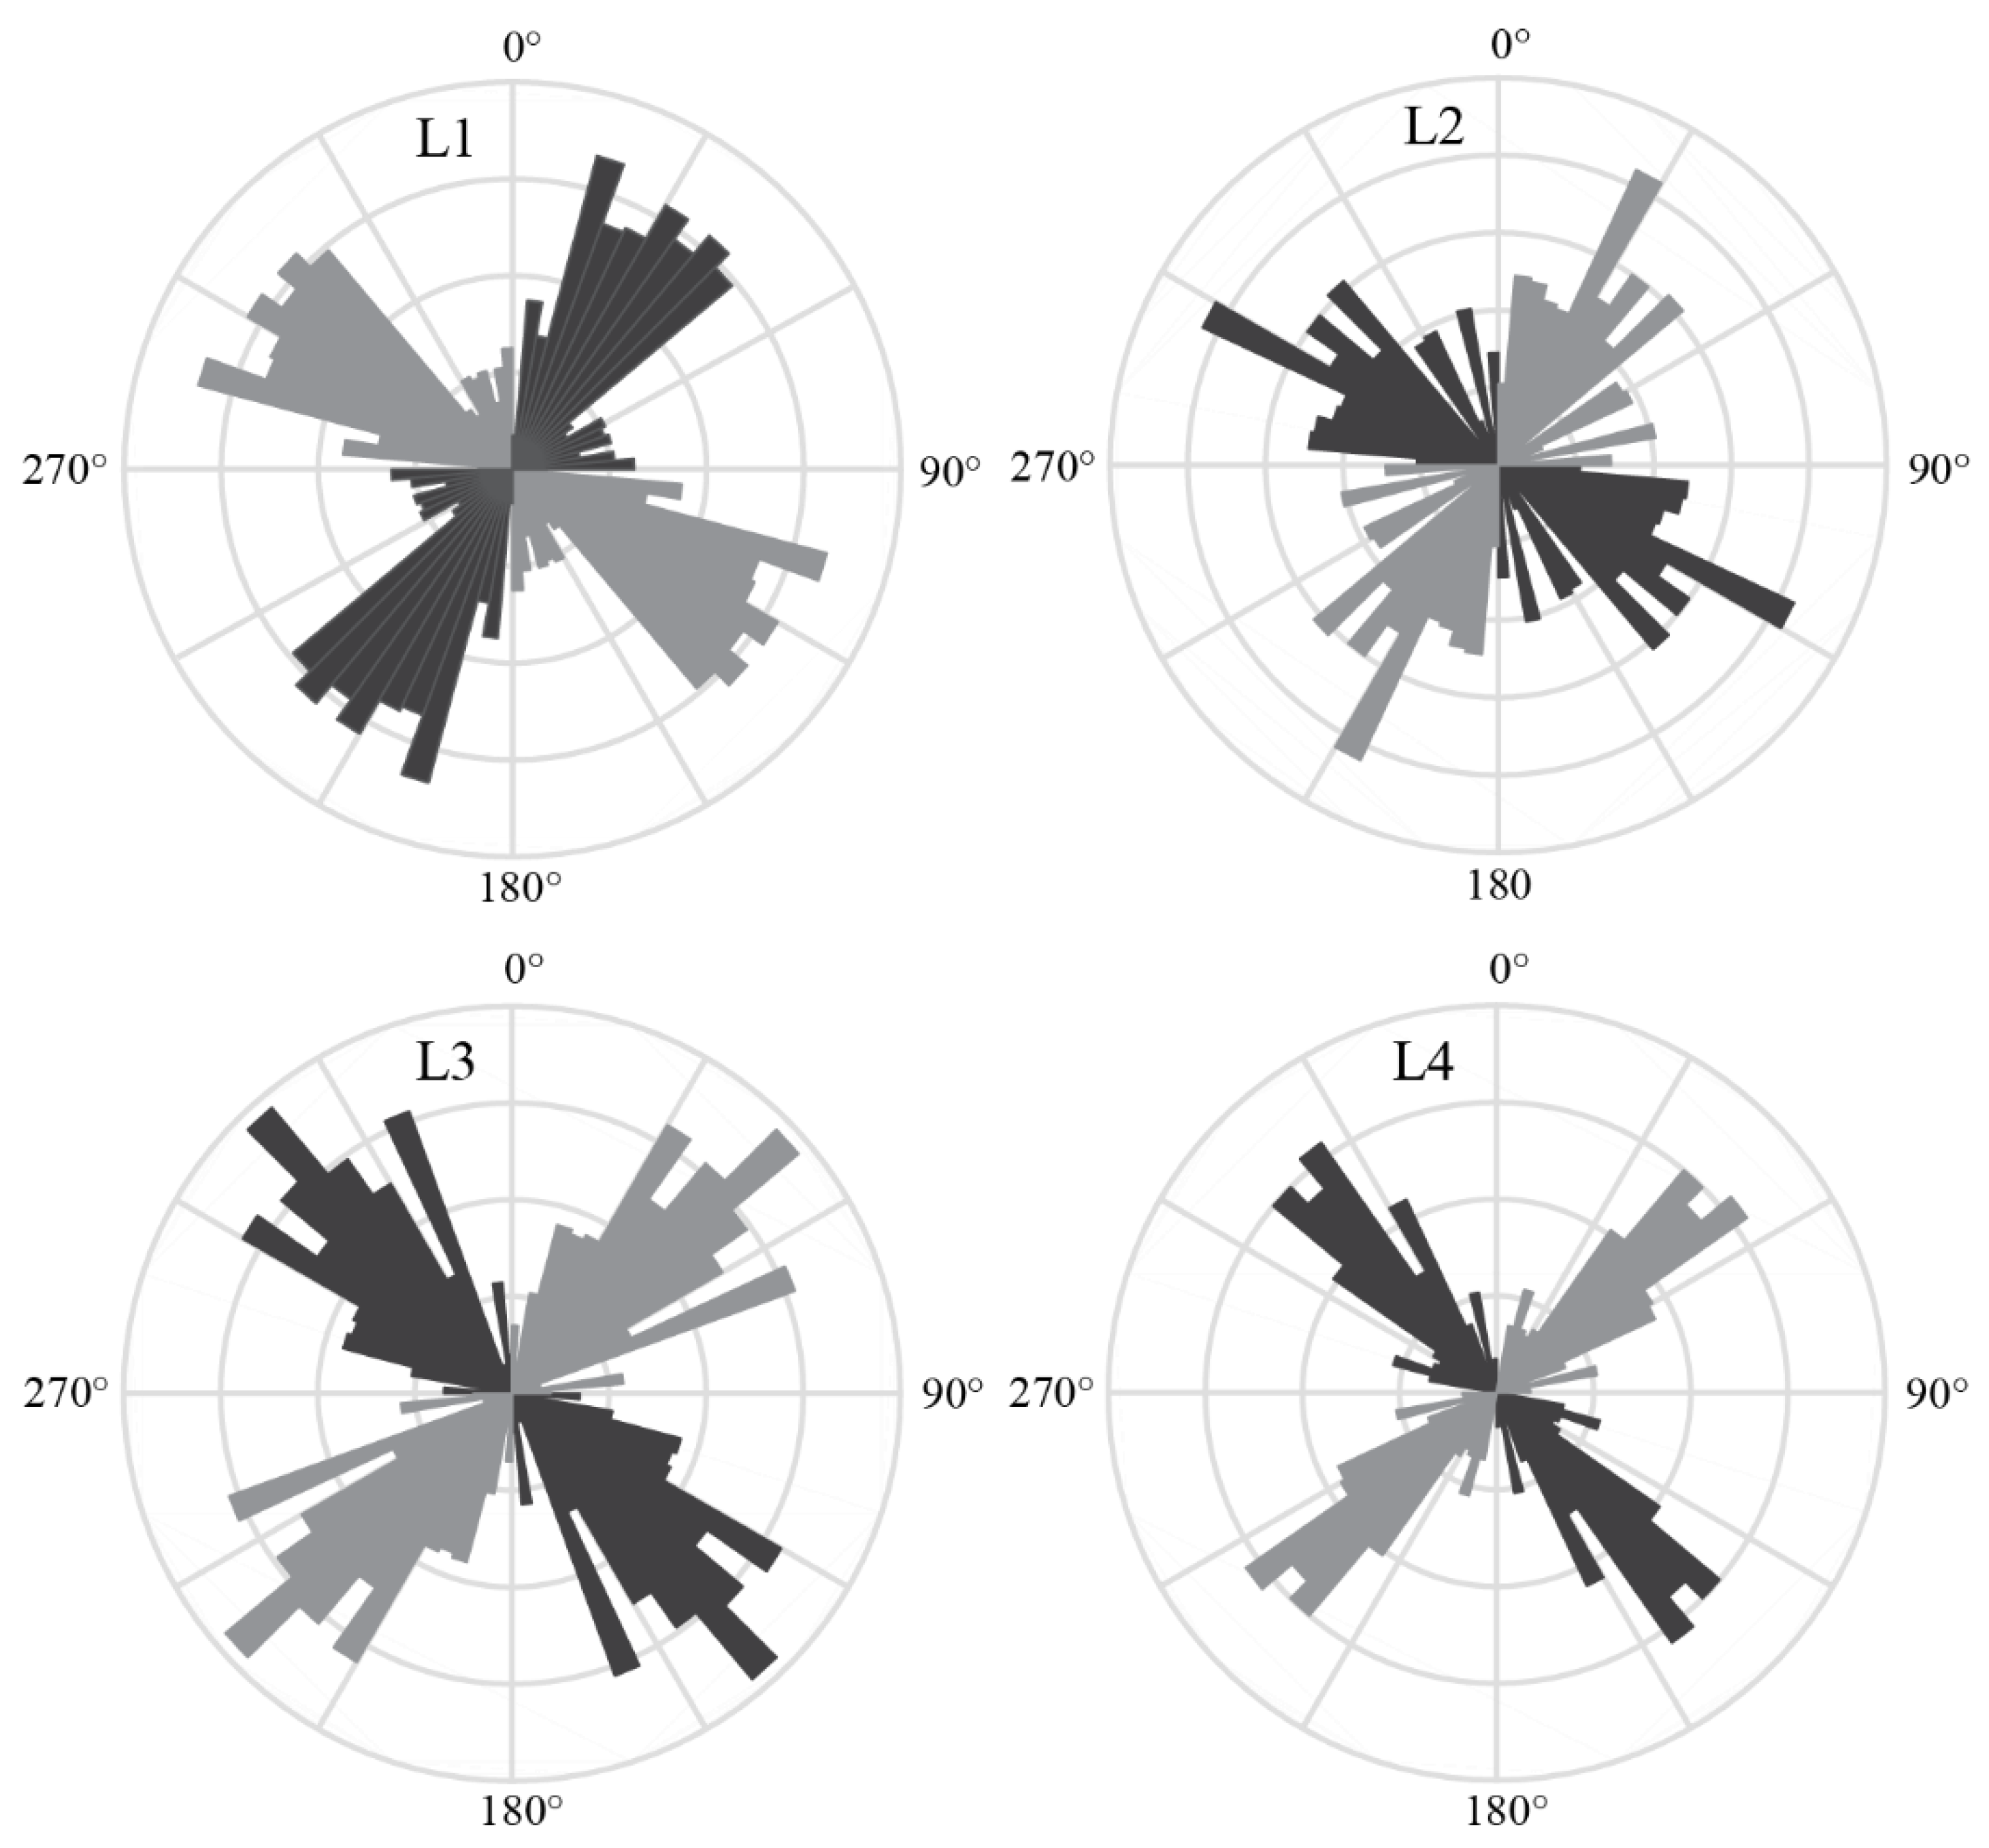
3.2. Dimensionality and Strike Direction

Before the processed MT data can be inverted, a dimensionality analysis needs to be performed to determine whether a 2D or 3D approach is applicable. The G-B impedance tensor decomposition algorithm [21] was used in this dataset. Figure 4 shows the skew sections of the L2 and L3 profiles, which indicate the dimensionality information. When the skew value is smaller than 0.2, it can be treated as a 2D structure; otherwise, 3D inversion is necessary. The L2 and L3 skew sections show that most skew values are smaller than 0.2, which meets a 2D assumption. However, the skew values at some frequencies are larger than 0.2, which may be caused by 3D structures in the deep or noise. The analysis results of the L1 and L4 profiles show the same conclusion, that the underground structures can be treated as 2D. Thus, strike direction was analyzed as well to determine the rotation angle since the data had been collected in the north–south and west–east coordinate system.
The frequencies of each station were grouped into 320~100 Hz, 100~10 Hz, 10~1 Hz, 1~0.1 Hz, and 0.1~0.01 Hz. The strike angles of the five frequency groups of each station were produced by the G-B decomposition [21]. Then, the strike angles were statistically expressed as rose diagrams for each profile in a frequency range of 100~0.01 Hz (Figure 5). The impedance tensor decomposition result had an ambiguity of 90 degrees, which could only be solved with external information such as a regional geological map or induction vectors. According to the geological information of the research area, the black wedges in Figure 5 indicate the strike directions. The nearly W–E-trending profile L1 has a well-defined strike direction of NE30° (the black wedge in Figure 5) since it perpendicularly crosses the boundary fault between the Xingkou Depression and the Shangqiu Uplift. However, the other three profiles vertically cross the boundary between the Shangqiu Uplift and the Huangkou Depression from the southwest to the northeast. Thus, clearly defined strike directions of SE120°, SE145°, and SE145° can be found for the L2, L3, and L4 profiles, respectively (black wedges in Figure 5). This variation of strike directions between L2, L3, and L4 may have been caused by the change in the trending of the Jiaozuo-Shangqiu fault around the L3 profile. As a result, the measured impedance tensors of profiles L1, L2, L3, and L4 were rotated toward NE30°, SE120°, SE145°, and SE145°, respectively, before the 2D inversions.

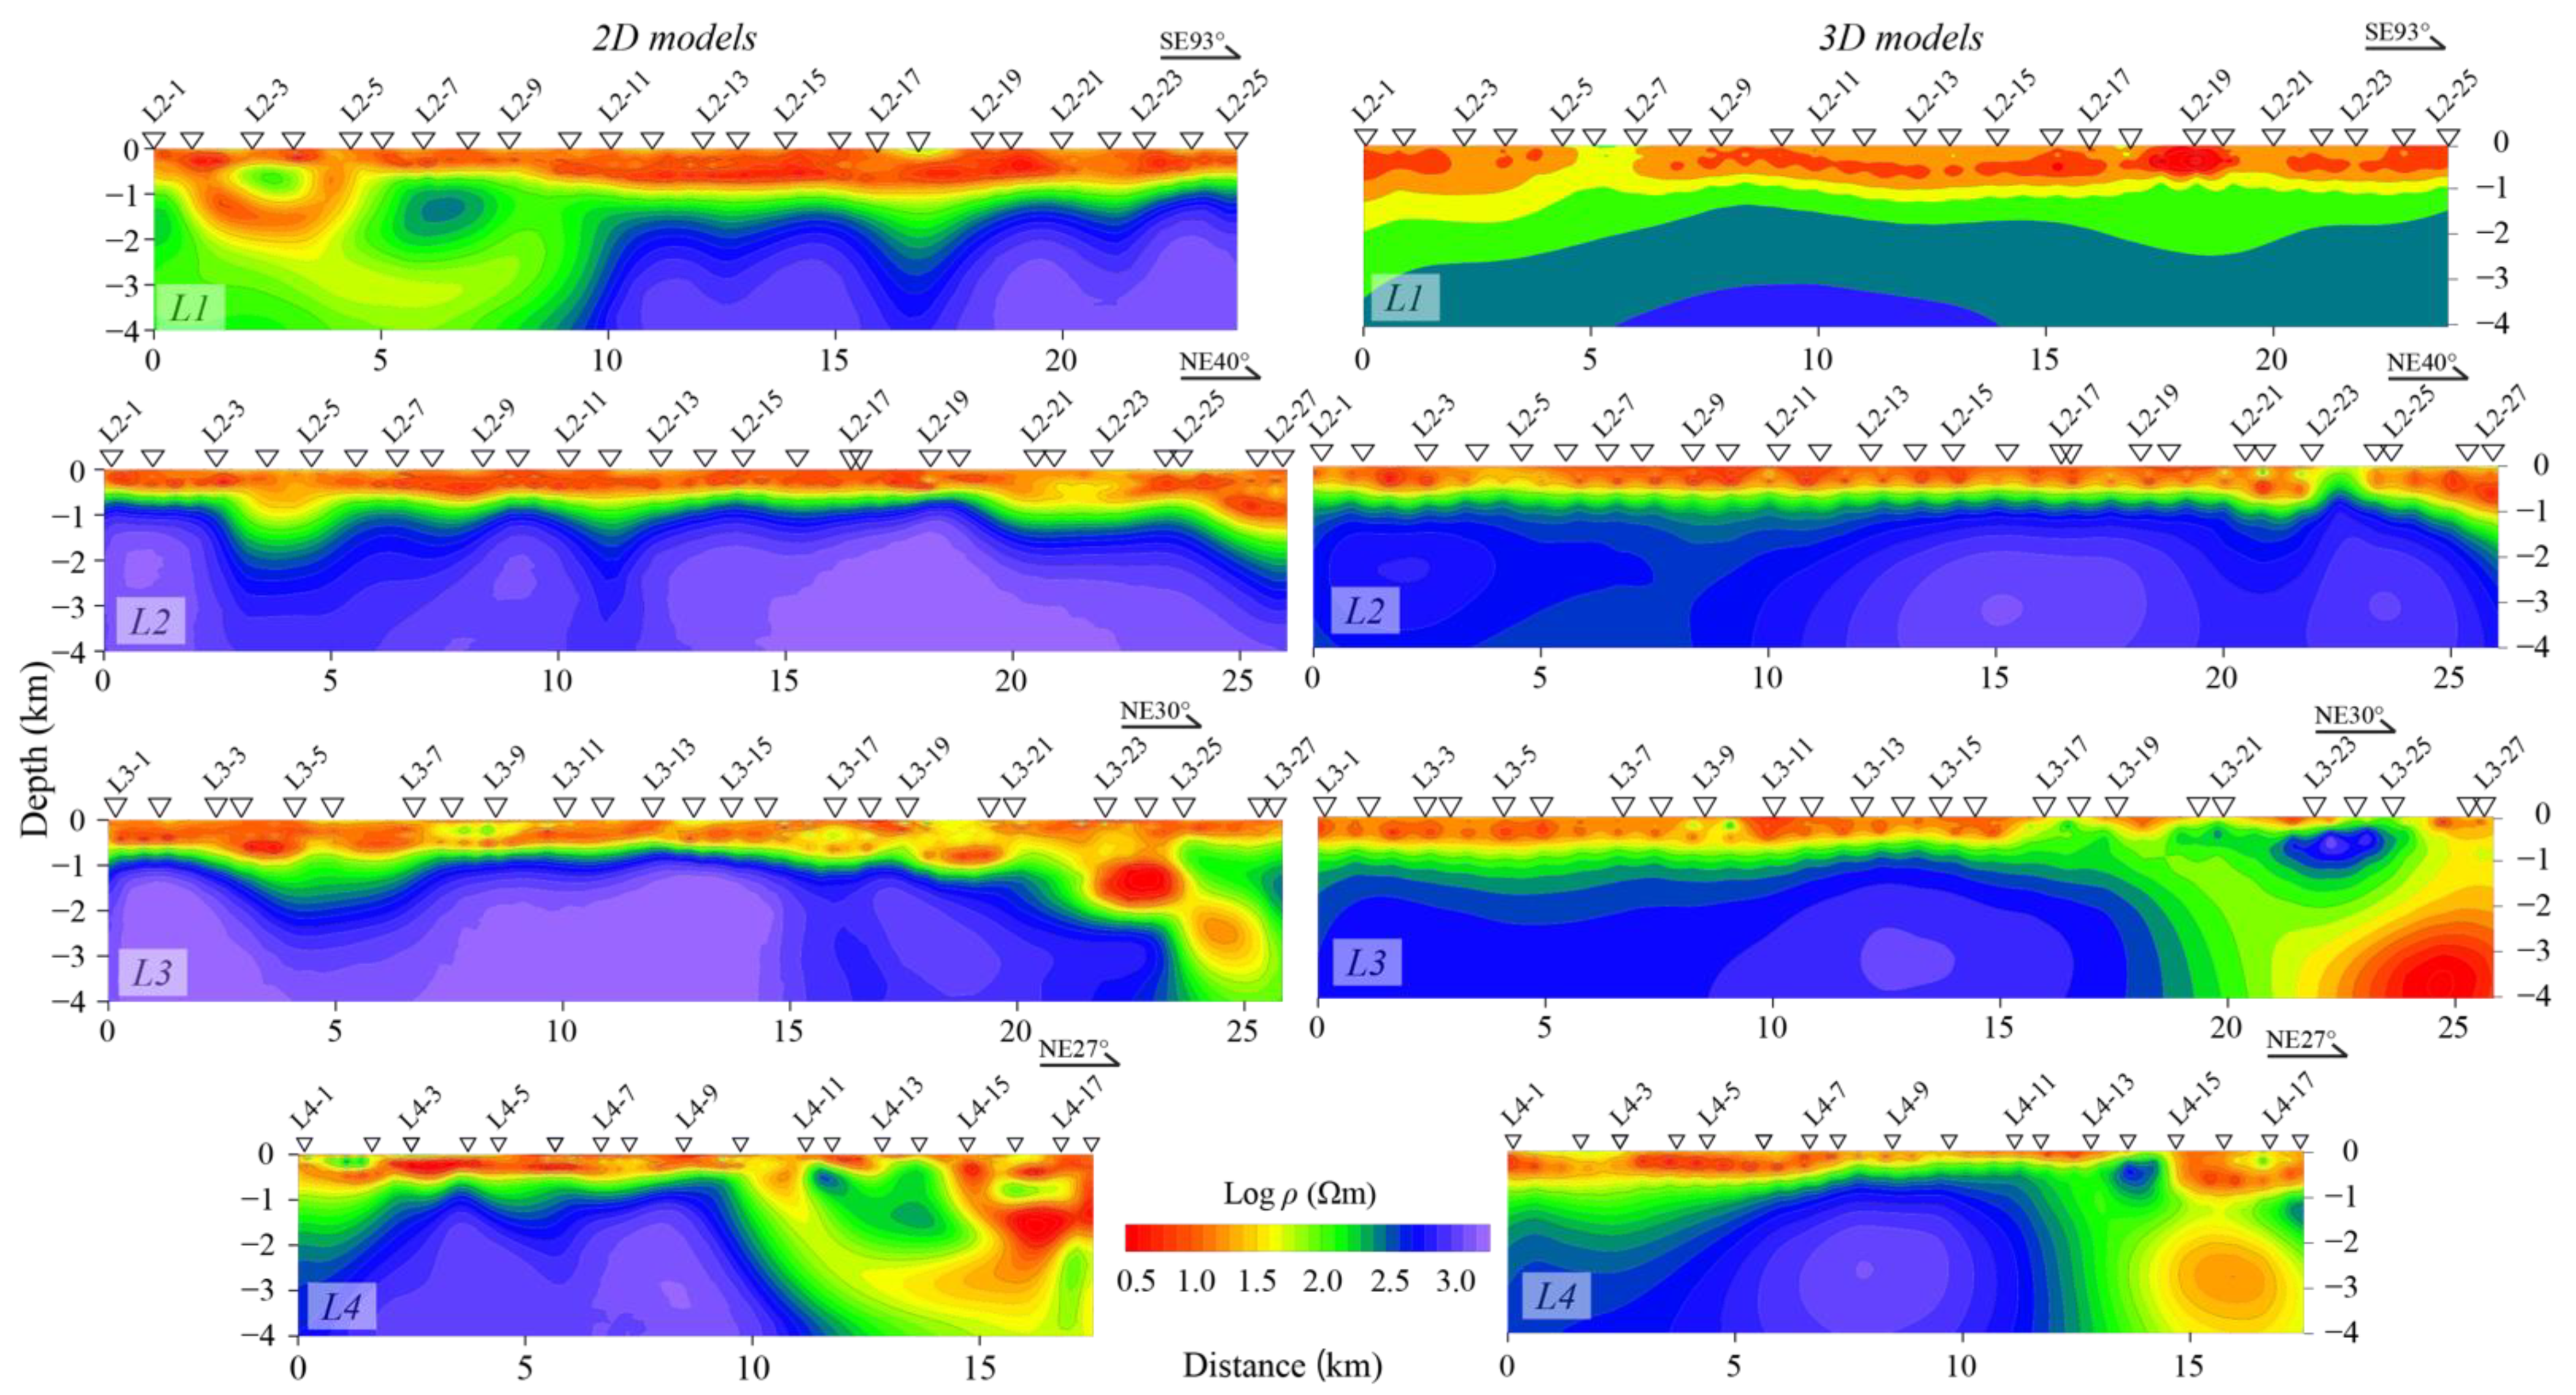
3.3. Two- and Three-Dimensional Inversions

After the impedance tensors were rotated, 2D inversion was achieved using the WinGLink software, which integrated the Nonlinear Conjugate Gradient (NLCG) algorithm [22]. Both transverse magnetic (TM) and transverse electric (TE) modes of data in a frequency range of 320~0.01 Hz were included in the inversions. Assuming that the average resistivity of the study area was 10 Ωm, the skin depth of a 0.01 Hz signal would be around 15.8 km, which is far deeper than the target depth of 4 km. The error floors of apparent resistivity and phase for both TM and TE modes were set to 10% and 5%, respectively. Auto static shift correction was switched on during the inversions to remove possible static shifts. The most important parameter in the NLCG inversion is the regularization factor τ, which balances the model roughness and data fitting. A large τ generates a smooth model, although the data are poorly fitted. In contrast, a small τ fits the data well, while a rough illness model is produced. A series of τ values were then tested, and the L-curve, which represents the functional relationship between model roughness and data fitting, was plotted [23,24]. The result shows that an τ equal to 10 balanced the model roughness and data fitting best. Thus, all profiles were inverted with τ = 10. The inversions started with a 100 Ωm half-space and finished after 100 iterations. The RMS misfits of the profiles were between 2.0 and 2.5, indicating that the data were fitted well.
The 3D inversion was also achieved with the ModEM package [25] since the west to east structures were superimposed by the southwest to northeast structures. The full impedance tensors of 97 MT stations were inverted with a frequency band of 100~0.01 Hz. The error floors of the diagnostic and off-diagnostic components were set to 10% and 5% of |ZxyZyx|1/2, respectively. The study area was discretized with an 800 m grid in the x and y directions, in the core region where the MT stations are distributed. A total of 12 additional cells were padded onto each of the four horizontal directions, with a step ratio of 1.5. Forty-nine vertical layers were included in the thickness of the first layer, equaling to 100 m and an increasing ratio of 1.1. The inversion started with a 100 Ωm half-space, and the RMS decreased to 2.82 after 102 iterations. A comparison of the 2D models (left panel) and 3D models (right panel) is shown in Figure 6. Although the 2D and 3D models show very good consistency, the 2D models are much more sensitive to the boundaries. This may be because this area can be treated as a 2D structure, and 3D inversion over-smoothed the structures [26]. Thus, 2D models are used in the following discussion.

4. Features of the Resistivity Models

According to these 2D resistivity models (Figure 6), the electrical structure of the Shangqiu Uplift can be vertically divided into three layers. The first electrical layer is a low-resistivity layer with a resistivity value less than 30 Ωm, which can be continuously traced in the four 2D models. The second electrical layer is a medium- to high-resistivity layer, which has a resistivity value between 30 and 100 Ωm. Among them, the overall thickness of this layer at stations L1-3 to L1-4 in the L1 section and that at stations L3-5 to L3-7 in the L3 section are increased since they are both affected by faults. The thickness of other areas is not much different. The third electrical layer is a high-resistivity layer, with a resistivity value greater than 100 Ωm and an undulating top surface. The amplitude of the uplift in the eastern part of the Shangqiu Uplift is larger than that in the western part, which may be affected by the Tanlu fault zone. According to the two-dimensional models of profiles L2, L3, and L4 (Figure 7b–d), the electrical structure of the models show that beneath stations L2-6, L3-9, and 4-3 in the L2, L3, and L4 models, respectively, there is a secondary depression zone along profiles L2, L3, and L4. We named it the Panzhuang-Luhe Secondary Depression, which is a secondary structural unit of the Shangqiu Uplift. According to the results of coal exploration in eastern Henan, the basement rock of this secondary depression is a Carboniferous and Permian coal-bearing strata that dips slightly toward the south [14,15,16,17]. The dip angles of the strata are generally between 6° and 10°. The south and north sides of the depression zone are accompanied by two sets of lateral electrical gradient zones (F2 and F3 in Figure 7). According to our resistivity models and combined with regional geological and seismic exploration data [14,15,16,17], it can be concluded that the F2 fault is the Southern Minquan-Shangqiu fault, and the F3 fault is the Luhe fault. The F2 fault is northwest–southeast-trending and is southwestward-dipping, with an angle of 30–65° and a fault width of more than 300 m. The F3 fault also trends from northwest to southeast, but it is northeastward-dipping with an angle of 35–65° and a fault width of more than 600 m.
From the electrical structure model of the L1 profile, there are two west-dipping electrical gradient zones (F4 and F5) between stations L1-9 and L1-10 and near station L1-18. According to regional geological data [14,15,16,17], the F4 fault is the Ningling fault, and the F5 fault is the Suixian fault. The Suixian fault is the boundary between the Xingkou Depression and the Shangqiu Uplift, which are both secondary tectonic units of the eastern Taikang Uplift. The basement rock surface of the Xingkou Depression to the east of the Suixian fault is deeper, while the basement rock surface of the Shangqiu Uplift to the west of it is shallower.

5. Prospective Evaluations of Geothermal Resources

The Shangqiu Uplift experienced two subsidences and two uplifts in the Early Paleozoic. During the subsidence period, carbonate rock strata were formed, and during the uplift period, the carbonate rock strata were strongly denuded. From the Middle Carboniferous to the Early Permian, seawater intruded from north to south, and a set of sea–land interfaces with a series of coal-bearing rocks developed in the area. From the end of the Triassic to the Paleogene, the Shangqiu Uplift was in a state of large-scale uplift. The buried Ordovician hills in the study area experienced weathering and leaching for up to 410 Ma before being covered by Neogene. The longer the sedimentary discontinuity lasts, and the stronger the weathering and leaching, the stronger the development of the pores, fractures, and caves in the carbonate rocks will be [27]. Therefore, the study area has the potential to form a good thermal reservoir.
As a secondary tectonic unit of the Taikang Uplift, the Shangqiu Uplift has a shallow basement rock burial depth and a significantly higher geothermal gradient than the depressional areas in this region. According to the results of MT work in the study area and combined with regional geology, geophysics, and drilling exploration data, we drew the basement-rock geological map of the Shangqiu Uplift, with a resistivity value of 100 Ωm as the boundary (Figure 8). The undulating shape of the basement rock and the distribution direction of the fault structure can be clearly seen in Figure 8. The basement rock surface depths of the Huanglou-Pingtai and the Qianzhang-Jiangzhuang anticlines are only 700 m deep, and the underlying strata beneath their Cenozoic covering strata are Ordovician.
The strikes of these two anticlines are NWW, suggesting that the basement structure is greatly influenced by the north–south compression of the Qinling-Dabie Orogenic Belt. In terms of local tectonic morphology, the core of the anticline generally has a high geothermal temperature and a large gradient while the two wings have a low geothermal temperature and a small gradient. It can be seen from Figure 9 that the distribution direction of the relatively high ground temperature anomaly (32 °C) at a depth of 300 m in the Shangqiu Uplift is in the NWW direction, which is generally consistent with the distribution direction of the Huanglou-Pingtai and the Qianzhang-Jiangzhuang anticlines; this reflects the characteristics of the large geothermal gradient when the basement rock is buried in a shallow area. According to this correspondence, two prospective geothermal anomaly areas are proposed in the study area, namely the Huanglou-Pingtai and the Qianzhang-Jiangzhuang prospective geothermal anomaly areas (see Figure 8). Delineating the prospective geothermal anomalies will have an important guiding significance for the subsequent exploration and development of geothermal resources in the Shangqiu Uplift.
To further verify the occurrence of geothermal resources in the study area, a geothermal exploration well (named SR-1, yellow star in Figure 8) is constructed in the Huanglou-Pingtai prospective geothermal anomaly area, with a maximum drilling depth of 1702 m. The drilling results of the borehole SR-1 show that the basement depth of the Shangqiu Uplift at this location is 901 m below the surface, and the overlying stratum is composed of Quaternary sediments with a thickness of 201.37 m and Neogene sediments with a thickness of 699.63 m. This is consistent with our interpretation. The results show that the water output is 1500 m3/d, and the water temperature at the wellhead is 51.5 °C. This is the geothermal well with the largest water yield in the Shangqiu Uplift at present, and it provides a new basis for future geothermal exploration, development, and utilization.

6. Conclusions

We arranged four MT profiles in the Shangqiu Uplift and its adjacent areas and performed data analyses as well as 2D and 3D inversions on the data. According to the resistivity models and combined with regional geological data, the faults in the study area have been inferred, and the strata have been divided. The main results are as follows:
(1)
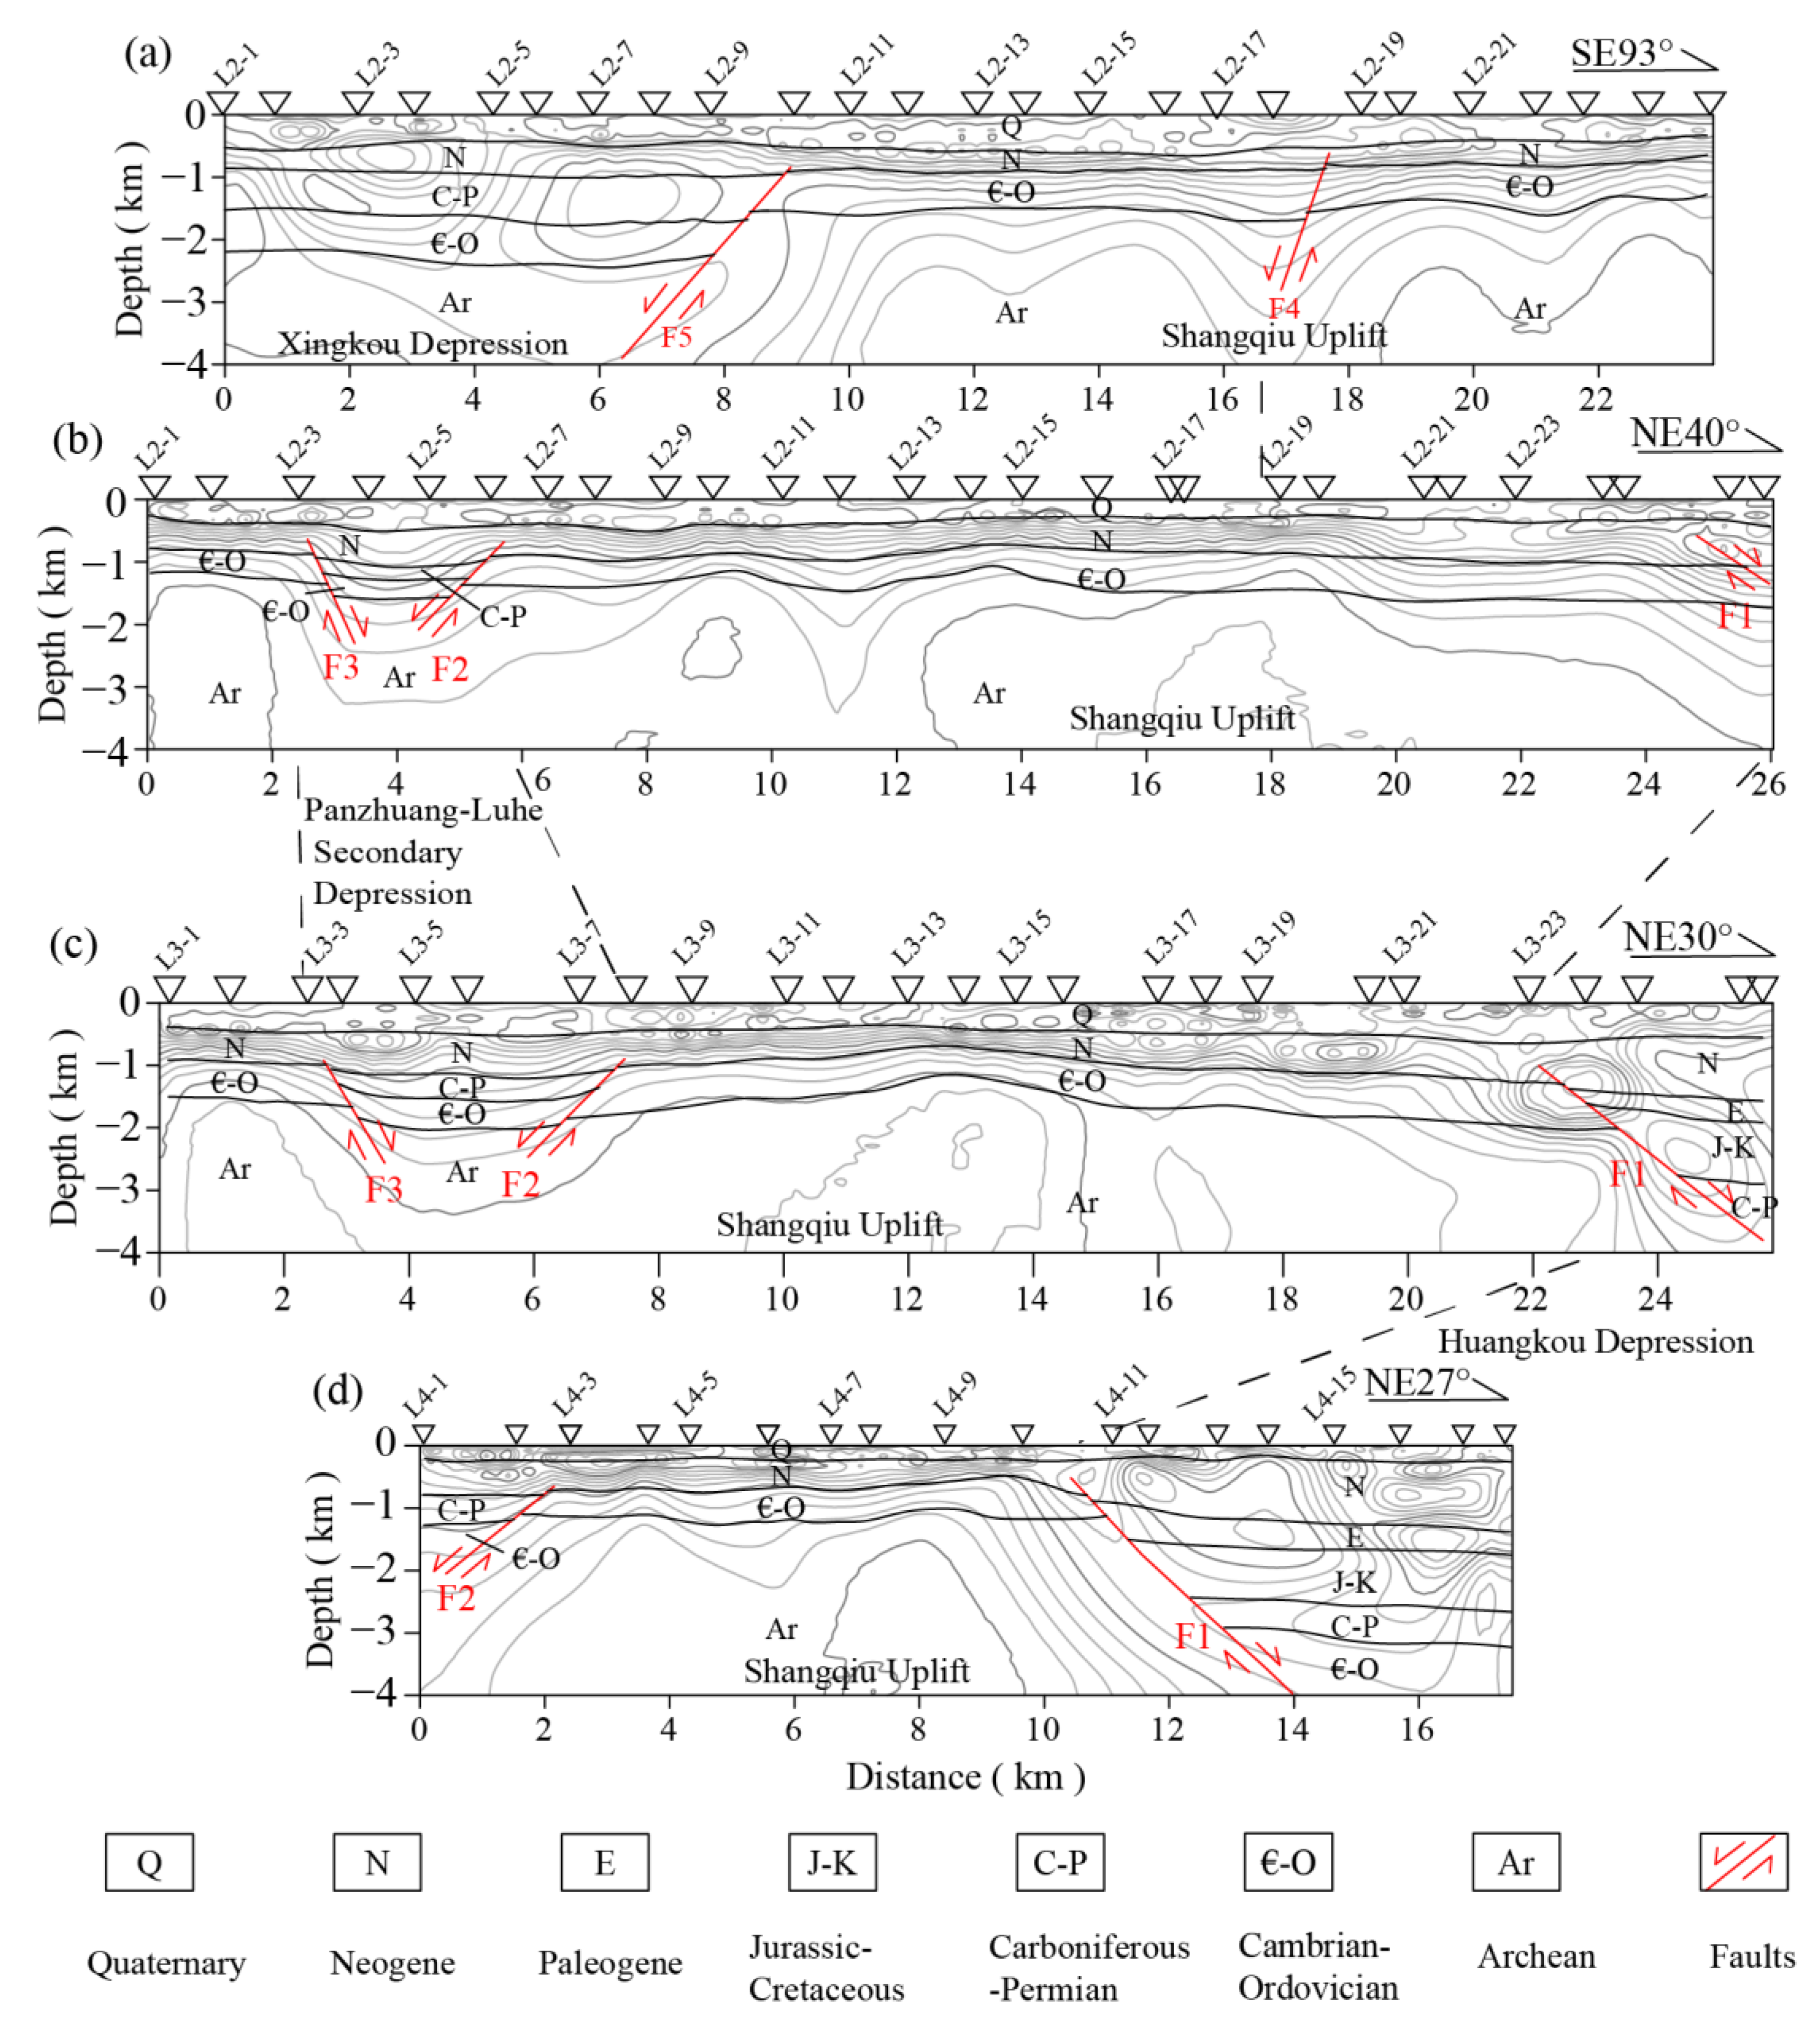
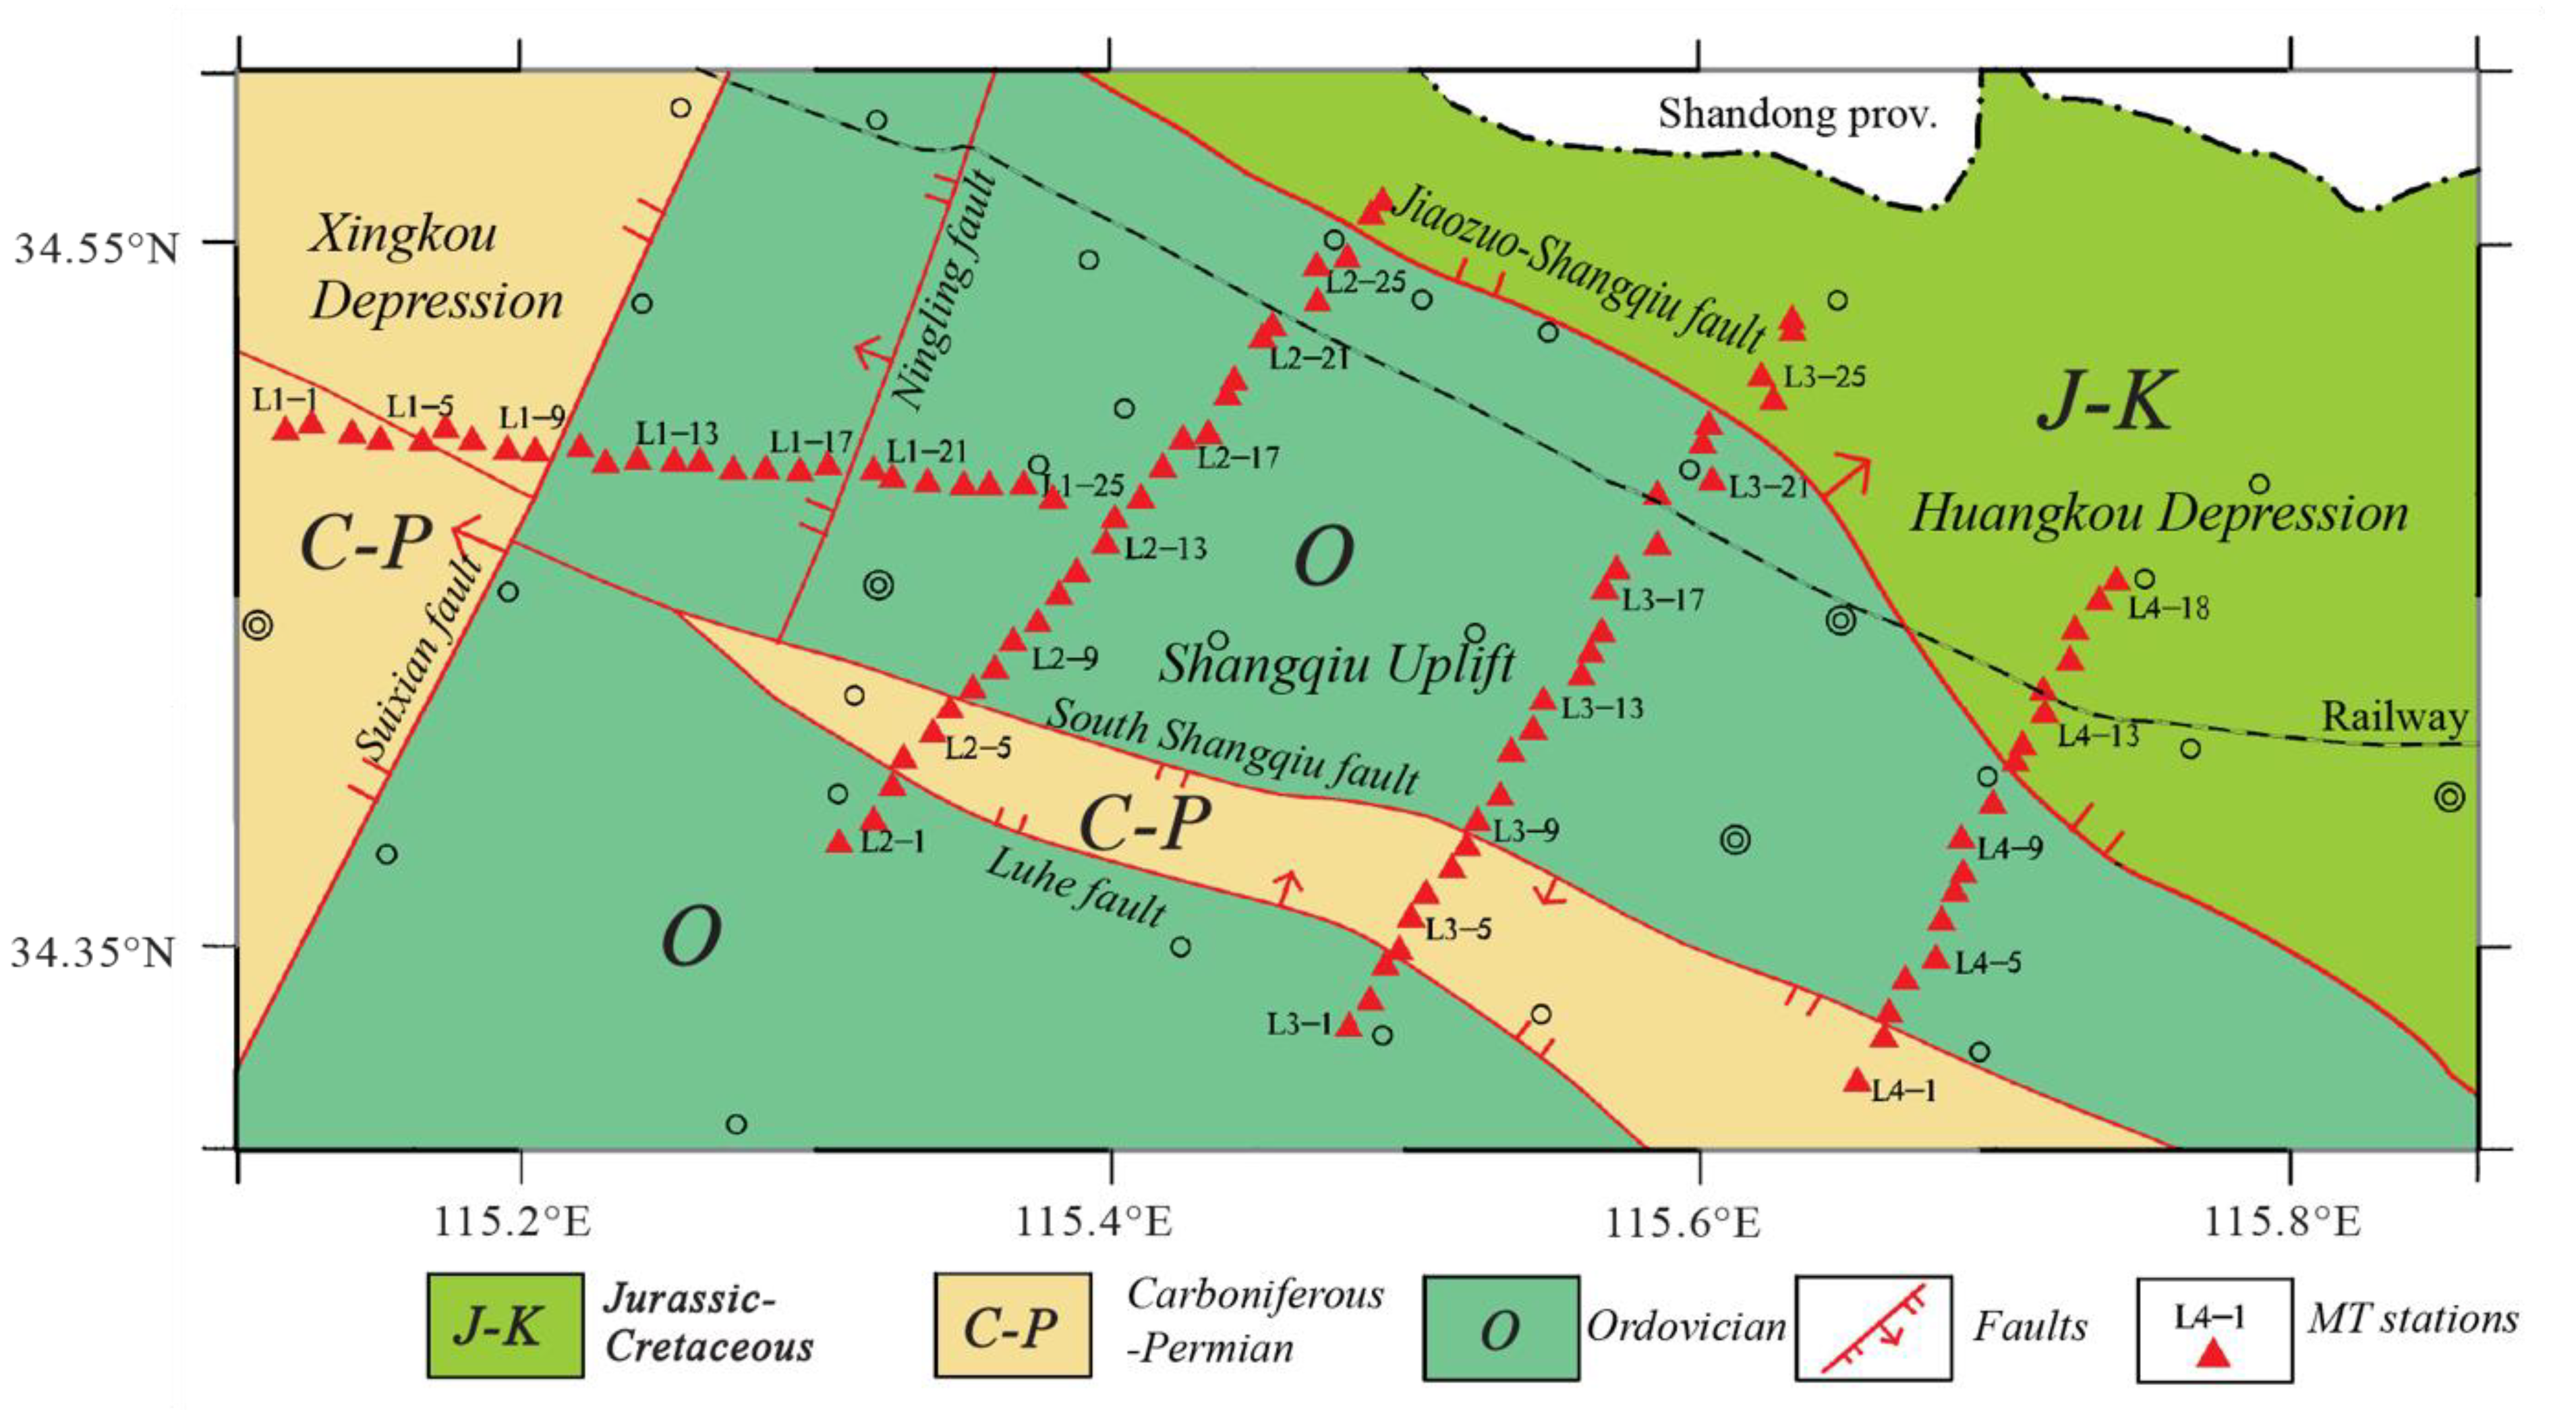
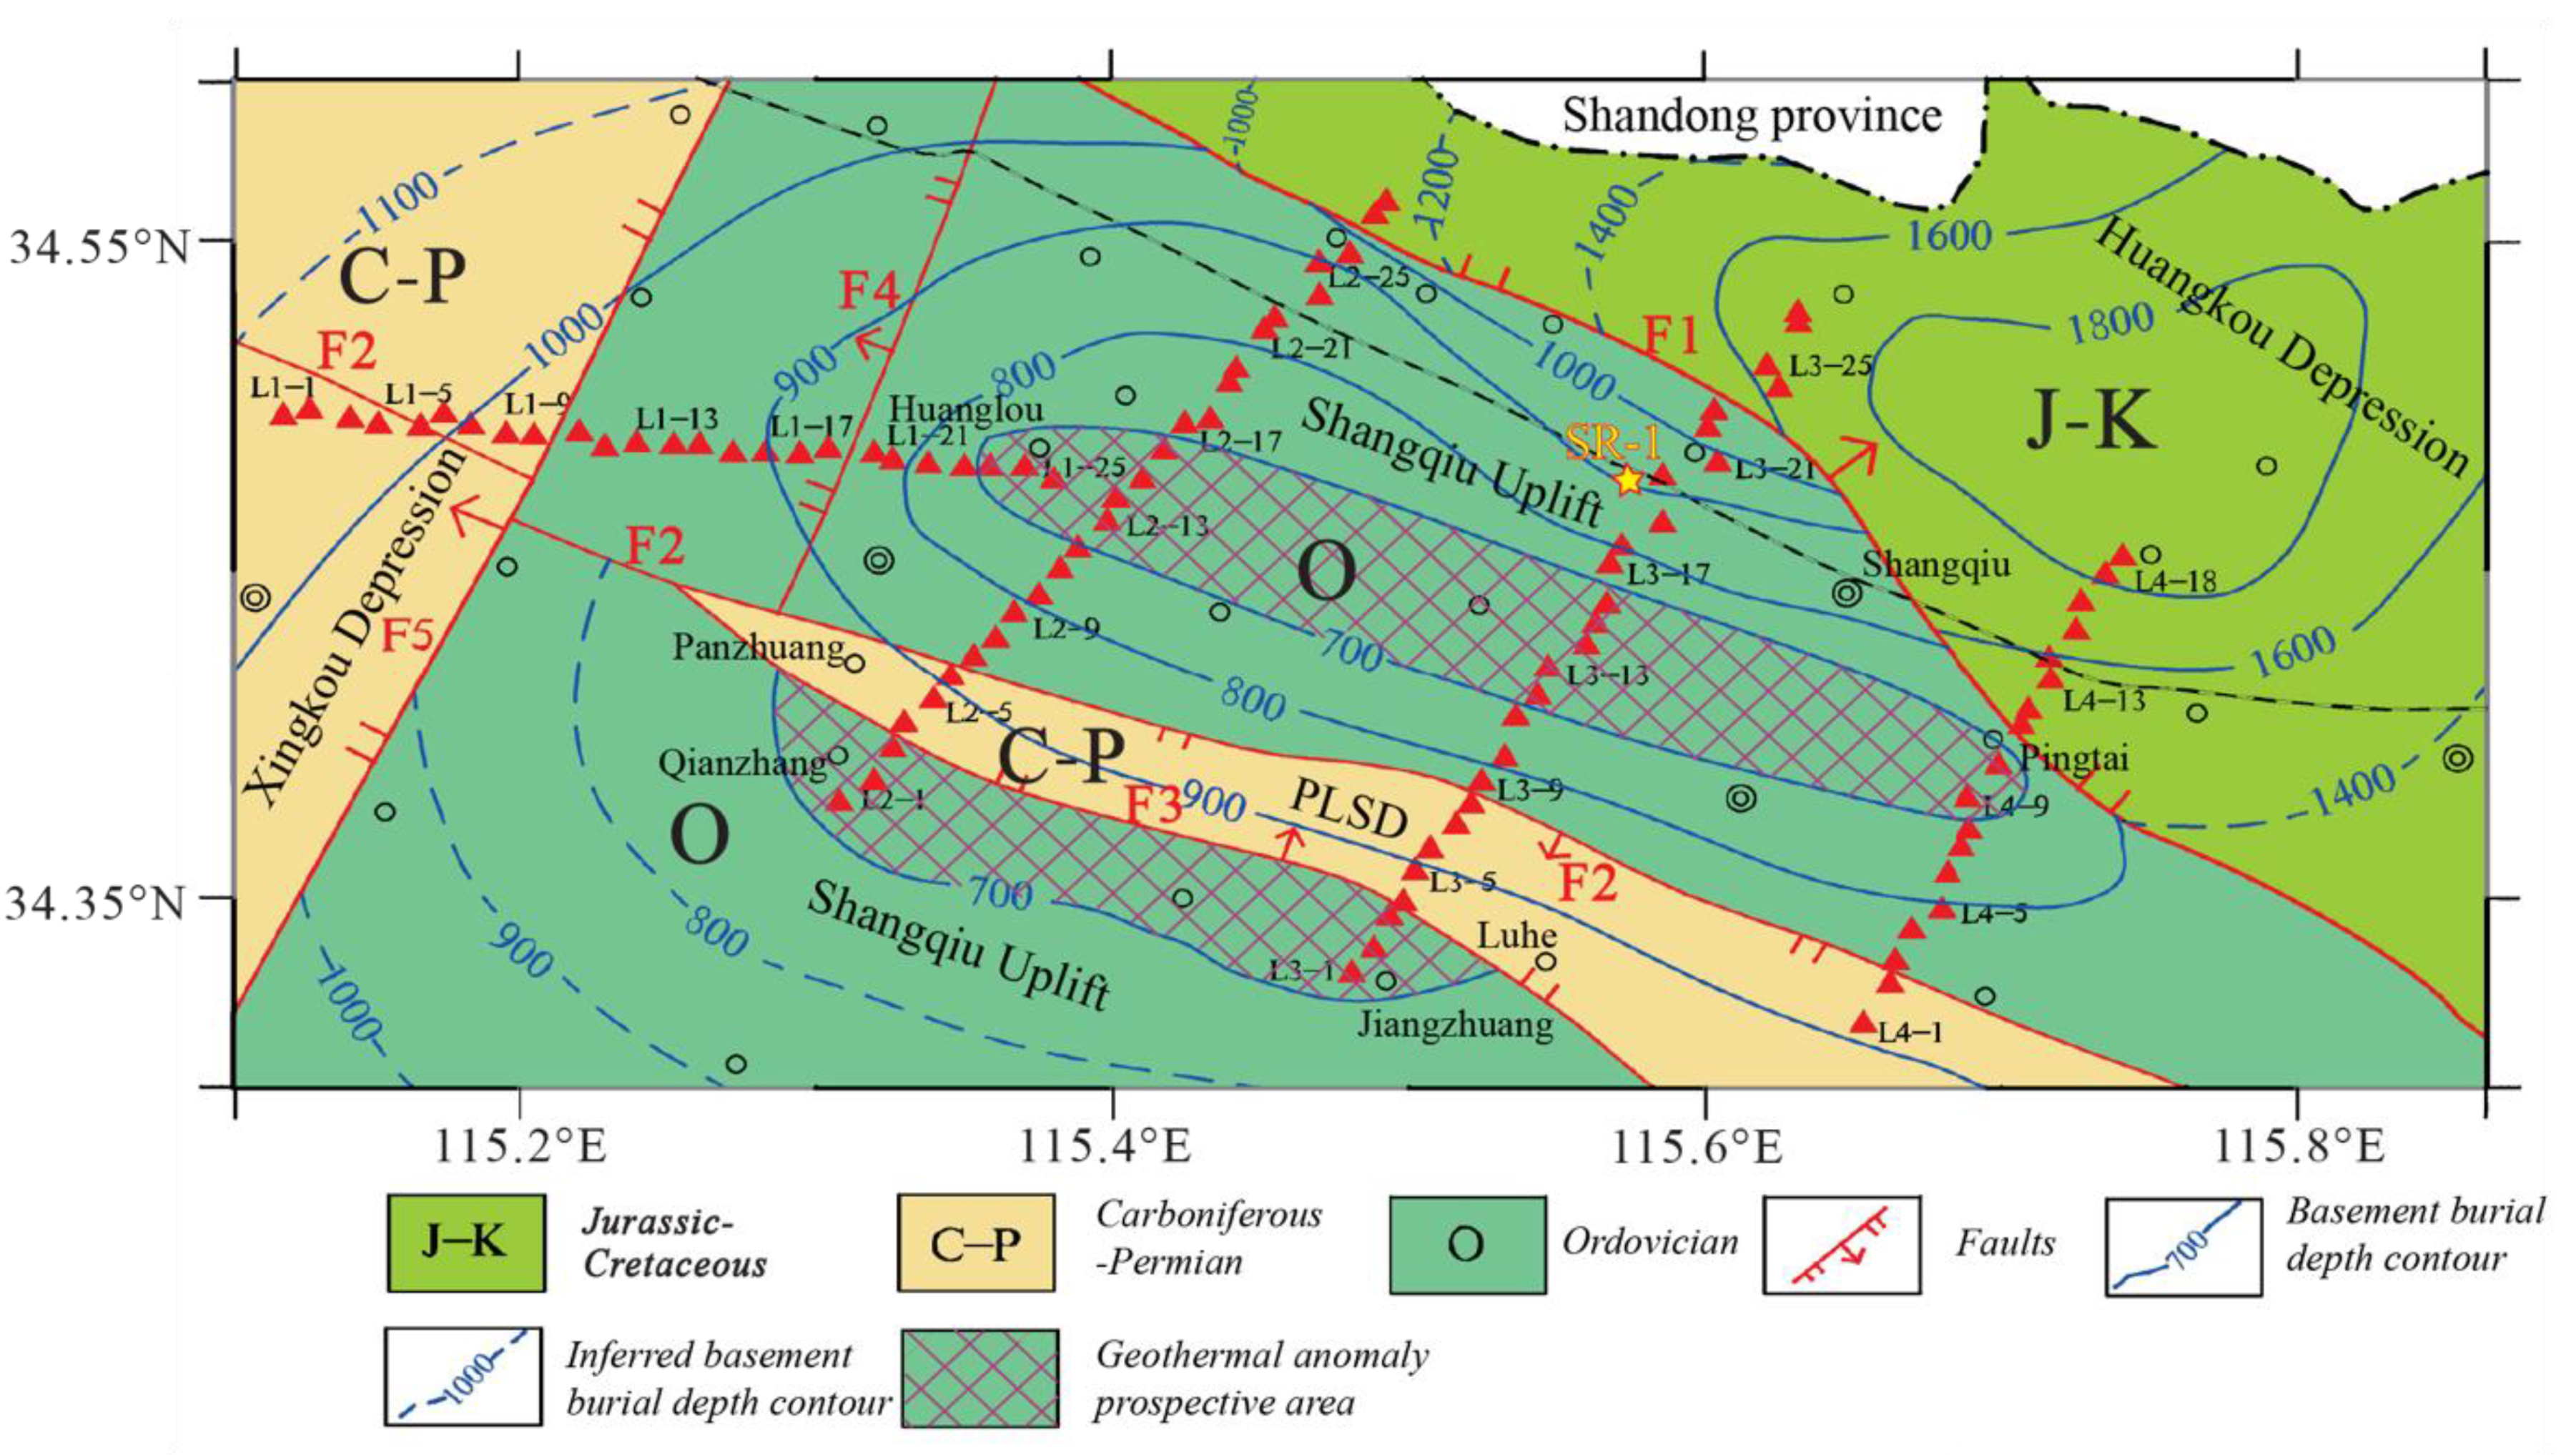
According to the large difference in electrical structure on both sides of the fault zone, the locations of two large-scale boundary faults (the Jiaozuo-Shangqiu (F1) and the Suixian faults (F5)) and three small-scale faults in the Shangqiu Uplift (the Southern Shangqiu fault (F2), the Luhe fault (F3), and the Ningling fault (F4)) are proposed.
(2)
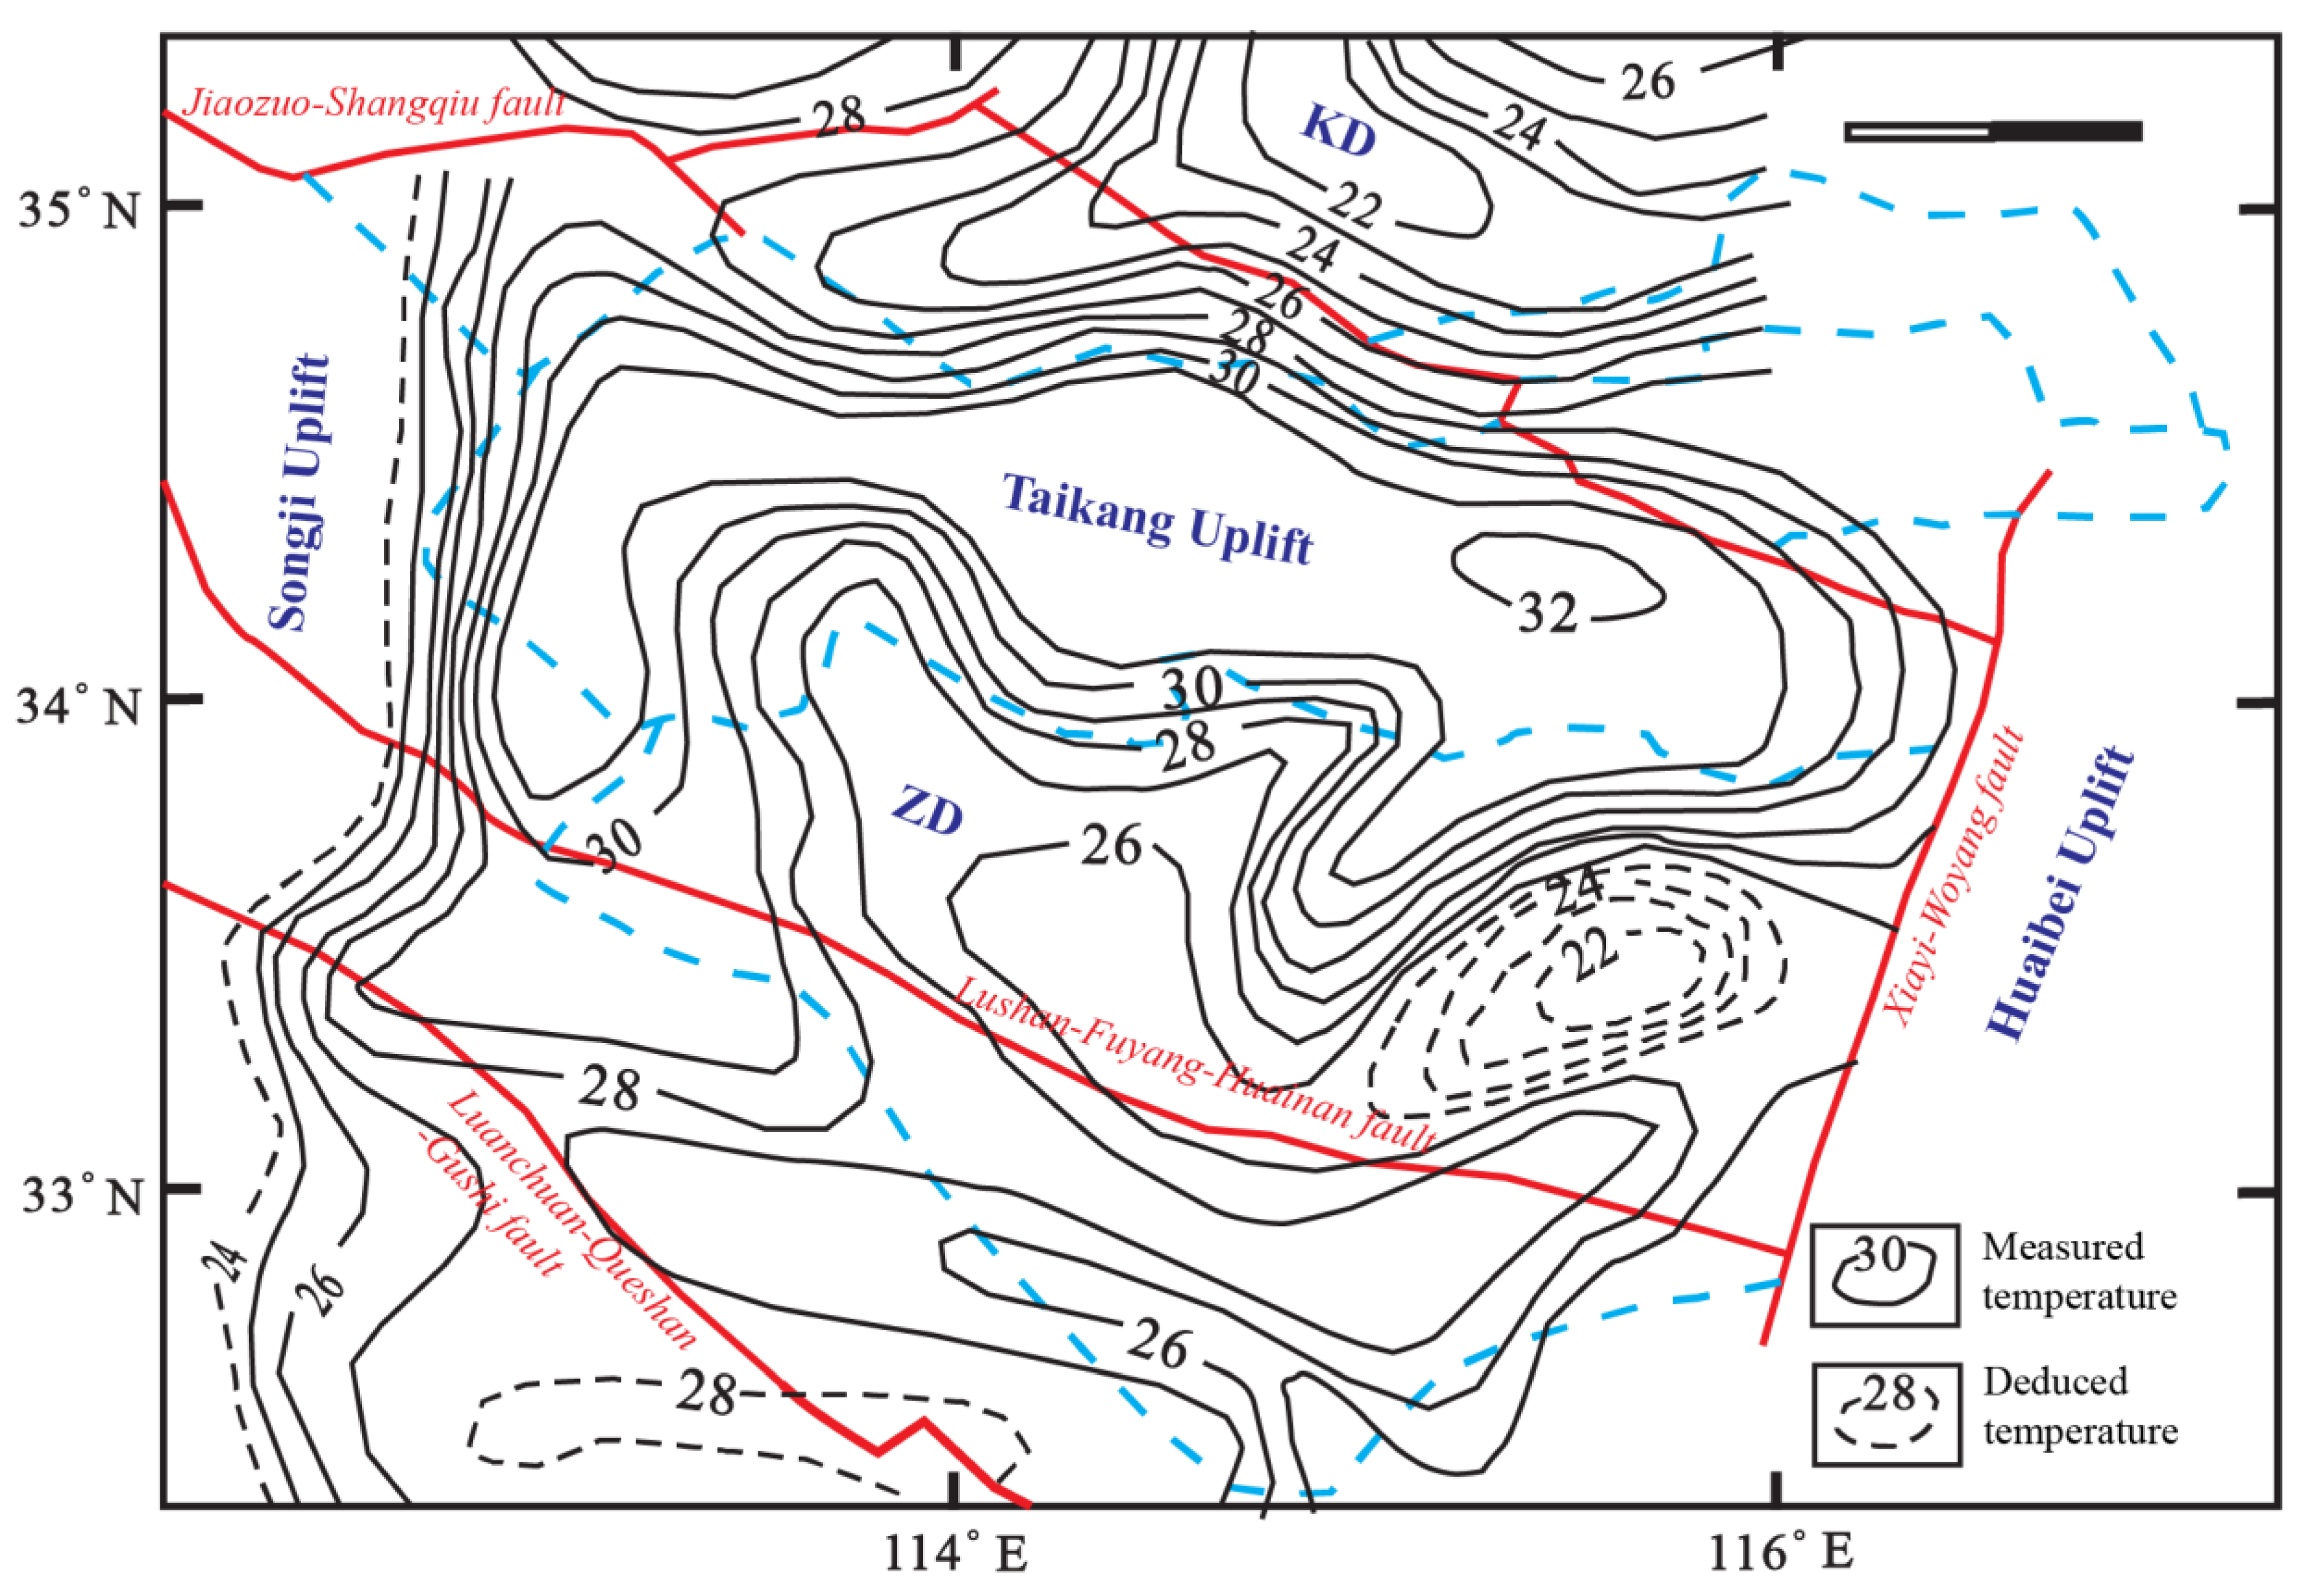
Based on the results of MT detection, the basement-rock geological map of the Shangqiu Uplift is constructed, with 100 Ωm as the boundary. Then, according to the good correspondence between the high-resistivity anomaly formed by the deep-basement uplift and the high-value area of the regional geothermal field, two prospective geothermal anomaly areas are proposed.
(3)
Drilling results confirm the reliability of our research.

Author Contributions

Conceptualization, B.X.; methodology, H.Z. and Z.L.; validation, B.S.; formal analysis, B.X. and Z.L.; writing—original draft preparation, B.X. and G.Y.; visualization, Z.L. and H.Z. All authors have read and agreed to the published version of the manuscript.

Funding

Henan Province Financial Geological Exploration Project (ID: 2017-22-39).

Institutional Review Board Statement

Not applicable.

Informed Consent Statement

Not applicable.

Data Availability Statement

Not applicable.

Acknowledgments

We thank Alan Jones and Gary McNeice for making their impedance tensor decomposition code publicly available. We are also grateful to Gary Egbert for the ModEM code. Special thanks to the two anonymous reviewers.

Conflicts of Interest

The authors declare no conflict of interest.

References

  1. Unsworth, M.J.; Jones, A.G.; Wei, W.; Marquis, G.; Gokarn, S.G.; Spratt, J.E. Crustal rheology of the Himalaya and Southern Tibet inferred from magnetotelluric data. Nature 2005, 438, 78–81. [Google Scholar] [CrossRef] [PubMed]
  2. Flóvenz, Ó.G.; Georgsson, L.S.; Árnason, K. Resistivity structure of the upper crust in Iceland. J. Geophys. Res. Solid Earth 1985, 90, 10136–10150. [Google Scholar] [CrossRef]
  3. Singh, S.; Drolia, R.; Sharma, S.; Gupta, M. Application of resistivity surveying to geothermal exploration in the Puga Valley, India. Geoexploration 1983, 21, 1–11. [Google Scholar] [CrossRef]
  4. Cagniard, L. Basic theory of the magneto-telluric method of geophysical prospecting. Geophysics 1953, 18, 605–635. [Google Scholar] [CrossRef]
  5. Zhang, F.; Jia, Z.; Qian, H.; Jin, B. Hydraulic connection of different geothermal reserviors near the urban area of Tianjin city. Contrib. Geol. Miner. Resour. Res. 2015, 30, 448–455. [Google Scholar]
  6. Yang, Y.-J.; Pang, H.; Jin, B.-Z.; Liu, J.L.; Qian, H.-Q.; Liu, F. Discussion on the geological tectonic setting and geothermal origin in Zhouliangzhuang area of Tianjin. Glob. Geol. 2010, 29, 646–655. [Google Scholar]
  7. Xu, B.W.; Liu, Z.L.; Ye, G.F.; Shi, F.; Zhu, H.L.; Zhang, M.; Wang, X.Y. Evaluation and analysis of geothermal resources in Ninghe uplift—Evidence from magnetotelluric method. Prog. Geophys. 2018, 33, 2278–2284. [Google Scholar]
  8. Li, X.; Nie, R.; Wang, L. Application effects of magnetotellurics sounding for exploration geothermal resource in Tianjin. Geol. Surv. Res. 2010, 33, 76–80. [Google Scholar]
  9. Wang, Q.; Zhao, Z.P.; Yin, B.X.; Hu, F.S. The application of magnetotelluric sounding (MT) method to deep geothermal investigation in plain. Chin. J. Eng. Geophys. 2016, 6, 782–787. [Google Scholar]
  10. Zhao, J.L.; Chen, T.Z.; Zhang, J. The application of the MT method to the investigation of geothermal resources in Kaifeng depression. Geophys. Geochem. Explor. 2010, 34, 163–166. [Google Scholar]
  11. Xu, H.L.; Zhao, Z.; Yang, Y.; Tang, Z. Structural pattern and structural style of the Southern North China Basin. Acta Geosicientia Sin. 2003, 24, 27–34. [Google Scholar]
  12. Sun, Z. Tectonic evolution and petroleum exploration prospective of Taikang uplift. Pet. Explor. Dev. 1996, 23, 6–10. [Google Scholar]
  13. Xu, H.L.; Zhao, Z.; Lu, F.L.; Yang, Y.; Tang, Z.; Sun, G.; Xu, Y. Tectonic evolution of the Nanhuabei area and analysis about its petroleum potential. Geotecton. Metallog. 2004, 28, 450–463. [Google Scholar]
  14. Li, W. Effects of igneous intrusions on texture and quality of coal seam in eastern Henan Province. Coal. Geol. Explor. 2014, 42, 8–13. [Google Scholar]
  15. Li, W.; Xia, B.; Lu, W. Geophysical characteristics and Coal-Searching prospects in east henan area. Geophys. Geochem. Explor. 2004, 28, 26–31. [Google Scholar]
  16. Liu, G.; Zhang, T. 2D Seismic to Coal Prospecting in the Western Parts of Sui County. Miner. Resour. Geol. 2013, 27, 342–346. [Google Scholar]
  17. Yang, M.H.; Wang, S.M.; Zheng, X.F.; Wang, J.X.; Bai, H.; Zeng, P. Aeromagnetic anomalies characteristics and tectonic subareas of southern North China Craton and adjacent regions. Geol. Rev. 2009, 55, 862–872. [Google Scholar]
  18. Zhao, D.L.; Zhao, X.J.; Zheng, L.; Yu, Z.S. Tectonic evolution and coal-searching prospect of tongxu uplift. Geol. Resour. 2008, 17, 132–134. [Google Scholar]
  19. Gamble, T.D.; Goubau, W.M.; Clarke, J. Magnetotellurics with a remote magnetic reference. Geophysics 1979, 44, 53–68. [Google Scholar] [CrossRef] [Green Version]
  20. Egbert, G.; Booker, J.R. Robust estimation of geomagnetic transfer functions. Geophys. J. Int. 1986, 87, 173–194. [Google Scholar] [CrossRef] [Green Version]
  21. Groom, R.W.; Bailey, R.C. Decomposition of magnetotelluric impedance tensors in the presence of local three-dimensional galvanic distortion. J. Geophys. Res. Earth Surf. 1989, 94, 1913–1925. [Google Scholar] [CrossRef] [Green Version]
  22. Rodi, W.; Mackie, R.L. Nonlinear conjugate gradients algorithm for 2-D magnetotelluric inversion. Geophysics 2001, 66, 174–187. [Google Scholar] [CrossRef]
  23. Farquharson, C.G.; Oldenburg, D.W. A comparison of automatic techniques for estimating the regularization parameter in non-linear inverse problems. Geophys. J. Int. 2004, 156, 411–425. [Google Scholar] [CrossRef] [Green Version]
  24. Hansen, P.C. Analysis of discrete ill-posed problems by means of the L-curve. SIAM Rev. 1992, 34, 561–580. [Google Scholar] [CrossRef]
  25. Kelbert, A.; Meqbel, N.; Egbert, G.; Tandon, K. ModEM: A modular system for inversion of electromagnetic geophysical data. Comput. Geosci. 2014, 66, 40–53. [Google Scholar] [CrossRef]
  26. Tietze, K.; Ritter, O. Resolution of 3D Elongated Deep Conductive Bodies Embedded in a 2D Background Conductivity Structure by 3D and 2D Magnetotelluric Inversion. In 24. Schmucker-Weidelt-Kolloquium für Elektromagnetische Tiefenforschung. 2011. Available online: https://gfzpublic.gfz-potsdam.de/pubman/faces/ViewItemFullPage.jsp?itemId=item_65381_3 (accessed on 12 April 2022).
  27. Chen, M. Geothermics of North China; Science Press: Beijing, China, 1988. [Google Scholar]
  28. Yuan, L. Discussion on the characteristics of geothermal field in eastern Henan. Geol. Henan 1990, 8, 1–3. [Google Scholar]
Figure 1. (a) Structural division map of the southern North China Basin. (b) Secondary structural division of the Taikang Uplift after [18]. JSF: Jiaozuo-Shangqiu fault, XWF: Xiayi-Woyang fault, LFHF: Lushan-Fuyang-Huainan fault, LQGF: Luanchuan-Queshan-Gushi fault, and TLFZ: Tanlu Fault Zone. Circles with Pinying names are cities in the study area. The dashed white rectangle is the study area shown in Figure 2.
Minerals 12 00811 g001
Figure 2. The distribution map of the MT stations in the study area with strata and structural information.
Minerals 12 00811 g002
Figure 3. Sounding curves of the MT station L3-6. Left and right panels: processed with local and remote referencing of magnetic field components, respectively.
Minerals 12 00811 g003
Figure 4. Dimensionality analysis results produced by the G-B impedance tensor decomposition algorithm [21] for the L2 and L3 profiles. Triangles with labels are MT stations.
Minerals 12 00811 g004
Figure 5. Statistical results of the strike analysis of profiles L1, L2, L3, and L4 in a frequency range of 100~0.01 Hz. Black wedges indicate the preferred strike directions.
Minerals 12 00811 g005
Figure 6. A comparison of resistivity models of the four MT profiles produced by 2D (left panel) and 3D (right panel) inversions, respectively. Triangles with labels are MT stations.
Minerals 12 00811 g006
Figure 7. Possible interpretation of faults and strata in the study area according to the 2D resistivity models. Triangles with labels are MT stations. F1: Jiaozuo-Shangqiu fault, F2: South Shangqiu fault, F3: Luhe fault, F4: Ningling fault, and F5: Suixian fault. (ad) Interpretation of L1, L2, L3 and L4, respectively.
Minerals 12 00811 g007
Figure 8. The basement-rock burial depth contour inferred with the resistivity models and the proposed prospective geothermal anomaly areas. PLSD: Panzhuang-Luhe Secondary Depression. F1: Jiaozuo-Shangqiu fault, F2: South Shangqiu fault, F3: Luhe fault, F4: Ningling fault, and F5: Suixian fault. Yellow star labelled with “SR-1” represents the location of the well.
Minerals 12 00811 g008
Figure 9. The underground temperature contour of the Taikang Uplift and adjacent areas at a depth of 300 m, after [28]. KD: Kaifeng Depression, and ZD: Zhoukou Depression.
Minerals 12 00811 g009
Publisher’s Note: MDPI stays neutral with regard to jurisdictional claims in published maps and institutional affiliations.

