Abstract
The coupling effect of accumulated damage and impact load substantially affects the integrity of the surrounding rock structure in deep coal mining engineering, which has inhibited safe and effective coal mining. Therefore, dynamic compression tests were performed on coal measures sandstone specimens with accumulated damage using the SHPB device. The effects of a high strain rate and accumulated damage on the sandstone’s mechanical behavior and damage evolution were investigated. The results reveal that accumulated damage has a considerable impact on specimen stress–strain curves and lowers dynamic compressive strength and deformation modulus substantially. The sandstone failure mode looks to be shear failure from a macroscopic perspective, while it appears to be intergranular fracture between the mineral particles from a microscopic perspective. The macroscopic and microscopic failure mechanisms of the sandstone specimens likewise conformed to the energy absorption law. The accumulated damage factor and the accumulated damage correction coefficient were presented in order to construct a statistical damage constitutive model of rocks based on the Weibull distribution. This model provides a decent description of the effects of accumulated damage and the strain rate on sandstone’s mechanical behavior, with parameters that are all of evident physical significance.
1. Introduction
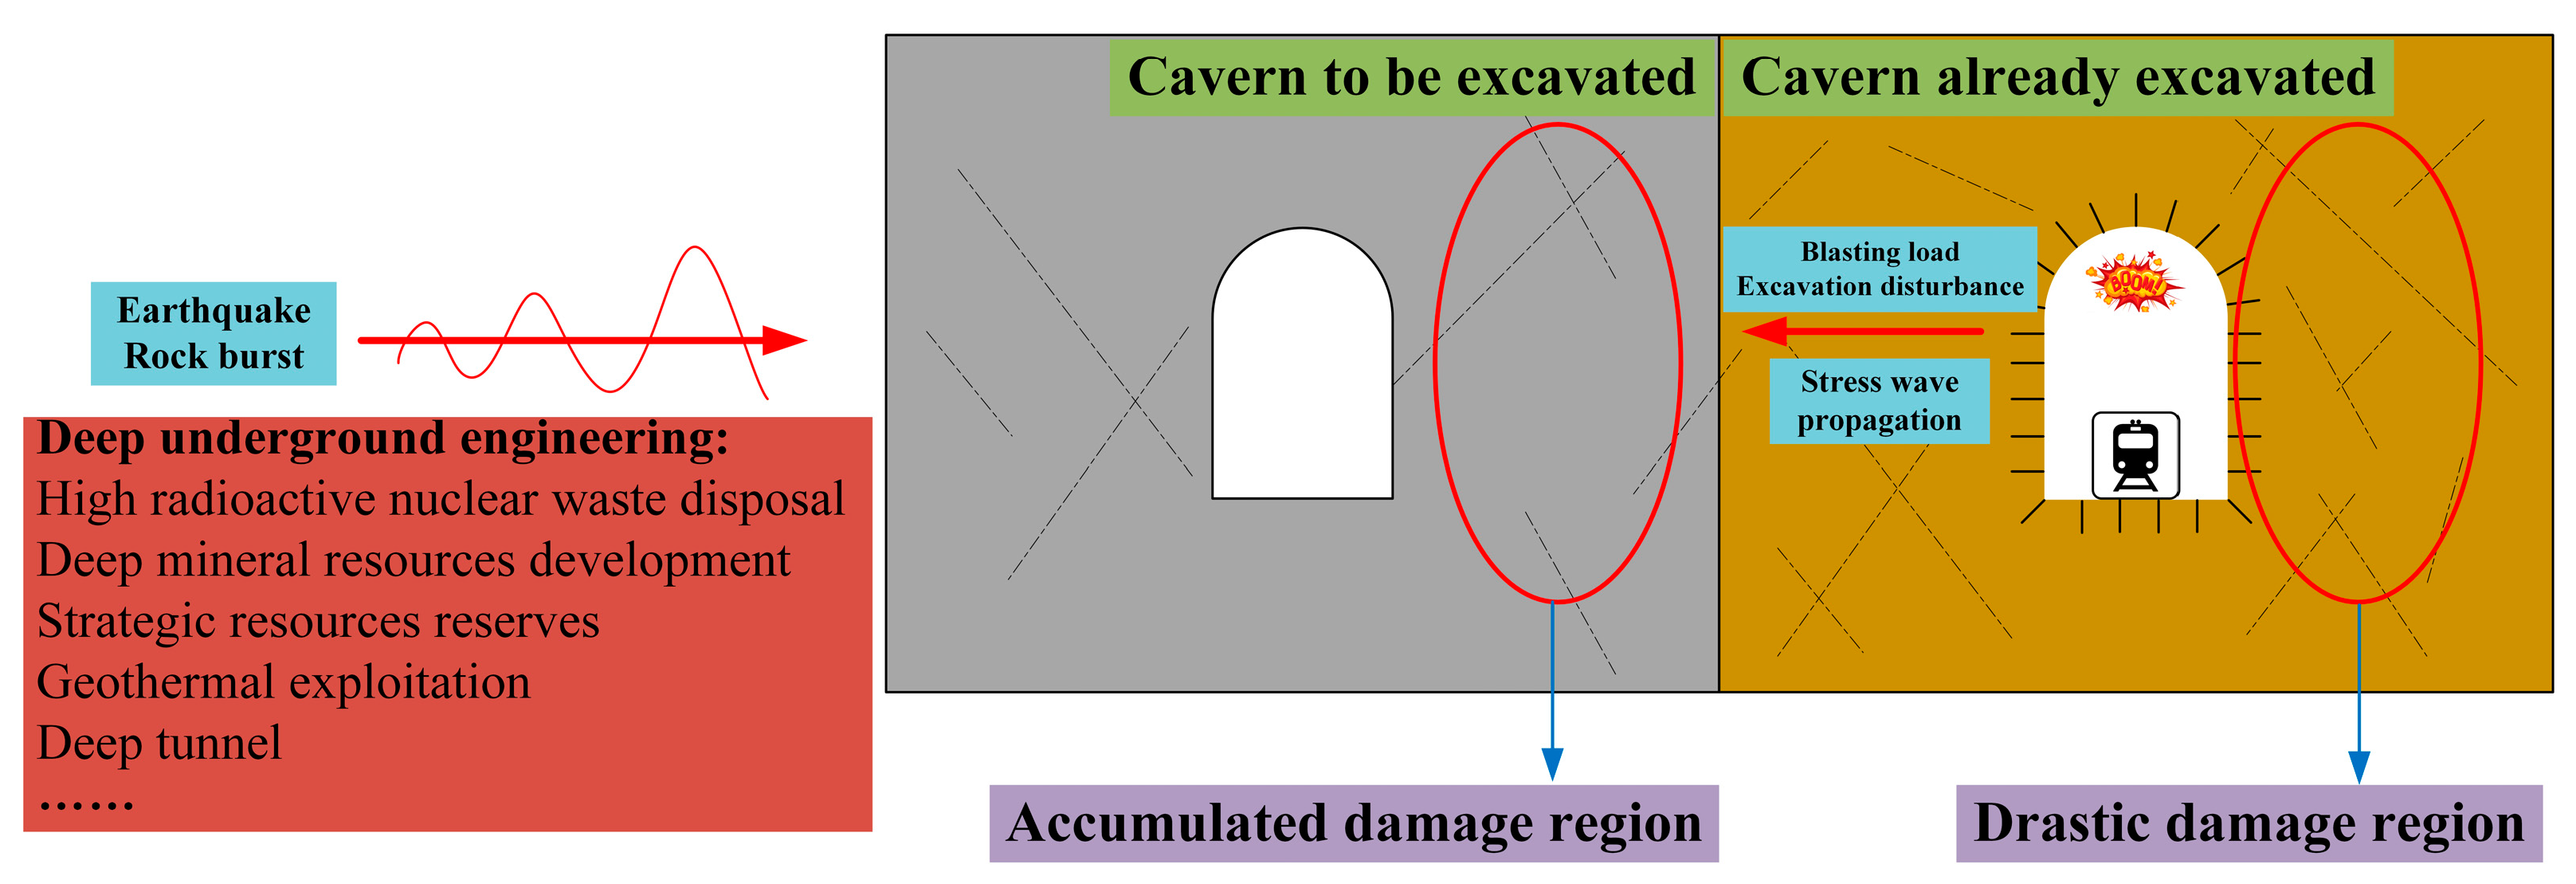
Deep mining engineering has more engineering risks than shallow mining engineering, such as frequent and high-intensity rockburst, massive mine pressure bumps, and considerable deformation of the roadway surrounding rock [1,2,3]. It could be owing to the deep rock mass’s complicated geological environment of “three highs and one disturbance” [4,5]. As a result, the deep roadway’s surrounding rock mass is frequently subjected to significant impact loads [2,5]. At the same time, the deep surrounding rock mass will be damaged to varying degrees after excavation due to the more complex stress field in the deep mine roadway (Figure 1) [1,4,6]. Therefore, comprehending the rock mechanics under the coupling action of accumulated damage and impact load is critical for deep mining engineering.

Figure 1.
Overview of rock dynamics and accumulated damage problems in deep underground engineering.
Over the last few decades, rock dynamics research has advanced significantly. Researchers began by studying the uniaxial compression characteristics of rocks under impact load [7,8,9], then looked at the tensile performance of rocks under impact load [10,11], and finally came to a conclusion that, in most cases, the impact load dramatically increases the strength of rocks, which is manifested as the strain rate effect. The impact of high temperatures on the mechanical characteristics of rocks under impact loads has been thoroughly investigated using a background in deep mining engineering [12,13]. Similarly, the effects of coupled static and dynamic conditions have also been extensively studied [14,15]. The freeze–thaw cycle has a significant impact on the dynamic characteristics of rocks in open-pit mining and geotechnical engineering in cold and wet environments [16,17]. Some researchers studied the evolution of rocks’ mechanical behavior under cyclic impact loads in order to better understand the dynamic damage characteristics of rocks [18,19]. They discovered that as the cyclic impact number increases, the dynamic strength and deformation capacity of rocks weaken, reflecting the gradual accumulation of fatigue damage. In recent years, the dynamic fracture characteristics of rocks in different types of damage states have also been studied in depth by a number of scholars. Peng et al. [20] evaluated the static and dynamic mechanical behavior of granite at various burial depths and discovered that the initial damage variables of the rock specimens grew significantly at first and then gradually dropped as the burial depth increased. Wang et al. and Li et al. [21,22] inflicted initial damage on Fangshan granite with the aid of microwave radiation. Microwave damage was quantified using CT values to investigate further the effect of the initial damage on dynamic rock fragmentation. Yan et al. [23,24] examined the dynamic cracking behavior and energy evolution of flawed rocks, considering that rocks in subsurface rock engineering are initially subjected to static tectonic stress or gravity stress and then to dynamic loading. In truth, the investigation of accumulated damage is not restricted to rocks [25]. The nature of the accumulated damage is that it alters the microstructural parameters of rocks, such as porosity, pore size, and pore distribution, causing changes in the physical properties of the rocks, which strongly affect their mechanical characteristics [26,27,28]. Therefore, the concern regarding accumulated stress damage caused by deep mining engineering requires immediate attention.
The constitutive model of rocks has become a difficult research task due to the discontinuity and non-uniformity of rock materials [2,29]. Numerous academics have contributed to rock dynamics by doing extensive theoretical research. The Jh-2 model [30] is frequently used to describe the dynamic response of rocks. It is a phenomenological constitutive model that has no correlation with the microstructure of rocks and ignores their fundamental features. The classical TCK model was developed by Taylor et al. [31]. They assumed the distribution and development law of micro-cracks in rocks from the microscopic perspective and characterized the rocks’ behavior. Liu et al. [32] developed a dynamic damage constitutive model for jointed rock masses based on the TCK theory. To characterize the damage induced by micro-cracks and joints, they proposed a mesoscopic damage variable and a macroscopic damage tensor. The G–K model [33] has also been widely accepted by scholars. It can effectively describe the process of rock properties evolving as a result of cracks in the rock. The rock dynamic constitutive relationship created using the 3D scatterplot method, proposed by Zhou et al. [34], takes into account the scenario of unstable strain rate loading and may provide more plentiful strain rate information. Scholars address more intricate situations while studying building rock material models. For example, Li and Shi [35] proposed a rock dynamic material model based on the D-P strength criterion and the Johns–Cook model for high confining pressures. Wu et al. [36] and Ke et al. [17] proposed a model for dynamic strength degradation of rocks that takes into account the number of F–T cycles. The initial accumulated damage effect of rocks has not yet been included in theoretical rock dynamics studies.
In this work, the SHPB test system was used to evaluate the performance of coal measures sandstone after it was subjected to initial accumulated damage under the action of an impact load. Sandstone deformation and failure modes, as well as energy absorption patterns, were analyzed in detail. Finally, a statistical damage constitutive model that considers accumulated damage and the strain rate effect has been developed employing the accumulated damage factor and the accumulated damage correction coefficient. The sensitivities of the corresponding parameters were evaluated to measure the relative physical significance.
2. Material and Methods
2.1. Material Characterization
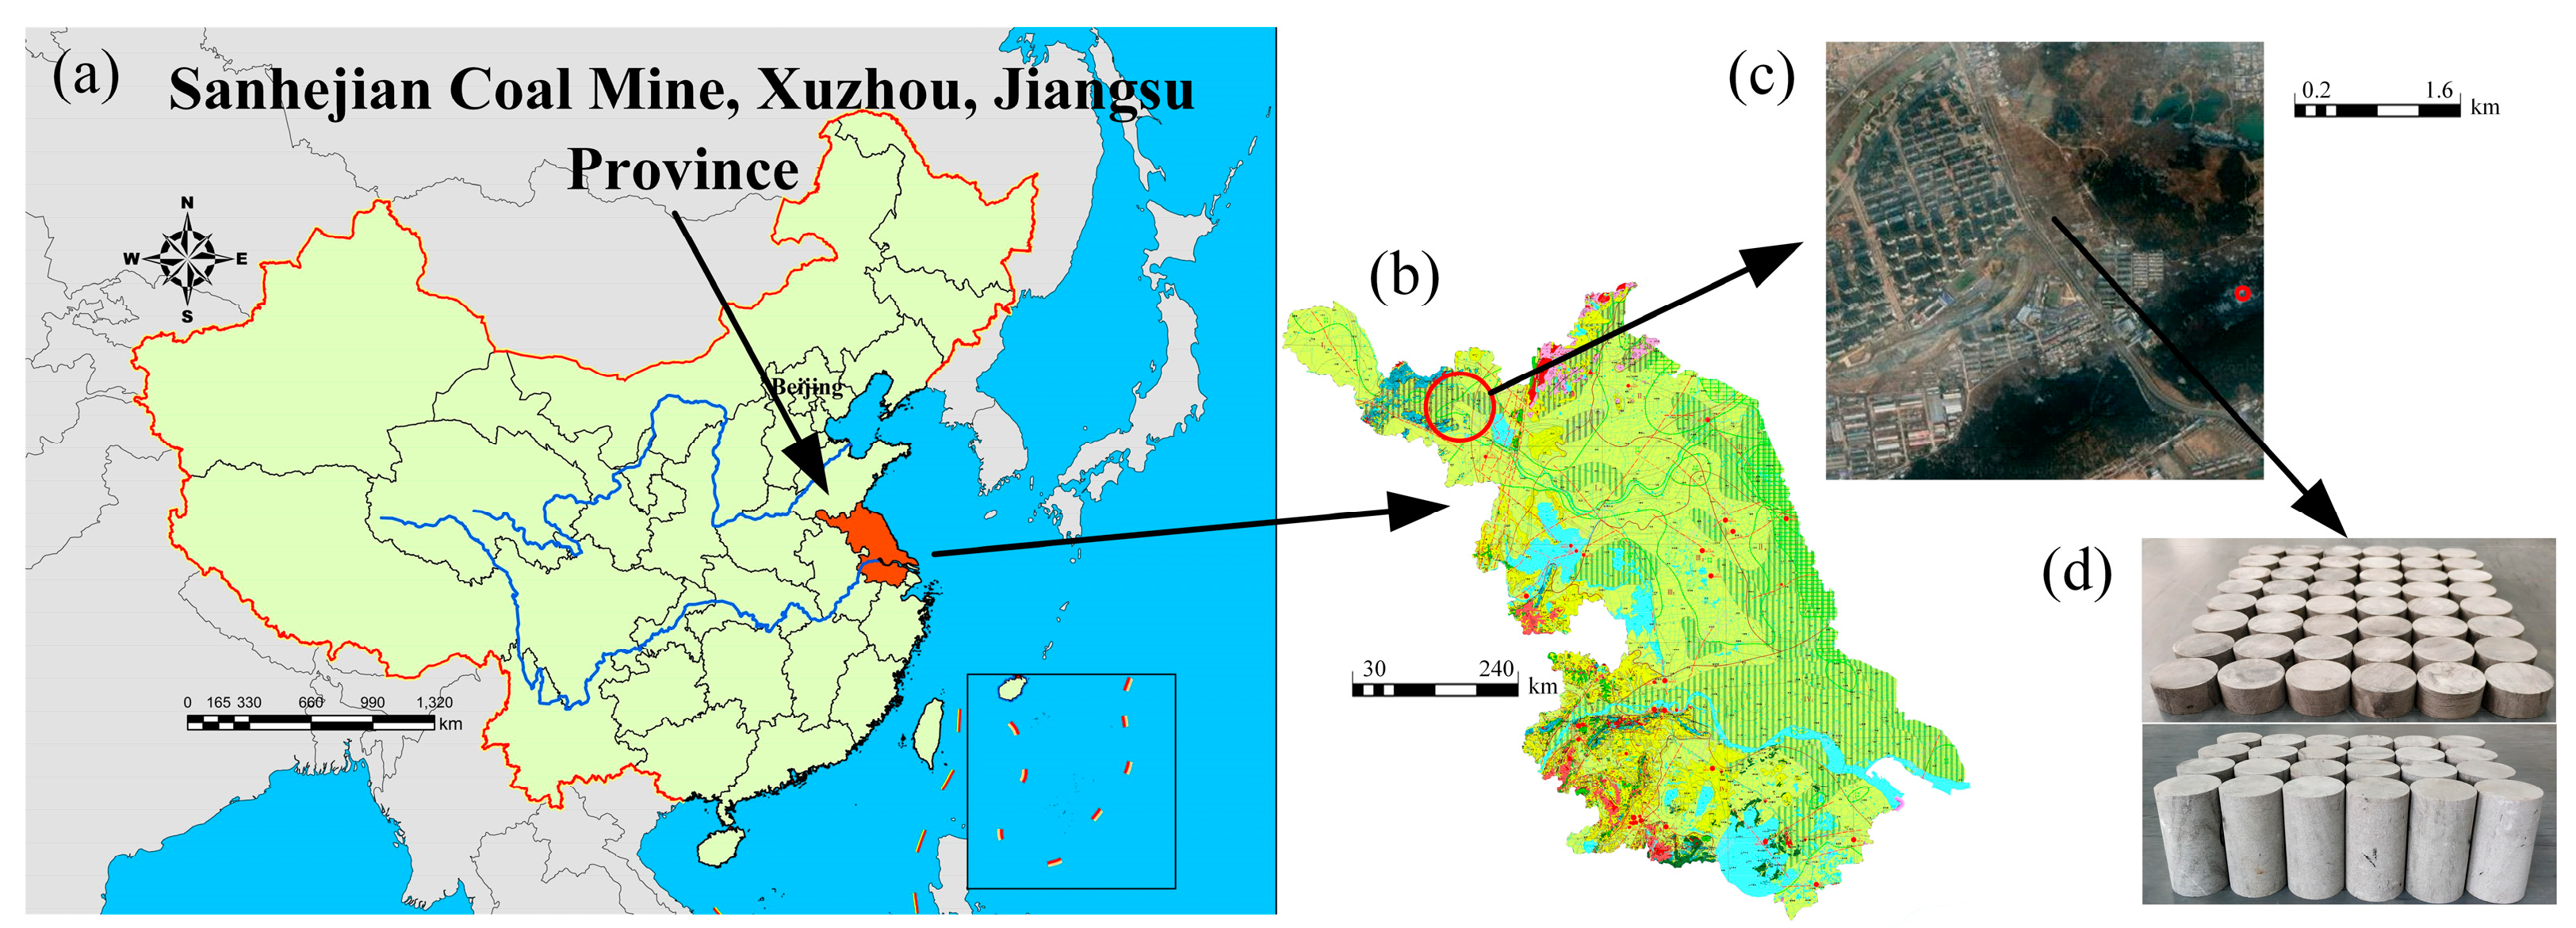
The rock material employed in this research is coal measures sandstone, sourced from the Sanhejian coal mine, Xuzhou, Jiangsu province, China, at a depth of 800 m, as indicated in Figure 2. In this location, thick Jurassic–Cretaceous strata overlay the coal measures strata. Disc-type rock specimens were treated for dynamic testing according to the test concept. Simultaneously, a portion of the sandstone was turned into standard cylinders with a diameter of 50 mm and a height of 100 mm for quasi-static tests. The specimens were machined to suit ISRM specifications [37] (Figure 2d). The sandstone specimens with apparent faults or cracks on the surfaces were removed after processing. The remaining specimens were then ultrasonically tested with an HC-U81 ultrasonic detector, and any sandstone specimens with anomalous acoustic values were discarded. Finally, the remaining specimens were employed to conduct quasi-static and dynamic tests, ensuring that sandstone specimen dispersion remained within the controlled range.

Figure 2.
Coal measures sandstone sampling sites: (a) Location in China; (b) geological sketch of Jiangsu province (from the National Geological Archive of China); (c) satellite view of the Sanhejian coal mine; (d) part of sandstone specimens.
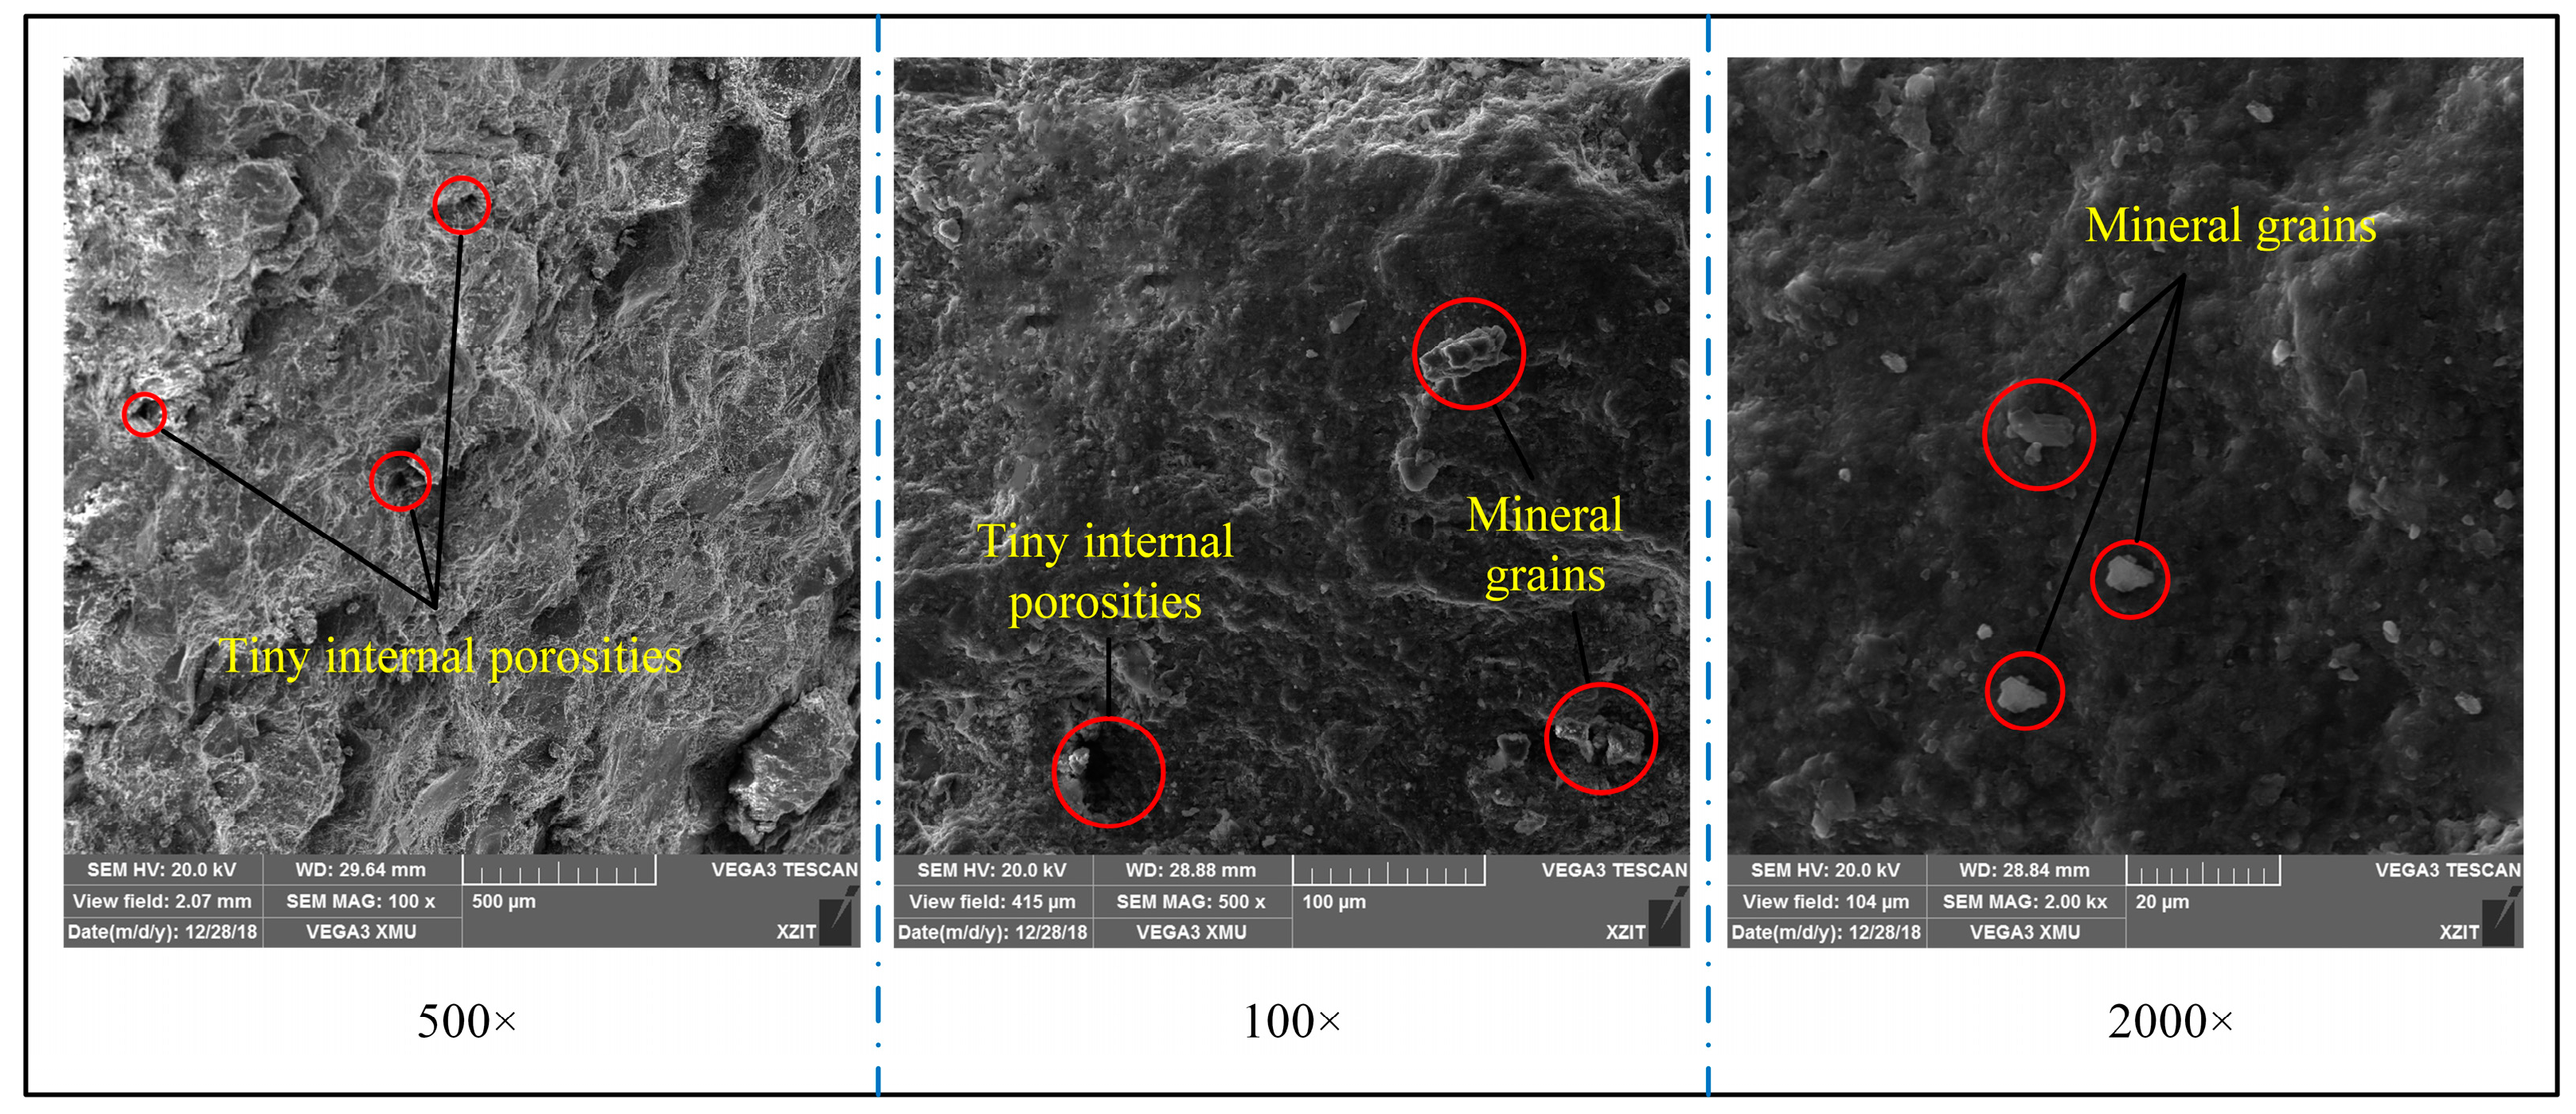
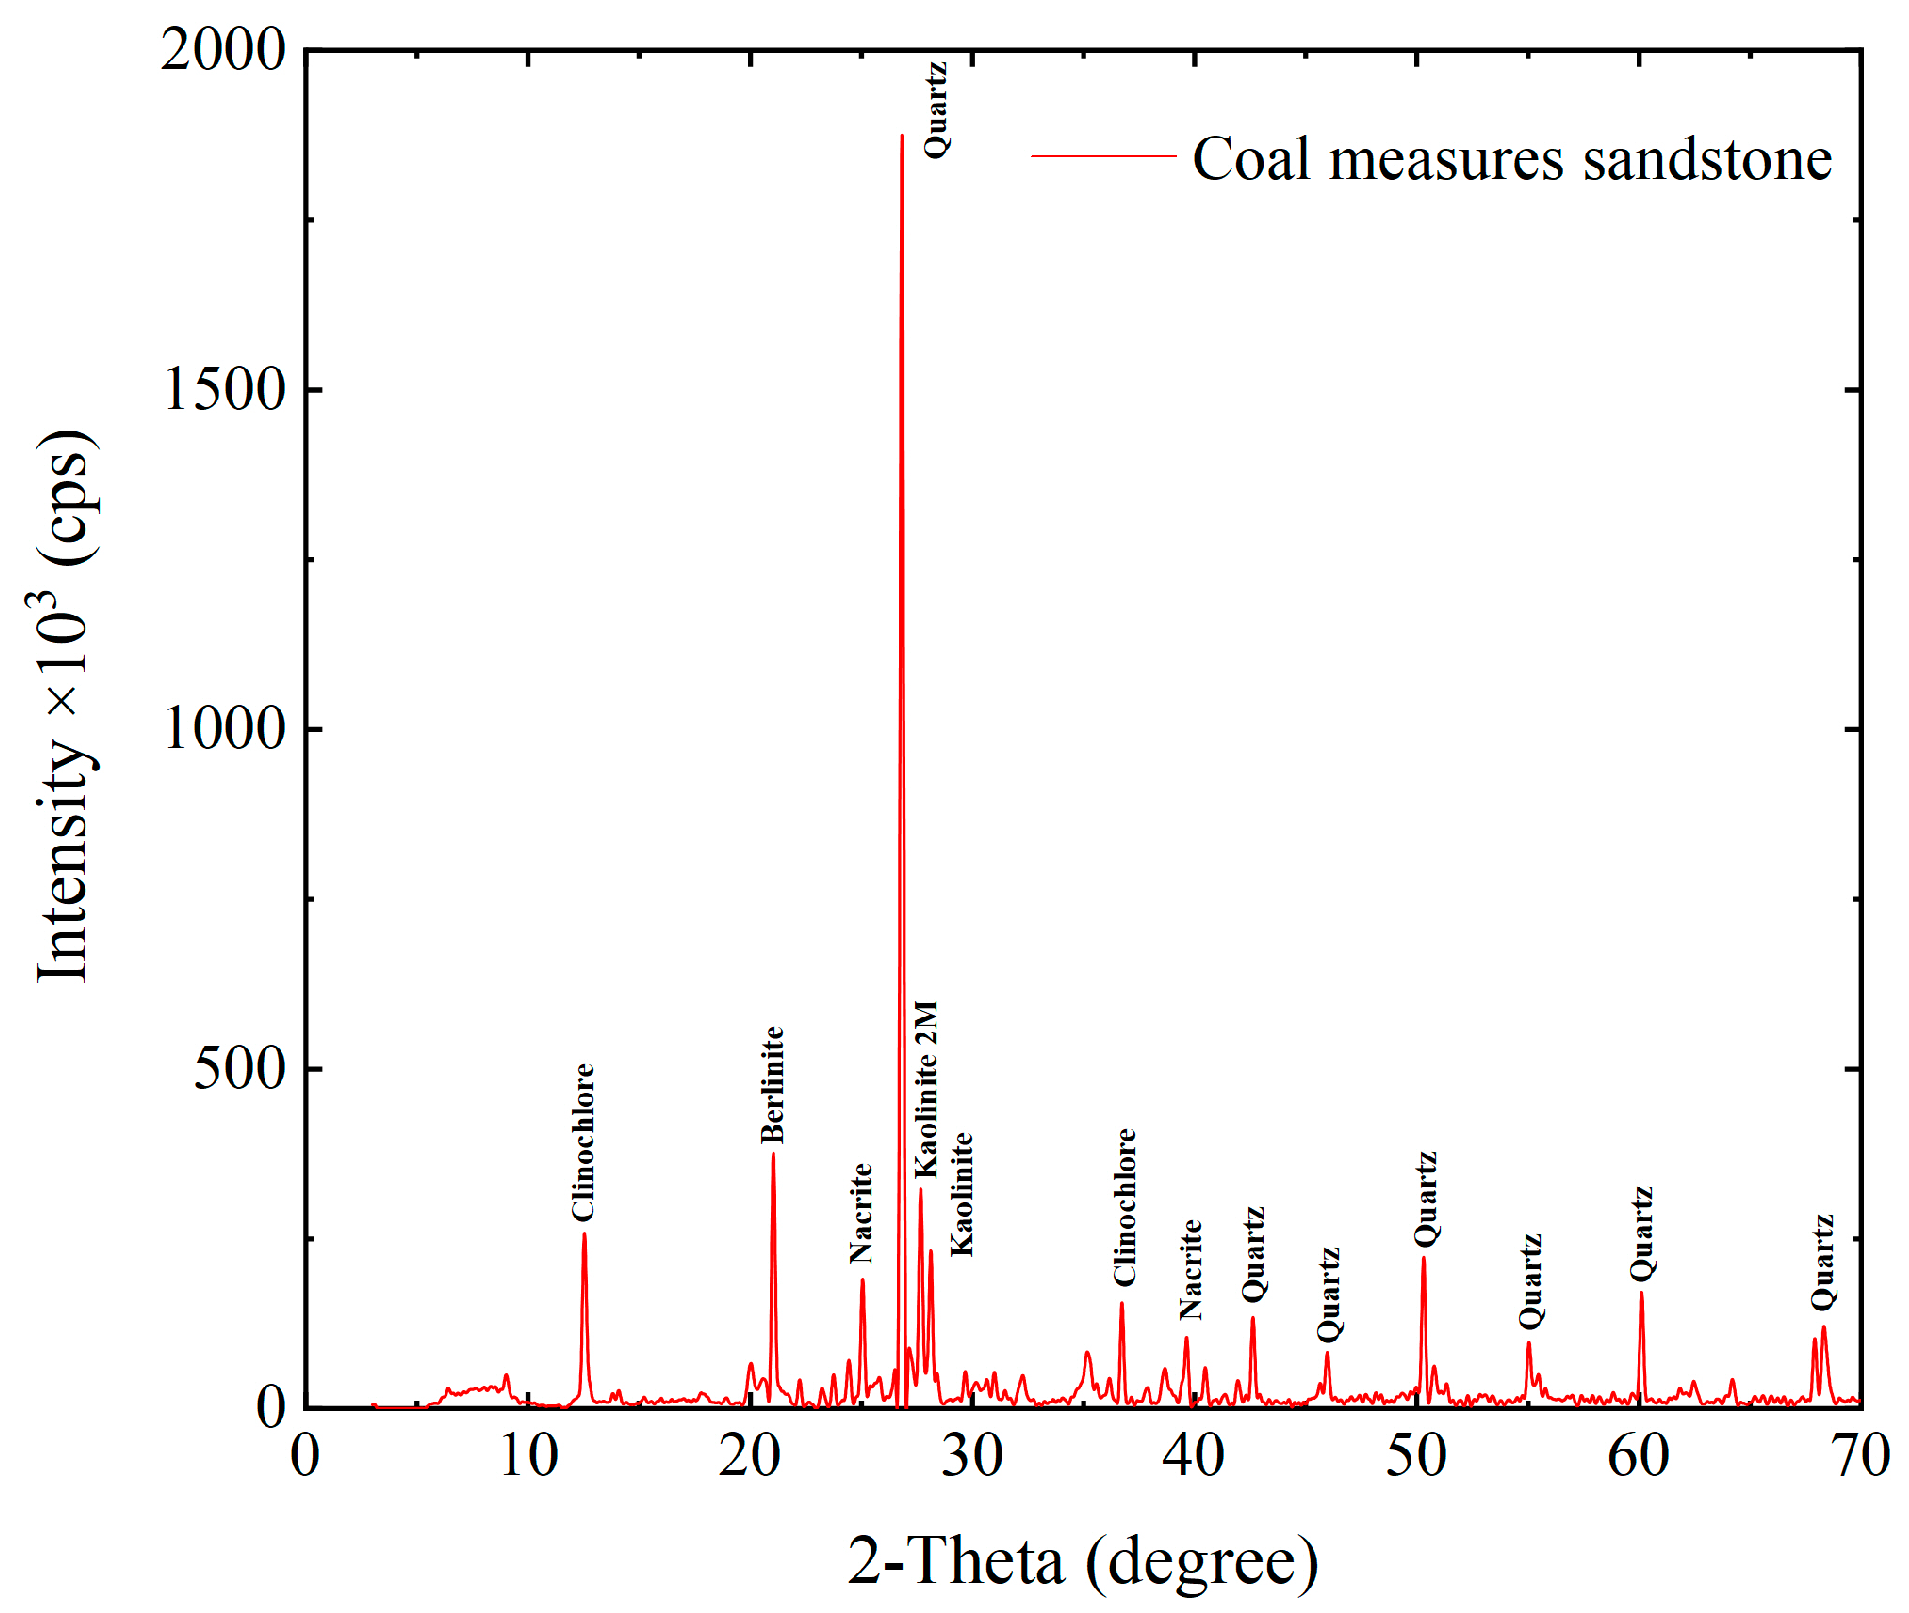
The SEM images and the XRD graph of coal measures sandstone are shown in Figure 3 and Figure 4, respectively. The SEM images show some tiny internal porosities and mineral grains on the surface of the sandstone, indicating that the selected sandstone may be sensitive to an accumulated damage effect. The mineralogical composition of the sandstone is represented by an XRD graph. According to the XRD graph, the sandstone used in this study contains a large proportion of quartz, along with a slight presence of berlinite, clinochlore, kaolinite, and nacrite.

Figure 3.
Scanning electron microscopy (SEM) analysis of sandstone.

Figure 4.
X-ray diffraction (XRD) study of sandstone.
2.2. Physical and Quasi-Static Tests
The physical and quasi-static properties of the rock are critical for describing material qualities. The sandstone specimens were dried for 24 h in an electric drying oven at 85 °C, following which the moisture content of the sandstone in its natural condition could be determined. According to several observations and estimates, sandstone has a density of 2589 kg/m3, a P-wave velocity of 3682 m/s, and a natural moisture content of 1.13%.
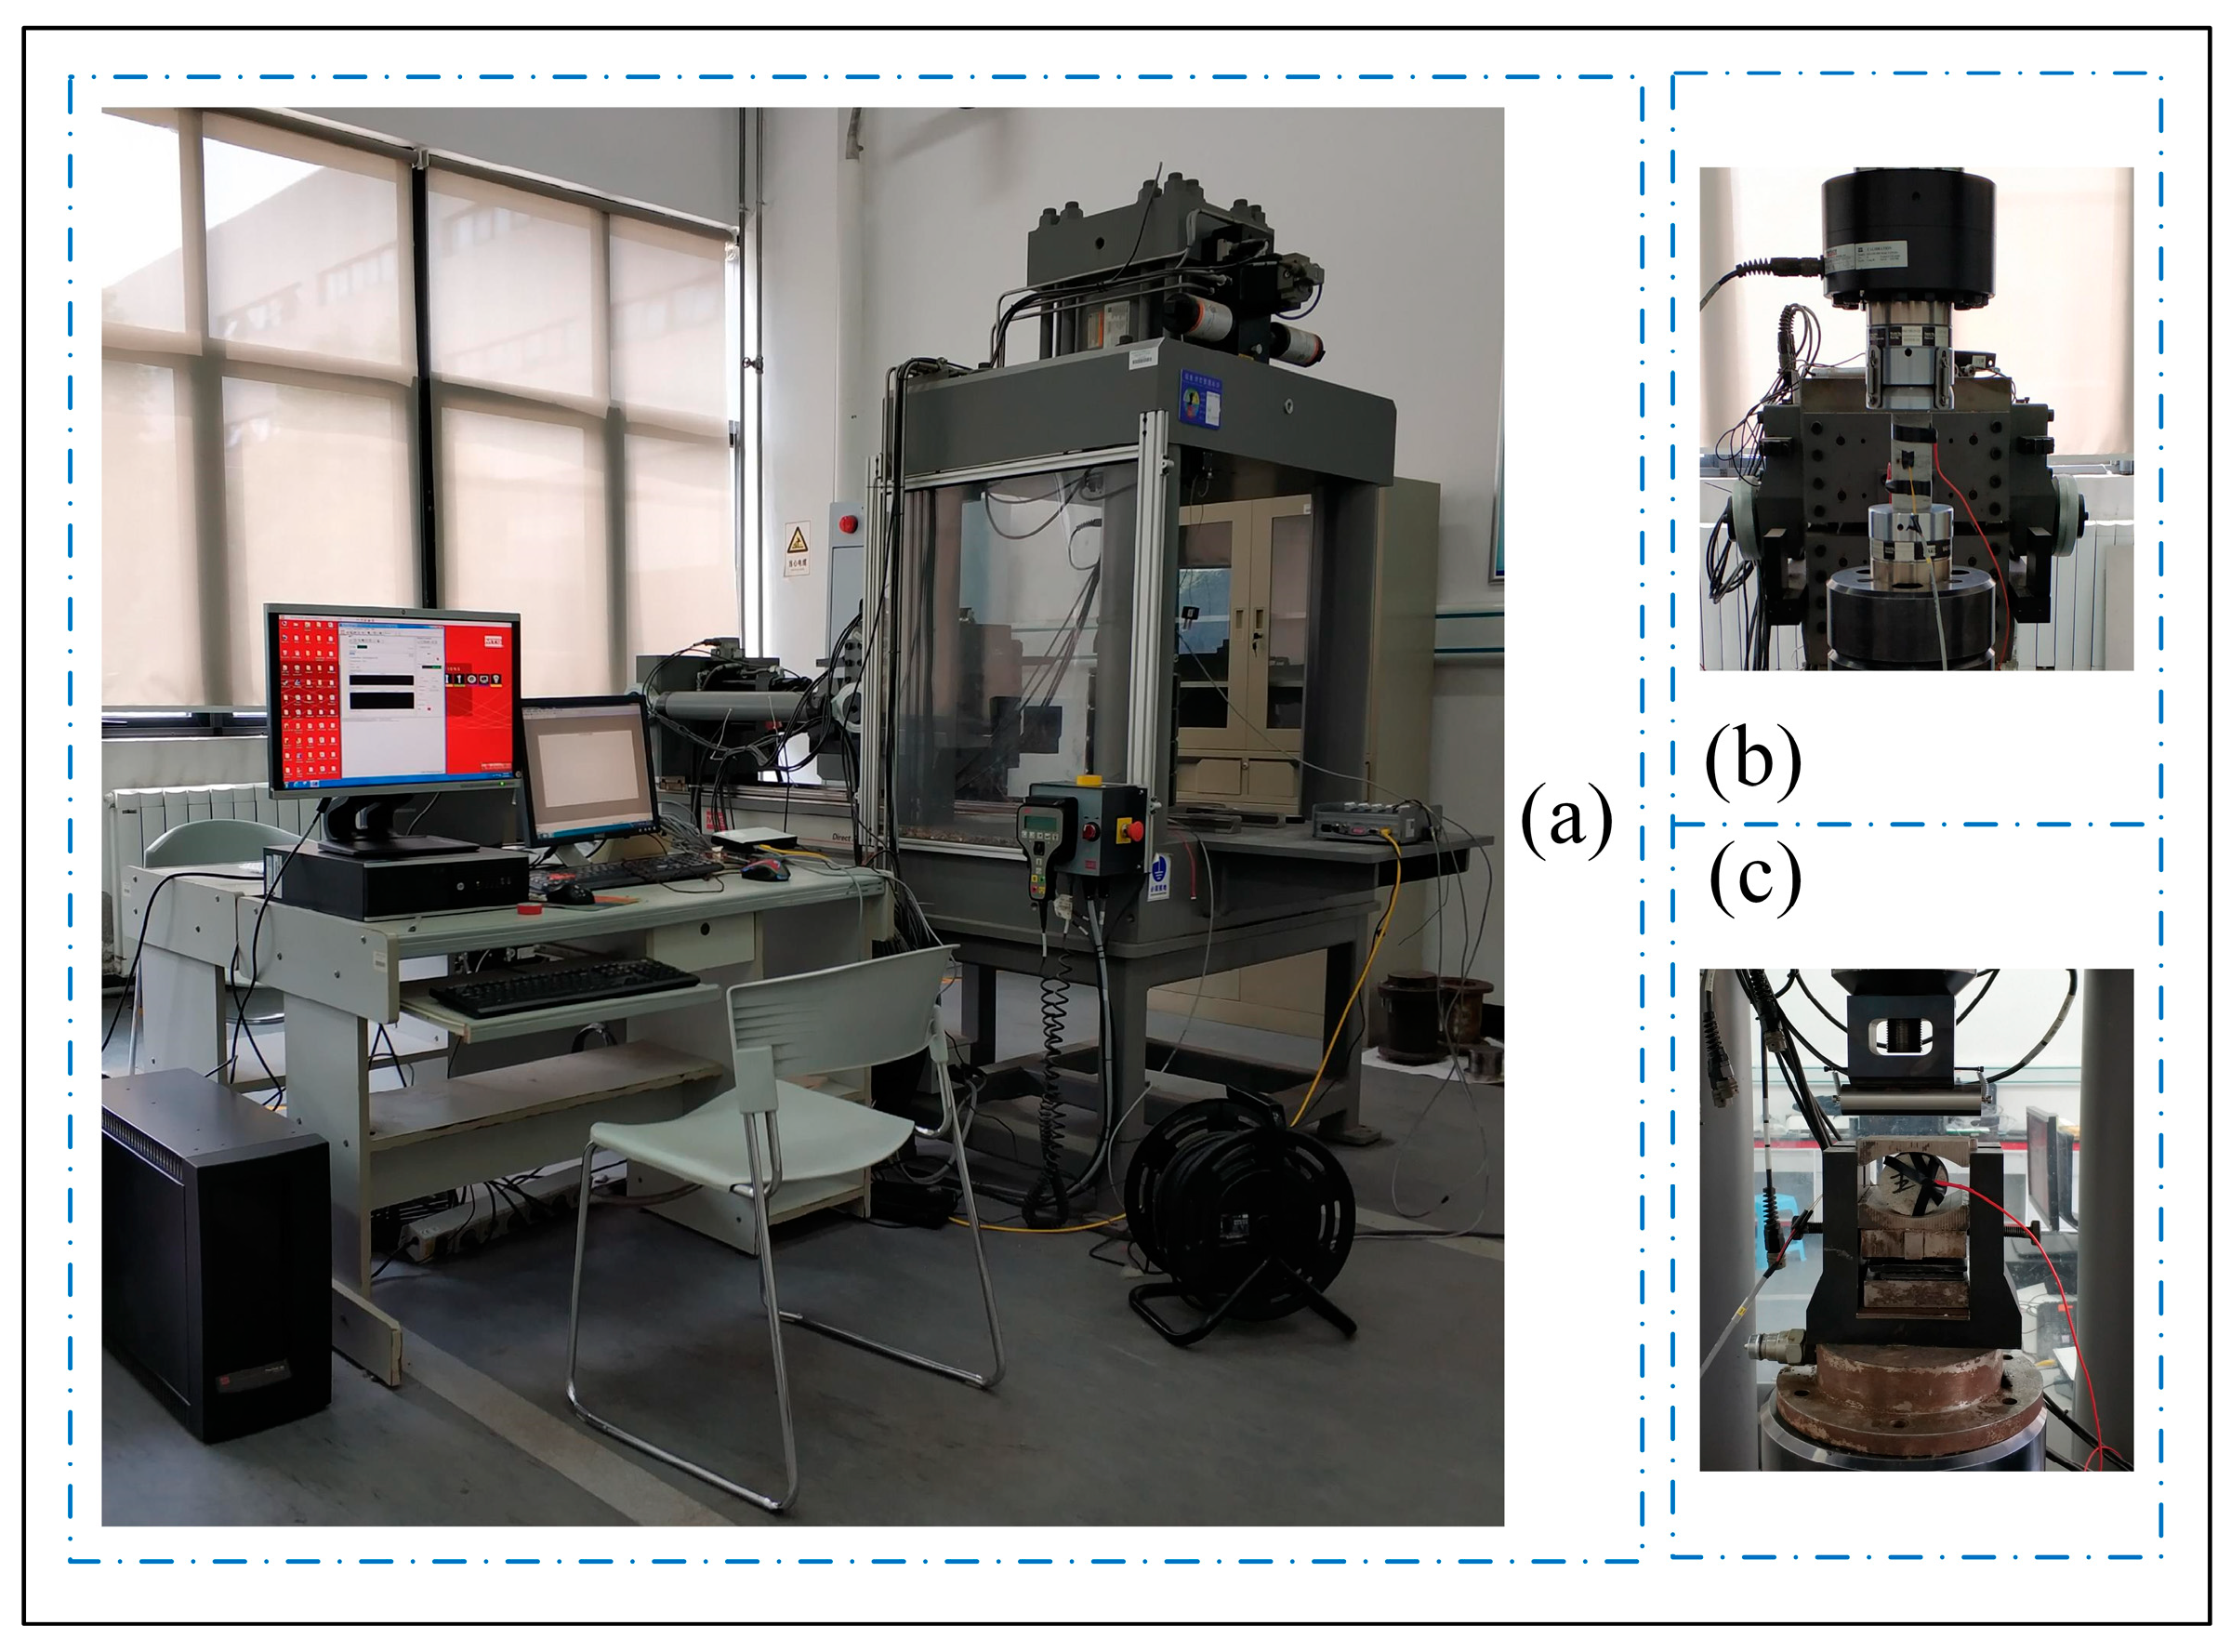
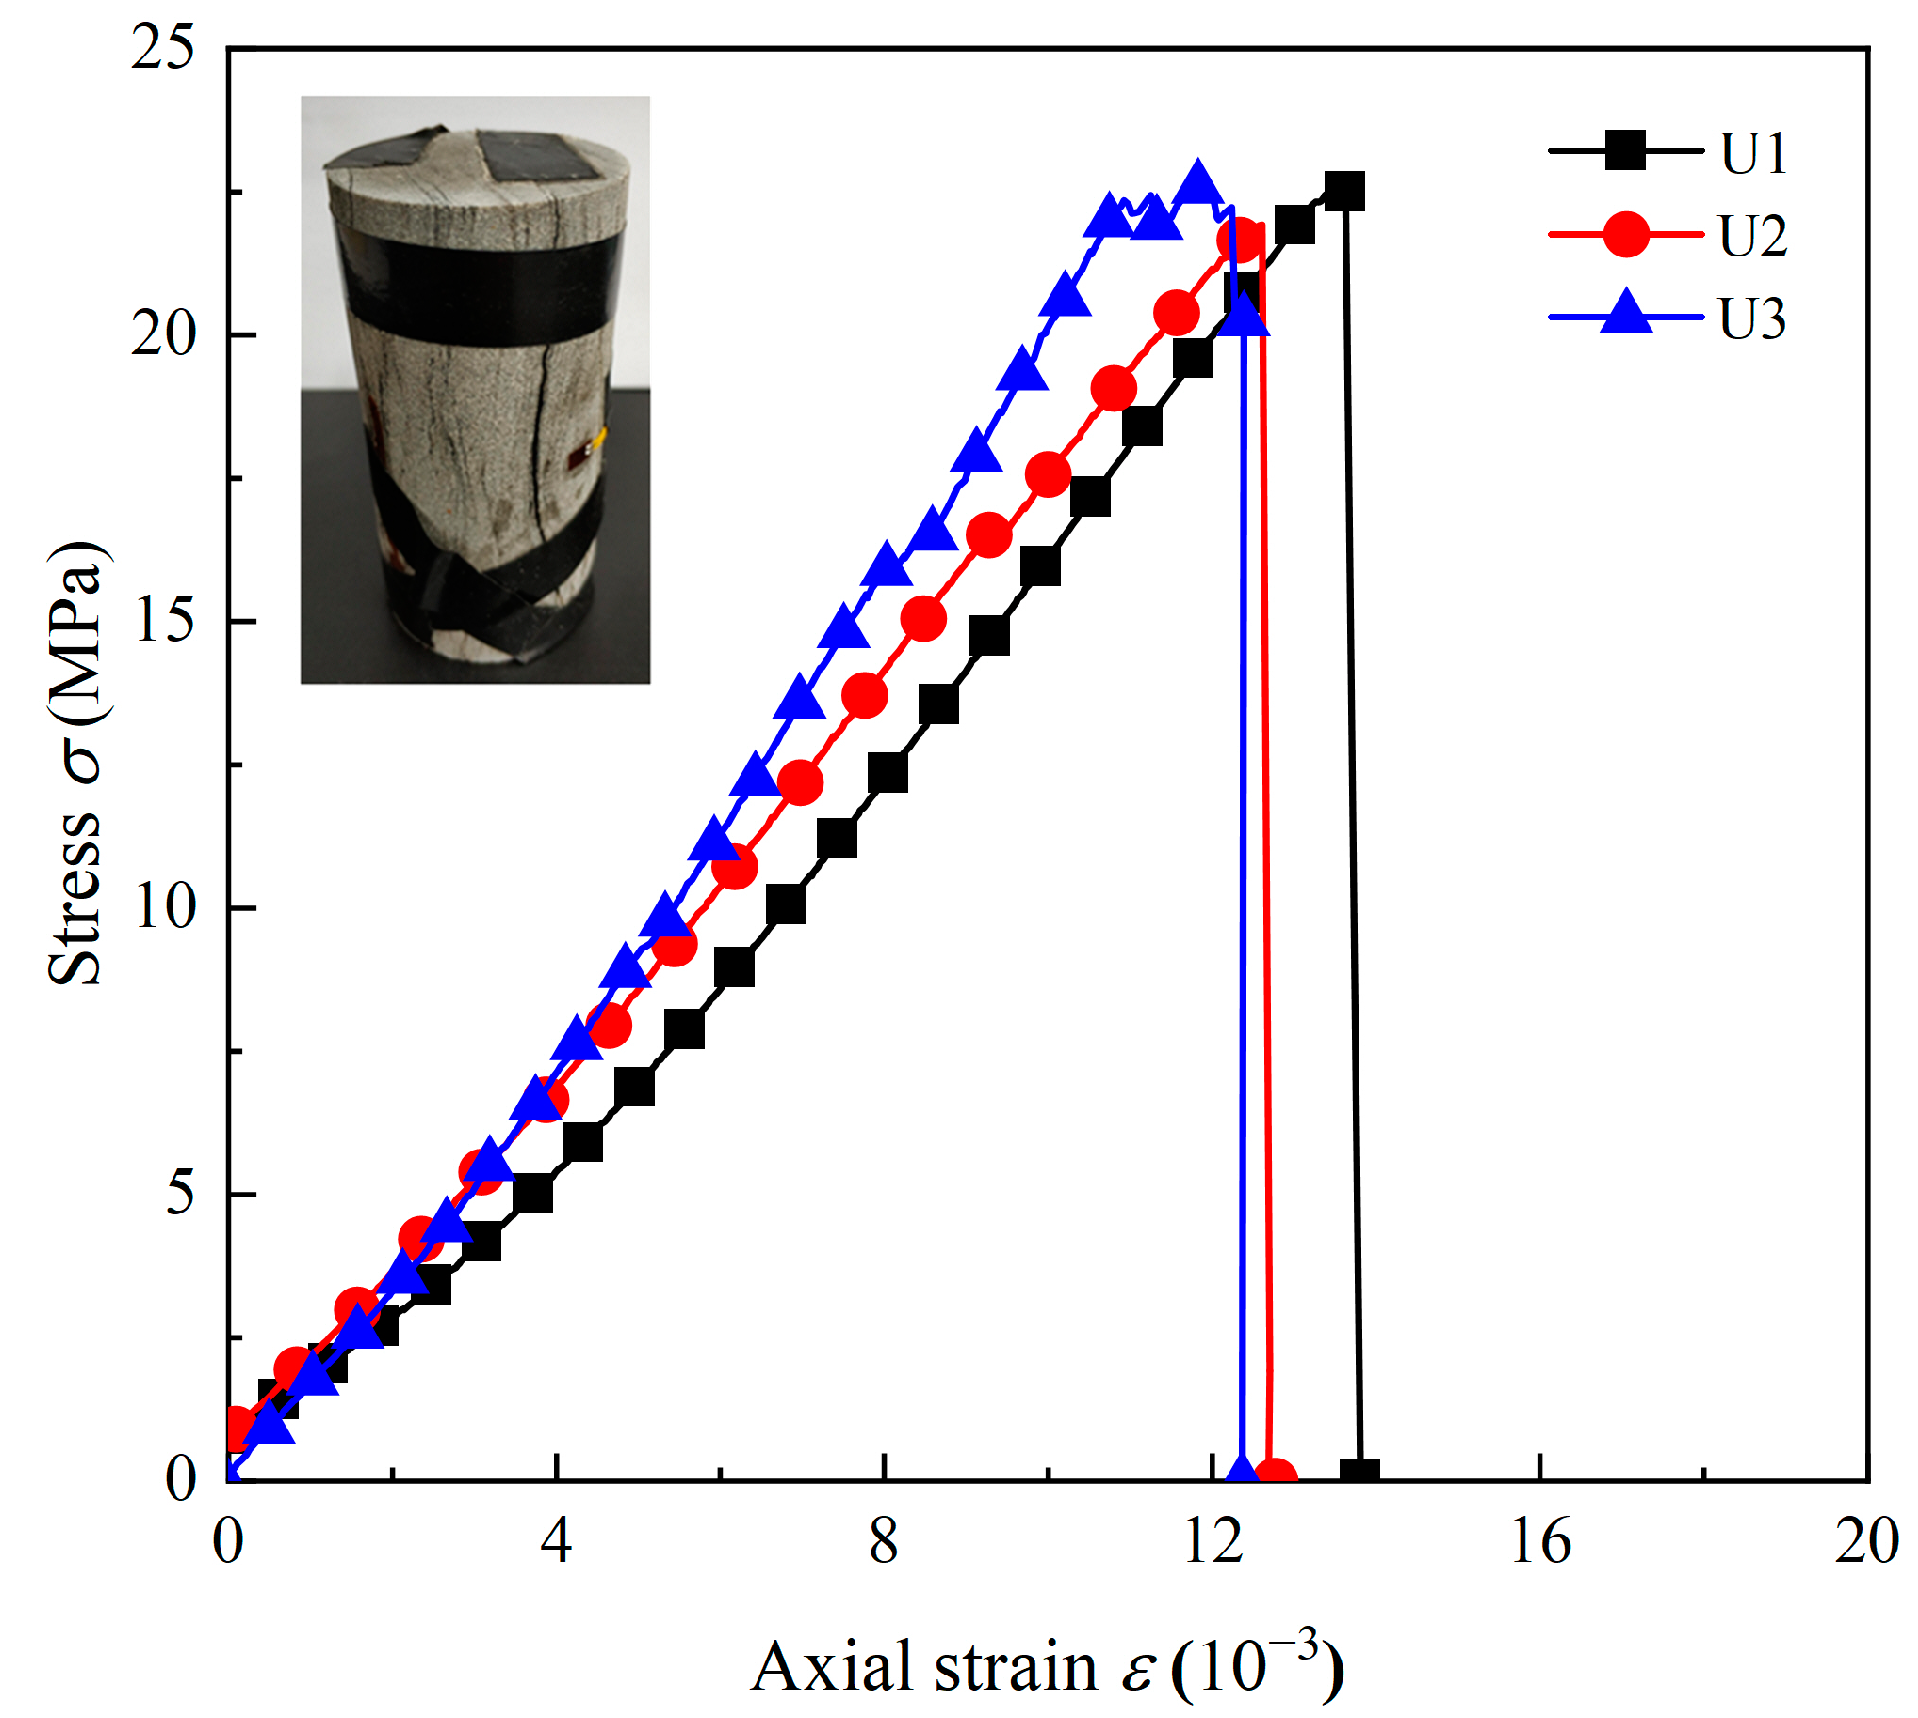
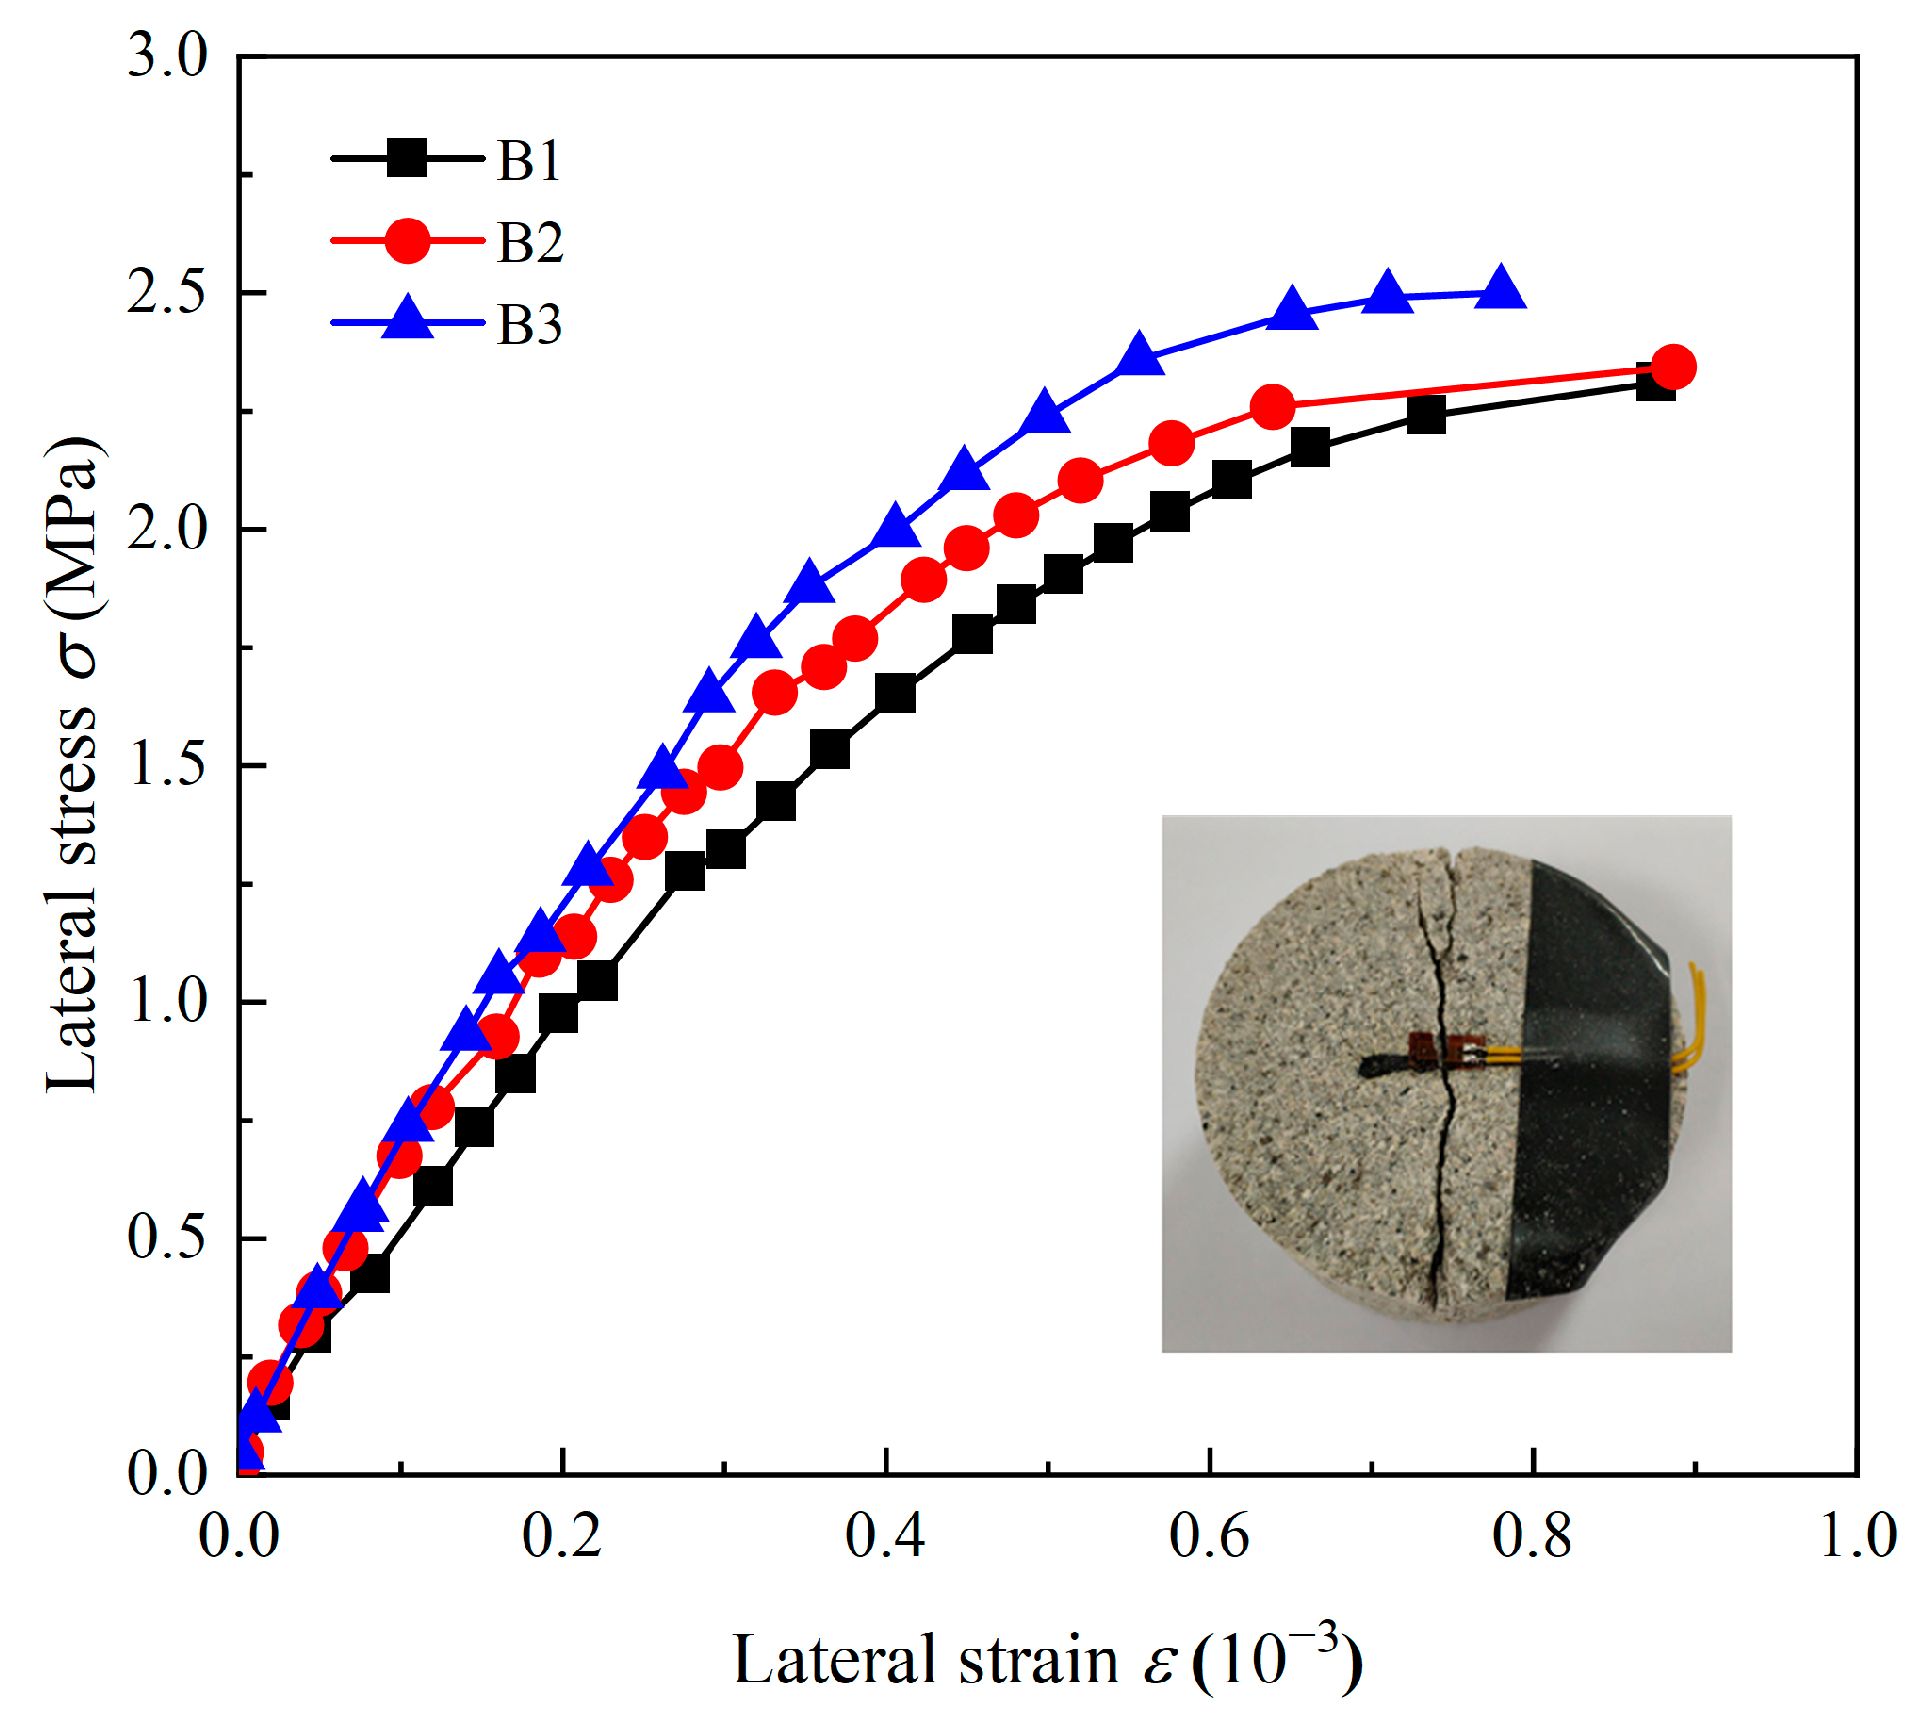
MTS816 was used to conduct quasi-static tests on the sandstone, including uniaxial compression tests and Brazilian tests (Figure 5). Strain gauges were fitted to the center of the specimens before the tests to measure the transverse strain in a direction perpendicular to the loading force. The uniaxial compression stress–strain curves are shown in Figure 6. The stress–strain curves exhibit a tiny bending state when the stress level is low. The stress–strain curves become straighter as the stress increases to a level high enough to destroy the specimens. Shear and tensile failures are responsible for specimen failure. This type of rock is known as a plastic-elastomer [38]. The specimens had an average uniaxial compressive strength of 22.46 MPa, an average elastic modulus of 1.91 GPa, and an average Poisson’s ratio of 0.14 after three sets of uniaxial compression testing. The lateral stress–lateral strain graphs in Figure 7 show the typical tensile failure characteristics. The sandstone’s average indirect tensile strength is 2.38 MPa. The physical and mechanical properties of the sandstone are summarized in Table 1.
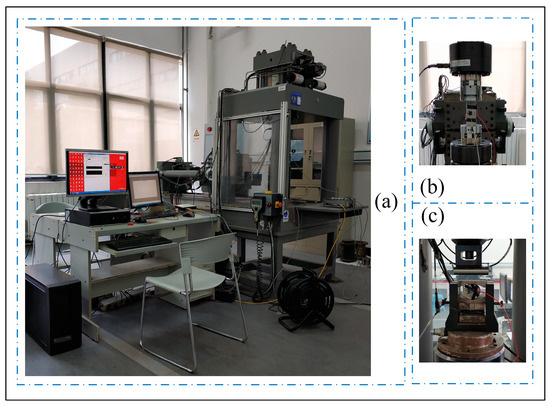
Figure 5.
Quasi-static test methods: (a) MTS816 system; (b) uniaxial compression tests; (c) Brazilian tests.

Figure 6.
Uniaxial compression stress–strain curves.
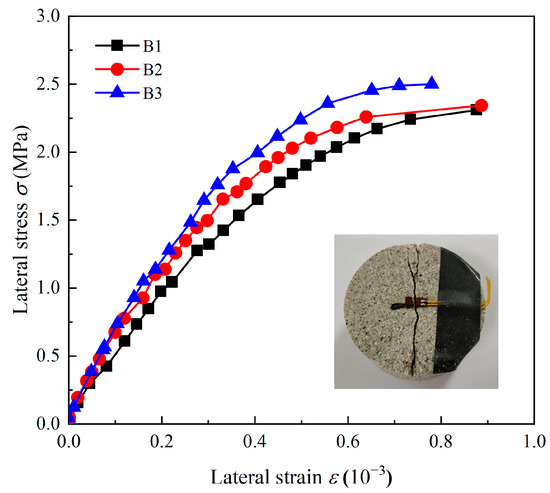
Figure 7.
Indirect tensile stress–strain curves.

Table 1.
Basic physical and mechanical properties of sandstone.
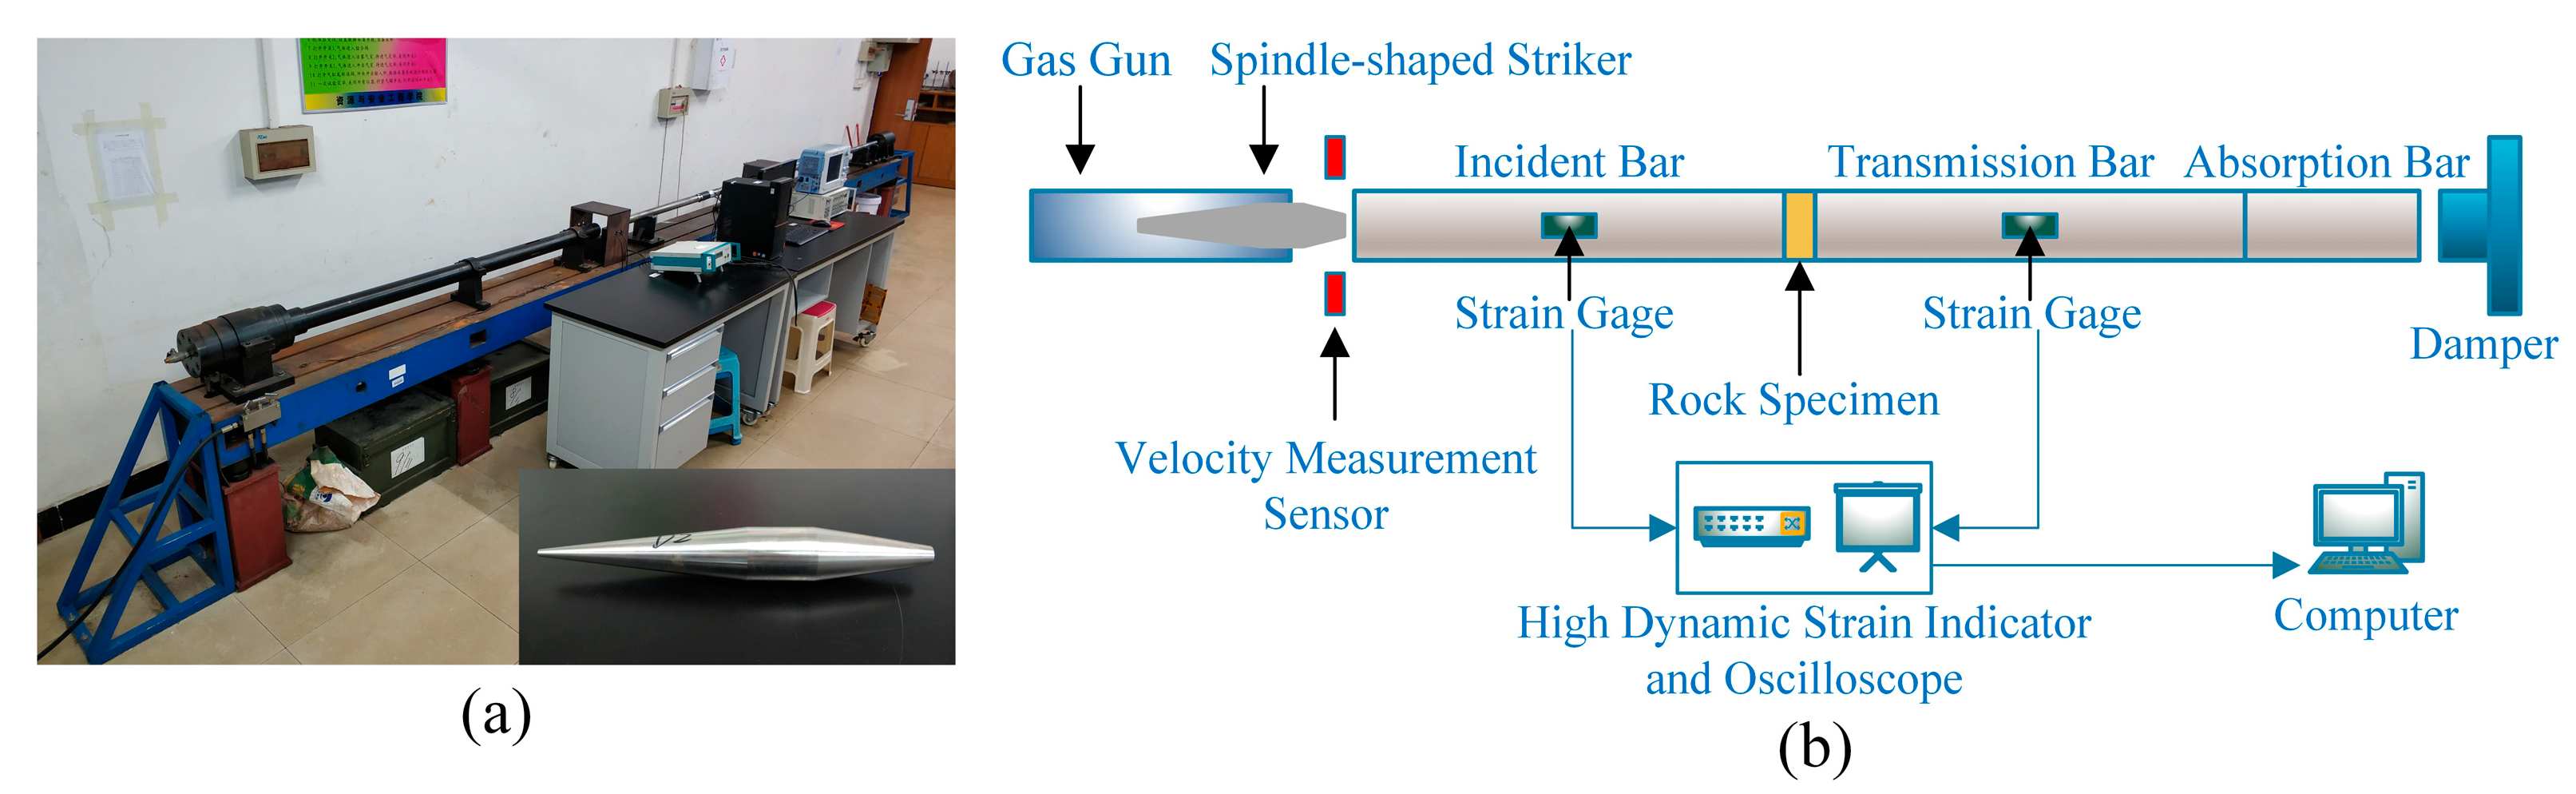
2.3. Dynamic Testing Facilities
The experimental investigation on coal measures sandstone was carried out at Central South University using a 50 mm diameter split Hopkinson pressure bar (SHPB) testing system, as shown in Figure 8.

Figure 8.
Split Hopkinson pressure bar test system: (a) SHPB device, Central South University; (b) schematic diagram.
The specific parameters of the SHPB device are detailed by Li et al. [39] and Qiu et al. [40]. The striker is shaped similar to a spindle to obtain the half-sine incident stress wave along the direction of the bars. It prevents fragile materials from being damaged prematurely during the tests. This particularly formed striker permits rock specimens to be loaded at a constant strain rate for as long as possible, which is critical in dynamic tests [41,42]. Two sets of strain gauges are attached to the middle of the bar system, and the wave data can be collected by the SDY2107A high dynamic strain indicator and the DL850E oscilloscope. The following part of the research is carried out using the first complete set of waveforms acquired during testing. Another key step before the tests is to lubricate the end faces of the specimens and the bar system with a thin layer of lubricant to reduce frictional effects. Many researchers have investigated the impact of various length-to-diameter ratios on test results, recommending a range of 0.5 to 1 as the best length-to-diameter ratio [43]. The size of the rock specimen should be more than 10 times the maximum diameter of the rock particles, according to the ISRM-suggested method for SHPB testing [37], and the inertia effect and dispersion effects should be avoided as much as feasible. For this study, disc-type sandstone specimens with a length-to-diameter ratio of 0.5 were used, i.e., 25 mm length and 50 mm diameter. The dynamic properties of rock with strain rates between 101 and 103 s−1 can be obtained using the SHPB test system, which covers the range of high strain rates seen in deep mining engineering.
Two essential assumptions underpin the SHPB experimental technique. The one-dimensional stress wave theory is the initial assumption [42]. The stress wave is thought to propagate in a one-dimensional direction in the bars. The stress wave is unaffected by the dispersion effect throughout the operation, and the cross-section of the bars is always flat. The specimen’s stress uniformity assumption is the second hypothesis [44]. The stress and strain in the specimen are equally distributed during stress wave propagation, and the stress and strain of the two end faces of the specimen are equal. The stress equilibrium condition can be verified by the relationship between the incident wave, the reflected wave, and the transmitted wave. For a typical compression test in Figure 9, the sum of the incident wave and the reflected wave is in high agreement with the transmitted wave, proving that the forces at both ends of the sandstone specimen are approximately equivalent. Equation (1) is naturally obtained using these two assumptions:
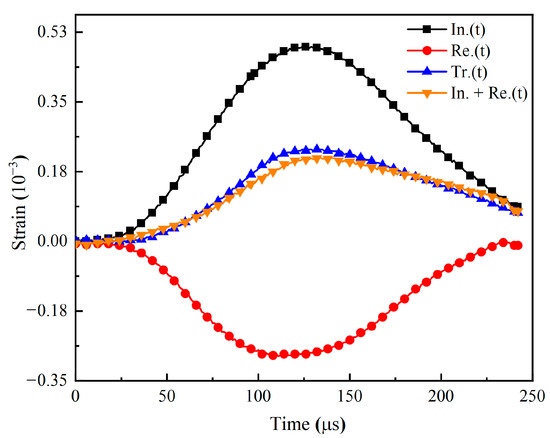
Figure 9.
Dynamic stress equilibrium for a typical compression test.
2.4. Definition of Accumulated Damage
Micro-cracks begin to develop within the rock when damage is produced in the specimen. After that, as the damage within the rock progressively intensifies, the cracks gradually expand to penetrate the rock, eventually leading to rock destruction. The rock will deform when it is subjected to external loads. At the same time, energy, namely strain energy, will gradually accumulate inside the sample. The rock sample will be destroyed once the accumulated strain energy exceeds the limit value. So, we define the strain energy density as the amount of energy stored per unit volume of the rock. The strain energy density can reflect rock failure caused by the nature and stress state of the rock material itself [45,46,47]. The strain energy density can be calculated by Equation (2):
where U denotes the strain energy density; W denotes the strain energy; V denotes the specimen volume; and σ and ε denote the stress and the corresponding strain, respectively.
Uniaxial compression tests apply different loads to rock specimens to form additional accumulated damage. The rock specimen will be broken when its strength reaches its maximum value, and the strain energy density of the specimen will be the highest. The ratio of the corresponding strain energy density under a specific load to the maximum strain energy density is called the accumulated damage factor (Figure 10), which is expressed by Equation (3):
where D denotes the accumulated damage factor, denotes the strain energy density when strain is ε, and denotes the maximum strain energy density. After calculation, .
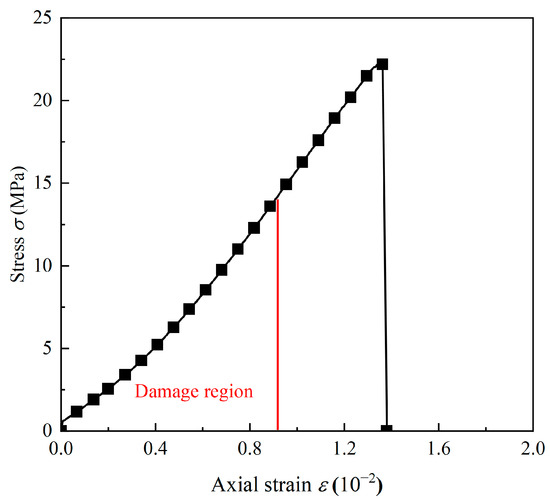
Figure 10.
Characterization of the damage region.
Different sandstone specimens were subjected to axial pressures of 40%, 50%, 60%, 70%, 80%, and 90% of uniaxial compressive strength to control different accumulated damage degrees. The corresponding accumulated damage factors were calculated, as shown in Table 2. Figure 11 demonstrates that the damage factor increases linearly with the growth of the axial load.
Table 2.
Axial stress and the corresponding accumulated damage factor.
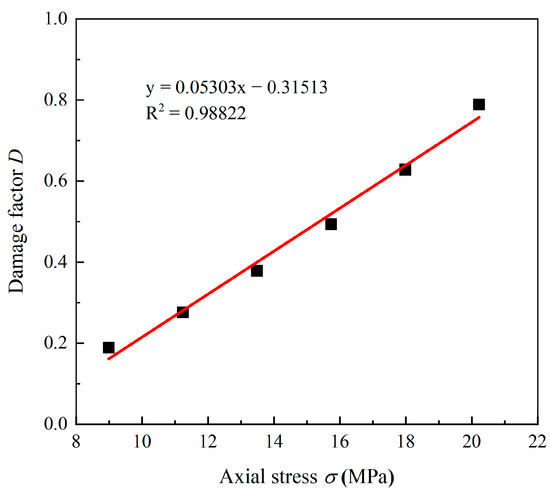
Figure 11.
Relationship between the accumulated damage factor and axial stress.
2.5. Dynamic Testing Scheme
Dynamic tests were performed consecutively under seven different accumulated damage situations in this study. The specific test scheme is as follows:
- Initial accumulated damage tests. The MTS816 is used to apply various levels of accumulated damage to selected coal measures sandstone specimens. The accumulated damage factor is calculated to measure the extent of the sandstone damage.
- Dynamic tests of sandstone. The SHPB test equipment is used to perform impact tests on sandstone to investigate the coupling effect of a high strain rate and the accumulated damage. There are five different strain rates and seven different accumulated damage conditions in this study. In each condition, only one test is conducted. In the event of a significant irregularity in the test results, a second test under the identical settings is required to ensure reliability.
- Observation of sandstone failure modes. An SEM device is used to observe sandstone’s microstructure after failure and compare it with the macroscopic failure morphology. Finally, the effects of high strain rates and accumulated damages on the sandstone failure mode are explored.
2.6. Dynamic Testing Facilities
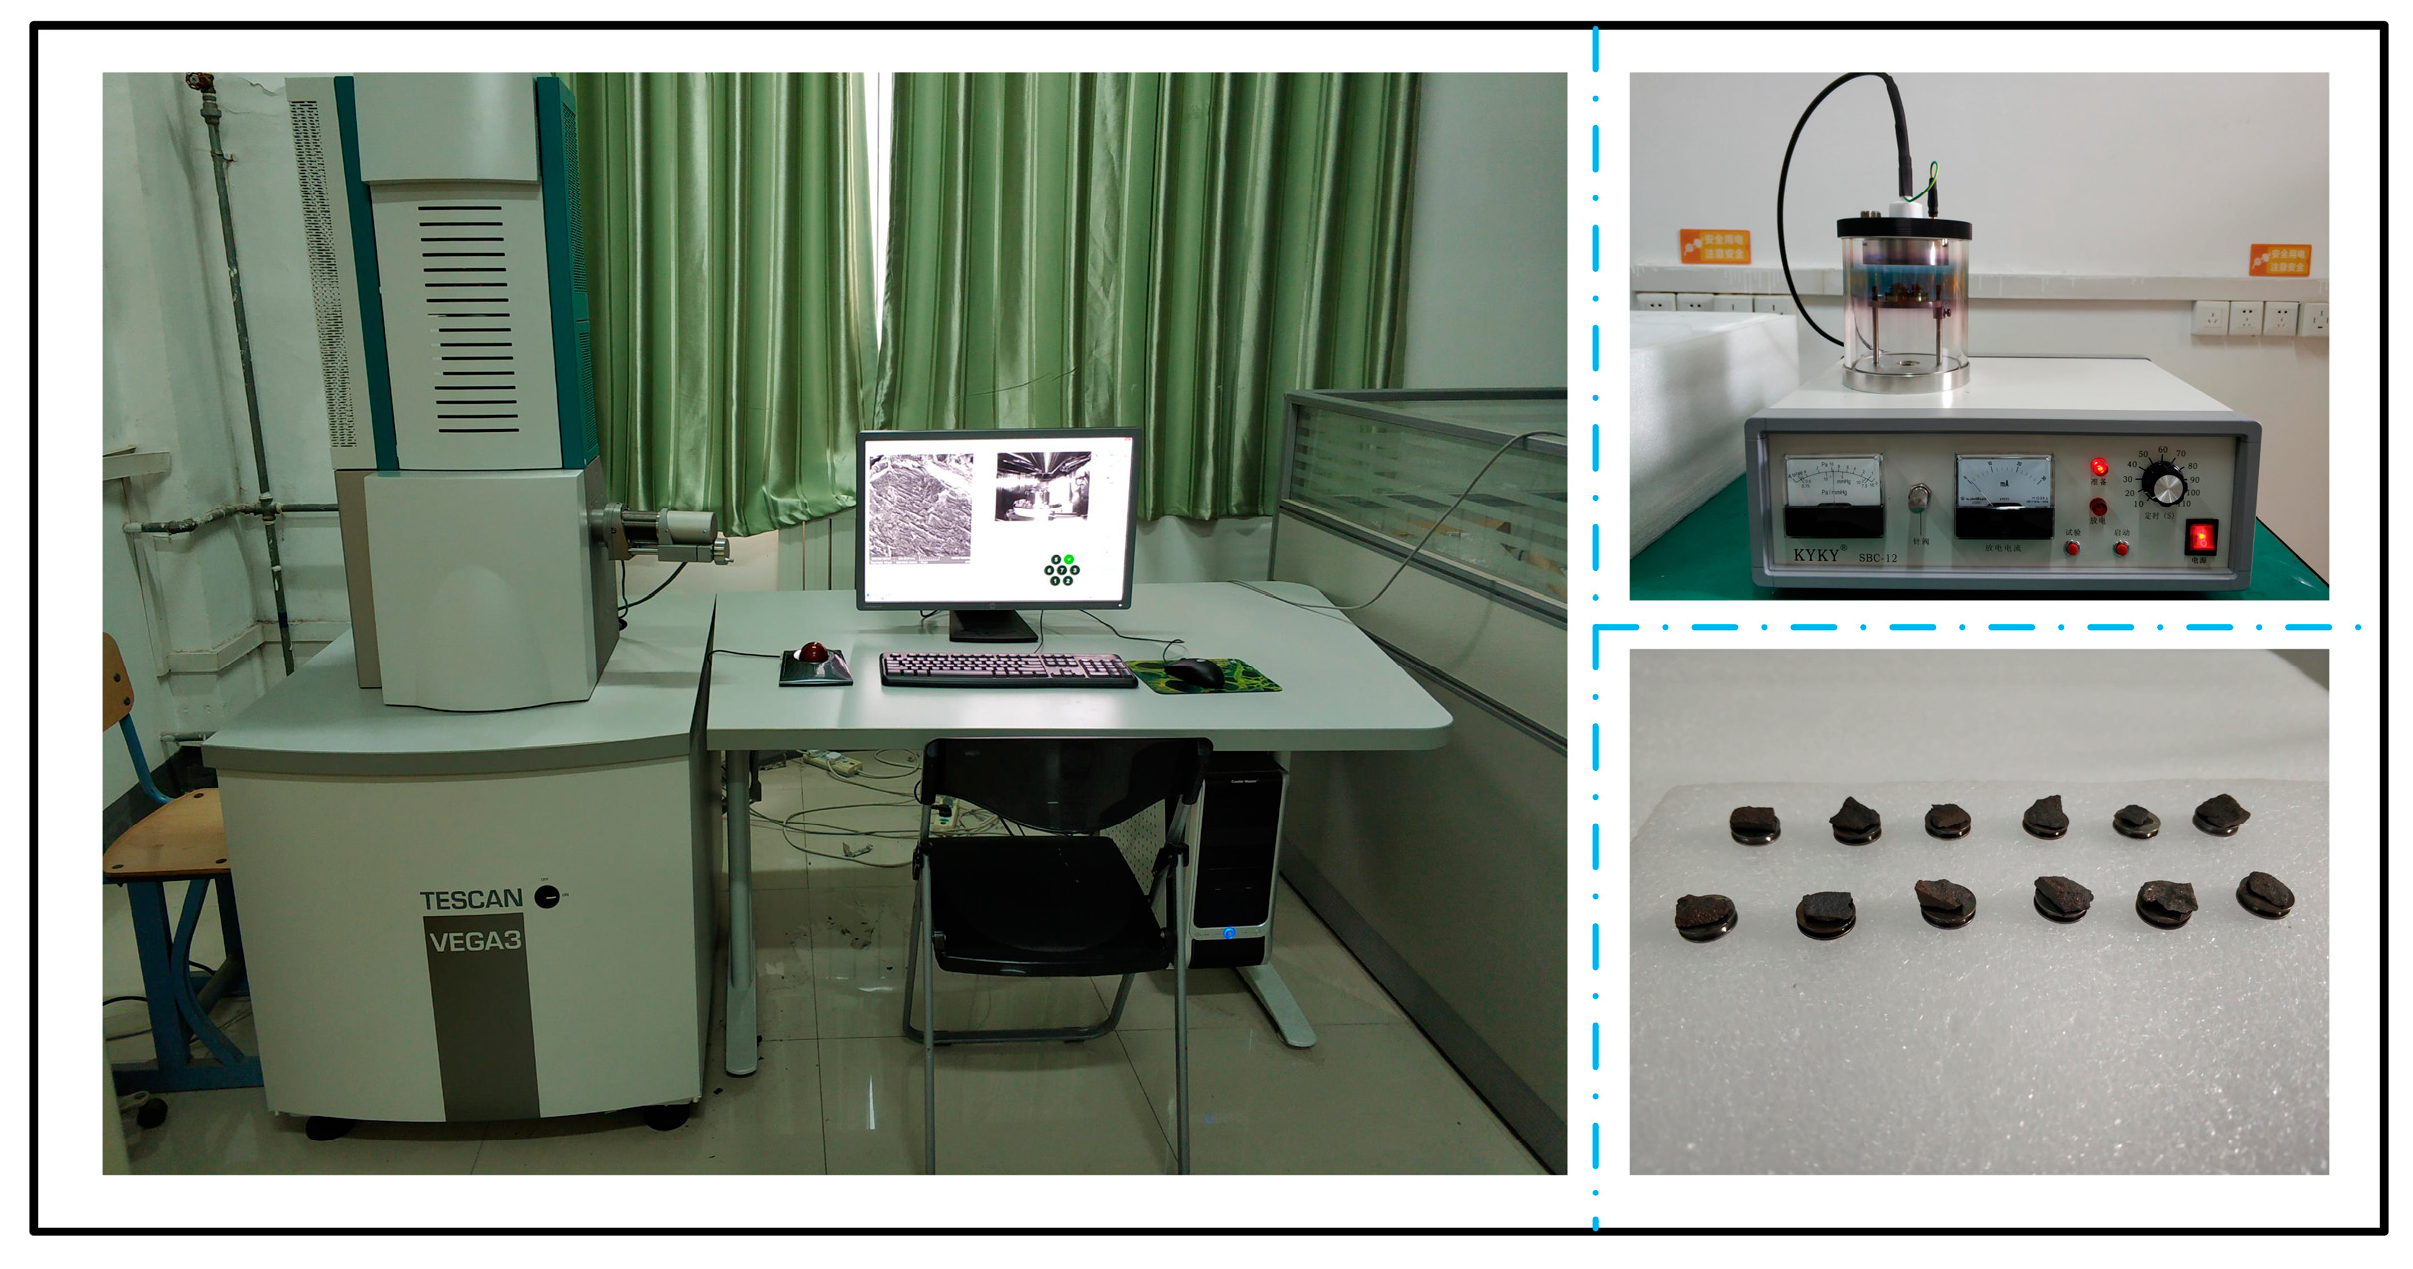
In order to explore the microscopic morphology modes of the fracture surface after sandstone failure, the TESCAN VEGA3 scanning electron microscope system (SEM) of the Xuzhou University of Engineering is employed (Figure 12). Several small fragments with a diameter of about 10 mm in the middle of the fracture surface are selected for observation. The samples are well prepared by spraying the surfaces of the observed fragments with gold using the SBC-12 small ion sputtering apparatus.
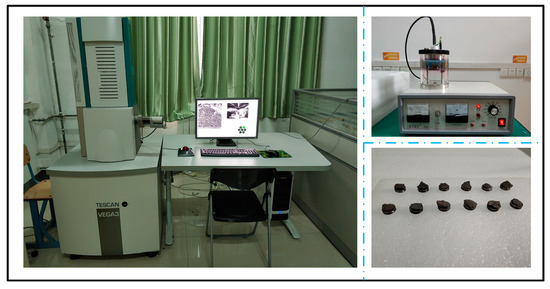
Figure 12.
TESCAN VEGA3 scanning electron microscopy (SEM) test system.
3. Results and Discussion
3.1. Dynamic Properties of Coal Measures Sandstone
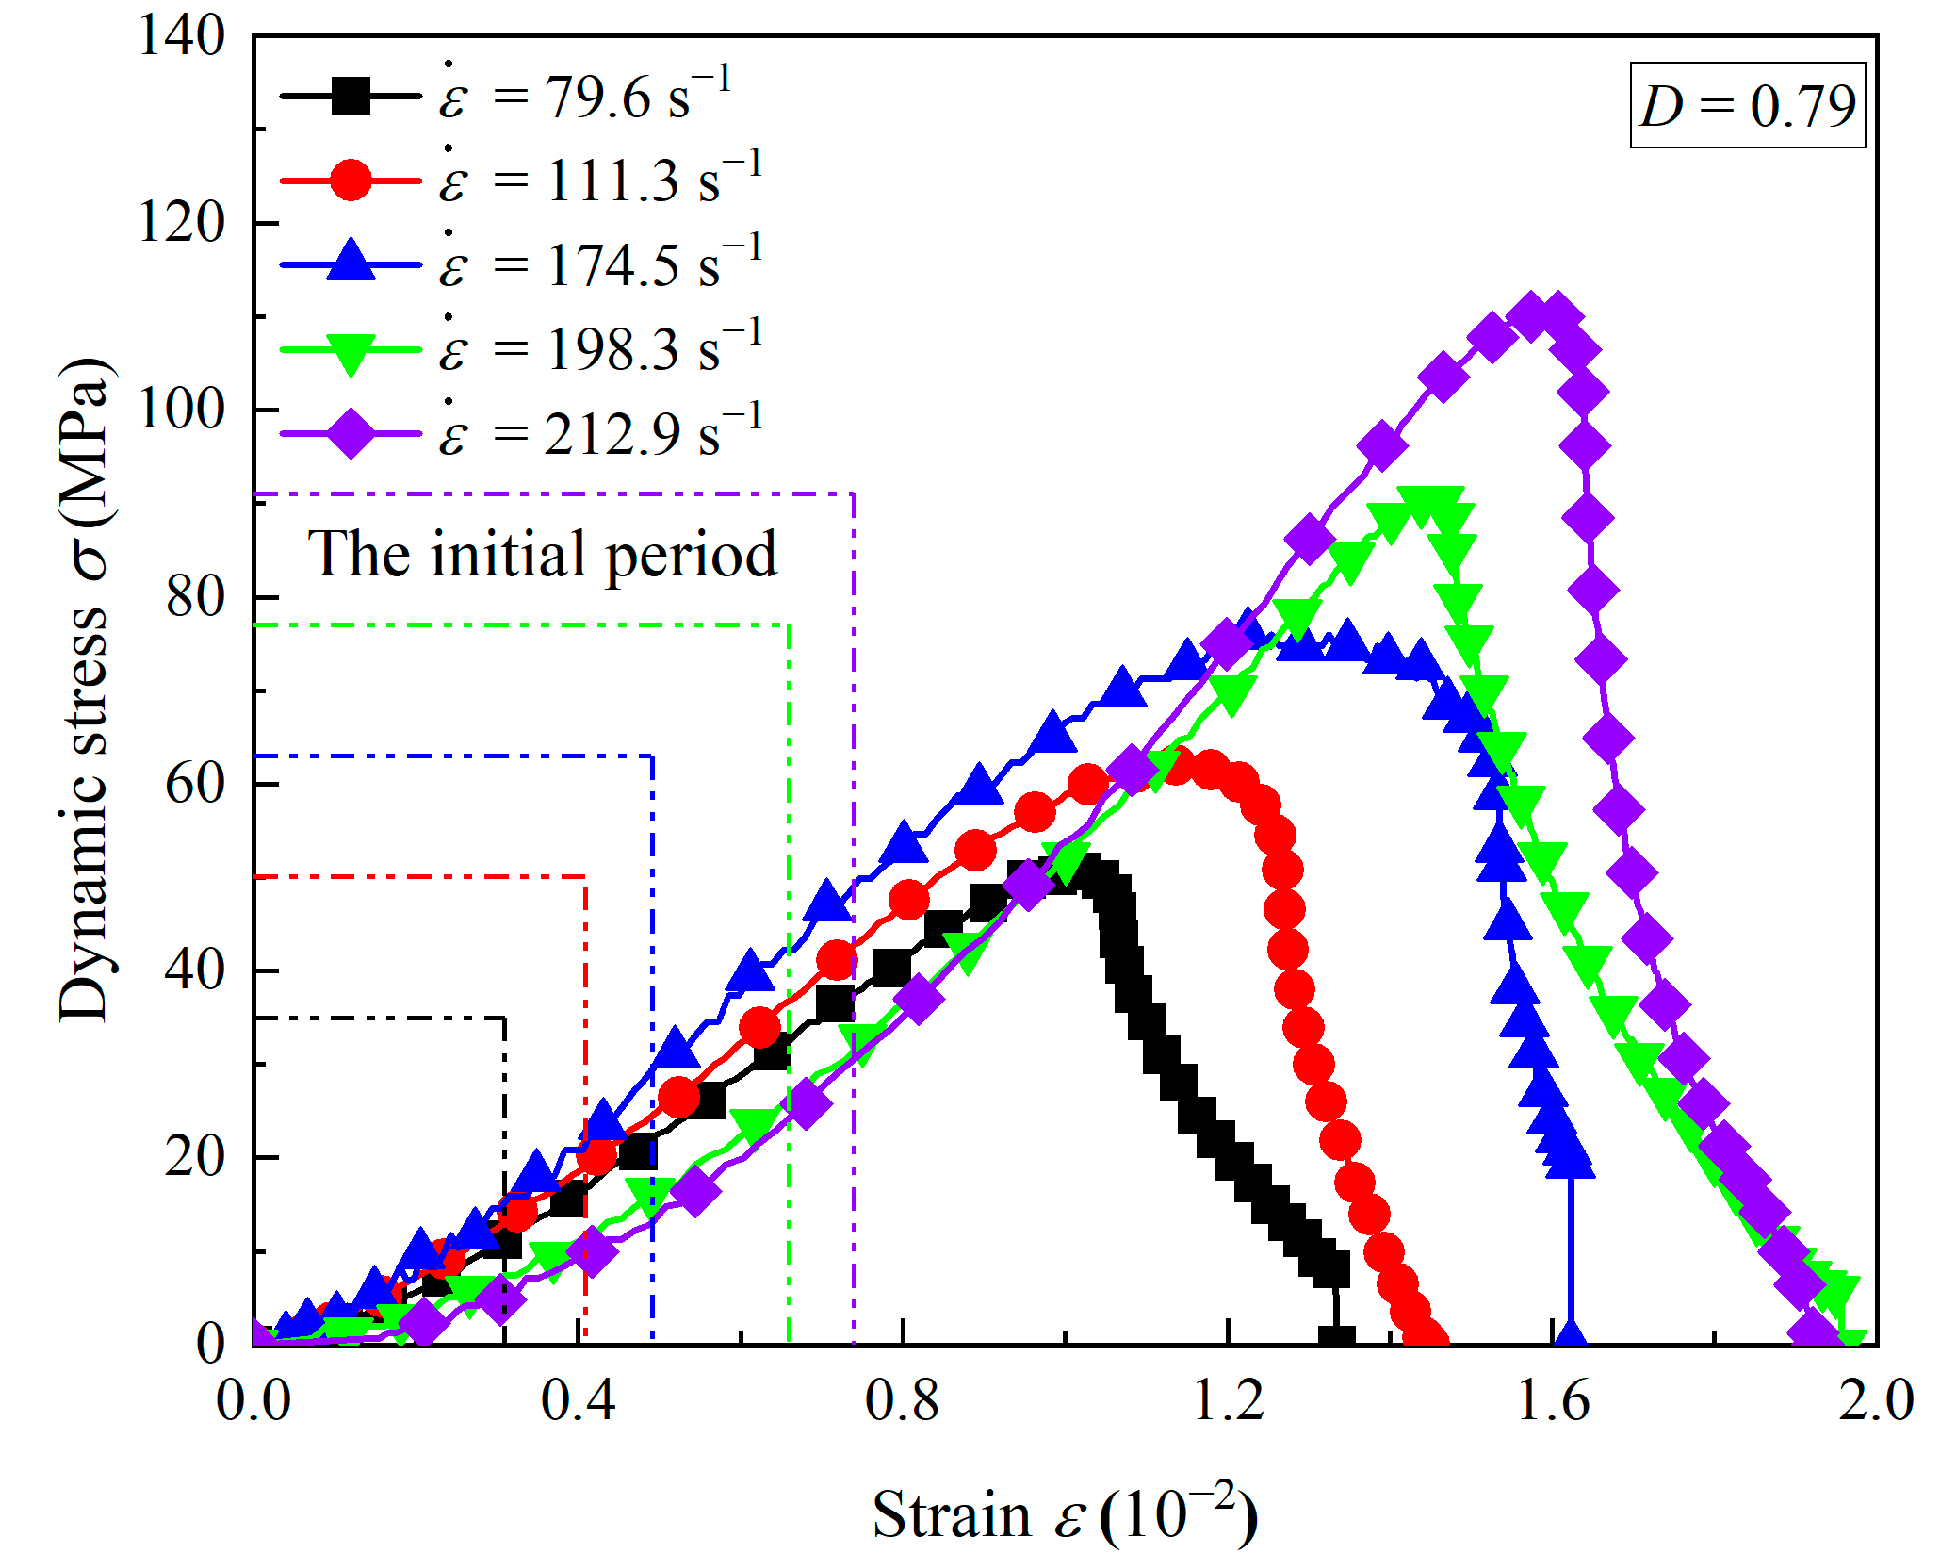
In this study, five similar high strain rates are obtained by setting five different impact pressures to investigate the dynamic mechanical properties of coal measures sandstone under impact loading conditions. Figure 13 illustrates the impacts of the strain rate on the stress–strain curves of the sandstone specimens without accumulated damage. The stress–strain curves with high strain rates show certain similarities, which means they can all be roughly classified into three phases. The first phase is the linear elastic phase, in which the dynamic stress–strain curves exhibit a straight upward tendency. In this phase, the stress wave propagated from the incident bar into the sandstone specimen will propagate many times inside the specimen and, finally, the strain and stress will reach a uniform state. The second phase is the plastic deformation phase, which begins at the end of the linear elastic phase and ends when the stress of the specimen reaches the peak value. In this phase, the sandstone specimen undergoes primarily plastic deformation. The third phase is called the strain-softening phase. In this phase, the sandstone specimen still has specific strength until it is completely destroyed. For some rocks, there is still a stage prior to the linear elastic phase, in which the rock specimen undergoes the compaction of the initial internal crack, as shown in the corresponding static tests [48]. However, the initial crack compaction phase is almost negligible under impact loading.
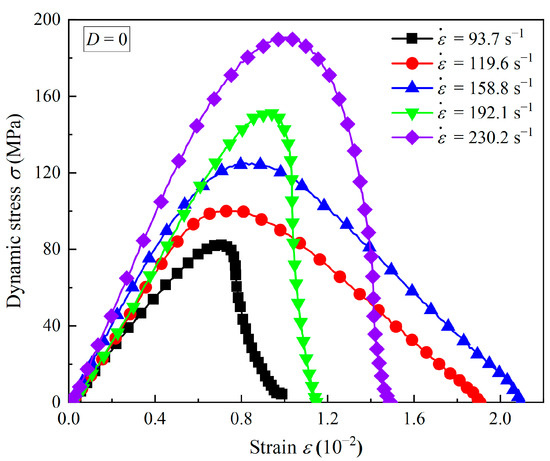
Figure 13.
Dynamic stress–strain curves of sandstone at different strain rates.
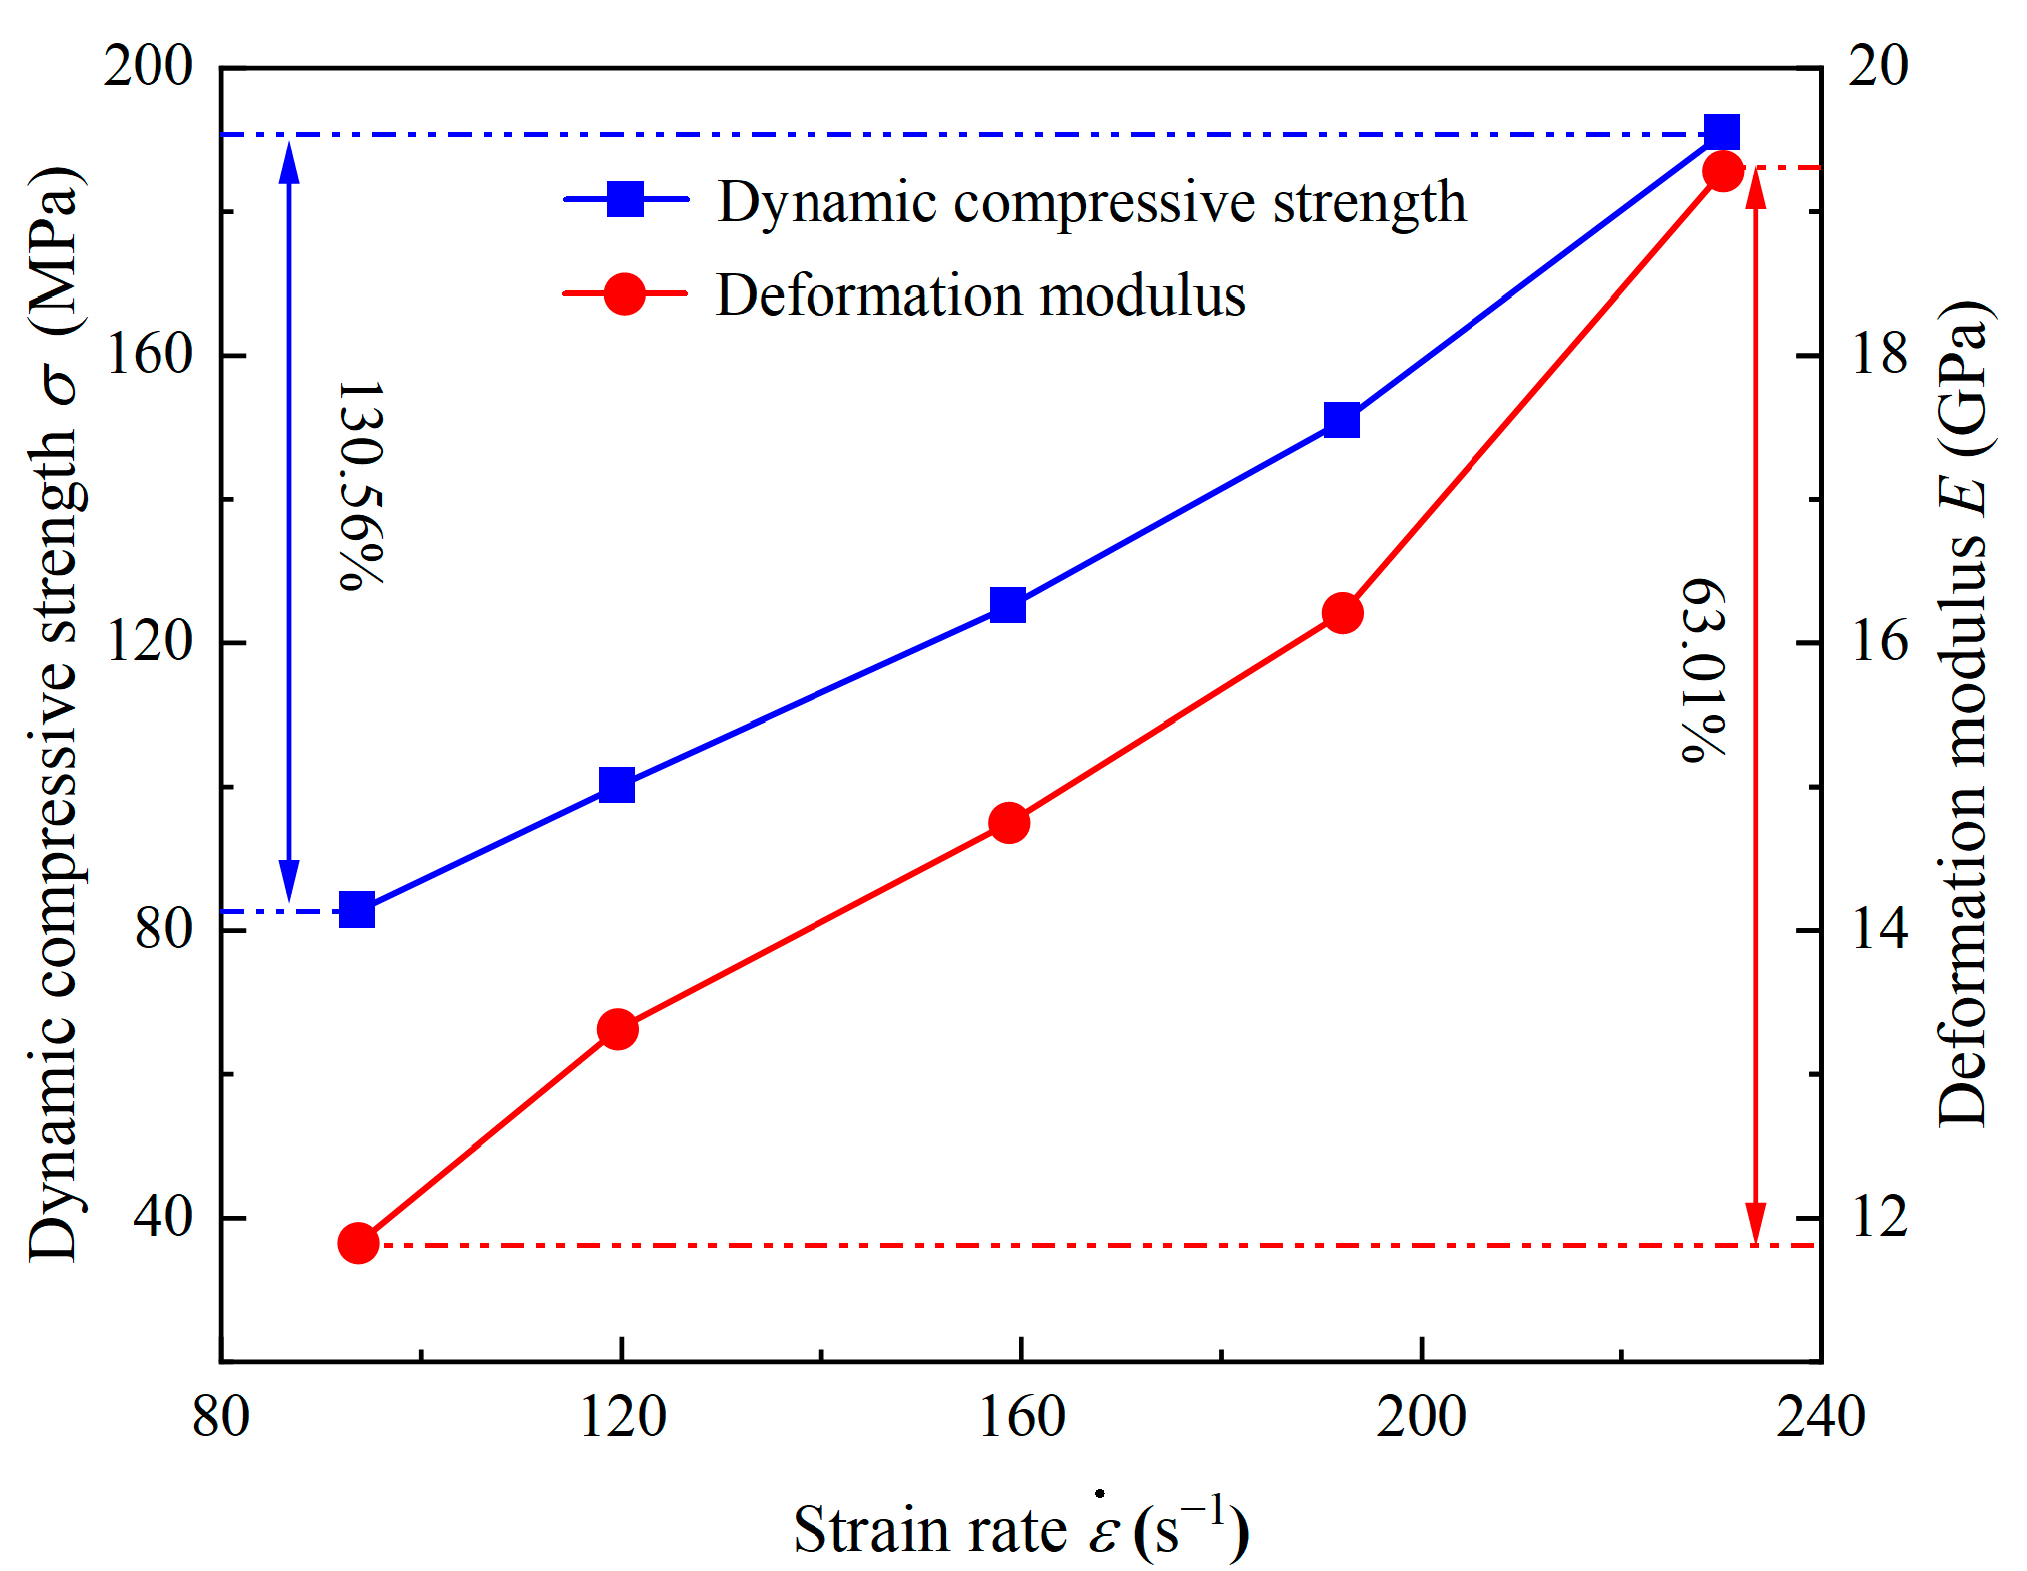
The dynamic strength and the deformation modulus of sandstone are available using the dynamic stress–strain curves (Figure 14). As the strain rate rises from 93.7 s−1 to 230.2 s−1, the peak stress progressively increases from 82.8 MPa to 190.9 MPa. From static tests, sandstone strength is 22.5 MPa, which indicates that the high strain rate significantly contributes to the sandstone strength. The deformation modulus is calculated by the ratio of the peak stress of the sandstone specimen to the strain at the peak stress. It is adopted to describe the sandstone deformation characteristics. The deformation modulus of sandstone increases from 11.8 GPa to 19.3 GPa as the strain rate rises from 93.7 s−1 to 230.2 s−1. Under impact loading conditions, sandstone specimens’ strength and deformation modulus have a similar variation trend, but the increased amplitude is different. Specifically, when the strain rate experiences the same variation range, the sandstone strength increases by 130.56%, while the deformation modulus of sandstone increases by 63.01%. Namely, the sandstone strength is more sensitive to strain rates than to deformation characteristics.
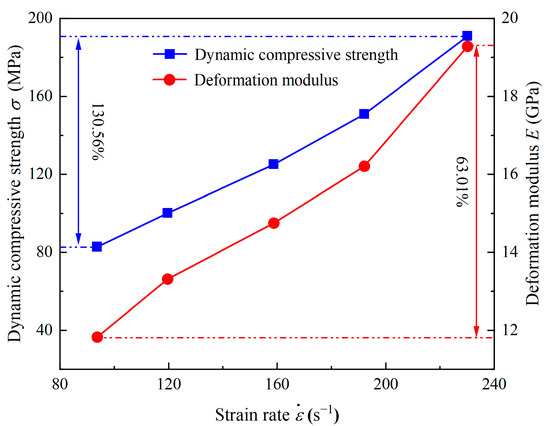
Figure 14.
Variation in dynamic strength and the deformation modulus of sandstone with strain rates.
3.2. Effects of Accumulated Damage on the Stress–Strain Curves
For the purpose of investigating the effects of accumulated damage on the dynamic behavior of sandstone under five kinds of similar strain rates, dynamic stress–strain curves of sandstone specimens at different strain rates and accumulated damages are first obtained, as shown in Figure 15. We use accumulated damage factors to distinguish the extent of the accumulated damage. The accumulated damage factor D ranges from 0 to 1. The larger the D, the higher the accumulated damage degree of the sandstone specimen, and the more the number of microscopic cracks. When D is closer to 1, these microscopic cracks are likely to show up in the form of larger macroscopic cracks.
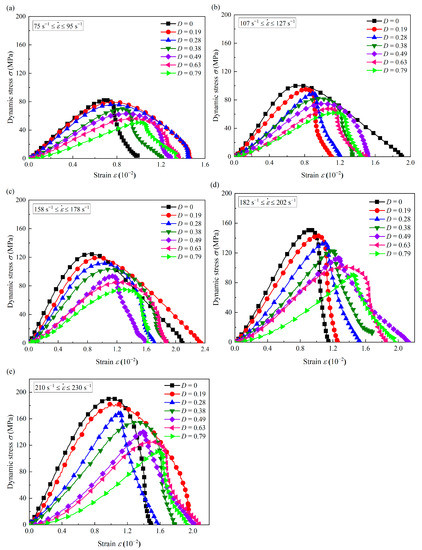
Figure 15.
Dynamic stress–strain curves of sandstone with different accumulated damages when strain rates between (a) 75 s−1 and 95 s−1, (b) 107 s−1 and 127 s−1, (c) 158 s−1 and 178 s−1, (d) 182 s−1 and 202 s−1, and (e) 210 s−1 and 230 s−1.
As described in the previous section, the stress–strain curves of sandstone specimens with accumulated damages at different strain rates reveal a certain similarity in the overall shape. The linear elastic phase, the plastic deformation phase, and the strain softening phase are well reflected in these stress–strain curves, indicating that their mechanical behaviors are similar. However, the initial phases show differences as the accumulated damage increases. Specifically, when the specimen has accumulated damage, the first phase in the stress–strain curve is no longer a linear elastic phase but a crack closure phase. In this phase, the stress–strain curves are nonlinear and tend to be concave.
The stress–strain curves of the sandstone at different strain rates when the accumulated damage is at its maximum are given in Figure 16. It is noticed that these stress–strain curves all have more obvious crack closure phases. More cracks in the sandstone specimens cause the appearance of the crack closure phase. When the accumulated damage factor is more significant, the accumulated damage degree of the specimen is greater, and the micro-cracks in the sandstone specimens gradually increase. These micro-cracks may produce macroscopic cracks visible to the naked eye due to the penetration. The increase in internal cracks leads to the crack closure phase of the samples in dynamic tests, and this stage will gradually grow longer with the increase in accumulated damage. Simultaneously, the high strain rate will profoundly impact the process, as evidenced by the fact that the initial crack closure phase of the sandstone specimens becomes progressively longer as the strain rate increases, which can be observed in Figure 15.

Figure 16.
Dynamic stress–strain curves of damaged sandstone at different strain rates.
3.3. Effects of Accumulated Damage on the Compressive Strength
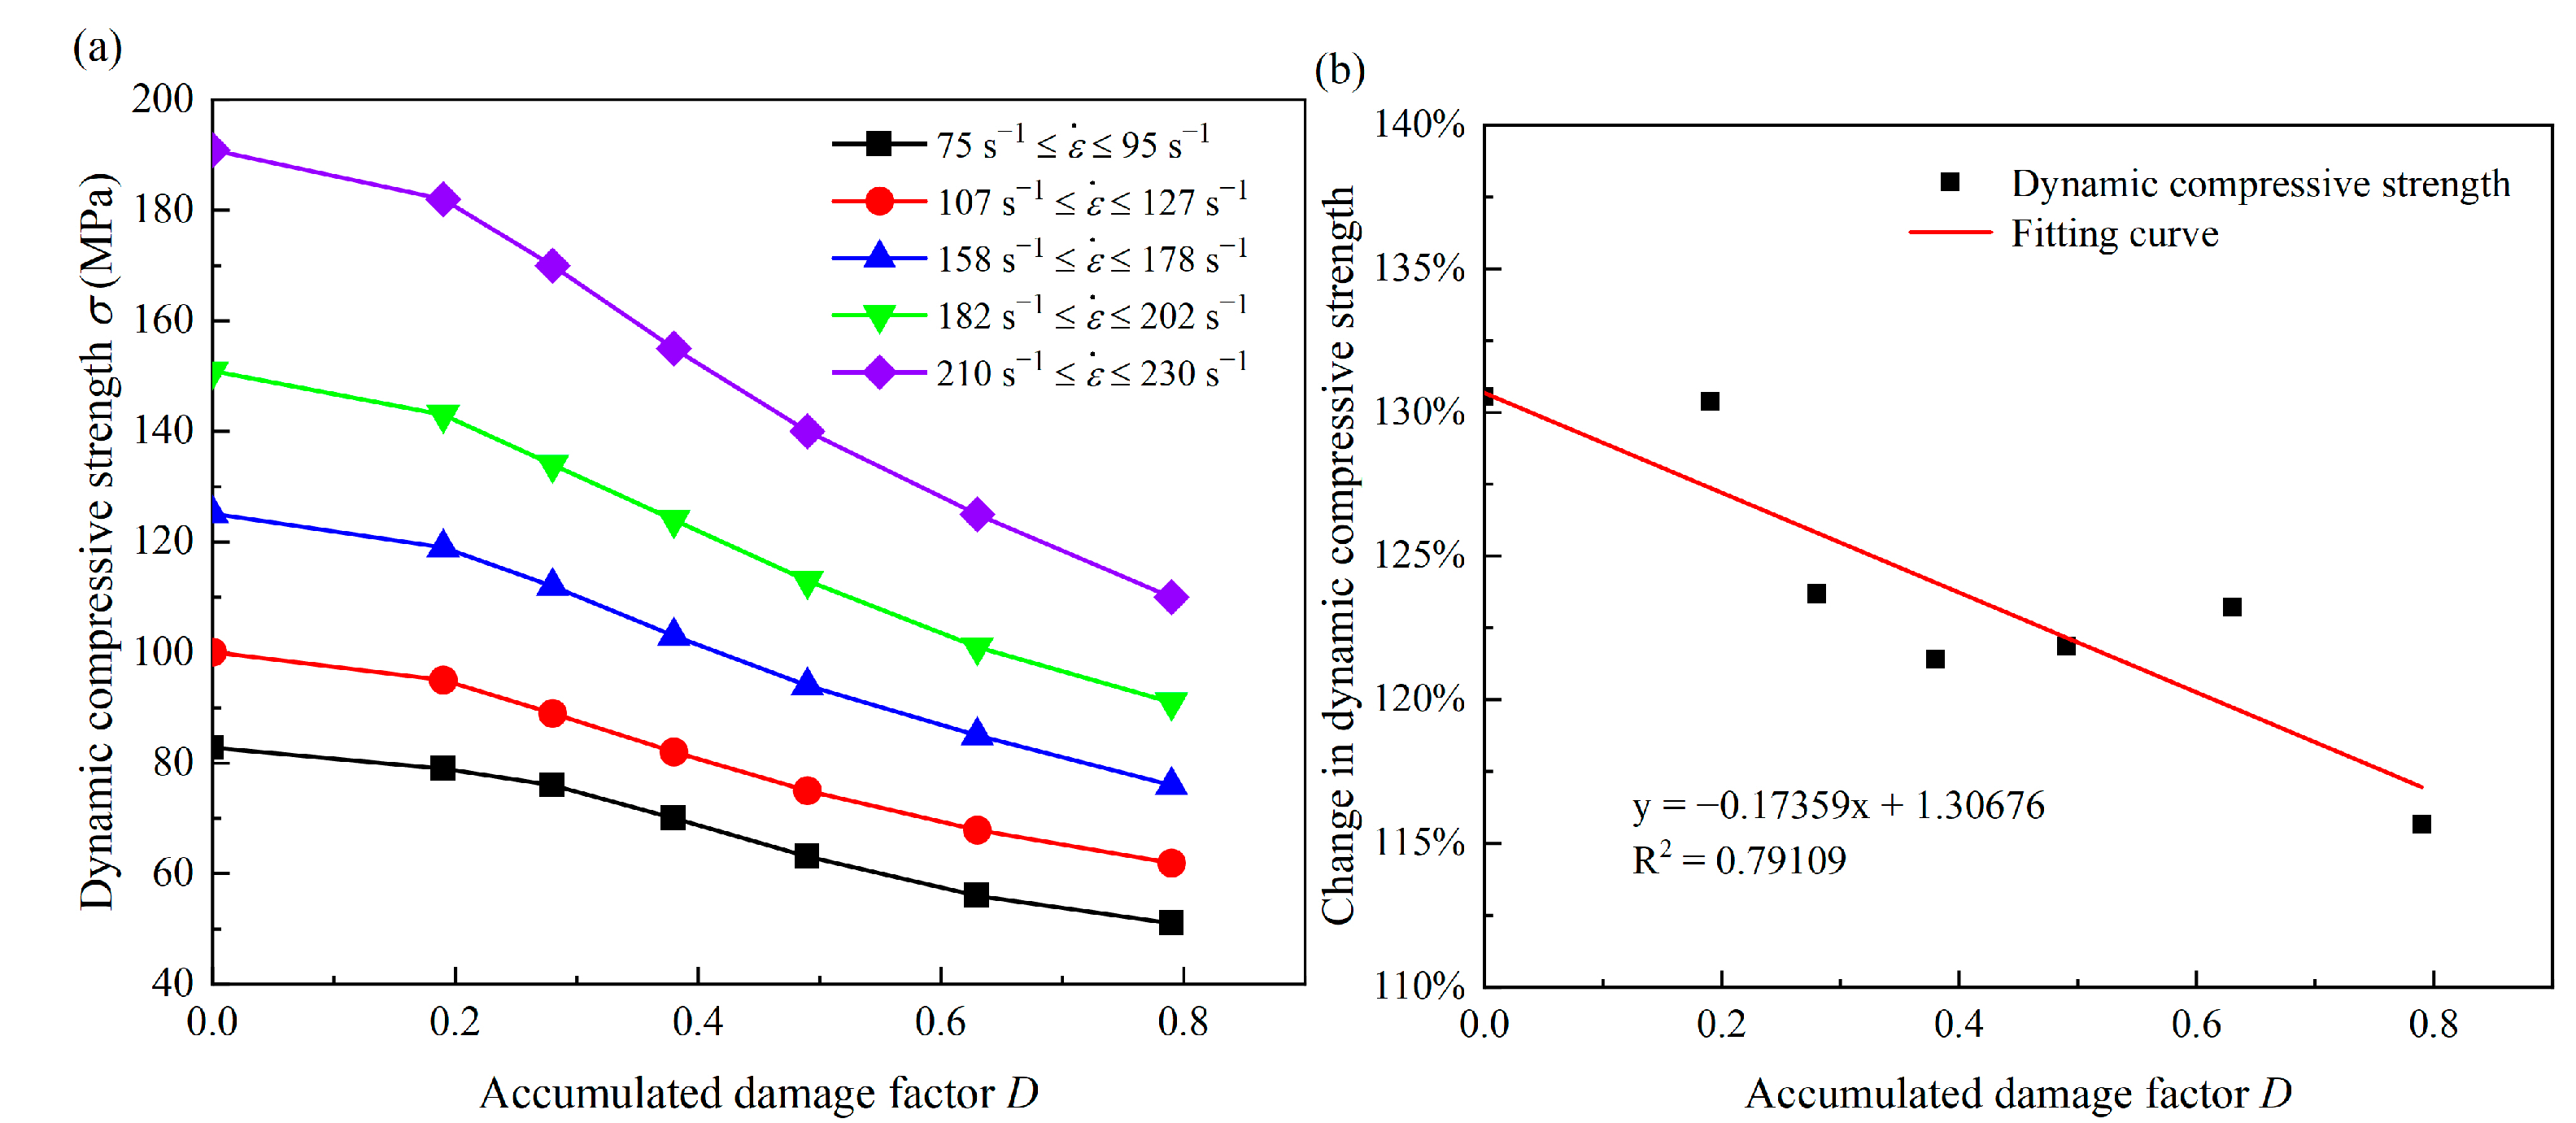
The effects of the strain rate and the accumulated damage on the dynamic compressive strength of sandstone are compared and investigated using the dynamic stress–strain curves of sandstone specimens in Figure 15. Figure 17 plots the variation in sandstone dynamic compressive strength at different strain rates and accumulated damage conditions and the increase factor of dynamic strength under the same accumulated damage factor. It can be seen that under each strain rate, the increase in the damage factor causes a gradual decrease in the dynamic compressive strength, suggesting that the accumulated damage inflicts excellent damage on the sandstone specimens. For instance, when the strain rate is the maximum, with the increase in the accumulated damage factor from 0 to 0.79, the dynamic compressive strength decreases from 190.9 MPa to 110.2 MPa, with a decrease of 42.3%. Another significant feature is that when D is less than 0.3, the dynamic compressive strength of sandstone with a similar strain rate decreases slowly. When D exceeds 0.3, the decreasing trend of the peak stress at a similar strain rate becomes more pronounced, indicating that the high strain rate will increase the change rate of sandstone strength. Furthermore, when the specimens experience the same accumulated damage, the dynamic compressive strength gradually rises with the increasing strain rate, suggesting that strain rate and the accumulated damage have an essential role in the sandstone behavior at the same time. The most likely explanation for the decrease in sandstone strength with the increasing damage factor is that the existence of accumulated damage leads to more micro-cracks. As loading proceeds, the transverse cracks in the sandstone specimens gradually close, while the vertical cracks continue to expand faster. These micro-cracks may also interpenetrate and eventually form macroscopic cracks, thus leading to a sharp reduction in the bearing capacity of sandstone. Therefore, the damage pattern of rock specimens is more likely to consist of two modes: tensile fracture and shear fracture. This situation is more evident under a high strain rate than in the quasi-static tests. Figure 17b exhibits how the increased amplitude of sandstone strength varies with the accumulated damage factor within the same range of strain rates. When the accumulated damage factor is 0, the higher impact velocity increases the sandstone peak stress by 130%, while the strength increases by 115% at a damage factor of 0.79. In other words, the increase in accumulated damage leads to a gradual reduction in the increased amplitude of sandstone strength at different strain rates.
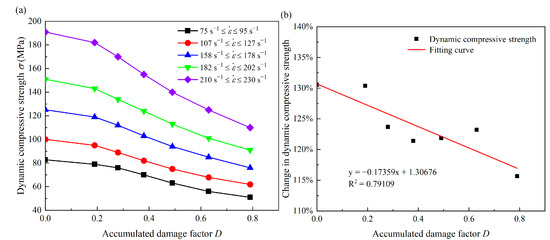
Figure 17.
Variation in (a) the dynamic compressive strength of sandstone and (b) change in sandstone strength with accumulated damage.
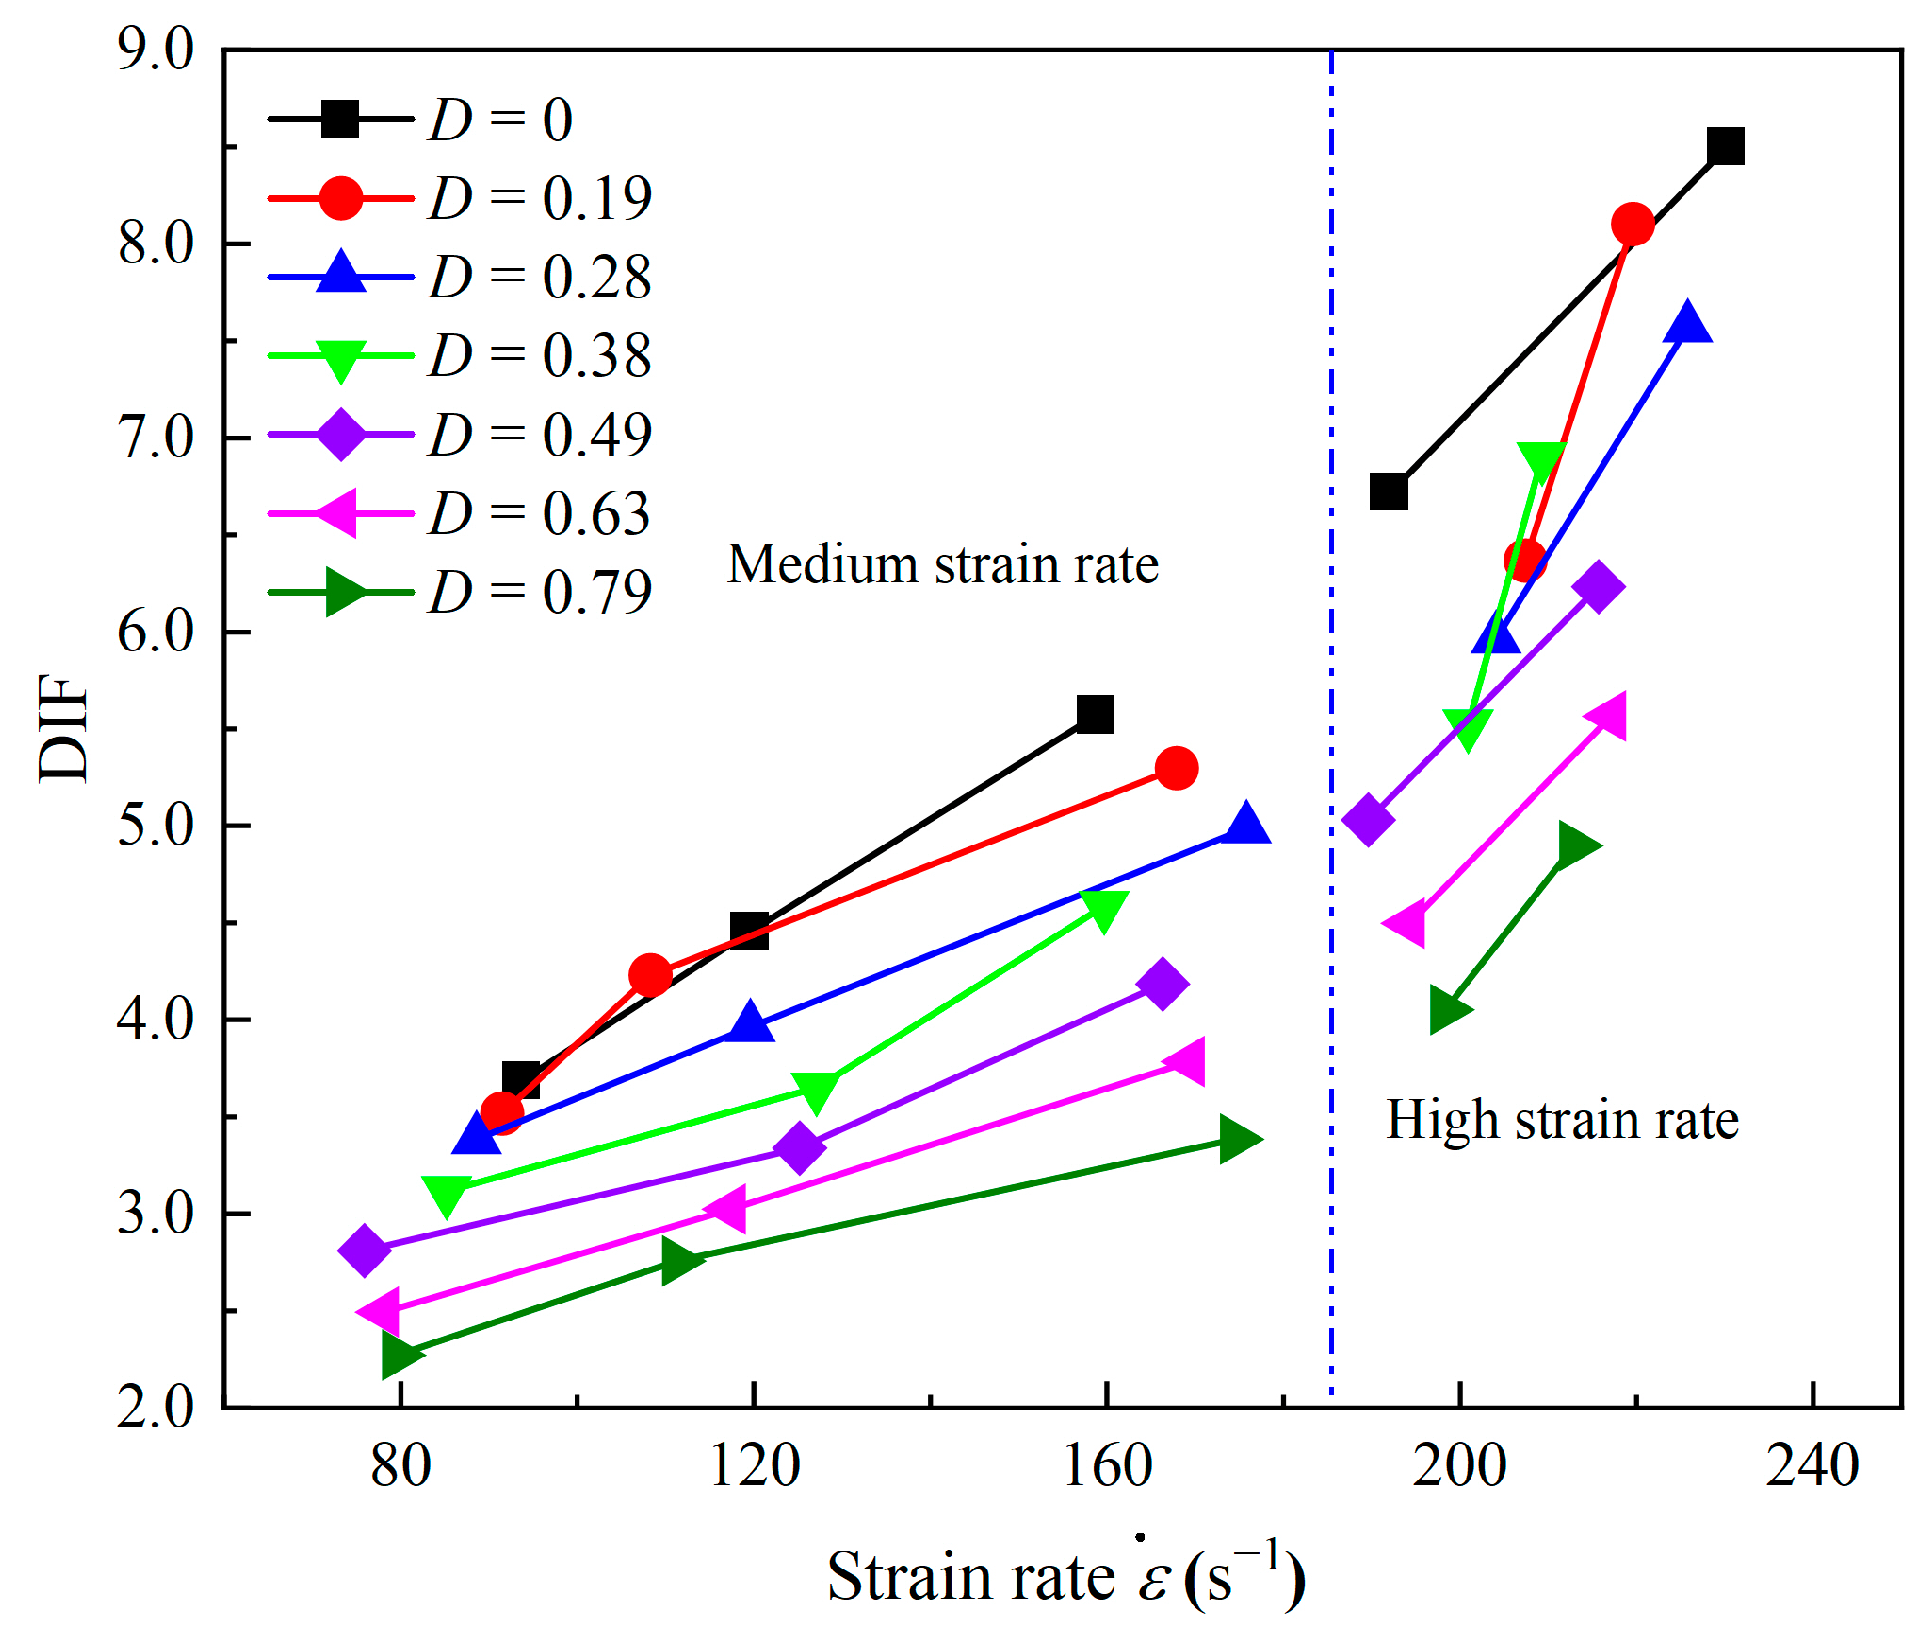
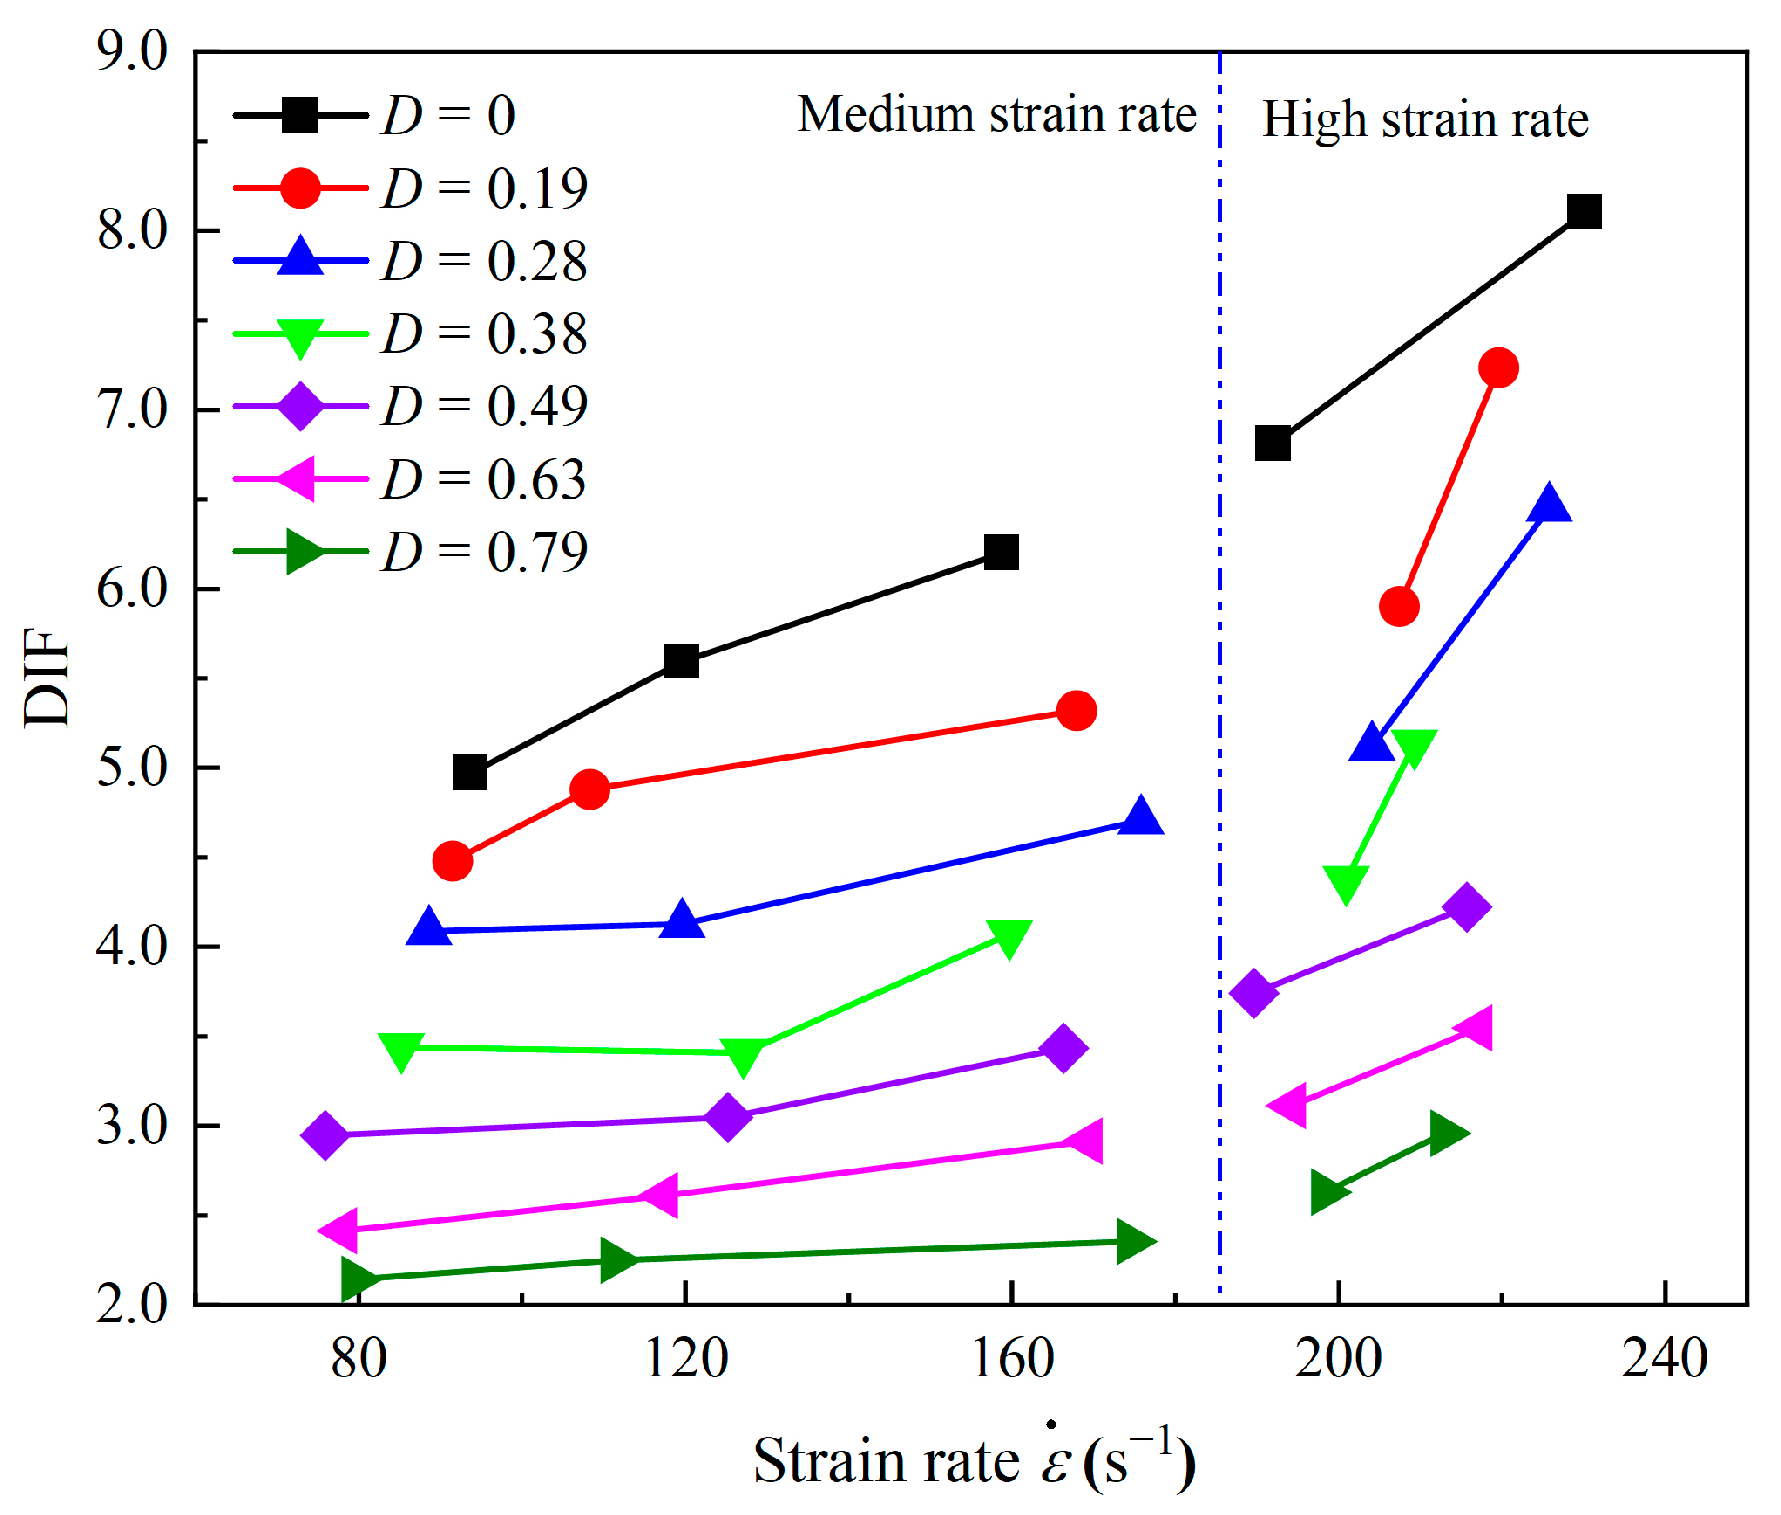
The dynamic increase factor is evaluated to compare the variability in sandstone’s dynamic strength and quasi-static strength. The DIF is defined as the ratio of the dynamic and quasi-static test values for sandstone, representing the increase in rock properties under impact load [9,44,49]. Figure 18 depicts the variation in the DIF with the strain rate. For each accumulated damage factor, the DIF is distinguished into the medium-strain-rate part and the high-strain-rate part. For the medium strain rate, the rate of increase of the DIF is significantly lower than that of the high strain rate. The accumulated damage reduces the influence of the strain rate on the DIF.
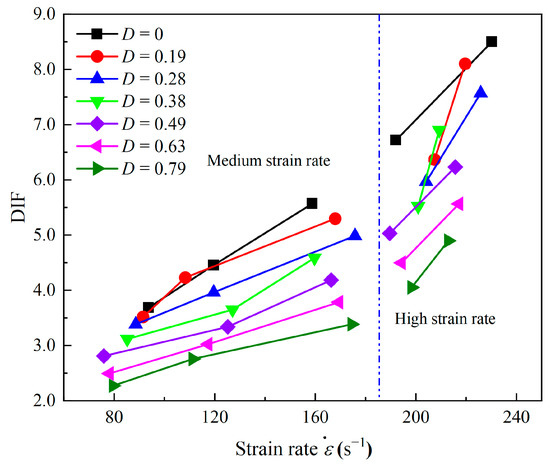
Figure 18.
Dynamic increase factor (DIF) of dynamic compressive strength.
3.4. Effects of Accumulated Damage on the Deformation Modulus
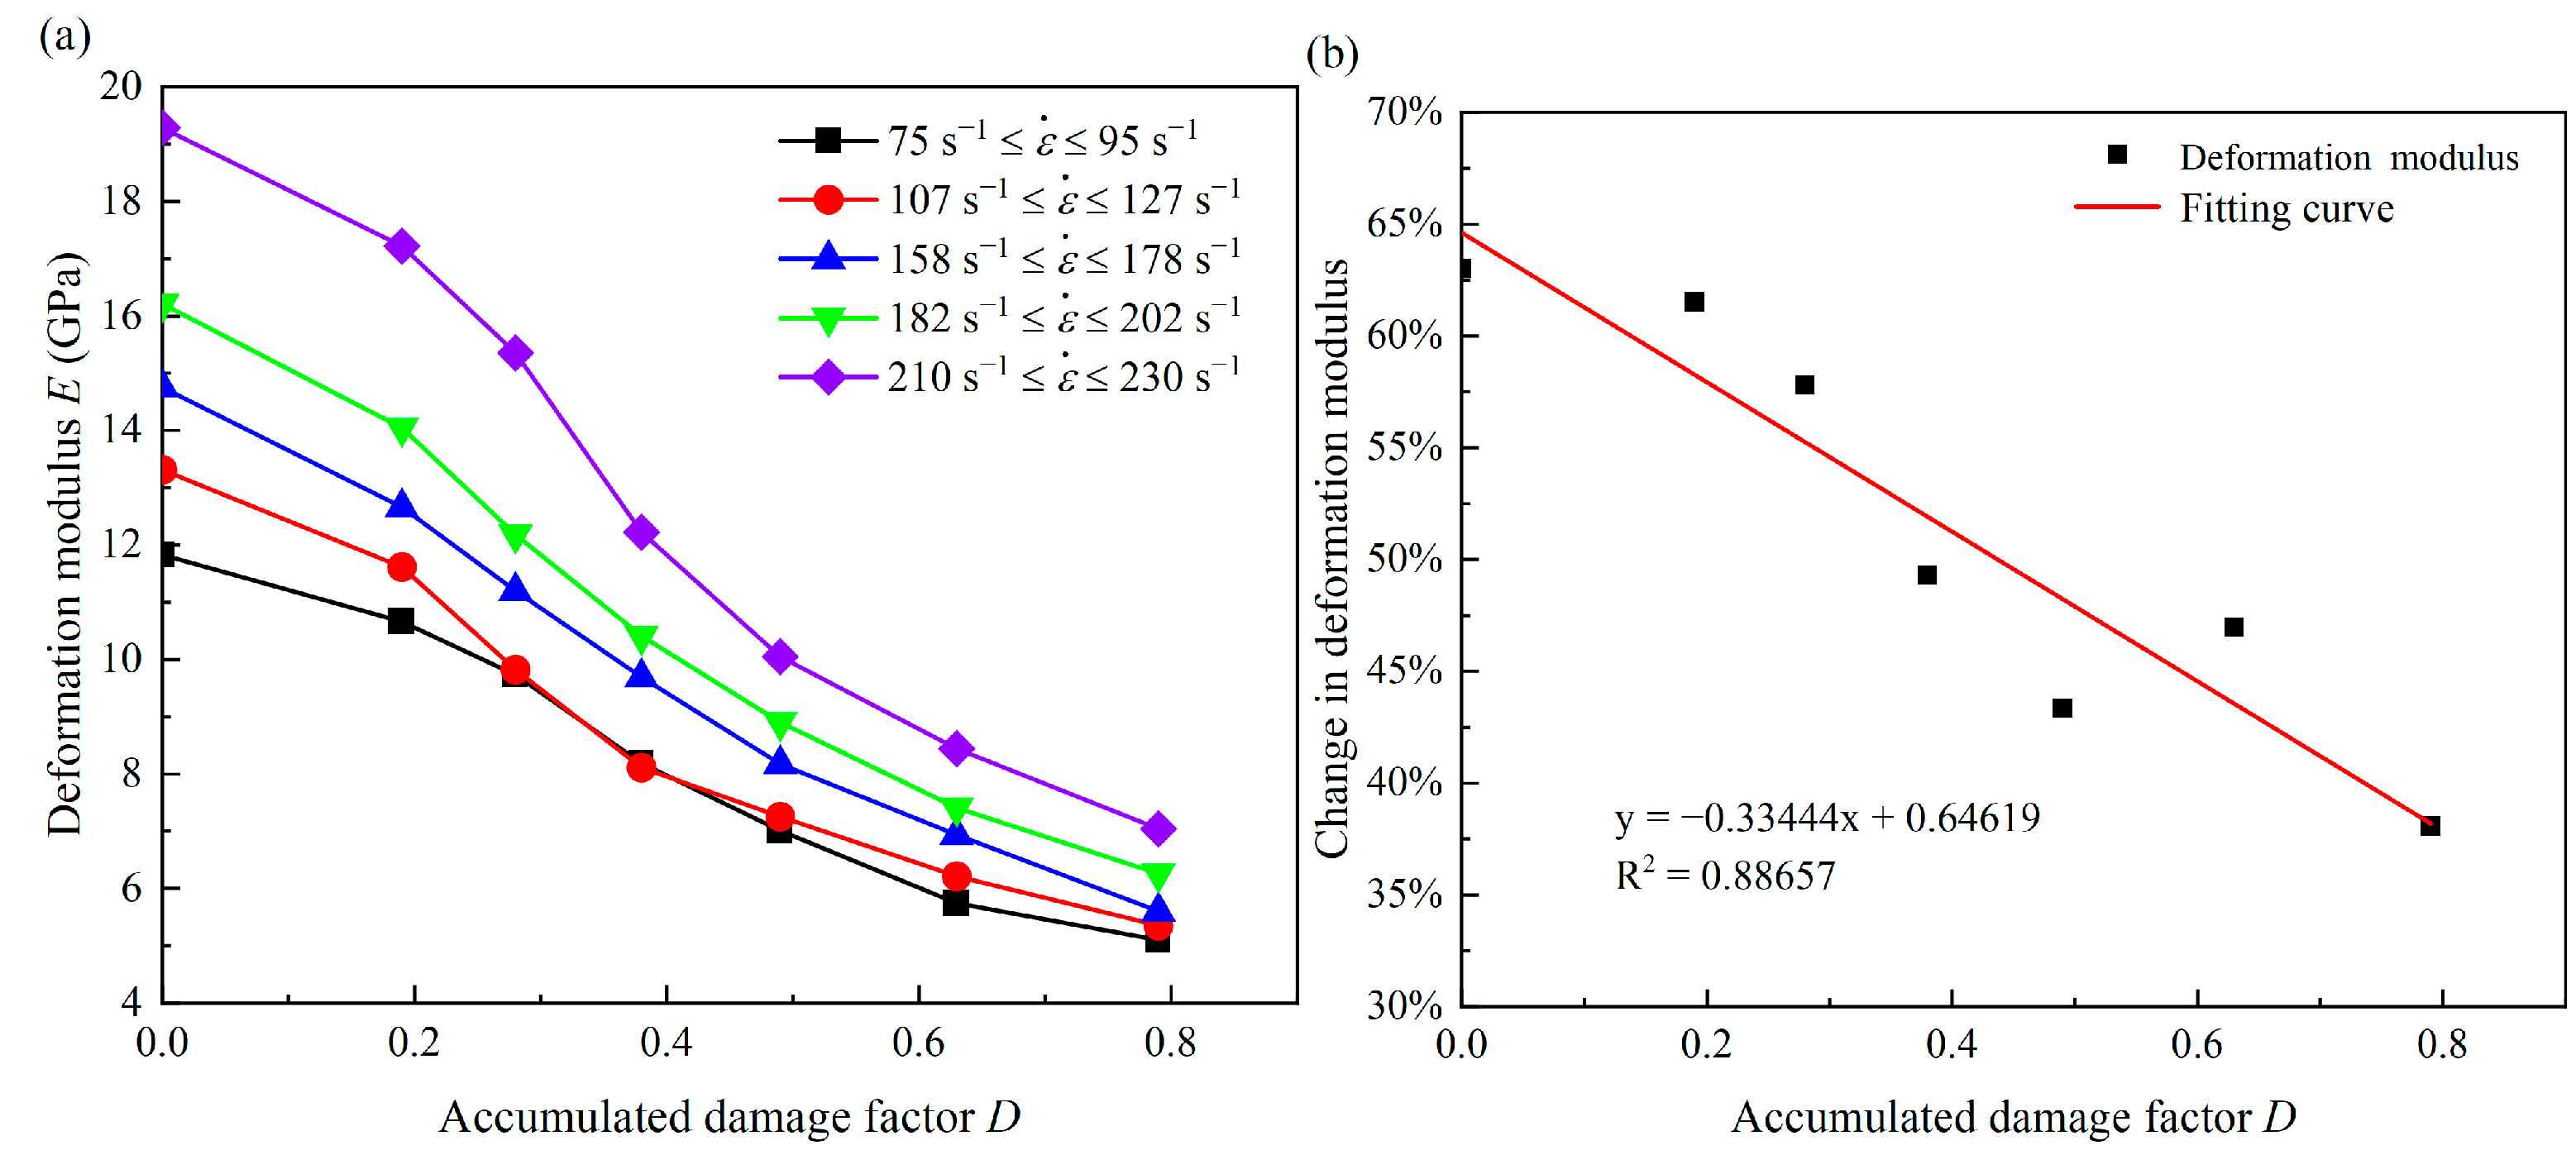
In addition to affecting the extreme bearing capacity of the sandstone, the accumulated damage also influences the ability of the specimens to resist deformation under high strain rates. The deformation modulus is defined as the ratio of dynamic peak strength to the corresponding critical strain. Figure 19 shows the variation in sandstone deformation modulus with different strain rates and accumulated damage. Generally speaking, the dynamic deformation modulus and compressive strength have similar forms. As the strain rate is approximately 220 s−1, with the accumulated damage factor increasing from 0 to 0.79, the deformation modulus of sandstone specimens decreases from 19.3 GPa to 7.1 GPa, with a decrease rate of 63.2%, which is more significant than the decrease rate of sandstone compressive strength under the same condition. However, when the strain rate is the lowest, the decrease in the deformation modulus becomes 56.8%, which implies that the strain rate causes a specific impact on the changing of the sandstone deformation modulus. Figure 19b shows how the increased amplitude of the sandstone deformation modulus varies with the accumulated damage factor within the same range of strain rates. When there is no accumulated damage to the sandstone specimen, the deformation modulus of sandstone increases by 63% as the strain rate turns from minimum to maximum. With the increase in the accumulated damage, the increase in the sandstone deformation modulus decreases. As the accumulated damage factor reaches 0.79, the growth in the sandstone deformation modulus decreases to 38%. The increased amplitude of the sandstone deformation modulus is reduced by almost 40% when the accumulated damage factor rises from 0 to 0.79, far more than that of compressive strength. It thus indicates that compared with the compressive strength, the deformation modulus of sandstone is more susceptible to accumulated damage.
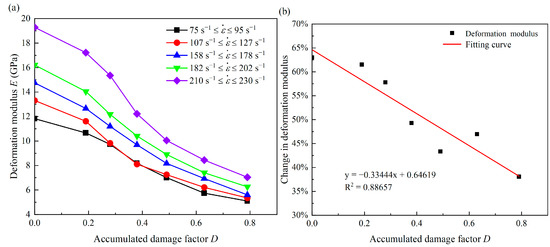
Figure 19.
Variation in (a) the deformation modulus of sandstone and (b) change in deformation modulus with accumulated damage.
Meanwhile, the DIF of the deformation modulus has also been calculated [44]. The deformation modulus increases remarkably along with the strain rate compared with the results of quasi-static tests. The increasing trend of the deformation modulus is similar to compressive strength and can also be divided into medium-strain-rate and high-strain-rate parts. When the samples do not experience accumulated damage, the DIF varies from 4.9 to 8.1. The DIF varies between 2.1 and 3.0 when the accumulated damage to the sandstone specimens is the largest (Figure 20).

Figure 20.
Dynamic increase factor (DIF) of the deformation modulus.
4. Deformation and Failure Modes of Coal Measures Sandstone
In addition to the quantitative properties of materials, rock failure behavior and fragment establishment are also essential to obtain the impacts of a high strain rate and accumulated damage on failure modes.
4.1. Macroscopic Failure Modes
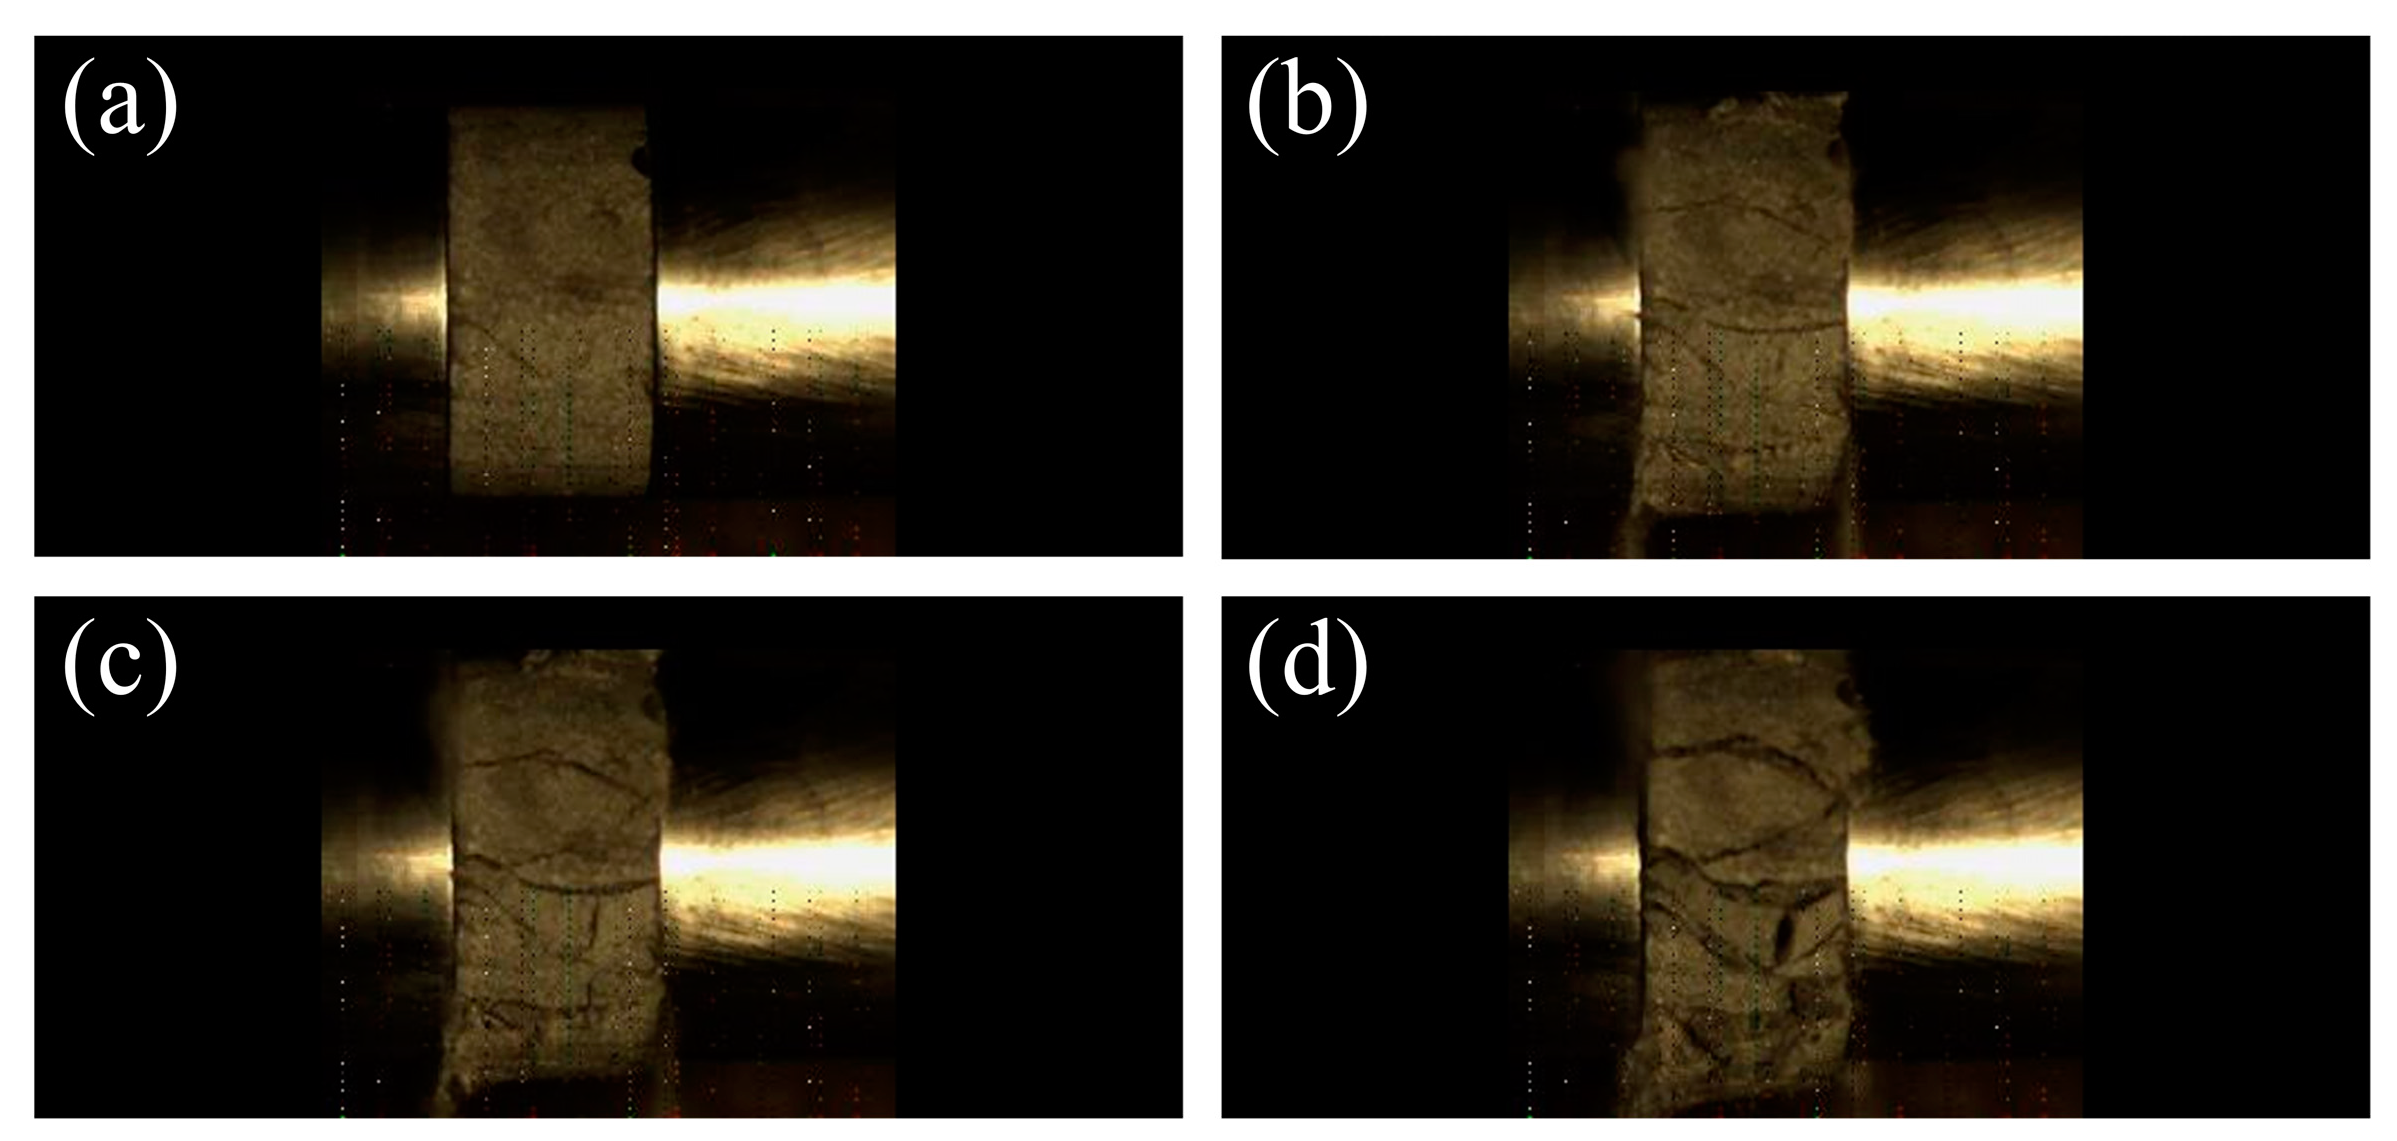
A high-speed camera is used to capture the process of testing sandstone specimens using the SHPB device. Figure 21 displays the failure states of a sandstone specimen in an experiment. The axial crack first appears on the specimen during the compressive test and gradually expands (Figure 21a). After that, some secondary cracks occur near the axial cracks, and most of the secondary cracks are shear cracks (Figure 21b,c). It is due to the reason that the specimen has accumulated damage before being subjected to impact load. The accumulated damage reduces the internal friction angle of the specimen, leading to shear failure. Finally, these cracks together cause the complete destruction of the sandstone specimen (Figure 21d).
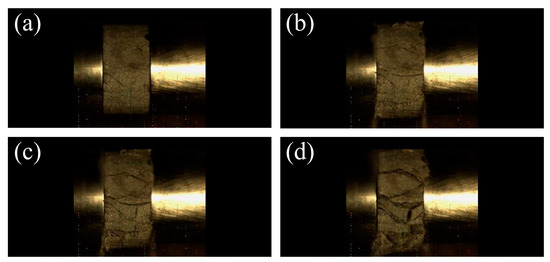
Figure 21.
Failure process of a sandstone specimen at 209.3 s−1: (a–d) represent four moments of failure in chronological order.
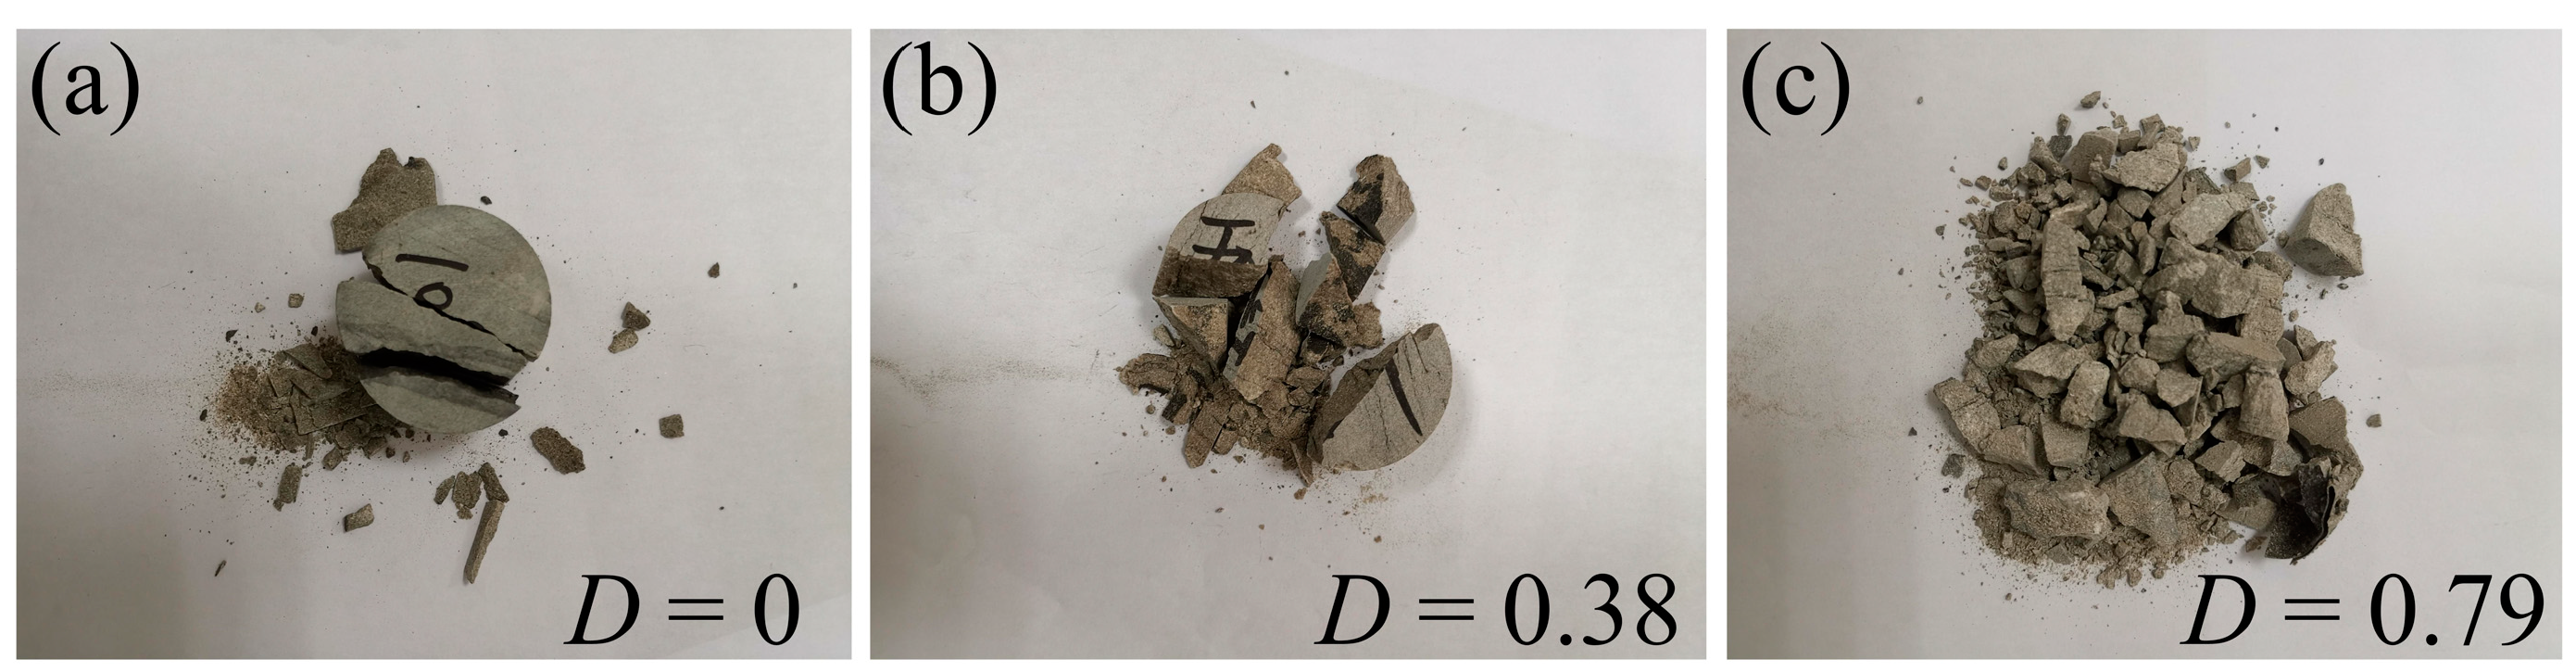
Figure 22 shows the fragments of sandstone specimens after dynamic tests at a similar strain rate. For compressive load, Figure 22 proves that the fragment sizes of specimens decrease significantly with increasing accumulated damage. Tensile fracture is dominant when the sandstone specimen has not experienced the initial accumulated damage. The failure of the specimen begins with the peeling of its peripheral radial part (Figure 22a). The fragments reveal multiple huge block shapes when the accumulated damage factor reaches 0.38, showing that the specimens are failing due to tensile and shear fracture, both of which contribute significantly to the eventual failure (Figure 22b). As the accumulated damage increases, the volume of the wedge-shaped block decreases gradually, smaller pieces appear, and the degree of the sandstone failure increases further (Figure 22c). The appearance of more wedge-shaped blocks represents that the angle between the fracture surface and the principal stress direction of sandstone samples increases gradually, which implies that the internal friction angle decreases gradually with the increase in the accumulated damage degree suffered by sandstone. Another possible reason for this failure pattern is that the increase in accumulated damage leads to more pores or micro-cracks in the sandstone, thus reducing the cohesion of sandstone specimens. In other words, the failure mode of sandstone under impact load depends not only on the high strain rate but also on the cohesion and the internal friction angle. In general, compressive failure is characterized by the cracks expanding along the axial direction of the specimen until the specimen is destroyed. The raised strain rate causes overall particle fragmentation failure to occur in the specimens. Furthermore, because of the accumulated damage, the rock particles are destroyed many times, resulting in the formation of fine-grained powder.
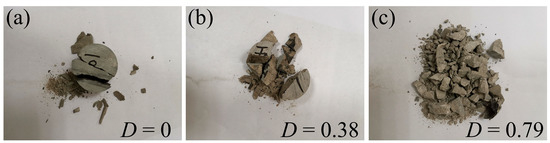
Figure 22.
Fragment establishment of sandstone specimens with different accumulated damages: (a) D = 0, (b) D = 0.38, and (c) D = 0.79.
4.2. Microscopic Failure Modes
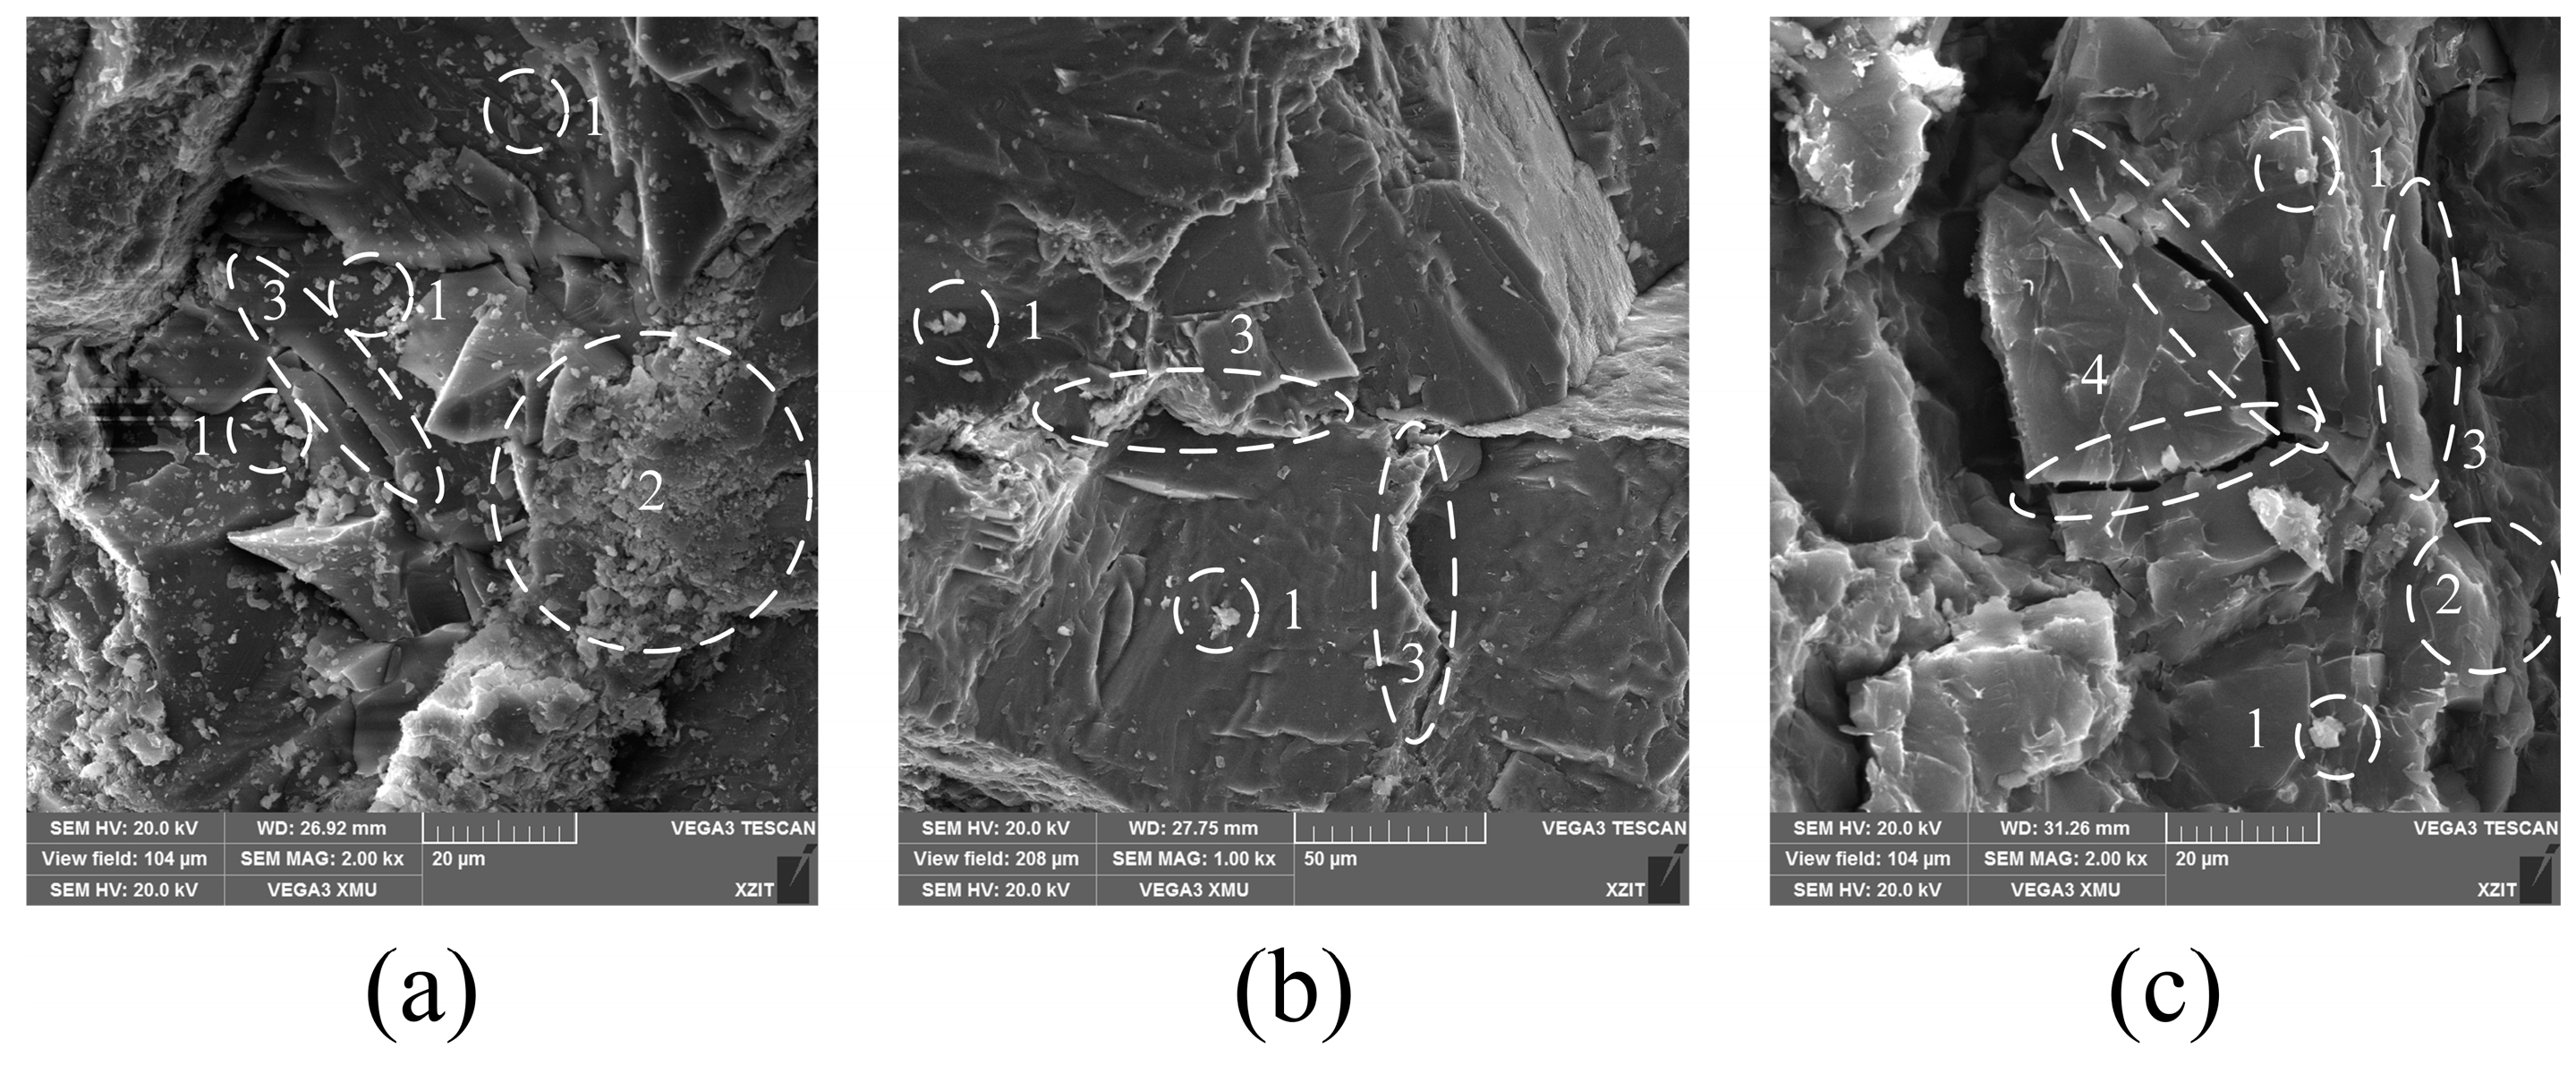
The microscopic morphology of sandstone after dynamic failure is observed by the SEM test system. Figure 23 shows the micromorphological characteristics of sandstone specimens with accumulated damage before and after dynamic tests.
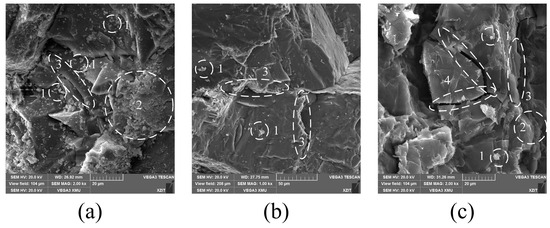
Figure 23.
The microscopic failure characteristics of sandstone with accumulated damage: (a) sandstone specimen not subjected to impact load; (b) sandstone specimen at a low impact velocity; (c) sandstone specimen at a high impact velocity (1: tiny mineral particles; 2: rough surface; 3: intergranular fracture; 4: transgranular fracture).
It can be seen that there are many tiny mineral particles and some rough portions on the surface of the sandstone specimen with accumulated damage but not subjected to impact load (Figure 23a). The existence of accumulated damage also causes intergranular fracture in the sandstone specimen. When the sandstone specimen is coupled with a low strain rate and accumulated damage, the sandstone failure surface is relatively comparable to that of the specimen not subjected to impact load. However, more intergranular fractures appear (Figure 23b). When the sandstone specimen suffers a greater strain rate, a new failure mode, transgranular fracture, is exhibited on the failure surface of the sandstone (Figure 23c). In other words, accumulated damage mainly causes intergranular fracture between the mineral particles, while a higher strain rate mainly causes transgranular fracture inside the mineral particles.
4.3. Energy Absorption Law
In order to understand the energy absorption law of sandstone samples, the specific energy absorption (SEA) factor is calculated [50].
where , , and are the energy of the relevant waves; , , and are the cross-sectional area, the longitudinal wave velocity, and the elastic modulus of the incident bar and the transmission bar, respectively; , , and are the relevant stress signals; is the energy absorbed by the sandstone specimen; and is the specimen volume. Finally, the SEA factor can be figured out according to Equation (4).
We assume that the stress wave is completely transmitted during the experiment, indicating that there is no energy loss at the interface between the specimens and the bar system. Thus, energy absorption factors of sandstone under different accumulated damages and strain rates are calculated, as shown in Figure 24. The results demonstrate that an increase in the strain rate can significantly enhance the value of the energy absorption factor. Further, the accumulated damage also increases the value of the energy absorption factor. The results correspond to the macro- and micro-failure patterns. When the strain rate and the accumulated damage reach a higher level, the sandstone specimen absorbs more energy. As a result, the failure mode of sandstone is manifested in the appearance of more and smaller wedge-shaped blocks. Due to the repeated destruction of sandstone specimens, many powdery sandstone particles will appear. Sandstone specimens absorb more energy at a microscopic level, leading to a gradual shift in the sandstone failure mode from intergranular to transgranular fracture.
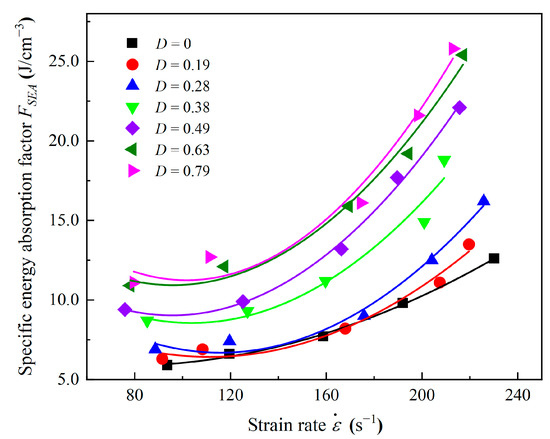
Figure 24.
Specific energy absorption factors of sandstone.
5. Statistical Damage Constitutive Model Considering the Strain Rate Effect and the Accumulated Damage
Based on the Weibull distribution, a statistical damage constitutive model of coal measures sandstone is proposed by considering the accumulated damage and the strain rate effect.
5.1. Statistical Damage Constitutive Model
It is generally accepted that rock failure begins with internal micro-cracks, and with the increase in the external load, the micro-cracks gradually expand to macroscopic cracks, eventually leading to rock failure. Damage evolution of rock leads to the degradation of elasticity [51]. Assuming that [50,51] (1) the intact rock is a homogeneous and isotropic material; (2) each mesoscopic microelement of the rock is continuous and elastic before destruction; and (3) the rock intensity obeys the Weibull distribution, the probability distribution function is expressed by Equation (5):
where F denotes the strength of the rock material microelement, F0 denotes the mean value, and m denotes the shape parameter or uniformity index representing the microelement. Tang [52]
points out that the larger the m, the higher will be the material uniformity.
From strain strength theory [53], F in the above formula can be replaced by ε, so Equation (5) changes to:
The rock damage variable D is specified as the ratio of the number of failure microelements and the number of all microelements N in the rock [51]. Then, the expression of the damage variable is:
When the load on the rock increases from σ to , the number of failure microelements increases to . Therefore, when the external load increases from 0 to σ, the total number of failure microelements is:
Substituting Equation (8) into Equation (7) yields:
At this point, the damage factor D is caused by the loads on the rock and its value varies from 0 to 1. and m refer to the proportion parameter and the shape parameter of rock materials, respectively. According to Wang et al. [51], when m is the same, D increases as increases. When the stress level is the same, the greater the m, the earlier the appearance of the complete damage.
Based on the Lemaitre strain equivalence hypothesis [54,55], the deformation modulus of damaged materials is:
where denotes the deformation modulus of the damaged rock and denotes the deformation modulus of the undamaged rock.
However, after the sandstone specimen has experienced accumulated damage, some micro-cracks have already appeared within the rock before the dynamic tests, which makes the deformation modulus of the sandstone specimen with accumulated damage different from that of the non-damaged specimen. Assume that the accumulated damage factor is . At the same time, the stress–strain curves of the sandstone specimens that have experienced accumulated damage show an obvious crack closure stage, which is significantly different from that of the complete sandstone specimens. From the analysis in the previous section, the existence of accumulated damage gradually reduces the internal friction angles and cohesion of the sandstone specimens. Therefore, is defined as the accumulated damage correction coefficient to represent the characteristics closely related to the reduction in cohesion and internal friction angles caused by accumulated damages. The parameters a and b represent the shape coefficients of the stress–strain curves. The actual damage deformation modulus of the specimen after experiencing accumulated damage is then expressed by the following equation:
Therefore, the stress–strain relationship of the specimen with accumulated damage is given by:
Substituting Equation (9) into Equation (12) yields the statistical damage constitutive model considering accumulated damage:
Parameters a, b, , and m in Equation (13) are all functions of strain rate, which are given by:
Substituting Equation (14) into Equation (13) yields the statistical damage constitutive model considering the accumulated damage and the strain rate effect:
5.2. Sensitivity Analysis of Parameters
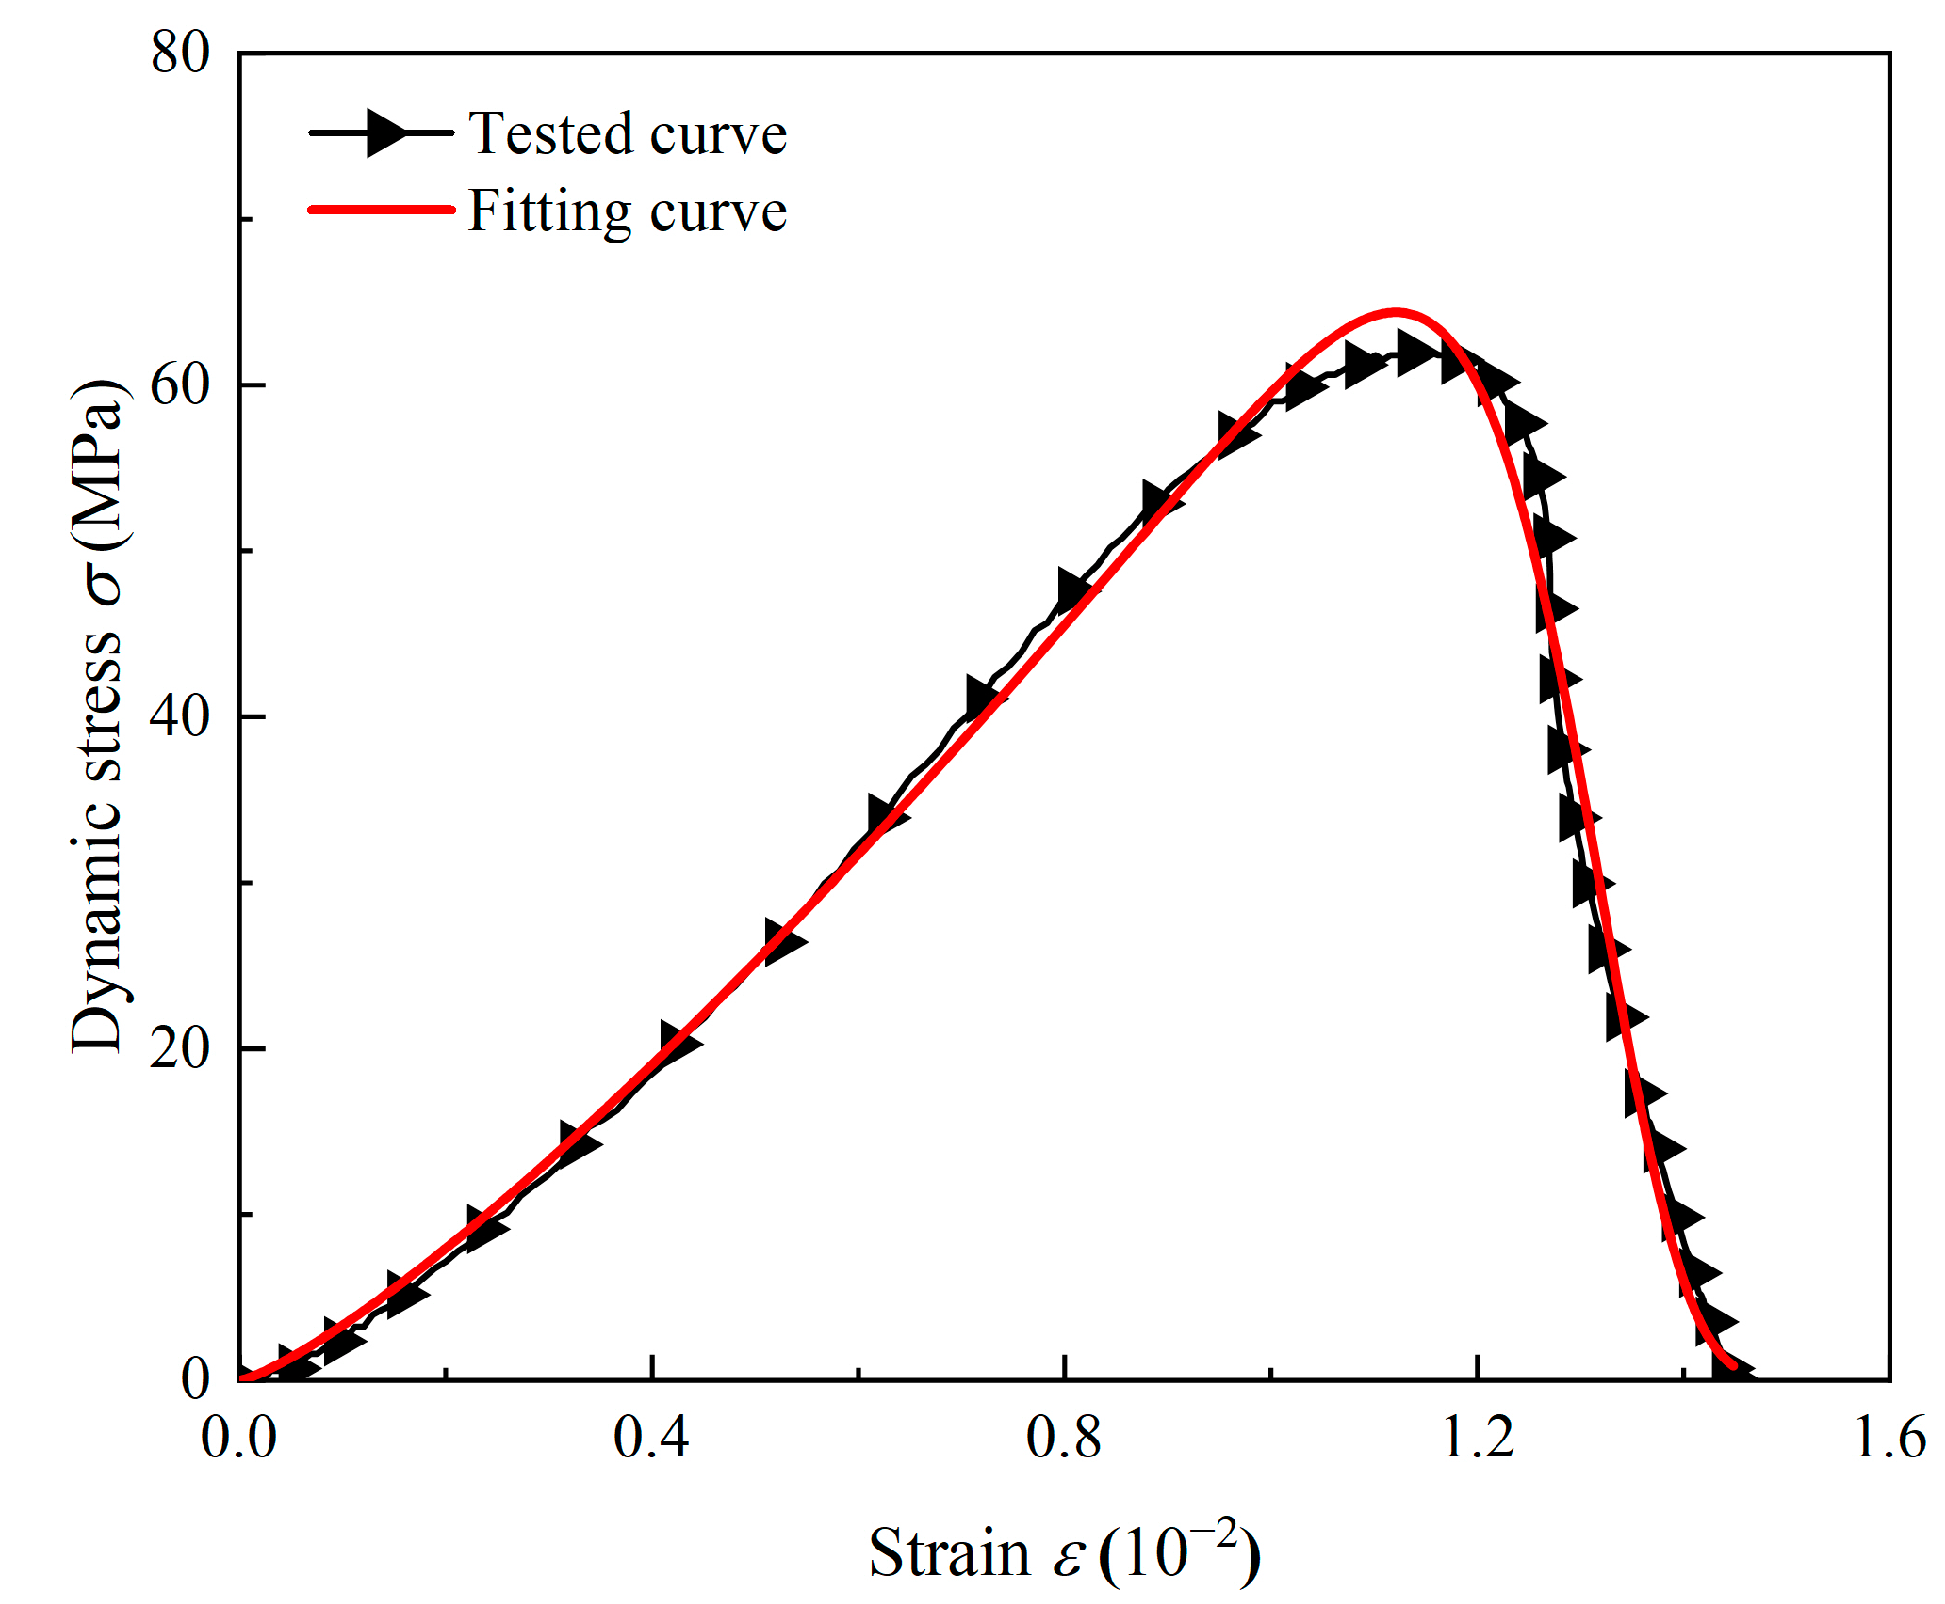
The sandstone stress–strain curve with the accumulated damage of 0.79 and the strain rate of 111.3 s−1 is selected for the comparative study of parameter sensitivity. The experimental data are fitted using the constitutive model in the previous section, and the fitted curve is provided in Figure 25. The values of the four fitting parameters in the constitutive model can be obtained as follows:
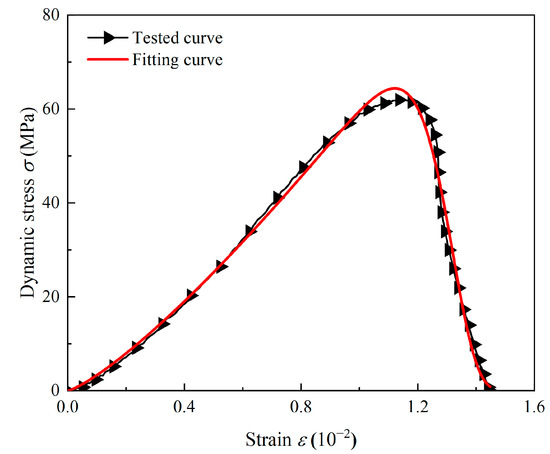
Figure 25.
Comparison of tested and fitting stress–strain curves.
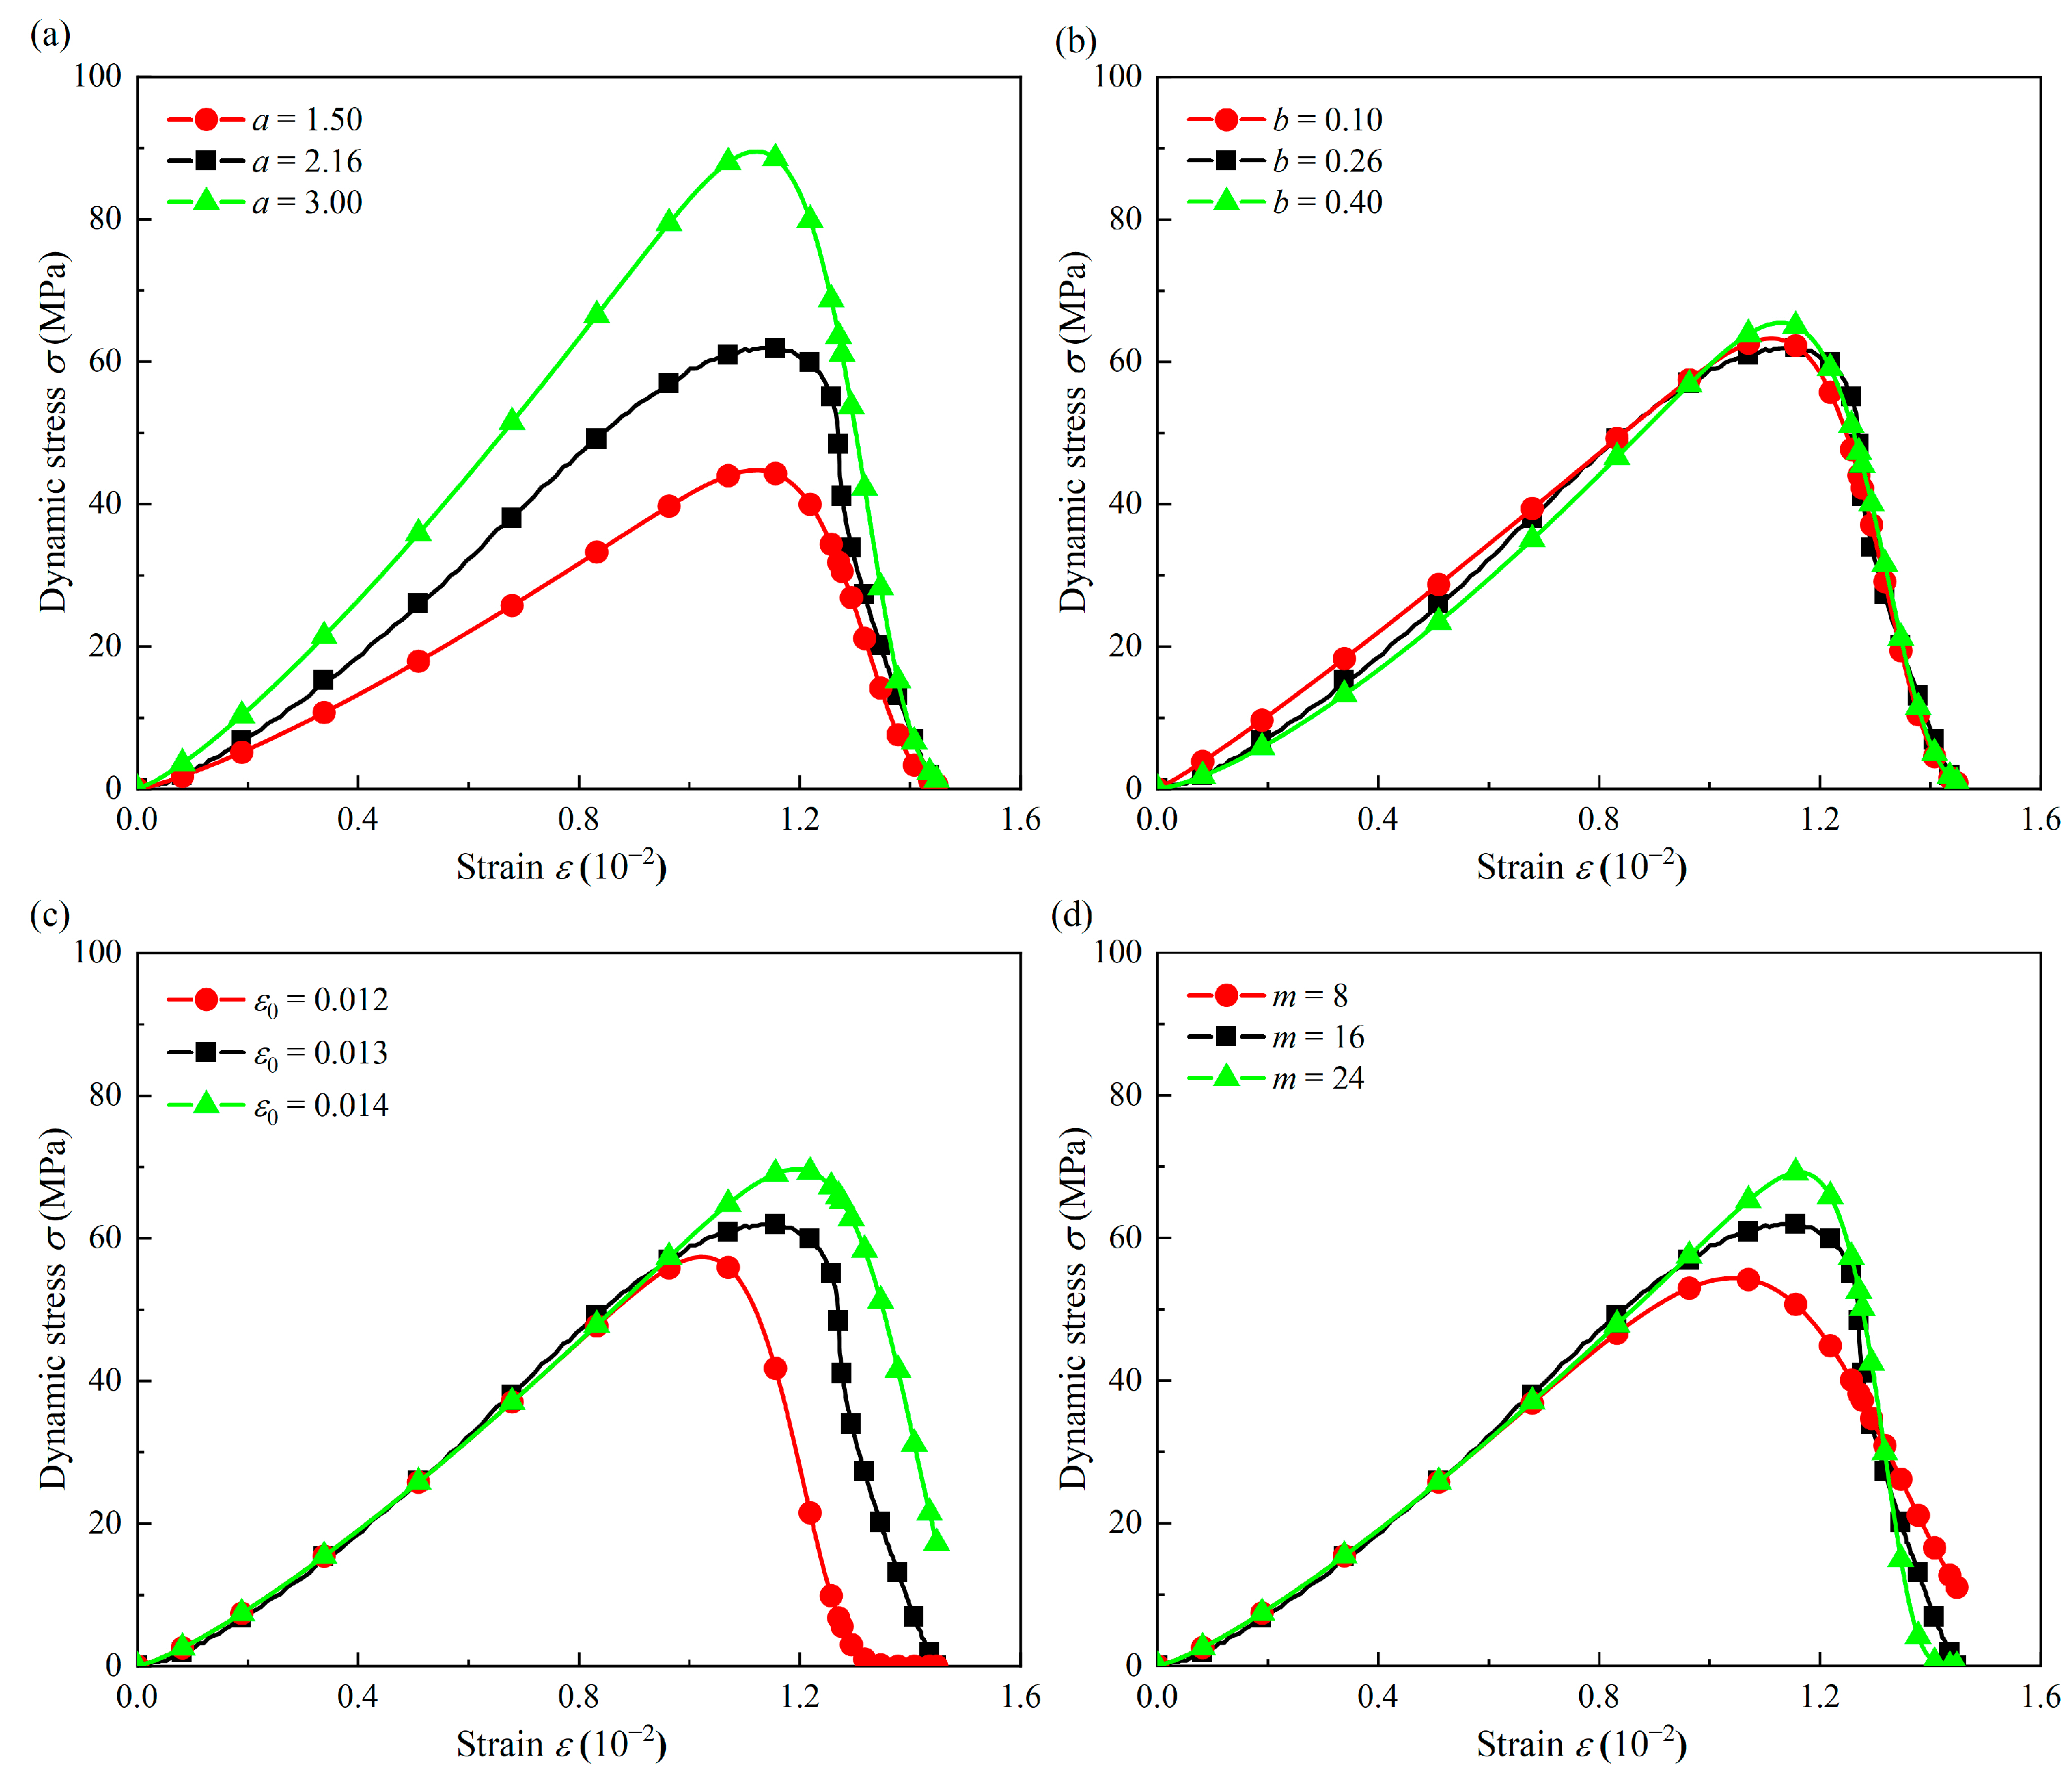
When parameter a is set to 1.50, 2.16, and 3.00, three different stress–strain curves are shown in Figure 26a. The graph reveals that parameter a mainly affects the peak stress of curves. The larger the value of parameter a, the greater the peak stress, thus increasing the deformation modulus. Figure 26b shows three kinds of stress–strain curves as parameter b is 0.10, 0.26, and 0.40, respectively. The value of parameter b mainly affects the pre-peak phases. The greater the value of parameter b, the more pronounced the crack closure stage, which indicates that the value of parameter b is affected by accumulated damage. Figure 26c gives the stress–strain curves with different values of . It can be seen that parameter has a significant effect on the peak stress and the corresponding peak strain in the stress–strain curve. The larger the , the greater the peak stress and the corresponding peak strain. From Figure 26d, parameters m and have a similar effect. They all have a specific effect on the peak stress and the corresponding peak strain. However, the difference is that the existence of parameter m makes the post-peak phases change significantly, and it changes the shape of the curves. The larger the value of m, the steeper the falling phases.
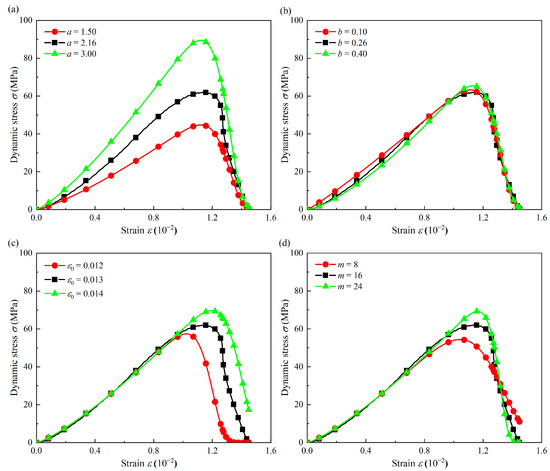
Figure 26.
Effects of model parameters on the stress–strain curve: (a) parameter a; (b) parameter b; (c) parameter ; (d) parameter m.
5.3. Validation and Discussion of the Model
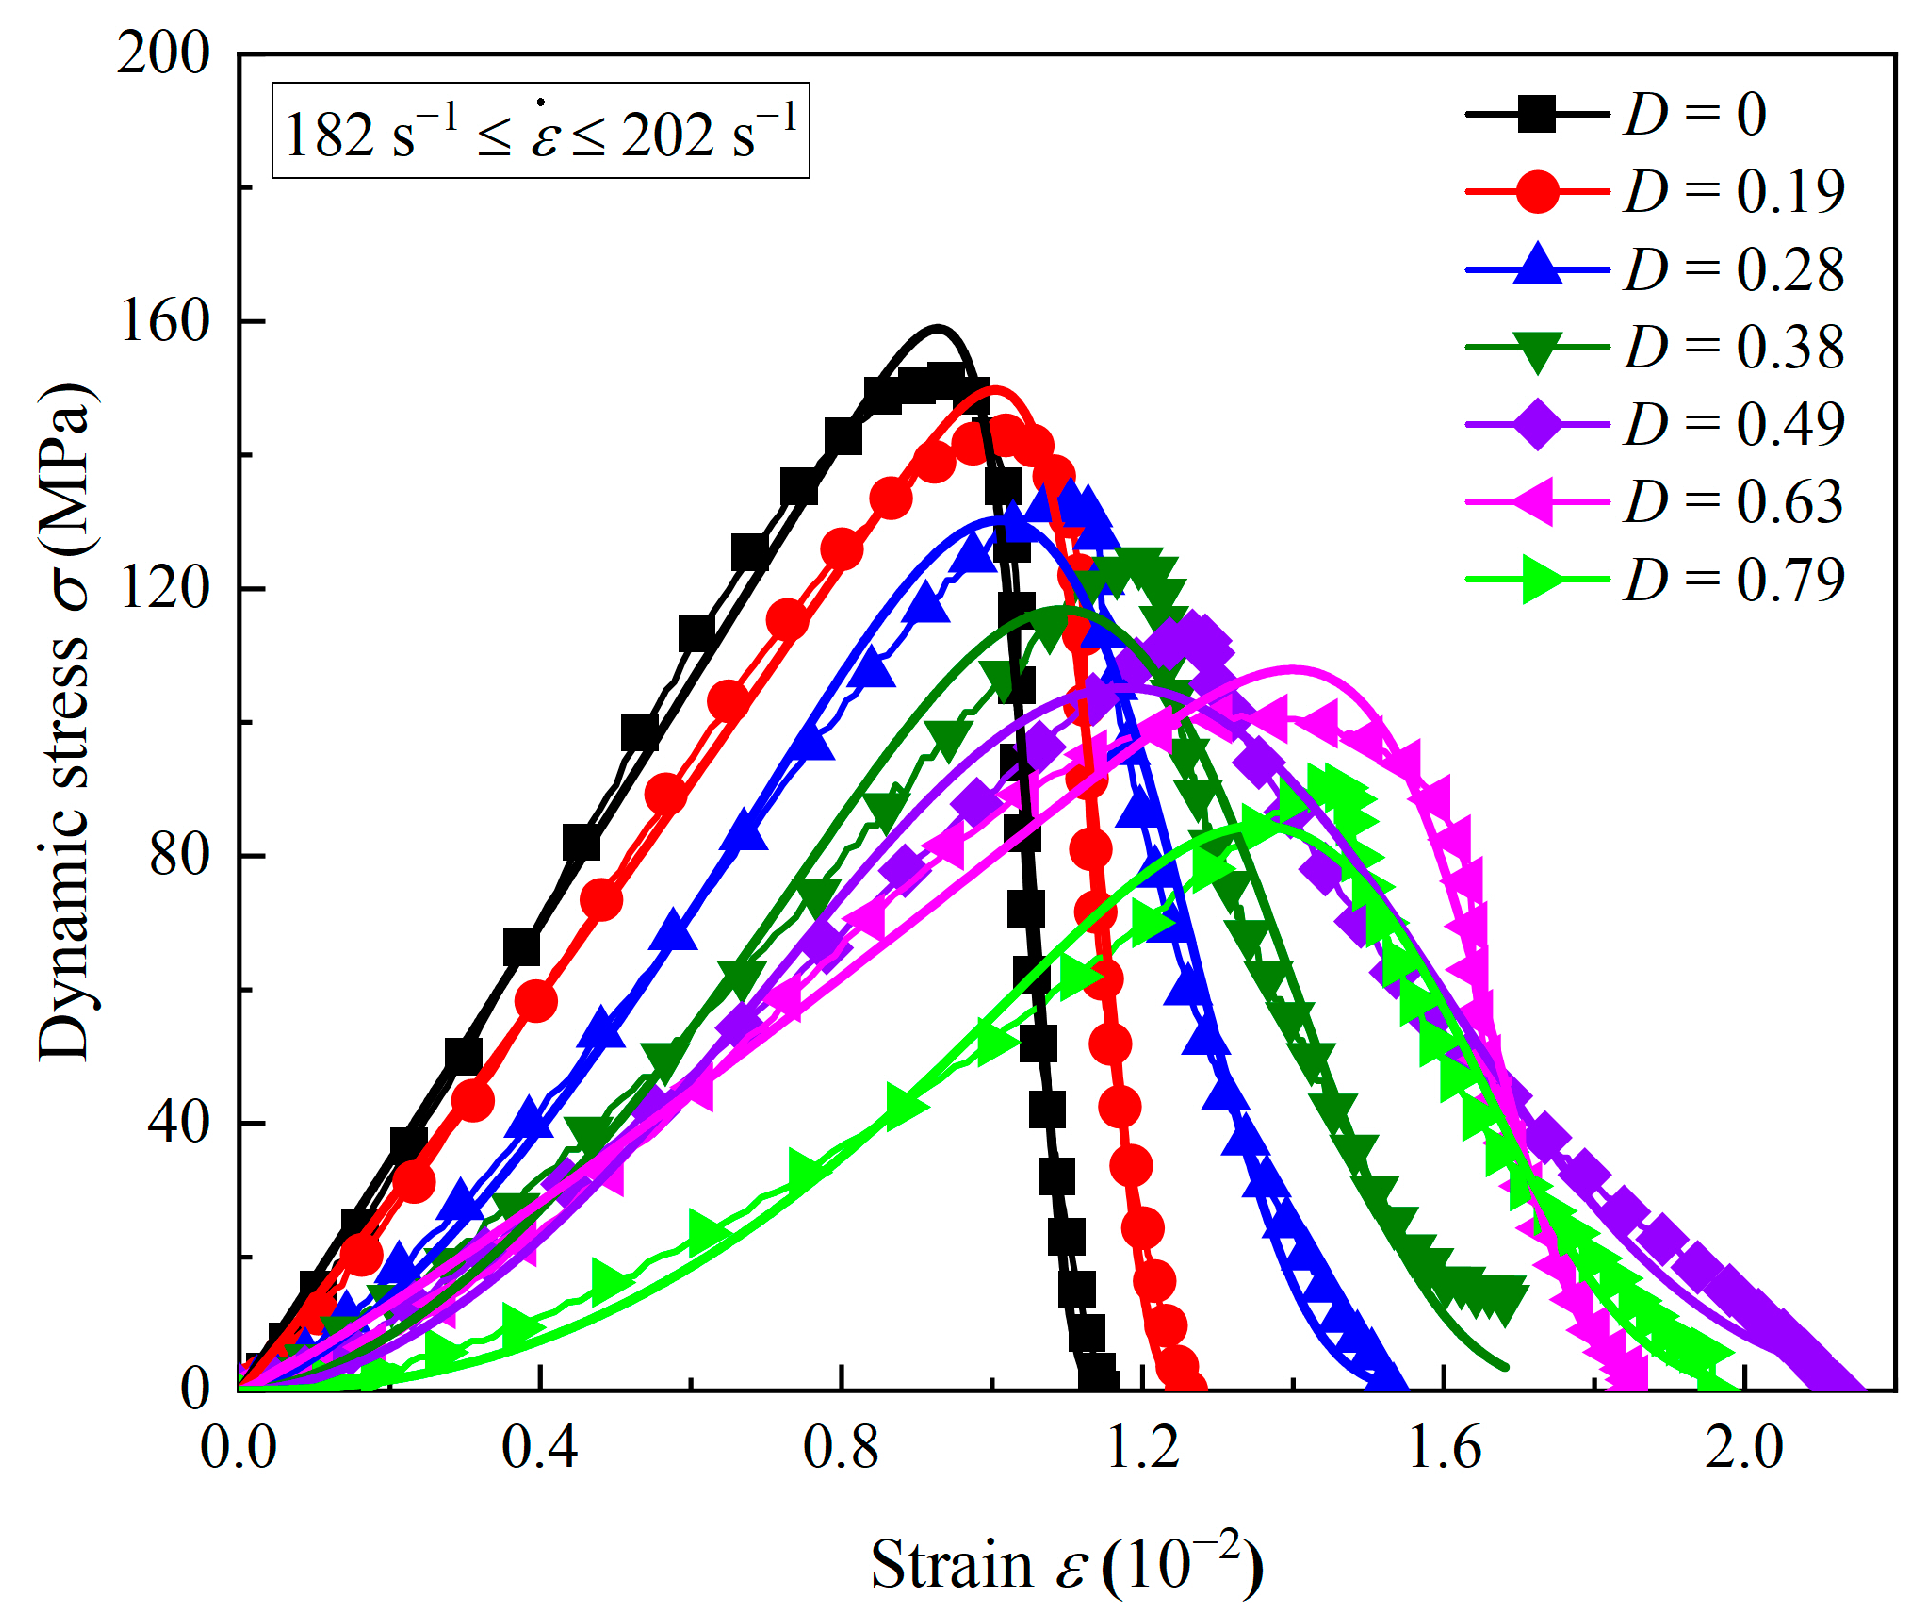
According to the statistical damage constitutive model, the dynamic stress–strain curves of sandstone under different accumulated damages are fitted, and the tested and fitting curves are shown in Figure 27.
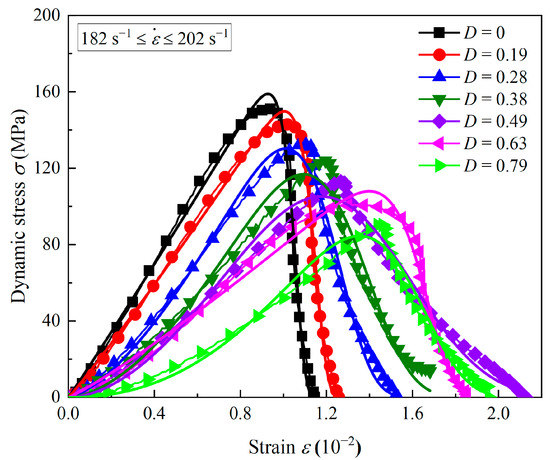
Figure 27.
Comparison of tested and fitting stress–strain curves with different accumulated damages.
It can be seen that compared with the data obtained from the tests, the prediction results obtained from the constitutive model show a higher consistency. It is noteworthy that, as described in Section 3.2, the presence of accumulated damage gradually lengthened the crack closure phase of the stress–strain curve, which is well represented by this model. At the same time, the post-peak phase is also accurately predicted. In addition, it is worth emphasizing that there are four parameters in this model, all of which have their specific physical meanings. They all affect each phase in the stress–strain curves and are indispensable, which is also different from some previous studies [31,32,56,57]. In conclusion, the model presented in this paper can reasonably predict the influence of accumulated damage effects and strain rate effects, which indicates that the model has good applicability.
This research aims to highlight the effects of accumulated damage on deep rocks. In this study, coal measures sandstone is set as the main object of study for impact tests. It is well known that different types of rocks have distinct physical and mechanical properties, which makes it likely that the effects of accumulated damage on them will be highly varied. It is unknown whether the experimental results and the proposed statistical damage constitutive model in this study are applicable to other types of rocks. The next attempt is to apply accumulated damage to other types of rocks and alter the type of accumulated damage using different stress paths. Future research will offer fresh perspectives on estimating the accumulated damage impacts of deep in situ rock environments.
6. Conclusions
The coupling effect of accumulated damage and a high strain rate has a profound influence on deep mining engineering. In this study, six accumulated damage conditions were assigned to coal measures sandstone, and a statistical damage constitutive model for sandstone considering the strain rate effect and the accumulated damage was developed. The main conclusions are as set out below:
- The stress–strain curves of the intact coal measures sandstone are classified into three phases: the linear elastic phase, the plastic deformation phase, and the strain-softening phase. The accumulated damages result in the crack closure phases in the dynamic curves of sandstone, and the greater the accumulated damage, the longer the crack closure phase.
- The accumulated damage results in a significant reduction in the dynamic strength and the deformation modulus of the sandstone specimens. Compared with the compressive strength, the deformation modulus of sandstone is more susceptible to accumulated damage. The DIFs of strength and the deformation modulus are divided into two stages. The high-strain-rate phase has a faster change rate than the low- and medium-strain-rate phases.
- Accumulated damage reduces the internal friction angle of sandstone, leading to tensile fracture and shear fracture in the macroscopic failure mode. From a microscopic perspective, accumulated damage leads to intergranular fracture between mineral particles, whereas a high strain rate induces transgranular fracture in mineral particles. The energy absorption law corresponds to the failure modes of sandstone specimens.
- A statistical damage constitutive model of sandstone is established, which can well reflect the effect of the strain rate and accumulated damage on the dynamic response. Parameter a mainly affects the peak stress, while parameter b mainly affects the crack closure phase. The parameters and m have certain effects on the peak stress and the deformation modulus, but parameter m also affects the strain-softening phase.
Author Contributions
Methodology, Z.S. and H.P.; investigation, J.X.; resources, H.N.; data curation, Z.S. and S.G.; writing—original draft preparation, Z.S., J.X. and H.N.; writing—review and editing, Z.S., S.G. and H.P.; visualization, Z.S. and J.X.; supervision, H.P. All authors have read and agreed to the published version of the manuscript.
Funding
This research was funded by the National Natural Science Foundation of China (No. 51974296 and No. 52061135111).
Data Availability Statement
Data available on request due to privacy restrictions.
Conflicts of Interest
The authors declare no conflict of interest.
References
- He, M.C.; Xie, H.P.; Peng, S.P.; Jiang, Y.D. Study on Rock Mechanics in Deep Mining Engineering. Chin. J. Rock Mech. Eng. 2005, 24, 2803–2813. [Google Scholar]
- Huang, L.X. Development and New Achievements of Rock Dynamics in China. Rock Soil Mech. 2011, 32, 2889–2900. [Google Scholar]
- Qian, Q.H. Challenges Faced by Underground Projects Construction Safety and Countermeasures. Chin. J. Rock Mech. Eng. 2012, 31, 1945–1956. [Google Scholar]
- Xie, H.P. Research Review of the State Key Research Development Program of China: Deep Rock Mechanics and Mining Theory. J. China Coal Soc. 2019, 44, 1283–1305. [Google Scholar]
- Xia, K.W.; Wang, S.; Xu, Y.; Chen, R.; Wu, B.B. Advances in Experimental Studies for Deep Rock Dynamics. Chin. J. Rock Mech. Eng. 2021, 40, 448–475. [Google Scholar]
- Rong, T.L.; Zhou, H.W.; Wang, L.J.; Ren, W.G.; Guo, Y.B. A Damage-Based Permeability Models of Deep Coal under Mining Disturbance. Rock Soil Mech. 2018, 39, 3983–3992. [Google Scholar]
- Bauer, S.J.; Song, B.; Sanborn, B. Dynamic Compressive Strength of Rock Salts. Int. J. Rock Mech. Min. Sci. 2019, 113, 112–120. [Google Scholar] [CrossRef]
- Duan, K.; Li, Y.C.; Wang, L.; Zhao, G.F.; Wu, W. Dynamic Responses and Failure Modes of Stratified Sedimentary Rocks. Int. J. Rock Mech. Min. Sci. 2019, 122, 104060. [Google Scholar] [CrossRef]
- Mishra, S.; Khetwal, A.; Chakraborty, T. Dynamic Characterisation of Gneiss. Rock Mech. Rock Eng. 2019, 52, 61–81. [Google Scholar] [CrossRef]
- Gong, F.Q.; Zhao, G.F. Dynamic Indirect Tensile Strength of Sandstone under Different Loading Rates. Rock Mech. Rock Eng. 2013, 47, 2271–2278. [Google Scholar] [CrossRef]
- Jiang, W.; Lu, Y.B.; Jiang, X.Q.; Duan, J.Z. Experimental Study on Dynamic Direct Tensile Mechanical Properties of Mortar-Granite ITZ. Chin. J. Rock Mech. Eng. 2018, 37, 1905–1915. [Google Scholar]
- Li, M.; Mao, X.B.; Cao, L.L.; Pu, H.; Mao, R.R.; Lu, A.H. Effects of Thermal Treatment on the Dynamic Mechanical Properties of Coal Measures Sandstone. Rock Mech. Rock Eng. 2016, 49, 3525–3539. [Google Scholar] [CrossRef]
- Yin, T.B.; Li, X.B.; Yin, Z.Q.; Zhou, Z.L.; Liu, X.L. Study and Comparison of Mechanical Properties of Sandstone under Static and Dynamic Loadings after High Temperature. Yanshilixue Yu Gongcheng Xuebao/Chin. J. Rock Mech. Eng. 2012, 31, 273–279. [Google Scholar]
- Gong, F.Q.; Li, X.B.; Liu, X.L.; Zhao, J. Experimental Study of Dynamic Characteristics of Sandstone under One-Dimensional Coupled Static and Dynamic Loads. Chin. J. Rock Mech. Eng. 2010, 29, 2076–2085. [Google Scholar]
- Zhu, W.C.; Bai, Y.; Li, X.B.; Niu, L.L. Numerical Simulation on Rock Failure under Combined Static and Dynamic Loading during SHPB Tests. Int. J. Impact Eng. 2012, 49, 142–157. [Google Scholar] [CrossRef]
- Han, T.L.; Shi, J.P.; Cao, X.S. Fracturing and Damage to Sandstone under Coupling Effects of Chemical Corrosion and Freeze–Thaw Cycles. Rock Mech. Rock Eng. 2016, 49, 4245–4255. [Google Scholar] [CrossRef]
- Xu, J.C.; Pu, H.; Sha, Z.H. Mechanical Behavior and Decay Model of the Sandstone in Urumqi under Coupling of Freeze–Thaw and Dynamic Loading. Bull. Eng. Geol. Environ. 2021, 80, 2963–2978. [Google Scholar] [CrossRef]
- Zhou, T.; Dong, S.L.; Zhao, G.F.; Zhang, R.; Wu, S.Y.; Zhu, J.B. An Experimental Study of Fatigue Behavior of Granite under Low-Cycle Repetitive Compressive Impacts. Rock Mech. Rock Eng. 2018, 51, 3157–3166. [Google Scholar] [CrossRef]
- Tong, L.H.; Yu, Y.; Lai, S.K.; Lim, C.W. Dynamic Weakening of Sandstone Subjected to Repetitive Impact Loading. Rock Mech. Rock Eng. 2019, 52, 2197–2206. [Google Scholar] [CrossRef]
- Peng, K.; Liu, Z.P.; Zou, Q.L.; Zhang, Z.Y.; Zhou, J.Q. Static and Dynamic Mechanical Properties of Granite from Various Burial Depths. Rock Mech. Rock Eng. 2019, 52, 3545–3566. [Google Scholar]
- Li, X.; Wang, S.; Xu, Y.; Yao, W.; Xia, K.W.; Lu, G.M. Effect of Microwave Irradiation on Dynamic Mode-Ι Fracture Parameters of Barre Granite. Eng. Fract. Mech. 2020, 224, 106748. [Google Scholar] [CrossRef]
- Wang, S.; Xu, Y.; Xia, K.W.; Tong, T.Y. Dynamic Fragmentation Of Microwave Irradiated Rock. J. Rock Mech. Geotech. Eng. 2021, 13, 300–310. [Google Scholar] [CrossRef]
- Yan, Z.L.; Dai, F.; Liu, Y.; Du, H.B.; Luo, J. Dynamic Strength and Cracking Behaviors of Single Flawed Rock Subjected to Coupled Static-Dynamic Compression. Rock Mech. Rock Eng. 2020, 53, 4289–4298. [Google Scholar] [CrossRef]
- Yan, Z.L.; Dai, F.; Zhu, J.B.; Xu, Y. Dynamic Cracking Behaviors and Energy Evolution of Multi-Flawed Rocks under Static Pre-Compression. Rock Mech. Rock Eng. 2021, 54, 5117–5139. [Google Scholar] [CrossRef]
- Liu, K.; Xu, P.X.; Wang, F.; Jin, C.; Liu, Q.T.; Pang, H.P.; Xie, H.Z. The Accumulated Stress Damage and Residual Life Prediction of Unreinforced Concrete Pavement with Electric Heating Pipes. Constr. Build. Mater. 2021, 278, 122258. [Google Scholar] [CrossRef]
- Ni, H.Y.; Liu, J.F.; Chen, T.; Chen, S.J.; Meng, Q. Bin Coal Permeability Prediction Method Based on the Microscopic Pore-Fracture Dual-Porosity Structure. J. Pet. Sci. Eng. 2022, 211, 110107. [Google Scholar] [CrossRef]
- Jia, B.; Chen, Z.L.; Xian, C.G. Investigations of CO2 Storage Capacity and Flow Behavior in Shale Formation. J. Pet. Sci. Eng. 2022, 208, 109659. [Google Scholar] [CrossRef]
- Jia, B.; Xian, C.G. Permeability Measurement of the Fracture-Matrix System with 3D Embedded Discrete Fracture Model. Pet. Sci. 2022. [Google Scholar] [CrossRef]
- Kim, T.; Jeon, S. Experimental Study on Shear Behavior of a Rock Discontinuity under Various Thermal, Hydraulic and Mechanical Conditions. Rock Mech. Rock Eng. 2019, 52, 2207–2226. [Google Scholar] [CrossRef]
- Ai, H.A.; Ahrens, T.J. Simulation of Dynamic Response of Granite: A Numerical Approach of Shock-Induced Damage beneath Impact Craters. Int. J. Impact Eng. 2006, 33, 1–10. [Google Scholar] [CrossRef]
- Taylor, L.M.; Chen, E.P.; Kuszmaul, J.S. Microcrack-Induced Damage Accumulation in Brittle Rock under Dynamic Loading. Comput. Methods Appl. Mech. Eng. 1986, 55, 301–320. [Google Scholar] [CrossRef]
- Liu, H.Y.; Lv, S.R.; Zhang, L.M.; Yuan, X.P. A Dynamic Damage Constitutive Model for a Rock Mass with Persistent Joints. Int. J. Rock Mech. Min. Sci. 2015, 75, 132–139. [Google Scholar] [CrossRef]
- Grady, D.E.; Kipp, M.E. The Micromechanics of Impact Fracture of Rock. Int. J. Rock Mech. Min. Sci. 1979, 16, 293–302. [Google Scholar] [CrossRef]
- Zhou, Z.L.; Li, X.B.; Ye, Z.Y.; Liu, K.W. Obtaining Constitutive Relationship for Rate-Dependent Rock in SHPB Tests. Rock Mech. Rock Eng. 2010, 43, 697–706. [Google Scholar] [CrossRef]
- Li, H.Y.; Shi, G.Y. A Dynamic Material Model for Rock Materials under Conditions of High Confining Pressures and High Strain Rates. Int. J. Impact Eng. 2016, 89, 38–48. [Google Scholar] [CrossRef]
- Wu, A.J.; Deng, J.H.; Gu, X.; Hong, Y. Research on Mechanical Properties and Damage Evolution Law of Argillaceous Dolomite under Freeze-Thaw Cycles. Rock Soil Mech. 2014, 35, 3065–3072. [Google Scholar]
- Dai, F.; Huang, S.; Xia, K.W.; Tan, Z.Y. Some Fundamental Issues in Dynamic Compression and Tension Tests of Rocks Using Split Hopkinson Pressure Bar. Rock Mech. Rock Eng. 2010, 43, 657–666. [Google Scholar] [CrossRef]
- Cai, M.F.; He, M.C.; Liu, D.Y. Rock Mechanics and Engineering; Science Press: Beijing, China, 2013. [Google Scholar]
- Li, X.B.; Zhou, T.; Li, D.Y.; Wang, Z.W. Experimental and Numerical Investigations on Feasibility and Validity of Prismatic Rock Specimen in SHPB. Shock Vib. 2016, 2016, 7198980. [Google Scholar] [CrossRef] [Green Version]
- Qiu, J.D.; Li, D.Y.; Li, X.B.; Zhou, Z.L. Dynamic Fracturing Behavior of Layered Rock with Different Inclination Angles in SHPB Tests. Shock Vib. 2017, 2017, 7687802. [Google Scholar] [CrossRef] [Green Version]
- Li, X.B.; Lok, T.S.; Zhao, J. Dynamic Characteristics of Granite Subjected to Intermediate Loading Rate. Rock Mech. Rock Eng. 2005, 38, 21–39. [Google Scholar] [CrossRef]
- Gong, F.Q.; Si, X.F.; Li, X.B.; Wang, S.Y. Dynamic Triaxial Compression Tests on Sandstone at High Strain Rates and Low Confining Pressures with Split Hopkinson Pressure Bar. Int. J. Rock Mech. Min. Sci. 2019, 113, 211–219. [Google Scholar] [CrossRef]
- Su, C.D. Testing Study on the Effect of Crystal Size and Specimen Length on the Rockburst Tendency. Chin. J. Rock Mech. Eng. 2004, 23, 3750–3753. [Google Scholar]
- Zhang, Q.B.; Zhao, J. A Review of Dynamic Experimental Techniques and Mechanical Behaviour of Rock Materials. Rock Mech. Rock Eng. 2014, 47, 1411–1478. [Google Scholar] [CrossRef] [Green Version]
- Sun, Q.; Li, S.C.; Feng, X.D.; Li, W.T.; Yuan, C. Study of Numerical Simulation Method of Rock Fracture Based on Strain Energy Density Theory. Rock Soil Mech. 2011, 32, 1575–1582. [Google Scholar]
- Wen, Z.J.; Tian, L.; Jiang, Y.J.; Zuo, Y.J.; Meng, F.B.; Dong, Y.; Lin, G.; Yang, T.; Lv, D.W. Research on Damage Constitutive Model of Inhomogeneous Rocks Based on Strain Energy Density. Chin. J. Rock Mech. Eng. 2019, 38, 1332–1343. [Google Scholar]
- Xie, H.P.; Ju, Y.; Li, L. Yun Criteria for Strength and Structural Failure of Rocks Based on Energy Dissipation and Energy Release Principles. Chin. J. Rock Mech. Eng. 2005, 24, 3003–3010. [Google Scholar]
- Li, L.Y.; Xu, Z.Q.; Xie, H.P.; Ju, Y.; Ma, X.; Han, Z.C. Failure Experimental Study on Energy Laws of Rock under Differential Dynamic Impact Velocities. J. China Coal Soc. 2011, 36, 2007–2011. [Google Scholar]
- Millon, O.; Ruiz-Ripoll, M.L.; Hoerth, T. Analysis of the Behavior of Sedimentary Rocks under Impact Loading. Rock Mech. Rock Eng. 2016, 49, 4257–4272. [Google Scholar] [CrossRef]
- Wang, Z.L.; Shi, H.; Wang, J.G. Mechanical Behavior and Damage Constitutive Model of Granite under Coupling of Temperature and Dynamic Loading. Rock Mech. Rock Eng. 2018, 51, 3045–3059. [Google Scholar] [CrossRef]
- Wang, Z.L.; Li, Y.C.; Wang, J.G. A Damage-Softening Statistical Constitutive Model Considering Rock Residual Strength. Comput. Geosci. 2007, 33, 1–9. [Google Scholar] [CrossRef]
- Tang, C.A. Numerical Simulation of Progressive Rock Failure and Associated Seismicity. Int. J. Rock Mech. Min. Sci. Geomech. Abstr. 1997, 34, 249–261. [Google Scholar] [CrossRef]
- Li, Y.W.; Jia, D.; Rui, Z.H.; Peng, J.Y.; Fu, C.K.; Zhang, J. Evaluation Method of Rock Brittleness Based on Statistical Constitutive Relations for Rock Damage. J. Pet. Sci. Eng. 2017, 153, 123–132. [Google Scholar] [CrossRef]
- Lemaitre, J. Coupled Elasto-Plasticity and Damage Constitutive Equations. Comput. Methods Appl. Mech. Eng. 1985, 51, 31–49. [Google Scholar] [CrossRef]
- Xie, H.P.; Ju, Y.; Dong, Y.L. Discussion on the “Elastic Modulus Method” in the Classical Damage Definition. Mech. Eng. 1997, 19, 1–5. [Google Scholar]
- Xie, L.X.; Zhao, G.M.; Meng, X.R. Research on Damage Viscoelastic Dynamic Constitutive Model of Soft Rock and Concrete Materials. Chin. J. Rock Mech. Eng. 2013, 32, 857–864. [Google Scholar]
- Zhu, J.J.; Li, X.B.; Gong, F.Q.; Wang, S.M. Dynamic Characteristics and Damage Model for Rock under Uniaxial Cyclic Impact Compressive Loads. Chin. J. Geotech. Eng. 2013, 35, 531–539. [Google Scholar]


Publisher’s Note: MDPI stays neutral with regard to jurisdictional claims in published maps and institutional affiliations. |
© 2022 by the authors. Licensee MDPI, Basel, Switzerland. This article is an open access article distributed under the terms and conditions of the Creative Commons Attribution (CC BY) license (https://creativecommons.org/licenses/by/4.0/).