
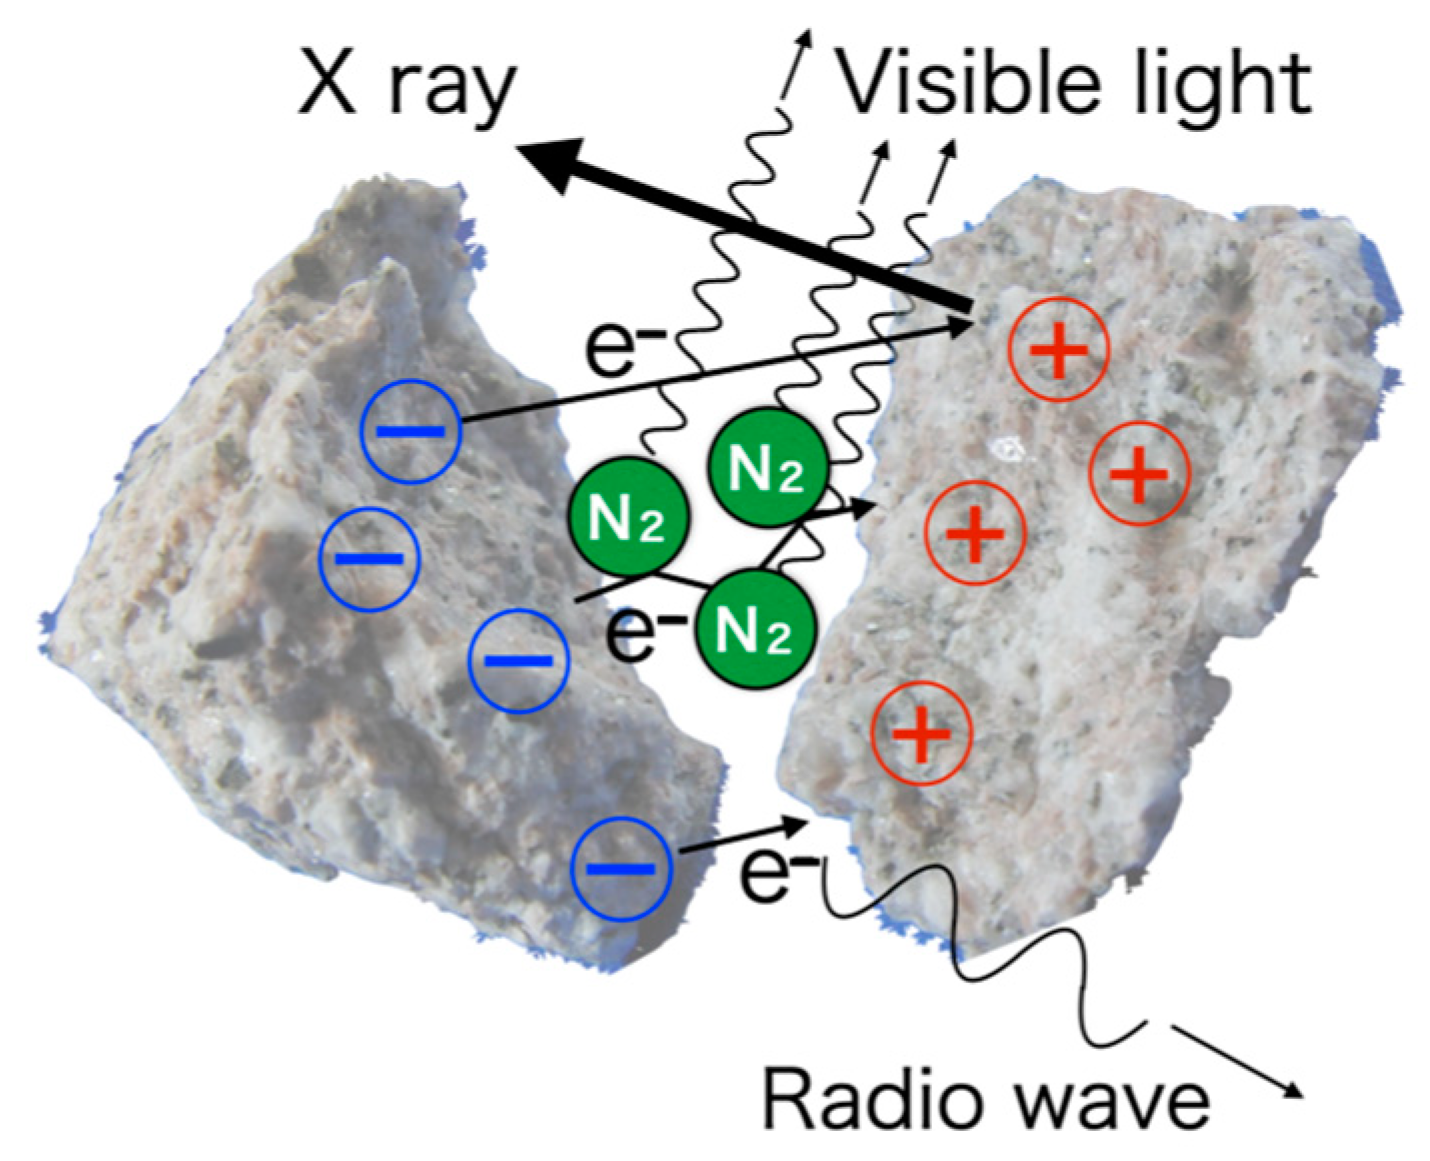
Experimental Investigation of Visible-Light and X-ray Emissions during Rock and Mineral Fracture: Role of Electrons Traveling between Fracture Surfaces

 , , , ,
Abstract
1. Introduction
2. Experiments
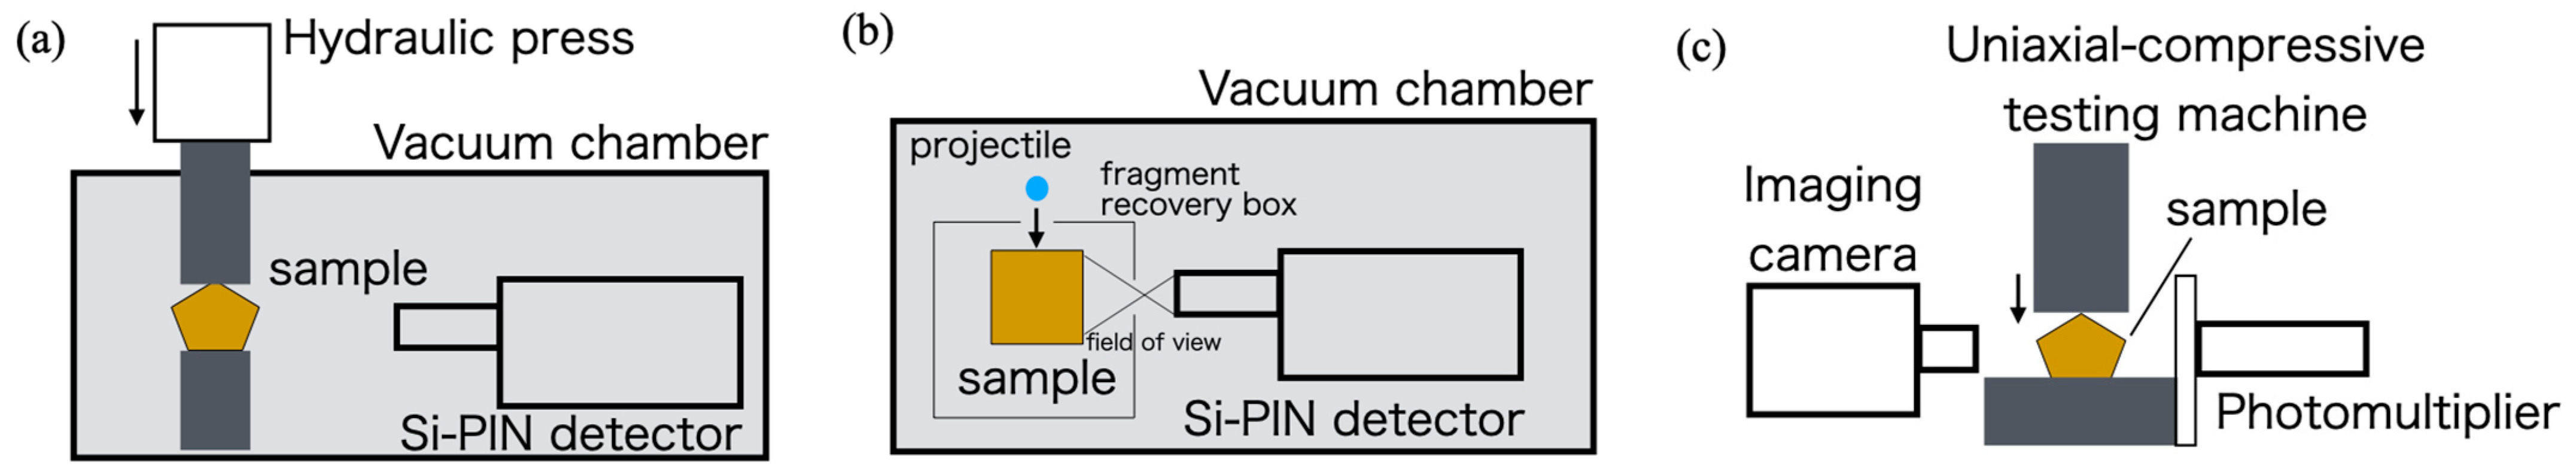
2.1. X-ray Measurements in a Vacuum
2.1.1. Hydraulic Press Experiments
2.1.2. Impact Experiments
2.2. Visible-Light Measurements in the Atmosphere: Press Experiments
3. Results
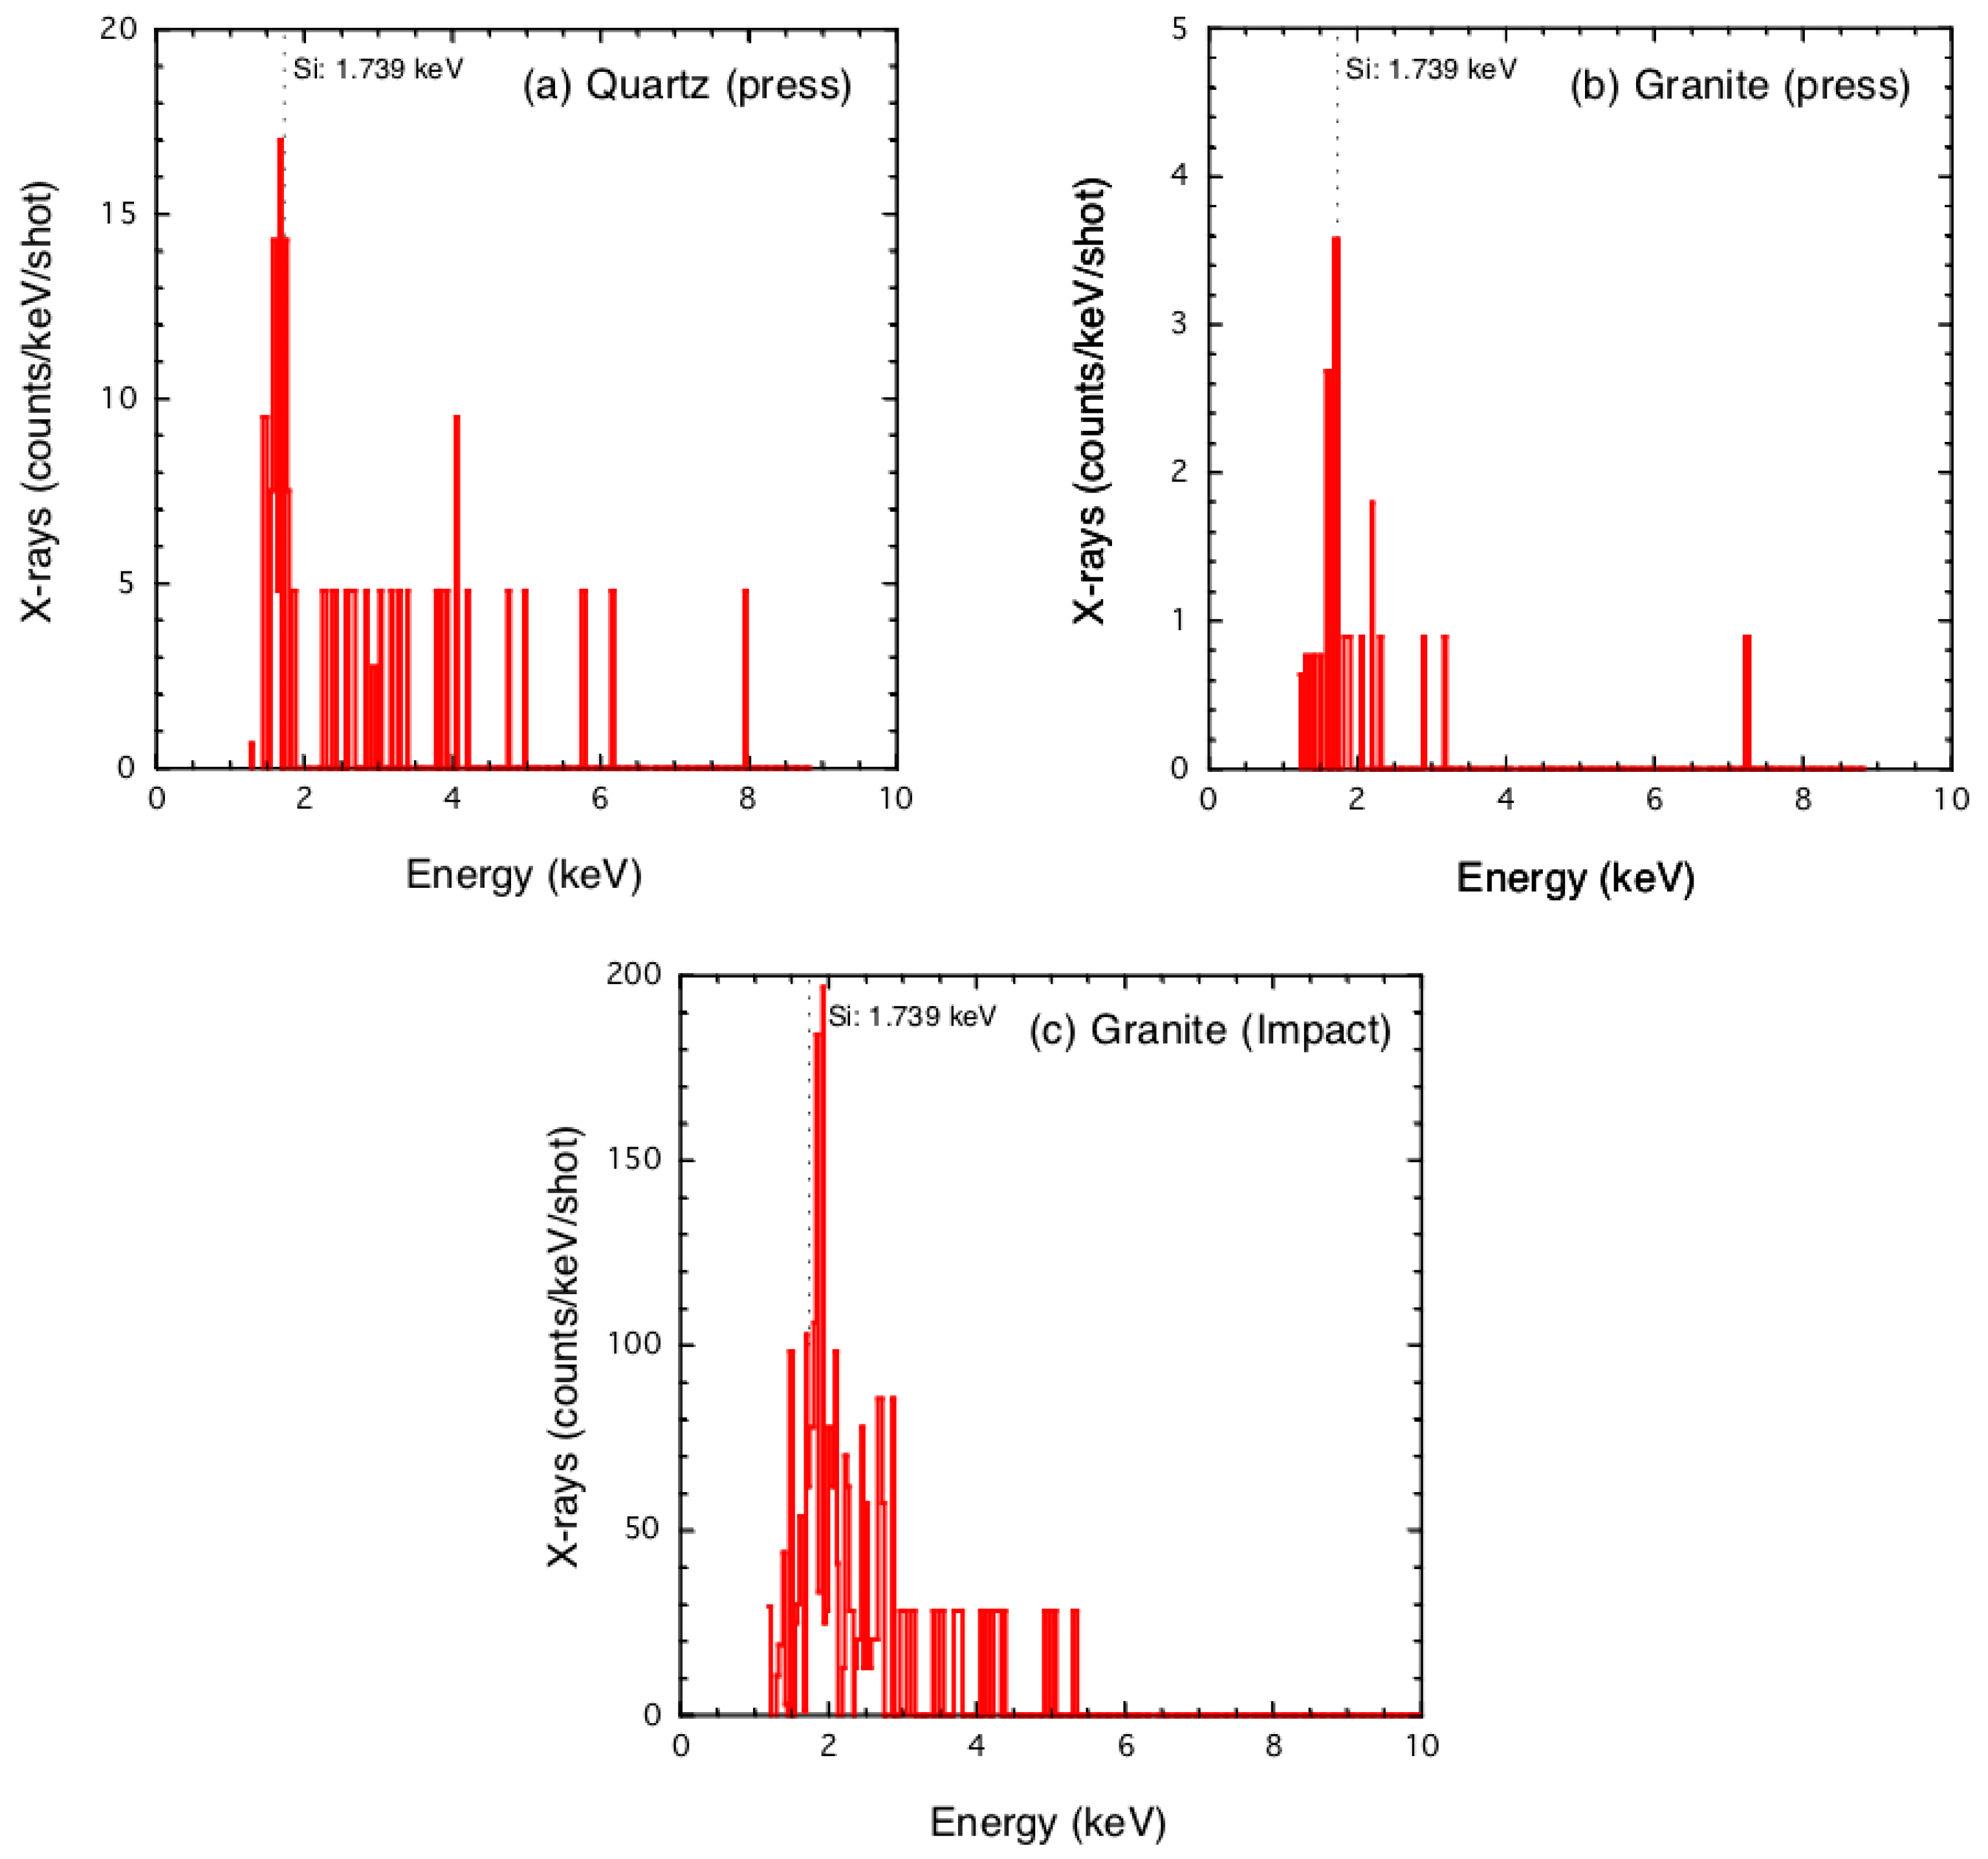
3.1. X-ray
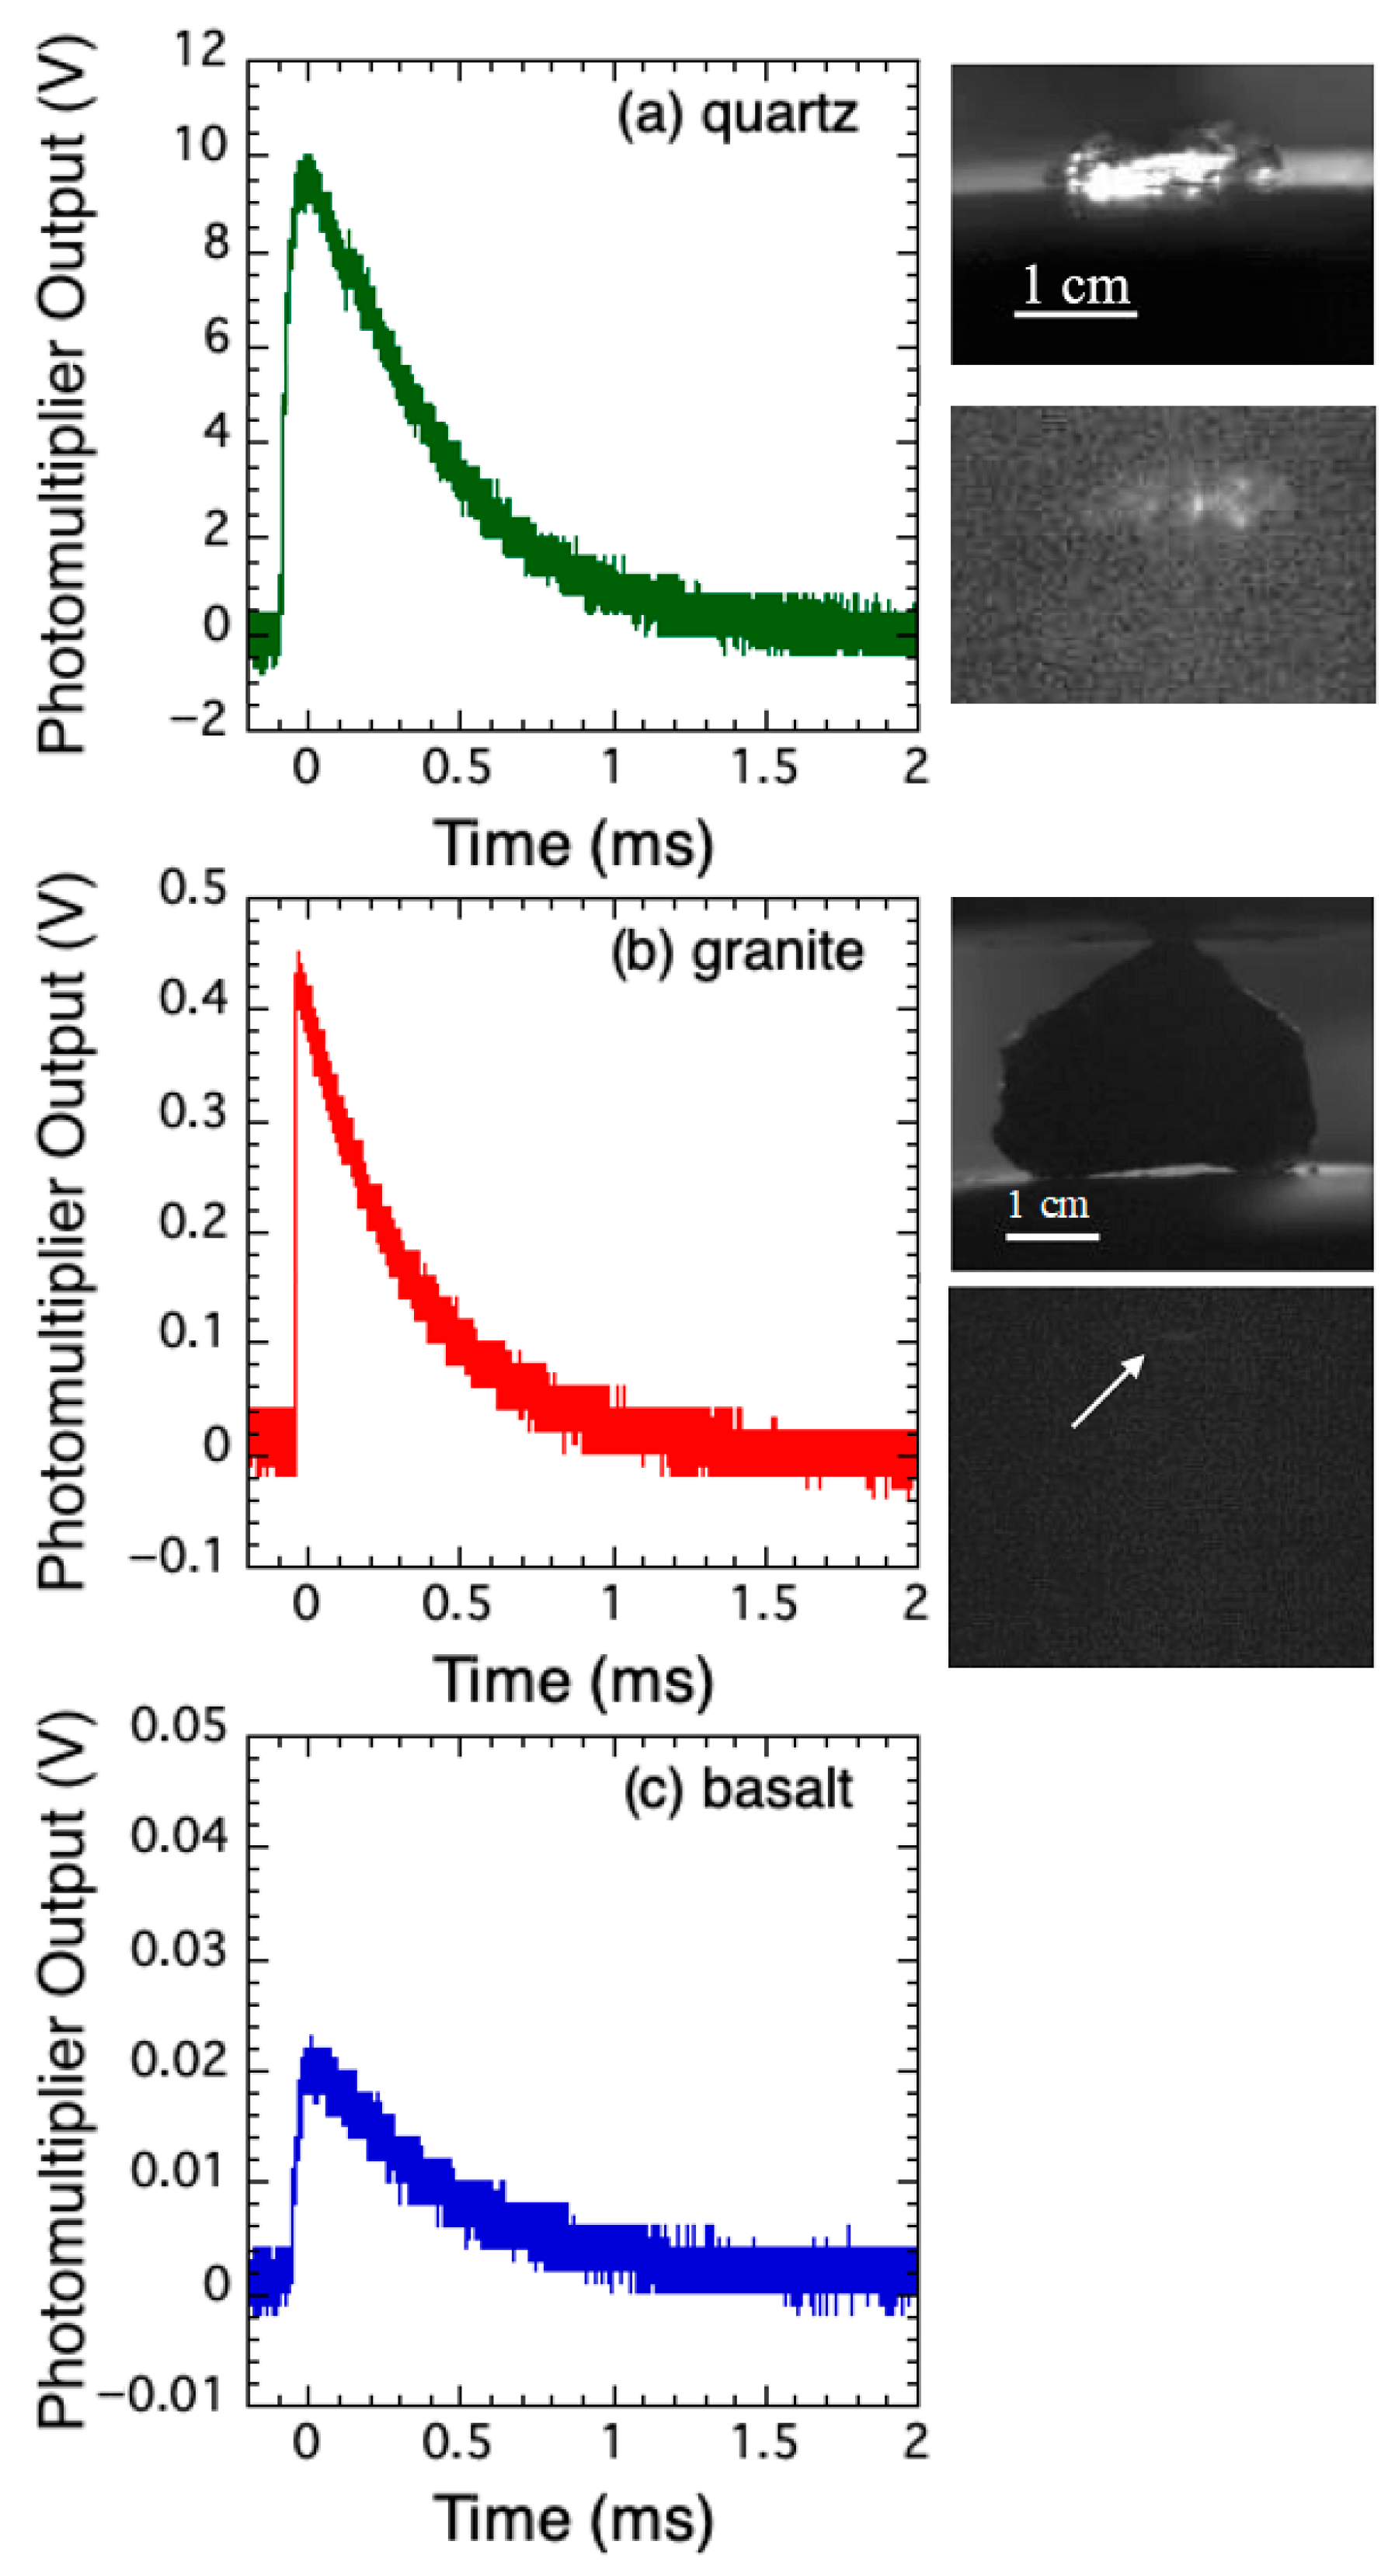
3.2. Visible Light
4. Discussion
4.1. Number of Electrons Resulting in X-ray
4.2. Comparison between X-ray and Radio Waves
4.3. Comparison between X-ray and Visible Light
4.4. Crack Surface Electrification during Rock Fracture
4.5. Feasibility of Observing the Radiation Emitted during Rock Fracture
4.5.1. Observation of X-ray Emitted during Rock Fracture in Space
4.5.2. Observation of Radio Waves in Natural Earthquakes
4.5.3. Observation of Visible Lights in Natural Earthquakes
5. Conclusions
Supplementary Materials
Author Contributions
Funding
Data Availability Statement
Acknowledgments
Conflicts of Interest
References
- Terada, T. On luminous phenomena accompanying earthquakes. Bull. Earthq. Res. Inst. Tokyo Imperial Univ. 1931, 9, 225–255. [Google Scholar] [CrossRef][Green Version]
- Derr, J.S. Earthquake lights: A review of observations and present theories. Bull. Seismol. Soc. Am. 1973, 63, 2177–2187. [Google Scholar]
- Warwick, J.W.; Stoker, C.; Meyer, T.R. Radio emission associated with rock fracture: Possible application to the Great Chilean Earthquake of May 22, 1960. J. Geophys. Res. 1982, 87, 2851–2859. [Google Scholar] [CrossRef]
- Tsukuda, T. Sizes and some features of luminous sources associated with the 1995 Hygo-ken Nanbu earthquake. J. Phys. Earth 1997, 45, 73–82. [Google Scholar] [CrossRef]
- Nitsan, U. Electromagnetic emission accompanying fracture of quartz-bearing rocks. Geophys. Res. Lett. 1977, 4, 333–336. [Google Scholar] [CrossRef]
- Ogawa, T.; Oike, K.; Miura, T. Electromagnetic radiations from rocks. J. Geophys. Res. 1985, 90, 6245–6249. [Google Scholar] [CrossRef]
- Cress, G.O.; Brady, B.T.; Rowell, G.A. Sources of electromagnetic radiation from fracture of rock samples in the laboratory. Geophys. Res. Lett. 1987, 14, 331. [Google Scholar] [CrossRef]
- Yamada, I.; Masuda, K.; Mizutani, H. Electromagnetic and acoustic emission associated with rock fracture. Phys. Earth Planet. Inter. 1989, 57, 157–168. [Google Scholar] [CrossRef]
- Martelli, G.; Smith, P.N.; Woodward, A.J. Light, radiofrequency emission and ionization effects associated with rock fracture. Geophys. J. Int. 1989, 98, 397–401. [Google Scholar] [CrossRef]
- Brady, B.T.; Rowell, G.A. Laboratory investigation of the electrodynamics of rock fracture. Nature 1986, 321, 488–492. [Google Scholar] [CrossRef]
- Kawaguchi, Y. Charged particle emission and luminescence upon bending fracture of Granite. Jpn. J. Appl. Phys. 1998, 37, 3495–3499. [Google Scholar] [CrossRef]
- Kato, M.; Mitsui, Y.; Yanagidani, T. Photographic evidence of luminescence during faulting in granite. Earth Planets Space 2010, 62, 489–493. [Google Scholar] [CrossRef][Green Version]
- Dickinson, J.T. Fracto-emission. In Non-Destructive Testing of Fibre-Reinforced Plastics Composites, Vol. 2; Summerscales, J., Ed.; Springer: New York, NY, USA, 1990; pp. 429–482. [Google Scholar]
- Klyuev, V.A.; Toporov, Y.P.; Allev, A.D.; Chalykh, A.E.; Lipson, A.G. The effect of air pressure on the parameters of x-ray emission accompanying adhesive and cohesive breaking of solids. Sov. Phys. Tech. Phys. 1989, 34, 361–364. [Google Scholar]
- Finkelstein, D.; Powell, J. Earthquake Lightning. Nature 1970, 228, 759–760. [Google Scholar] [CrossRef] [PubMed]
- Mizutani, H.; Ishido, T.; Yokokura, T.; Ohnishi, S. Electrokinetic phenomena associated with earthquake. Geophys. Res. Lett. 1976, 3, 365–368. [Google Scholar] [CrossRef]
- Walton, A.J. Triboluminescence. Adv. Phys. 1977, 26, 887–948. [Google Scholar] [CrossRef]
- Chandra, B.P. Mechanoluminescence. In Luminescence of Solids; Vij, D.R., Ed.; Plenum Press: New York, NY, USA, 1998; pp. 361–389. [Google Scholar]
- Xie, Y.; Li, Z. Triboluminescence: Recalling interest and new aspects. Chem 2018, 4, 943–971. [Google Scholar] [CrossRef]
- Chandra, B.P.; Chandra, V.K.; Jha, P.; Patel, R.; Shende, S.K.; Thaker, S.; Baghel, R.N. Fracto-mechanoluminescence and mechanics of fracture of solids. J. Lumin. 2012, 132, 2012–2022. [Google Scholar] [CrossRef]
- Harvey, E.N. The luminescence of adhesive tape. Science 1939, 89, 460–461. [Google Scholar] [CrossRef]
- Dickinson, J.T.; Park, M.K.; Donaldson, E.E.; Jensen, L.C. Fracto-emission accompanying adhesive failure. J. Vac. Sci. Technol. 1982, 20, 436–439. [Google Scholar] [CrossRef]
- Berkov, V.I.; Lipson, A.G.; Klyuev, V.A.; Toporov, Y.P.; Deryagin, B.V. Mechanism for x-ray emission during breaking of adhesion bonds. Sov. Phys. Dokl. 1987, 32, 381. [Google Scholar]
- Camera, C.G.; Escobar, J.V.; Hird, J.R.; Putterman, S.J. Correlation between nanosecond X-ray flashes and stick-slip friction in peeling tape. Nature 2008, 455, 1089–1092. [Google Scholar] [CrossRef]
- Kadono, T.; Arakawa, M.; Mitani, N.K. Fragment velocity distribution in the impact disruption of thin glass plates. Phys. Rev. E 2005, 72, 045106. [Google Scholar] [CrossRef] [PubMed]
- Kurosawa, K.; Nagaoka, Y.; Senshu, H.; Wada, K.; Hasegawa, S.; Sugita, S.; Matsui, T. Dynamics of hypervelocity jetting during oblique impacts of spherical projectiles investigated via ultrafast imaging. J. Geophys. Res. 2015, 120, 1237–1251. [Google Scholar] [CrossRef]
- Kadono, T.; Tanigawa, T.; Kurosawa, K.; Okamoto, T.; Matsui, T.; Mizutani, H. Correlation between fragment shape and mass distributions in impact disruption. Icarus 2018, 309, 260–264. [Google Scholar] [CrossRef]
- Ebel, H. X-ray tube spectra. X-ray Spectrom. 1999, 28, 255–266. [Google Scholar] [CrossRef]
- Mason, B.; Moore, C.B. Principles of Geochemistry, 4th ed.; John and Wiley & Sons: New York, NY, USA, 1982. [Google Scholar]
- Li, Y.-H. Distribution patterns of the elements in the ocean: A synthesis. Geochim. Cosmochim. Acta 1999, 55, 3223–3240. [Google Scholar]
- Ogawa, K.; Okada, T.; Shirai, K.; Kato, M. Numerical estimation of lunar X-ray emission for X-ray spectrometer onboard SELENE. Earth Planets Space 2008, 60, 283–292. [Google Scholar] [CrossRef]
- Ogawa, K. Basic Development of a Compact X-ray Tube for In-Situ X-ray Analysis of Planetary Surface Composition. Ph.D. Thesis, Tokyo Institute of Technology, Tokyo, Japan, 2008. [Google Scholar]
- Landau, L.D.; Lifshitz, E.M. The Classical Theory of Fields; Pergamon: Oxford, UK, 1971. [Google Scholar]
- Borst, W.L. Excitation of several important metastable states of N2 by electron impact. Phys. Rev. A 1972, 5, 648656. [Google Scholar]
- McCarty, L.S.; Whitesides, G.M. Electrostatic charging due to separation of ions at interfaces: Contact electrification of ionic electrets. Angew. Chem. Int. Ed. 2008, 47, 2188–2207. [Google Scholar] [CrossRef]
- Poppe, T.; Blum, J.; Henning, T. Experiments on collisional grain charging of micron-sized preplanetary dust. Astrophys. J. 2000, 533, 472–480. [Google Scholar] [CrossRef]
- National Astronomical Observatory of Japan (Ed.) Chronological Scientific Tables; Maruzen: Tokyo, Japan, 2016. [Google Scholar]
- Lockner, D.A. Rock failure. In Rock Physics and Phase Relations: A Handbook of Physical Constants, AGU Reference Shelf 3; Ahrens, T.J., Ed.; American Geophysical Union: Washington, DC, USA, 1995; pp. 128–148. [Google Scholar]
- Mandelbrot, B.B.; Evertsz, C.J.G. The potential distribution around growing fractal clusters. Nature 1990, 348, 143–145. [Google Scholar] [CrossRef]
- Family, F.; Vicsek, T. Simulating fractal aggregation. Comput. Phys. 1990, 4, 44–49. [Google Scholar] [CrossRef]
- De Assis, T.A.; Borondo, F.; Benito, R.M.; Andrade, R.F.S. Field emission properties of fractal surfaces. Phys. Rev. B 2008, 78, 235427. [Google Scholar] [CrossRef]
- Feder, J. Fractals; Plenum: New York, NY, USA, 1988. [Google Scholar]
- Kittel, C. Introduction to Solid State Physics, 8th ed.; John Wiley & Sons: New Jersey, NJ, USA, 2005. [Google Scholar]
- Arakawa, M.; Saiki, T.; Wada, K.; Ogawa, K.; Kadono, T.; Shirai, K.; Sawada, H.; Miura, A. An artificial impact on the asteroid (162173) Ryugu formed a crater in the gravity-dominated regime. Science 2020, 368, 67–71. [Google Scholar] [CrossRef] [PubMed]
- Hirata, T. Fractal dimension of fault systems in Japan: Fractal structure in rock fracture geometry at various scales. Pure Appl. Geophys. 1989, 131, 157–170. [Google Scholar] [CrossRef]


| Samples | NpX(Si) | NeX | EV | NpV |
|---|---|---|---|---|
| Quartz | ||||
| Press | (5.6 ± 1.7) × 105 | (9.9 ± 2.9) × 109 | (9.4 ± 2.7) × 1011 | (4.9 ± 1.4) × 1011 |
| Granite | ||||
| Press | (8.7 ± 3.5) × 104 | (2.1 ± 0.8) × 109 | (4.6 ± 1.4) × 1010 | (2.4 ± 0.7) × 1010 |
| Impact | 2.9 × 10⁵ | 6.9 × 10⁹ | No data | - |
| Basalt | ||||
| Press | undetected | - | 2.7 × 10⁹ | 1.4 × 10⁹ |
Publisher’s Note: MDPI stays neutral with regard to jurisdictional claims in published maps and institutional affiliations. |
© 2022 by the authors. Licensee MDPI, Basel, Switzerland. This article is an open access article distributed under the terms and conditions of the Creative Commons Attribution (CC BY) license (https://creativecommons.org/licenses/by/4.0/).
Share and Cite
Kadono, T.; Ogawa, K.; Shirai, K.; Arakawa, M.; Kurosawa, K.; Okamoto, T.; Matsui, T.; Hasegawa, S.; Suzuki, A.I.; Kobayashi, H. Experimental Investigation of Visible-Light and X-ray Emissions during Rock and Mineral Fracture: Role of Electrons Traveling between Fracture Surfaces. Minerals 2022, 12, 778. https://doi.org/10.3390/min12060778
Kadono T, Ogawa K, Shirai K, Arakawa M, Kurosawa K, Okamoto T, Matsui T, Hasegawa S, Suzuki AI, Kobayashi H. Experimental Investigation of Visible-Light and X-ray Emissions during Rock and Mineral Fracture: Role of Electrons Traveling between Fracture Surfaces. Minerals. 2022; 12(6):778. https://doi.org/10.3390/min12060778
Chicago/Turabian StyleKadono, Toshihiko, Kazunori Ogawa, Kei Shirai, Masahiko Arakawa, Kosuke Kurosawa, Takaya Okamoto, Takafumi Matsui, Sunao Hasegawa, Ayako I. Suzuki, and Hideyuki Kobayashi. 2022. "Experimental Investigation of Visible-Light and X-ray Emissions during Rock and Mineral Fracture: Role of Electrons Traveling between Fracture Surfaces" Minerals 12, no. 6: 778. https://doi.org/10.3390/min12060778
APA StyleKadono, T., Ogawa, K., Shirai, K., Arakawa, M., Kurosawa, K., Okamoto, T., Matsui, T., Hasegawa, S., Suzuki, A. I., & Kobayashi, H. (2022). Experimental Investigation of Visible-Light and X-ray Emissions during Rock and Mineral Fracture: Role of Electrons Traveling between Fracture Surfaces. Minerals, 12(6), 778. https://doi.org/10.3390/min12060778