
The Ulug-Sair Gold Occurrence (Western Tuva, Russia): Mineralogy, Ore Genesis, and S-O Isotope Systematics

 ,
, 
Abstract
:1. Introduction
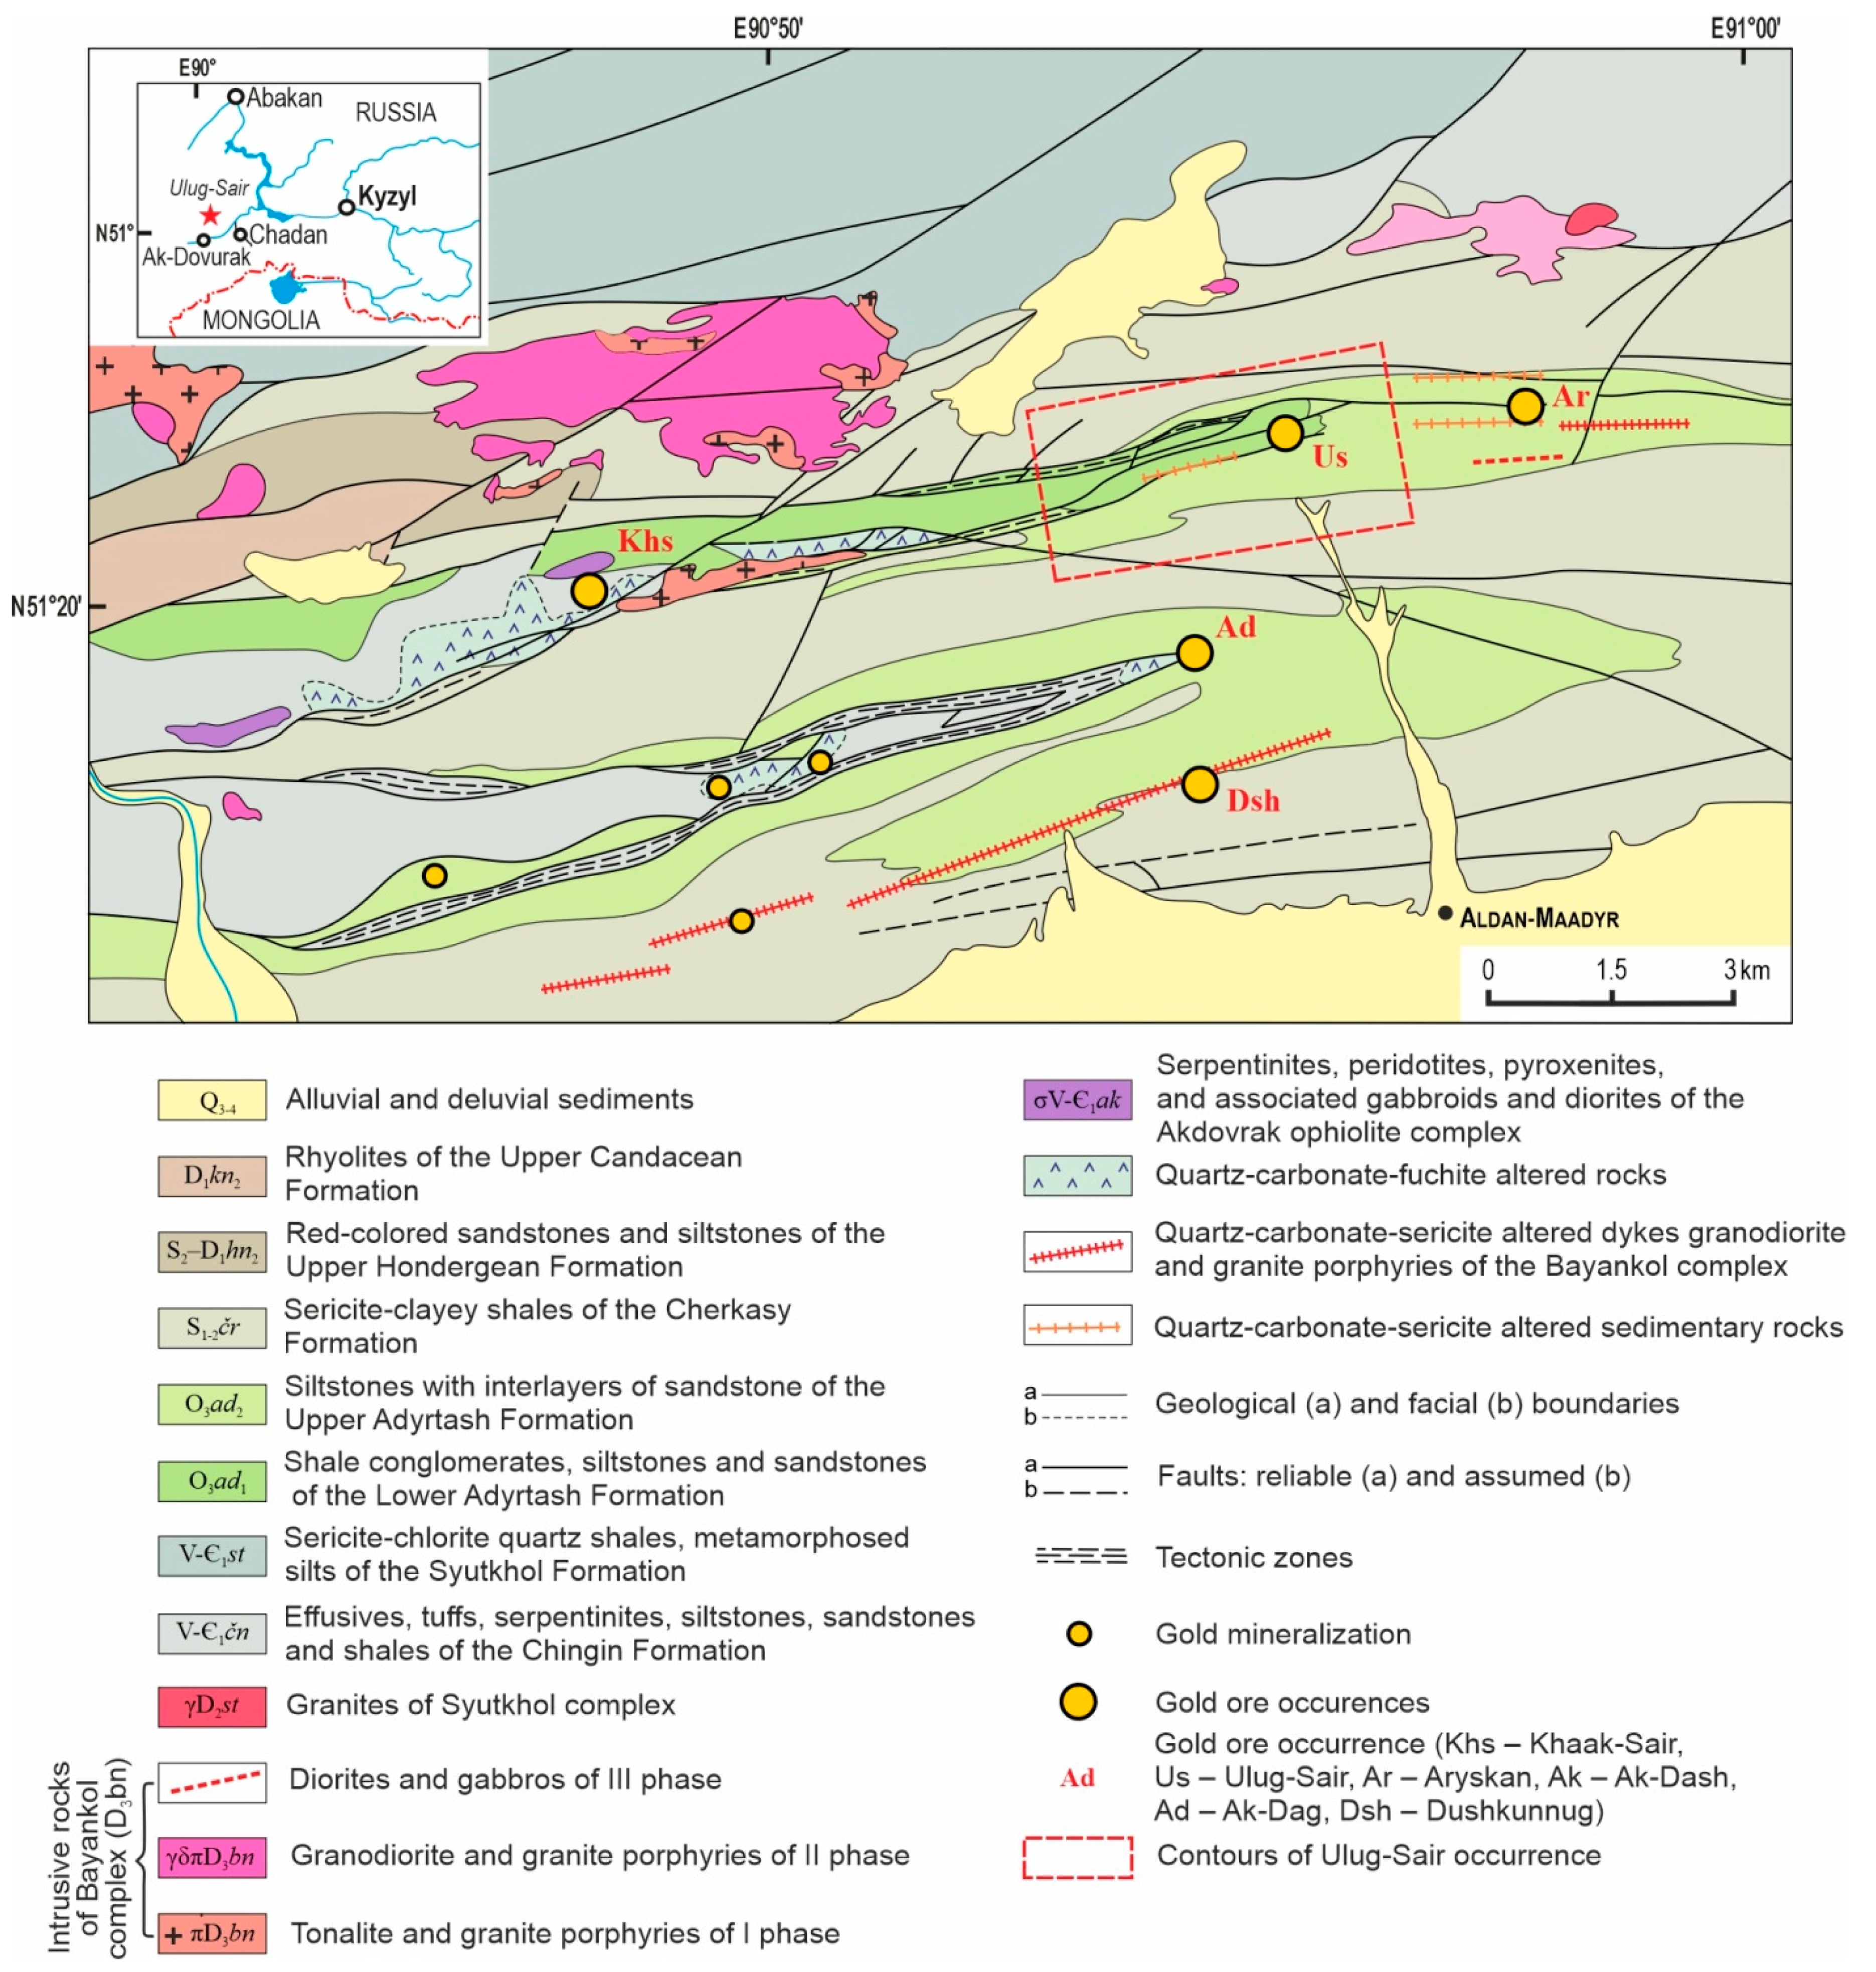
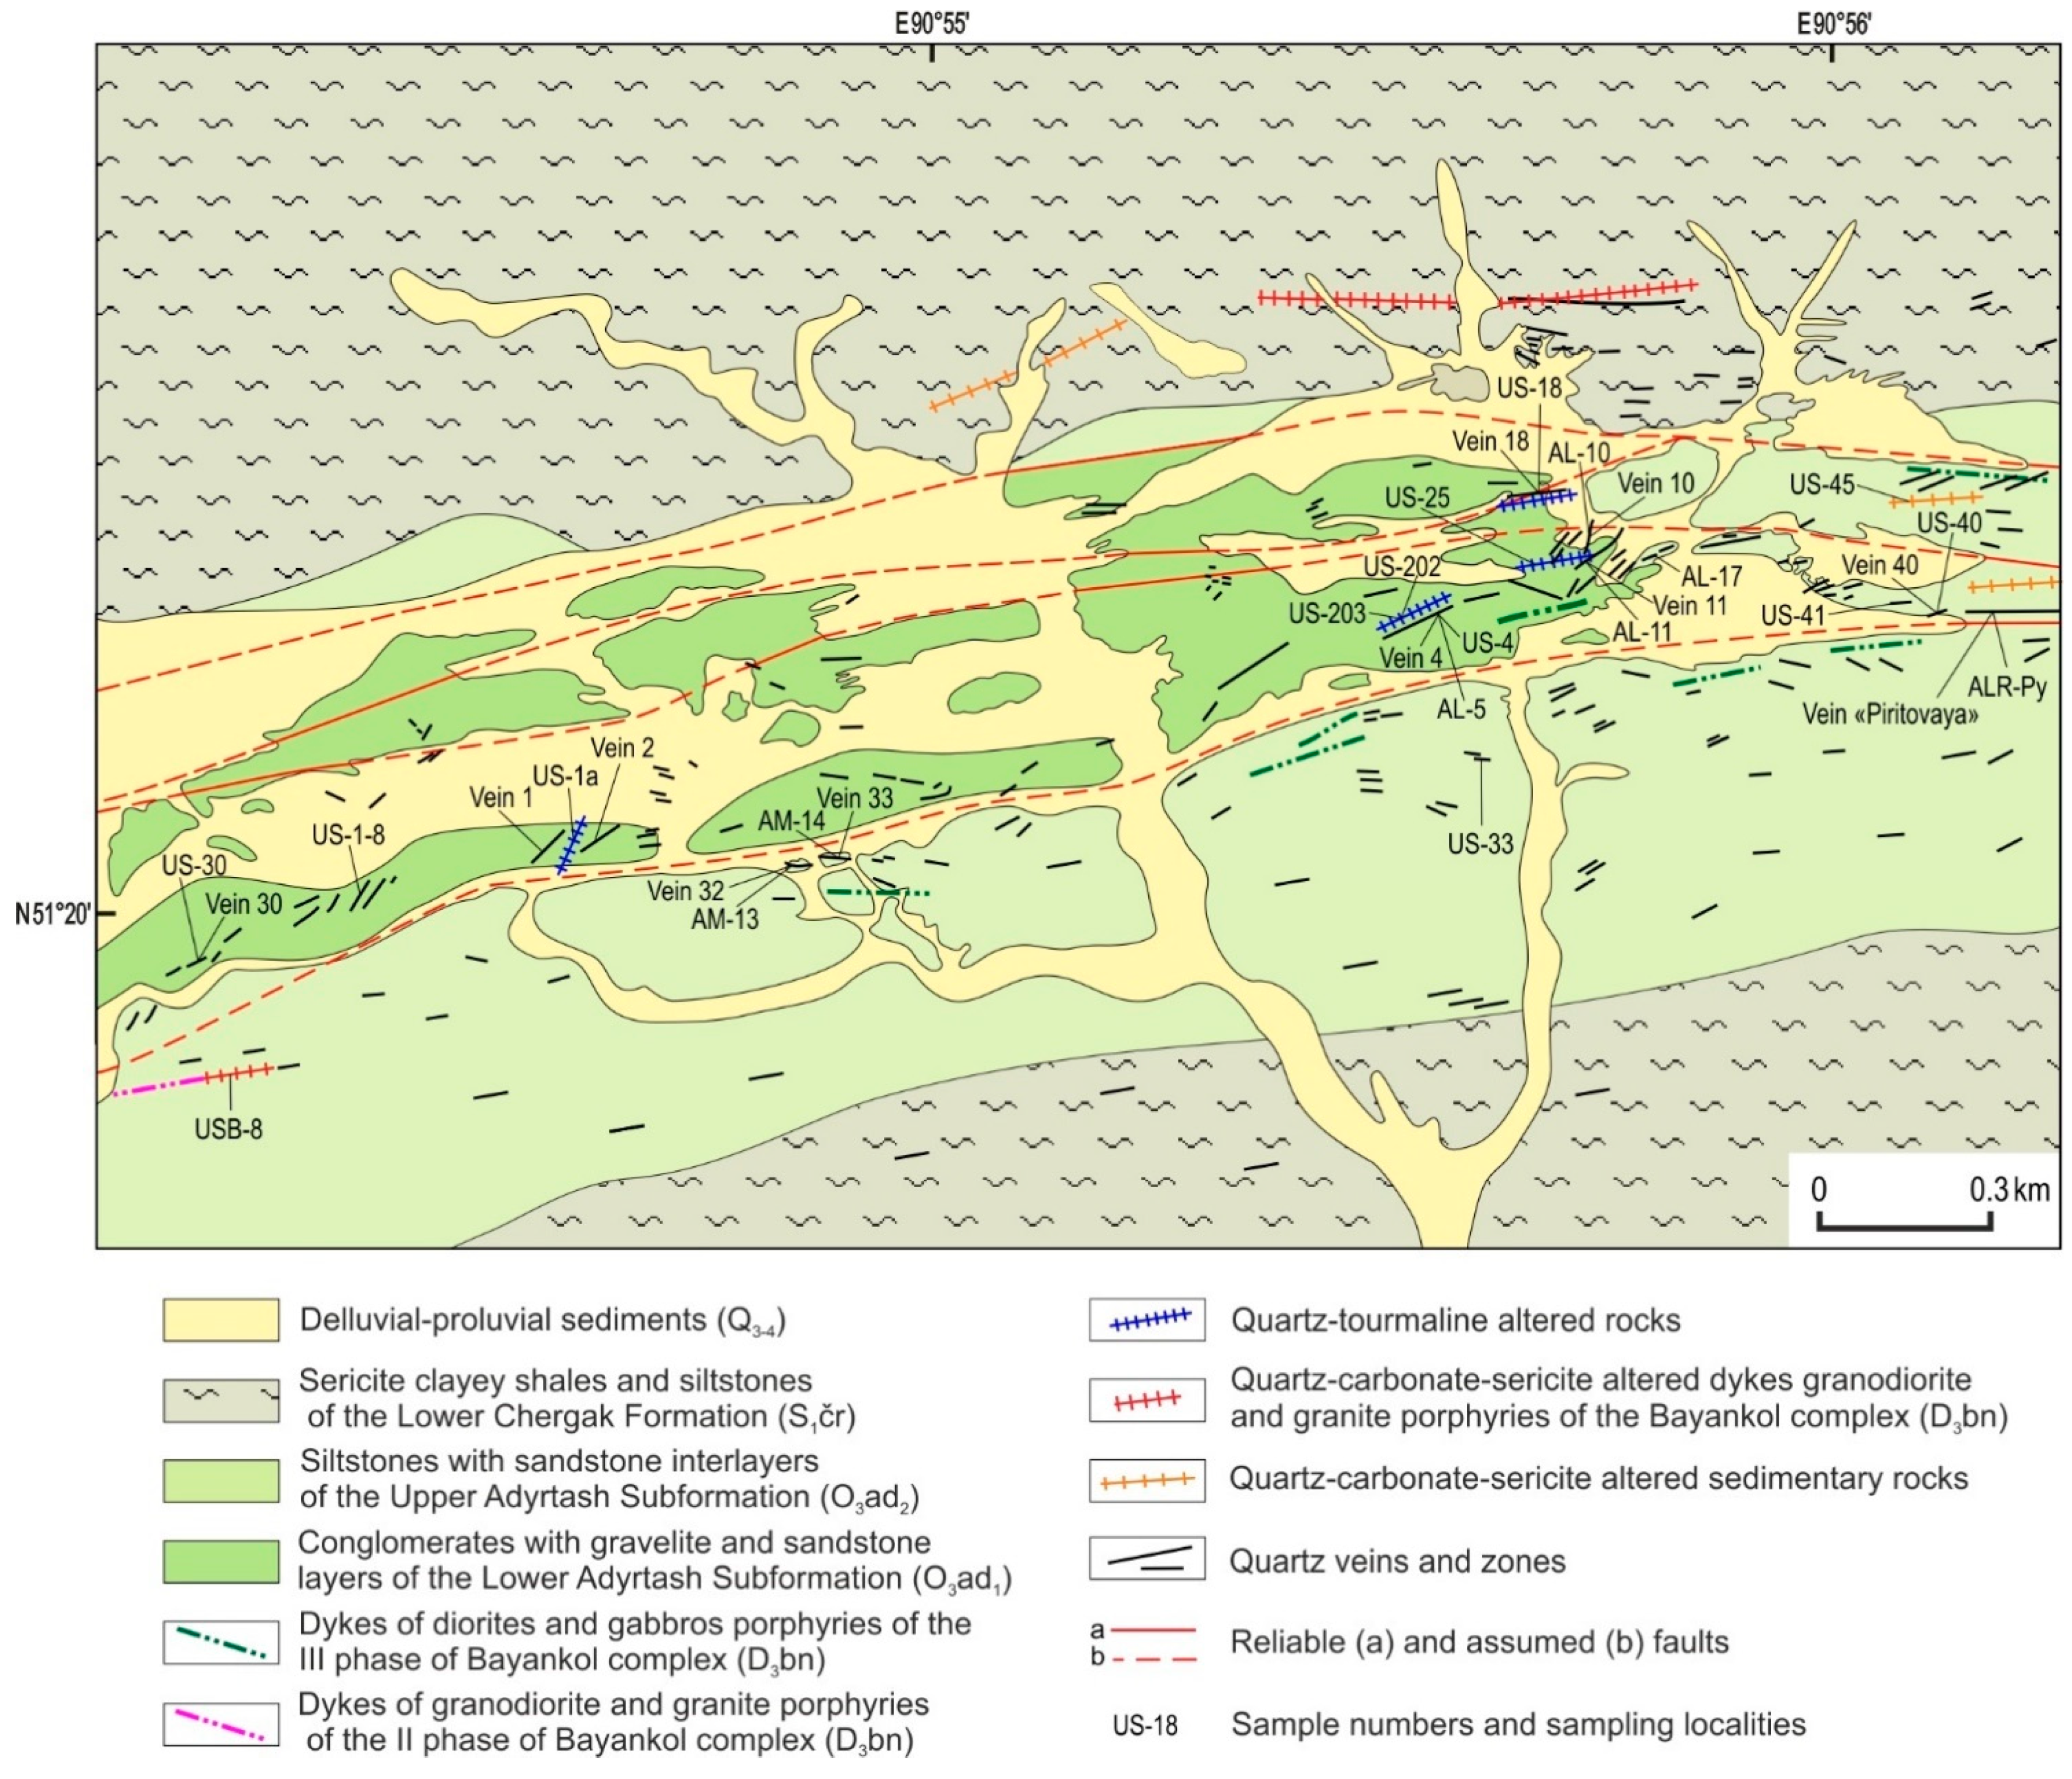
2. Geological Setting
3. Methods
4. Results
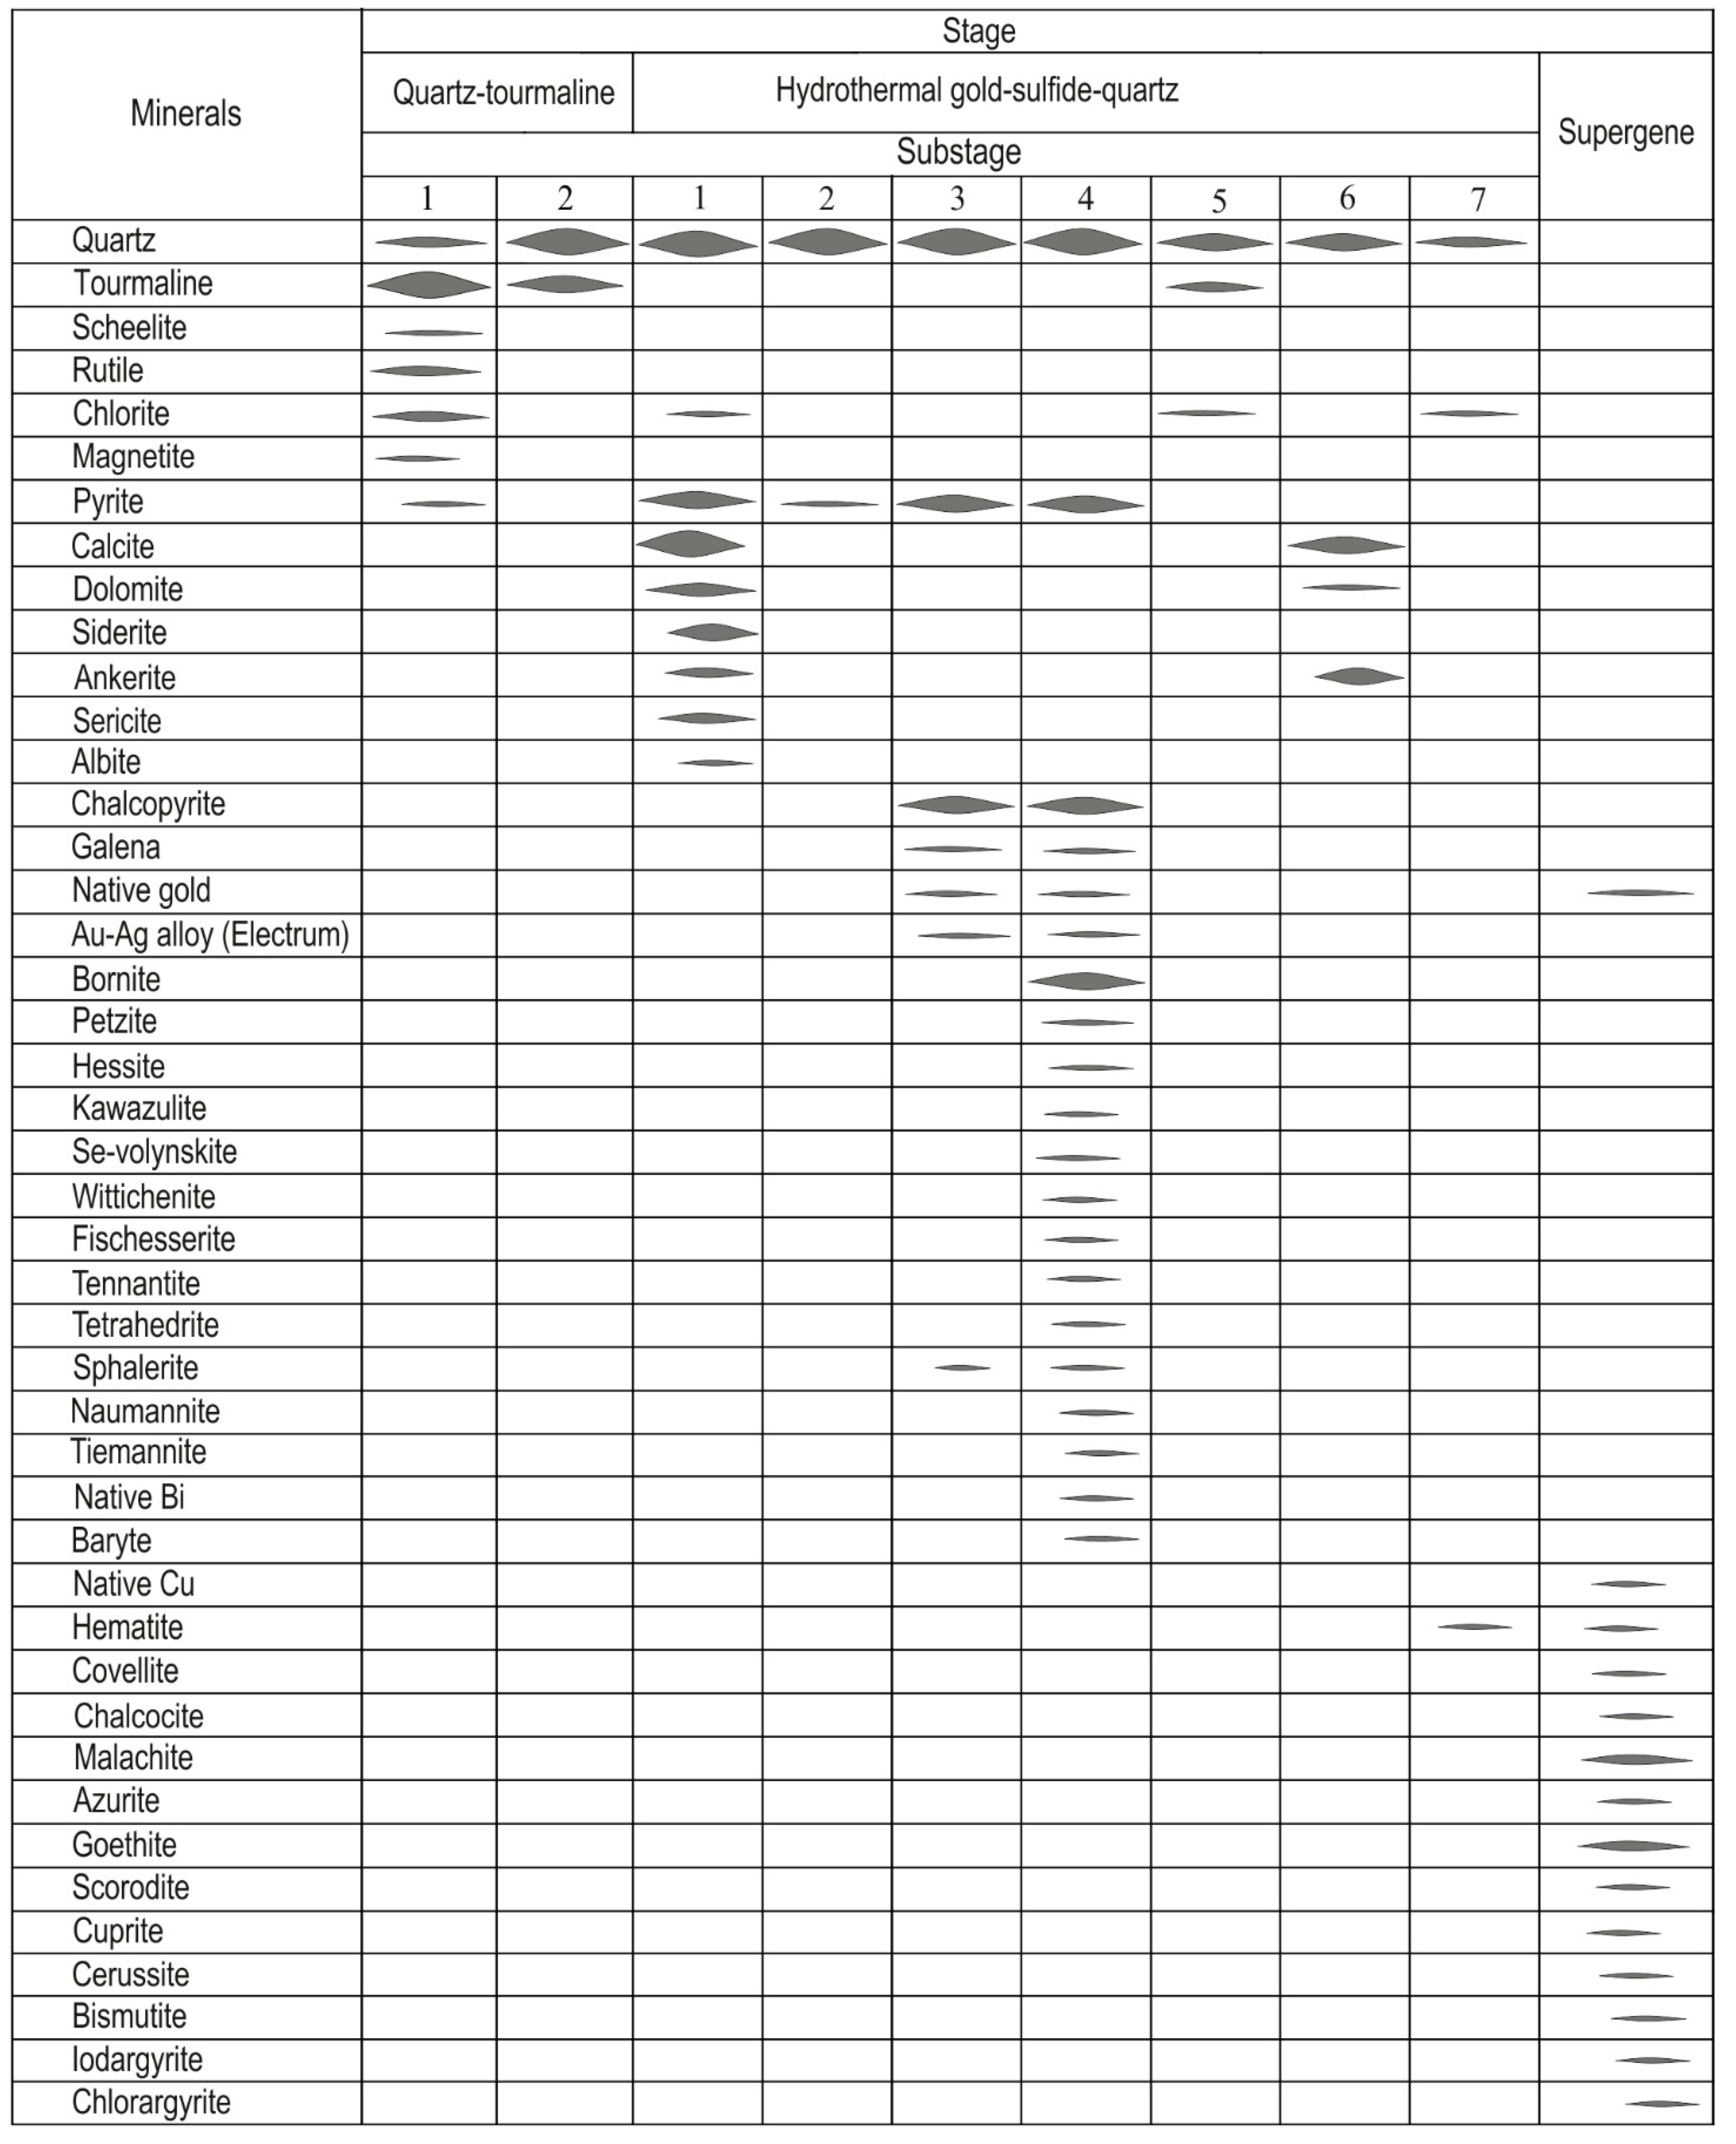
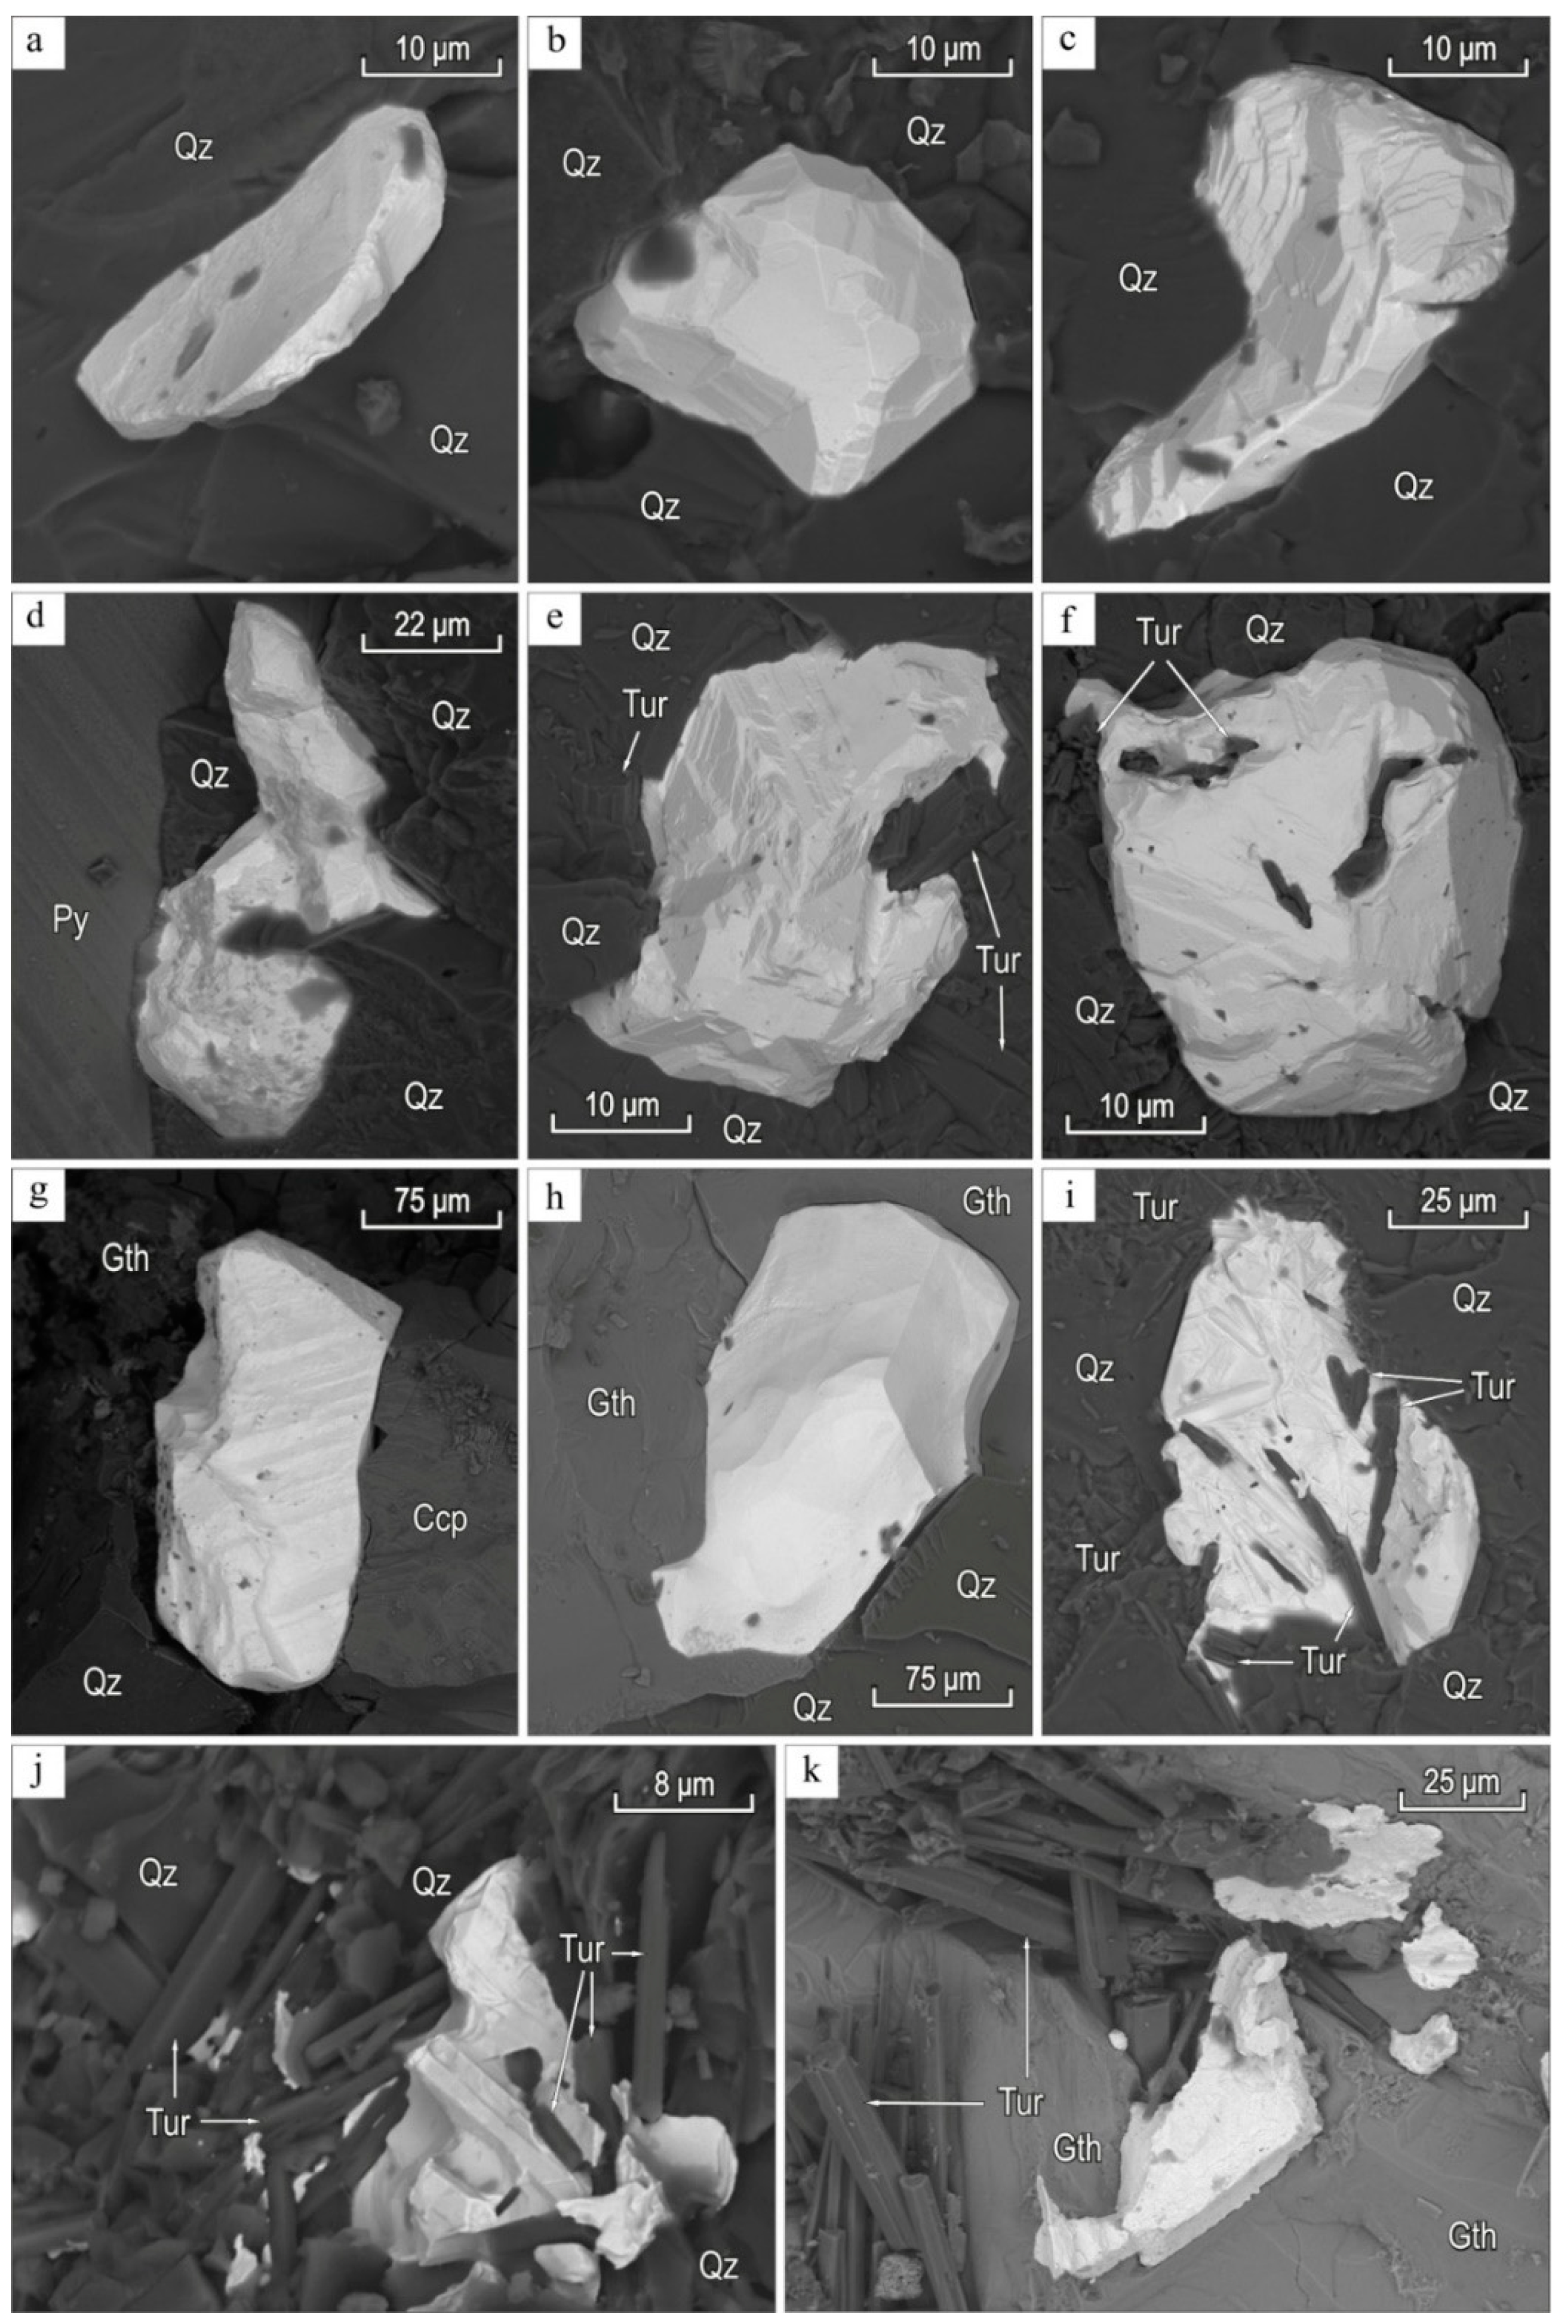
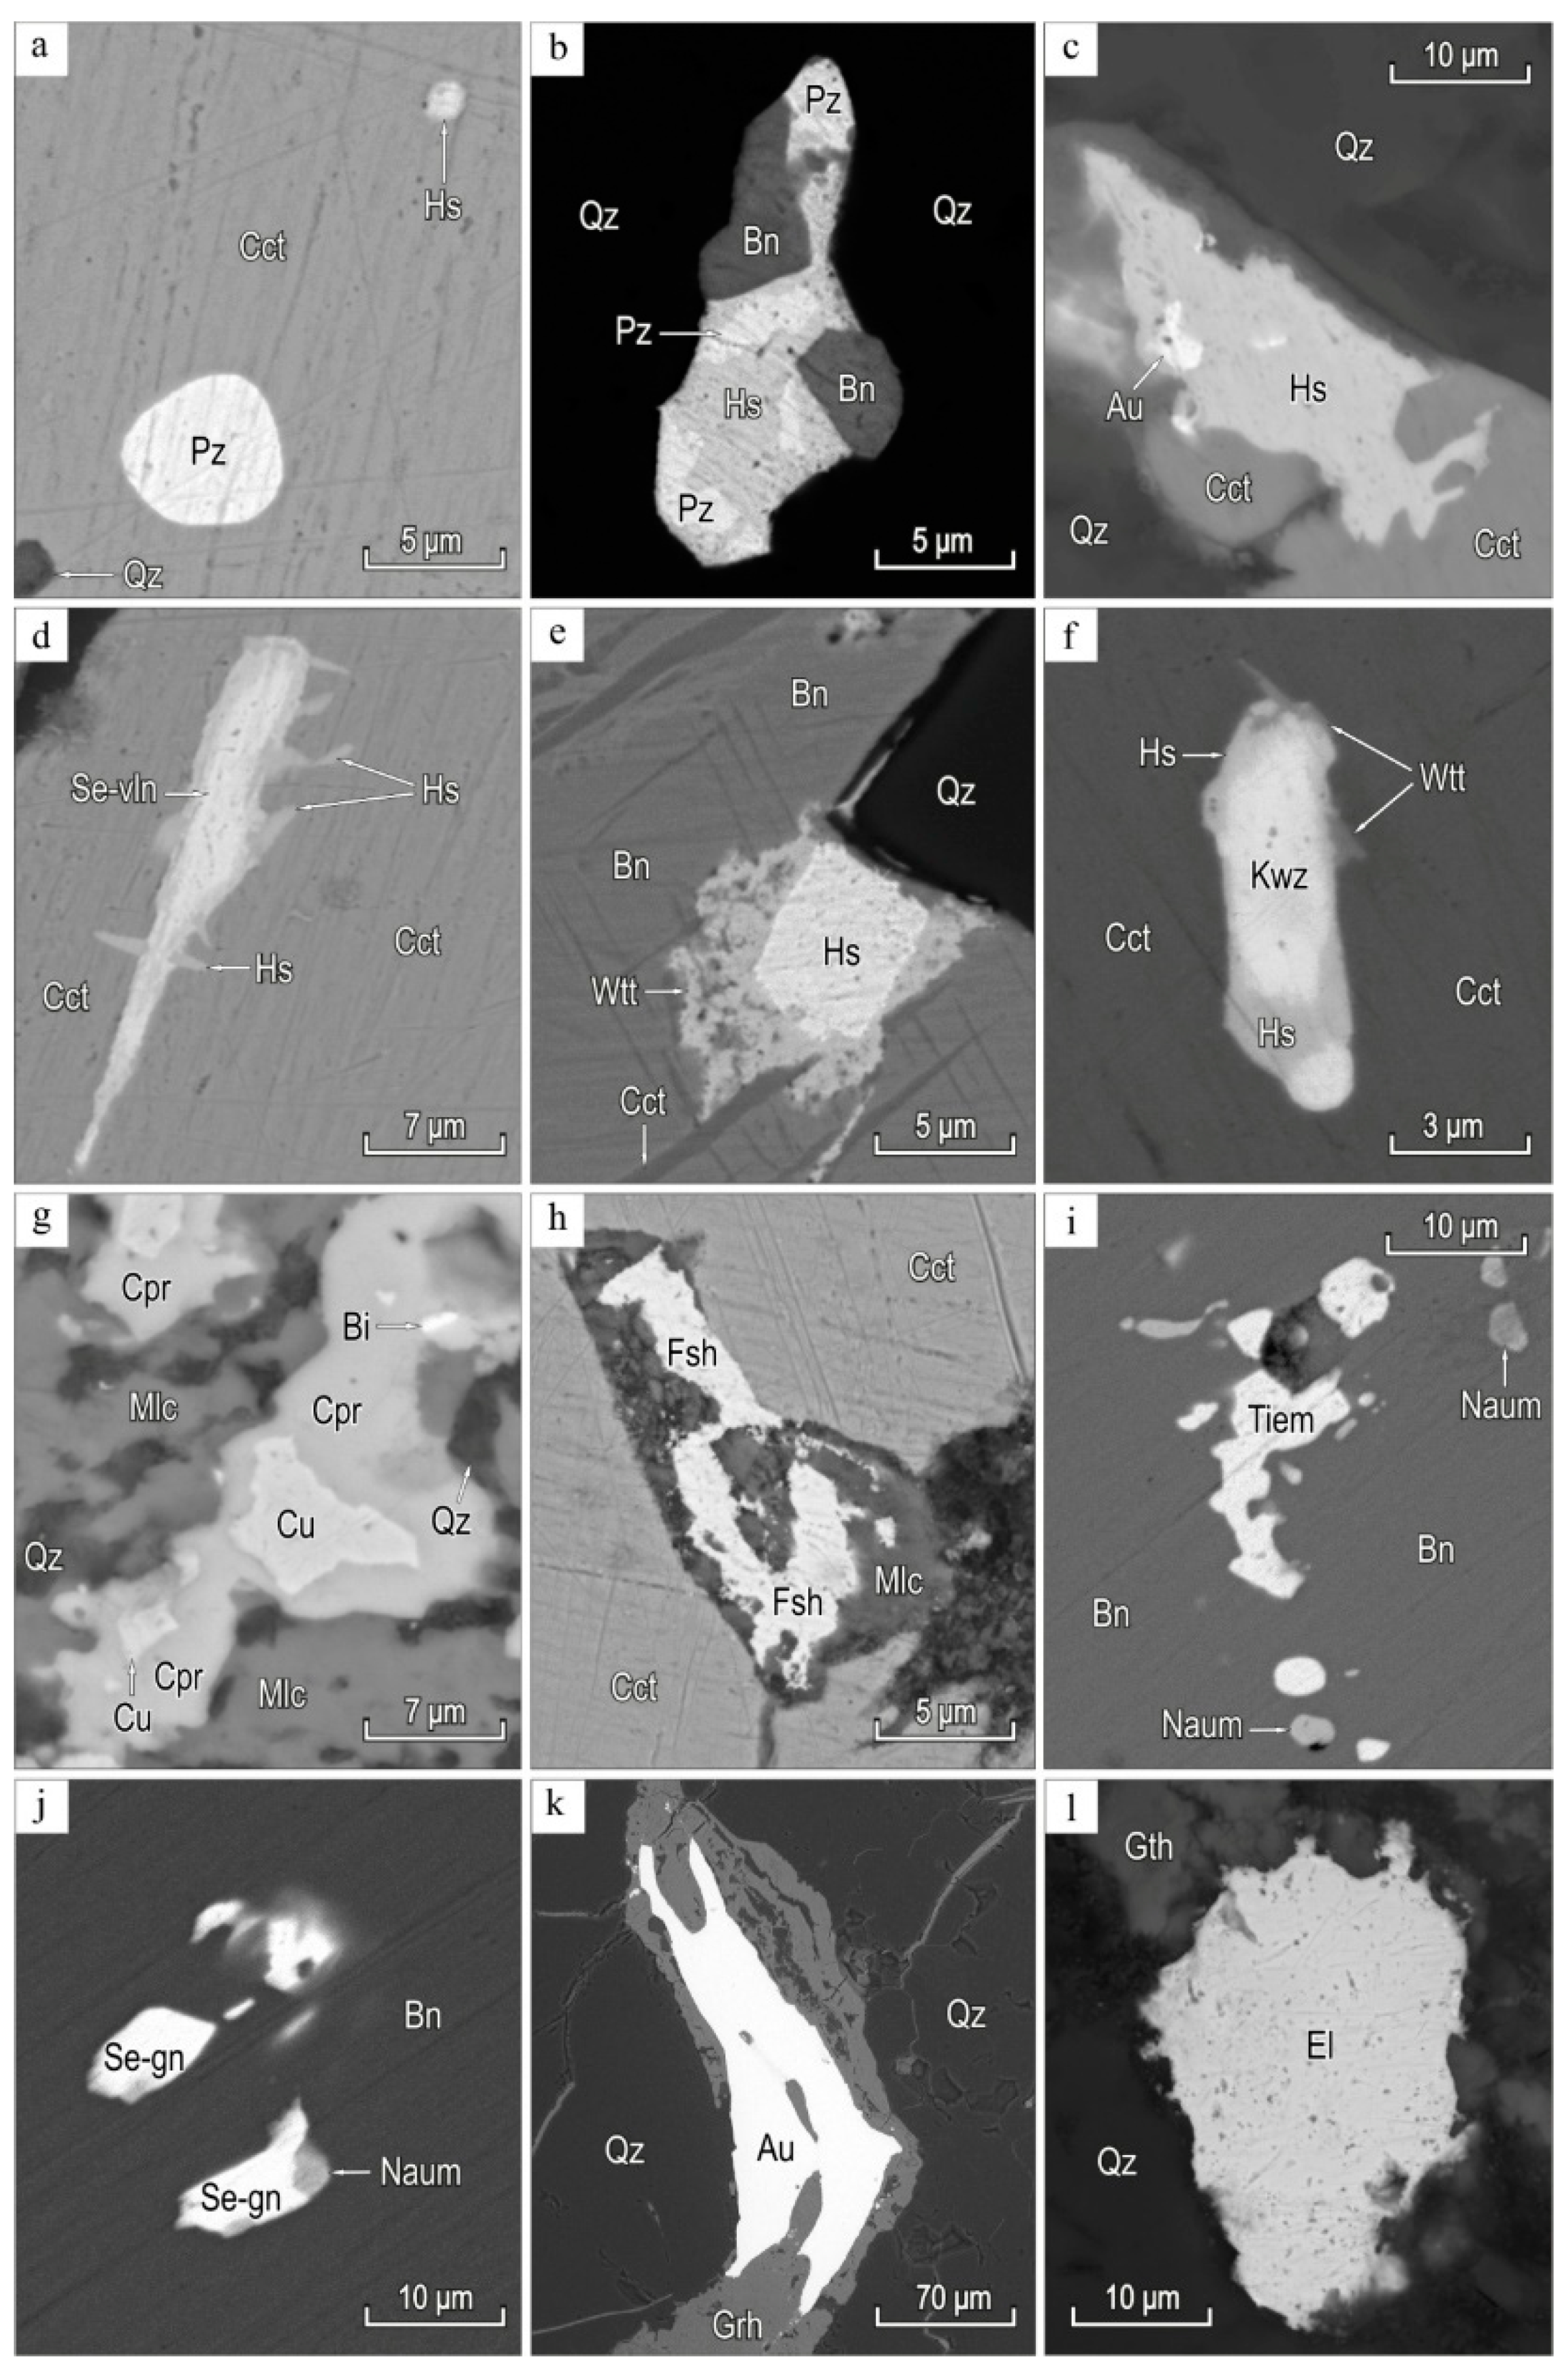
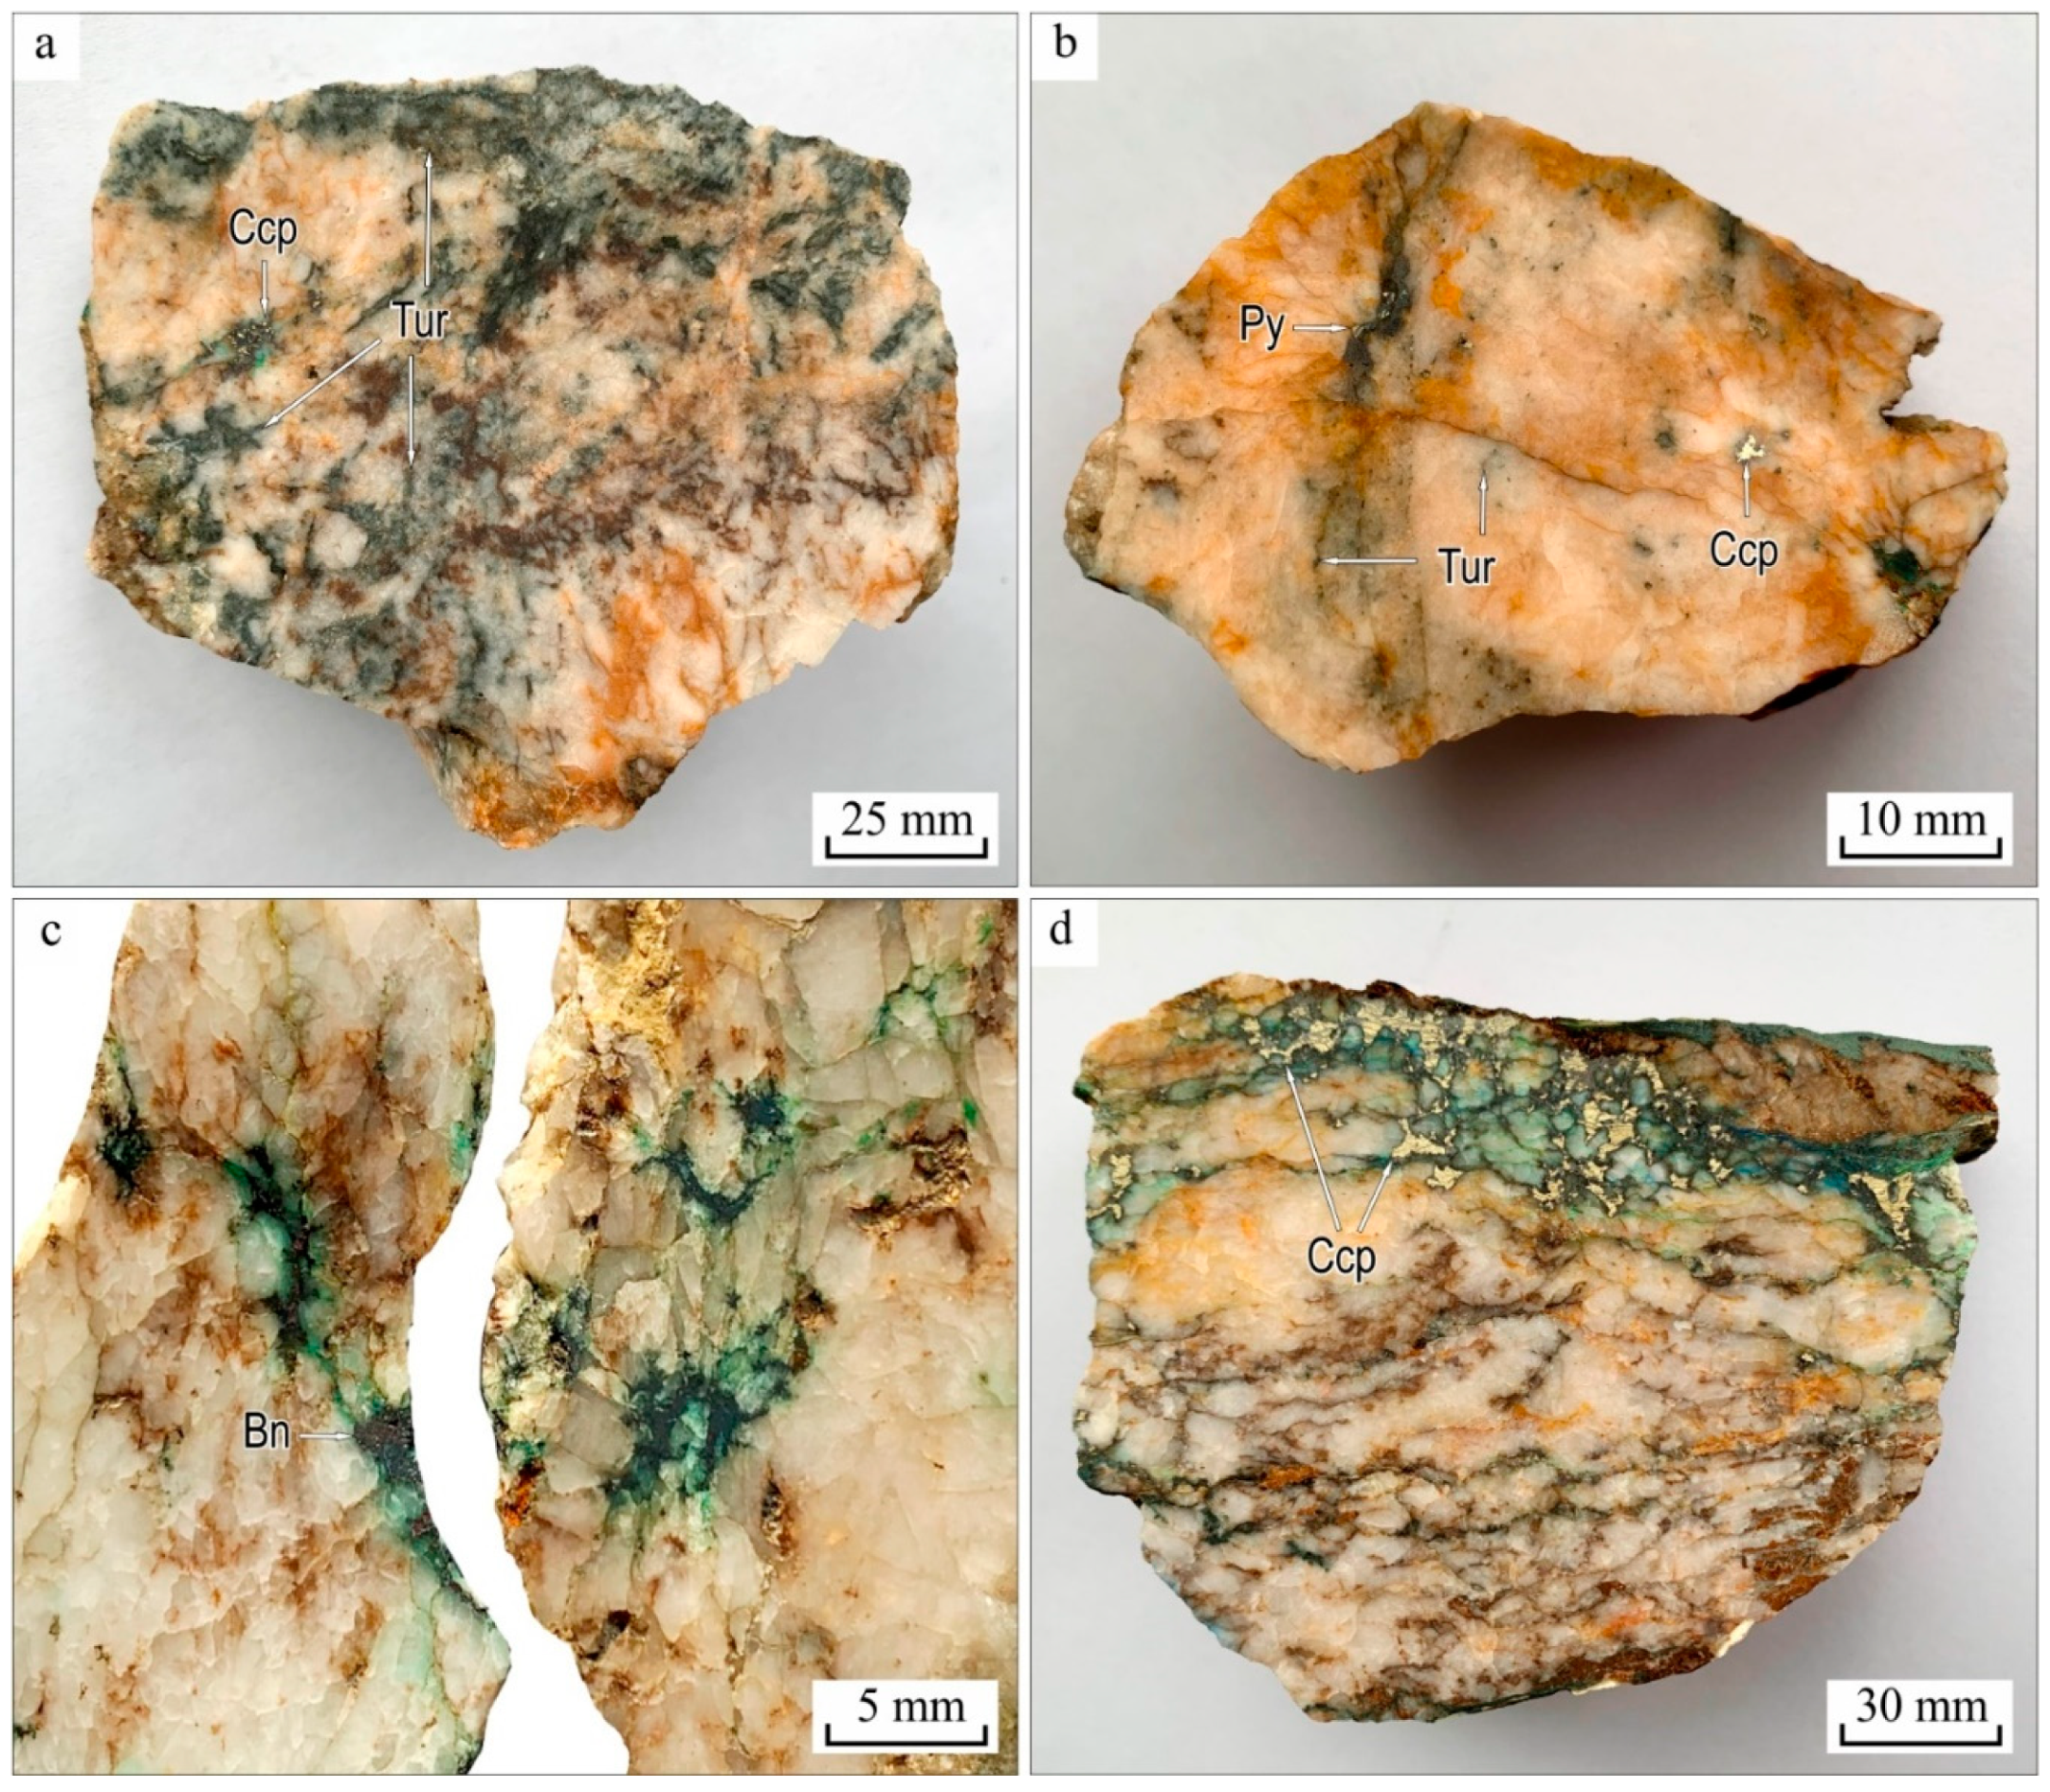
4.1. Mineralogy
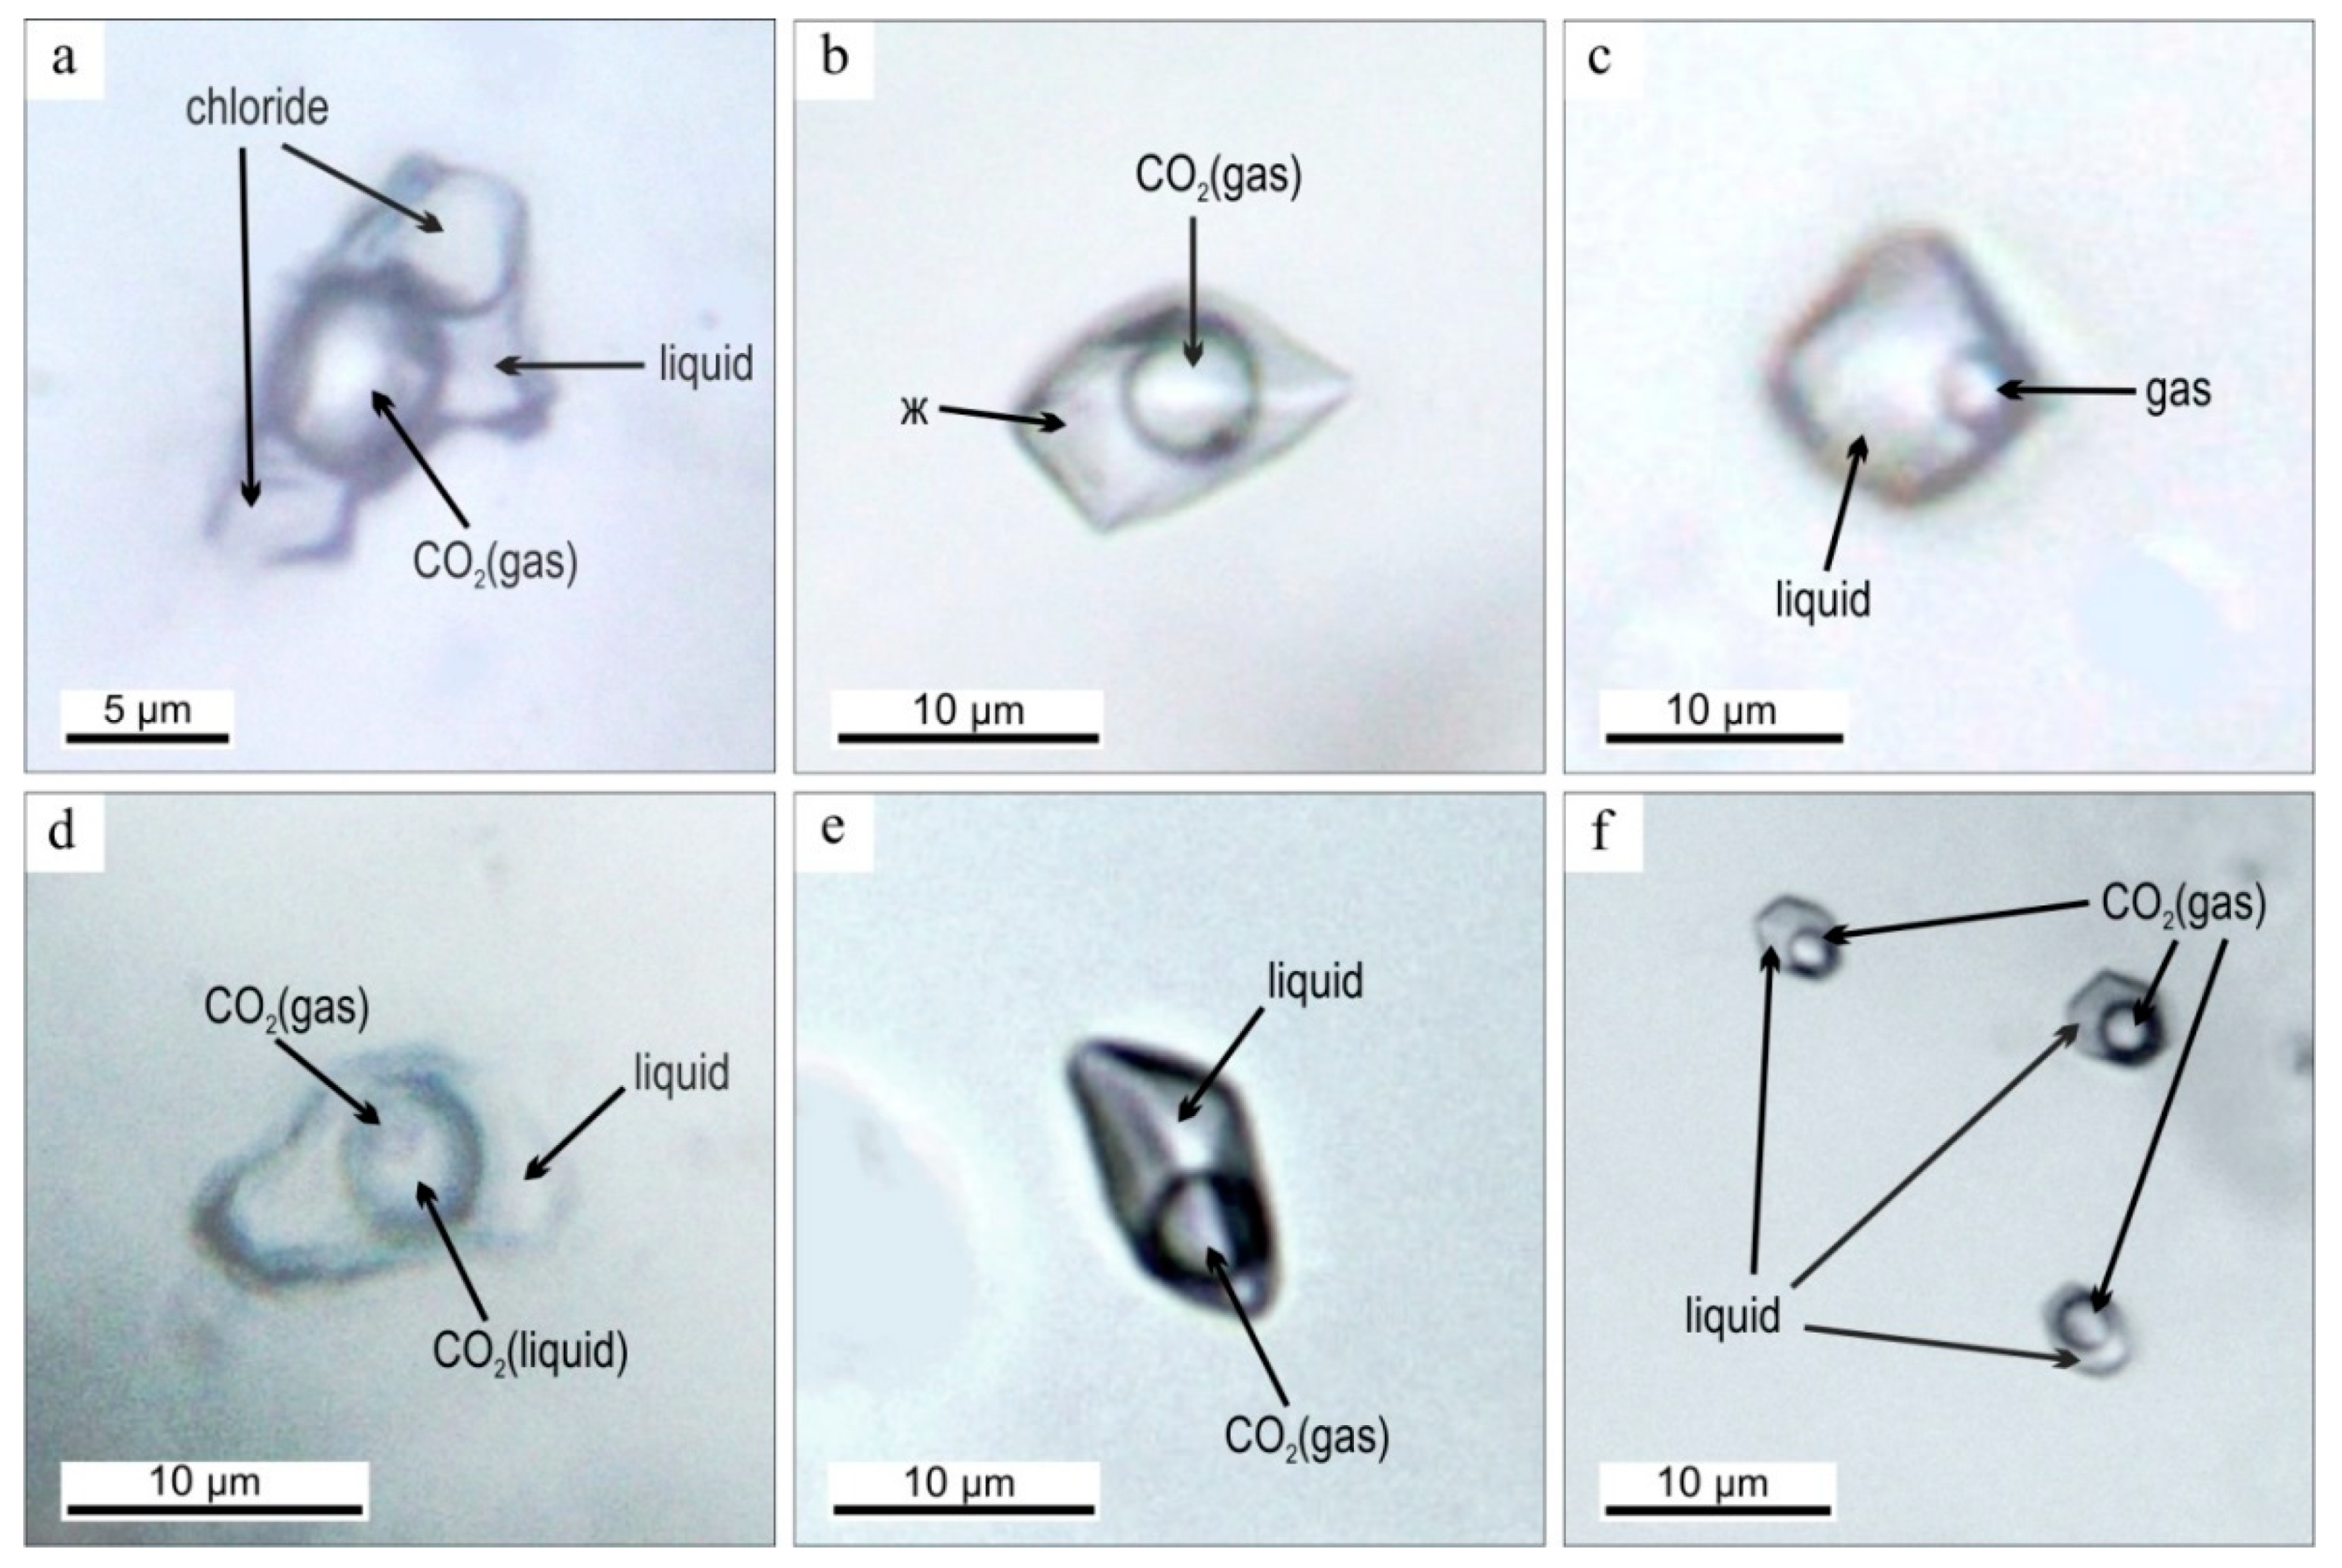
4.2. Fluid Inclusions
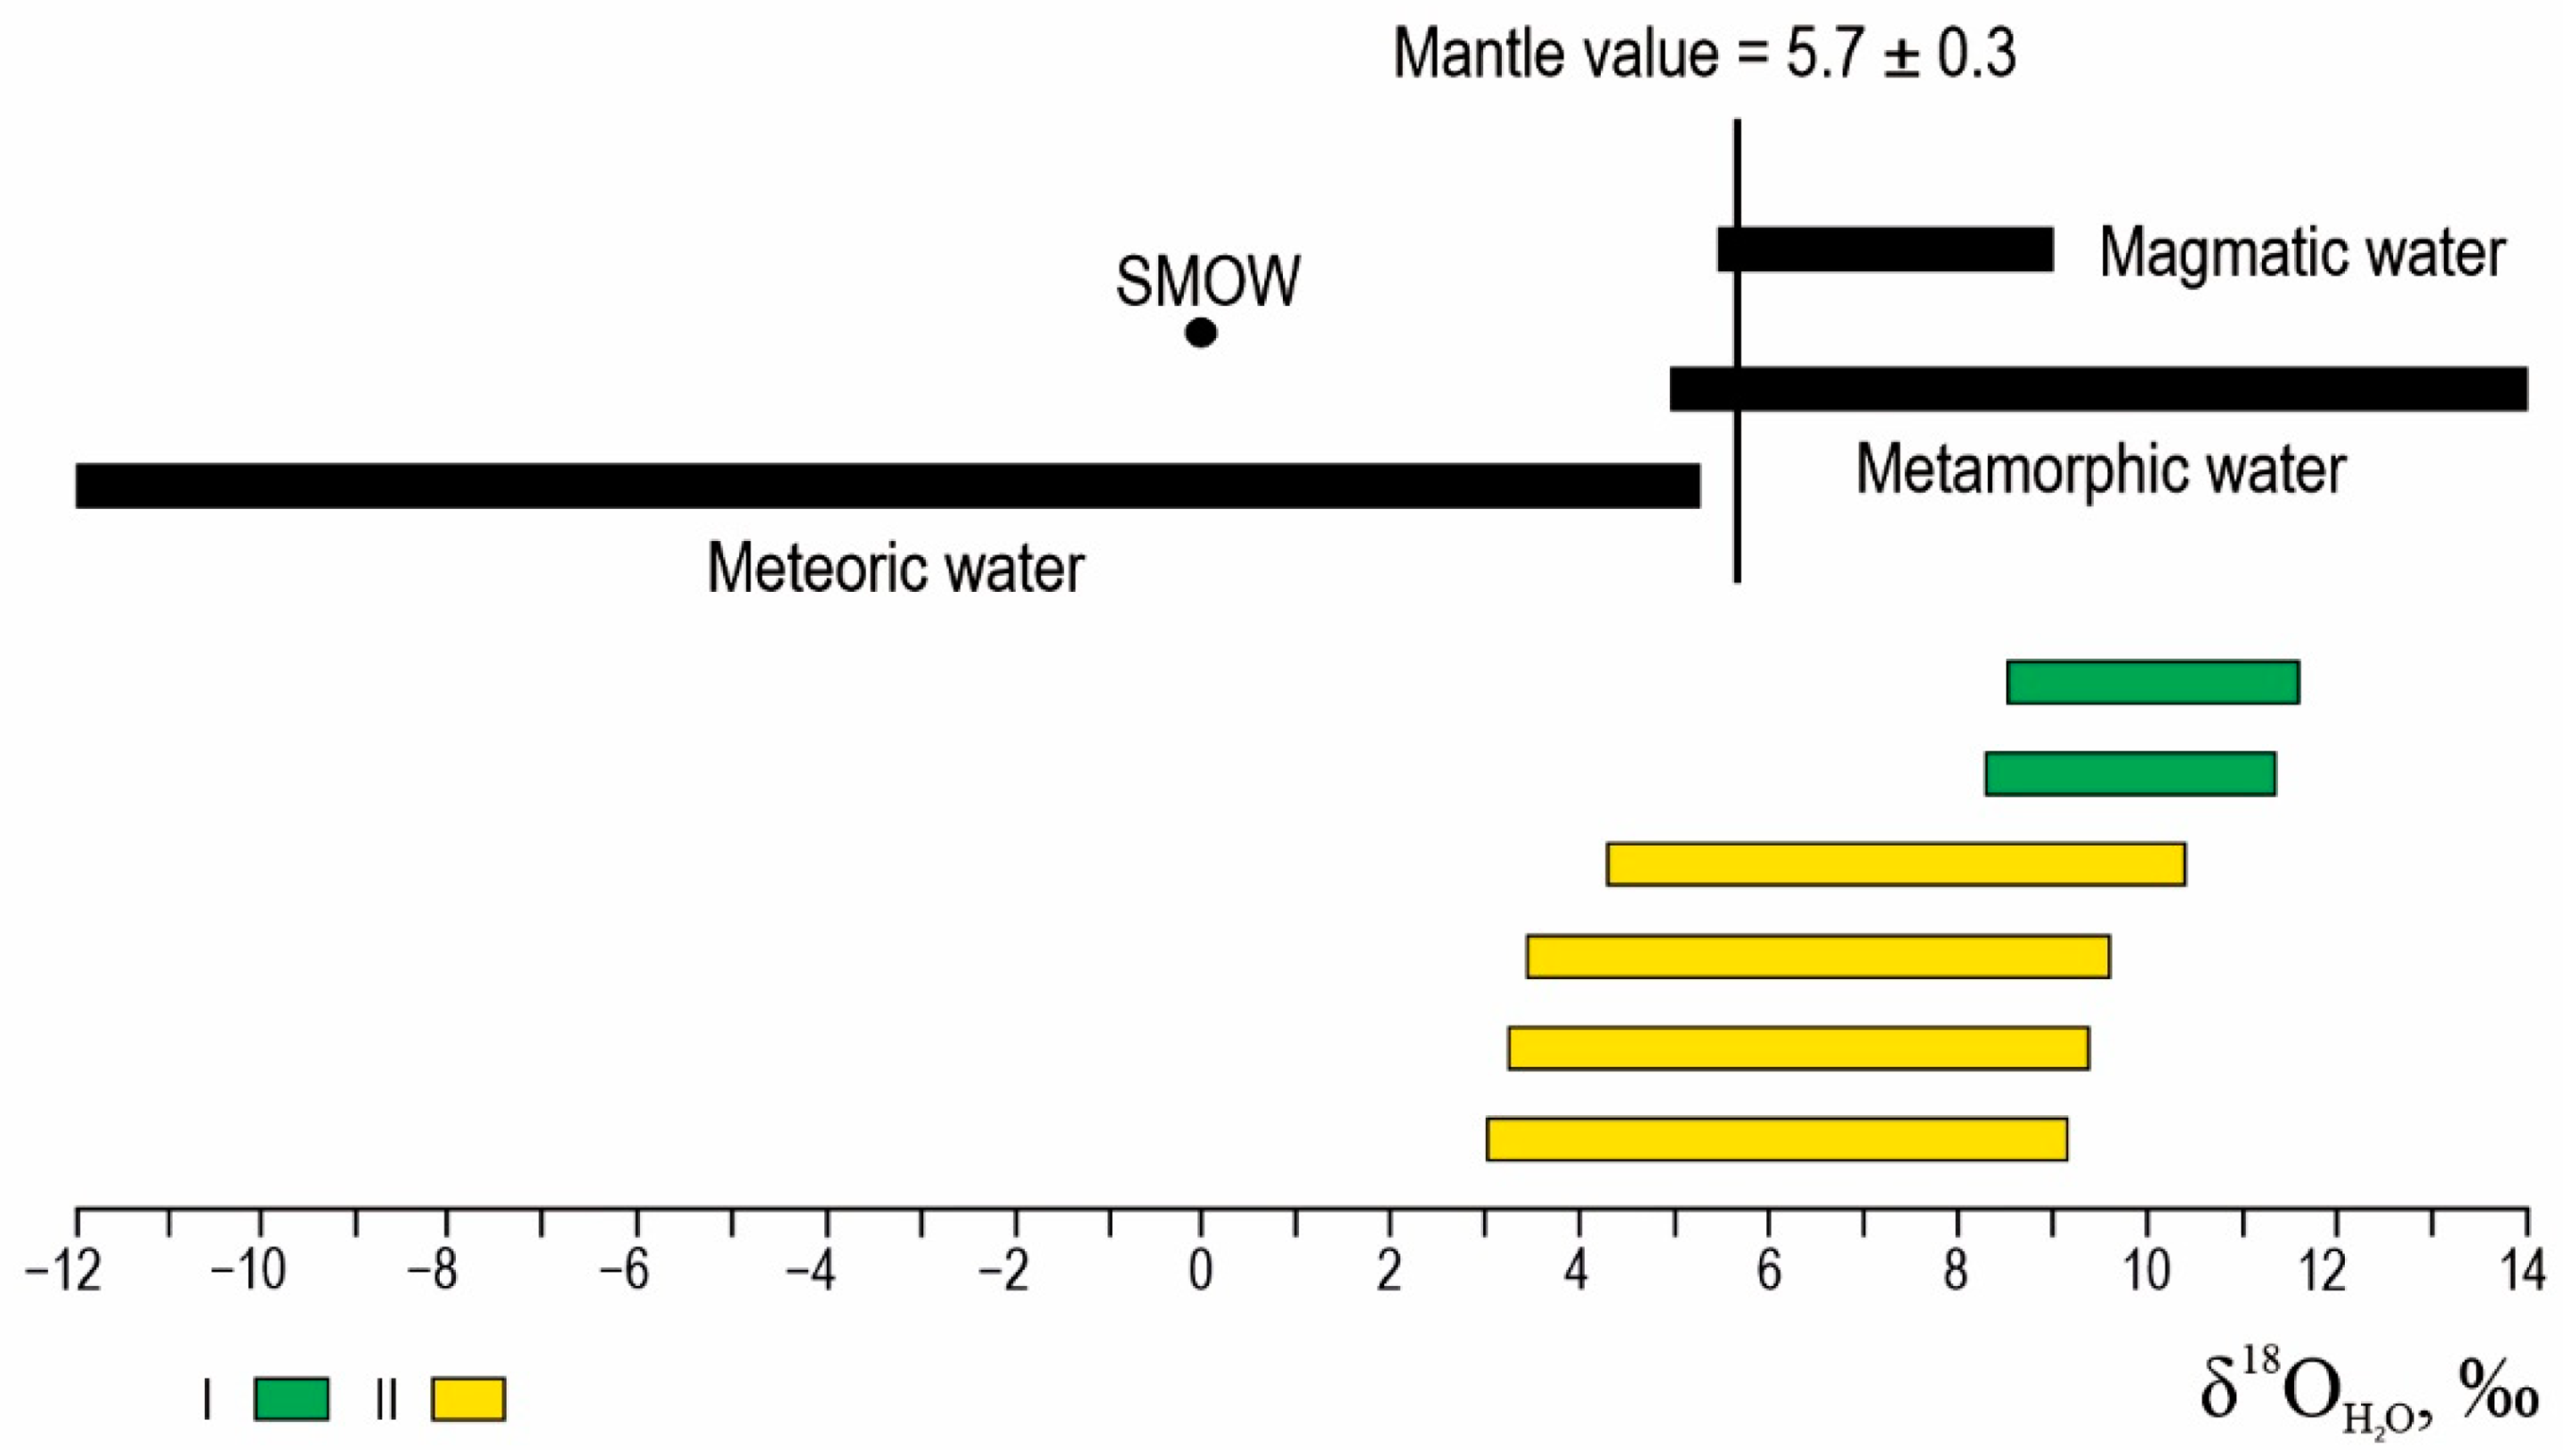
4.3. Fluid Isotopic Composition of S and O
5. Discussion
6. Conclusions
Author Contributions
Funding
Data Availability Statement
Acknowledgments
Conflicts of Interest
References
- Cook, N.J.; Ciobanu, C.L.; Spry, P.G.; Voudouris, P.; the participants of IGCP-486. Understanding gold-(silver)-telluride-(selenide) mineral deposits. Episodes 2009, 32, 249–263. [Google Scholar] [CrossRef] [Green Version]
- Cooke, D.R.; Deyell, C.L.; Waters, P.J.; Gonzales, R.I.; Zaw, K. Evidence for magmatic-hydrothermal fluids and ore-forming processes in epithermal and porphyry deposits of the Baguio District, Philippines. Econ. Geol. 2011, 106, 1399–1424. [Google Scholar] [CrossRef]
- Gamyanin, G.N.; Goncharov, V.I.; Goryachev, N.A. Gold-Raremetal deposits of northeastern Russia. Tikhookeanskaya 1998, 17, 94–103. [Google Scholar]
- Goryachev, N.A.; Gamyanin, G.N. Gold-Bismuth (Gold-Raremetal) Deposits of North East Russia: Types, and Exploration Perspectives. Gold ore Deposits of East Russia; NESC FEB RAS: Magadan, Russian, 2006; pp. 50–62. [Google Scholar]
- Hedenquist, J.W.; Arribas, A., Jr.; Reynolds, T.J. Evolution of an intrusion-centered hydrothermal system: Far Southeast-Lepanto porphyry-epithermal Cu-Au deposits, Philippines. Econ. Geol. 1998, 93, 373–404. [Google Scholar] [CrossRef] [Green Version]
- Sillitoe, R.H.; Thompson, F.H. Intrusion-related vein gold deposits: Types, tectono-magmatic settings, and difficulties of distinction from orogenic gold deposits. Resour. Geol. 1998, 48, 237–250. [Google Scholar] [CrossRef]
- Lang, J.R.; Baker, T. Intrusion related gold systems: The present level of understanding. Miner. Depos. 2001, 36, 477–489. [Google Scholar] [CrossRef]
- Pak, S.J.; Choi, S.-G.; Oh, C.-W.; Heo, C.-H.; Choi, S.-H.; Kim, S.-W. Genetic environment of the intrusion-related Yuryang Au-Te deposit in the Cheonan metallogenic province, Korea. Resour. Geol. 2006, 56, 117–132. [Google Scholar] [CrossRef]
- Rowins, S.M. Reduced porphyry copper-gold deposits: A new variation on an old theme. Geology 2000, 28, 491–494. [Google Scholar] [CrossRef]
- Vikent’eva, O.V.; Prokofiev, V.Y.; Gamyanin, G.N.; Goryachev, N.A.; Bortnikov, N.S. Intrusion-related gold–bismuth deposits of North-East Russia: PTX parameters and sources of hydrothermal fluids. Ore Geol. Rev. 2018, 100, 240–259. [Google Scholar] [CrossRef]
- Smith, M.T.; Thompson, J.F.H.; Bressler, J.; Layer, P.; Mortensen, J.K.; Abe, I.; Takaoka, H. Geology of the Liese Zone, Pogo property, east-central Alaska. SEG Discov. 1999, 38, 1–21. [Google Scholar] [CrossRef]
- Hart, C.J.R.; McCoy, D.; Goldfarb, R.J.; Smith, M.; Roberts, P.; Hulstein, R.; Blake, A.A.; Bundtzen, T.K. Geology, exploration and discovery in the Tintina gold province, Alaska and Yukon. Soc. Econ. Geol. Spec. Publ. 2002, 9, 241–274. [Google Scholar]
- Damdinov, B.B.; Garmaev, B.L.; Mironov, A.G.; Dashinmaev, Z.B. Gold-bismuth mineralization in the southeastern part of the Eastern Sayan. Dokl. Earth Sci. 2009, 425, 256–259. [Google Scholar] [CrossRef]
- Garmaev, B.L.; Damdinov, B.B.; Mironov, A.G. Pogranichnoe Au–Bi occurrence, Eastern Sayan: Composition and link to magmatism. Geol. Ore Deposits. 2013, 55, 455–466. [Google Scholar] [CrossRef]
- Moravek, P. The Mokrsko gold deposit. In Gold Deposits of the Central and SW Part of the Bohemian Massif. Third Biennial Society for Geology Applied to Mineral Deposits Meeting; Moravek, P., Ed.; Excursion Guide: Prague, Czech Republic, 1995; pp. 33–61. [Google Scholar]
- Nie, F.-J.; Jiang, S.-H.; Liu, Y. Intrusion-Related Gold Deposits of North China Craton, People’s Republic of China. Resour. Geol. 2004, 54, 299–324. [Google Scholar] [CrossRef]
- Baker, T.; Pollard, P.J.; Mustard, R.; Mark, G.; Graham, J.L. A comparison of granite-related tin, tungsten, and gold-bismuth deposits: Implications for exploration. SEG Newsl. 2005, 61, 5–17. [Google Scholar] [CrossRef]
- Goryachev, N.A.; Pirajno, F. Gold deposits and gold metallogeny of Far East Russia. Ore Geol. Rev. 2014, 59, 123–151. [Google Scholar] [CrossRef]
- Lindgren, W. Mineral Deposits, 4th ed.; McGraw–Hill Book Company: New York, NY, USA, 1933; p. 930. [Google Scholar]
- Hedenquist, J.W. The ascent of magmatic fluid: Discharge versus mineralization. Mineral. Assoc. Can. Short Course Ser. 1995, 23, 263–289. [Google Scholar]
- Richards, J.P. Alcalic-type epithermal gold deposits—A review. Mineral. Assoc. Can. Short Course Ser. 1995, 23, 367–400. [Google Scholar]
- Shackleton, J.M.; Spry, P.G.; Bateman, R. Telluride mineralogy of the Golden Mile deposit, Kalgoorlie, Western Australia. Can. Mineral. 2003, 41, 1503–1524. [Google Scholar] [CrossRef] [Green Version]
- Spry, P.; Foster, F.; Truckle, J.; Chadwick, T. The mineralogy of the Golden Sunlight gold–silver telluride deposit, Whitehall, Montana, USA. Mineral. Petrol. 1997, 59, 143–164. [Google Scholar] [CrossRef]
- Kelley, K.D.; Romberger, S.B.; Beaty, D.W.; Pontius, J.A.; Snee, L.W.; Stein, H.J.; Thompson, T.B. Geochemical and geochronological constraints on the genesis of Au-Te Deposits at Cripple Creek, Colorado. Econ. Geol. 1998, 93, 981–1012. [Google Scholar] [CrossRef]
- Ahmad, H.; Solomon, M.; Walshe, J.L. Mineralogical and geochemical studies of the Emperor gold telluride deposit, Fiji. Econ. Geol. 1987, 82, 345–370. [Google Scholar] [CrossRef]
- Pals, D.; Spry, P. Telluride mineralogy of the low-sulfidation epithermal Emperor gold deposit, Vatukoula, Fiji. Mineral. Petrol. 2003, 79, 285–307. [Google Scholar] [CrossRef]
- Cooke, D.R.; McPhail, D. Epithermal Au–Ag–Te mineralization, Acupan, Baguio district, Philippines: Numerical simulations of mineral deposition. Econ. Geol. 2001, 96, 109–131. [Google Scholar]
- Vikent’eva, O.; Prokofiev, V.; Borovikov, A.; Kryazhev, S.; Groznova, E.; Pritchin, M.; Vikentyev, I.; Bortnikov, N. Contrasting Fluids in the Svetlinsk Gold-Telluride Hydrothermal System, South Urals. Minerals 2020, 10, 37. [Google Scholar] [CrossRef] [Green Version]
- Zaykov, V.V.; Melekestseva, I.Y.; Ankusheva, N.N.; Mongush, A.A.; Kuzhuget, R.V. The Aldan-Maadyr gold-bearing zone in Hg-listvenites and tourmaline altered rocks, Republic of Tuva: Mineralogy, forming conditions and resources. In Large Igneous Provinces of Asia, Mantle Plumes and Metallogeny: Abs. of the International Symposium; Sibprint: Novosibirsk, Russia, 2009; pp. 414–417. [Google Scholar]
- Kuzhuget, R.V.; Zaykov, V.V.; Lebedev, V.I.; Mongush, A.A. Gold mineralization of the Khaak-Sair gold-quartz ore occurrence in listwanites (western Tuva). Russ. Geol. Geophys. 2015, 56, 1332–1348. [Google Scholar] [CrossRef]
- Berzin, N.A.; Kungurtsev, L.V. Geodynamic interpretation of Altai–Sayan Geological complexes. Russ. Geol. Geophys. 1996, 37, 56–73. [Google Scholar]
- Kuzhuget, R.V.; Ankusheva, N.N.; Redina, A.A.; Prokopyev, I.R.; Ponomarchuk, A.V. Khaak-Sair gold-sulfide-quartz ore occurrence (Western Tuva): Dating, PT parameters, fluid composition, and isotopes of S, O and C. Bull. Tomsk. Polytech. Univ. Geo Assets Eng. 2021, 332, 148–163. [Google Scholar] [CrossRef]
- Kuzhuget, R.V.; Ankusheva, N.N.; Redina, A.A.; Prokopevd, I.R.; Ondar, E.V. Aryskan gold-sulphide-quartz ore occurrence (Western Tuva): Conditions of formation and geochemical peculiarities of fluid. Bull. Tomsk. Polytech. Univ. Geo Assets Eng. 2020, 331, 224–237. [Google Scholar] [CrossRef]
- Kuzhuget, R.V. Gold-Telluride Mineralization of the Aldan-Maadyr Ore Cluster (Western Tuva): Mineralogical and Geochemical Features of Ores and Conditions for Their Formation. Ph.D. Thesis, TuvIENR SB RAS, Novosibirsk, Russia, 2014; p. 20. [Google Scholar]
- Spenser, R.J.; Moller, N.; Weare, J.N. The prediction of mineral solubilities in mineral waters: A chemical equilibrium model for the Na-K-Ca-Mg-Cl-SO4 system at temperatures below 25 °C. Geochim. Et Cosmochim. Acta 1990, 54, 575–590. [Google Scholar] [CrossRef]
- Davis, D.W.; Lowenstein, T.K.; Spenser, R.J. Melting behavior of fluid inclusions in laboratory-grown halite crystals in the systems NaCl-H2O, NaCl-KCl-H2O, NaCl-MgCl2-H2O, and CaCl2-NaCl-H2O. Geochim. Cosmochim. Acta 1990, 54, 591–601. [Google Scholar] [CrossRef]
- Bodnar, R.J.; Vityk, M.O. Interpretation of microthermometric data for H2O–NaCl fluid inclusions. In Fluid Inclusions in Minerals: Methods and Applications; De Vivo, B., Frezzotti, M.L., Eds.; Fluids Research Laboratory, Department of Geological Sciences, Virginia Tech: Blacksburg, VA, USA, 1994; pp. 117–130. [Google Scholar]
- Roedder, E. Fluid inclusions. In Reviews in Mineralogy and Geochemistry; De Gruyter: Berlin, Germany, 1984; Volume 12, p. 646. [Google Scholar]
- Barton, P.B.; Skinner, B.J. Sulfide mineral stabilities. In Geochemistry of Hydrothermal Ore Deposits; Barnes, H.L., Ed.; Willey & Sons: New York, NY, USA, 1979; pp. 278–403. [Google Scholar]
- Afifi, A.M.; Kelly, W.C.; Essene, E.J. Phase relations among tellurides, sulphides and oxides: I. Thermochemical data and calculated equilibria. Econ. Geol. 1988, 83, 377–404. [Google Scholar] [CrossRef]
- Zhuravkova, T.V.; Palyanova, G.A.; Kalinin, Y.A.; Goryachev, N.A.; Zinina, V.Y.; Zhitova, L.M. Physicochemical conditions of formation of gold and silver parageneses at the valunistoe deposit (Chukchi peninsula). Russ. Geol. Geophys. 2019, 60, 1247–1256. [Google Scholar] [CrossRef]
- Palyanova, G.A.; Savva, N.E.; Zhuravkova, T.V.; Kolova, E.E. Minerals of gold and silver in pyrites of low-sulfide ores of the Juliet deposit (North-East of Russia). Russ. Geol. Geophys. 2016, 57, 1488–1510. [Google Scholar] [CrossRef]
- Brown, P.E. Flincor: A microcomputer program for the reduction and investigation of fluid inclusion data. Am. Miner. 1989, 74, 1390–1393. [Google Scholar]
- Kryazhev, S.G.; Prokof’ev, V.Y.; Vasyuta, Y.V. Use of method ICP MS at the analysis of composition of ore-forming fluids. Vestn. MSU Geol. 2006, 4, 30–36. [Google Scholar]
- Prokofiev, V.Y.; Kiseleva, G.D.; Dolomanova-Topol, A.A.; Borisovsky, S.E.; Trubkin, N.V.; Magazina, L.V.; Kryazhev, S.G.; Krasnov, A.N.; Zorina, L.D. Mineralogy and Formation Conditions of Novoshirokinsky Base Metal–Gold Deposit, Eastern Transbaikal Region, Russia. Geol. Ore Deposits. 2017, 59, 521–550. [Google Scholar] [CrossRef]
- Kita, I.; Matsubaya, O. F2-technique for the oxygen isotopic analysis of silica minerals. Rep. Res. Inst. Nat. Resour. Min. Coll. Akita Univ. 1983, 48, 25–33. [Google Scholar]
- Ohmoto, H.; Rye, R.O. Isotopes of Sulfur and Carbon. Geochemistry of Hydrothermal Ore Deposits; Wiley: New York, NY, USA, 1979; pp. 509–567. [Google Scholar]
- Li, Y.; Liu, J. Calculation of sulfur isotope fractionation in sulfides. Geochim. Cosmochim. Acta 2006, 70, 1789–1795. [Google Scholar] [CrossRef]
- Ohmoto, H. Stable isotope geochemistry of ore deposits. In Stable Isotopes in High Temperature Geological Processes. Rev. Mineral. Geochem. 1986, 16, 491–560. [Google Scholar]
- Hoefs, J. Stable Isotope Geochemistry; Springer: Berlin/Heidelberg, Germany, 2009; p. 281. [Google Scholar]
- Shikazono, N. A comparison of temperatures estimated from the electrum-sphalerite-pyrite-argentite assemblage and filling temperatures of fluid implications from epitermal Au-Ag vein-type deposits in Japan. Econ. Geol. 1985, 80, 1415–1424. [Google Scholar] [CrossRef]
- Bortnikov, N.S.; Kramer, H.; Genkin, A.D. Paragenesis of tellurides of gold and silver in the gold ore deposit Florencia (Republic of Cuba). Geol. Ore Deposits. 1988, 2, 49–61. [Google Scholar] [CrossRef]
- Zhang, L.-G.; Liu, J.-X.; Zhou, H.B.; Chen, Z.-S. Oxygen isotope fractionation in the quartz-water-salt system. Econ. Geol. 1989, 89, 1643–1650. [Google Scholar] [CrossRef]
- Zheng, Y.F. Oxygen isotope fractionation in carbonate and sulfate minerals. Geochem. J. 1999, 33, 109–126. [Google Scholar] [CrossRef] [Green Version]
- Vikent’eva, O.V.; Bortnikov, N.S.; Vikentyev, I.V.; Groznova, E.O.; Lyubimtseva, N.G.; Murzin, V.V. The Berezovsk Giant Intrusion-Related Gold Quartz deposit, Urals, Russia: Evidence for Multiple Magmatic and Metamorphic Fluid Reservoirs. Ore Geol. Rev. 2017, 91, 837–863. [Google Scholar] [CrossRef]
- Bortnikov, N.S. Geochemistry and the origin of ore-forming fluids in hydrothermal-magmatic systems in tectonically active zones. Geol. Ore Depos. 2006, 48, 3–28. [Google Scholar] [CrossRef]
- Belogub, E.V.; Melekestseva, I.Y.; Novoselov, K.A.; Zabotina, M.V.; Tretyakov, G.A.; Zaykov, V.V.; Yuminov, A.M. Listvenite-related gold deposits of the South Urals (Russia): A review. Ore Geol. Rev. 2017, 85, 247–270. [Google Scholar] [CrossRef]
- Borisenko, A.S.; Lebedev, V.I.; Obolensky, A.S.; Zaykov, V.V.; Tyulkin, V.G. Physical and chemical conditions for the formation of hydrothermal deposits in Western Tuva. In Basic Parameters of Natural Processes of Endogenous Ore Formation; Nauka: Novosibirsk, Russia, 1979; pp. 226–235. [Google Scholar]
- Goldfarb, R.J.; Groves, D.I. Orogenic gold: Common or evolving fluid and metal sources through time. Lithos 2015, 233, 2–26. [Google Scholar] [CrossRef]
- Prokof’ev, V.; Zorina, L.; Reyf, F.; Ishkov, Y.; Kudryavtseva, O.; Baksheev, I. Conditions of Gold Mineralization by Boron-Rich Fluids. In Proceedings of the 17th International Conference European Current Research on Fluid Inclusions, Budapest, Hungary, 5–7 June 2003; Acta Mineralogica-Petrographica Abstract Series 2. pp. 165–166. [Google Scholar]
- Kun, L.; Ruidong, Y.; Wenyong, C.; Rui, L.; Ping, T. Trace element and REE geochemistry of the Zhewang gold deposit, southeastern Guizhou Province. Chin. J. Geochem. 2014, 3, 109–118. [Google Scholar] [CrossRef]
- Wilkinson, J.J. Fluid inclusions in hydrothermal ore deposits. Lithos 2001, 55, 229–272. [Google Scholar] [CrossRef]
- Groves, D.I.; Goldfarb, R.J.; Gebre-Mariam, M.; Hagemann, S.G.; Robert, F. Orogenic gold deposits: A proposed classification in the context of their crustal distribution and relationship to other gold deposit types. Ore Geol. Rev. 1998, 13, 7–27. [Google Scholar] [CrossRef]
- Ridley, J.R.; Diamond, L.W. Fluid chemistry of orogenic lode gold deposits and implications for genetic models. SEG Rev. 2000, 13, 141–162. [Google Scholar] [CrossRef]
- Phillips, G.N.; Powell, R. Formation of gold deposits: A metamorphic devolatilization model. J. Metamorph. Geol. 2010, 28, 689–718. [Google Scholar] [CrossRef]
- Groves, D.I.; Santosh, M.; Deng, J.; Wang, Q.; Yang, L.; Zhang, L. A holistic model for the origin of orogenic gold deposits and its implications for exploration. Miner. Depos. 2020, 55, 275–292. [Google Scholar] [CrossRef]
- Kouhestani, H.; Pashidnejad-Omran, N.; Rastad, E.; Mohajjol, M.; Goldfarb, R.; Ghaderi, M. Orogenic gold mineralization at the Chah Bagh deposit, Muteh gold district, Iran. J. Asian Earth Sci. 2014, 91, 89–106. [Google Scholar] [CrossRef]
- Wang, C.; Shao, Y.-J.; Evans, N.J.; Li, H.; Zhou, H.-D.; Huang, K.-X.; Liu, Z.-F.; Chen, Y.; Lai Ch Liu, Q.-Q. Genesis of Zixi gold deposit in Xuefengshan, Jiangnan Orogen (South China): Age, geology and isotopic constraints. Ore Geol. Rev. 2020, 117, 103301. [Google Scholar] [CrossRef]
- Izvekova, A.D.; Damdinov, B.B.; Damdinova, L.B.; Moskvitina, M.L. Gold-telluride mineralization in ore of Pionerskoe goldquartz deposit (Eastern Sayan, Russia). Geol. Ore Depos. 2021, 63, 579–598. [Google Scholar] [CrossRef]


| № | Au | Ag | Hg | Pb | Te | Se | S | Total | Crystallochemical Formula |
|---|---|---|---|---|---|---|---|---|---|
| Petzite | |||||||||
| 1 | 25.21 | 41.56 | – | – | 32.69 | – | – | 99.46 | Ag3.00Au1.00Te2.00 |
| 2 | 25.10 | 41.55 | – | – | 33.15 | – | – | 99.80 | Ag2.99Au0.99Te2.02 |
| Hessite | |||||||||
| 3 | – | 63.12 | – | – | 36.47 | – | – | 99.59 | Ag2.02Te0.98 |
| 4 | – | 62.22 | – | – | 37.29 | – | – | 99.51 | Ag1.99Te1.01 |
| 5 | – | 62.29 | – | – | 37.47 | – | – | 99.76 | Ag1.99Te1.01 |
| 6 | – | 62.08 | – | – | 37.34 | – | – | 99.42 | Ag1.99Te1.01 |
| 7 | – | 62.38 | – | – | 36.86 | – | – | 99.24 | Ag2.00Te1.00 |
| 8 | – | 62.25 | – | – | 37.55 | – | – | 99.80 | Ag1.99Te1.01 |
| 9 | – | 61.85 | – | – | 37.37 | – | – | 99.22 | Ag1.99Te1.01 |
| 10 | – | 62.64 | – | – | 36.76 | – | – | 99.40 | Ag2.01Te0.99 |
| Fischesserite | |||||||||
| 11 | 27.95 | 48.70 | – | – | – | 23.07 | – | 99.72 | Au0.96Ag3.06Se1.98 |
| 12 | 27.39 | 48.86 | – | – | – | 23.27 | – | 99.52 | Au0.94Ag3.06Se2.00 |
| 13 | 26.12 | 49.16 | – | 0.70 | 0.32 | 23.36 | – | 99.66 | (Au0.89Pb0.03)0.91Ag3.07(Se1.99Te0.02)2.01 |
| 14 | 26.74 | 48.60 | – | 0.98 | 0.62 | 22.57 | – | 99.51 | (Au0.92Pb0.03)0.95Ag3.07(Se1.95Te0.03)1.97 |
| Naumannite | |||||||||
| 15 | – | 72.69 | – | – | – | 26.52 | – | 99.21 | Ag2.00Se1.00 |
| 16 | – | 74.75 | – | – | – | 22.91 | 1.80 | 99.46 | Ag2.00(Se0.84S0.16)1.00 |
| Tiemannite | |||||||||
| 17 | – | – | 72.58 | – | – | 26.49 | 0.76 | 99.83 | Hg1.00(Se0.93S0.07)1.00 |
| 18 | – | – | 72.81 | – | – | 25.60 | 1.08 | 99.49 | Hg1.01(Se0.90S0.09)0.99 |
| 19 | – | – | 73.65 | – | – | 23.92 | 1.97 | 99.54 | Hg1.00(Se0.83S0.17)1.00 |
| 20 | – | – | 74.05 | – | – | 26.98 | 2.65 | 99.76 | Hg0.99(Se0.79S0.22)1.01 |
| 21 | – | – | 74.76 | – | – | 21.69 | 2.93 | 99.38 | Hg1.01(Se0.74S0.25)0.99 |
| 22 | – | – | 76.69 | – | – | 17.81 | 4.84 | 99.34 | Hg1.01(Se0.59S0.40)0.99 |
| № | Ag | Bi | Cu | Te | Se | S | Total | Crystallochemical Formula |
|---|---|---|---|---|---|---|---|---|
| Se-volynskite | ||||||||
| 23 | 19.76 | 39.23 | – | 30.58 | 9.59 | – | 99.16 | Ag1.00Bi1.03Te1.31Se0.66 |
| 24 | 20.37 | 39.17 | – | 29.48 | 10.45 | – | 99.47 | Ag1.02Bi1.01Te1.25Se0.72 |
| Kawazulite | ||||||||
| 25 | – | 54.22 | – | 36.01 | 8.98 | – | 99.21 | Bi1.98Te2.15Se0.87 |
| 26 | – | 55.37 | – | 36.50 | 7.79 | – | 99.66 | Bi2.04Te2.20Se0.76 |
| 27 | – | 55.17 | – | 35.56 | 8.74 | – | 99.51 | Bi2.02Te2.13Se0.85 |
| 28 | – | 55.26 | – | 35.55 | 8.28 | – | 99.09 | Bi2.04Te2.15Se0.81 |
| 29 | – | 55.48 | – | 35.61 | 8.78 | – | 99.87 | Bi2.02Te2.13Se0.85 |
| Wittichenite | ||||||||
| 30 | – | 39.93 | 40.09 | – | – | 19.70 | 99.72 | Cu3.07Bi0.93S3.00 |
| 31 | – | 40.89 | 39.27 | – | – | 19.38 | 99.54 | Cu3.05Bi0.97S2.98 |
| Sample | FlA | Phases | Thom, °C | Thom CO2, °C | Teut, °C | Tice melt, °C | C, wt %, NaCl eq | D, g/cm3 | P bar | Fluid Salt Composition |
|---|---|---|---|---|---|---|---|---|---|---|
| Quartz–tourmaline veins | ||||||||||
| US-202 | P | VL | 343–365 | – | −33 to −33.9 | −5.2 to −7.1 | 8.2–10.6 | – | – | MgCl2–H2O + NaCl–KCl–H2O |
| US-203 | PS | VL | 325–350 | – | −23 to −25 | – | – | MgCl2–H2O + NaCl–KCl–H2O | ||
| Quartz–carbonate–sericite-altered rocks | ||||||||||
| USB-8 | P | VL | 350–400 | – | −10 to −8 | −0.4 to −0.1 | 0.18–0.71 | – | – | chloride + CO2 (gas) + CH4 (gas) + N2 (gas) |
| Ps | VL, VLS | 200–240 | – | – | −3.8 to −3 | 4.9–6.1 | – | – | chloride | |
| Gold–sulfide–quartz veins (I) | ||||||||||
| US-18 | P, Ps | VL | 240–360 | – | −21.3 to −38.2 | −6.3 to −3.7 | 6–9.6 | – | – | MgCl2–H2O + NaCl–KCl–H2O |
| US-4 | P | VL | 290–330 | – | – | −8.3 to −4.2– | 6.74–12.51 | – | – | chloride + CO2 (gas) |
| P | VLC | – | 170–180 | – | 1.74–6.45 | 0.51–0.56 | 750–900 | |||
| US-4AL-5 | Ps | VL | 200–240 | – | −21.2 to −38.2 | −4.4 to −2.7 | 4.5–6.8 | – | – | NaCl–KCl–H2O + MgCl2–H2O + CO2 (gas) |
| Gold–telluride–sulfide–quartz veins (II) | ||||||||||
| US-30 | P | VL | 270–330 | – | −20.9 to −32.1 | −4.8 to −2.5 | 4.6–7.4 | – | – | NaCl–KCl–H2O + MgCl2–H2O |
| ALR-Py | Ps | VL | 130–250 | – | −21.3 to −24.9 | −3.5 to −6.3 | 5.0–9.5 | – | – | NaCl–Na2SO4–H2O, NaCl–KCl–H2O and NaCl–Na2B2O5–H2O |
| US-40 US-41 | P | VLC | 230–250 | +4 to +16.8 | – | – | – | – | – | chloride |
| P, Ps | VL | 140–160 | – | – | – | – | – | – | chloride + CO2 (gas) | |
| US-33 | P | VL | 115–170 | – | −22 to −38 | −2.1 to −6.1 | 3.5–9.3 | – | – | NaCl–KCl–H2O + MgCl2–H2O |
| Elements | I | II | Average | ||
|---|---|---|---|---|---|
| Samples | |||||
| US-18 | AM-13 | ALR-Py | AM-14-2 | ||
| Macrocomponents, g/kg H2O | |||||
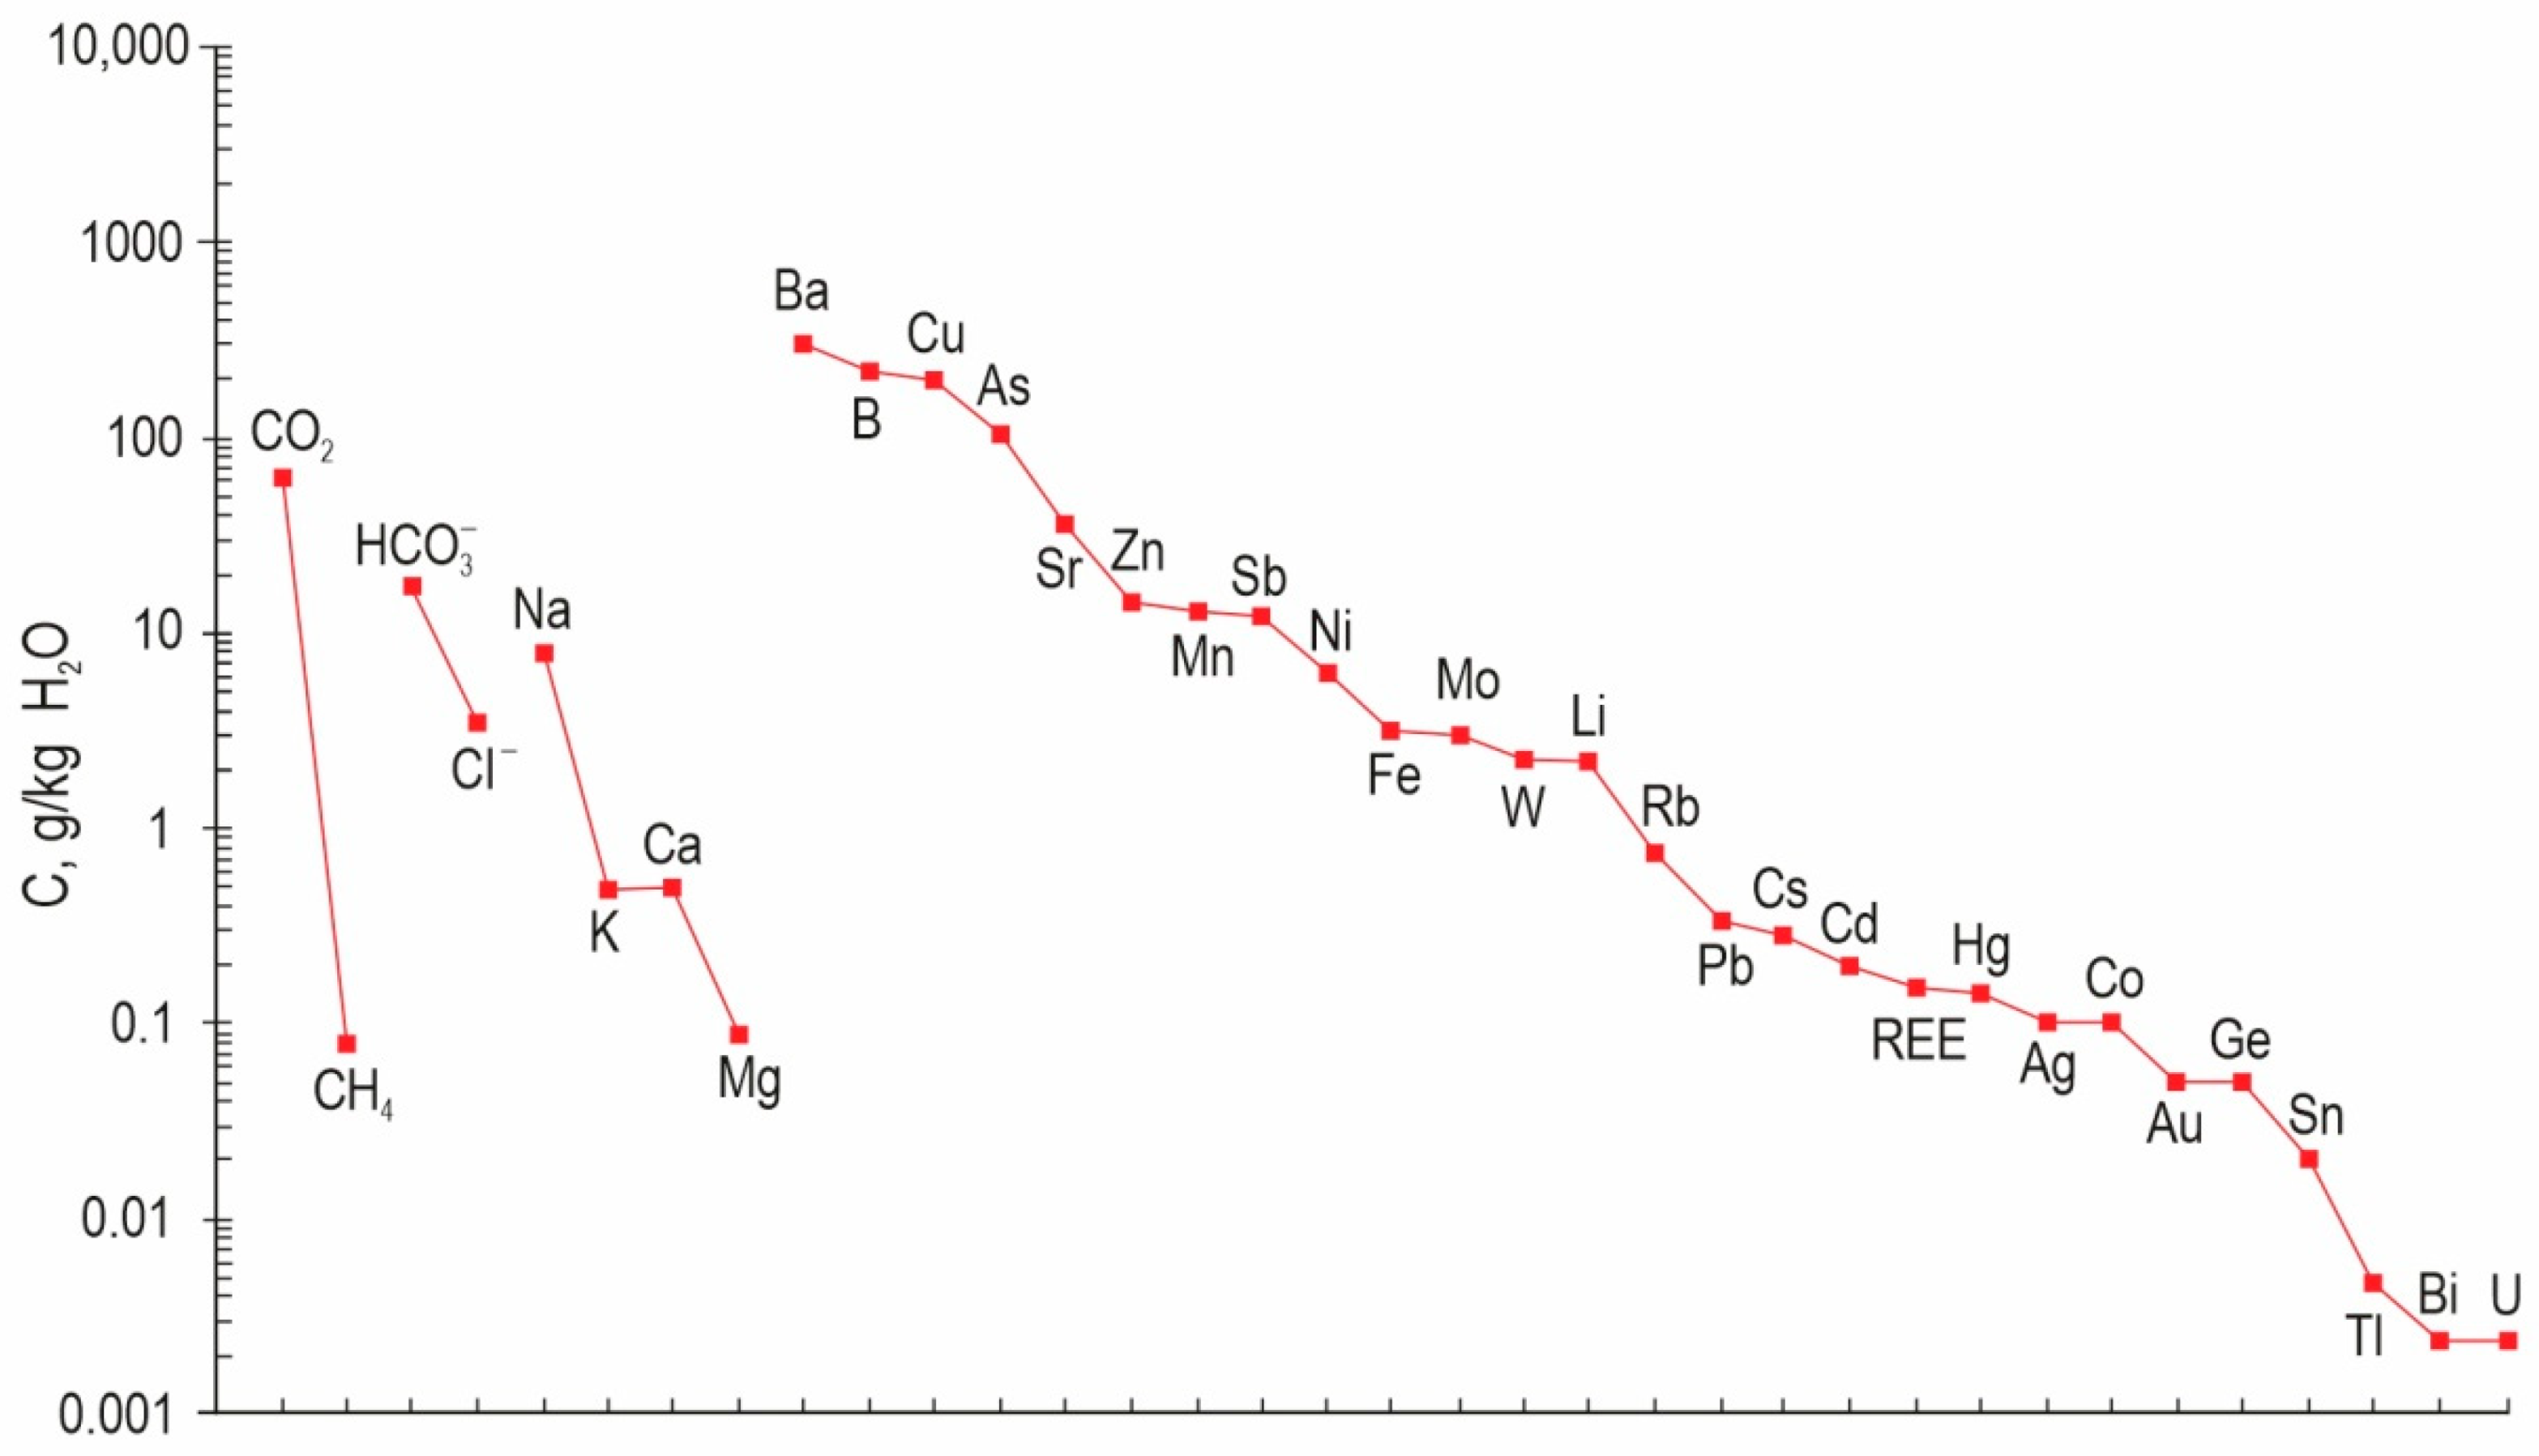
| CO2 | 56.24 | 41.31 | 85.58 | 69.77 | 63.23 |
| CH4 | 0.05 | 0.03 | 0.19 | 0.04 | 0.08 |
| Cl− | 2.65 | 4.31 | 4.51 | 2.81 | 3.57 |
| HCO3− | 11.61 | 10.04 | 35.74 | 13.13 | 17.63 |
| Na | 5.73 | 6.48 | 12.91 | 6.70 | 7.96 |
| K | 0.32 | 0.14 | 1.32 | 0.16 | 0.49 |
| Ca | 0.01 | 0.04 | 1.96 | 0.00 | 0.50 |
| Mg | 0.1 | 0.005 | 0.26 | 0.00 | 0.09 |
| Microcomponents, 10−3 g/kg H2O | |||||
| B | 295.55 | 74.40 | 696.31 | 129.53 | 298.95 |
| Ba | 57.85 | 53.31 | 153.19 | 637.97 | 225.58 |
| Cu | 15.53 | 0.03 | 780.13 | 0.00 | 198.92 |
| As | 45.42 | 66.74 | 208.87 | 101.43 | 105.62 |
| Sr | 27.67 | 17.19 | 82.27 | 19.24 | 36.59 |
| Zn | 0.00 | 0.00 | 58.48 | 0.00 | 14.62 |
| Mn | 9.23 | 0.40 | 42.68 | 0.02 | 13.08 |
| Sb | 6.27 | 8.07 | 27.87 | 7.37 | 12.40 |
| Ni | 3.00 | 1.26 | 20.38 | 0.47 | 6.28 |
| Fe | 1.62 | 2.03 | 9.17 | 0.00 | 3.20 |
| Mo | 0.73 | 0.07 | 10.89 | 0.47 | 3.04 |
| W | 0.00 | 0.00 | 9.07 | 0.00 | 2.27 |
| Li | 1.59 | 2.34 | 3.72 | 1.24 | 2.23 |
| Rb | 0.40 | 0.16 | 2.17 | 0.33 | 0.76 |
| Pb | 0.00 | 0.17 | 1.18 | 0.00 | 0.34 |
| Cs | 0.10 | 0.19 | 0.61 | 0.25 | 0.29 |
| Cd | 0.08 | 0.06 | 0.66 | 0.01 | 0.20 |
| Hg | 0.00 | 0.00 | 0.58 | 0.00 | 0.14 |
| Ag | 0.00 | 0.18 | 0.21 | 0.00 | 0.10 |
| Co | 0.04 | 0.00 | 0.35 | 0.00 | 0.10 |
| Au | 0.03 | 0.00 | 0.17 | 0.02 | 0.05 |
| Ge | 0.03 | 0.04 | 0.07 | 0.05 | 0.05 |
| Sn | 0.00 | 0.08 | 0,00 | 0.00 | 0.02 |
| REE | 0.07 | 0.08 | 0.08 | 0.38 | 0.15 |
| Tl | 0.01 | 0.01 | 0.00 | 0.00 | 0.005 |
| Bi | 0.00 | 0.01 | 0.01 | 0.00 | 0.005 |
| U | 0.00 | 0.00 | 0.01 | 0.00 | 0.0025 |
| Na/K | 17.90 | 46.29 | 9.78 | 41.87 | 28.96 |
| CO2/CH4 | 1171.67 | 1530 | 436.63 | 1701.7 | 1210 |
| K/Rb | 800 | 875 | 608 | 484 | 645 |
Publisher’s Note: MDPI stays neutral with regard to jurisdictional claims in published maps and institutional affiliations. |
© 2022 by the authors. Licensee MDPI, Basel, Switzerland. This article is an open access article distributed under the terms and conditions of the Creative Commons Attribution (CC BY) license (https://creativecommons.org/licenses/by/4.0/).
Share and Cite
Kuzhuget, R.V.; Ankusheva, N.N.; Pirajno, F.; Mongush, A.A.; Butanaev, Y.V.; Suge-Maadyr, N.V. The Ulug-Sair Gold Occurrence (Western Tuva, Russia): Mineralogy, Ore Genesis, and S-O Isotope Systematics. Minerals 2022, 12, 712. https://doi.org/10.3390/min12060712
Kuzhuget RV, Ankusheva NN, Pirajno F, Mongush AA, Butanaev YV, Suge-Maadyr NV. The Ulug-Sair Gold Occurrence (Western Tuva, Russia): Mineralogy, Ore Genesis, and S-O Isotope Systematics. Minerals. 2022; 12(6):712. https://doi.org/10.3390/min12060712
Chicago/Turabian StyleKuzhuget, Renat V., Natalia N. Ankusheva, Franco Pirajno, Andrey A. Mongush, Yuri V. Butanaev, and Nadezhda V. Suge-Maadyr. 2022. "The Ulug-Sair Gold Occurrence (Western Tuva, Russia): Mineralogy, Ore Genesis, and S-O Isotope Systematics" Minerals 12, no. 6: 712. https://doi.org/10.3390/min12060712
APA StyleKuzhuget, R. V., Ankusheva, N. N., Pirajno, F., Mongush, A. A., Butanaev, Y. V., & Suge-Maadyr, N. V. (2022). The Ulug-Sair Gold Occurrence (Western Tuva, Russia): Mineralogy, Ore Genesis, and S-O Isotope Systematics. Minerals, 12(6), 712. https://doi.org/10.3390/min12060712