
Fluid Inclusion and Chemical Composition Characteristics of Emeralds from Rajasthan Area, India


Abstract
1. Introduction
2. Geology
3. Materials and Methods
4. Results
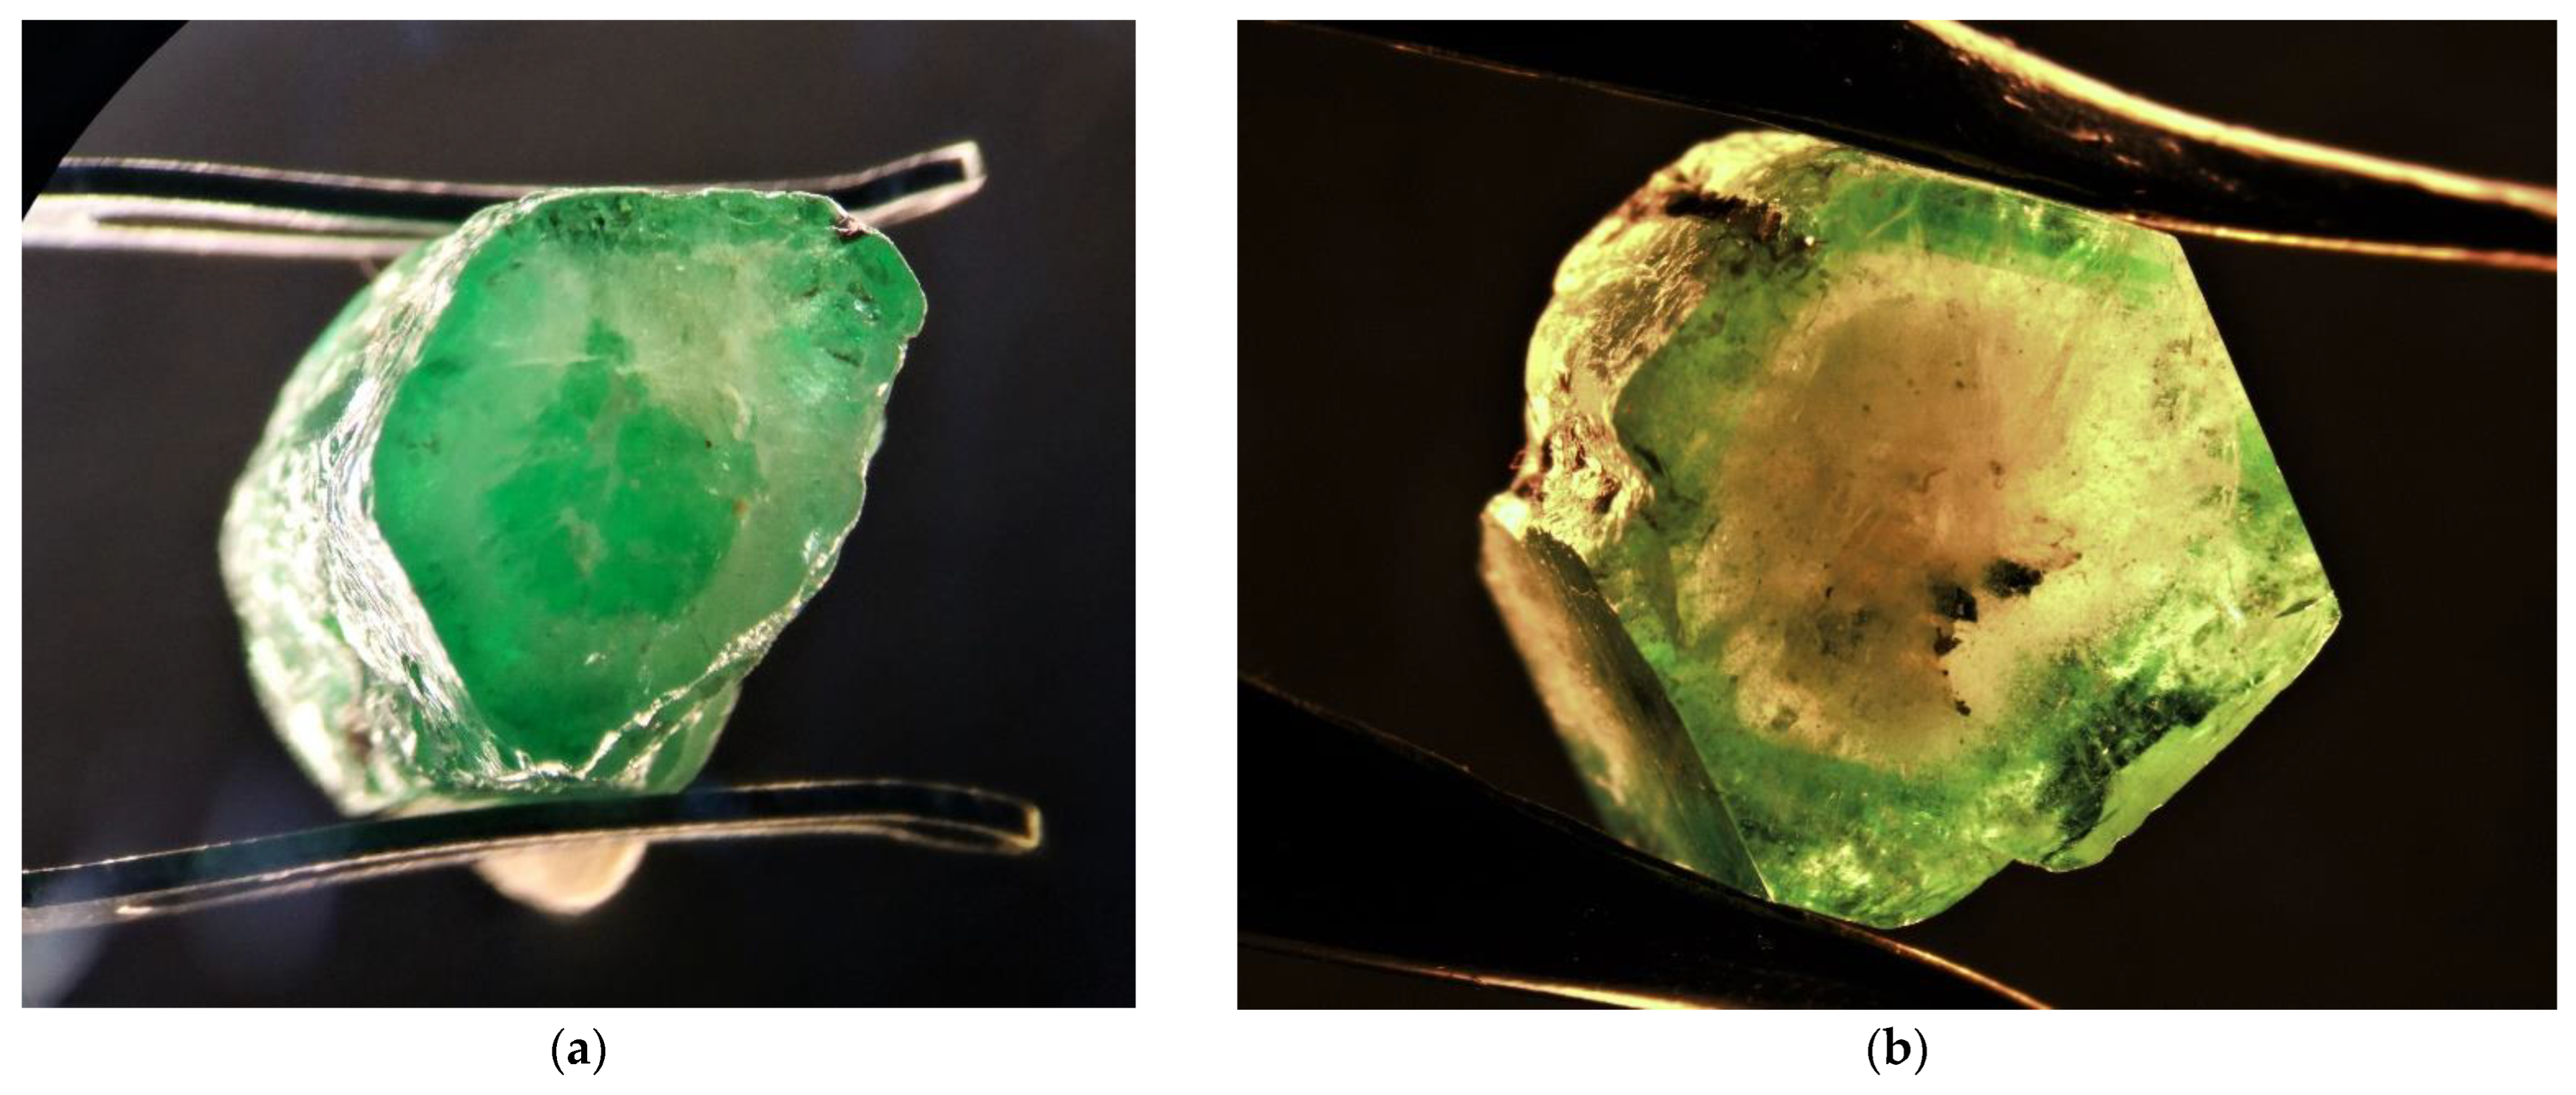
4.1. Gemological Properties
4.2. Magnification
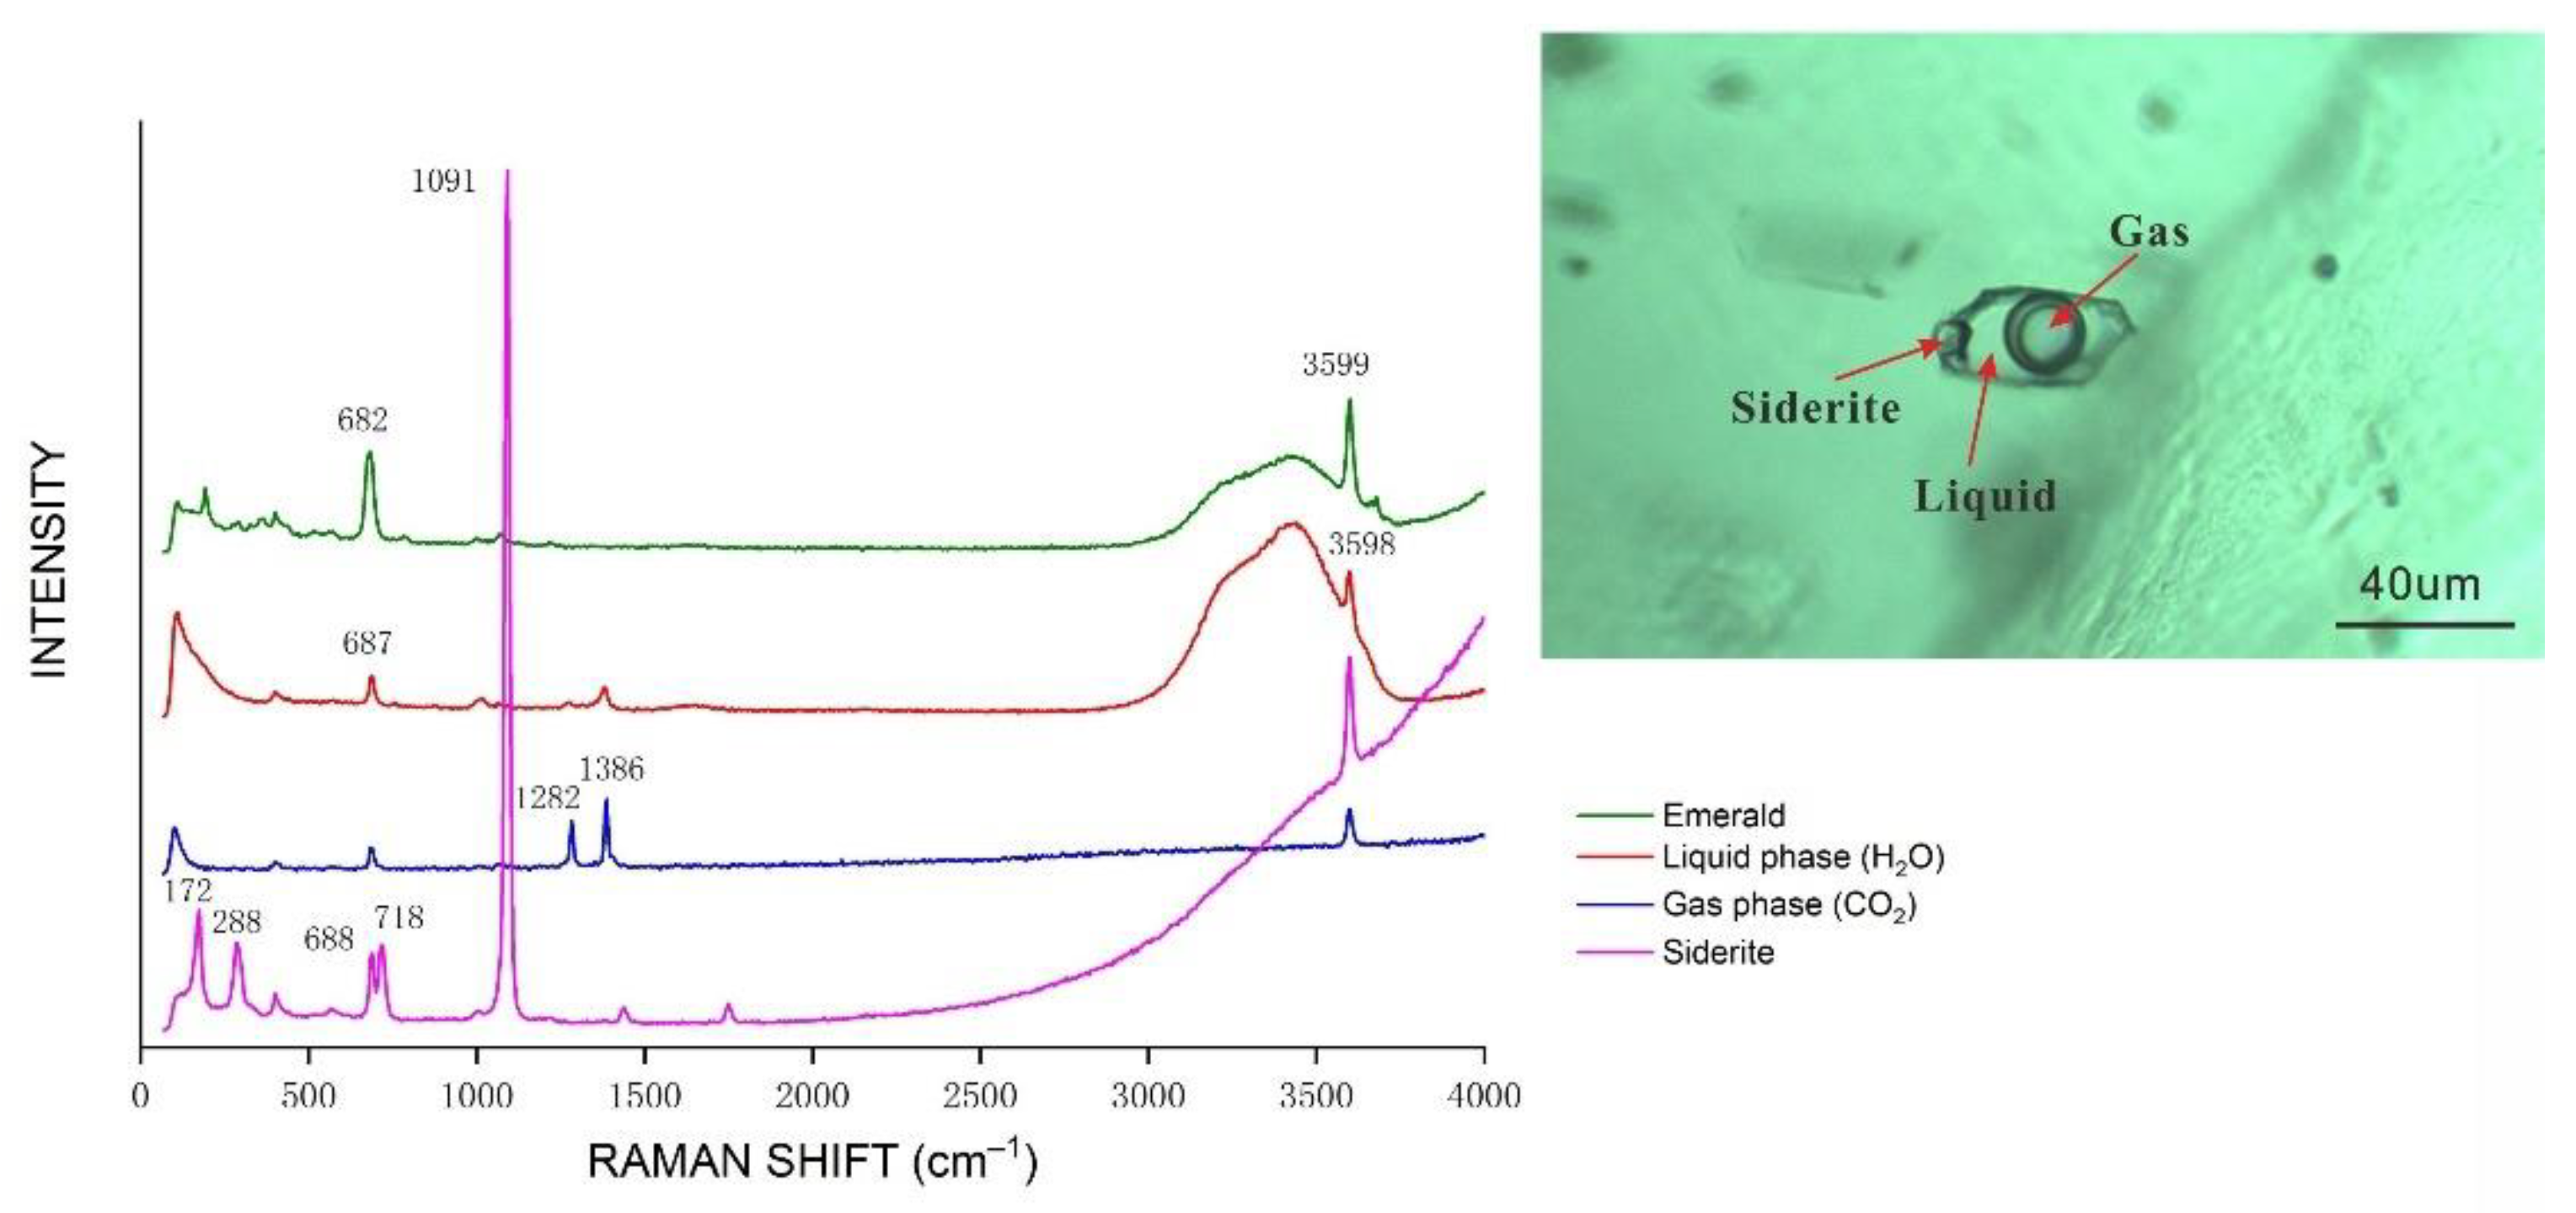
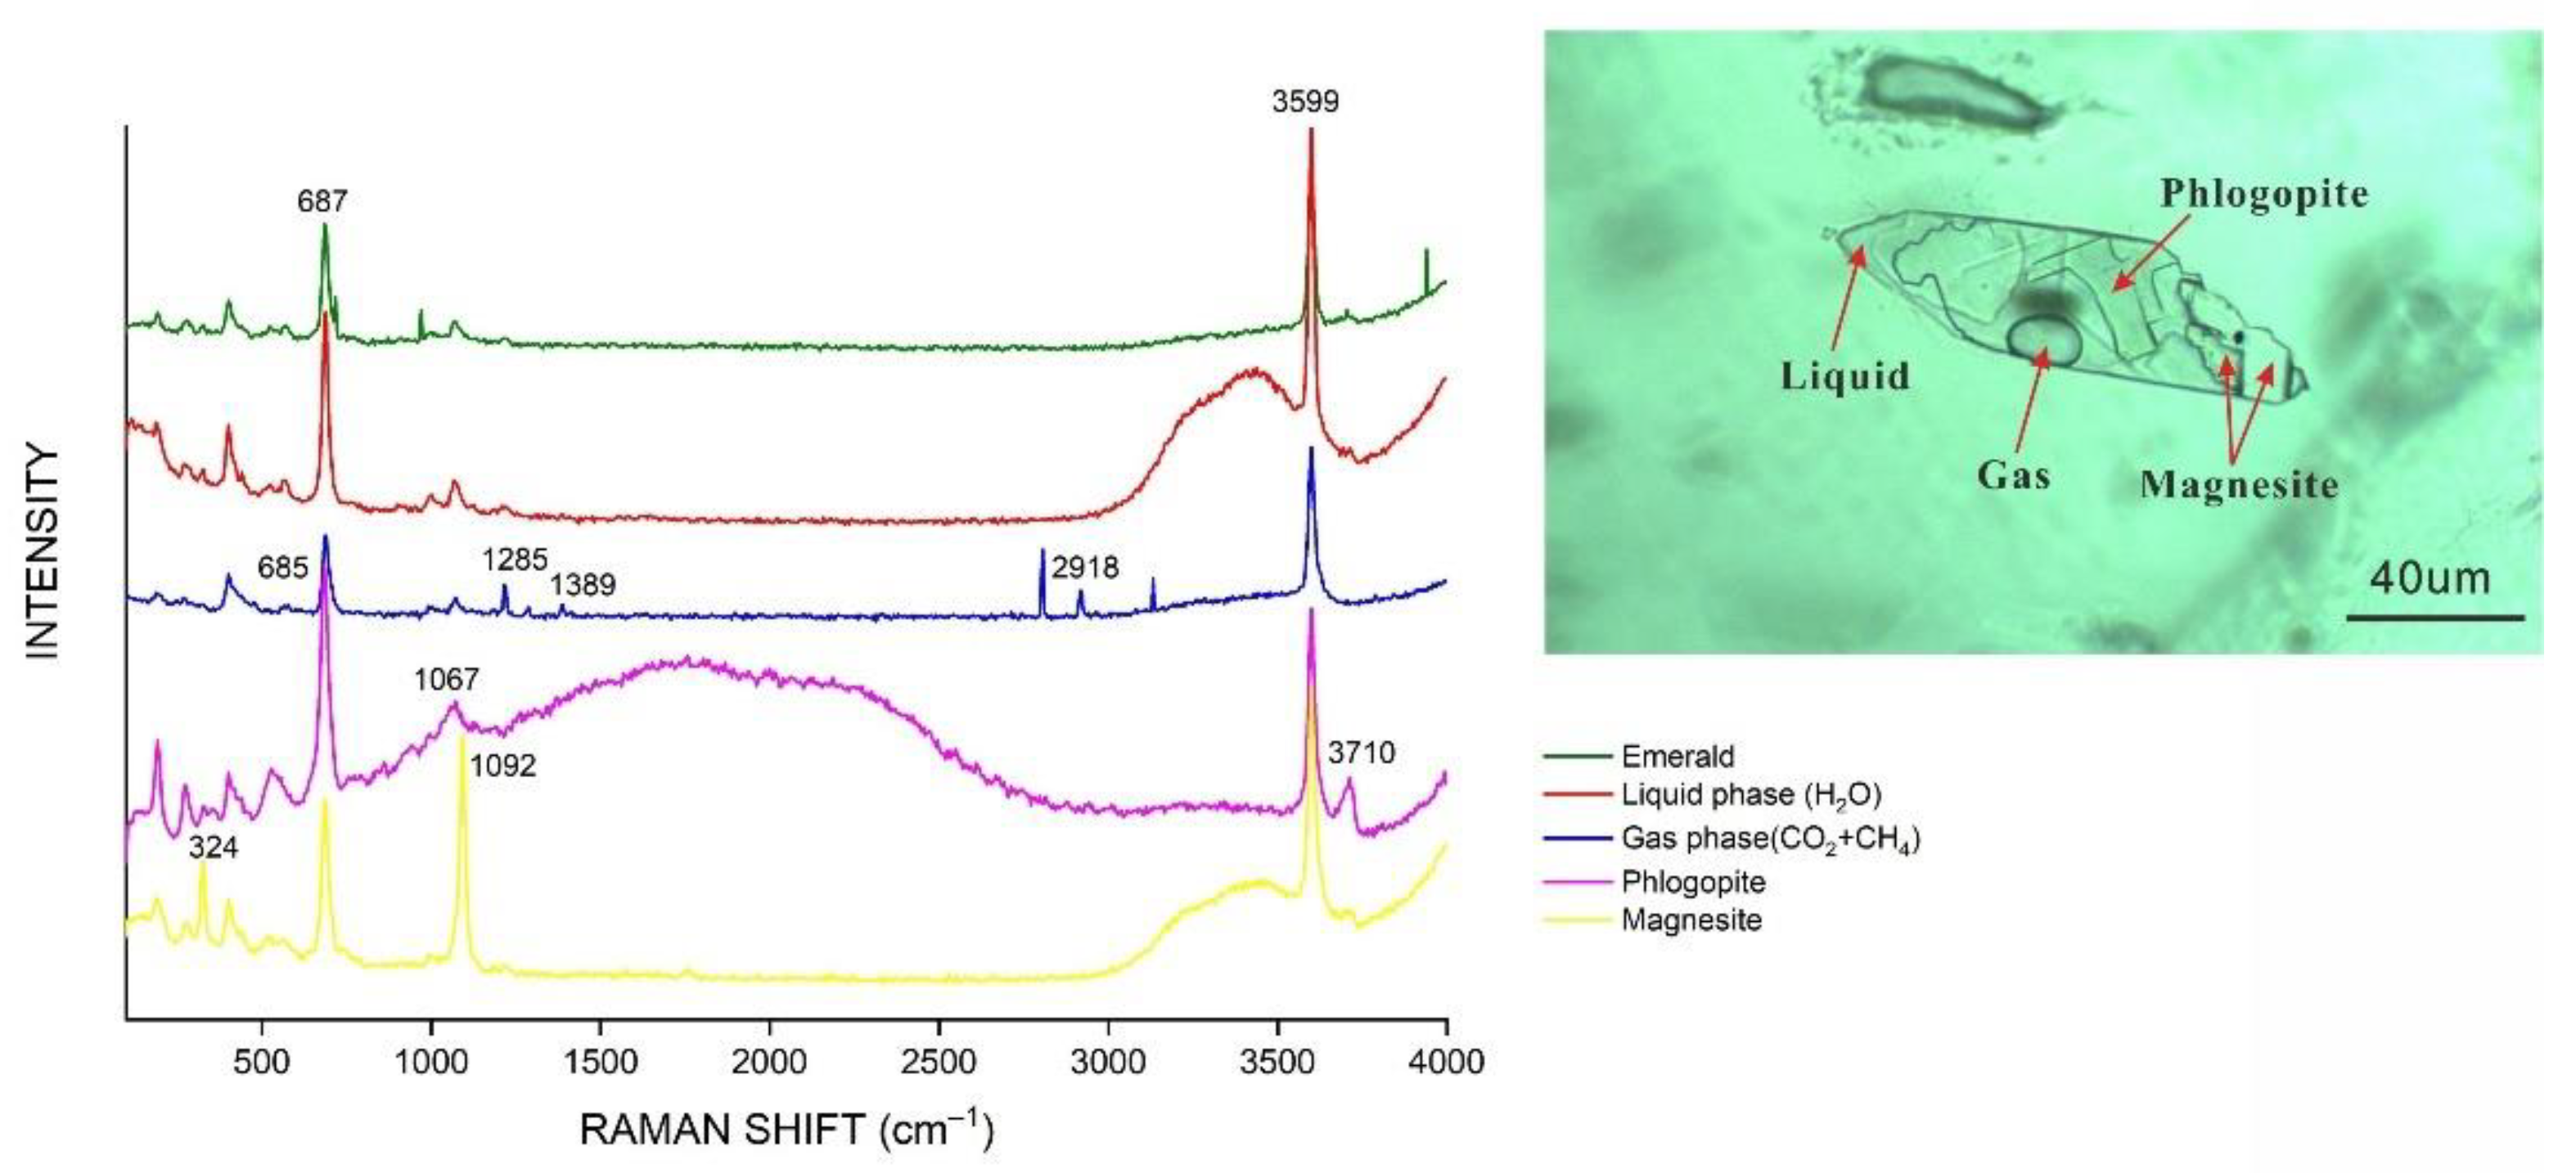
4.3. Composition of the Multiphase Inclusions
4.4. Spectroscopy
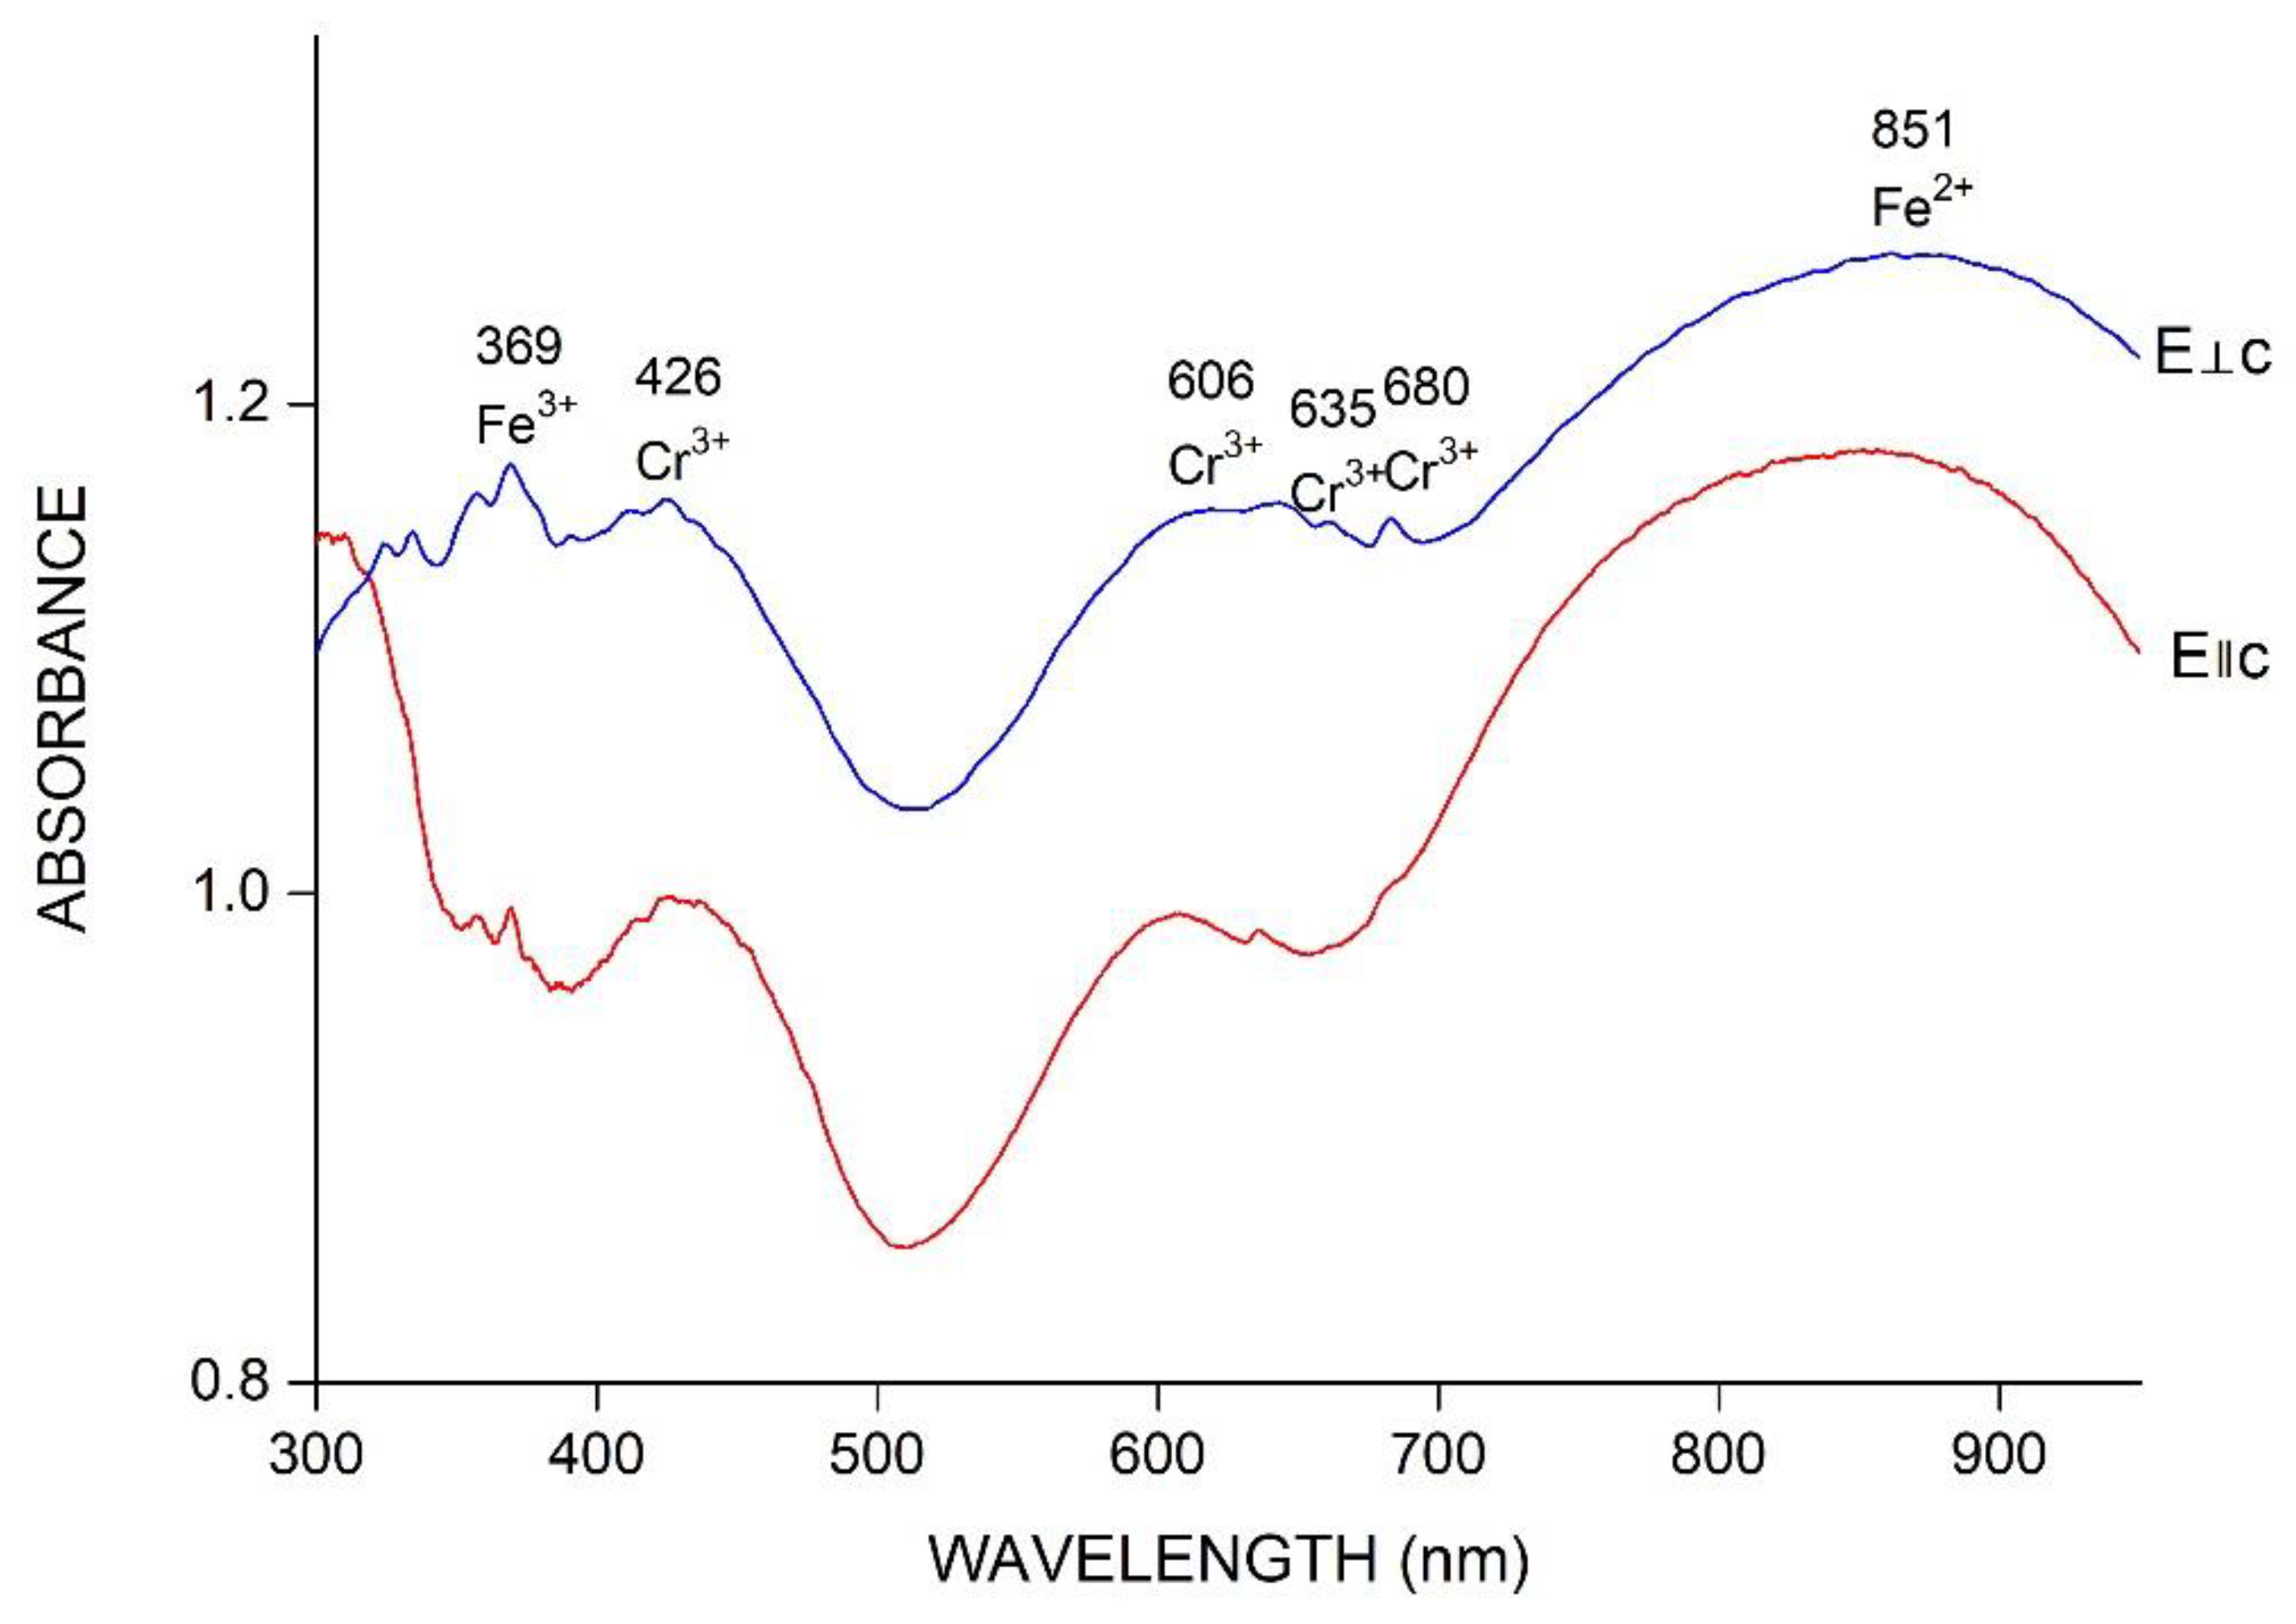
4.4.1. UV-Vis-NIR
4.4.2. Infrared
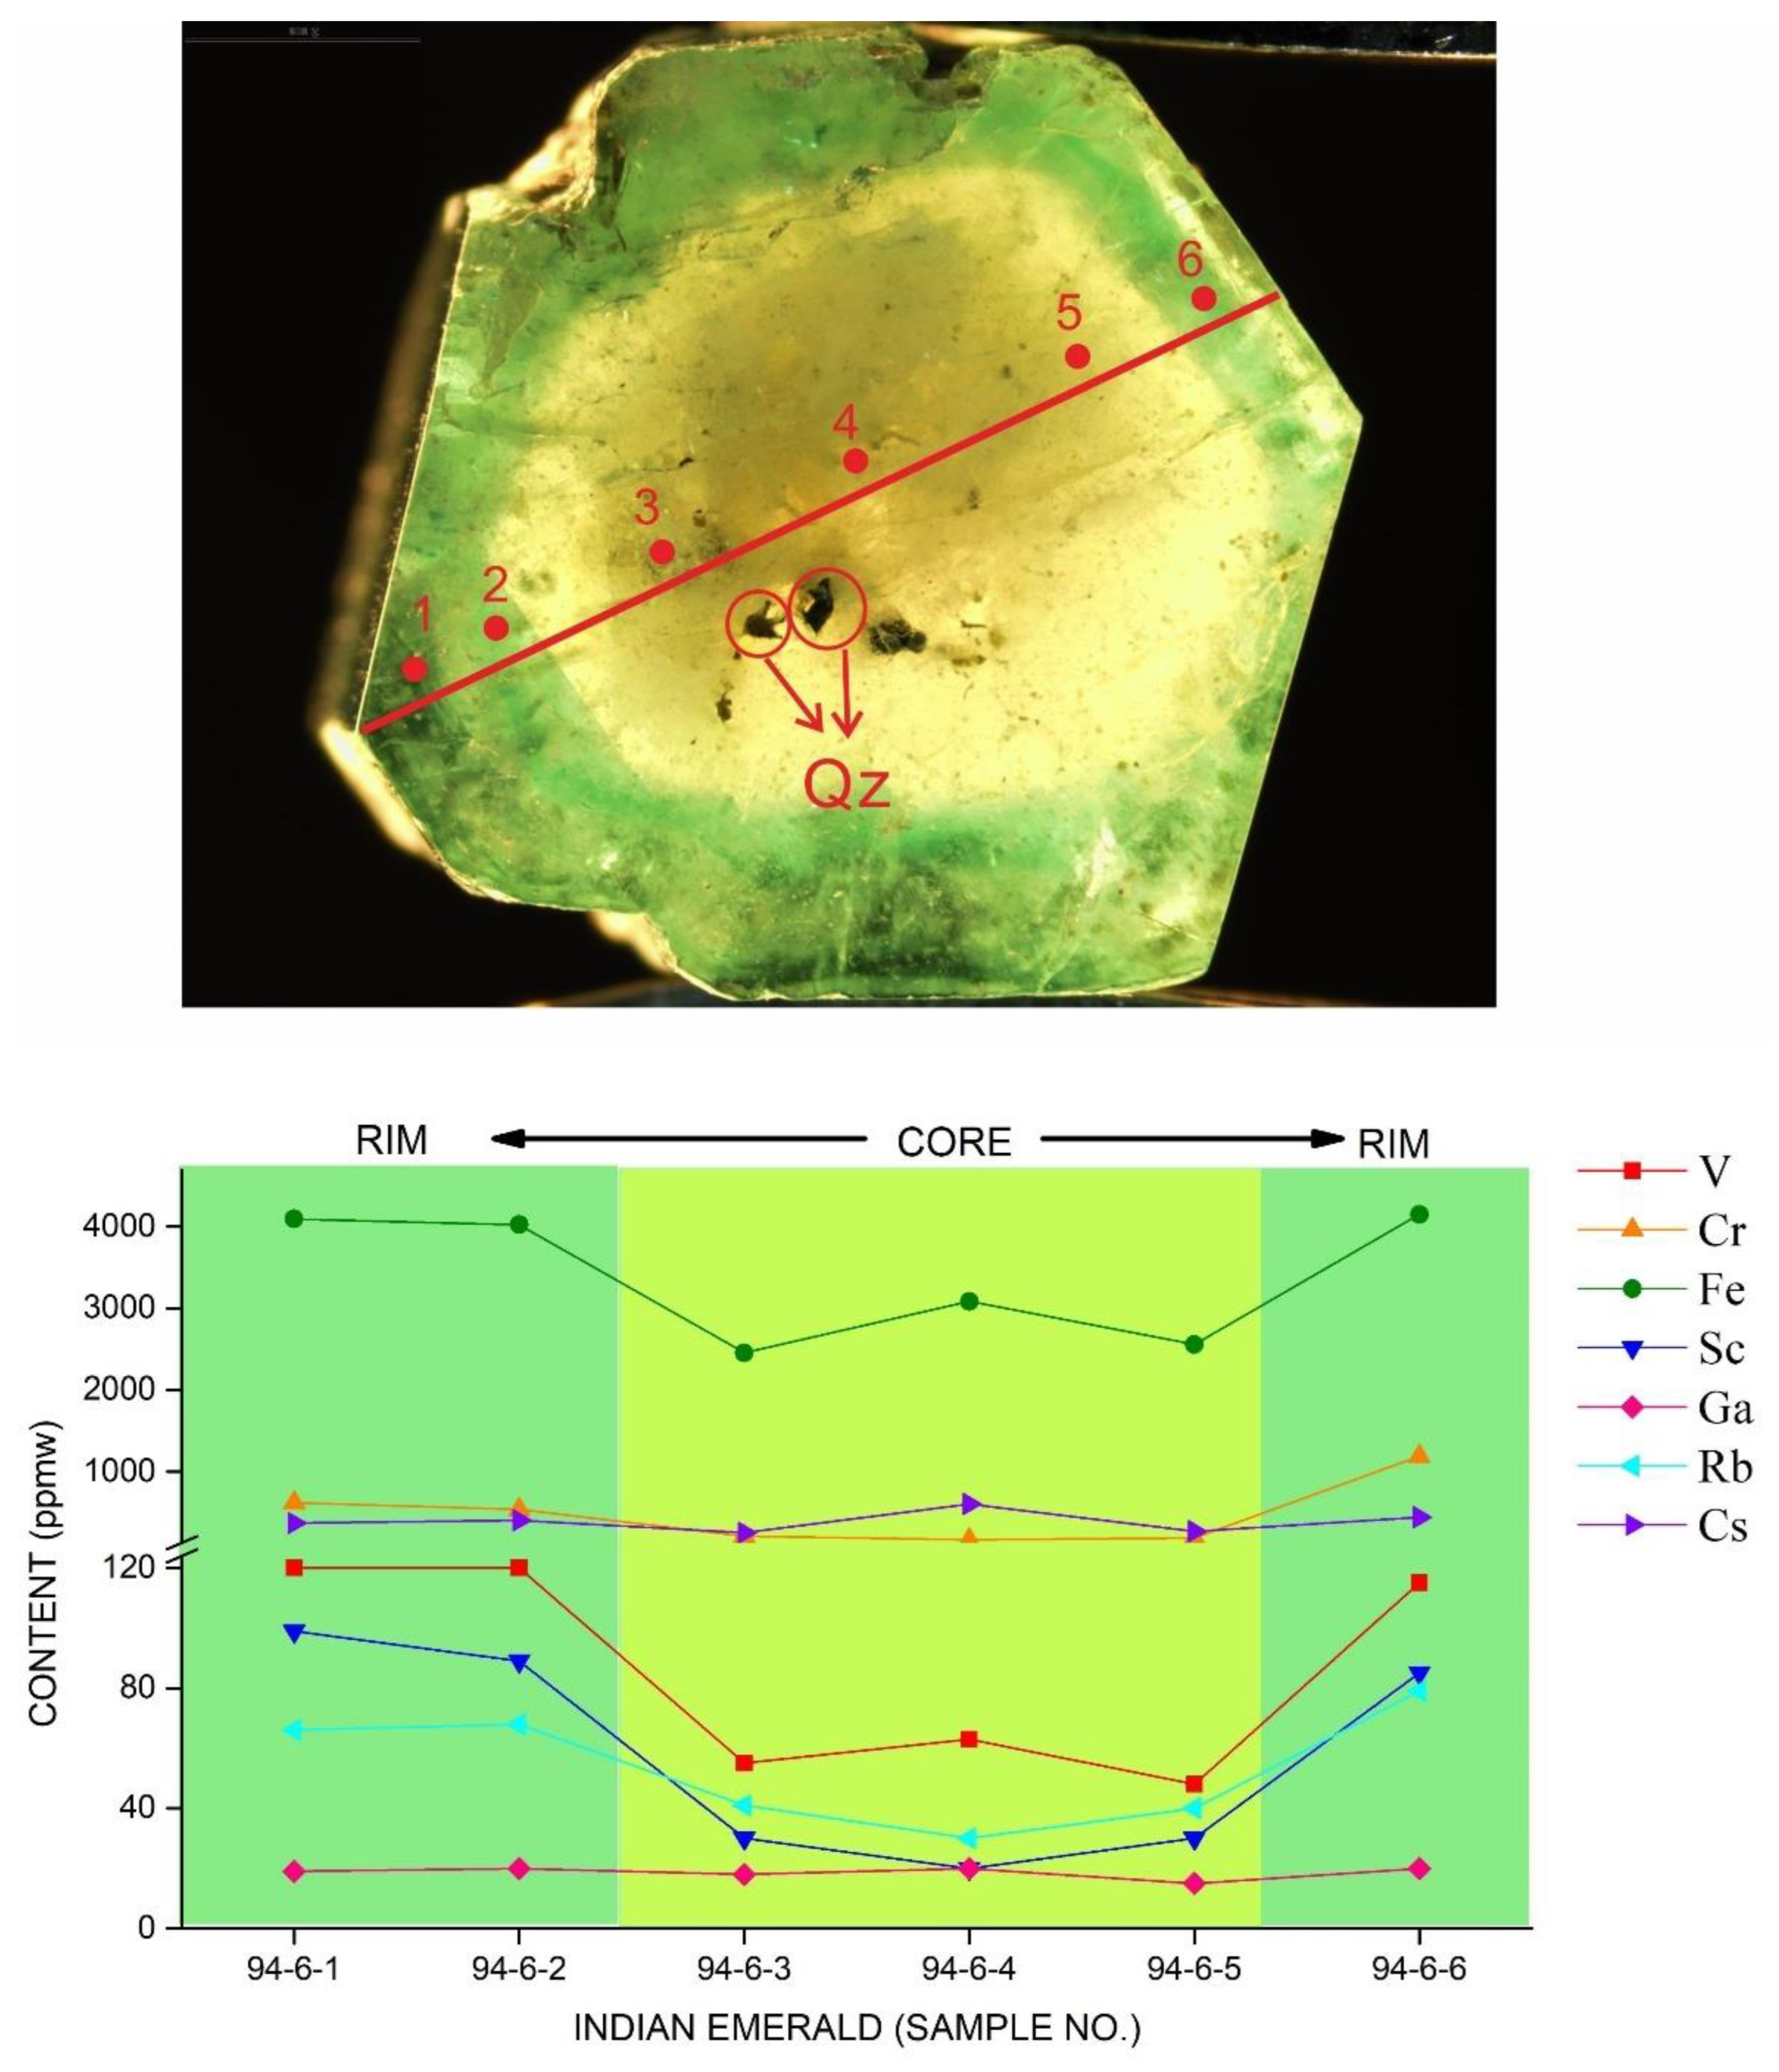
4.5. Major and Trace Elements Analysis
5. Discussion
5.1. Optical Properties of Indian Emeralds
5.2. Micro-Inclusions and Geological Environment
5.3. Spectroscopy
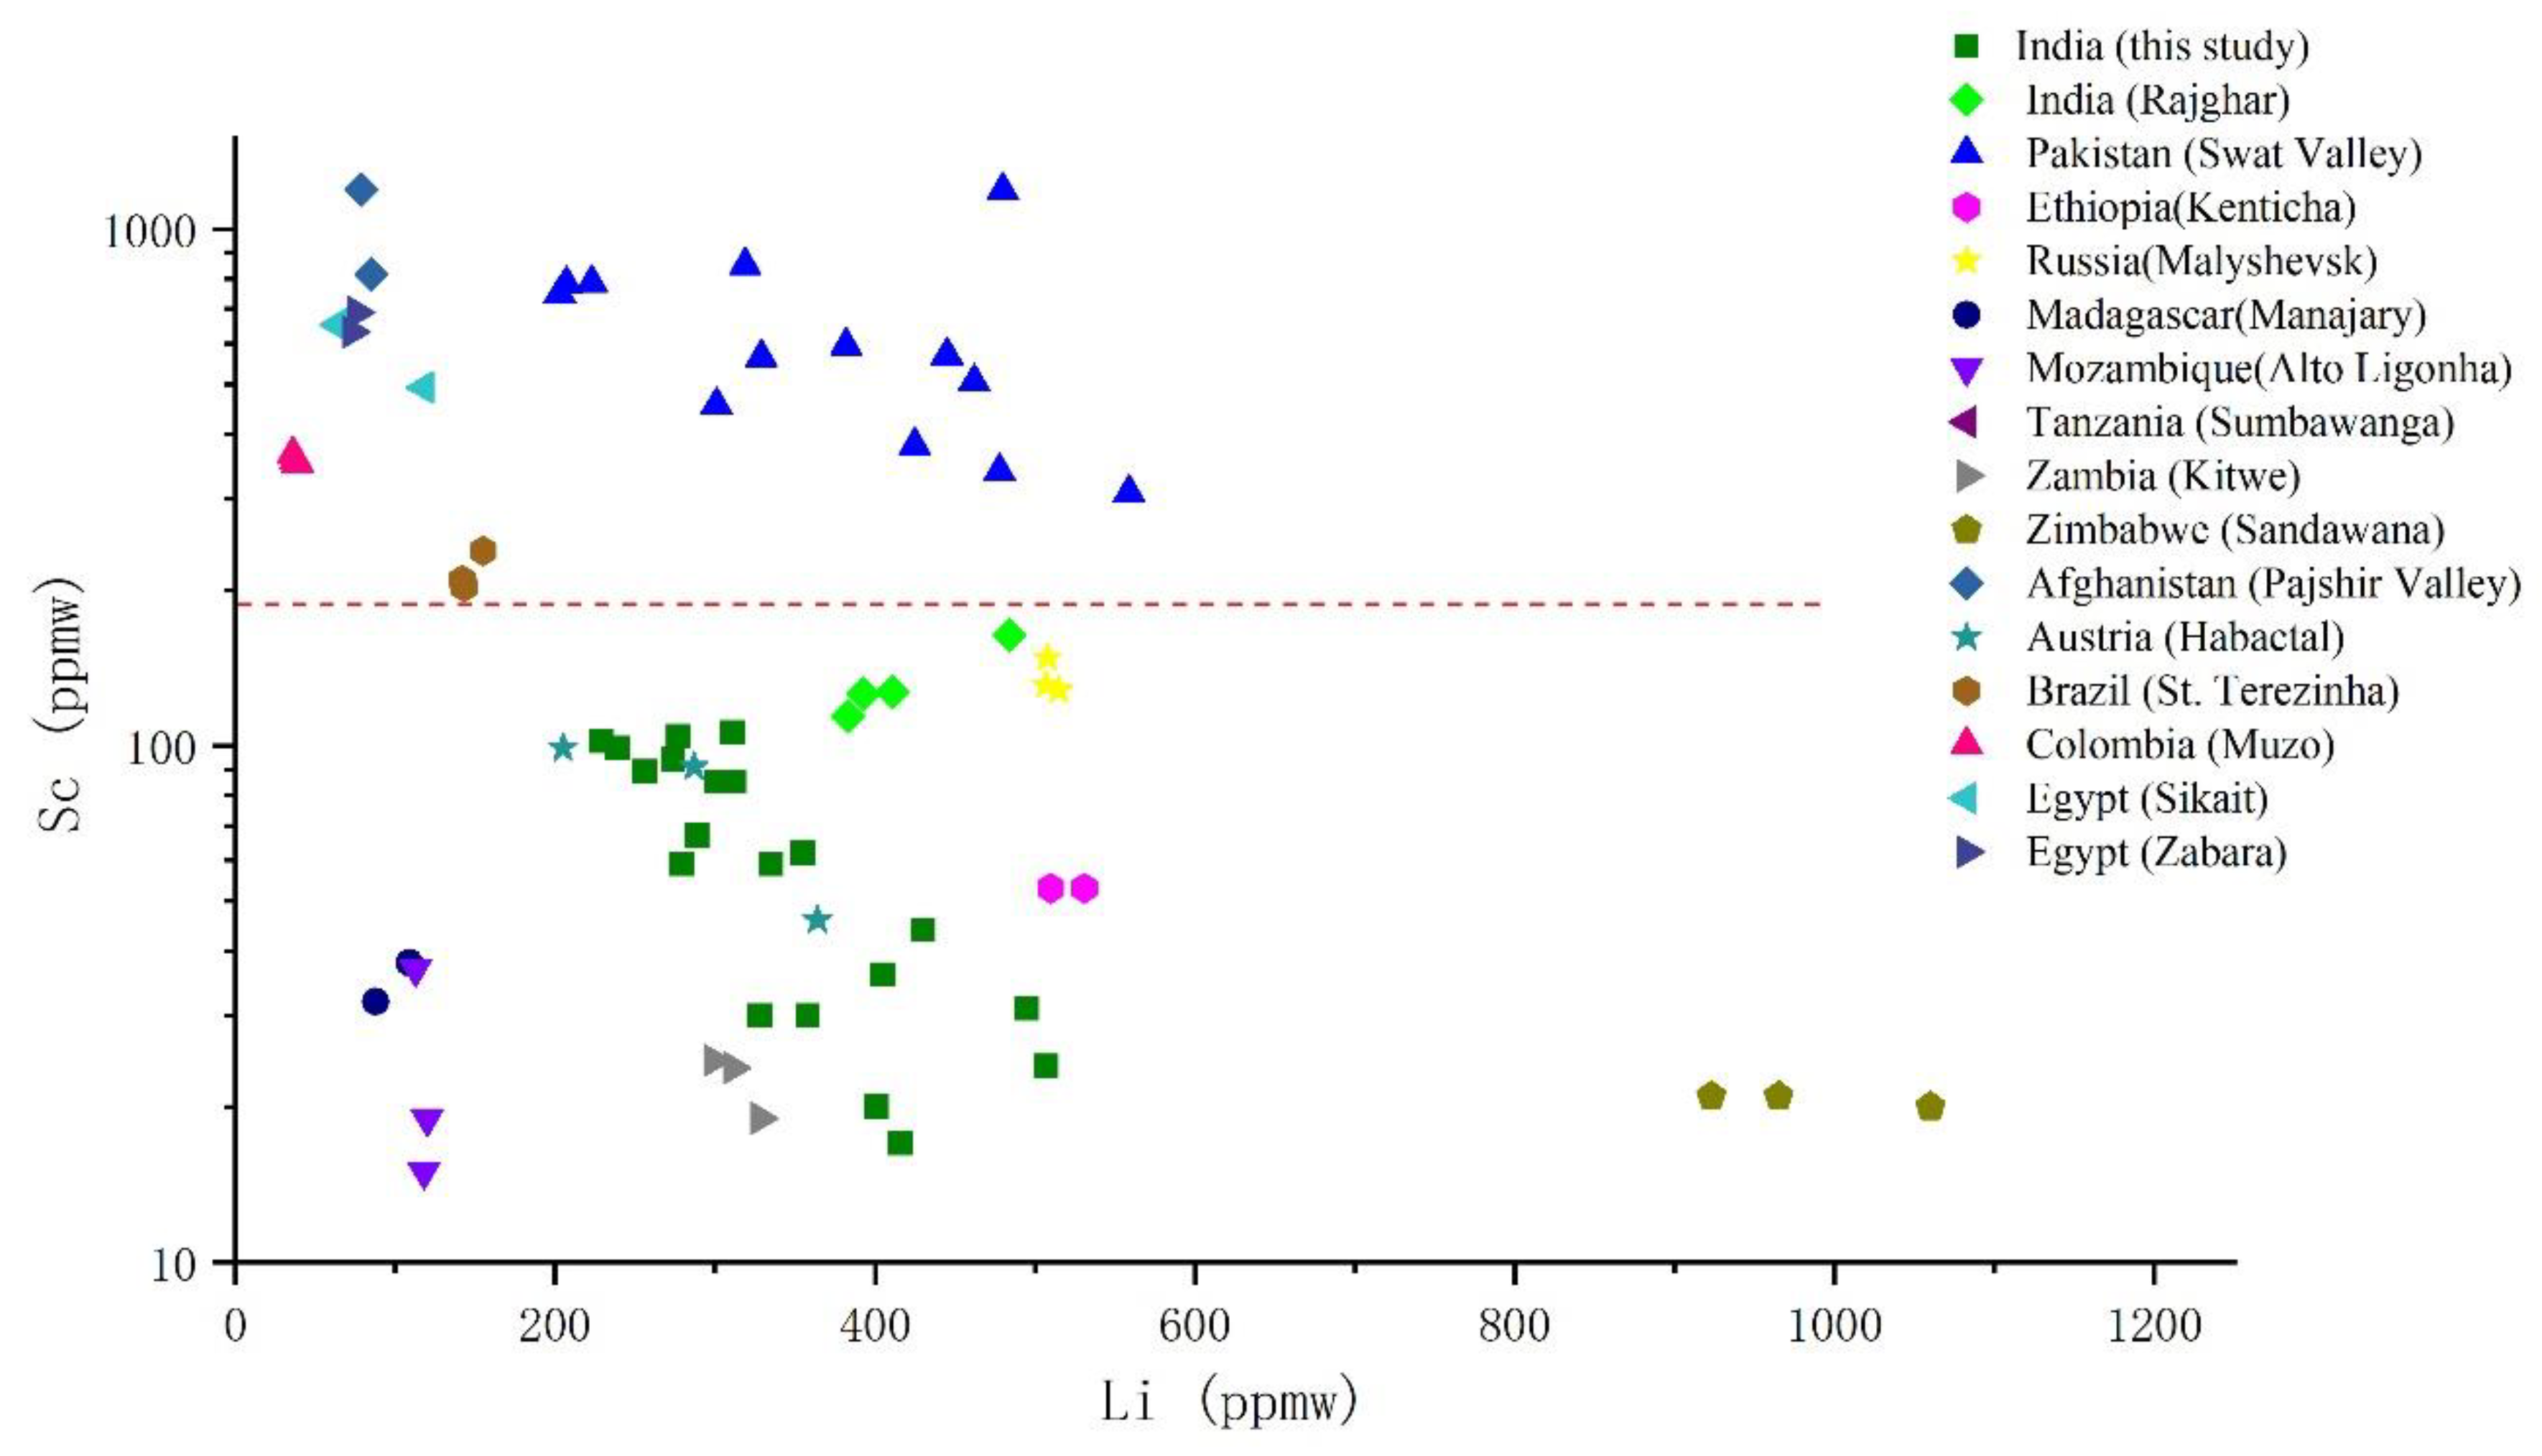
5.4. Trace-Element Chemistry
6. Conclusions
Author Contributions
Funding
Data Availability Statement
Acknowledgments
Conflicts of Interest
References
- Carlo, A.; Conte, A.M.; Medeghini, L.; Ottolini, L.; De Vito, C. Major and trace element geochemistry of emerald from several deposits: Implications for genetic models and classification schemes. Ore Geol. Rev. 2018, 94, 351–366. [Google Scholar] [CrossRef]
- Giuliani, G.; Groat, L.A. Geology of corundum and emerald gem deposits: A Review. Gems Gemol. 2019, 55, 464–489. [Google Scholar] [CrossRef]
- Saeseaw, S.; Renfro, N.D.; Palke, A.C.; Sun, Z.; McClure, S.F. Geographic origin determination of emerald. Gems Gemol. 2019, 55, 614–646. [Google Scholar] [CrossRef]
- Guo, H.; Yu, X.; Zheng, Y.; Sun, Z.; Ng, M.F.-Y. Inclusion and trace element characteristics of emeralds from Swat Valley, Pakistan. Gems Gemol. 2020, 56, 336–355. [Google Scholar] [CrossRef]
- Giuliani, G.; Groat, L.A.; Marshall, D.; Fallick, A.E.; Branquet, Y. Emerald deposits: A review and enhanced classification. Minerals 2019, 9, 105. [Google Scholar] [CrossRef]
- Grew, E.S.; Hazen, R.M. Beryllium mineral evolution. Am. Mineral. 2014, 99, 999–1021. [Google Scholar] [CrossRef]
- Wu, M.Q.; Samson, I.M.; Qiu, K.F.; Zhang, D.H. Concentration mechanisms of REE-Nb-Zr-Be mineralization in the Baerzhe deposit, NE China: Insights from textural and chemical features of amphibole and rare-metal minerals. Econ. Geol. 2021, 116, 651–679. [Google Scholar] [CrossRef]
- Wu, M.Q.; Samson, I.M.; Qiu, K.F.; Zhang, D.H. Multi-stage metasomatic Zr mineralization in the world-class Baerzhe Rare-earth element-Nb-Zr-Be deposit, China. Am. Mineral. 2022, 5, 2–49. [Google Scholar] [CrossRef]
- Qiu, K.F.; Yu, H.C.; Wu, M.Q.; Geng, J.Z.; Ge, X.K.; Gou, Z.Y.; Taylor, R.D. Discrete Zr and REE mineralization of the Baerzhe rare-metal deposit, China. Am. Mineral. 2019, 104, 1487–1502. [Google Scholar] [CrossRef]
- Long, Z.Y.; Yu, X.Y.; Zheng, Y.Y. Ore formation of the Dayakou emerald deposit (Southwest China) constrained by chemical and boron isotopic composition of tourmaline. Ore Geol. Rev. 2021, 135, 104208. [Google Scholar] [CrossRef]
- Ball, S.H. Historical notes on gem mining. Econ. Geol. 1931, 26, 681–738. [Google Scholar] [CrossRef]
- Brown, J.C. Emeralds in India. Gemmologist 1953, 22, 133–136. [Google Scholar]
- Crookshank, H. Emeralds in Mewar. Geological Survey of India. Indian Miner. 1947, 1, 28–30. [Google Scholar]
- Roy, B.C. The economic geology and mineral resources of Rajasthan and Ajmer. Mem. Geol. Soc. India 1959, 86, 356. [Google Scholar]
- Paul, A. Mineral chemistry and geochronology of the Rajasthan emerald deposits, NW India. Can. Mineral. 2020, 58, 335–346. [Google Scholar] [CrossRef]
- Brown, J.C.; Dey, A.K. India’s Mineral Wealth; Oxford University Press: Oxford, UK, 1955; p. 761. [Google Scholar]
- Krishnan, M.S. The mineral production of the Indian Union during 1952. Rec. Geol. Surv. India 1955, 86, 309–376. [Google Scholar]
- Iyer, L.A.N.; Thiagarjan, R. Indian precious stones. Geol. Surv. India Bull. 1961, 18, 105. [Google Scholar]
- Panjikar, J.; Ramchandran, K.T.; Balu, K. New emerald deposits from southern India. Aust. Gemmol. 1997, 19, 427–432. [Google Scholar]
- Roy, B.C. Emerald deposits in Mewar and Ajmer Merwara. Rec. Geol. Surv. India 1955, 86, 377–401. [Google Scholar]
- Sinkankas, J. Emeralds and other beryls. Geosci. Press Prescot 1989, 1, 665. [Google Scholar]
- Groat, L.A.; Giuliani, G.; Marshall, D.D.; Turner, D. Emerald deposits and occurrences: A review. Ore Geol. Rev. 2008, 34, 87–112. [Google Scholar] [CrossRef]
- Alexander, A.E. Emeralds from the Ajmer District, India. J. Gemmol. 1951, 3, 14. [Google Scholar] [CrossRef]
- Gubelin, E.J. Some additional data on Indian emeralds. Gems Gemol. 1951, 7, 13–22. [Google Scholar]
- Kazmi, A.H.; Snee, L.W. (Eds.) Origin and classification of Pakistani and world emerald deposits. In Emeralds of Pakistan: Geology, Gemology, and Genesis; Van Nostrand Reinhold Karachi Pak: New York, NY, USA, 1989; pp. 229–236. [Google Scholar]
- Cheilletz, A. Les gisements d’émeraude d’Inde. In L’emeraude, Connaissances Actuelles et Prospectives; Giard, A., Ed.; Association Française de Gemmologie: Paris, France, 1998; pp. 119–124. (In French) [Google Scholar]
- Goldfarb, R.J.; Mao, J.W.; Qiu, K.F.; Goryachev, N. The great Yanshanian metallogenic event of eastern Asia: Consequences from one hundred million years of plate margin geodynamics. Gondwana Res. 2021, 100, 223–250. [Google Scholar] [CrossRef]
- Zheng, Y.Y.; Yu, X.Y.; Guo, H.S. Major and trace element geochemistry of dayakou vanadium-dominant emerald from malipo (Yunnan, China): Genetic model and geographic origin determination. Minerals 2019, 9, 777. [Google Scholar] [CrossRef]
- Fernandes, S.; Trivedi, A. Emerald deposits of Rajasthan. In Proceedings of the XXVIII International Gemmological Conference, Extended Abstracts, Madrid, Spain, 8–12 October 2001; pp. 110–116. [Google Scholar]
- Yu, H.L. Types of emerald deposits and characteristics of their inclusions. Jewel. Sci. Technol. 2001, 4, 41–46. (In Chinese) [Google Scholar]
- Hu, R.R.; Zhang, S.T. Research status of emerald deposit. Geol. Chem. Miner. 2006, 28, 234–240. (In Chinese) [Google Scholar]
- Mumme, I. The Emerald; Mumme Publications: Port Hacking, NSW, Australia, 1982; p. 135. [Google Scholar]
- Reed, S.J.B. Recent Advances in Electron-Microprobe Analysis. Inst. Phys. Conf. Ser. 1993, 130, 67–74. [Google Scholar]
- Li, C.; Zhou, L.; Zhao, Z.; Zhang, Z.; Zhao, H.; Li, X.; Qu, W. In-situ Sr isotopic measurement of scheelite using fs-LA-MC- ICPMS. J. Asian Earth Sci. 2018, 160, 38–47. [Google Scholar] [CrossRef]
- Liu, Y.; Hu, Z.; Gao, S.; Günther, D.; Xu, J.; Gao, C.; Chen, H. In situ analysis of major and trace elements of anhydrous minerals by LA-ICP-MS without applying an internal standard. Chem. Geol. 2008, 257, 34–43. [Google Scholar] [CrossRef]
- Wood, D.L.; Nassau, K. The characterization of beryl and emerald by visible and infrared absorption spectroscopy. Am. Mineral. 1968, 53, 777–800. [Google Scholar]
- Schmetzer, K.; Berdesinski, W.; Bank, H. Über die Mineralart Beryll, ihre Farben und Absorptionsspektren. Z. Dtsch. Gemmol. Ges. 1974, 23, 5–39. (In German) [Google Scholar]
- Zwaan, J.H.; Seifert, A.V.; Vrána, S.; Laurs, B.M.; Anckar, B.; Simmons, W.B.S.; Falster, A.U.; Lustenhouwer, W.J.; Muhlmeister, S.; Koivula, J.I.; et al. Emeralds from the Kafubu Area, Zambia. Gems Gemol. 2005, 41, 117–148. [Google Scholar] [CrossRef]
- Łodziński, M.; Sitarz, M.; Stec, K.; Kozaneckid, M.; Fojude, Z.; Jurga, S. ICP, IR, Raman, NMR investigations of beryls from pegmatites of the Sudety Mts. J. Mol. Struct. 2005, 1, 744–747, 1005–1015. [Google Scholar] [CrossRef]
- Johnson, M.L.; Elen, S.; Muhlmeister, S. On the identification of various emerald filling substances. Gems Gemol. 1999, 35, 82–107. [Google Scholar] [CrossRef][Green Version]
- Schwarz, D.; Henn, U. Emeralds from Madagascar. J. Gemmol. 1992, 23, 140–149. [Google Scholar] [CrossRef]
- Fukuda, J.; Shinoda, K. Coordination of water molecules with Na+ cations in a beryl channel as determined by polarized IR spectroscopy. Phys. Chem. Miner. 2008, 35, 347–357. [Google Scholar] [CrossRef]
- Yu, X.Y.; Hu, D.Y.; Niu, X.W.; Kang, W.R. Infrared Spectroscopic Characteristics and Ionic Occupations in Crystalline Tunneling System of Yellow Beryl. JOM 2017, 69, 704–712. [Google Scholar] [CrossRef]
- Marshall, D.; Downes, P.; Ellis, S.; Greene, R.; Loughrey, L.; Jones, P. Pressure–Temperature–Fluid Constraints for the Poona Emerald Deposits, Western Australia: Fluid Inclusion and Stable Isotope Studies. Minerals 2016, 6, 130. [Google Scholar] [CrossRef]
- Gübelin, E.J.; Koivula, J.I. Photoatlas of Inclusions in Gemstones; Opinio Publishers: Basel, Switzerland, 2008; Volume 3, p. 672. [Google Scholar]
- Long, Z.Y.; Yu, X.Y.; Jiang, X.; Guo, B.J.; Ma, C.Y.; You, Y.; Zheng, Y.Y. Fluid boiling and fluid-rock interaction as primary triggers for emerald deposition: Insights from the Dayakou emerald deposit (China). Ore Geol. Rev. 2021, 139, 104454. [Google Scholar] [CrossRef]
- Yu, X.Y.; Long, Z.Y.; Zhang, Y.; Qin, L.J.; Zhang, C.; Xie, Z.R.; Wu, Y.R.; Yan, Y.; Wu, M.K.; Wan, J.X. Overview of Gemstone Resources in China. Crystals 2021, 11, 1189. [Google Scholar] [CrossRef]
- Yu, H.C.; Qiu, K.F.; Hetherington, C.J.; Chew, D.; Huang, Y.Q.; He, D.Y.; Geng, J.Z.; Xian, H.Y. Apatite as an alternative petrochronometer to trace the evolution of magmatic systems containing metamict zircon. Contrib. Mineral. Petrol. 2021, 176, 68. Available online: https://link.springer.com/article/10.1007/s00410-021-01827-z (accessed on 19 August 2021). [CrossRef]
- Qiu, K.F.; Yu, H.C.; Deng, J.; McIntire, D.; Gou, Z.Y.; Geng, J.Z.; Chang, Z.S.; Zhu, R.; Li, K.N.; Goldfarb, R. The giant Zaozigou Au-Sb deposit in West Qinling, China: Magmatic-or metamorphic-hydrothermal origin? Miner. Depos. 2020, 55, 345–362. Available online: https://link.springer.com/article/10.1007/s00126-019-00937-w (accessed on 10 January 2020). [CrossRef]
- Giuliani, G.; Cheilletz, A.; Dubessy, J.; Rodriguez, C.T. Chemical composition of fluid inclusions in Colombian emerald deposits. Proc. Eighth Quadrenn. IAGOD Symp. 1993, 1, 159–168. [Google Scholar]
- Vapnik, Y.; Moroz, I.; Roth, M.; Eliezri, I. Formation of emeralds at pegmatite-ultramafic contacts based on fluid inclusions in Kianjavato emerald, Mananjary deposits, Madagascar. Miner. Mag. 2006, 70, 141–158. [Google Scholar] [CrossRef]
- Marshall, D.; Pardieu, V.; Loughrey, L.; Jones, P.; Xue, G. Conditions for emerald formation at Davdar, China: Fluid inclusion, trace element and stable isotope studies. Miner. Mag. 2012, 76, 213–226. [Google Scholar] [CrossRef]
- Zwaan, J.C.; Jacob, D.E.; Häger, T.; Cavalcanti Neto, M.T.O.; Kanis, J. Emeralds from the Fazenda Bonfim region, Rio Grande do Norte, Brazil. Gems Gemol. 2012, 48, 2–17. [Google Scholar] [CrossRef]
- Saeseaw, S.; Pardieu, V.; Sangsawong, S. Three-phase inclusions in emerald and their impact on origin determination. Gems Gemol. 2014, 50, 114–133. [Google Scholar] [CrossRef]
- Vertriest, W.; Wongrawang, P. A gemological description of Ethiopian emeralds. InColor 2018, 40, 72–73. [Google Scholar]
- Schwarz, D.; Giuliani, G.; Grundmann, G.; Glas, M. Die Entstehung der Smaragde ein vieldisskutiertes Thema. In Smaragde der Kostbarste Beryll, der Teuerste Edelstein (ExtraLapis); Schwarz, D., Hochlitner, R., Eds.; Weis: Sunbury, PA, USA, 2001; pp. 68–73. [Google Scholar]


| Properties | Results |
|---|---|
| Color | Green or green with yellow tone, and bluish green |
| Clarity | Heavily included |
| Refractive indices | ne: 1.578–1.585; no: 1.585–1.590 n: 1.581–1.591 b n: 1.575–1.583 c |
| Birefringence | 0.005–0.012 (0.008 c) |
| Specific gravity | 2.68–2.72 2.75–2.76 b 2.73–2.75 c |
| Pleochroism | Strong to medium yellowish green or green (o-ray) and bluish green (e-ray) |
| Fluorescence | Typically inert to long- and short-wave UV radiation |
| Chelsea filter | Dark green |
| Visible spectrum | Distinct lines at ~680 nm; partial absorption between 560 and 620 nm; and complete absorption <460 nm |
| Internal features |
|
| Sample | 94-5 | 94-6 | 94-8 | 127-2 | 127-4 | 127-9 | |
|---|---|---|---|---|---|---|---|
| Oxides (wt.%) | |||||||
| SiO2 | Range | 62.24–64.83 | 63.61–64.76 | 63.79–64.00 | 64.47–65.01 | 63.90–64.53 | 64.03–64.16 |
| Average | 64.48 | 64.33 | 63.87 | 64.81 | 64.22 | 64.10 | |
| TiO2 | Range | bdl-0.01 | bdl-0.03 | bdl-0.04 | bdl-0.05 | bdl-0.04 | bdl-0.03 |
| Average | bdl | 0.01 | 0.02 | 0.01 | 0.02 | 0.02 | |
| Al2O3 | Range | 16.56–17.68 | 16.00–17.51 | 15.32–15.74 | 16.28–17.50 | 15.46–15.50 | 16.52–16.58 |
| Average | 16.97 | 16.76 | 15.56 | 16.97 | 15.48 | 16.55 | |
| V2O3 | Range | bdl-0.01 | bdl-0.05 | 0.02–0.05 | bdl-0.04 | 0.01–0.09 | bdl-0.01 |
| Average | bdl | 0.02 | 0.04 | 0.02 | 0.05 | 0.01 | |
| Cr2O3 | Range | 0.01–0.22 | 0.04–0.16 | 0.13–0.22 | 0.03–0.25 | 0.92–0.93 | 0.08–0.11 |
| Average | 0.08 | 0.09 | 0.17 | 0.11 | 0.93 | 0.10 | |
| BeO | Range | 12.81–13.26 | 12.73–13.58 | 13.21–13.50 | 12.51–12.92 | 13.16–13.21 | 13.34–13.36 |
| Average | 12.99 | 13.13 | 13.31 | 12.72 | 13.19 | 13.35 | |
| MgO | Range | 1.64–2.12 | 1.67–2.39 | 2.23–2.27 | 1.61–2.17 | 2.29–2.41 | 2.01–2.11 |
| Average | 1.94 | 2.04 | 2.26 | 1.87 | 2.35 | 2.06 | |
| CaO | Range | 0.03–0.05 | 0.01–0.07 | 0.03–0.05 | 0.02–0.06 | 0.04–0.04 | 0.01–0.03 |
| Average | 0.04 | 0.04 | 0.04 | 0.04 | 0.04 | 0.02 | |
| FeO | Range | 0.38–0.53 | 0.42–0.65 | 0.51–0.61 | 0.41–0.70 | 0.69–0.73 | 0.44–0.50 |
| Average | 0.46 | 0.53 | 0.57 | 0.51 | 0.71 | 0.47 | |
| Na2O | Range | 1.37–1.73 | 1.22–1.70 | 1.83–1.91 | 1.29–1.62 | 1.70–1.74 | 1.68–1.68 |
| Average | 1.58 | 1.45 | 1.88 | 1.44 | 1.72 | 1.69 | |
| K2O | Range | 0.04–0.05 | 0.02–0.07 | 0.06–0.09 | 0.05–0.18 | 0.06–0.06 | 0.04–0.04 |
| Average | 0.04 | 0.04 | 0.07 | 0.08 | 0.06 | 0.04 | |
| Li2O a | Range | 0.05–0.05 | 0.05–0.08 | 0.05–0.07 | 0.04–0.07 | 0.04–0.05 | 0.05–0.13 |
| Average | 0.05 | 0.07 | 0.06 | 0.05 | 0.05 | 0.09 | |
| Cs2O | Range | bdl-0.04 | 0.02–0.05 | 0.03–0.03 | 0.02–0.04 | 0.05–0.06 | 0.05–0.07 |
| Average | 0.02 | 0.03 | 0.03 | 0.03 | 0.06 | 0.06 | |
| H2O b | Range | 2.36–2.48 | 2.29–2.47 | 2.51–2.54 | 2.32–2.45 | 2.47–2.48 | 2.47–2.47 |
| Average | 2.43 | 2.38 | 2.53 | 2.38 | 2.48 | 2.47 | |
| Total | Range | 98.61–99.43 | 97.72–99.65 | 97.67–98.11 | 98.92–99.40 | 99.30–99.58 | 98.49–98.58 |
| Average | 98.91 | 98.65 | 97.89 | 99.09 | 99.44 | 98.53 | |
| Atomic Proportions Based on the Si = 6 apfu | |||||||
| Si4+ | 6.000 | 6.000 | 6.000 | 6.000 | 6.000 | 6.000 | |
| Ti4+ | Range | bdl | bdl-0.002 | bdl-0.003 | bdl-0.003 | bdl-0.002 | bdl-0.002 |
| Average | 0.001 | 0.001 | 0.001 | 0.001 | 0.001 | ||
| Al3+ | Range | 1.823–1.929 | 1.755–1.923 | 1.693–1.744 | 1.772–1.908 | 1.694–1.716 | 1.824–1.827 |
| Average | 1.861 | 1.842 | 1.732 | 1.851 | 1.705 | 1.831 | |
| V3+ | Range | bdl-0.001 | bdl-0.004 | 0.002–0.004 | bdl-0.003 | bdl-0.006 | bdl-0.001 |
| Average | bdl | 0.001 | 0.003 | 0.001 | 0.003 | 0.001 | |
| Cr3+ | Range | 0.001–0.016 | 0.003–0.012 | 0.010–0.016 | 0.002–0.018 | 0.068–0.069 | 0.006–0.008 |
| Average | 0.006 | 0.007 | 0.013 | 0.008 | 0.069 | 0.007 | |
| Be2+ | Range | 2.873–2.948 | 2.844–3.022 | 2.979–3.050 | 2.780–2.888 | 2.938–2.979 | 2.996–3.007 |
| Average | 2.903 | 2.940 | 3.004 | 2.828 | 2.959 | 3.002 | |
| Mg2+ | Range | 0.226–0.295 | 0.231–0.336 | 0.312–0.318 | 0.222–0.300 | 0.317–0.337 | 0.280–0.294 |
| Average | 0.269 | 0.283 | 0.316 | 0.258 | 0.327 | 0.287 | |
| Ca2+ | Range | 0.003–0.005 | 0.001–0.006 | 0.003–0.005 | 0.002–0.006 | 0.003–0.004 | 0.001–0.003 |
| Average | 0.004 | 0.004 | 0.004 | 0.004 | 0.004 | 0.002 | |
| Fe2+ | Range | 0.029–0.041 | 0.033–0.051 | 0.040–0.048 | 0.031–0.054 | 0.054–0.057 | 0.034–0.039 |
| Average | 0.036 | 0.041 | 0.045 | 0.039 | 0.056 | 0.037 | |
| Na+ | Range | 0.246–0.314 | 0.219–0.311 | 0.334–0.347 | 0.232–0.292 | 0.309–0.313 | 0.304–0.306 |
| Average | 0.286 | 0.262 | 0.343 | 0.259 | 0.311 | 0.305 | |
| K+ | Range | 0.004–0.006 | 0.003–0.008 | 0.007–0.011 | 0.005–0.022 | 0.007–0.008 | 0.005–0.005 |
| Average | 0.005 | 0.005 | 0.008 | 0.010 | 0.008 | 0.005 | |
| Li+ | Range | 0.019–0.019 | 0.019–0.030 | 0.019–0.026 | 0.015–0.026 | 0.015–0.019 | 0.019–0.049 |
| Average | 0.019 | 0.026 | 0.022 | 0.019 | 0.017 | 0.034 | |
| Cs+ | Range | bdl-0.002 | 0.001–0.002 | 0.001–0.001 | 0.001–0.001 | 0.002–0.002 | 0.002–0.003 |
| Average | 0.001 | 0.001 | 0.001 | 0.001 | 0.002 | 0.003 | |
| cA+ | Range | 0.270–0.338 | 0.251–0.343 | 0.369–0.382 | 0.260–0.327 | 0.337–0.338 | 0.333–0.360 |
| Average | 0.311 | 0.294 | 0.375 | 0.289 | 0.338 | 0.347 | |
| Sample | 127-9 | 94-8 | 127-4 | 94-5 | 94-6 | 127-2 | Detection Limit | |
|---|---|---|---|---|---|---|---|---|
| Color | Yellowish Green | Green | Bluish Green | Core-Rim | Core-Rim | Core-Rim | ||
| Element | ||||||||
| Li | Range | 279 | 274–311 | 229–277 | 289–416 | 239–401 | 335–507 | 6.2 |
| Average | 295 | 253 | 353 | 316 | 434 | |||
| Be | Range | 55,948 | 58,955–61,465 | 55,442–60,513 | 56,572–60,218 | 56,865–62,767 | 56,852–58,905 | 22 |
| Average | 60,293 | 57,978 | 58,981 | 59,657 | 57,751 | |||
| B | Range | 4.39 | 7.65–19.21 | 9.66–29.58 | 1.69–10.75 | bdl-13.38 | 2.49–7.15 | 8.5 |
| Average | 11.5 | 19.62 | 5.99 | 6.21 | 4.58 | |||
| Na | Range | 14,007 | 12,746–14,797 | 14,696–15,875 | 11,573–13,213 | 10,474–14,908 | 9690–13,707 | 355 |
| Average | 13,504 | 15,286 | 12,282 | 13,067 | 11,732 | |||
| Mg | Range | 12,900 | 13,738–14,453 | 13,406–14,389 | 9570–14,466 | 9832–14,937 | 9675–13,277 | 52 |
| Average | 14,189 | 13,898 | 12,311 | 12,476 | 11,327 | |||
| Al | Range | 58,432 | 53,693–58,603 | 58,129–59,099 | 60,300–70,313 | 59,400–63,833 | 54,455–62,002 | 52 |
| Average | 55,692 | 58,614 | 64,597 | 61,741 | 59,398 | |||
| P | Range | 18 | bdl-69 | bdl-100 | 39–85 | bdl-81 | bdl-137 | 84 |
| Average | 39 | 50 | 60 | 45 | 47 | |||
| K | Range | 260 | 169–305 250 | 269–315 | 173–241 | 108–325 | bdl-402 151 | 173 |
| Average | 292 | 198 | 243 | |||||
| Ca | Range | 1149 | 750–1012 | 197–1082 | 315–1272 | bdl-1479 | bdl-3087 | 1020 |
| Average | 860 | 640 | 653 | 921 | 1403 | |||
| Sc | Range | 59 | 85–106 | 102–104 | 17–67 | 20–99 | 24–59 | 7.7 |
| Average | 95 | 103 | 49 | 59 | 39 | |||
| Ti | Range | 15.2 | 0.1–13.8 | 1.1–29.8 | 0.2–13.9 | 5–32.2 | 5.6–24.4 | 18.3 |
| Average | 5.1 | 15.5 | 8.9 | 18.1 | 15 | |||
| V | Range | 106 | 106–122 | 111–111 | 37–105 | 48–120 | 41–102 | 2.1 |
| Average | 114 | 111 | 82 | 87 | 74 | |||
| Cr | Range | 362 | 1242–1273 | 5937–6310 | 106–1332 | 162–1192 | 362–1364 | 7.3 |
| Average | 1259 | 6124 | 813 | 484 | 719 | |||
| Mn | Range | 15 | 10–16 | 14–22 | 8–15 | 7–16 | 2–74 | 4.4 |
| Average | 13 | 18 | 12 | 11 | 27 | |||
| Fe | Range | 3419 | 3848–4073 | 3874–3946 | 2759–3765 | 2451–4153 | 2627–3859 | 311 |
| Average | 3938 | 3910 | 3304 | 3394 | 3208 | |||
| Co | Range | 1.52 | 1.39–1.75 | 1.14–3.13 | 0.89–2.34 | bdl-3.48 | 0.64–2.82 | 1.9 |
| Average | 1.5 | 2.14 | 1.78 | 1.64 | 1.70 | |||
| Zn | Range | 48 | 53–62 | 44–57 | 37–81 | 38–108 | 61–97 | 2.7 |
| Average | 56 | 51 | 57 | 68 | 78 | |||
| Ga | Range | 25 | 21–23 | 17–20 | 14–20 | 15–20 | 17–24 | 1.6 |
| Average | 22 | 19 | 16 | 19 | 20 | |||
| Rb | Range | 41 | 55–73 | 61–63 | 41–83 | 30–79 | 37–80 | 3 |
| Average | 63 | 62 | 55 | 54 | 56 | |||
| Cs | Range | 423 | 365–408 | 403–479 | 222–459 | 249–602 | 281–572 | 1.9 |
| Average | 383 | 441 | 314 | 388 | 362 | |||
| Th | Range | 0.058 | bdl | bdl | bdl | bdl | bdl | 0.04 |
| Average | ||||||||
| U | Range | bdl | bdl | bdl | bdl | bdl-0.066 | bdl-0.024 | 0.01 |
| Average | bdl | bdl |
Publisher’s Note: MDPI stays neutral with regard to jurisdictional claims in published maps and institutional affiliations. |
© 2022 by the authors. Licensee MDPI, Basel, Switzerland. This article is an open access article distributed under the terms and conditions of the Creative Commons Attribution (CC BY) license (https://creativecommons.org/licenses/by/4.0/).
Share and Cite
Qin, L.-J.; Yu, X.-Y.; Guo, H.-S. Fluid Inclusion and Chemical Composition Characteristics of Emeralds from Rajasthan Area, India. Minerals 2022, 12, 641. https://doi.org/10.3390/min12050641
Qin L-J, Yu X-Y, Guo H-S. Fluid Inclusion and Chemical Composition Characteristics of Emeralds from Rajasthan Area, India. Minerals. 2022; 12(5):641. https://doi.org/10.3390/min12050641
Chicago/Turabian StyleQin, Li-Jie, Xiao-Yan Yu, and Hong-Shu Guo. 2022. "Fluid Inclusion and Chemical Composition Characteristics of Emeralds from Rajasthan Area, India" Minerals 12, no. 5: 641. https://doi.org/10.3390/min12050641
APA StyleQin, L.-J., Yu, X.-Y., & Guo, H.-S. (2022). Fluid Inclusion and Chemical Composition Characteristics of Emeralds from Rajasthan Area, India. Minerals, 12(5), 641. https://doi.org/10.3390/min12050641