Article

Using Top-of-Froth Conductivity to Infer Water Overflow Rate in a Two-Phase Lab-Scale Flotation Column

Department of Mining and Materials Engineering, McGill University, 3610 University Street, Montreal, QC H3A 0C5, Canada
*
Author to whom correspondence should be addressed.
Minerals 2022, 12(4), 454; https://doi.org/10.3390/min12040454
Submission received: 9 March 2022 / Revised: 3 April 2022 / Accepted: 5 April 2022 / Published: 7 April 2022
(This article belongs to the Special Issue Hydrodynamics and Gas Dispersion in Flotation)

Abstract

:
The metallurgical performance of a flotation machine is largely defined by phenomena occurring in the froth zone. The water content in the froth affects recovery by influencing froth stability and mobility and, at the same time, reduces grade by mechanical entrainment of gangue particles in the overflow water. Efficient operation requires a compromise between the water carried by bubbles from the collection zone and that which overflows. It is believed that the most suitable operating strategy could be based on the measurement of froth water content, as a strong correlation with water overflow is anticipated. This work reports the testing results of an in situ electrical conductivity sensor continuously measuring the froth zone water content in a laboratory-scale flotation column. The test program included simultaneous measurement of froth conductivity and water overflow rates for changes in gas flow rate and frother concentration. The results show a stronger dependence of the measured top-of-froth water content on frother concentration than on the gas flow rate. A relatively linear trend was shown between top-of-froth water content and water overflow rate for a given air rate and frother.

1. Introduction

The froth zone plays an important role in the flotation process by providing a transport medium for bubble–particle aggregates to rise from the collection zone to the concentrate launder. Bubbles and aggregates carry, in addition to the collected particles, water which entrains fine hydrophilic and hydrophobic particles [1,2]. This mechanical entrainment is a non-selective process that negatively affects the concentrate grade [3,4,5]. A cleaning action develops as the rising bubble–particle aggregates concentrate the target mineral by draining water back to the collection zone, carrying some of the entrained gangue [3].
The metallurgical performance is affected by the water carried by and contained in the froth, which is established by the water flows carried by bubbles from the collection zone and that overflowing into the concentrate launder. A large water content is indicative of more stable and mobile froths [6], which will result in higher recoveries because of a more efficient transfer of the collected material to the concentrate launder but at the same time lower grades because of the higher amounts of water (and entrained gangue) overflowing into the concentrate [7]. Therefore, a compromise is required depending on the perceived requirement of the flotation unit (high grade or high recovery).
Development of an operating strategy requires a control variable that can be continuously and reliably measured. The concentrate water flow rate (water recovery), which is considered the most suitable, due to its high correlation with recovery through entrainment [7], is not currently measured. However, as a strong correlation with the water overflow rate is expected, an alternative is the measurement of froth water content.
This work reports the results of testing an in situ electrical conductivity sensor continuously measuring the froth zone water content in a laboratory-scale flotation column. Measurement of froth conductivity using a flow conductivity cell and equations to calculate froth zone water content are described. Instrumentation for measuring and controlling the gas flowrate was incorporated into the experimental setup. The water overflow rate was determined through weighing timed samples. The program included simultaneous measurement of froth conductivity and water overflow rates for changes in the gas flow rate and concentration of three frothers.

2. Conductivity Measurements of Dispersions

The conductivity, κ (mS cm−1), is an intensive property describing the ability of a liquid solution to conduct an electrical current, which can be used to estimate the water content of an air–water dispersion as air is effectively non-conductive. The more water present, the more conductive the dispersion will be. In a two-phase dispersion (water–continuous phase, air–dispersed phase), the relative conductivity, K , is defined in Equation (1) as:
K = κ d i s p e r s i o n κ l i q u i d
where κ d i s p e r s i o n (mS cm−1) is the effective conductivity of the dispersion (both water and air), and κ l i q u i d (mS cm−1) is the continuous phase conductivity (water). This relative conductivity can then be related to the amount of continuous phase in the dispersion, or the froth zone water content, ε l . A theoretical relationship between relative conductivity and dispersion water content was derived by Maxwell [8] based on a dilute dispersion of mono-sized, non-conducting spheres:
ε l = 3 K K + 2
Maxwell’s equation has been successfully applied to dilute dispersions, such as those found in the collection zone of flotation machines, to determine gas holdup, ε g , a useful metric for inferring collection zone performance [9,10,11,12]. The application of Maxwell’s equation led to the development of an industrial gas holdup sensor, which has been described by Gomez and Finch [10]. Maxwell’s equation, however, has been shown to be effective only up to a liquid volume fraction of ~0.5 and is considered the limiting relationship for dilute dispersions [13]. In a more concentrated dispersion, akin to the froth zone, this relationship begins to underpredict the water content due to non-valid assumptions made in Maxwell’s derivation [13]. Recently, Feitosa et al. [14] reviewed the relative conductivity-to-water content relationship for a full range of dispersions, and developed an empirical model described by Equation (3).
ε l = 3 K ( 1 + 11 K ) ( 1 + 25 K + 10 K 2 )
This relationship is more applicable to flotation froths as the froth zone can vary between dry to wet froths depending on the operating conditions of the float cell. For a review on the derivation of models relating relative conductivity and water content in dispersions, see Banisi et al. [13].
The conductivity of a solution is determined by measuring the conductance, G (mS), of a solution between two electrodes. The measured conductance is related to the liquid conductivity, κ (mS cm−1), by the cell constant, A c e l l (cm), of the measuring device:
G = κ   A c e l l
The cell constant is affected by the characteristics of the generated electric field resulting from the size and spatial arrangement of the electrodes. For an ideal conductivity cell, one where the electric field is uniform and perpendicular to the electrodes, the cell constant is defined by the surface area and distance between the electrodes. A practical conductivity cell will have, in general, a cell constant different from that calculated from its geometry, due to non-idealities shown by the electric field generated in the sensor or to electrode arrangements with variable area and distances. In this case, the cell constant is determined experimentally by measuring the conductance of a solution of known conductivity and solving Equation (4).

3. Experimental Section

3.1. The Conductivity Sensor

To measure the conductivity of the dispersion in the froth zone, a flow cell that allows conductance measurements for a flowing dispersion was necessary. It was constructed utilizing three stainless steel rings as electrodes (10.2 cm inside diameter) threaded flush to the internal wall of a non-conducting polyvinyl chloride (PVC) cylinder. The ring electrodes were 1 cm wide, spaced 2 cm apart and oppositely charged (Figure 1).
The cell design follows the works conducted by Tavera [15] and Cortes-Lopez [9], who developed sensors for gas holdup measurement in the collection zone of industrial flotation columns.
The conductivity cell was fitted to the top of a lab-scale flotation column, flush with the column wall, positioning the midpoint of the sensor at 7.5 cm below the overflow lip. The sensor was connected to a Yokogawa EXA DC 402 conductivity meter, with a resistance range of 0.00 kΩ–999 MΩ and equipped with dynamic electrode polarization prevention.
In this study, the term top-of-froth water content refers to the volume of froth enclosed between the bottom and top grounded electrodes (Figure 1).

3.2. Emulsion Generation

Oil-in-water emulsions of known phase fractions were created to validate the relationship of relative conductivity to phase fraction. Kerosene (99.9% kerosene, Sigma Aldrich Canada, Oakville, ON, Canada) was used as the oil phase, and Montréal tap water was used as the continuous phase. Tween 60 (polyethylene glycol sorbitan monosterate, Sigma Aldrich Canada, Oakville, ON, Canada) was used as an emulsifier. Tween 60 was dissolved in the water phase (using a 2%vol ratio of Tween 60 to water) using a mechanical stirrer. The Tween 60 and water mixture was then mixed with the desired amount of kerosene (to create a variety of oil-in-water phase fractions). The overall mixture was then sonicated using a 24 kHz ultrasonic processor (Hielscher, Teltow, Germany, UP400S) running at 110 W until a stable emulsion was produced.

3.3. Blast Gate Apparatus and Methodology

The conductivity sensor was attached to a blast gate on top of the laboratory flotation column. The blast gate could be positioned as open or closed, as shown in Figure 2a,b, respectively. A two-phase dispersion was created by adding surfactant (PPG 425) at a variety of concentrations and gas flow rates to generate stable froths, allowing the froth depth to vary by controlling the interface level. With the froth overflowing, a conductivity measurement was recorded, and the blast gate was rapidly changed from open (position a.) to closed (position b.), capturing and collecting the froth being measured in the sensor. The water content in the froth dispersion was calculated by measuring the quantity of water collected, divided by the known volume of the sensor.

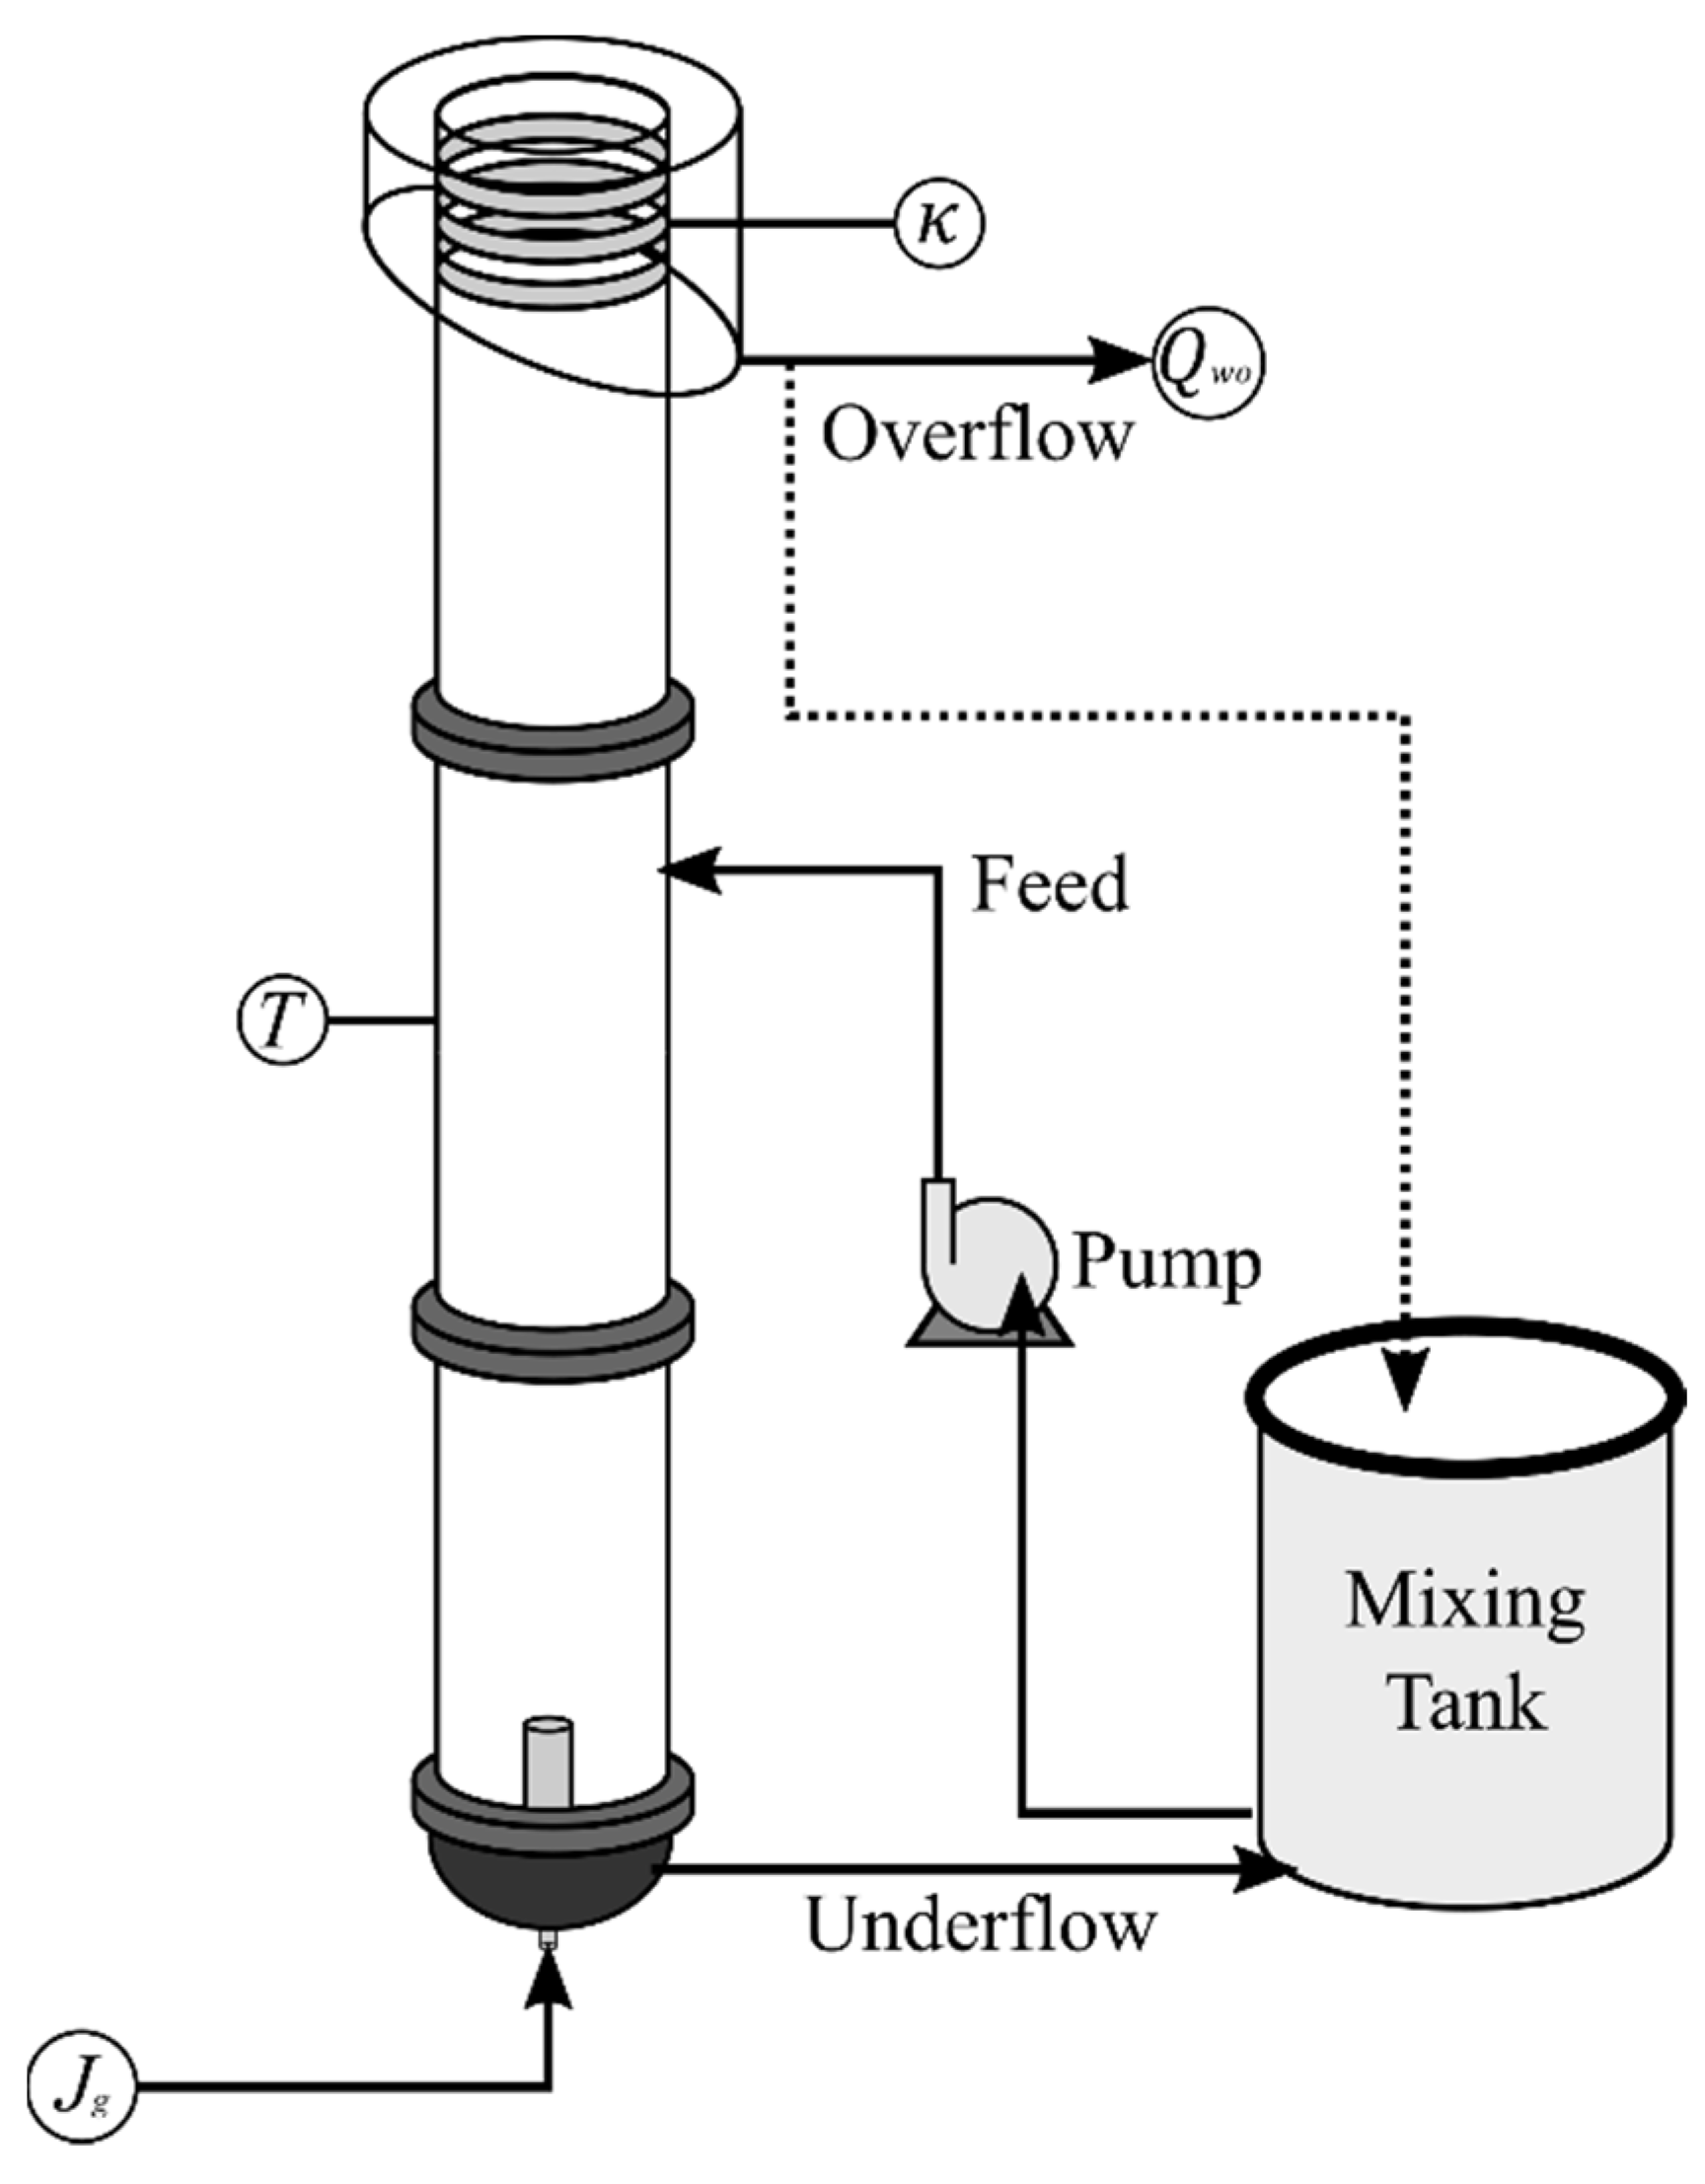
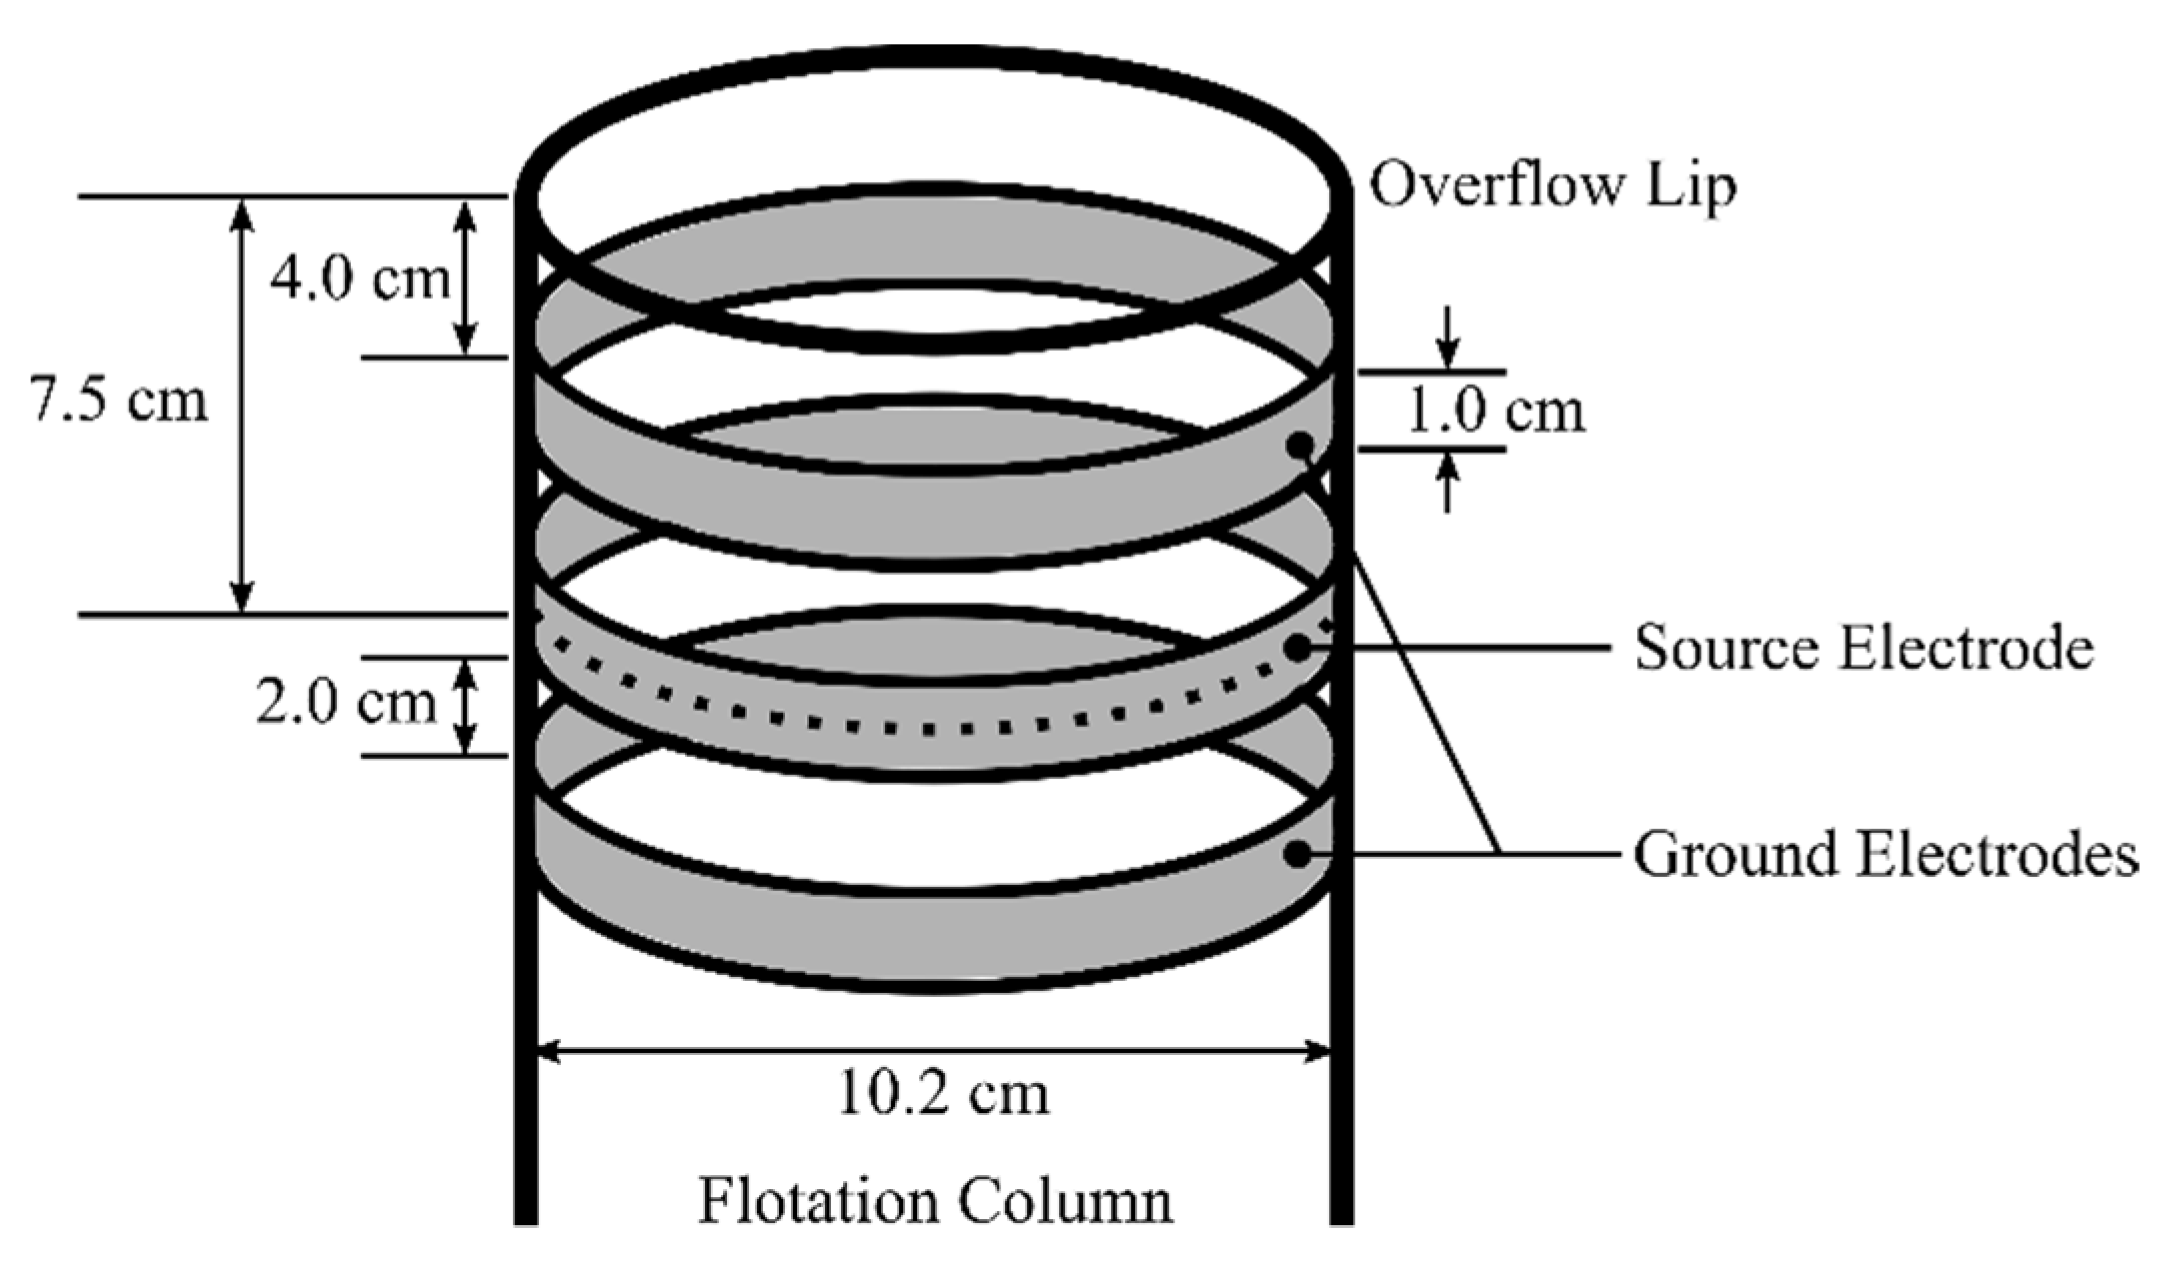
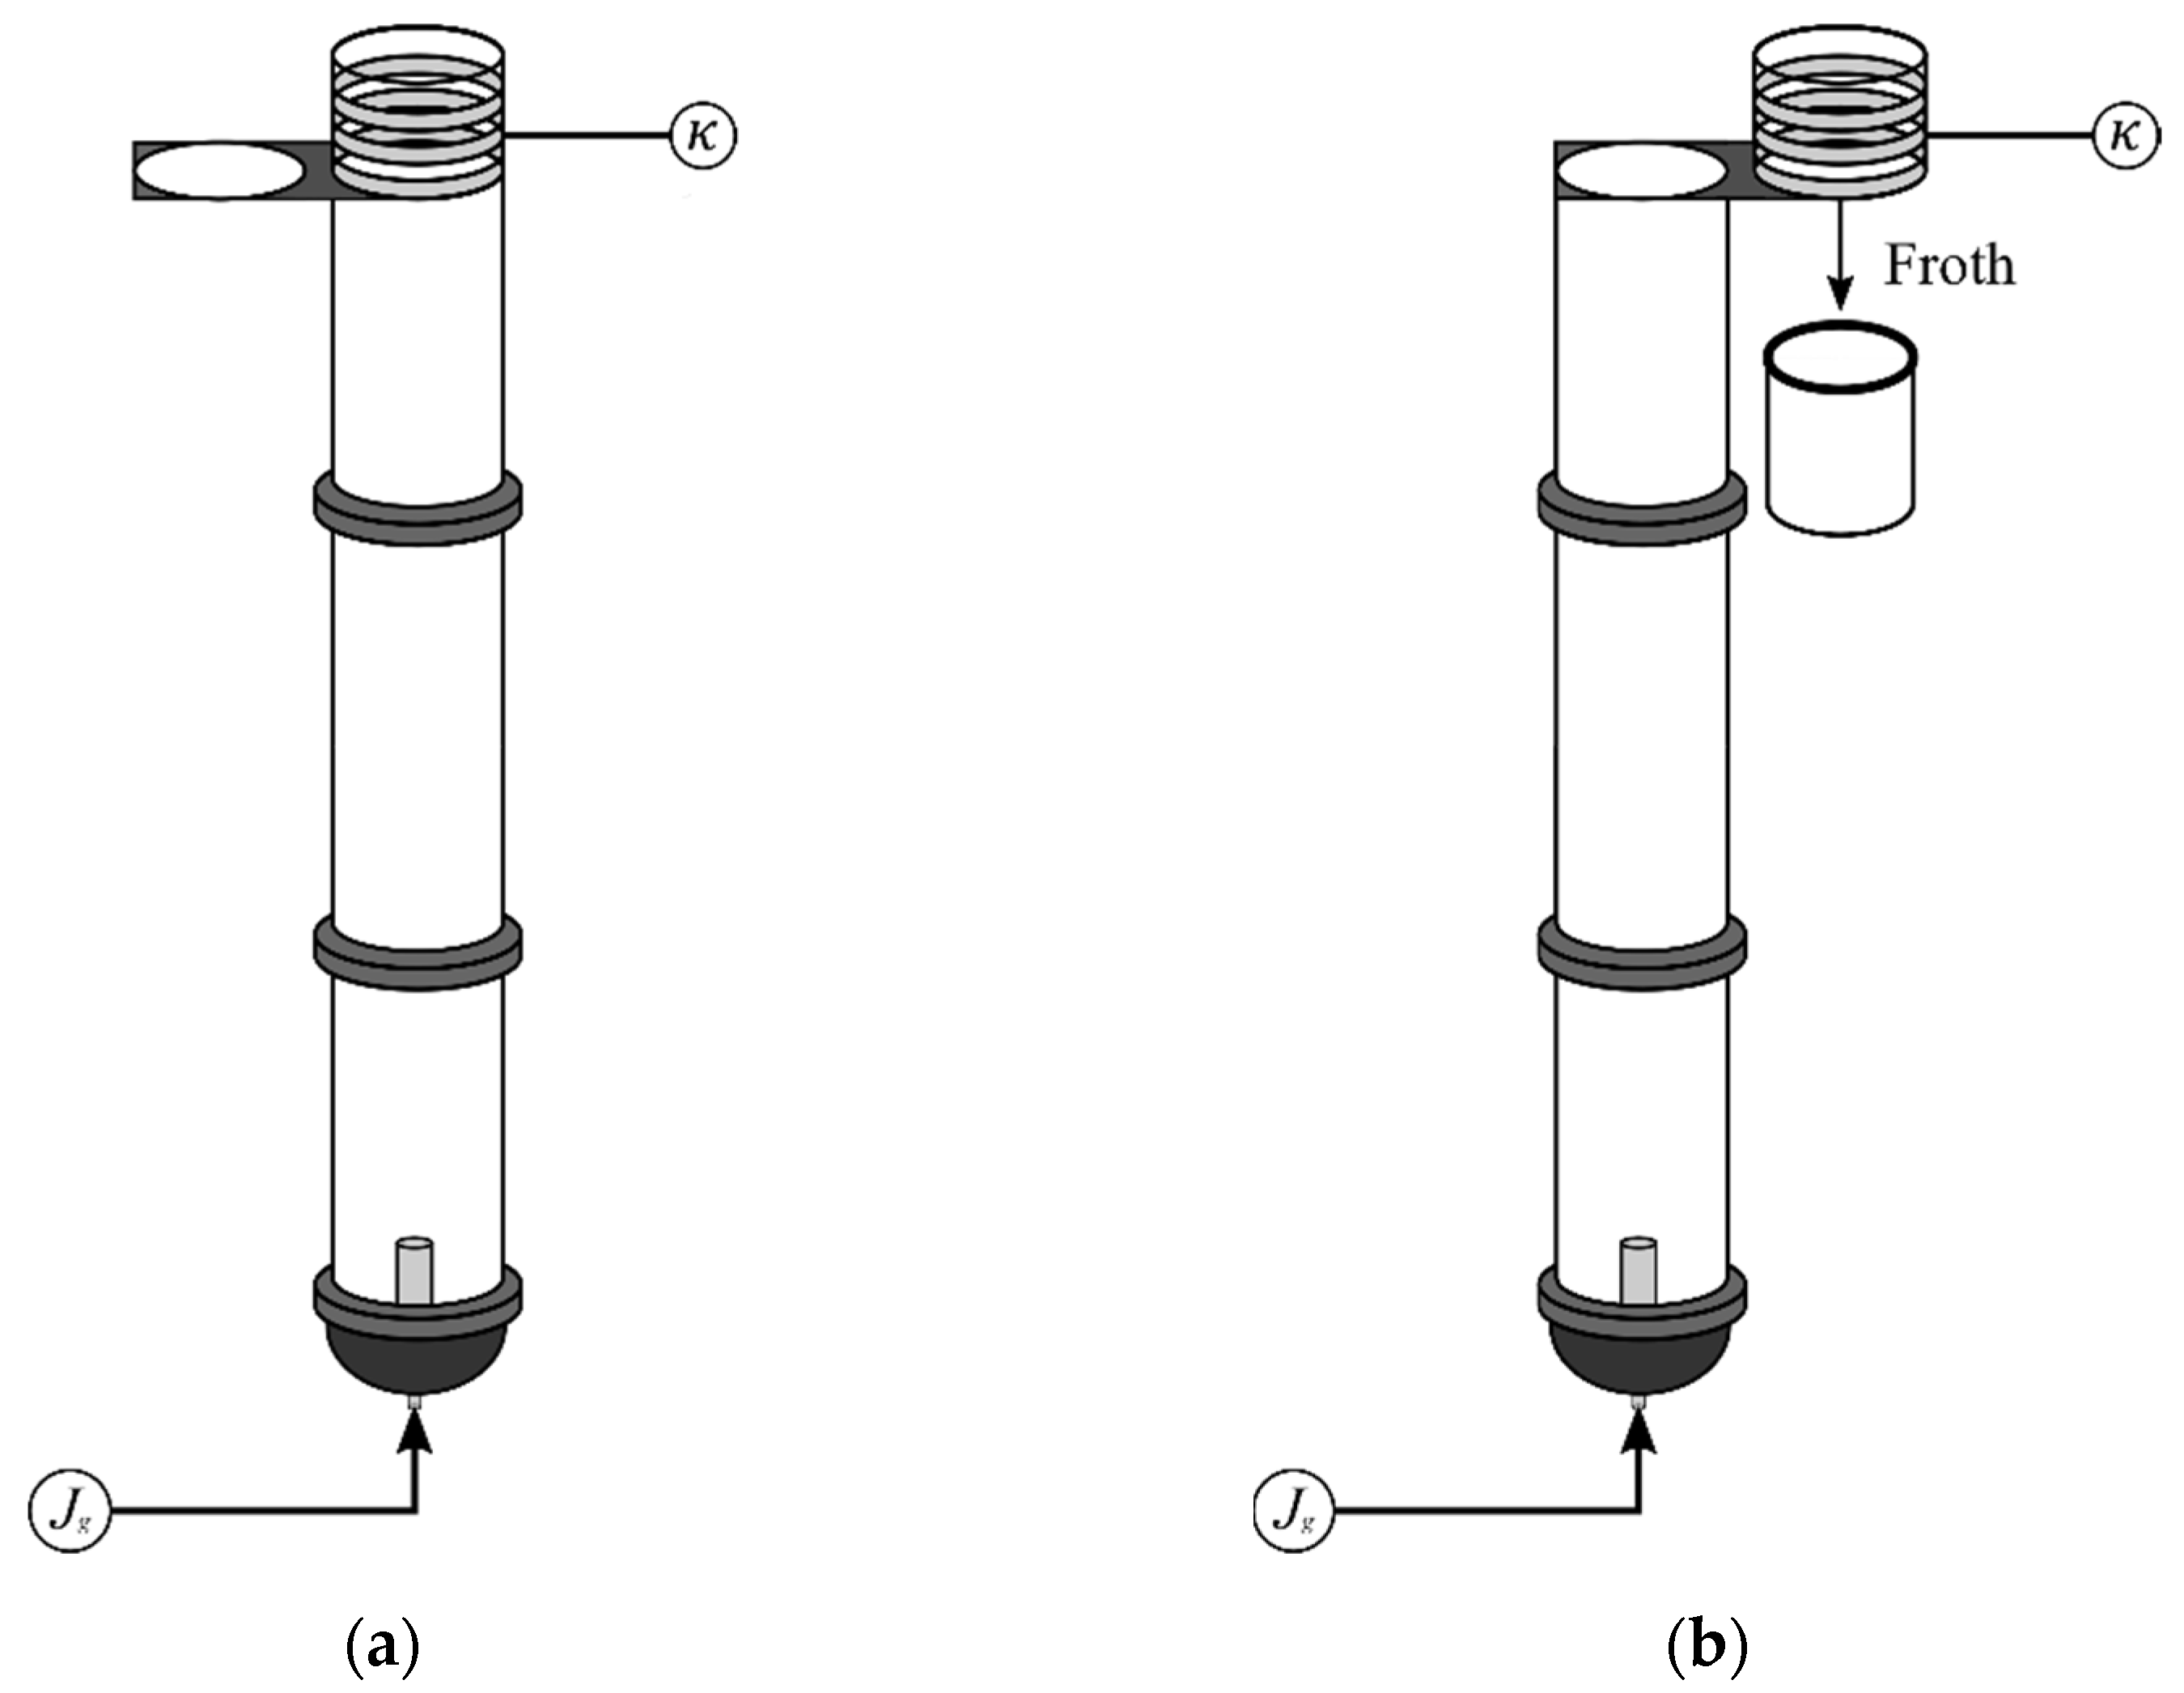
3.4. Laboratory Flotation Column and Methodology

The apparatus used, shown in Figure 3, was a 10.2 cm internal diameter flotation column, 3.65 m in height. The column was equipped with an air flow meter (OMEGA, FMA-A2409 mass controller) and temperature transmitter (Thermopar type K). Air was injected through a stainless-steel sparger to create fine bubbles. The conductivity sensor was fitted to the top of the column to measure the top of the froth zone conductivity. The overflowing froth was collected and measured using a bucket and stopwatch technique to measure the water overflow rate. The water overflow was collected for at least 60 s while simultaneously measuring the froth zone conductivity. The superficial air rate, J g (cm s−1) and frother concentration were varied to obtain different water overflow rates. The tests were operated with a constant froth depth of 21.6 cm. The froth depth was chosen to have a sufficiently stable froth in the measurement volume of the sensor. To obtain the conductivity of the continuous phase, the column was first filled with the process water solution in the absence of air. Overflowing water was recirculated to the mixing tank unless water overflow measurements were being conducted. The full apparatus is shown in Figure 3, and all measurements are summarized in Table 1.

3.5. Materials

3.5.1. Process Water

The process water used in this study was Montréal (Canada) city tap water, which was measured to have a conductivity of 330 μS cm−1 at room temperature (20 °C). It is noted that any change in conductivity of the process water used between experiments was accounted for by the relative nature of the conductivity measurements (Equation (1)). Experiments were performed at approximately 20 °C.

3.5.2. Frothers

Three samples of polyglycol frothers were employed in the study: DF1012 (Dow Chemicals, Midland, MI, USA), F160-13 (Flottec, Sudbury, ON, Canada) and PPG 425 (Sigma Aldrich, St. Louis, MO, USA). The frother molecule structures are summarized in Table 2.

4. Results and Discussion

4.1. Validating the Conductivity Sensor

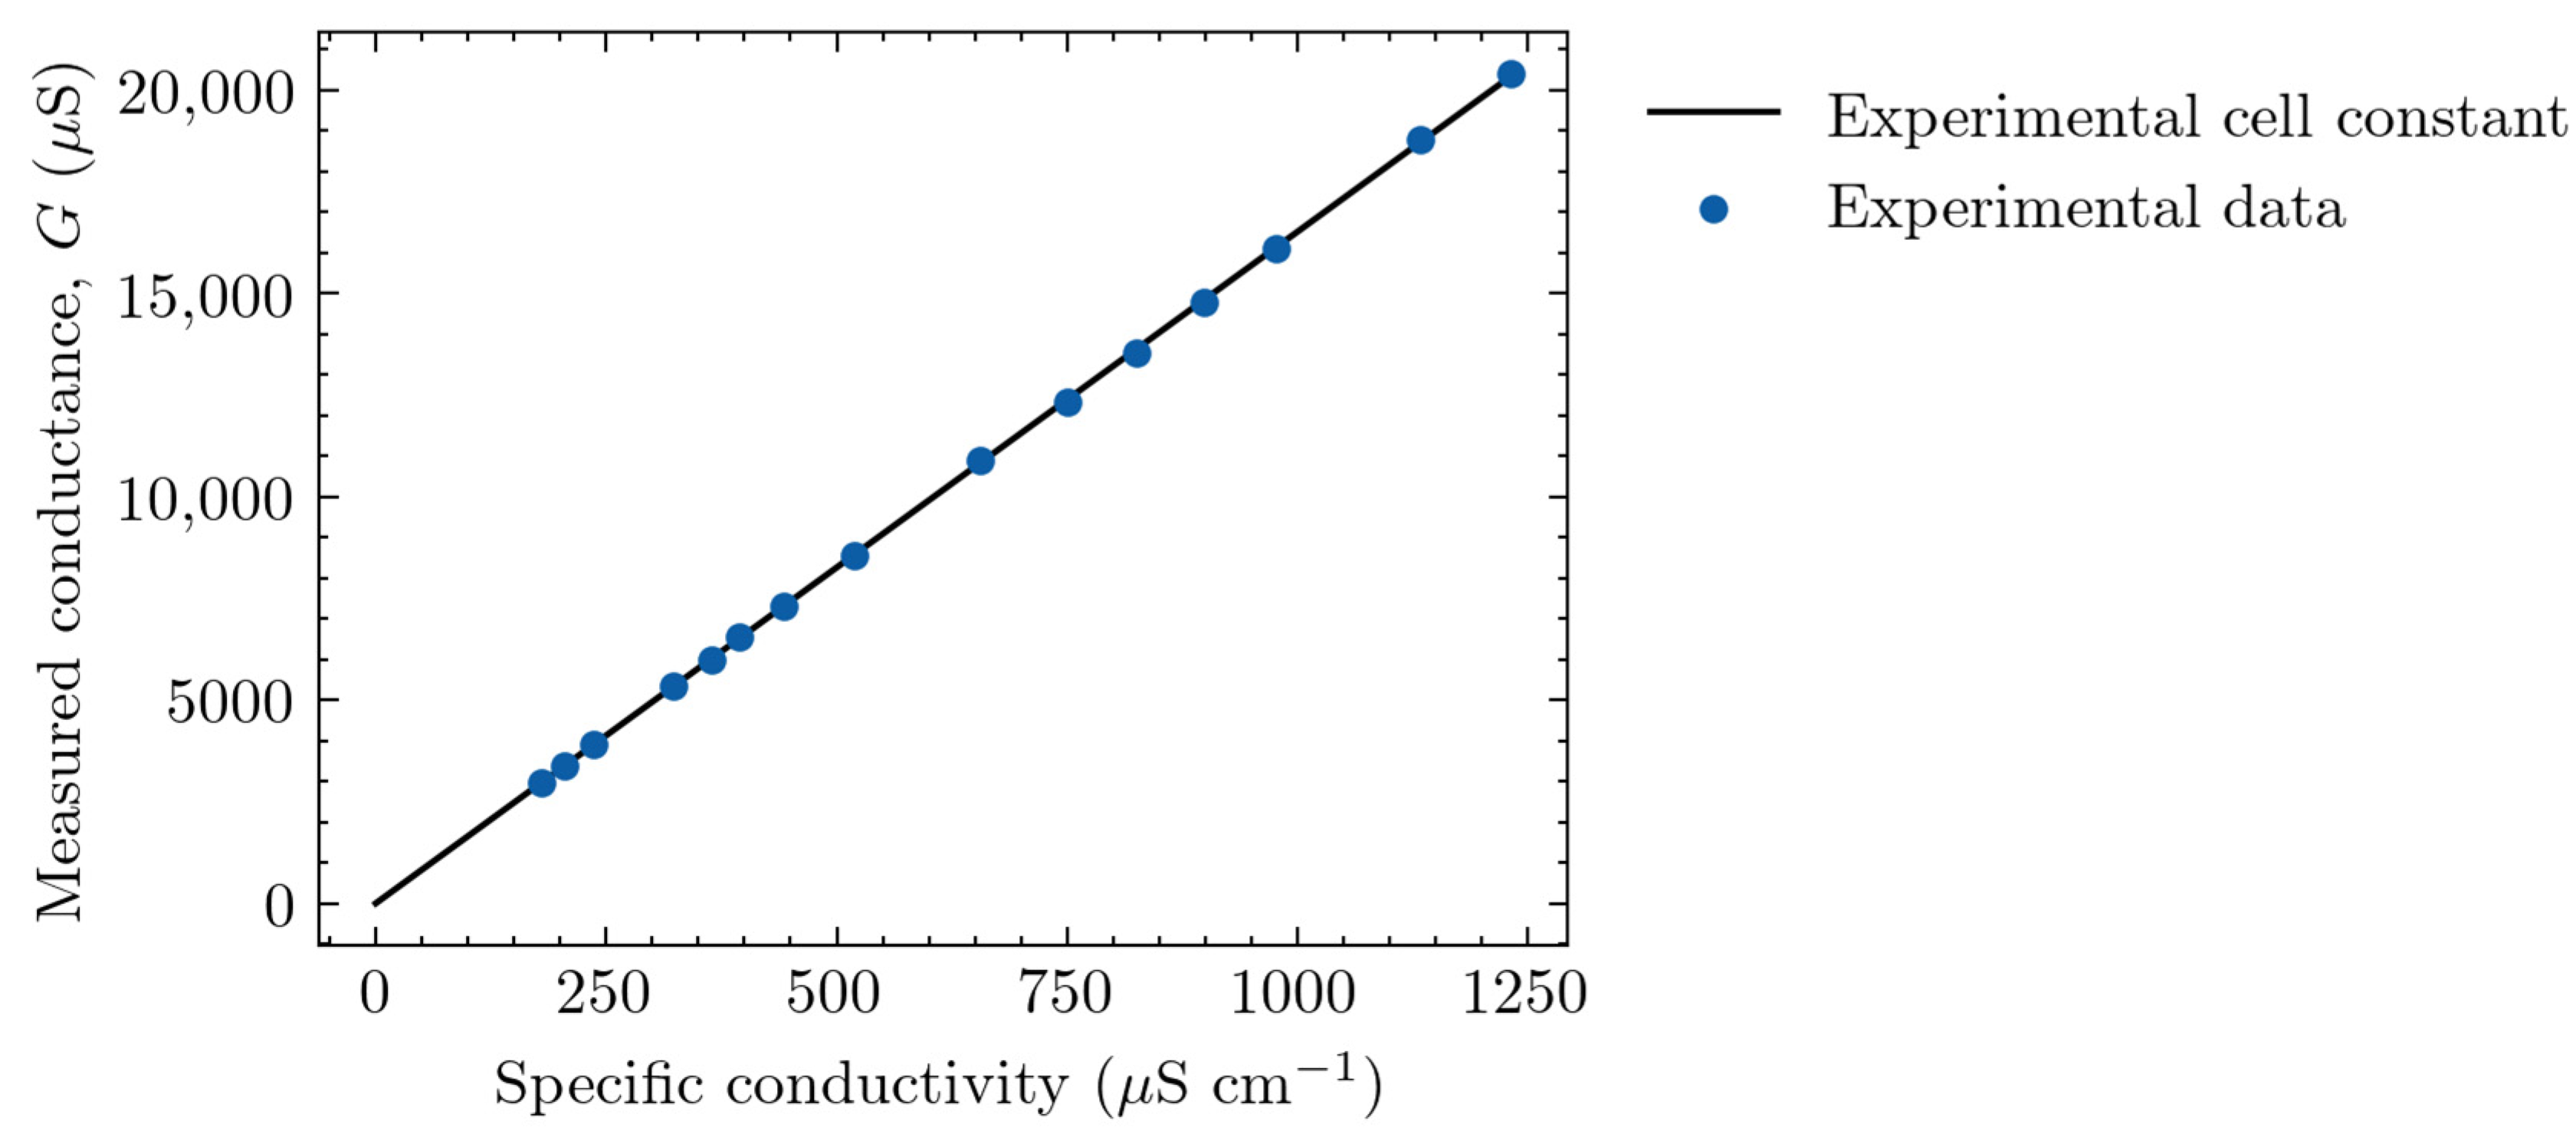
4.1.1. Determining the Cell Constant

The conductivity sensor cell constant was experimentally measured by referencing conductance measurements made by the sensor to the specific conductivity measured by a CDM210 Meter Lab laboratory conductivity meter. A range of solution conductivities were created by varying the concentration of potassium chloride (KCl). Figure 4 shows the measured conductance of the sensor for a specific conductivity range of 180–1200 µS cm−1.
The experimental cell constant (calculated by Equation (4)) was determined to be 16.2 cm and remained constant over the range of conductivities tested.

4.1.2. Measuring a Known Water Content Dispersion

A series of oil-in-water emulsions with known water phase fractions were created. As kerosene is effectively non-conductive [17], it acts to emulate air in an air–water dispersion. An emulsion was used to create a stable two-phase dispersion during measurements to validate the conductivity sensor. The kerosene phase was varied from 10% to 45%. The water phase (Montréal city tap water) was measured as the continuous phase fraction ( κ l i q u i d from Equation (1)), and then subsequently the kerosene–water emulsion was measured ( κ d i s p e r s i o n ). It is noted that larger kerosene phase fractions were not obtainable using the methodology described. To achieve higher kerosene phase fractions, high internal phase emulsions could be used, which are described by Cameron and Sherrington [18], but this was out of the scope of the present study. The Feitosa et al. [14] model (Equation (3)) was used to relate the measured relative conductivity to infer the water phase fraction, with the results shown in Figure 5.
The results show that the water content phase fraction was accurately predicted by the sensor and the Feitosa model, which produced an R2 value of 0.986.

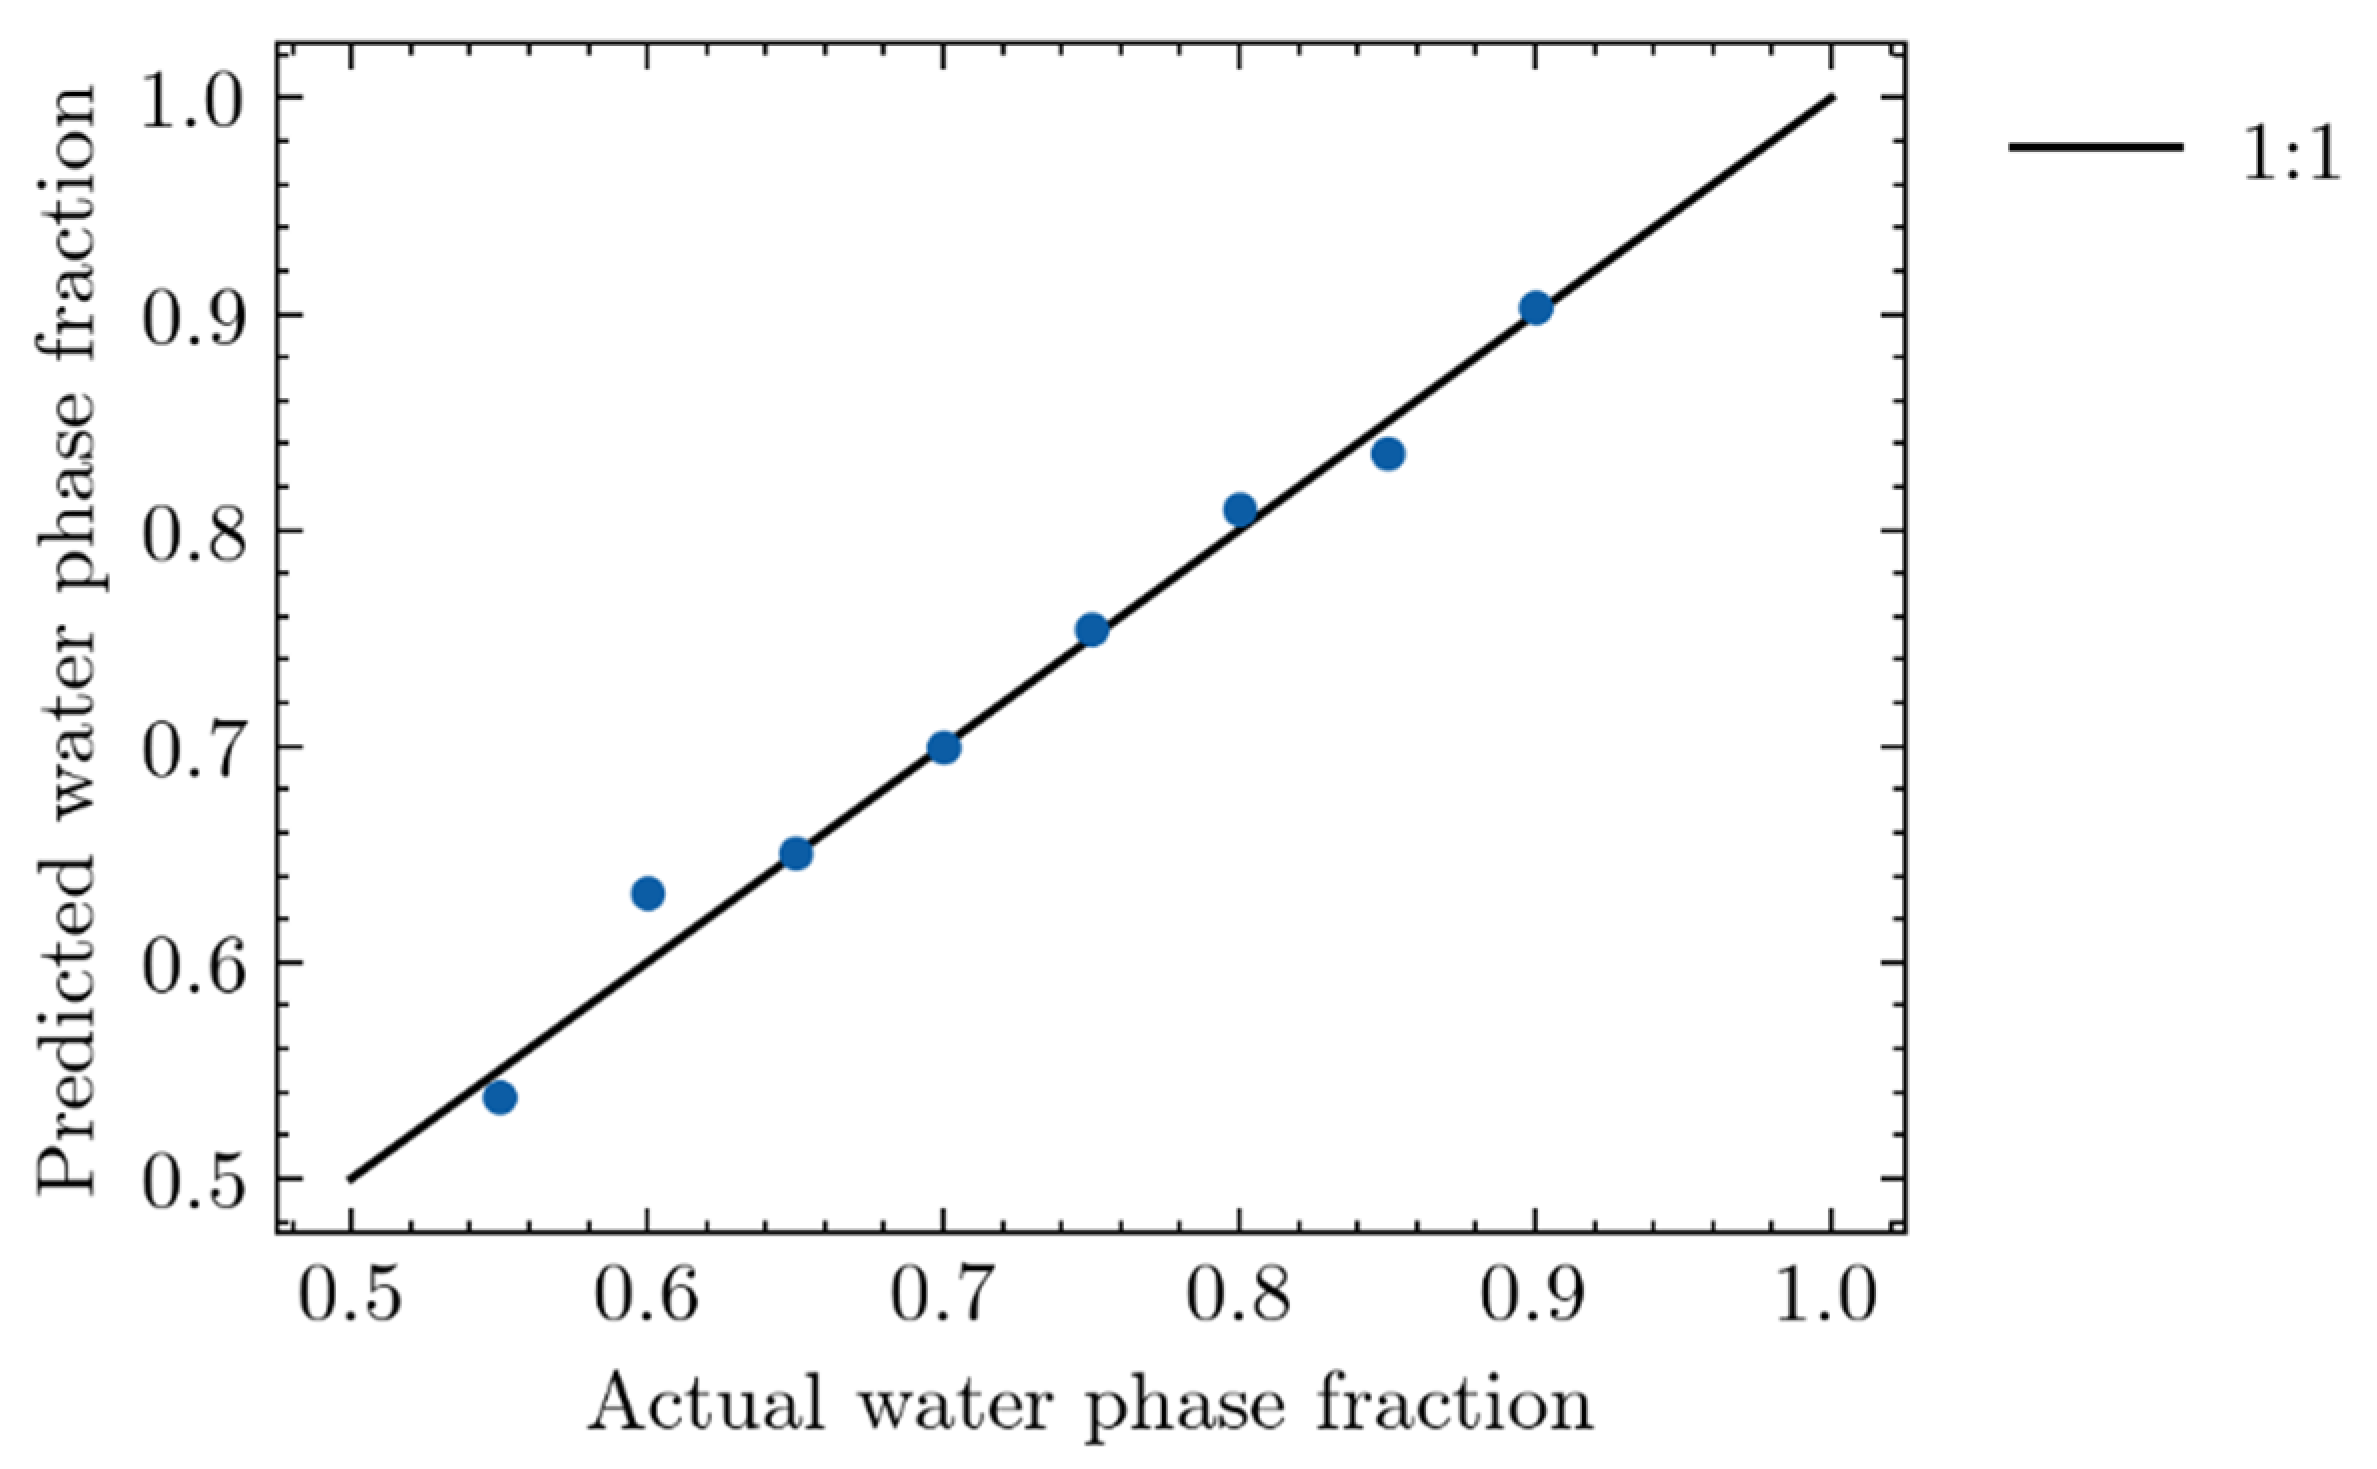
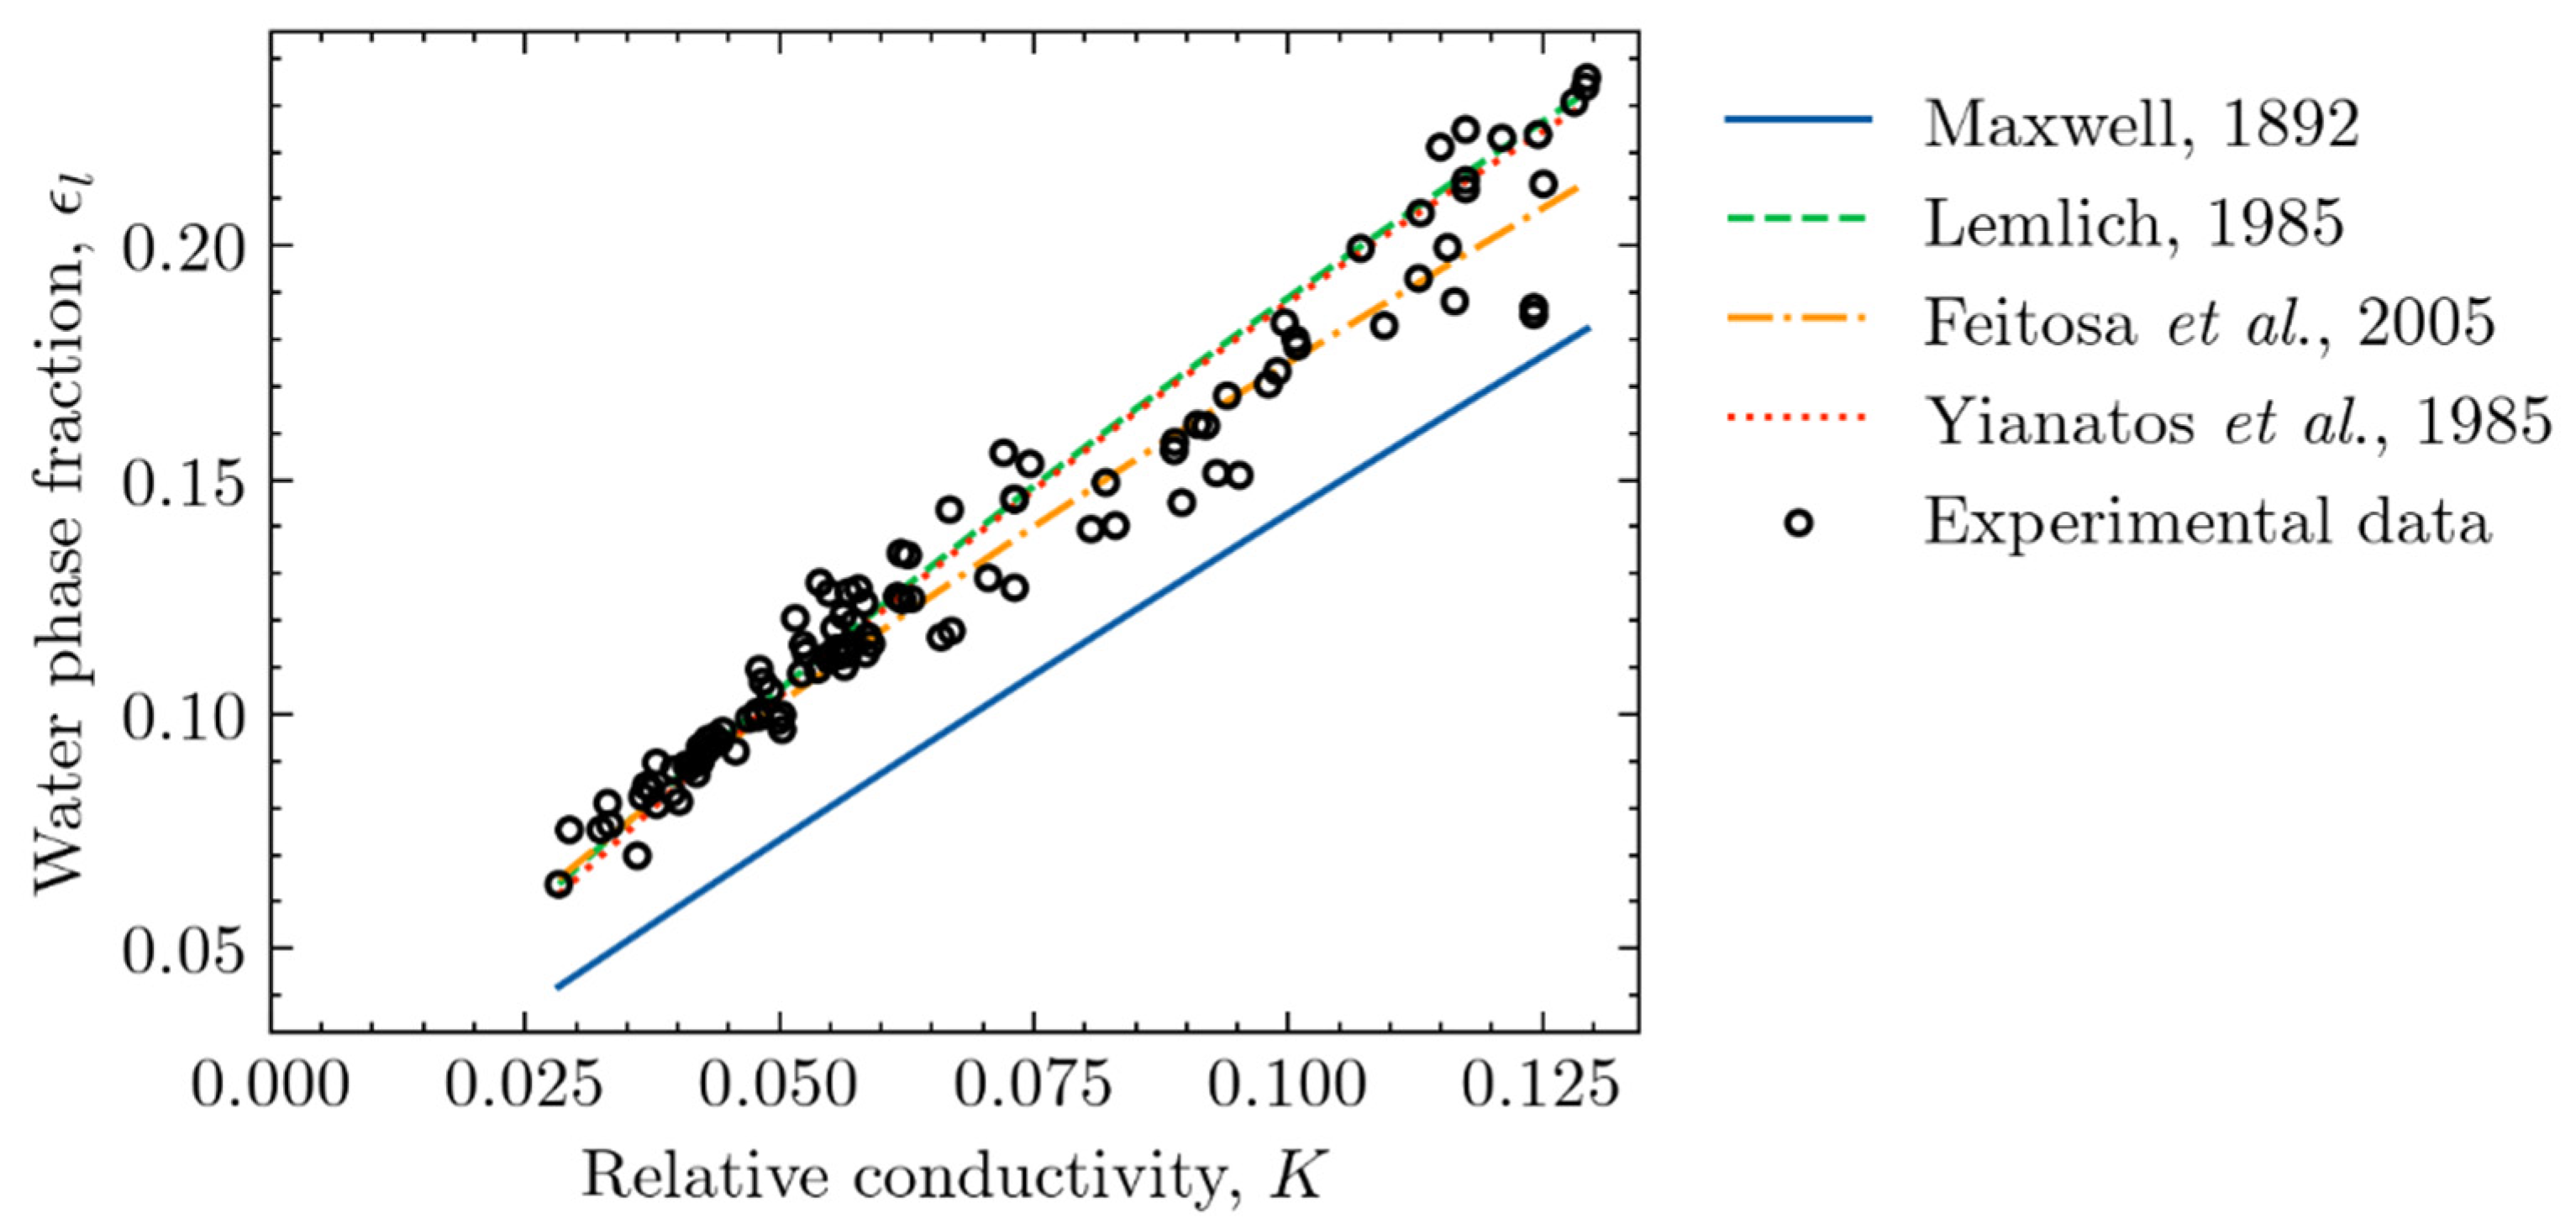
4.1.3. Validating the Relationship of Relative Conductivity to Froth Zone Water Content

The blast gate method described in Section 3.3 was used to further validate the Feitosa et al. [14] model. Tests were performed to simultaneously measure the froth zone conductivity and water content. The measured water content, determined by the blast gate method, and conductivity of the froth were then compared to the Feitosa et al. model and others from the literature summarized in Table 3 and shown in Figure 6.
The results show good agreement with the Feitosa et al., Yianatos et al. and Lemlich models. The deviation from Maxwell’s model at a low dispersion concentration was seen as described by Banisi et al. [13]. Table 4 outlines the R2 for the different models presented in Figure 6.
To select the model to use, a model showing good applicability from a dry froth to a dilute dispersion, as is seen in the collection zone, is recommended. This allows a single model to be used for all ranges of water contents that could be encountered in an industrial flotation machine. The Feitosa et al. [14] model is an empirical model developed from nine separate data sets, spanning from very dry to dilute dispersions, and fits the experimental data in Figure 6. The model has been applied in a number of studies in concentrated dispersions [21,22]. Thus, for the rest of this study, conductivity measurements of the froth are presented as froth zone water content, ε l , by means of the Feitosa et al. model.

4.2. Effect of Operating Conditions on the Top-of-Froth Zone Water Content

The effect of changing the input air rate and frother concentration on the top-of-froth water content was investigated by means of the methodology presented in Section 3.4 for the polyglycol frothers DF1012, PPG 425 and F160-13. Polyglycol frothers were chosen as they produced sufficient froth heights over a wide range of operating conditions to allow for investigation. Error bars indicate one standard deviation in the measurement and are included for all data points. A minimum of three replicate tests were performed for each condition. Below the concentrations tested, a sustainable water overflow was unobtainable for a froth depth of 21.6 cm, notably for concentrations below 20 ppm for the frother F160-13.

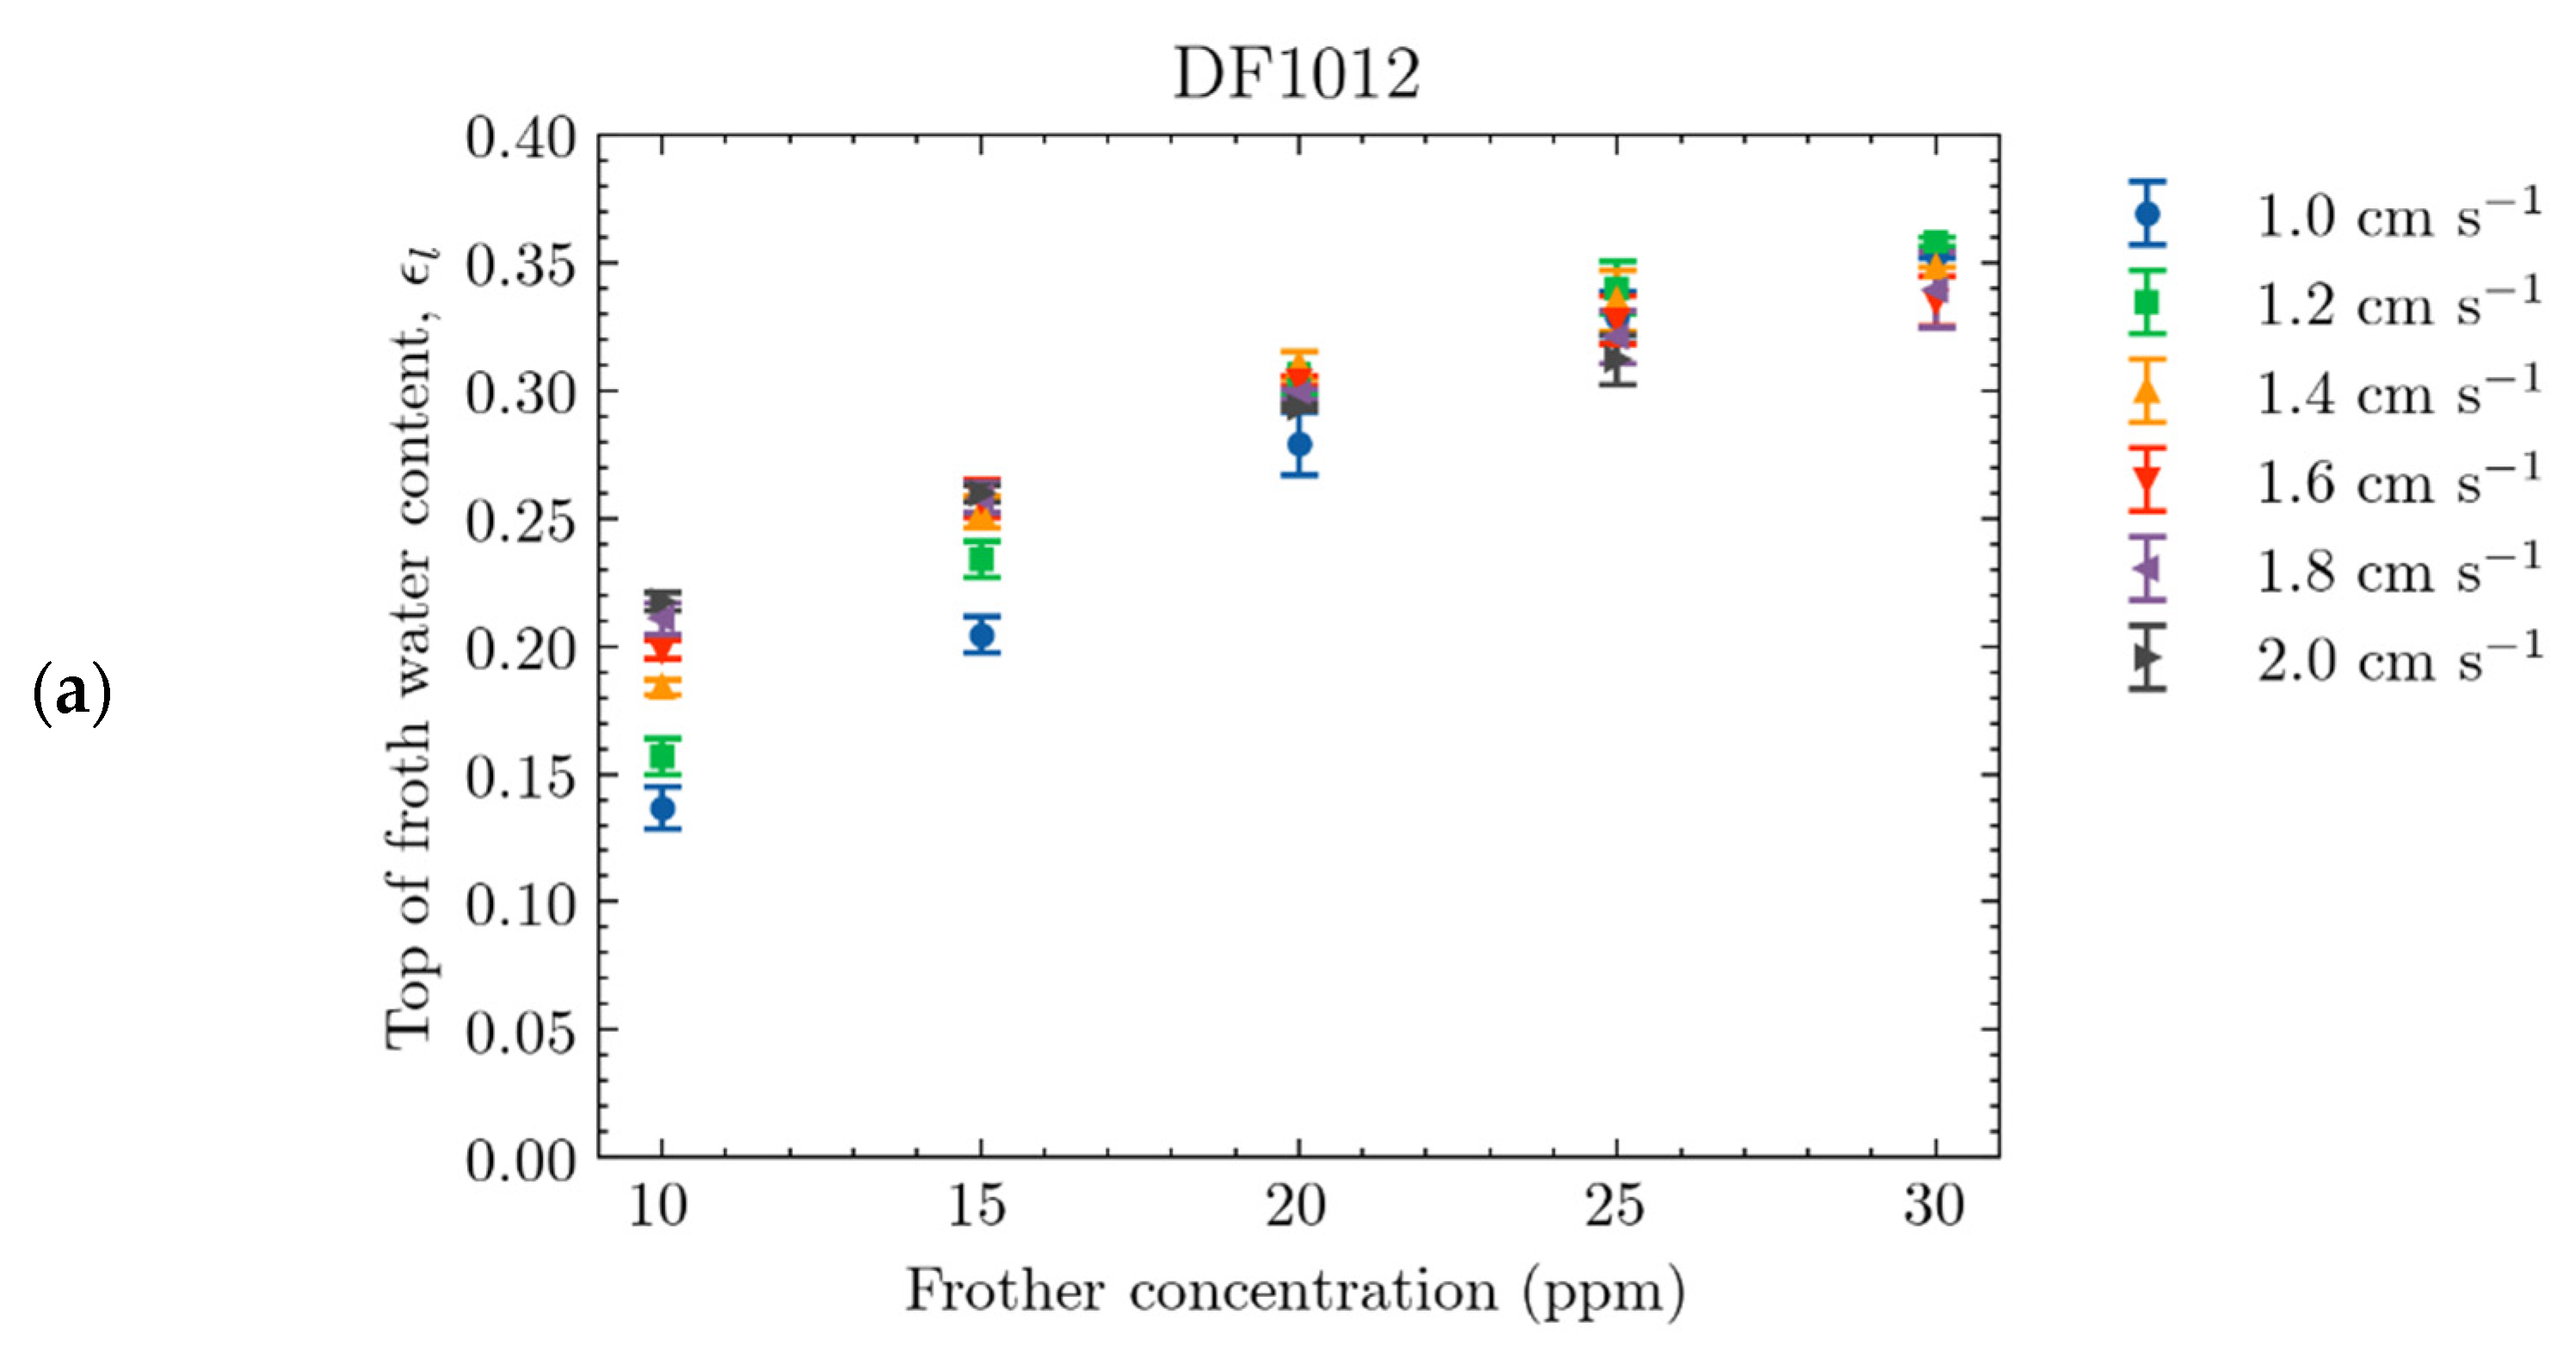
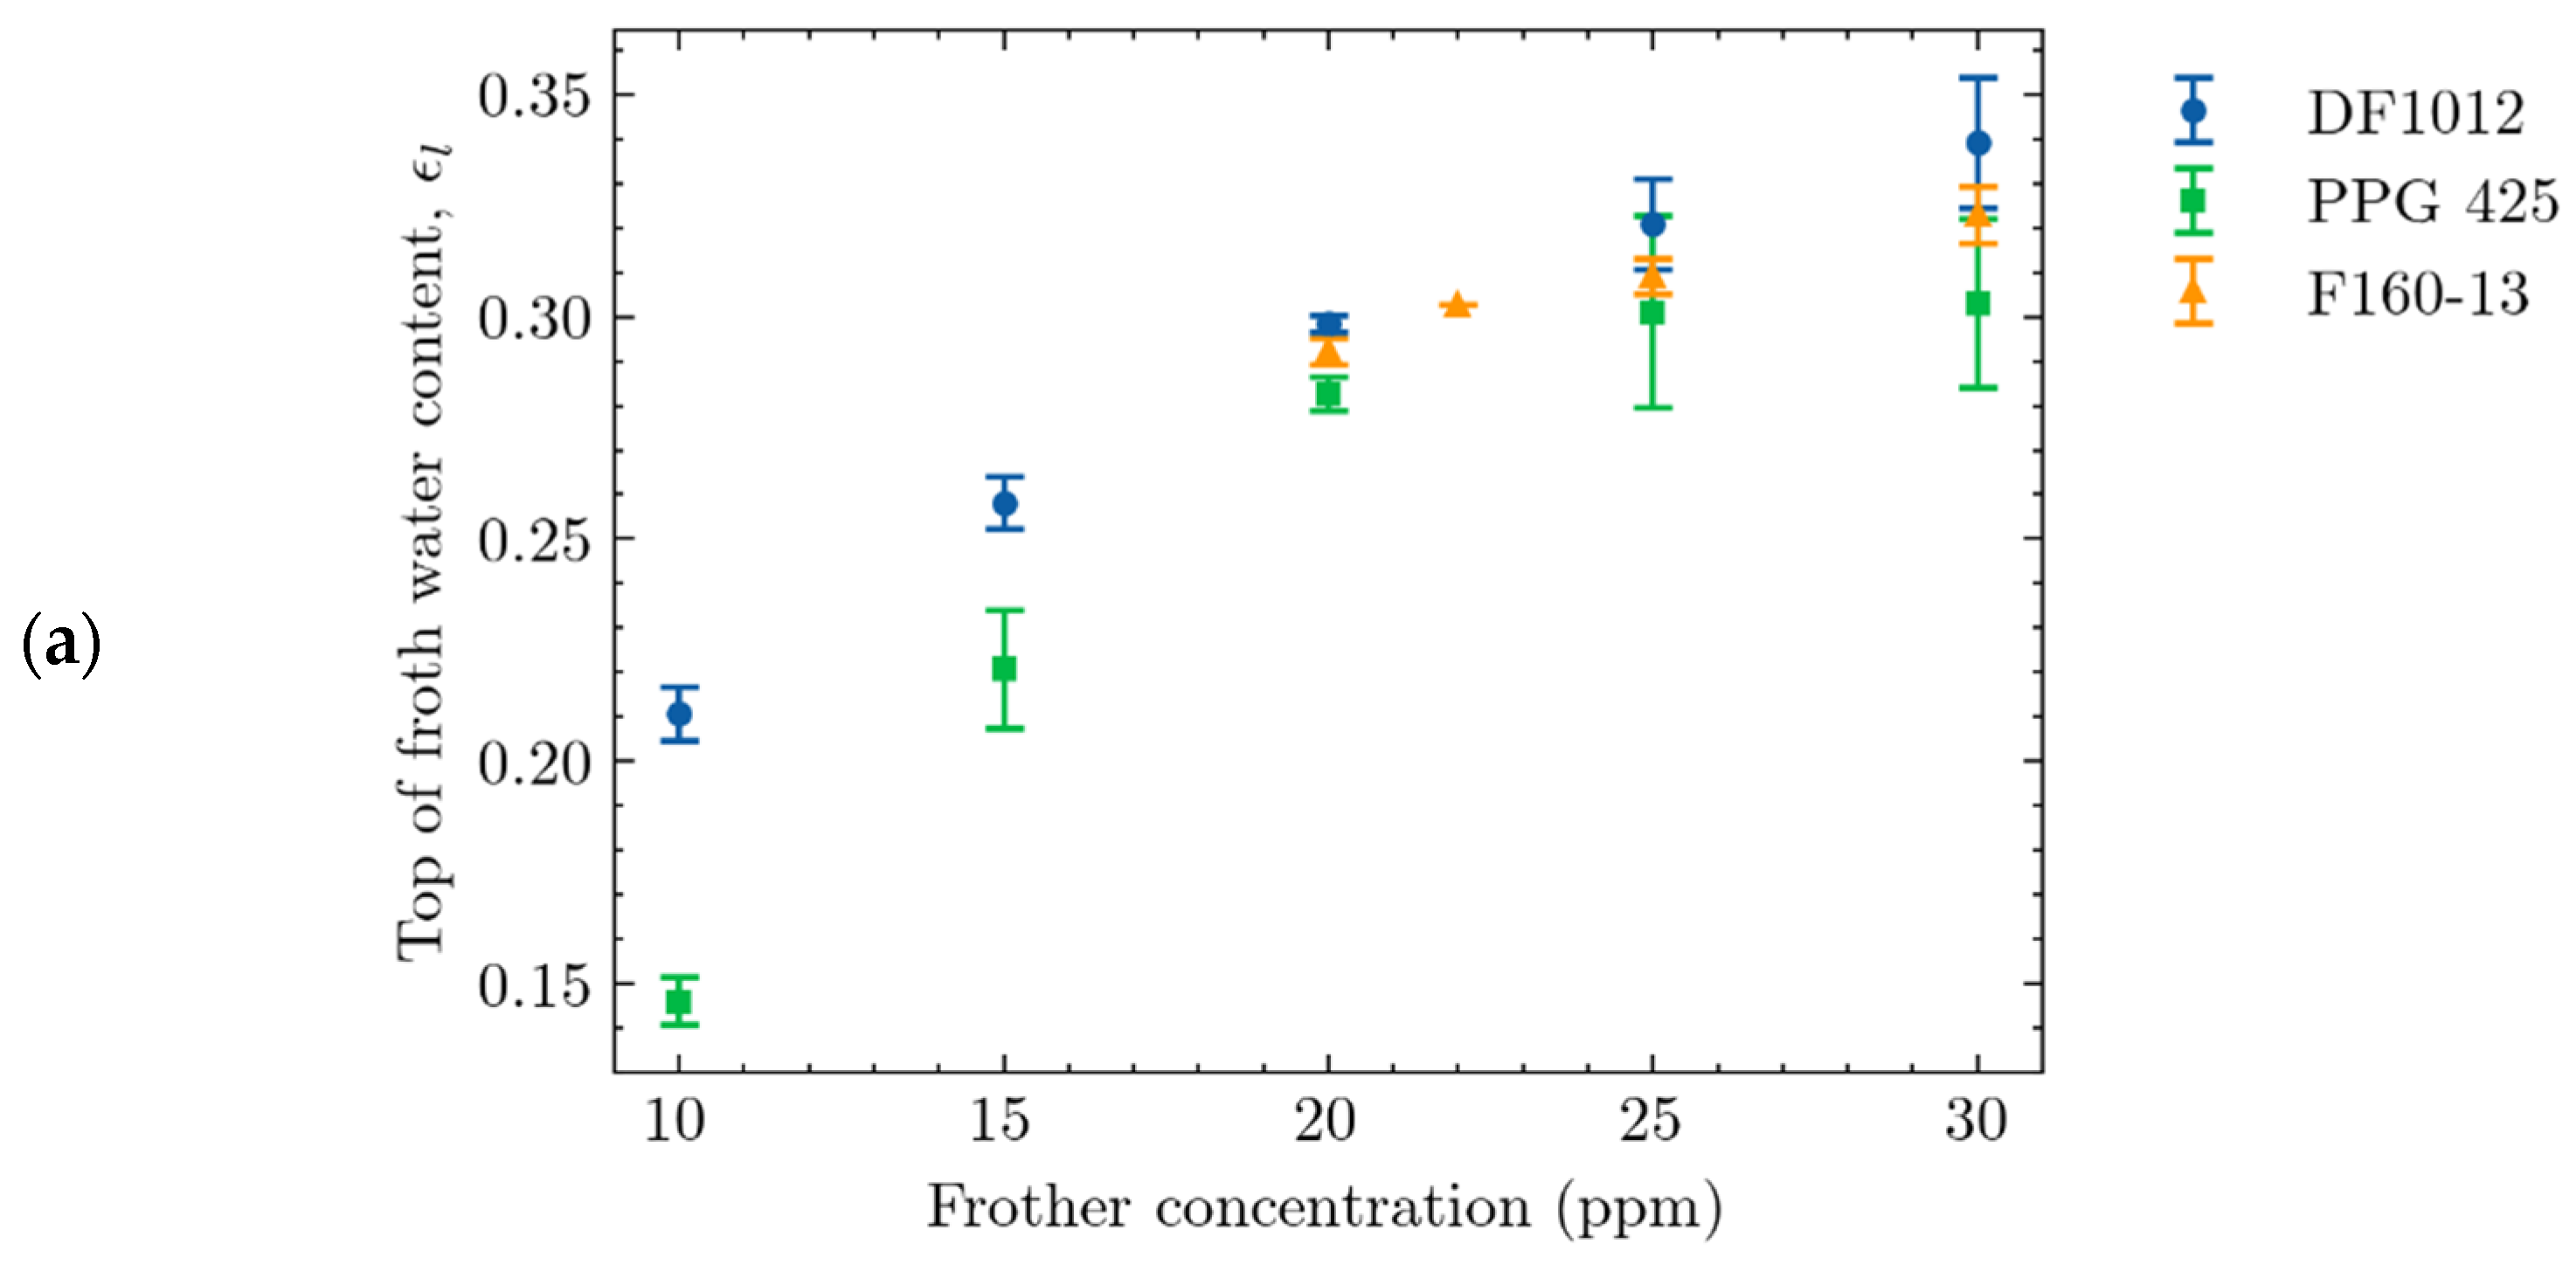
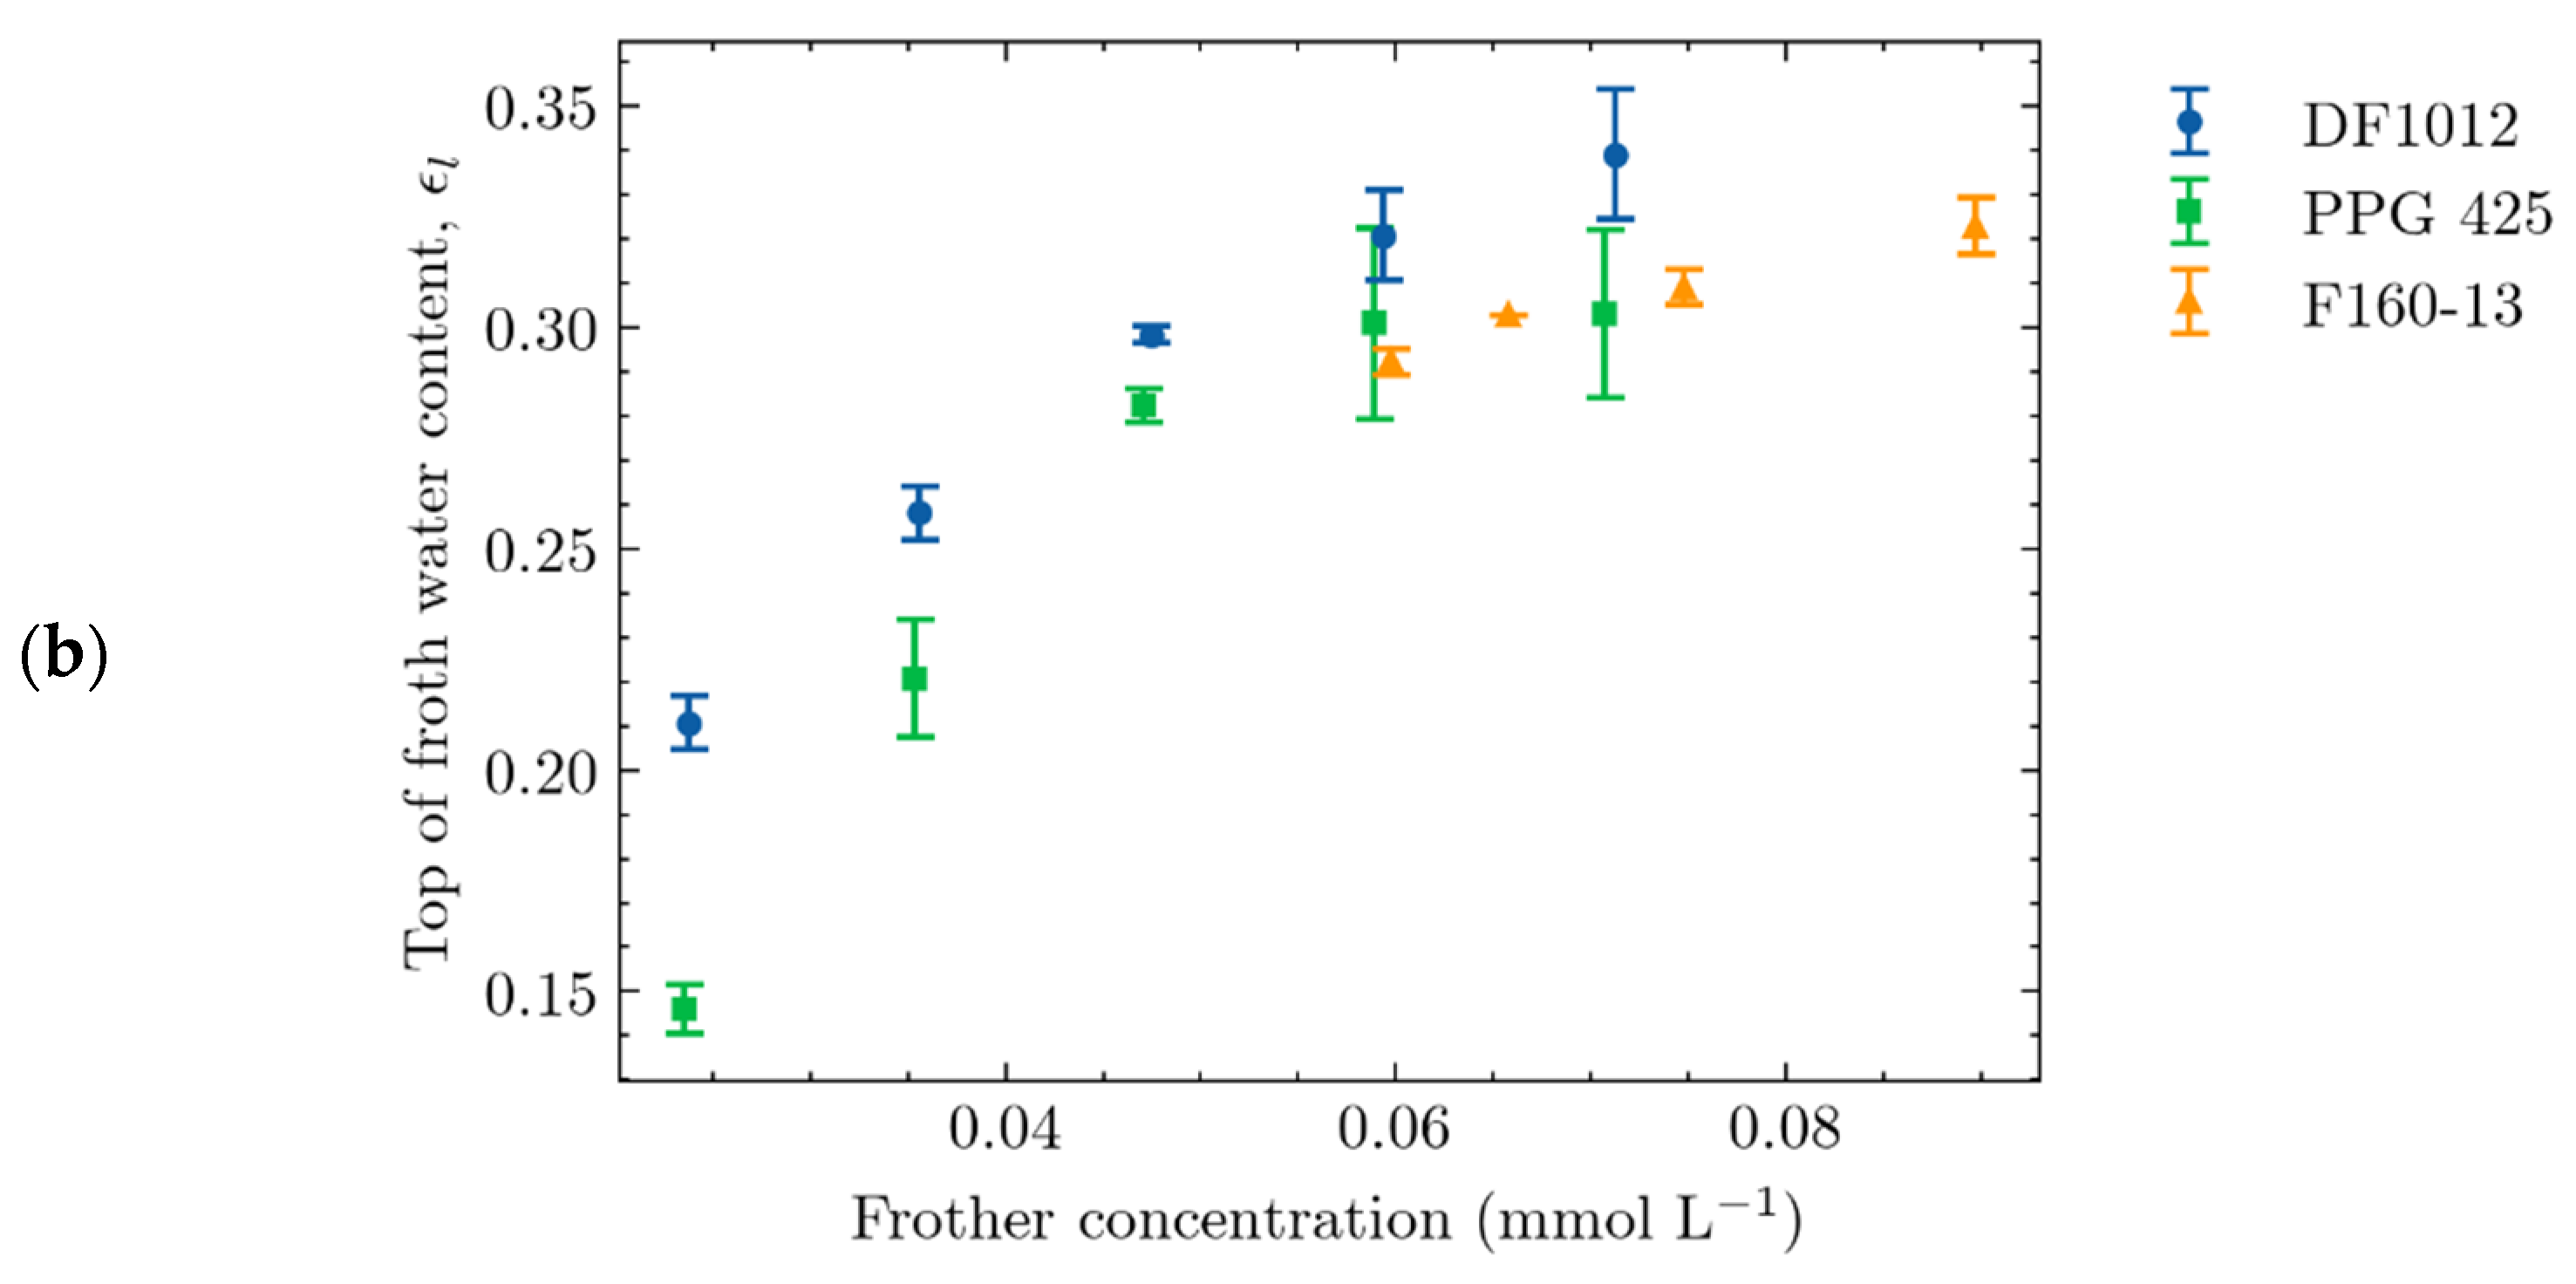
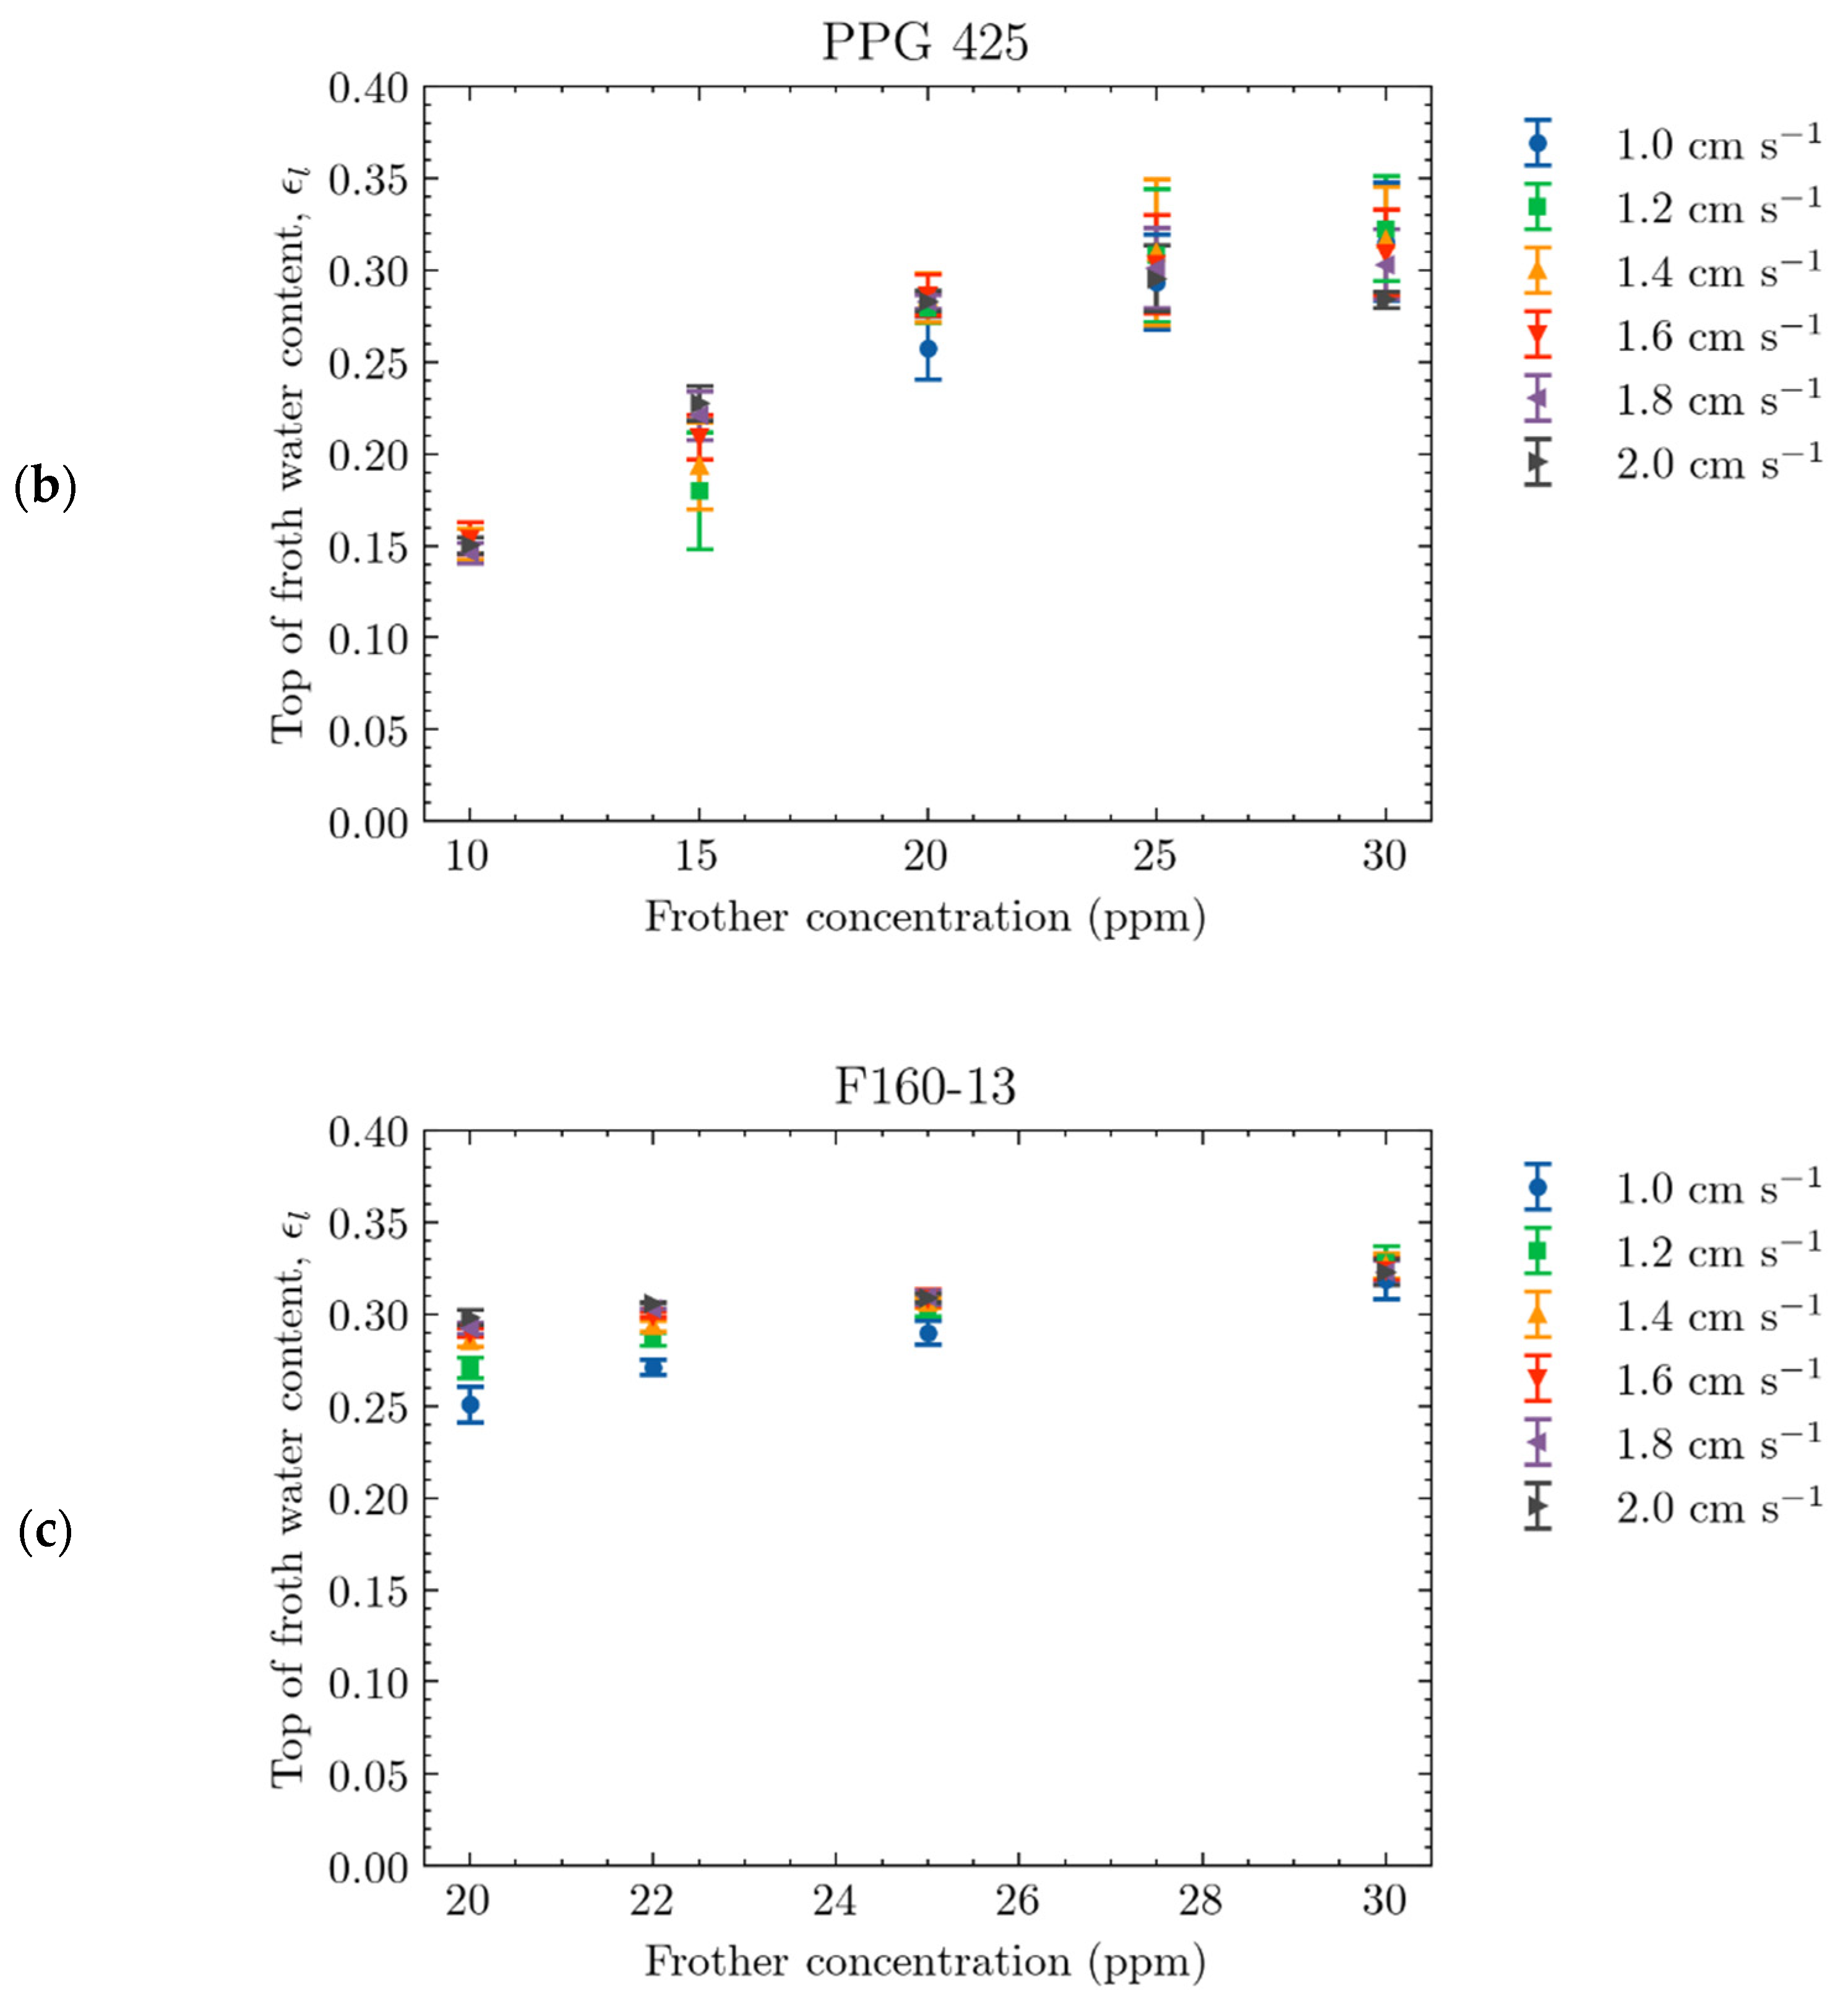
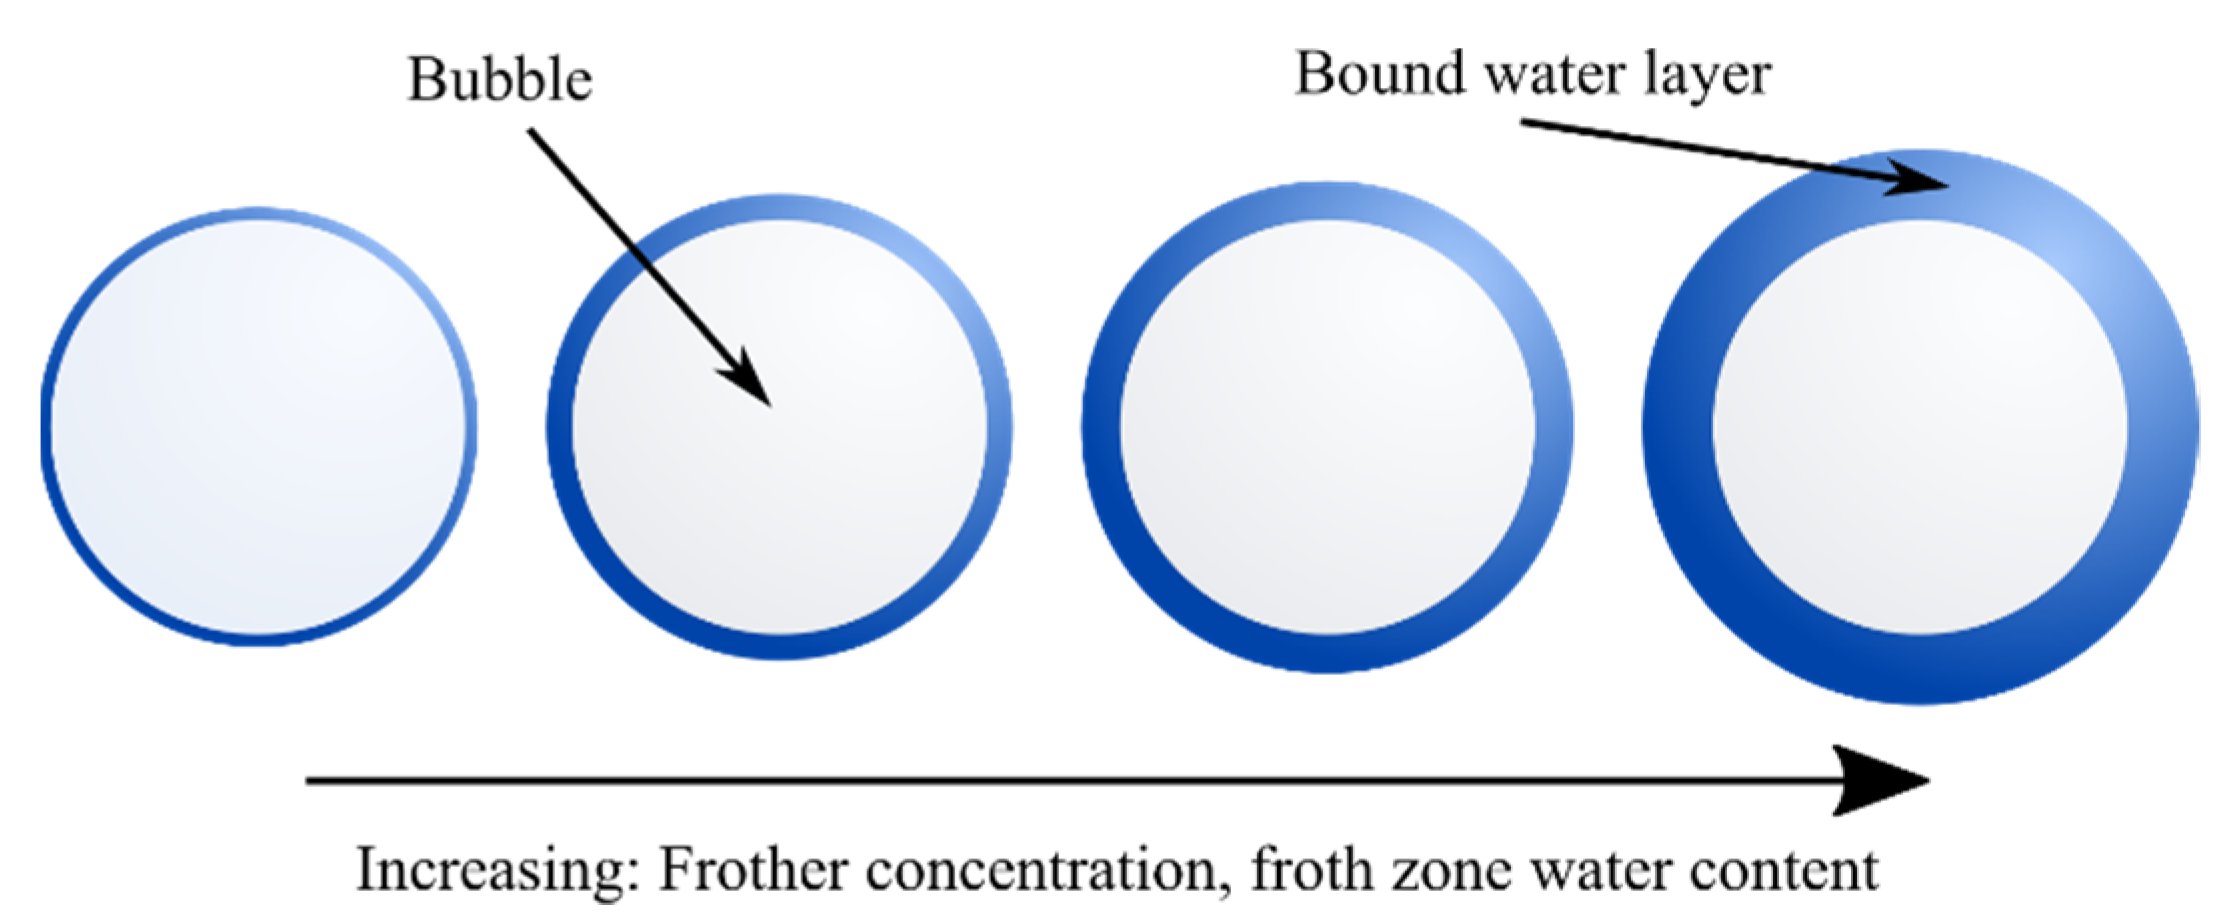
4.2.1. Effect of Frother Concentration

To better visualize the effect of changing the frother concentration on the resulting top-of-froth water content, the frother concentration is plotted as the dependant variable, as shown in Figure 7a–c, for the frothers DF1012, PPG 425 and F160-13, respectively, at various input air rates (1.0 to 2.0 cm s−1).
The effect of frother concentration is shown to be larger than the input air rate. As all the frother concentrations for both frothers were tested above their expected critical coalescence concentration (CCC) values [16], for a given air rate, the bubble size entering the froth zone should remain approximately the same [23,24]. Two mechanisms for the increase in observed top-of-froth water content are proposed.
The first is that the increase in frother concentration decreases the drainage of water. The reduction in drainage due to frother concentration is often attributed to a phenomenon called the Marangoni effect [25,26]. Frothers inherently reduce the surface tension of water [27,28,29], and while the overall effect on surface tension is small, the change drives local surface tensions along bubble surfaces [30]. As drainage occurs, the frother molecules located in the lamellae between bubbles are carried with the water, creating a surface tension gradient on the surface of the bubble (high where the frother molecules were, to low where the frother molecules are). The Marangoni effect resists this, which creates the mass transfer of frother molecules along the surface tension gradient, reducing the amount of drainage occurring. This is visualized in Figure 8.
The effects of frother structure on the bubble surface were also investigated by Tan et al. [31] by measuring the rise velocity of bubbles [32,33]. It was proposed that a larger alkyl chain length would allow for a closer packing of frother molecules, allowing room for more frother molecules to be adsorbed to the bubble surface, and thus a larger Marangoni effect is observed (when comparing similar frother molecules of different alkyl chain lengths) [31,32]. It was also proposed that the number of PO groups in the frother molecule also affects the bound water layer. A larger number of PO groups creates a larger H-bonding force, and thus binds more water to the bubble [31]. The drainage of water results in repeated breaking and forming of the H-bonding with passing water molecules, argued by Tan [34] to increase surface viscosity, which could lead to a decrease in drainage. The structures of DF1012, PPG 425 and F160-13 (summarized in Table 2) could thus provide some insight into the results. The top-of-froth water content is plotted against the frother concentration in Figure 9a,b, for concentration units of ppm and mmol L−1, respectively, for a chosen air rate of 1.8 cm s−1.
DF1012 contains nearly seven PO groups and one alkyl group, PPG 425 contains seven PO groups and no alkyl groups, while F160-13 contains two and a half PO groups and four alkyl groups. A small, but statistically relevant (determined by two-sample Student’s t-test for a significance level of 0.05) difference in top-of-froth water content could be seen between PPG 425 and DF1012 at lower concentrations. According to the mechanism described above, the larger number of alkyl group of DF1012 should result in a larger water content; however, the difference observed was small. While not shown, concentrations below what is presented for F160-13 resulted in an insufficient froth depth, and thus the top-of-froth water content could be considered 0. Therefore, the larger number of PO groups between F160 (2.5) and the other frothers tested indicates that the number of PO groups affects the stability and top-of-froth water content. It is speculated that observing the water contents at lower frother concentrations could reveal further insights, requiring a smaller froth conductivity sensor to be developed.
The second proposed mechanism is that the increase in frother concentration causes a larger bound water layer on the bubbles entering the froth (Figure 10).
Work conducted by Finch et al. [35] and Gelinas et al. [36] measured the bound water layer on bubbles using Fourier transform infrared spectroscopy and found a dependency of the bound water layer on the frother type being used. The bound water layer was attributed to H-bonding forces between the frother molecules situated at the water–air interface and free water molecules. There was no mention of frother concentrations; however, it is expected that with increasing frother concentration, the H-bonding forces would increase and thus increase the bound water layer. While this effect is unlikely to cause the type of change in water contents seen in Figure 7, as the bound water layers seen by Finch et al. [35] were in the order of nanometers, it could still have an effect.

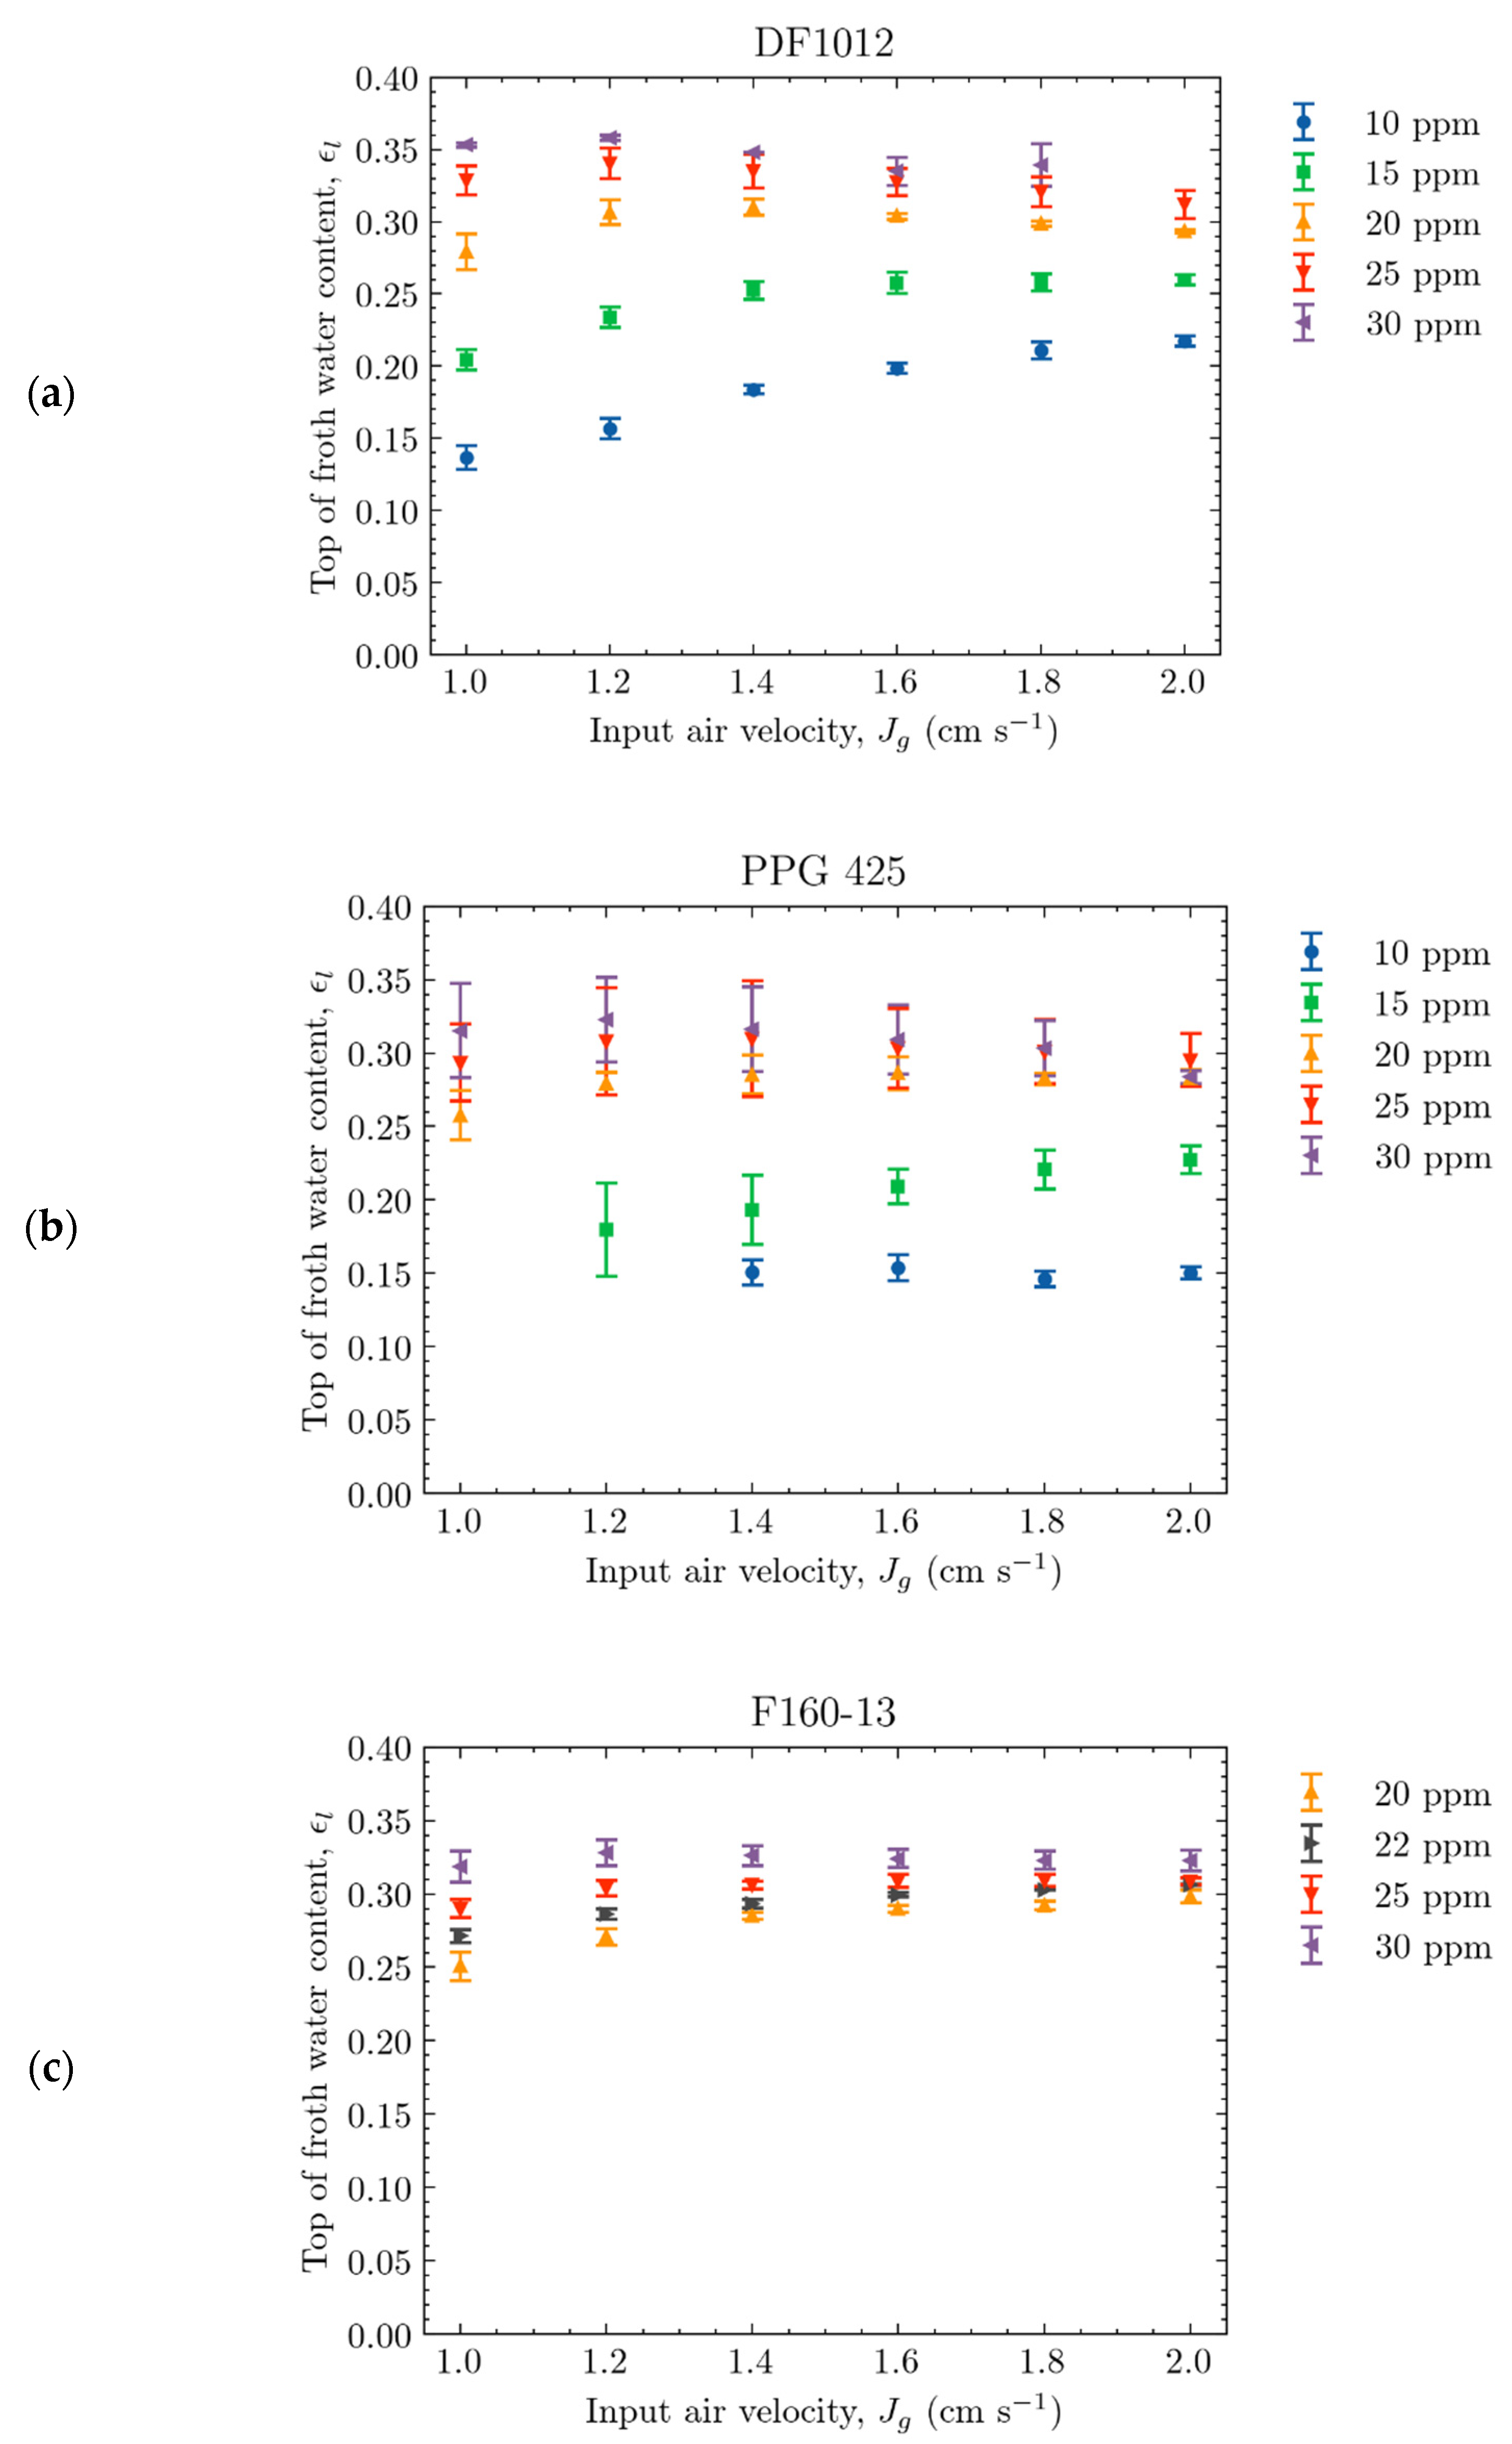
4.2.2. Effect of Input Air Rate

The effect of changing the input air rate, Jg (cm s−1), on the resulting top-of-froth water content is shown in Figure 11a–c for the frothers DF1012, PPG 425 and F160-13, respectively, at various frother concentrations (10 to 30 ppm).
The results show that increasing the air rate does not have a large effect on the measured top-of-froth water content. Two sample Student t-tests at a significance level of 0.05 were performed between the observations at the lowest and highest air rates for each frother and concentration tested. For DF1012 and F160-13, there were statistically significant increases in water content from the minimum to maximum air rate tested for lower frother concentrations (10 and 15 ppm for DF1012 and 20 and 22 ppm for F160-13). A statistically significant increase was shown for PPG 425 at 15 ppm but not at 10 ppm.
Increasing the air rate has several effects on the froth zone. Firstly, an increase in air rate increases the rate of bubbles and their associated water content arriving at the froth zone. The increase in air velocity would result in a decrease in the residence time of a bubble traveling through the froth. The decreased residence time is hypothesized to decrease the drainage and thus should act to increase the top-of-froth water content. However, this is only seen at smaller frother concentrations. To explain this, it is considered that at larger frother concentrations, a larger achievable froth depth can be obtained (quantified by the dynamic froth index [37,38]). The water content in the froth is expected to decrease with froth height due to drainage [39], which has been shown experimentally [40,41]. On a relative froth depth basis, h r , defined in Equation (5), the water content will decrease from some water content value at the collection zone interface, until there is no water (the froth is completely degraded).
h r = h f H m a x
where h f is the operating height of the froth, and H m a x is the maximum achievable froth height. Thus, h r is expected to be closely tied to resulting top-of-froth water content. As the experiments in this study were run at a constant froth depth of 21.6 cm, changes in H m a x caused by changes in operating conditions would affect h r .
It is expected that increasing the air rate (up to a certain point) will increase the achievable froth depth; however, if the change in H m a x as a result of increasing the air rate is relatively small compared to the froth depth achieved as a result of the frother concentration, little change would be seen in the relative froth depth and top-of-froth water content. However, if at small frother concentrations, the change in H m a x due to an increase in air rate has a much larger effect on h r , a larger increase in the top-of-froth water content would be observed.
It should be noted that in three-phase systems, an increase in the input air rate could increase the particle transport from the collection to the froth zone, which could act to further restrict drainage by blocking the interstitial channels through which water would normally drain [42] or destabilize the froth by bridging thin films between bubbles [43].

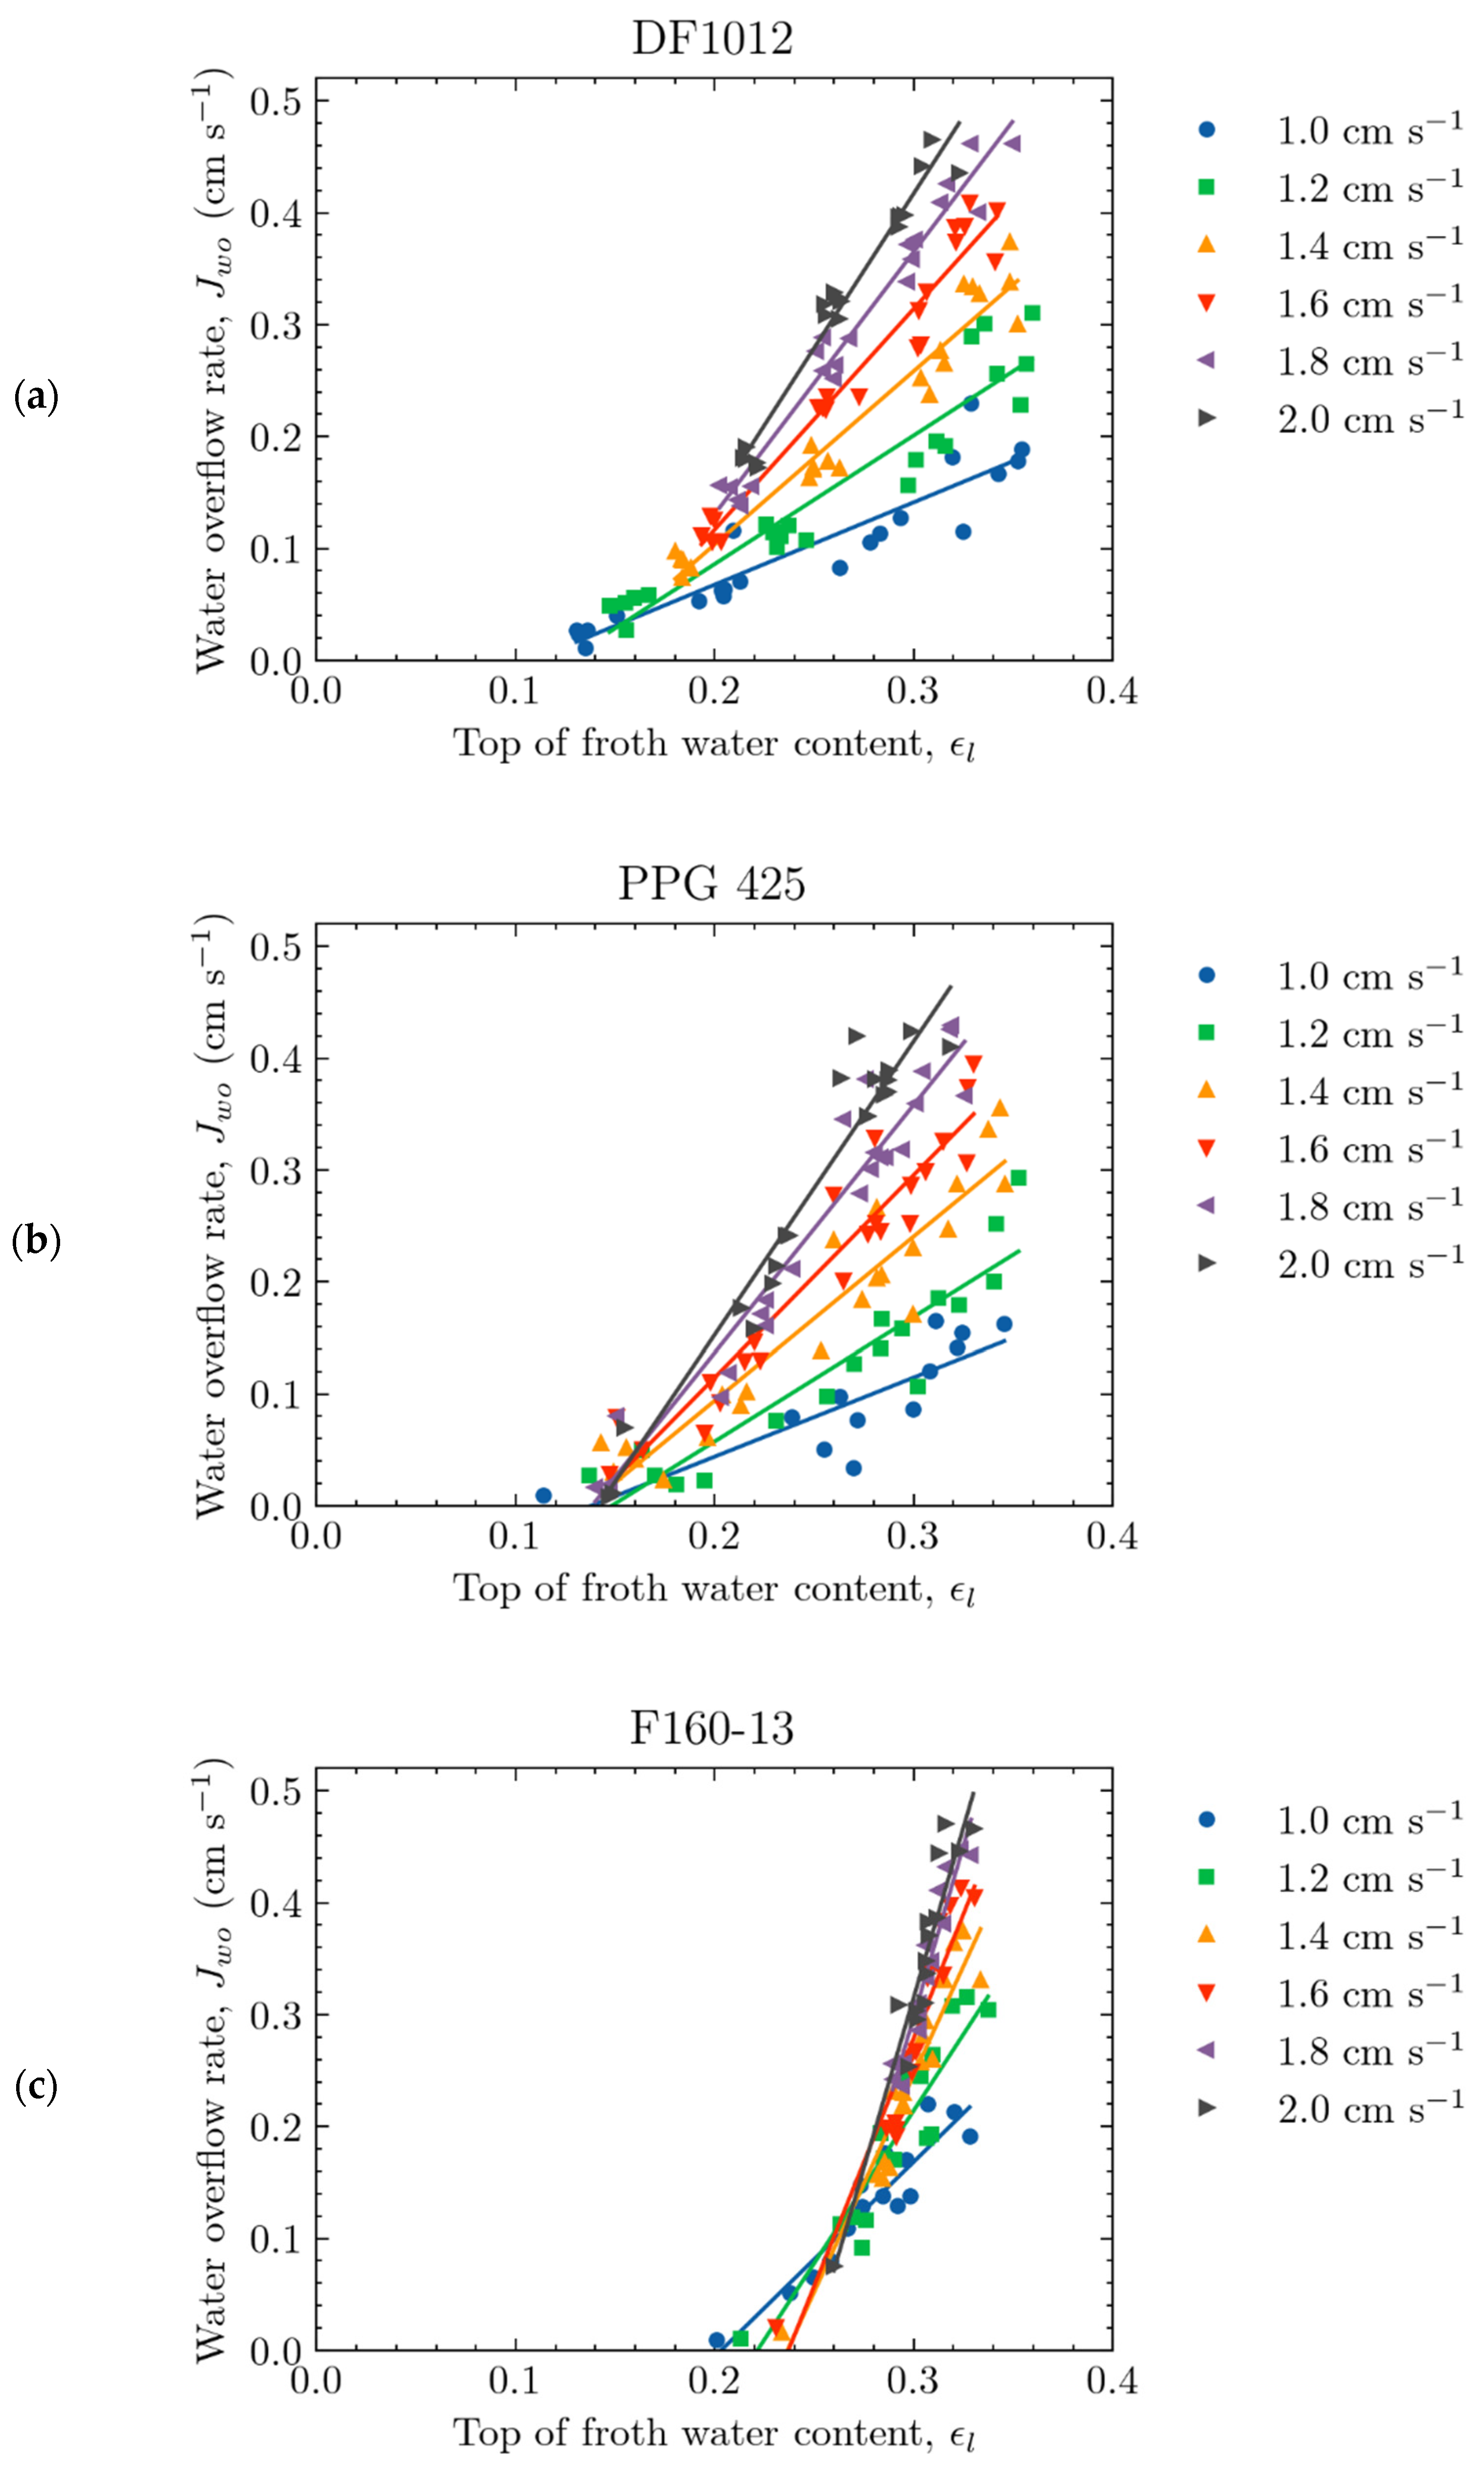
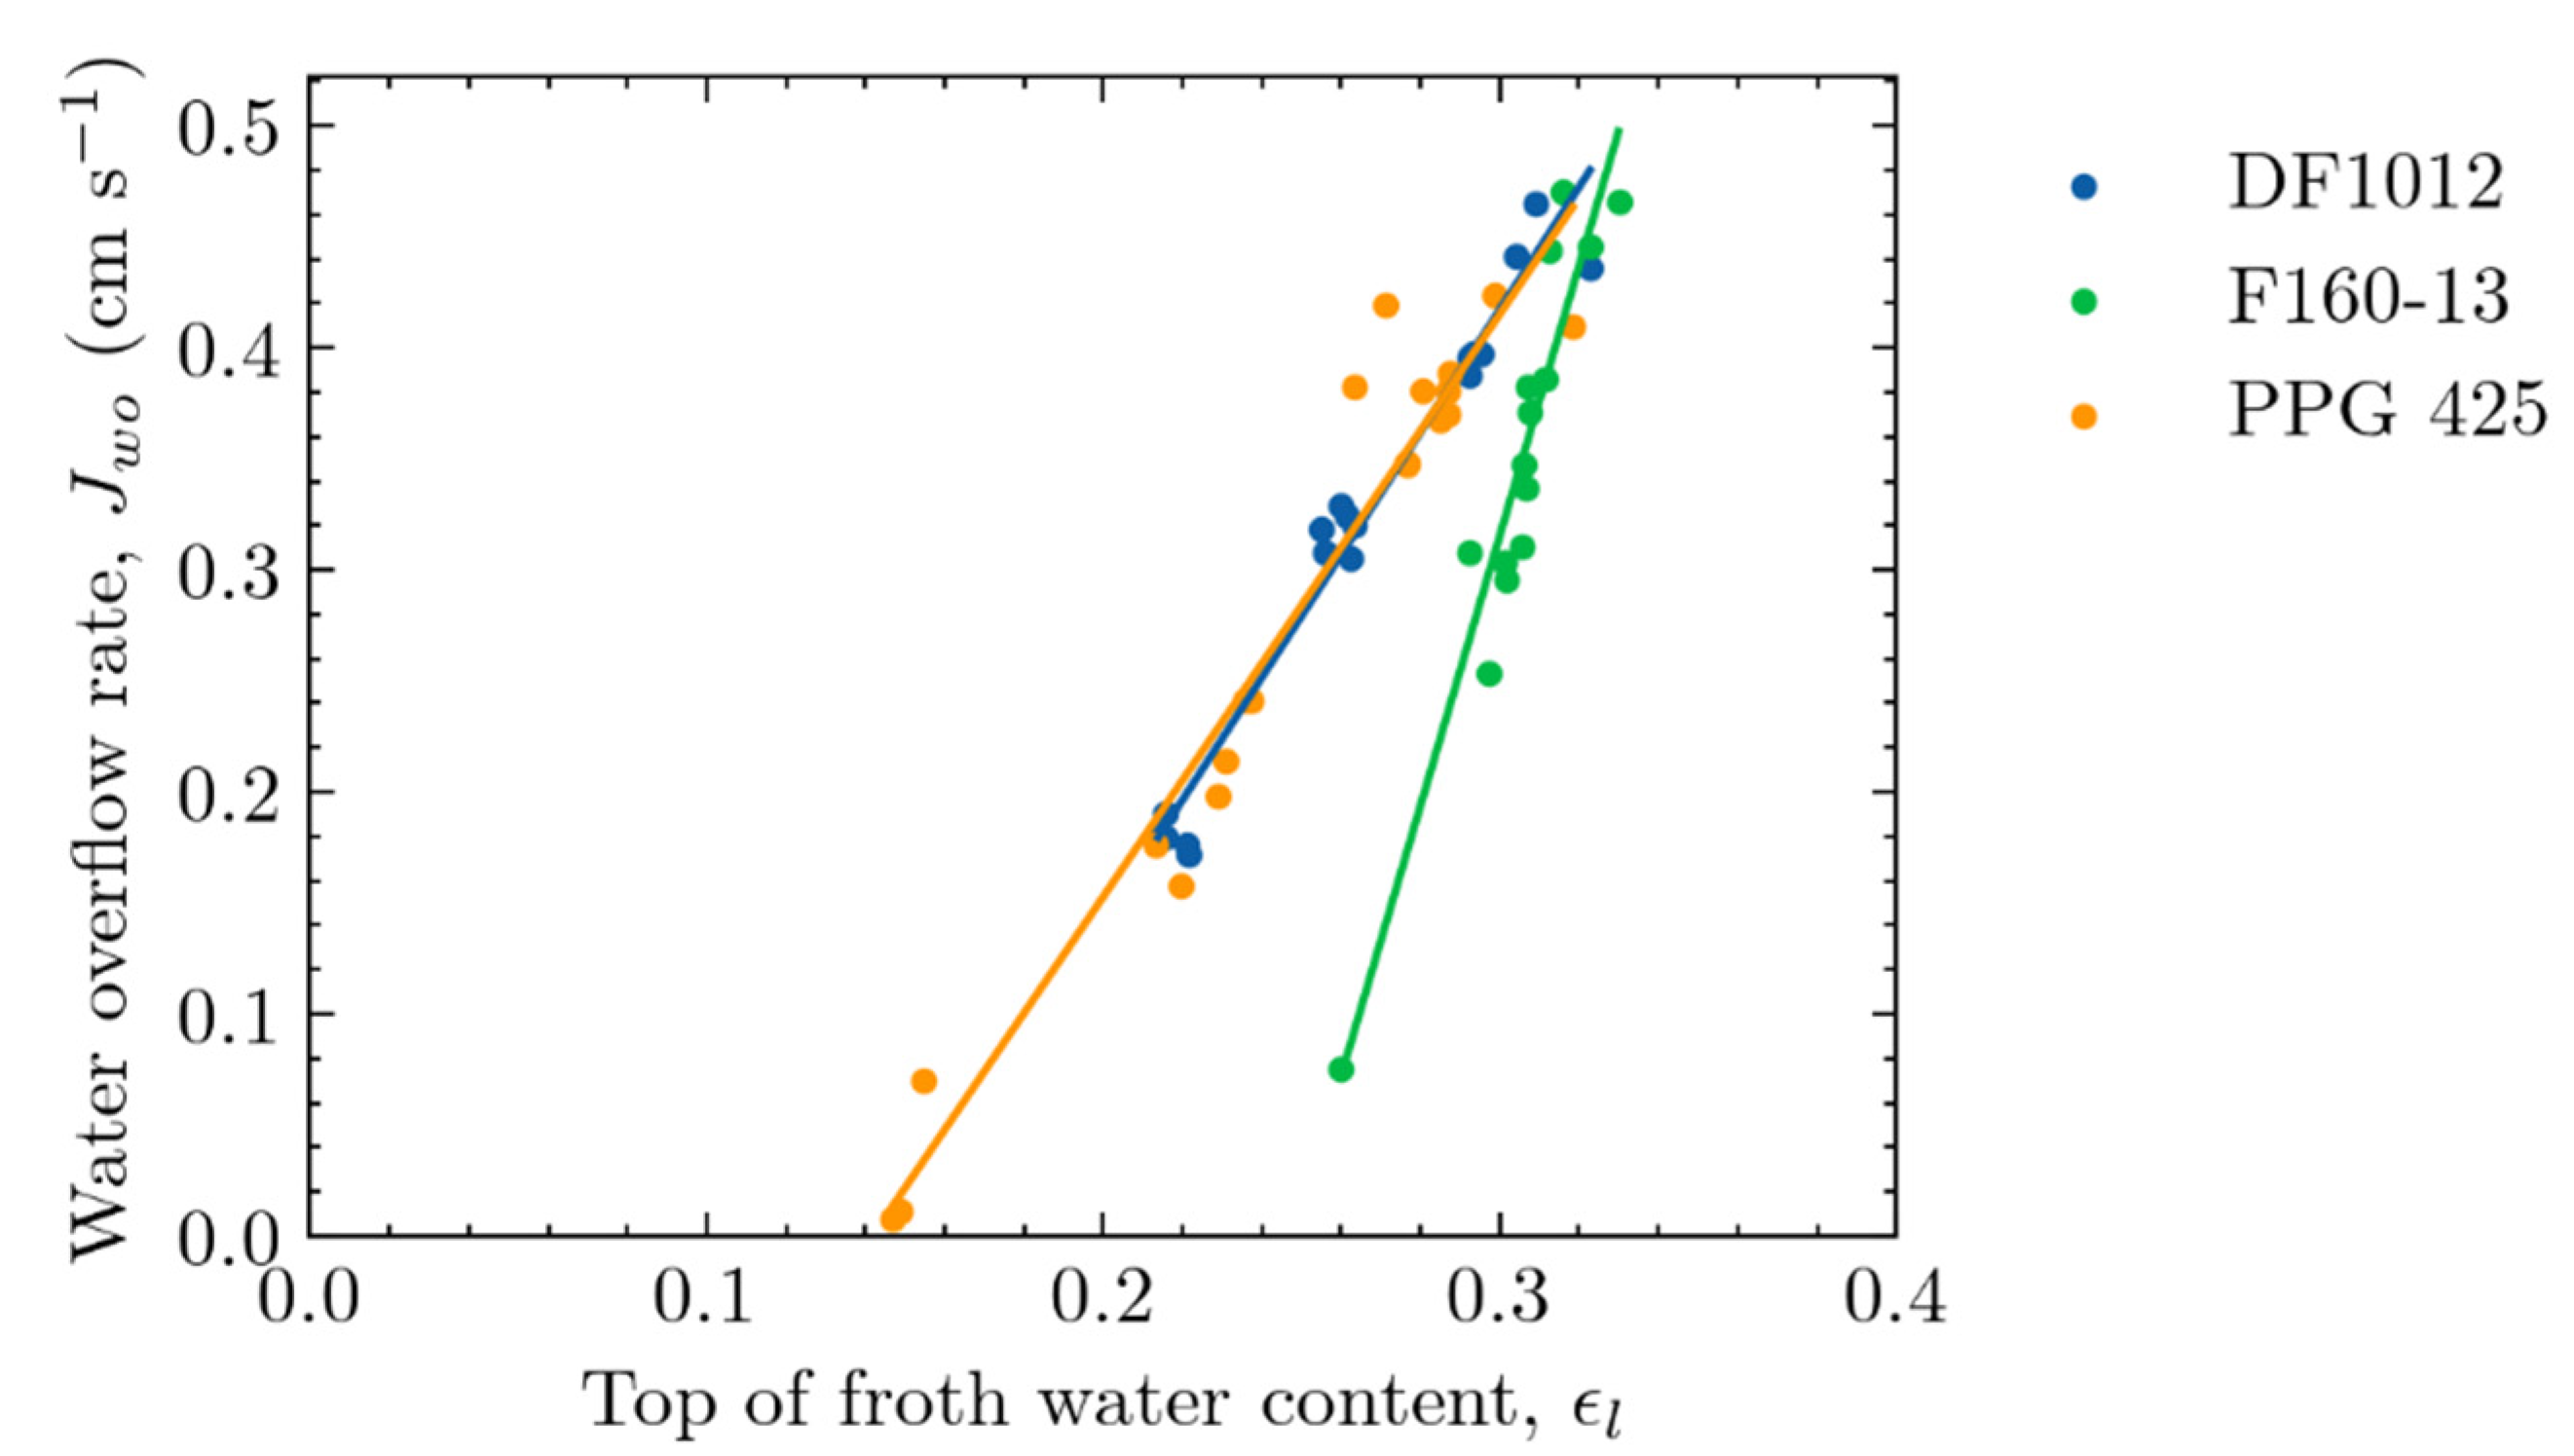
4.3. Relationship between Water Overflow Rate and Top-of-Froth Zone Water Content

The relationship of water overflow to the measured froth zone water content was investigated to evaluate the potential of the froth zone conductivity sensor in determining the water overflow rate of a flotation cell.
The relationship between froth zone water content and the measured water overflow rate are shown in Figure 12a–c for DF1012, PPG 425 and F160-13, respectively. The frother concentrations tested were the same, as shown in Figure 7 and Figure 11.
For a given air rate, there appeared to be a well-defined relationship between the froth zone water content and the superficial water overflow rate, J w o (cm s−1), for all frothers tested. This relationship can be explained phenomenologically by Equations (6) and (7) for the volumetric, Q w o (cm3 s−1), and superficial water overflow rate, respectively.
Q w o = Q f r o t h   ·   ε l
J w o = J f r o t h   ·   ε l
where Q f r o t h (cm3 s−1) and J f r o t h (cm s−1), are the volumetric and superficial flow rates, respectively, of the recovered froth to the concentrate launder. While the conductivity sensor can measure the froth zone water content, it cannot consider the volumetric flow of the froth. As the typical operation of an industrial flotation cell involves a constant input air rate (under steady-state operation), the results show promise in inferring the water overflow rate from froth conductivity measurements. Given a constant air rate, Figure 12 implies that the water overflow rate is proportional to the top-of-froth water content. The R2 values for the trend lines plotted in Figure 12 are summarized in Table 5. This means that for applications in flotation monitoring or diagnosis, an increase or decrease in froth zone water content infers an increase or decrease in the water overflow rate, which can be used to infer flotation performance. For example, the recovery of fine gangue material (through entrainment) has been shown to be related to the water overflow rate [7]. For a rougher flotation bank where high recoveries are typically targeted (instead of a focus on grade), a relatively large water content in the froth should be desired. In a cleaning flotation bank where high concentrate grades are desired, a low water overflow rate would be desired, and thus a lower froth water content should be targeted.
The trends in Figure 12 also follow similar trends to reported flotation hydrodynamic curves, a relationship between collection zone gas holdup and froth height for different frothers [44]. Strong frothers produce a comparatively larger increase in achievable froth height (hypothesized to be equivalent to the water overflow rate) for a given increase in collection zone gas holdup when compared to weaker frothers [44]. Further work is required to further relate the gas holdup in the collection zone to the water that enters the froth zone. Taller sensors would be able to measure this and account for changes in bubble size due to pressure differences.
From Equation (7), two observations are made. The first observation is that as the superficial water overflow rate approaches 0 cm s−1, the top-of-froth water content still exhibits a considerable amount of water (>0.1 for all frothers tested) in Figure 12. This indicates that there is a minimum amount of measured top-of-froth water content required to sustain an overflowing froth. This is attributed to the fact that the design of the sensor creates a volumetric average water content over a height of 7 cm of froth, with the midpoint of the measurement volume located 7.5 cm below the overflow lip. It is expected that the water content will decrease with the height of the froth, meaning that even if the water content at the very top of the froth is very small, the volumetric average of the 7 cm will contribute to the top-of-froth water content measurement.
The second observation is that the relationship of the water overflow rate to top-of-froth water content is different for the different frothers tested. For F160-13, a larger water content is required to produce an overflowing froth when compared with DF1012 and PPG 425. For similar water contents, F160-13 also comparatively produces a smaller water overflow, giving an indication there is a chemistry effect (perhaps frother-structure-related) on the froth stability (and thus froth recovery). This effect is shown in Figure 13 for the input air rate of 2.0 cm s−1.
Looking once again at the structure of the frothers tested, it was hypothesized that an increased number of PO groups in the frother molecule acts to increase the strength of water bounded to bubbles and thus increases the viscosity of the adjacent liquid layer [45], which would act to resist drainage. As the sensor measurement volume is below the overflow lip, if the frothers had significant differences in drainage, this could explain the results in Figure 13. F160-13 had a lower number of PO groups (2.5) compared to DF1012 (6.7) and PPG 425 (7). The lower number of PO groups could result in larger drainage within the froth, which could explain the difference in relationship between F160-13 and DF1012 and PPG 425, and explain the similarities between DF1012 and PPG 425. This chemistry effect could also affect the inherent stability of the froth. If decreased drainage occurs at the overflow lip, this decrease in drainage could act to stabilize the froth, allowing more to be recovered with a smaller water content.

4.4. Practical Implications

The results in this study show that the water content in the froth zone is heavily dependent on the frother concentration, and to some extent, the type of frother used and the air input to the flotation system. From this, it is shown that the frother concentration has a large effect on the froth zone at concentrations beyond the CCC concentration usually targeted by industrial operations.
In terms of the selection of frother, this study has shown that the frother type influences the froth stability, beyond simply binding water to bubbles. This has consequences in that for the same water overflow rate, a drier (implying less entrained gangue) froth can be recovered based on the selection of frother, which would indicate a higher froth recovery and increased recovery for the same amount of entrained gangue material (indicated by the water overflow).
The conductivity sensor developed in this study allows the measurement of the froth zone water content in real time, which can be used to monitor the froth zone in a flotation process. At a constant input air rate, the water content was shown to be proportional to the water overflow rate. Measuring the froth zone water content in real-time has potential in monitoring froth stability. Bubbles with low mineral loading tend to be less stable, which can result in large froth bubbles (and low water content), or the absence of a froth zone [46].
For the application to three-phase systems, work has been performed showing the technique is applicable for determining the gas phase concentration in the collection zone of industrial flotation machines by considering the liquid and mineral (solid) phase as a single conductive phase (with a specific conductivity less than that of the liquid) [9,47,48]. The solid–liquid phase conductivity measurement (analogous to κ l i q u i d in Equation (1)) is measured in situ in industrial flotation machines by a so-called syphon cell which eliminates the presence of gas from the collection zone [10]. Measurement of this solid–liquid conductivity in the froth zone would be more challenging, and an error would be introduced if it were measured in the collection zone; the error would be dependent on the concentration or dilution of mineral in the solid–liquid phase in the froth zone. In any case, trends collected along a line of industrial flotation cells, for example, would be a crucial piece of information, despite potential error, in deciding further courses of action. Further investigation is recommended.

5. Conclusions

An in-situ conductivity sensor was developed and used to measure the froth zone water content in a laboratory flotation column under a variety of operating conditions. The relationship of water content to relative conductivity was verified to be represented by the model proposed by Feitosa et al. [14]. The froth zone water content was shown to be affected primarily by the frother type and frother concentration; however, the input air rate had an influence at lower frother concentrations. Measured top-of-froth water contents ranged from approximately 0.10 to 0.35 (volume fraction). Below this range, no measurable water overflow was produced.
There was shown to be a proportional relationship between the water overflow rate and the measured froth zone water content, which shows promise in applying the sensor for monitoring industrial flotation processes (by inferring water overflow rate).
For the three frothers tested (DF1012, F160-13 and PPG 425), there was shown to be an influence of the frother type on the relationship of water overflow rate and froth zone water content, indicating a chemistry effect of the frother type on the inherent stability of froth; however, more investigation is required. This indicates that the selection of frother can yield both a stronger (in the sense of froth stability) and drier froth, as seen among DF1012, PPG 425 and F160-13. This demonstrates the importance of characterizing frothers effects on the froth zone.
Recommendations for future work include investigation in three-phase systems (air–liquid–mineral) to attempt to correlate mineral recovery through entrainment with froth conductivity measurements, and how the addition of wash water will affect the technique.

Author Contributions

Data curation, M.R.L.; Formal analysis, M.R.L.; Funding acquisition, K.E.W., Investigation, M.R.L.; Methodology, M.R.L., C.O.G. and K.E.W.; Supervision, K.E.W. and C.O.G.; Writing—original draft, M.R.L.; Writing—review and editing, M.R.L., K.E.W. and C.O.G. All authors have read and agreed to the published version of the manuscript.

Funding

The authors would like to acknowledge the Natural Sciences and Engineering Research Council of Canada (NSERC) and Flottec for funding this work through the Collaborative Research and Development (CRD) program (CRDPJ 530810-18). M. R. Lepage would also like to acknowledge funding from the McGill Engineering Doctoral Award (MEDA).

Data Availability Statement

Please contact authors to request raw data.

Conflicts of Interest

The authors declare no conflict of interest.

References

  1. Crosbie, R.; Runge, K.; McMaster, J.; Rivett, T.; Peaker, R. The impact of the froth zone on metallurgical performance in a 3m3 RCS flotation cell. In Proceedings of the Flotation 09′, Cape Town, South Africa, 9–12 November 2009. [Google Scholar]
  2. Massinaei, M.; Kohaldoozan, M.; Noaparast, M.; Oliazadeh, M.; Yianatos, J.; Shamsadini, R.; Yarahmadi, M. Froth zone characterization of an industrial flotation column in rougher circuit. Miner. Eng. 2009, 22, 272–278. [Google Scholar] [CrossRef]
  3. Laskowski, J.S. Frothers and Frothing. In Frothing in Flotation II; Gordon and Breach Science Publishers: Amsterdam, The Netherlands, 1998; pp. 1–50. [Google Scholar]
  4. Savassi, O.N.; Alexander, D.J.; Franzidis, J.P.; Manlapig, E.V. An empirical model for entrainment in industrial flotation plants. Miner. Eng. 1998, 11, 243–256. [Google Scholar]
  5. Neethling, S.J.; Cilliers, J.J. The entrainment factor in froth flotation: Model for particle size and other operating parameter effects. Int. J. Miner. Process. 2009, 93, 141–148. [Google Scholar]
  6. Ross, V.E. Mechanisms Operating Flotation Froths. In Froth in Flotation II; Gordon and Breach Science Publishers: Amsterdam, The Netherlands, 1998; pp. 109–144. [Google Scholar]
  7. Trahar, W.J. A rational interpretation of the role of particle size in flotation. Int. J. Miner. Process. 1981, 8, 289–327. [Google Scholar] [CrossRef]
  8. Maxwell, J.C. A Treatise of Electricity and Magnetism; Oxford University Press: London, UK, 1892. [Google Scholar]
  9. Cortes-Lopez, F. Design of a Gas Holdup Sensor for Flotation Diagnosis. Masters’s Thesis, McGill University, Montreal, QC, Canada, 1998. [Google Scholar]
  10. Gomez, C.O.; Finch, J.A. Gas dispersion measurements in flotation cells. Int. J. Miner. Process. 2007, 84, 51–58. [Google Scholar] [CrossRef]
  11. Maldonado, M.; Pinto, A.; Magne, L.; Gomez, C.O.; Finch, J.A. Gas holdup estimation using Maxwell equation in flotation systems: Revisited. Miner. Eng. 2016, 98, 9–13. [Google Scholar] [CrossRef]
  12. Moyo, P.; Gomez, C.O.; Finch, J.A. Characterizing Frothers using Water Carrying Rate. Can. Metall. Q. 2007, 46, 215–220. [Google Scholar] [CrossRef]
  13. Banisi, S.; Finch, J.A.; Laplante, A.R. Electrical Conductivity of Dispersions: A Review. Miner. Eng. 1993, 6, 369–385. [Google Scholar] [CrossRef]
  14. Feitosa, K.; Marze, S.; Saint-Jalmes, A.; Durian, D.J. Electrical conductivity of dispersions: From dry foams to dilute suspensions. J. Phys. Condens. Matter 2005, 17, 6301. [Google Scholar] [CrossRef]
  15. Tavera, F.J. Flow Cells to Measure Electrical Conductivity: Use in Estimating Gas Holdup in Flotation Systems. Ph.D. Thesis, Department of Mining and Metallurgical Engineering, McGill University, Montreal, QC, Canada, 1996. [Google Scholar]
  16. Zhang, W.; Nesset, J.; Rao, R.; Finch, J. Characterizing Frothers through Critical Coalescence Concentration (CCC)95-Hydrophile-Lipophile Balance (HLB) Relationship. Minerals 2012, 2, 208–227. [Google Scholar] [CrossRef] [Green Version]
  17. CAN/CGSB-3.3-2019; Kerosene. Government of Canada: Gatineau, QC, Canada, 2019.
  18. Cameron, N.R.; Sherrington, D.C. High internal phase emulsions (HIPEs)—Structure, properties and use in polymer preparation. In Biopolymers Liquid Crystalline Polymers Phase Emulsion; Springer: Berlin/Heidelberg, Germany, 1996; pp. 163–214. [Google Scholar]
  19. Lemlich, R. Semitheoretical Equation To Relate Conductivity to Volumetric Foam Density. Ind. Eng. Chem. Process Des. Dev. 1985, 24, 686–687. [Google Scholar] [CrossRef]
  20. Yianatos, J.B.; Laplante, A.R.; Finch, J.A. Estimation of local holdup in the bubbling and froth zones of a gas—Liquid column. Chem. Eng. Sci. 1985, 40, 1965–1968. [Google Scholar] [CrossRef]
  21. Hollenbach, R.; Oeppling, S.; Delavault, A.; Völp, A.R.; Willenbacher, N.; Rudat, J.; Ochsenreither, K.; Syldatk, C. Comparative study on interfacial and foaming properties of glycolipids in relation to the gas applied for foam generation. RSC Adv. 2021, 11, 34235–34244. [Google Scholar] [CrossRef]
  22. Völp, A.R.; Kagerbauer, L.; Engmann, J.; Gunes, D.Z.; Gehin-Delval, C.; Willenbacher, N. In-situ rheological and structural characterization of milk foams in a commercial foaming device. J. Food Eng. 2021, 290, 110150. [Google Scholar] [CrossRef]
  23. Cho, Y.S.; Laskowski, J.S. Effect of floation frothers on bubble size and foam stability. Int. J. Miner. Process. 2002, 64, 69–80. [Google Scholar] [CrossRef] [Green Version]
  24. Elmahdy, A.M.; Finch, J.A. Effect of frother blends on hydrodynamic properties. Int. J. Miner. Process. 2013, 123, 60–63. [Google Scholar] [CrossRef]
  25. Subrahmanyam, T.V.; Forssberg, E. Froth stability, particle entrainment and drainage in flotation—A review. Int. J. Miner. Process. 1988, 23, 33–53. [Google Scholar] [CrossRef]
  26. Tan, S.N.; Fornasiero, D.; Sedev, R.; Ralston, J. The interfacial conformation of polypropylene glycols and foam behaviour. Colloids Surf. A: Physicochem. Eng. Asp. 2004, 250, 307–315. [Google Scholar] [CrossRef]
  27. Harvey, P.A.; Nguyen, A.V.; Jameson, G.J.; Evans, G.M. Influence of sodium dodecyl sulphate and Dowfroth frothers on froth stability. Miner. Eng. 2005, 18, 311–315. [Google Scholar] [CrossRef]
  28. Drzymala, J.; Kowalczuk, P.B. Classification of Flotation Frothers. Minerals 2018, 8, 53. [Google Scholar] [CrossRef] [Green Version]
  29. Laskowski, J. Testing flotation frothers. 2004 SME Annu. Meet. Prepr. 2004, 38, 13–22. [Google Scholar]
  30. Finch, J.A.; Nesset, J.E.; Acuña, C. Role of frother on bubble production and behaviour in flotation. Miner. Eng. 2008, 21, 949–957. [Google Scholar] [CrossRef]
  31. Tan, Y.H.; Zhang, W.; Finch, J.A. Frother structure-property relationship: Effect of polypropylene glycol alkyl ethers on bubble rise velocity. In Proceedings of the XXVIII International Mineral Processing Congress Proceedings, Quebec City, QC, Canada, 11–15 September 2016. [Google Scholar]
  32. Tan, Y.H.; Finch, J.A. Frother structure-property relationship: Effect of alkyl chain length in alcohols and polyglycol ethers on bubble rise velocity. Miner. Eng. 2016, 95, 14–20. [Google Scholar] [CrossRef]
  33. Tan, Y.H.; Zhang, W.; Finch, J.A. Frother structure-property relationship: Effect of polyethylene glycols on bubble rise velocity. Miner. Eng. 2018, 116, 56–61. [Google Scholar] [CrossRef]
  34. Tan, Y. Structure Effect of Alchohols and Polyglycols on Bubble Rise Velocity. Ph.D. Thesis, McGill University, Montréal, QC, Canda, 2013. [Google Scholar]
  35. Finch, J.A.; Gelinas, S.; Moyo, P. Frother-related research at McGill University. Miner. Eng. 2006, 19, 726–733. [Google Scholar] [CrossRef]
  36. Gelinas, S.; Finch, J.A.; Gouet-Kaplan, M. Comparative real-time characterization of frother bubble thin films. J. Colloid Interface Sci. 2005, 291, 187–191. [Google Scholar] [CrossRef] [PubMed]
  37. Gupta, A.K.; Banerjee, P.K.; Mishra, A. Effect of Frothers on Foamability, Foam Stability, and Bubble Size. Coal Prep. 2007, 27, 107–125. [Google Scholar] [CrossRef]
  38. Hadler, K.; Cilliers, J.J. The Effect of Particles on Surface Tension and Flotation Froth Stability. Min. Metall. Explor. 2019, 36, 63–69. [Google Scholar] [CrossRef] [Green Version]
  39. Hutzler, S.; Cox, S.J.; Wang, G. Foam drainage in two dimensions. Colloids Surf. A Physicochem. Eng. Asp. 2005, 263, 178–183. [Google Scholar] [CrossRef]
  40. Lepage, M.R.; Visconti, L.; Liboiron-Ladouceur, O.; Waters, K.E. Vertical water content profiles of two-phase flotation froths measured through conductivity. Miner. Eng. 2020, 154, 106399. [Google Scholar] [CrossRef]
  41. Malysa, K. Water contents in froths obtained from solutions of α-terpineol, n-pentatnol and n-octanol. Int. J. Miner. Process. 1993, 40, 69–81. [Google Scholar] [CrossRef]
  42. Wills, B.A.; Finch, J.A. Chapter 12—Froth Flotation. In Wills’ Mineral Processing Technology, 8th ed.; Wills, B.A., Finch, J.A., Eds.; Butterworth-Heinemann: Boston, MA, USA, 2016; pp. 265–380. [Google Scholar] [CrossRef]
  43. Farrokhpay, S. The significance of froth stability in mineral flotation—A review. Adv. Colloid Interface Sci. 2011, 166, 1–7. [Google Scholar] [CrossRef] [PubMed]
  44. Cappuccitti, F.; Nesset, J.E. Frother and collector effects on flotation cell hydrodynamics and their implications on circuit performance. In Proceedings of the 48th Conference of Metallurgists, Sudbury, ON, Canada, 23–26 August 2009. [Google Scholar]
  45. Tan, Y.; Finch, J. Frothers and gas dispersion: A review of the structure-property-function relationship. Physicochem. Probl. Miner. Process. 2018, 54, 40–53. [Google Scholar] [CrossRef]
  46. Zhang, W. The effects of frothers and particles on the characteristics of pulp and froth properties in flotation—A critical review. J. Miner. Mater. Charact. Eng. 2016, 4, 251–269. [Google Scholar] [CrossRef] [Green Version]
  47. Uribe-Salas, A.; Gomez, C.O.; Finch, J.A. A conductivity technique for gas and solids holdup determination in three-phase reactors. Chem. Eng. Sci. 1994, 49, 1–10. [Google Scholar] [CrossRef]
  48. Banisi, S.; Finch, J.A.; Laplante, A.R. On-line gas and solids holdup estimation in solid-liquid-gas systems. Miner. Eng. 1994, 7, 1099–1113. [Google Scholar] [CrossRef]
Figure 1. Schematic of the conductivity sensor used in experiment.
Minerals 12 00454 g001
Figure 2. Schematic of the apparatus used to validate the relationship of froth zone water content and relative conductivity. The conductivity cell was placed on a blast gate which could be positioned to measure the froth’s relative conductivity (a) and to measure the froth water content (b).
Minerals 12 00454 g002
Figure 3. Schematic of experimental apparatus.
Minerals 12 00454 g003
Figure 4. Measured conductivity cell conductance over a range of specific conductivities.
Minerals 12 00454 g004
Figure 5. Actual against predicted water phase fraction for kerosene in water emulsion measured by conductivity.
Minerals 12 00454 g005
Figure 6. Relationship of froth zone water content and relative conductivity for various models from literature [8,14,19,20].
Minerals 12 00454 g006
Figure 7. Measured froth water content under various operating conditions for (a) DF1012, (b) PPG 425 and (c) F160-13, at various input air rates.
Minerals 12 00454 g007aMinerals 12 00454 g007b
Figure 8. Visualization of the Marangoni effect to resist drainage. Adapted from Tan et al. [26].
Minerals 12 00454 g008
Figure 9. Effect of changing frother concentration (a) units of ppm and (b) units of mmol L−1 on the top-of-froth water content at 1.8 cm s−1.
Minerals 12 00454 g009aMinerals 12 00454 g009b
Figure 10. Proposed increase in bound water layer with increasing frother concentration.
Minerals 12 00454 g010
Figure 11. Measured froth water content under various operating conditions for (a) DF1012, (b) PPG 425 and (c) F160-13, at various frother concentrations.
Minerals 12 00454 g011
Figure 12. Relationship of froth zone water content and water overflow rate for (a) PPG 425, (b) DF1012 and (c) F160-13. Different data points at similar air rates were obtained by varying the frother concentration. Trend lines were added to add clarity to results, and do not imply a definitive model.
Minerals 12 00454 g012
Figure 13. Comparison of the relationship of water overflow rate and froth water content for the frothers tested at an air velocity of 2.0 cm s−1.
Minerals 12 00454 g013
Table 1. Summary of experimental measurements.
SymbolMeasurementUnitsMethod
κ ConductivitymS cm−1Conductivity sensor
Q w o Water overflow ratecm s−1Bucket and stopwatch (60 s collection)
T TemperatureCTemperature transmitter
J g Input air velocitycm s−1Gas flow meter
Table 2. Summary of critical coalescence concentrations for frothers tested, from Zhang et al. [16].
FrotherStructure
DF1012 CH 3 ( OC 3 H 6 ) 6.7 OH
F160-13 C 4 H 9 ( OC 3 H 6 ) 2.5 OH   *
PPG 425 H ( OC 3 H 6 ) 7 OH
* Approximate structure.
Table 3. Models from the literature relating relative conductivity to water content in a dispersion.
ModelSource
ε l = 3 K / ( K + 2 ) [8]
ε l = 3 K 2.5 K 4 3 + 0.5 K 2 [19]
ε l = 3 K ( 1 + 11 K ) / ( 1 + 25 K + 10 K 2 ) [14]
ε l = 2.315 K / ( 2.315 K + 1 ) [20]
Table 4. R2 values for data obtained in this study, and various models from the literature.
ModelR2
Maxwell [8]0.556
Lemlich [19]0.947
Feitosa et al. [14]0.949
Yianatos et al. [20]0.949
Table 5. R2 values for the proportional trends seen in Figure 12.
Jg (cm s−1)PPG 425DF1012F160-13
1.00.6880.8550.879
1.20.8610.9030.869
1.40.8980.9480.914
1.60.9170.9560.908
1.80.9320.9660.908
2.00.9460.9660.896
Publisher’s Note: MDPI stays neutral with regard to jurisdictional claims in published maps and institutional affiliations.

