Abstract
In China, more than 10,000 Tailings storage facilities (TSF) have been created on the ground surface through mineral mining processes, these TSF occupy a large amount of land. The strength of the tailings is too low to be able to stand on its own without strengthening. In order to save land resources and alleviate the damage to the environment caused by mineral mining, it is necessary to reinforce the TSF so that they can store more tailings. China is one of the countries with the largest area of permafrost and seasonal frozen regions, accounting for about 75% of the country’s total land area. The problem can be exacerbated in these regions where the freeze–thaw effect can further degrade the strength of tailings. A review of the literature suggests that there is little research on the mechanical and microstructural properties of tailings reinforced with cement-based materials under freeze–thaw conditions, especially when the tailings are to be discharged to land for sustainable development. This study investigates the effect of freeze–thaw cycles on the mechanical properties and microstructural changes of tailings reinforced with cement-based materials to mitigate environmental hazards. Unconfined compressive strength (UCS) tests, scanning electron microscopic images, X-Ray Diffraction tests, thermogravimetry tests and mercury intrusion porosimetry tests were conducted on samples of tailings. The results from this study show that freeze–thaw cycles reduce the UCS of all the tested samples eventually, but the frozen temperature does not significantly affect the UCS. The larger number of freeze–thaw cycles, the more damage is to the surface morphology and the matrix of the tailings. The results presented in the paper can help engineers and managers to effectively transport the TSF to other locations to minimize environmental hazards to achieve sustainable production of mineral mining processes.
1. Introduction
The excavation and removal of ore mass from the ground create a large volume of surface voids or ground subsidence, which poses environmental hazards [1,2]. Run-of-mine ores are initially processed through standard mineral processing operations, such as crushing, magnetic separation, gravity separation, dense medium separation and flotation to increase their grade for subsequent extraction of metals, the waste generated is called tailings. In China, more than 10,000 tailing storage facilities (TSF) have been generated on the ground due to mining [3], by the end of 2020, the reserves of tailings reservoirs reached 22.26 billion tons [4]. The type of tailings accumulated on the surface needs to be disposed of at a proper location to mitigate the environmental impact of the mineral process. If not handled well, the TSF most likely leads to serious geotechnical dangers (e.g., tailings dam failure) and land contamination (e.g., heavy metal leaching) [5,6]. Tailings generated from metal-sulfide mines usually contain non-valuable sulfide minerals, such as pyrite (FeS2), pyrrhotite (Fe1−xS, where 0 < x < 0.2), and arsenopyrite (FeAsS) that generate acid mine drainage when exposed in the environment to oxygen (O2) and water [7]. In addition, tailings can turn into mud in wet weather, e.g., rain, and into dust in dry weather, e.g., by wind. This creates severe pollution of the environment.
To solve these problems, some researchers [8,9,10,11] suggested that the tailings be used to backfill mined-out areas, which has a good effect on the control of geological subsidence. Backfilling is a good idea, but if the tailings used are rich in sulfide minerals, it can cause other problems, especially the enhanced generation of acid mine drainage. Another promising approach is to simultaneously repurpose and treat tailings via alkali activation in a process called geopolymerization. Some mine tailings are ideal geopolymer materials because they contain high clay and aluminosilicate minerals, which are essential components for the geopolymer matrix to form. In this process, aluminosilicates are dissolved in highly-concentrated alkali hydroxide or silicate solution to form a structurally stable material composed of amorphous, interconnected Si-O-Al polymeric matrices via a combination of diffusion, coagulation and polycondensation. They are potentially suitable raw materials for geopolymeric products with considerably high compressive strength and long-term durability [12]. Other researchers [13] proposed to add some cement-based material to the tailings to form a consolidated body with certain mechanical strength and discharge them into valleys or ground subsidence areas through transport by pipes or belts. Either way, the tailings should be strengthened before they can be transported to another location. In this way, it provides a method to support mining in its transition into an economically sustainable, socially responsible, and environmentally sensitive industry. This approach can simultaneously reduce waste generation, provide additional economic benefits to stakeholders, empower host communities, and improve rehabilitation programs [14]. In fact, a leaching test, such as TCLP showing that the slag and tailing samples are non-hazardous should also be provided as the greatest challenge in the repurposing of mining wastes is their potential to release hazardous elements to the environment. Alkali-activated cementitious materials can store harmful elements in the consolidated body, making them less prone to leaching [15].
The area of permafrost and seasonal frozen regions accounts for about 23% of the world’s total land area [16]. It is, therefore, of significant importance to consider the influences of the cold weather on the strength of tailings reinforced with cement-based materials. In the past decades, researchers focused their attention on the internal microstructure in their studies of cement-based materials [17]. This is because the microstructure determines the strength and durability of the tailings. However, freeze–thaw cycles can destroy the reinforced body of tailings since frozen water, i.e., ice, generates crystallization pressure on the capillary and pore walls in the tailings, and the expanded volume leads to an increase in stress [18]. The ice then melts to water, causing a collapse of some pores and extensions into larger pore structures. As a result, the porosity of the tailings is increased. Clearly continuous cycles of freeze–thaw will degrade the mechanical properties of cement-based materials [19].
A number of researchers [20,21,22,23] investigated the degradation of compressive strength of concrete due to freeze–thaw cycles. Tang [24] applied the artificial freezing method in subway tunnel construction and found that the value of freezing temperature had a slight influence on the dynamic elastic modulus of soil, but freeze–thaw action can reduce the dynamic elastic modulus. Xie [25] studied the interaction between desertification and permafrost and found that both the cohesion values and the compressive strength of the permafrost samples that experienced freeze–thaw cycles were decreased compared to the unfrozen samples. Some researchers [26] observed that crystallization pressure by ice was the most important source of stress during freeze–thaw cycles for cement-based composites. The interfacial energy between the porous media played a vital role in the crystallization pressure, which is the stress that acted on the walls of pores due to the growing ice crystal [27,28,29,30]. Therefore, it is imperative to accurately measure the pore size distribution and micromorphology of the tailings reinforced with cement-based materials before and after freeze–thaw cycles.
Further review of the literature suggests that current research focused more on the mechanical and microstructural properties of concrete or soil only [31,32,33,34]. There is little or no research on tailings reinforced with cement-based materials under freeze–thaw conditions, especially when the tailings are to be discharged to land. Clearly knowledge on the degradation of mechanical and microstructural properties of tailings reinforced with cement-based materials under freeze–thaw cycles can help prevent failures of tailing dams and mitigate their environmental hazards. This can achieve not only sustainable production in the mining process but also bring about significant social, economic and environmental benefits. Therefore, there is a well-justified need to study the degradation of mechanical strength of tailings reinforced with cement-based materials under freeze–thaw cycles.
The main objective of this paper is to experimentally study the mechanical and microstructural properties of tailings reinforced with cement-based materials before and after freeze–thaw cycles and to identify the causes of changes in mechanical and microstructural properties. To achieve this objective, samples of tailings are prepared with different curing periods, namely 3, 7 and 28-days and frozen at different temperatures, namely −5 °C, −10 °C, and −15 °C for different numbers of cycles, namely 0, 3, 5, 7, 10, 12, 15, 20. Then, uniaxial compressive (UCS) tests are conducted on these samples. This w followed by the X-Ray Diffraction (XRD) and thermogravimetry (TG) tests to identify and assessment of the hydration products of cement-based materials before and after freeze–thaw cycles. Scanning electron microscopy (SEM) is performed on these samples to analyze the composition and microcosmic morphology of the hydration products. Finally, the microscope pore structures of the samples are studied through the mercury intrusion porosimetry (MIP) experiment. The paper focuses on the effects of freeze–thaw cycles on the mechanical and microscopic properties of the tailings to provide a theoretical and experimental basis for their wider application in cold regions to achieve environmental sustainability and cleaner production in the mining process.
2. Design of Experiment
2.1. Geology of the Mine and Test Materials
Lilou Iron Mine is located in Huoqiu County, western Anhui Province. The ore body has an elevation of −520∼−862 m, an average thickness of 48.2 m, and an inclination angle of 65∼85°. The roof of the deposit and its surrounding rocks are gneiss and dolomite marble. The hardness coefficient of specular hematite in the ore-bearing belt is 8 to 12, but the local extrusion and crushing have a broken structure. The lithology of the ore body floor is mainly dolomite marble, with no fissures and karst caves developed. The shape of the ore body within the ore deposit is layered, the ore body tends to be nearly north-south, and the ore body is inclined to the west. At present, the mining capacity of the mine is 7.5 million tons/year, which is the largest iron ore underground mining in China.
The tailings (from the Anhui Lilou Iron Mine, the main mineralogical composition is specular hematite) mixed with a new type of cement-based material were used as the test material. Although Ordinary Portland Cement is one of the most commonly used binders in backfilling and discharging [35], its costs account for almost 75% of the discharge expenditure [36]. Thus, a cheaper new type of cement-based material (denoted NCM) is developed to replace Ordinary Portland Cement. The composition of the NCM is clinker, lime, gypsum, blast furnace slag with a proportion of 14:6:10:70 (the main mineralogical compositions of lime, gypsum, blast furnace slag is calcium hydroxide, calcium sulfate and melilite, the main mineralogical compositions of clinker are tricalcium silicate, dicalcium silicate, tricalcium aluminate and tetracalcium ferroaluminate) [37]. The grain size distribution of NCM is given in Table 1 where d10, d30, d50, d60, d90 represent the cumulative content on the particle composition curve, with corresponding particle sizes of 10%, 30%, 50%, 60%, 90% of the volume, respectively. The main chemical compositions of NCM are given in Table 2; 0.4% of admixture was added to NCM. The admixture consists of sodium sulfate, alum, sodium fluorosilicate with a proportion of 2:1:1. Previous test results have proved [37] that the UCS of the tailings with NCM at the ages of 3, 7 and 28-days are 2.4, 2.4 and 1.7 times higher than that with OPC, respectively.

Table 1.
Grain size distribution of NCM and tailings.
Table 2.
Main chemical compositions of NCM and tailings.
Tap water was used to mix the binders, i.e., NCM with tailings. The grain size distribution of tailings is shown in Table 1. The main mineralogical compositions of the tailings are listed in Table 2. The grain size distribution of the tailings is shown in Figure 1.
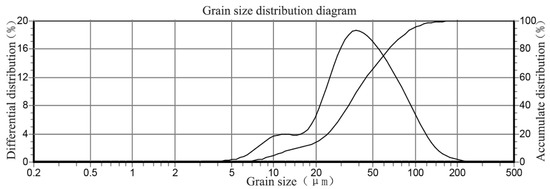
Figure 1.
Grain size distribution of tailings.
2.2. Test Specimens
The water to binder (w/NCM) ratio of the mix proportion adopted in this study is 5.6. The binder (NCM) content of the tailings is 4.5% by weight. The preparation of the specimens basically follows the standard ASTMC39 [38] and includes the following steps: Firstly, the required amount of tailings, NCM and water were determined according to the experimental scheme, and the tailings mixtures were produced by mixing the required quantity of tailings, NCM and water for 7 min until a homogeneous paste was obtained. The prepared mortar was then poured into plastic cylinders, whose diameter and height are 50 mm and 100 mm, respectively. Then, the prepared samples of tailings mixtures were sealed with a plastic cover to prevent moisture loss. They were cured in an environmental chamber with a controlled temperature of 20 ± 1 °C and a minimum of 95% relative humidity for different curing times, i.e., 3, 7 and 28-days. To assure comparable results in the current measurements, identical experimental conditions are maintained for all the tests. After curing, tailings samples were frozen at three temperatures namely −5 °C, −10 °C and −15 °C, and then thawed in the environmental chamber with different numbers of cycles, namely, 0, 3, 5, 7, 10, 12, 15, 20 for each freezing temperature. The freezing and thawing time are both 12 h, according to the period of a natural cycle. To cover a range of designated values for different test variables of curing time, freezing temperature and number of freezing-thawing cycles, 230 samples of tailings mixture were prepared in this study.
A detailed test plan for this study is shown in Table 3. It should be noted that only water and binder are added to the XRD and TG tests, other operations are the same as above.
Table 3.
Test plan for experiment.
2.3. Tests on Specimens
Tests undertaken on tailings samples included mechanical tests, XRD, TG, SEM and MIP measurement. In accordance with ASTMC39 [38], the mechanical strength of tailings samples is represented by the UCS [39], which is one of the most important indicators to measure the macroscopic mechanical damage characteristics on samples. It is relatively intuitive to find the relationship between the damage and the number of freeze–thaw cycles. The UCS tests are performed on the tailings samples after they are cured for 3-days, 7-days, 28-days (referred to as 3-, 7-, 28-day samples hereafter), and experienced 0, 3, 5, 7, 10, 12, 15, 20 freeze–thaw cycles.
XRD is a common measurement for crystal phase structure identification in cement-based materials [40]. The tests were performed on NCM samples that are cured for 7-days and 28-days and experienced 20 freeze–thaw cycles at a freezing temperature of −10 °C.
TG test is to assess the amount of hydration products on the microstructural development of the cement-based materials. The tests were performed on NCM samples that were cured for 7-days and 28 days and undergone different freeze–thaw cycles at different freezing temperatures.
SEM images are used to evaluate the influence of hydration products on tailings samples [41]. The tests were conducted on tailings samples that were cured for 3-days, 7-days, 28-days and had undergone freeze–thaw cycles of 0, 5, 10, 20 times at the freezing temperature of −10 °C.
MIP is a high-precision method to analyze the micropore structure of materials [42,43]. Non-immersion liquid cannot penetrate the porous area unless external pressure is introduced. The tests were conducted on tailings samples cured for 7 and 28-days, after the 20th freeze–thaw cycle at the temperatures of −5 °C, −10 °C, −15 °C and 20 °C.
The relationship between the pore diameter d (m) and the pressure P (MPa) can be described by the well-known Ishburn equation [44]:
where the applied pressure P is inversely proportional to pore diameter d, σ is the surface tension (N/m) and θ is the contact angle between mercury and the pore wall. The contact angle is believed in the range of 120° to 140° [45].
3. Results and Analysis
3.1. Effects of Freeze–Thaw Cycles on Strength of Tailings Samples
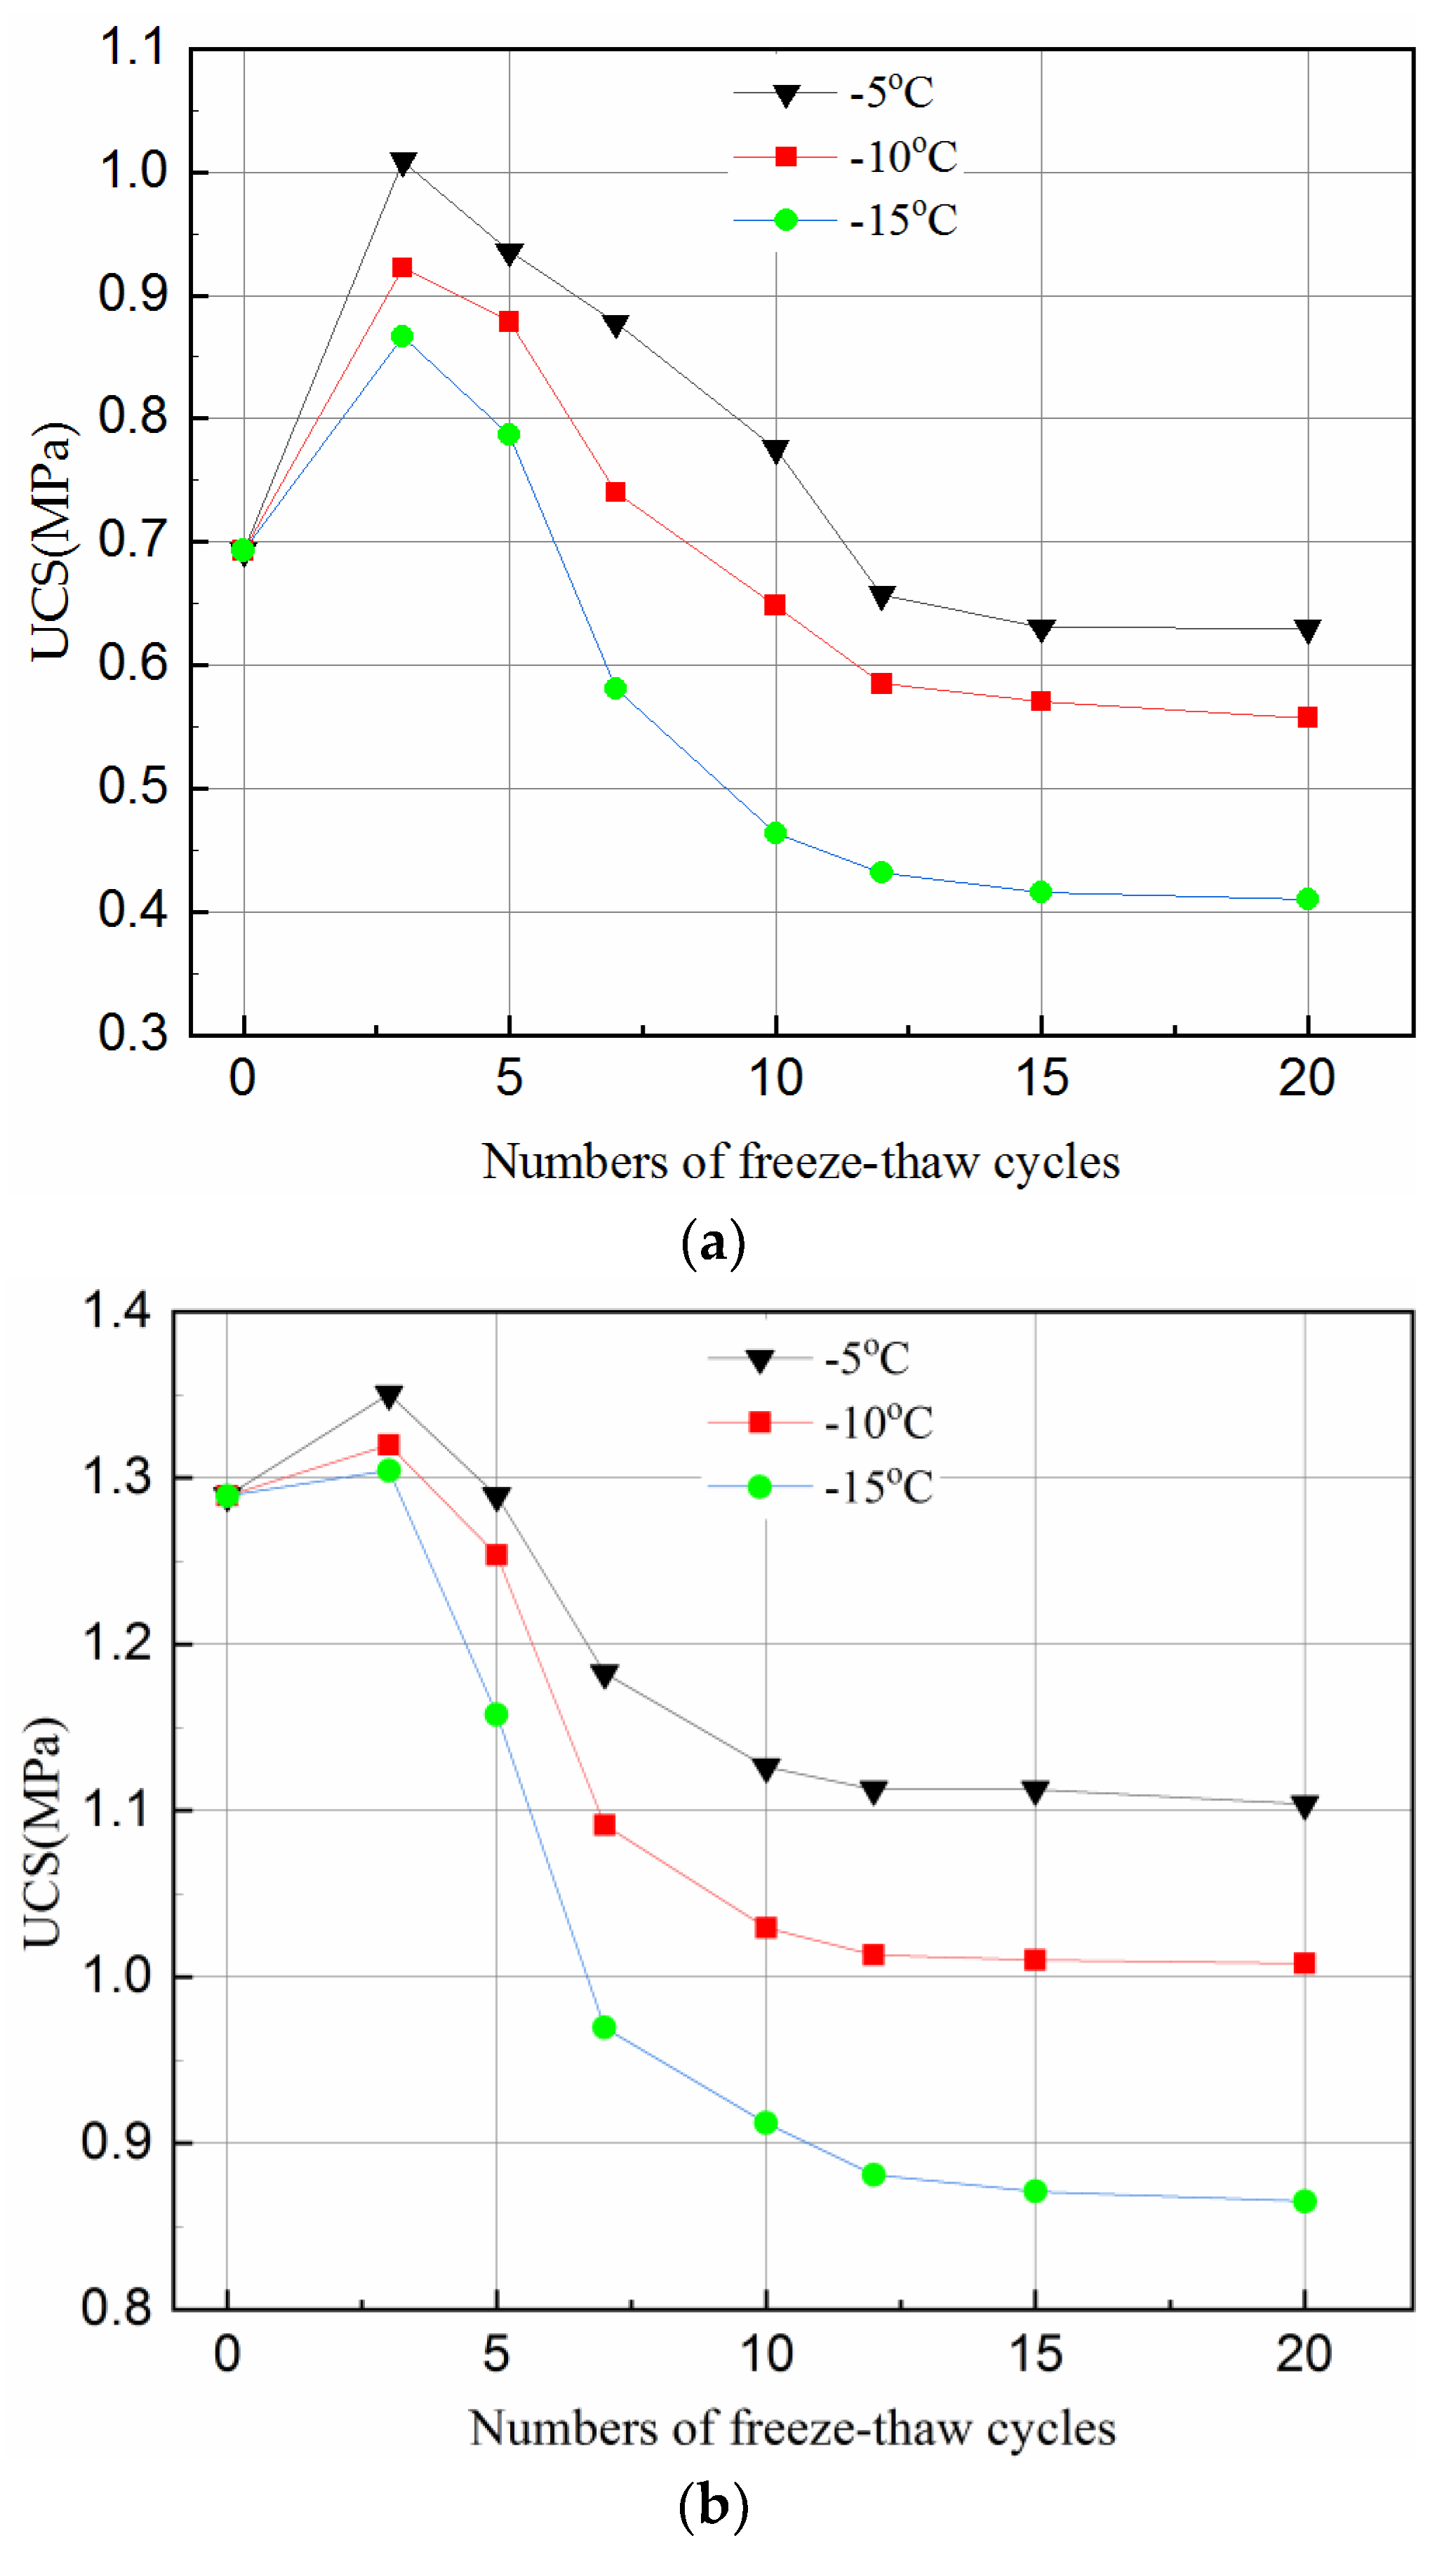
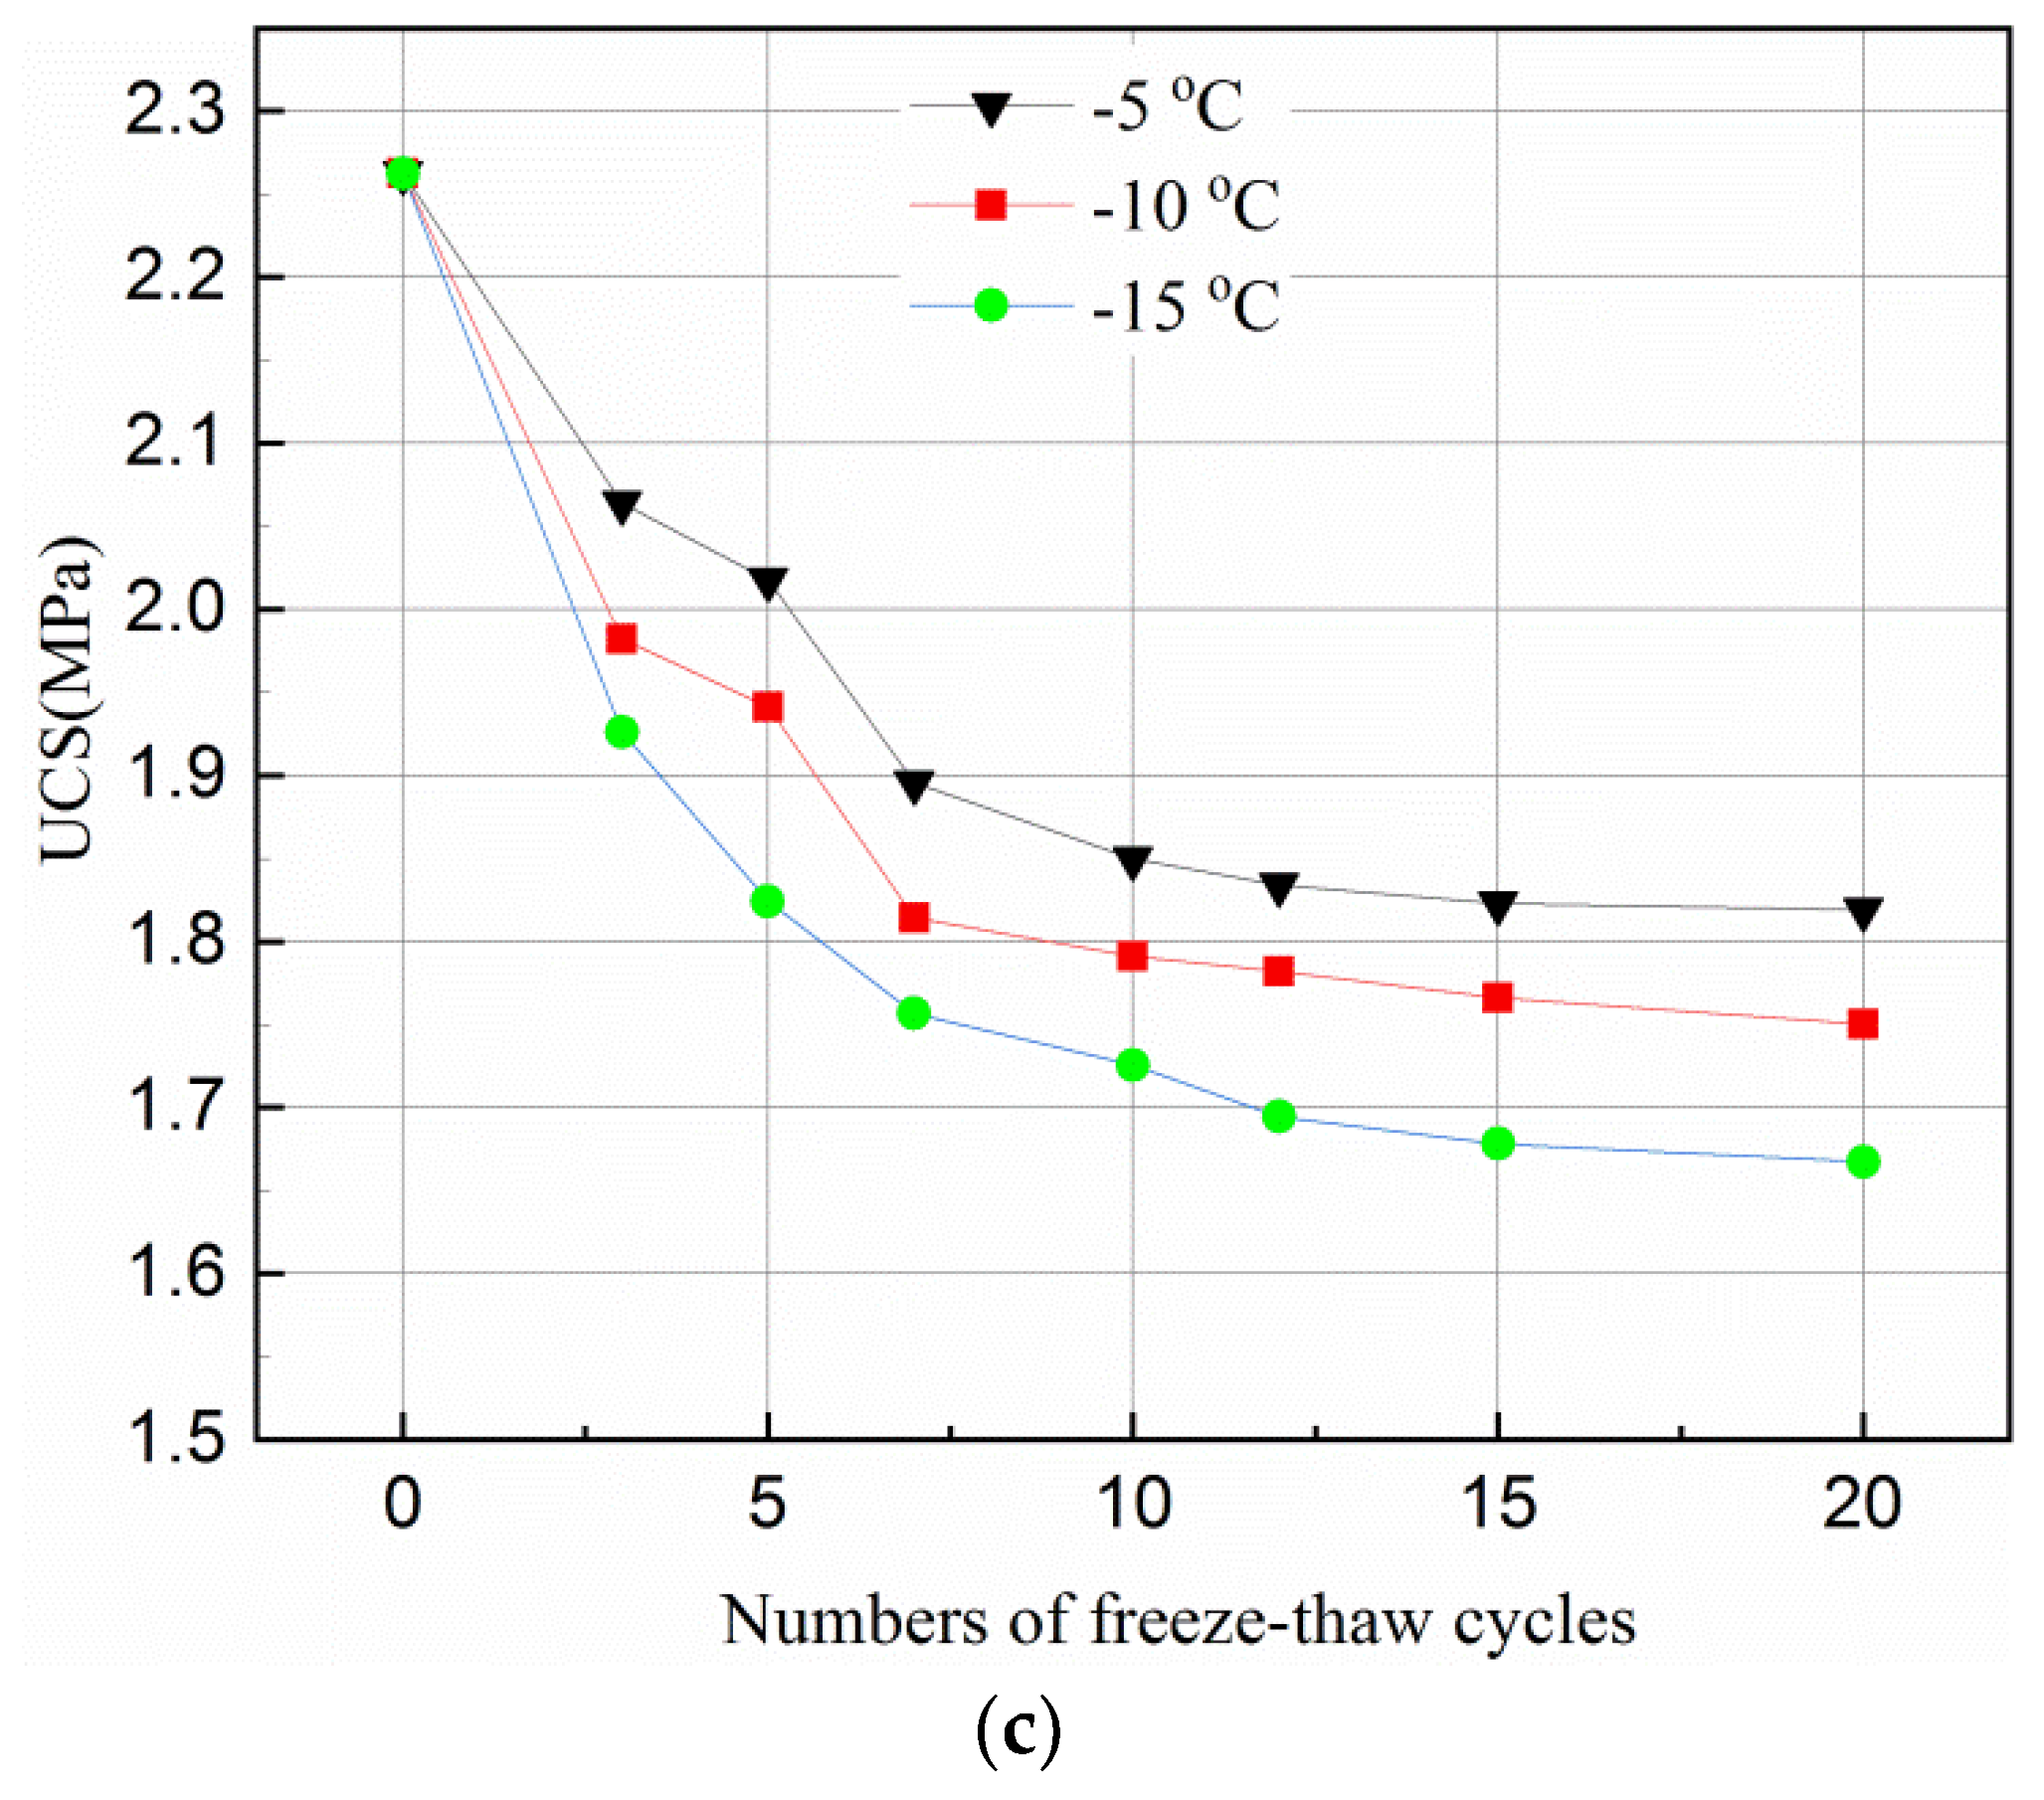
Figure 2 shows the UCS variation under different freeze–thaw cycles (0, 3, 5, 7, 10, 12, 15 and 20) and freezing temperatures (−5 °C, −10 °C, −15 °C). It can be clearly observed that the number of freeze–thaw cycles and freezing temperature has a significant effect on the strength variation of the tailing samples.
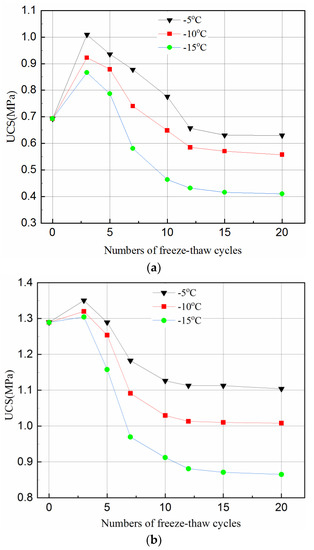
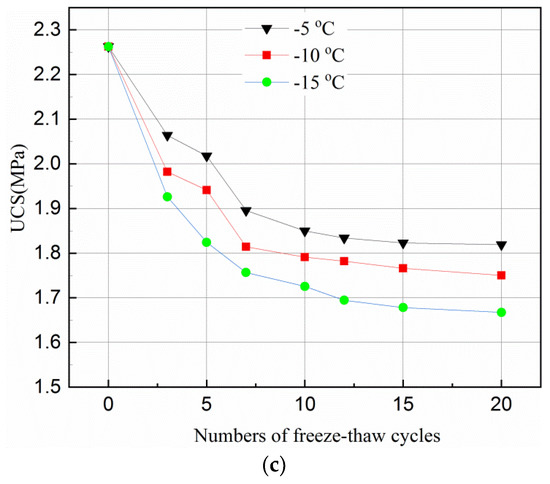
Figure 2.
Effect of freeze–thaw cycles on UCS of tailings samples for different curing time and temperature. (a) After 3-day curing; (b) After 7-day curing; (c) After 28-day curing.
Figure 2a,b shows that the UCS of the 3- and 7-day samples increases in the first 3 cycles, and then decreases until the 12th cycle. It becomes flat during the 12–20 cycles. However, the UCS of the 28-day samples decreases in the first three cycles, and becomes stable during the 10–20 cycles, as can be seen in Figure 2c.
The hydration reaction of the samples with a short curing time (e.g., 3-days and 7-days) did not proceed completely since the free water converted to ice during freezing. Therefore, there were few hydration products but many internal pores in the samples. Although the volume expanded by about 9% due to water becoming ice, the pores in the samples provided sufficient space to accommodate the expansion. Thus, the swelling effect of the ice crystals on the samples is not significant. When the temperature rises, the ice melts, and the hydration reaction continues. The hydrated products, such as calcium silicate hydrate (C-S-H) gels and ettringite crystals, continue to fill the internal pores, reducing the porosity of the samples, and as such increasing the strength. This is why in the first three cycles of freeze and thaw, the UCS of the samples increased. At this stage, the effect of hydration reaction on the strength is greater than the damage of freeze–thaw cycles.
However, with the accumulation of damage by the freeze–thaw cycles, the UCS of the samples started to decrease when it reached a peak value. This can also be because more hydration reactions were completed. When the samples were cured for a longer time, e.g., 28-days, sufficient hydration products were produced which filled up the internal pores and overlapped on each other. Such samples had a relatively dense matrix with little room to accommodate the expansion of the ice crystal when the samples were frozen. Thus, any expansion of the ice crystal could destroy the dense matrix of the samples and hence reduced the UCS of the samples. This can be seen in Figure 2 where the curves flattened after 12 cycles of 3 day samples, after 10 cycles of 7- and 28-day samples, the UCS stabilized upon reaching a certain value. The main reason for such variations is that the internal structure of the samples was destroyed by the freeze–thaw cycles in the initial stage. Thus, as the number of freeze–thaw cycles increased, a new stable state was reached.
Figure 2 indicates that the temperature affects the UCS of the samples differently for different curing times. The UCS values of the samples frozen at −10 °C were higher than that at −15 °C but lower than that at −5 °C for all curing time and freeze–thaw cycles. This phenomenon indicates that during the freeze–thaw cycles, the lower the temperature, the more destructive to the samples. Figure 2 also shows that the degree of temperature effect on samples was different with longer cured samples (i.e., 28-days). The reason for this is that when the samples were transferred from the curing box to the freezer, the freezing temperature was higher and the exchange rate between the samples was lower, and the the time required for the temperature to fall below the freezing point was higher. A hydration reaction is an exothermic process, a longer curing time means more hydration products during one freeze–thaw cycle and hence, less of an effect from temperature. Figure 2 further shows that, for the same curing time, the higher the freezing temperature, the greater the value of the UCS under the same freeze–thaw cycles. This is because when the temperature is below the freezing point, some of the crystal water is not converted to ice completely [46]. Being closer to the freezing point, means there is more free water in the hydration reaction which offsets the damage conducted by the freeze–thaw cycle to some extent. However, since the hydration reaction of the sample in 28-days almost consumed the raw materials, the influence of freezing temperature on the hydration reaction was reduced.
Figure 2 suggests that the UCS reduced less for higher freezing temperature, e.g., −5 °C, than that for lower ones, this can be explained as follows. In general, there are two kinds of pore structures, which are closed and connected pores. When the freezing temperature is low, the water in the closed pores with rigid constraints of pore walls freezes rapidly, and the ice crystal pressure increases. When the ice crystal pressure exceeds the strength of the pore wall, the freeze–thaw damage occurs in the samples. For connected pores, the capillary force in the smaller pores will reduce the freezing point of water so that the water in the non-capillary pores freezes first. The small pores connected to it will be isolated after freezing since the water between the pores has no time to seep. As a result, the closed pore is formed with the same damage mechanism as described above. When the freezing temperature is high, the water freezing process is a quasi-static process. For closed pores, the ice crystal pressure increases simultaneously with the elastic deformation of the pore wall. The ice crystal pressure is converted into elastic deformation energy and stored in the pore wall. Therefore, the freeze–thaw damage generated in the closed pores is small. For the connected pores, an unfrozen water film is formed between the water and the pore wall during the freezing process. While freezing, the water in the pores penetrates through the unfrozen water film to other pores, which reduces the ice crystal pressure. Therefore, the freeze–thaw damage generated in the connected pores is small.
Compared with the UCS of the unfrozen samples in Figure 2, the UCS of samples with 3-, 7- and 28-day curing reduced by about 9–40%, 14–32%, and 19–26%, respectively, under the same testing conditions. This is because a short curing time results in fewer internal hydration products in the samples. In general, an increase in curing time can produce more hydration products in the samples with less water in the pores. However, more water in the pores of the samples promotes the destructive effect of ice crystals during the freezing and thawing. The damage by freeze–thaw cycles is irreversible and will eventually damage the samples with shorter curing time than those with longer curing time.
3.2. Crystalline Phases and Amount of Hydration Products of NCM
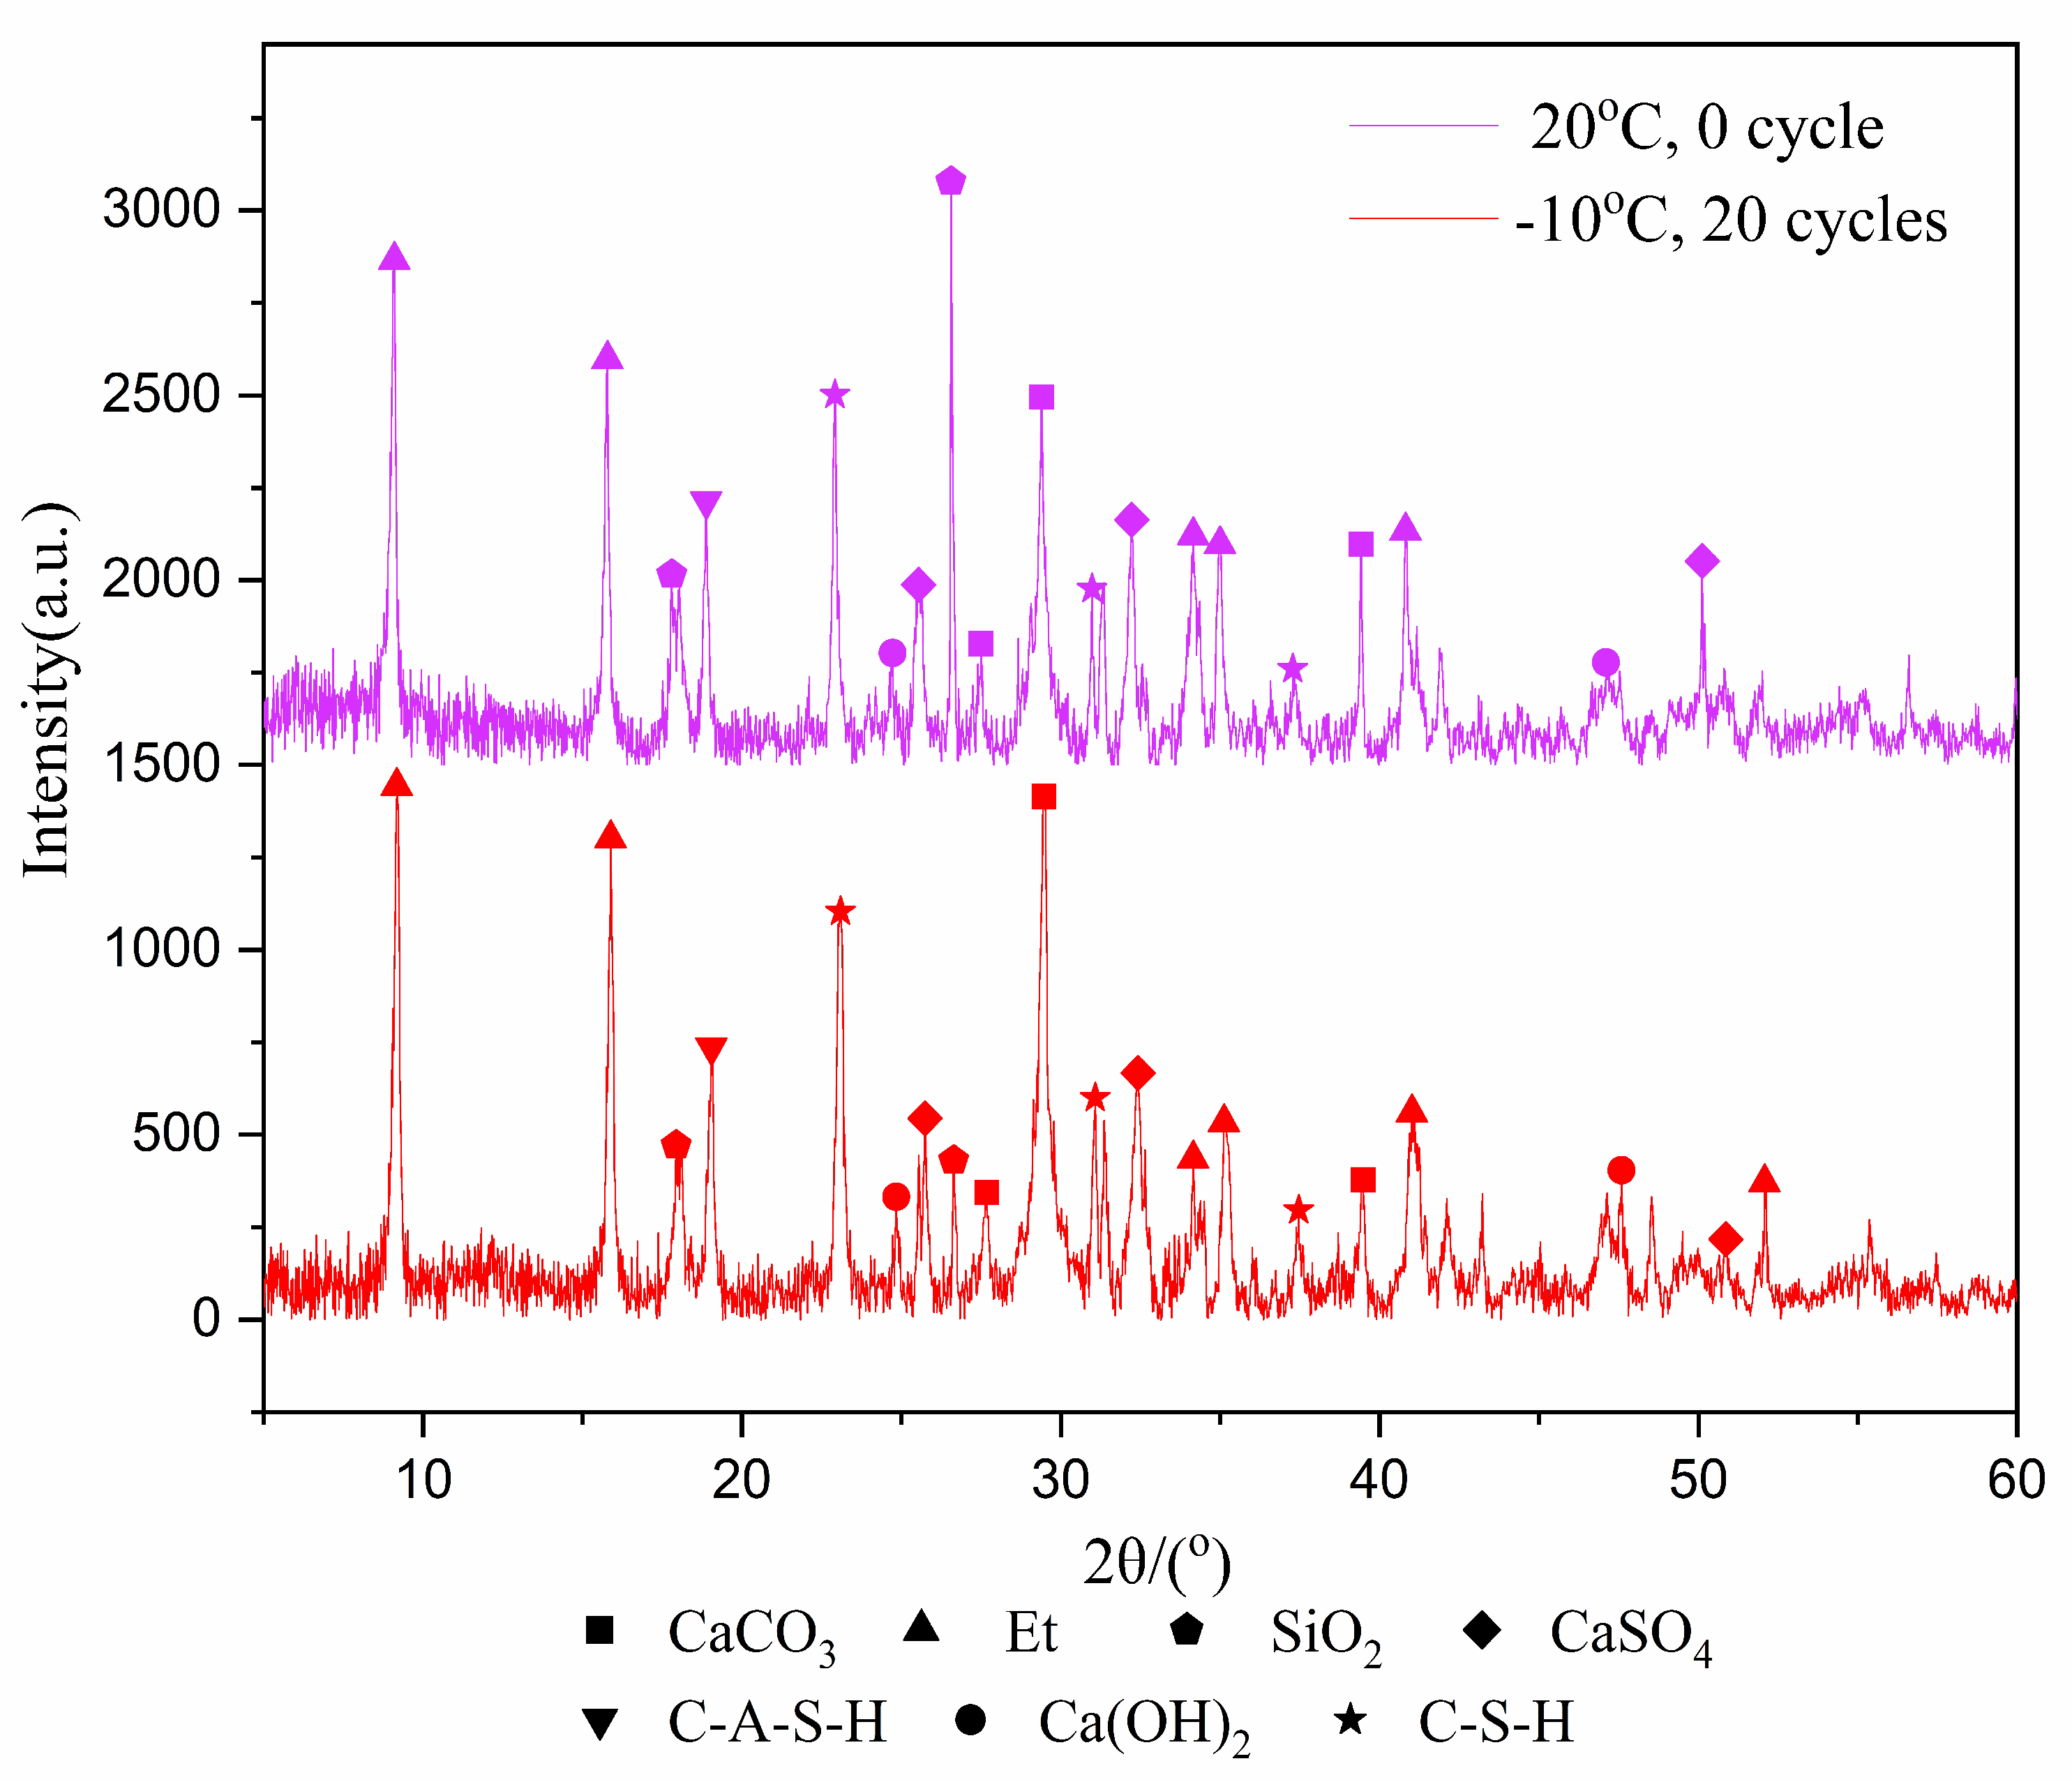
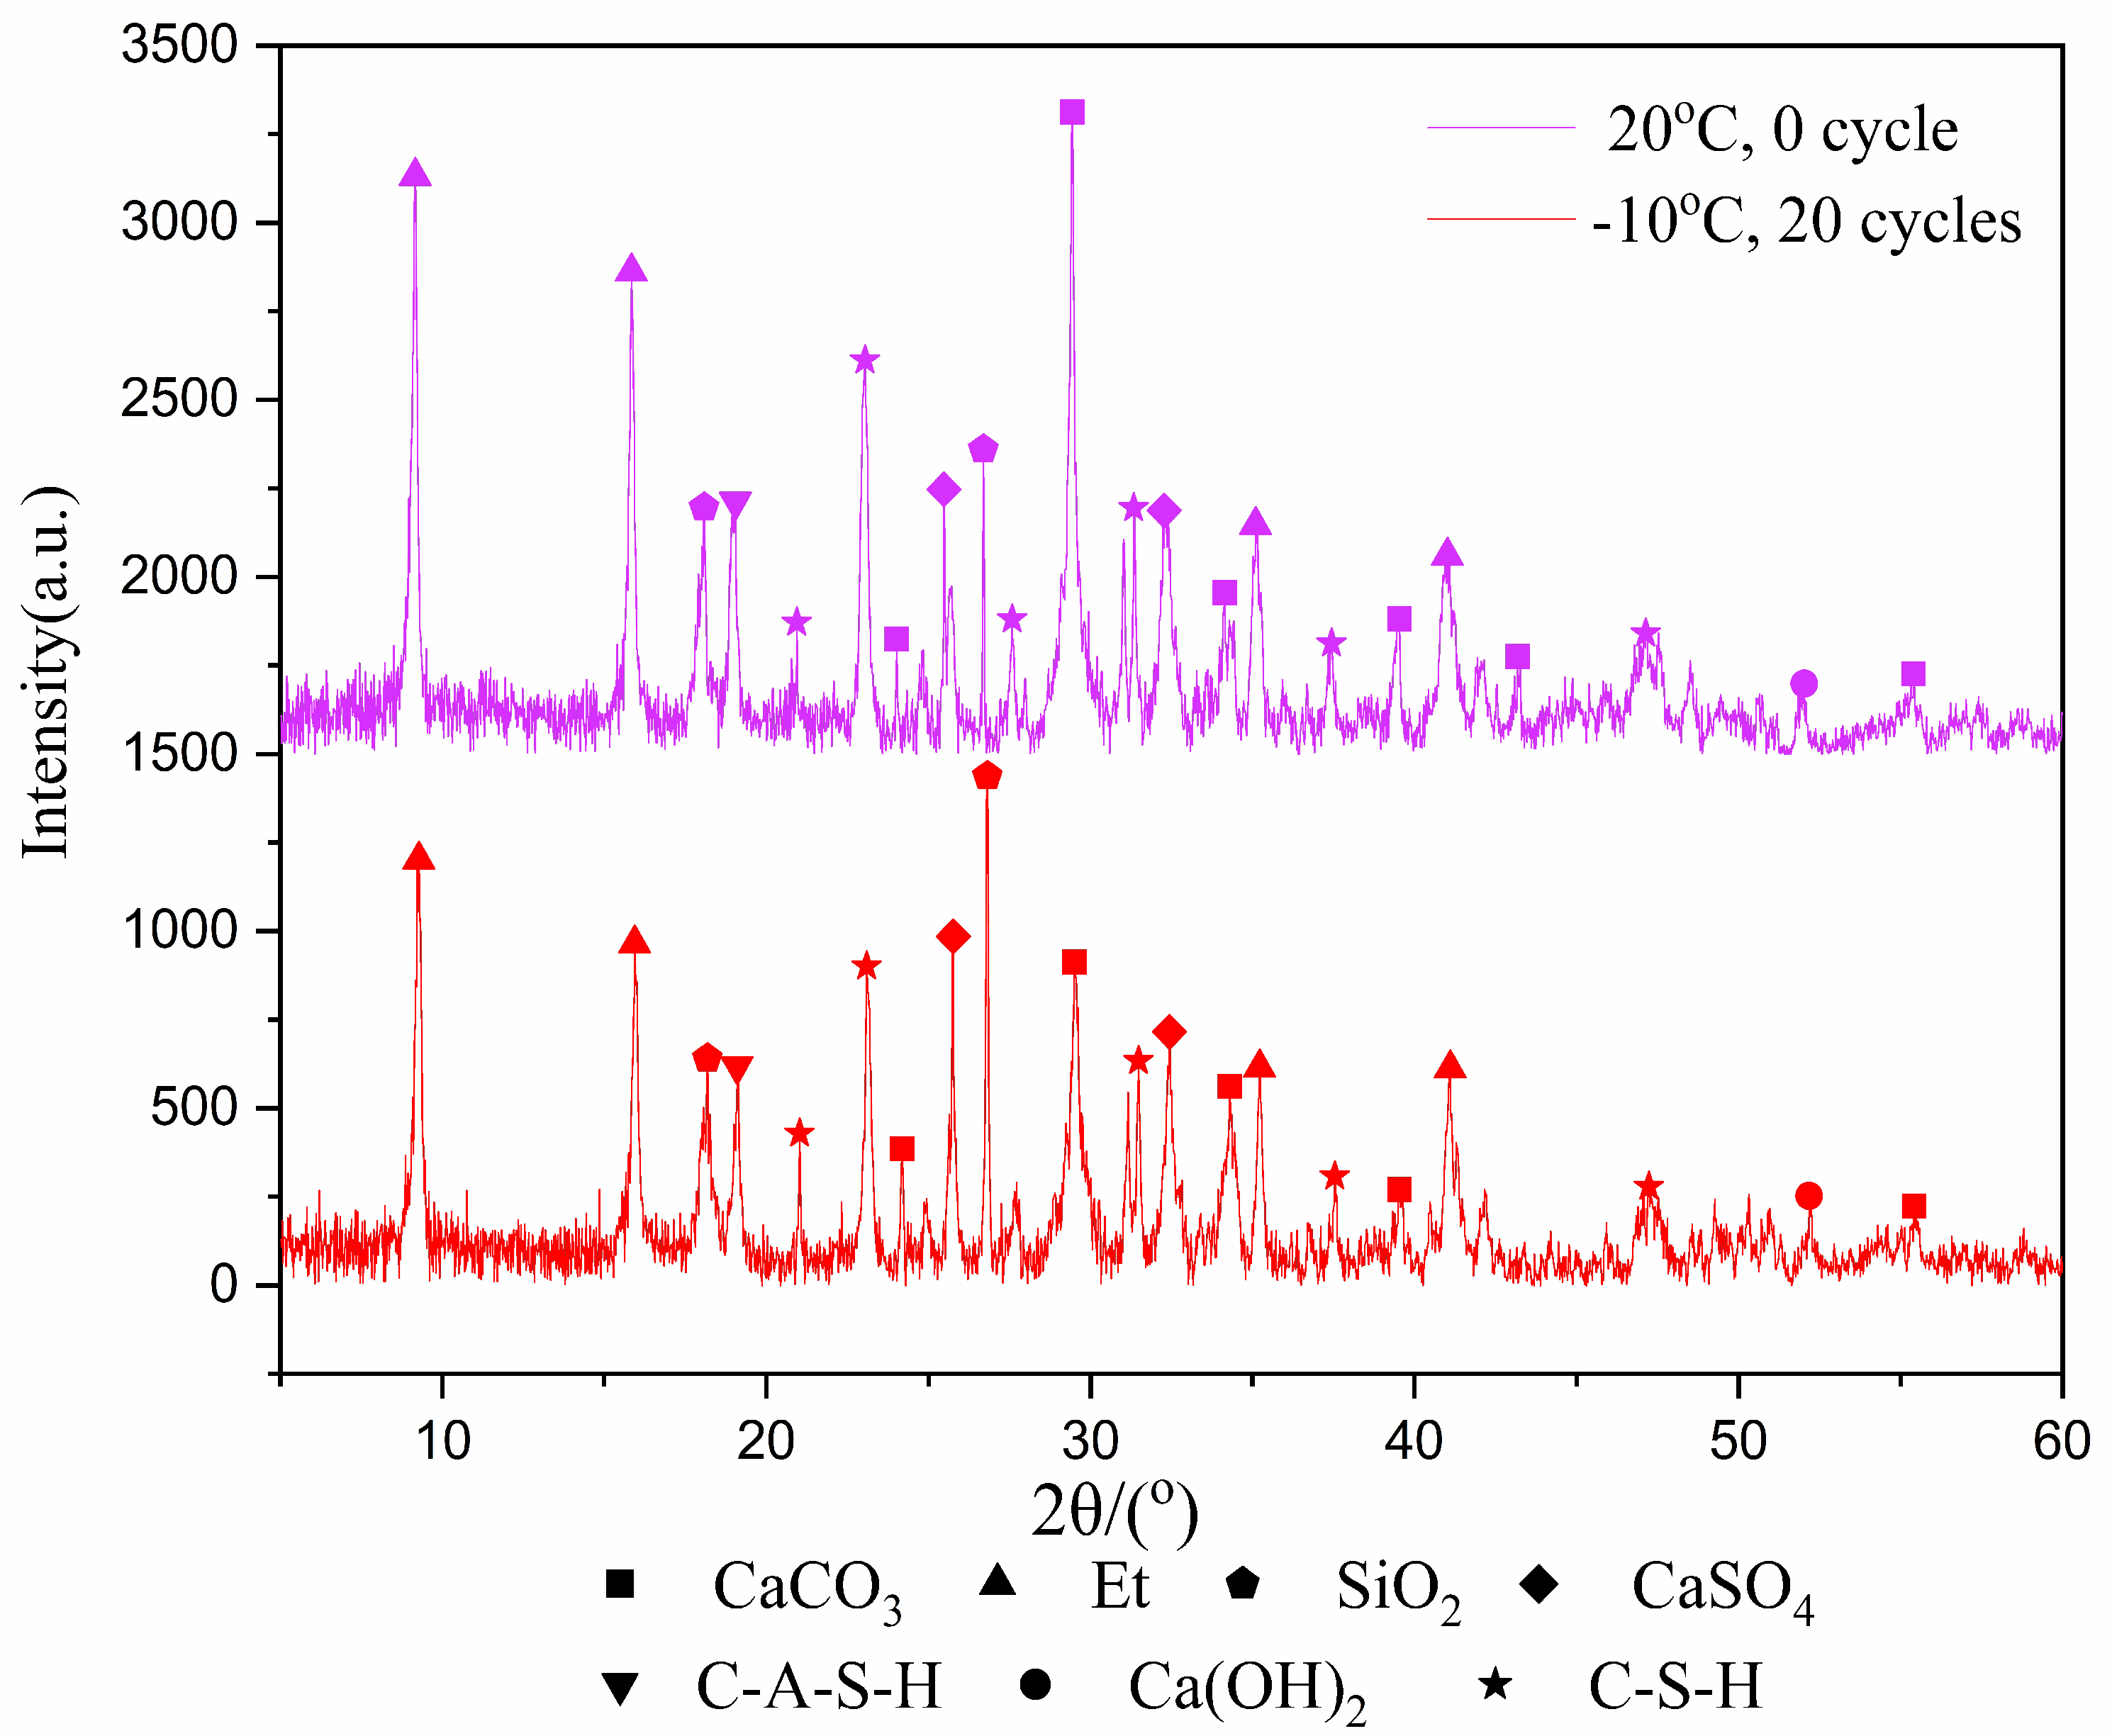
In the past, the research on freeze–thaw cycles mostly focused on rock and soil. These materials have no internal reactions, such as hydration reaction, during the freeze–thaw cycles, and their properties are relatively stable. However, for tailings samples, the hydration product is an important factor affecting the mechanical properties after freeze–thaw cycles. Therefore, it is important to analyze the change of the type and amount of hydration products in the samples before and after freeze–thaw cycles. The XRD test was used to identify the types of hydration products that were cured for 7 and 28-days after experiencing 20 freeze–thaw cycles at −10 °C, with results shown in Figure 3 and Figure 4.
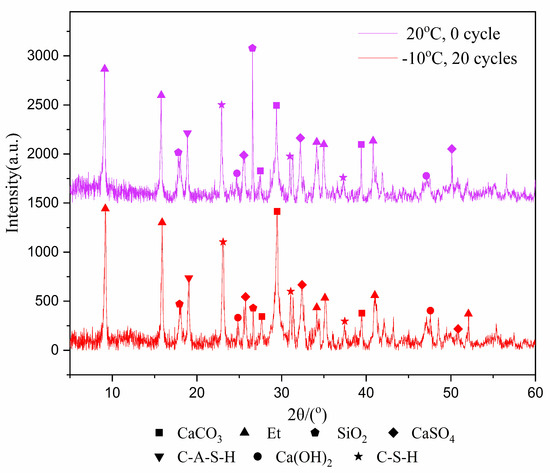
Figure 3.
XRD image of 7-day samples.
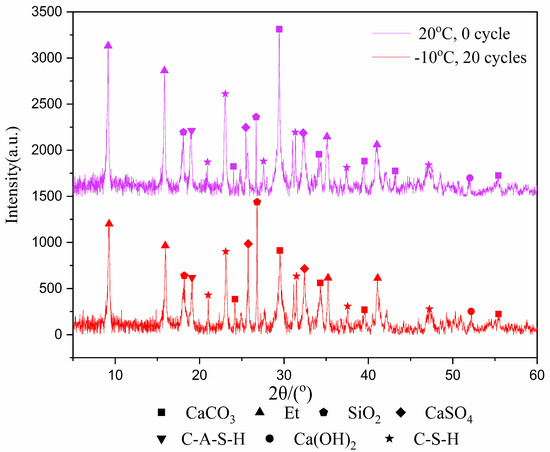
Figure 4.
XRD image of 28-day samples.
Figure 3 and Figure 4 show the products of calcium carbonate, ettringite, calcium hydroxide, hydrated calcium sulfoaluminate, calcium silicate hydrate, calcium sulfate and silica. Though the diffraction intensities of the substances are not the same at the same angle, the species phase does not change in general. The reason is that the hydration reaction still occurs during the freeze–thaw cycles, but it does not generate other substances due to the intermittent progress of the hydration reaction.
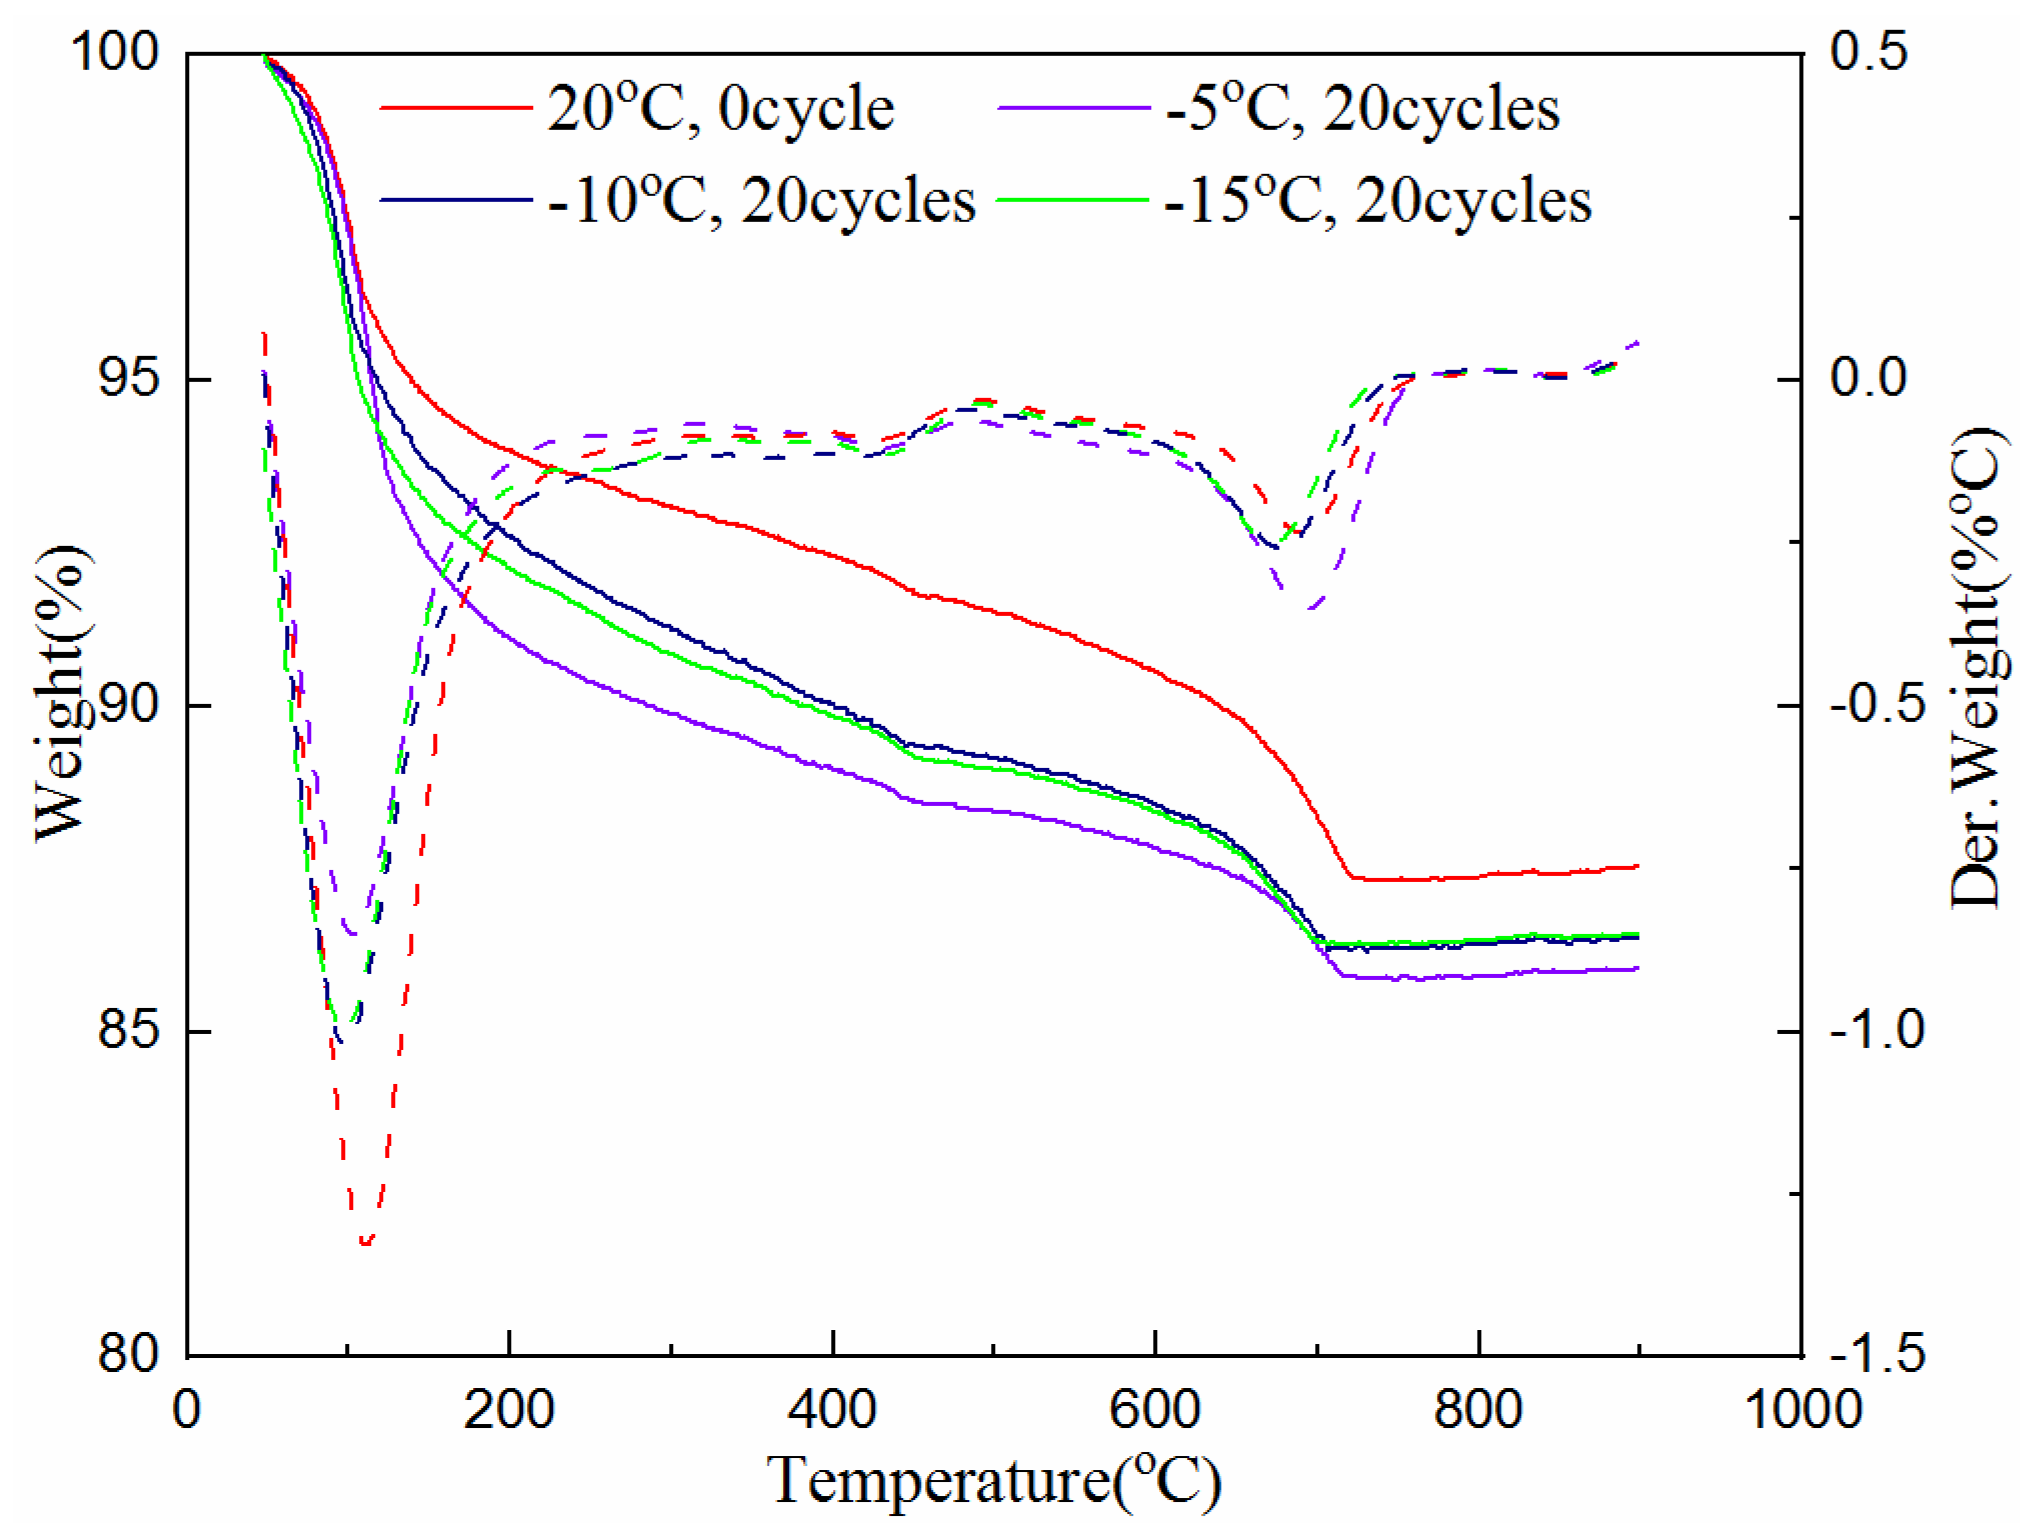
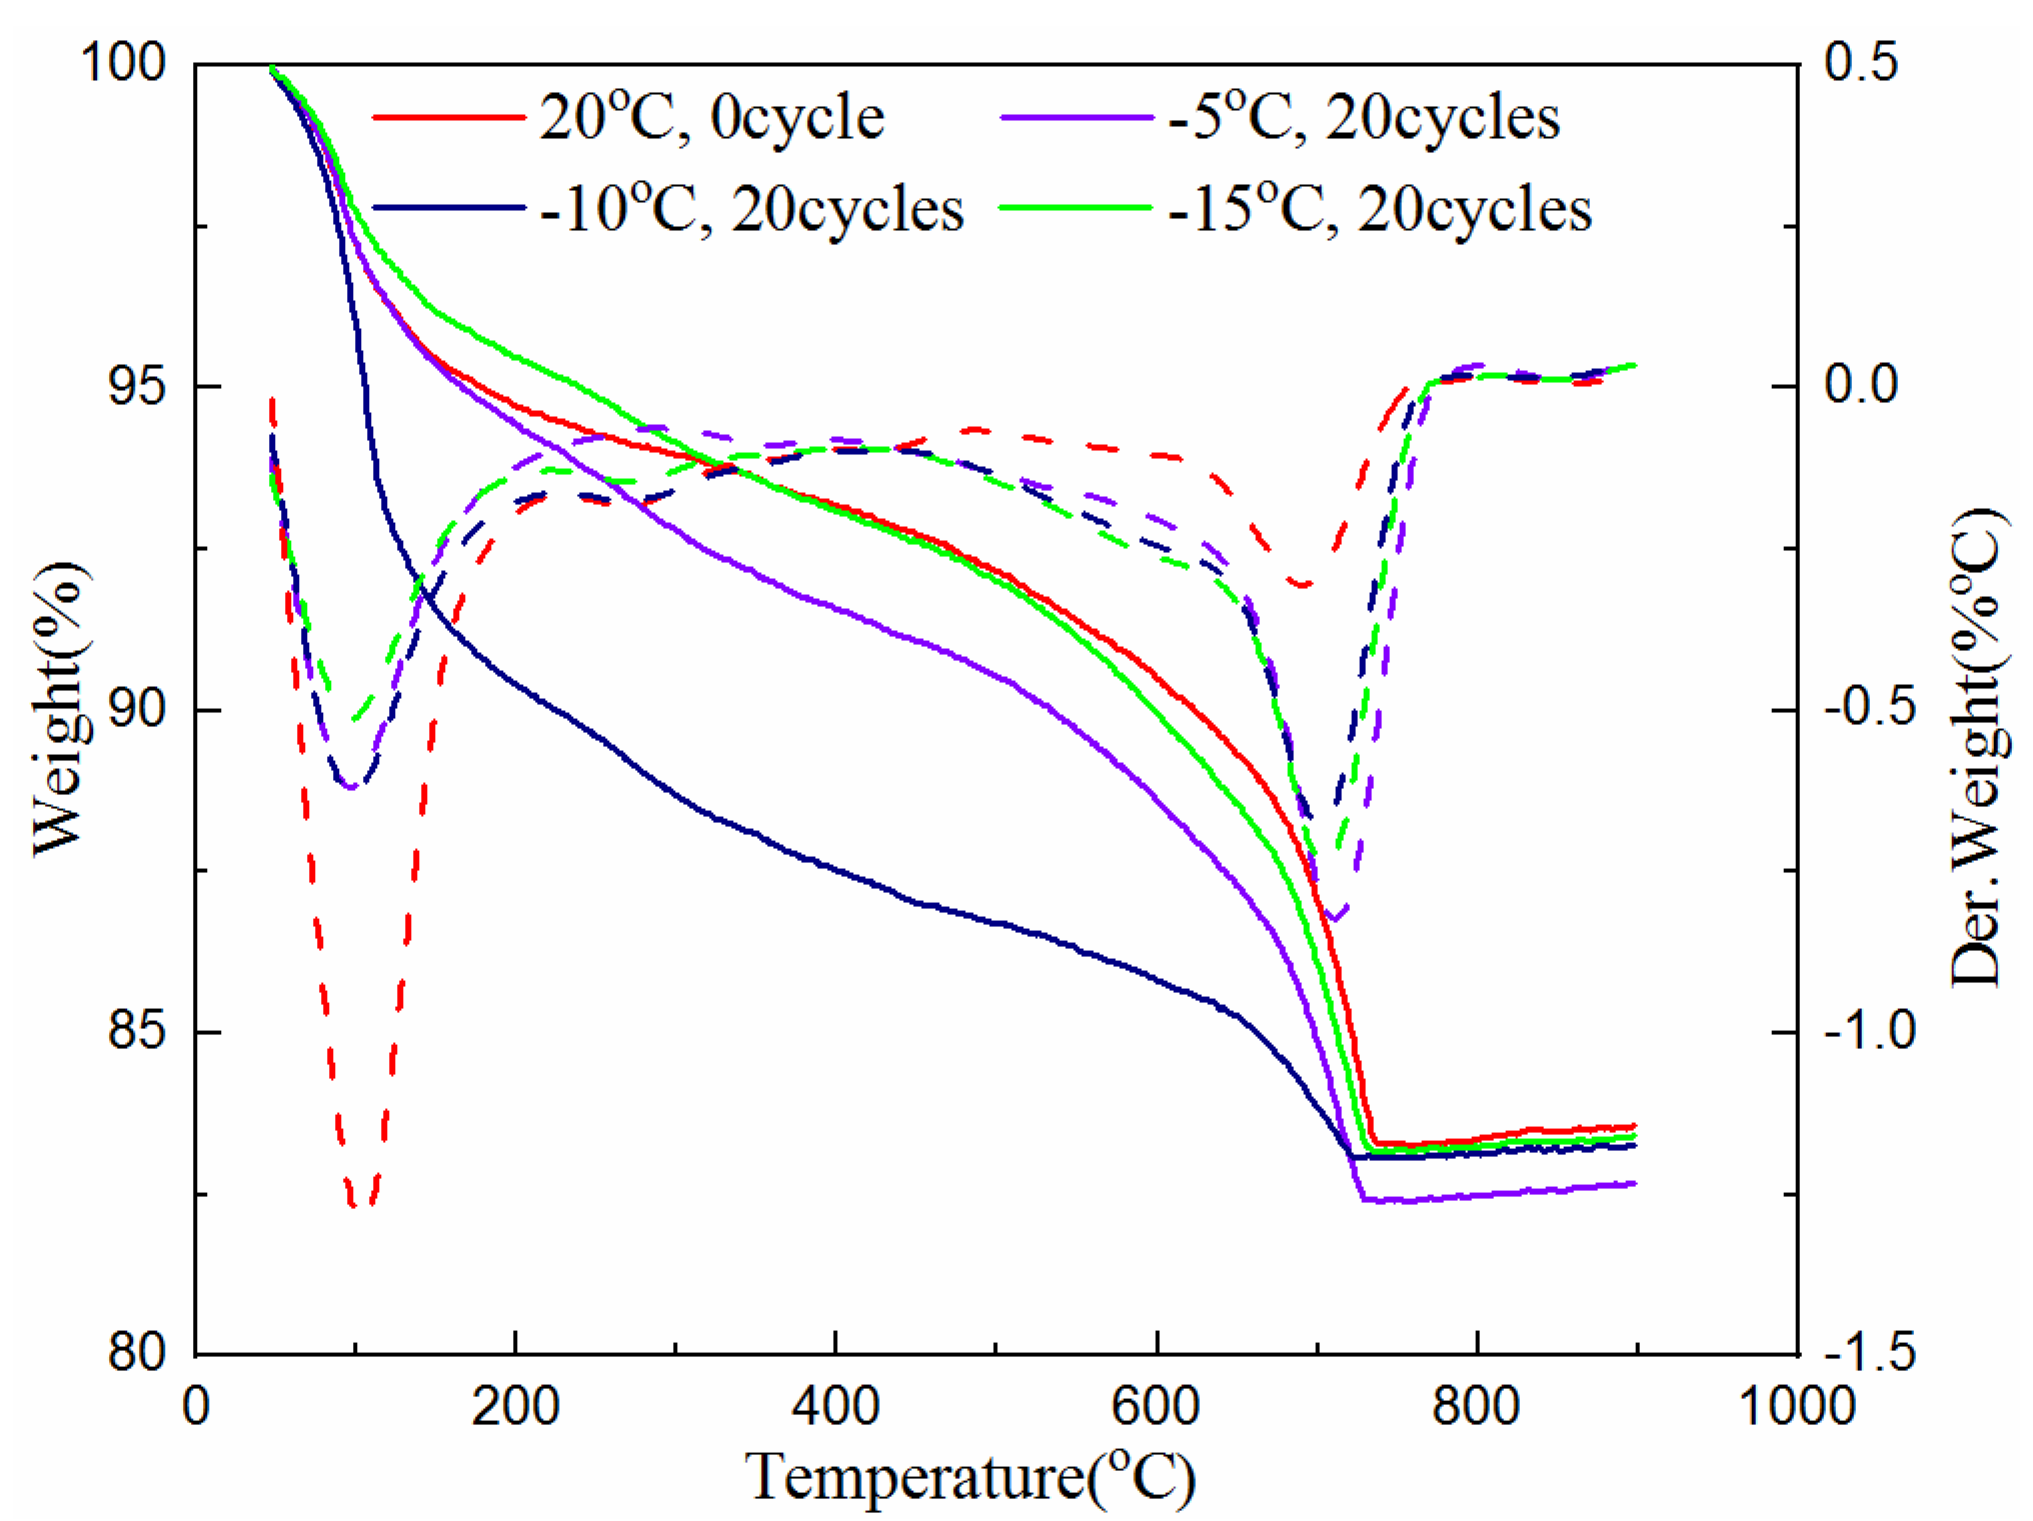
The TG analysis test was also used to determine the amount of hydration products of the samples cured for 7 and 28-days with 0 and 20 freeze–thaw cycles at the freezing temperature of −5 °C, −10 °C and −15 °C. The test data are plotted in Figure 5 and Figure 6. The solid line in the figures indicates the weight loss of the cementitious material with the increase of temperature, and the corresponding dotted line indicates its first differential, that is, the rate of mass loss, which corresponds to different types of materials at different heating temperatures. The value of the heating temperature valley is different for the amount of substance.
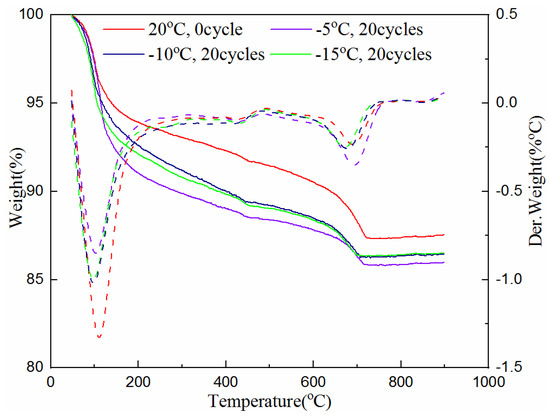
Figure 5.
Hydration product of samples at different freezing temperatures after 7-day curing.
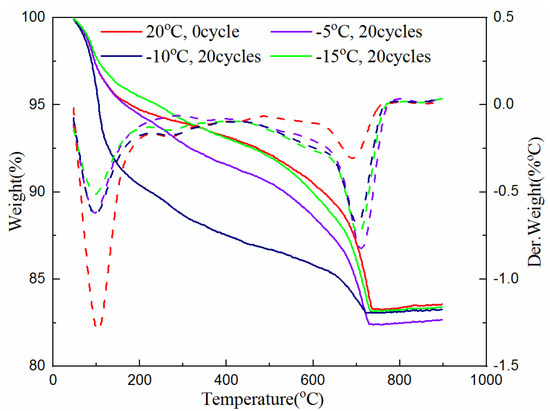
Figure 6.
Hydration product of samples at different freezing temperatures after 28-day curing.
As can be seen from Figure 5 and Figure 6, the troughs of the dotted lines in the temperature range of 50 °C to 800 °C represent the reduction of combined water, C-S-H gel, ettringite, calcium hydroxide and calcium carbonate. It can be seen from Figure 5, when the 7-day samples are subjected to unfrozen and 20 cycles of freeze–thaw at different freezing temperatures between 50 °C and 105 °C, the mass loss of the sample without freeze–thaw (i.e., 0 cycle) is large, while the samples experiencing 20 freeze–thaw cycles are relatively small. This shows that unfrozen samples contain more water, while the samples that experienced freeze–thaw cycles have less water due to the progress of the hydration reaction. It can also be seen that the sample with the freezing temperature of −5 °C has the most mass loss, indicating that the hydration reaction is more adequate at this temperature than that at the freezing temperature of −10 °C and −15 °C. The mass loss between 450 °C and 500 °C indicates the presence of calcium hydroxide. Though it is not clearly indicated, the curve of the unfrozen sample is relatively high. This proves the existence of hydration reactions during the freeze–thaw process again. The mass loss between 650–750 °C is due to the decomposition of calcium carbonate. The sample with 20 freeze–thaw cycles at the freezing temperature of −5 °C has the most mass loss, indicating that the hydration products produced after freezing and thawing at this temperature are the greatest. The reason is that the hydration reaction was still continuing during the freeze–thaw cycles, and the higher the freezing temperature is, the greater the degree of hydration reaction is.
Figure 6 shows that, at temperatures between 50 °C and 105 °C, the mass loss of the unfrozen sample is still the largest. However, compared with the 7-days sample, the difference in quality loss is not obvious. The reason is that the 7-day samples are rich in raw materials for hydration reaction, and the hydration reaction continues during the freezing and thawing process; while the raw material for hydration reaction in the 28-day samples has basically been consumed, and there is no difference before and after freeze–thaw cycles. Even between 450 °C and 500 °C, the decomposition of calcium hydroxide in the sample has not been seen. It can also be seen that the mass loss caused by the decomposition of calcium carbonate in the unfrozen samples between 650–750 °C is the smallest; while at the freezing temperature of −5 °C, the 20th freeze–thawed sample has the largest mass loss, but the difference is very small. In addition, the difference in the quality of the 28-day samples from the final remaining material is not as great as that of 7-day samples.
3.3. Surface Morphology Destroyed by Freeze–Thaw Cycles of the Samples
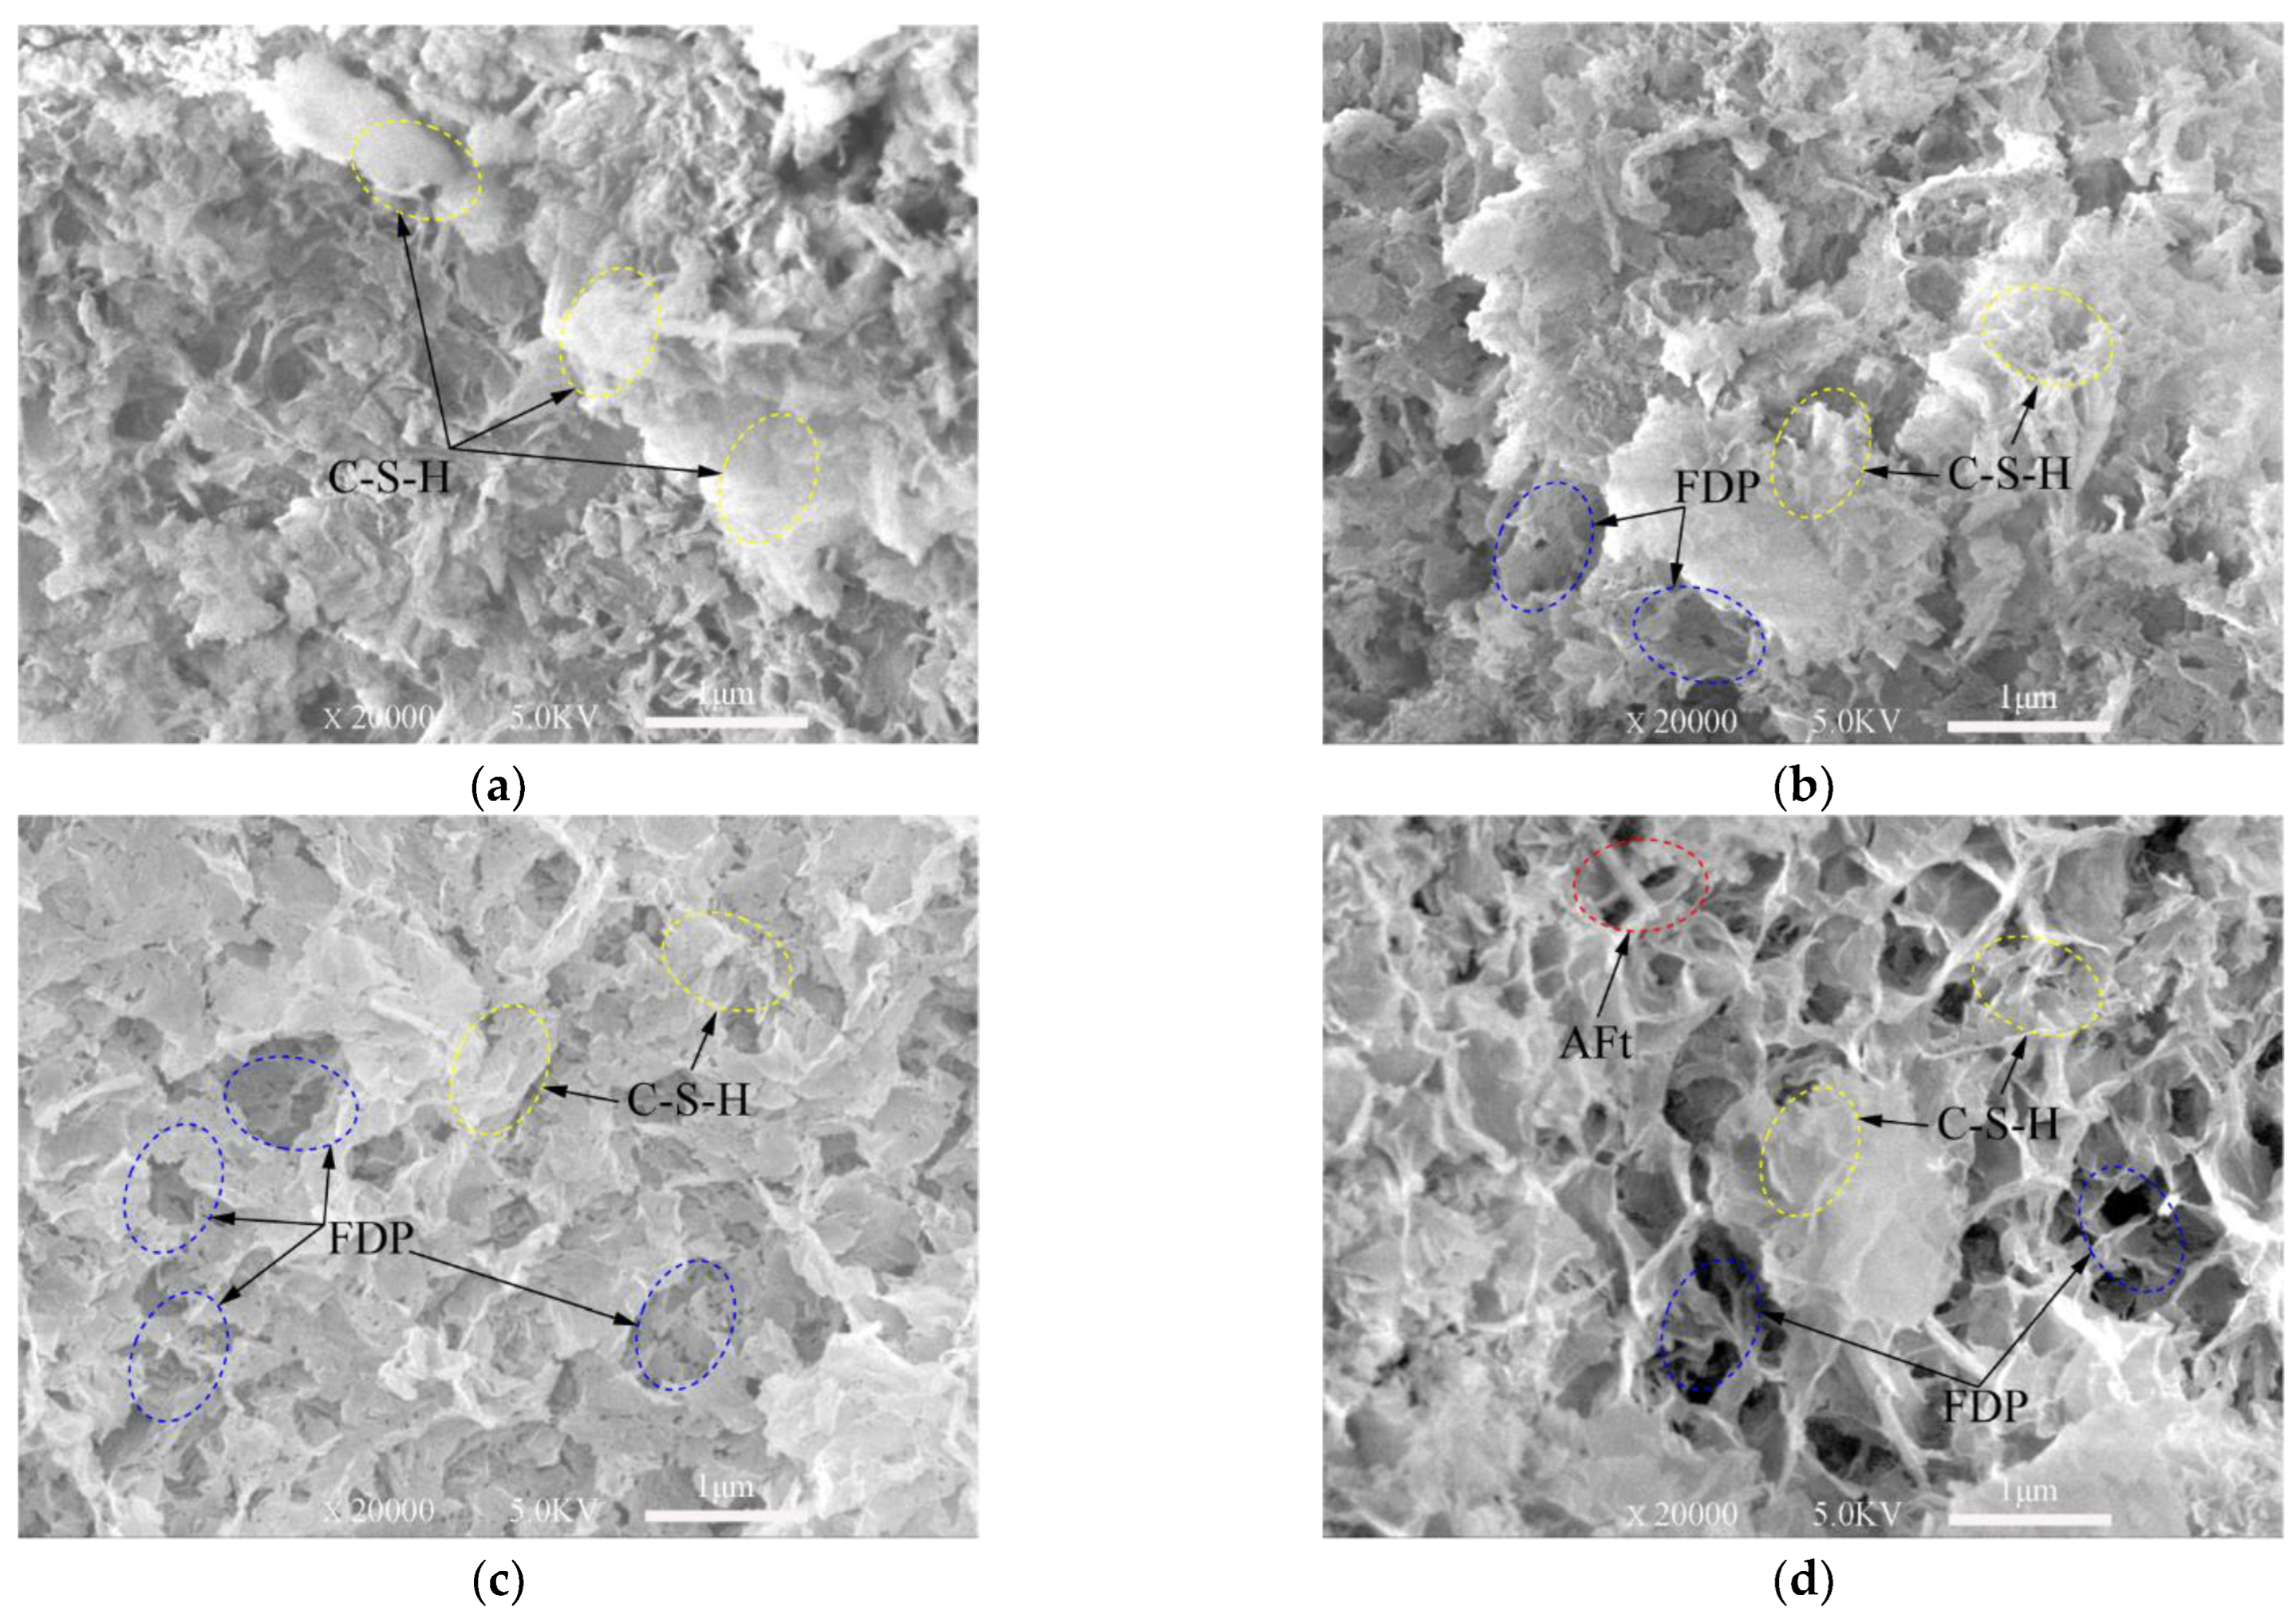
From SEM images presented in Figure 7, Figure 8 and Figure 9, ettringite crystal, C-S-H gels, capillary pores and freeze–thaw cycles damaged pores can be studied. Only the samples frozen at −10 °C are presented in this section.
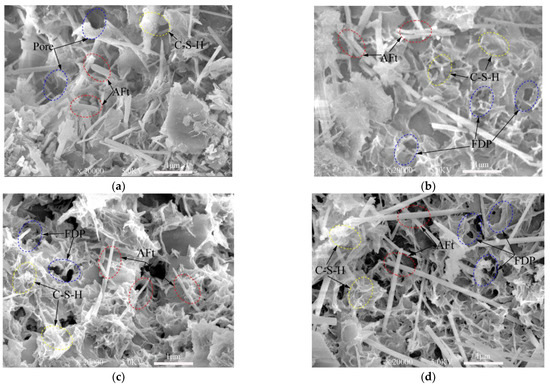
Figure 7.
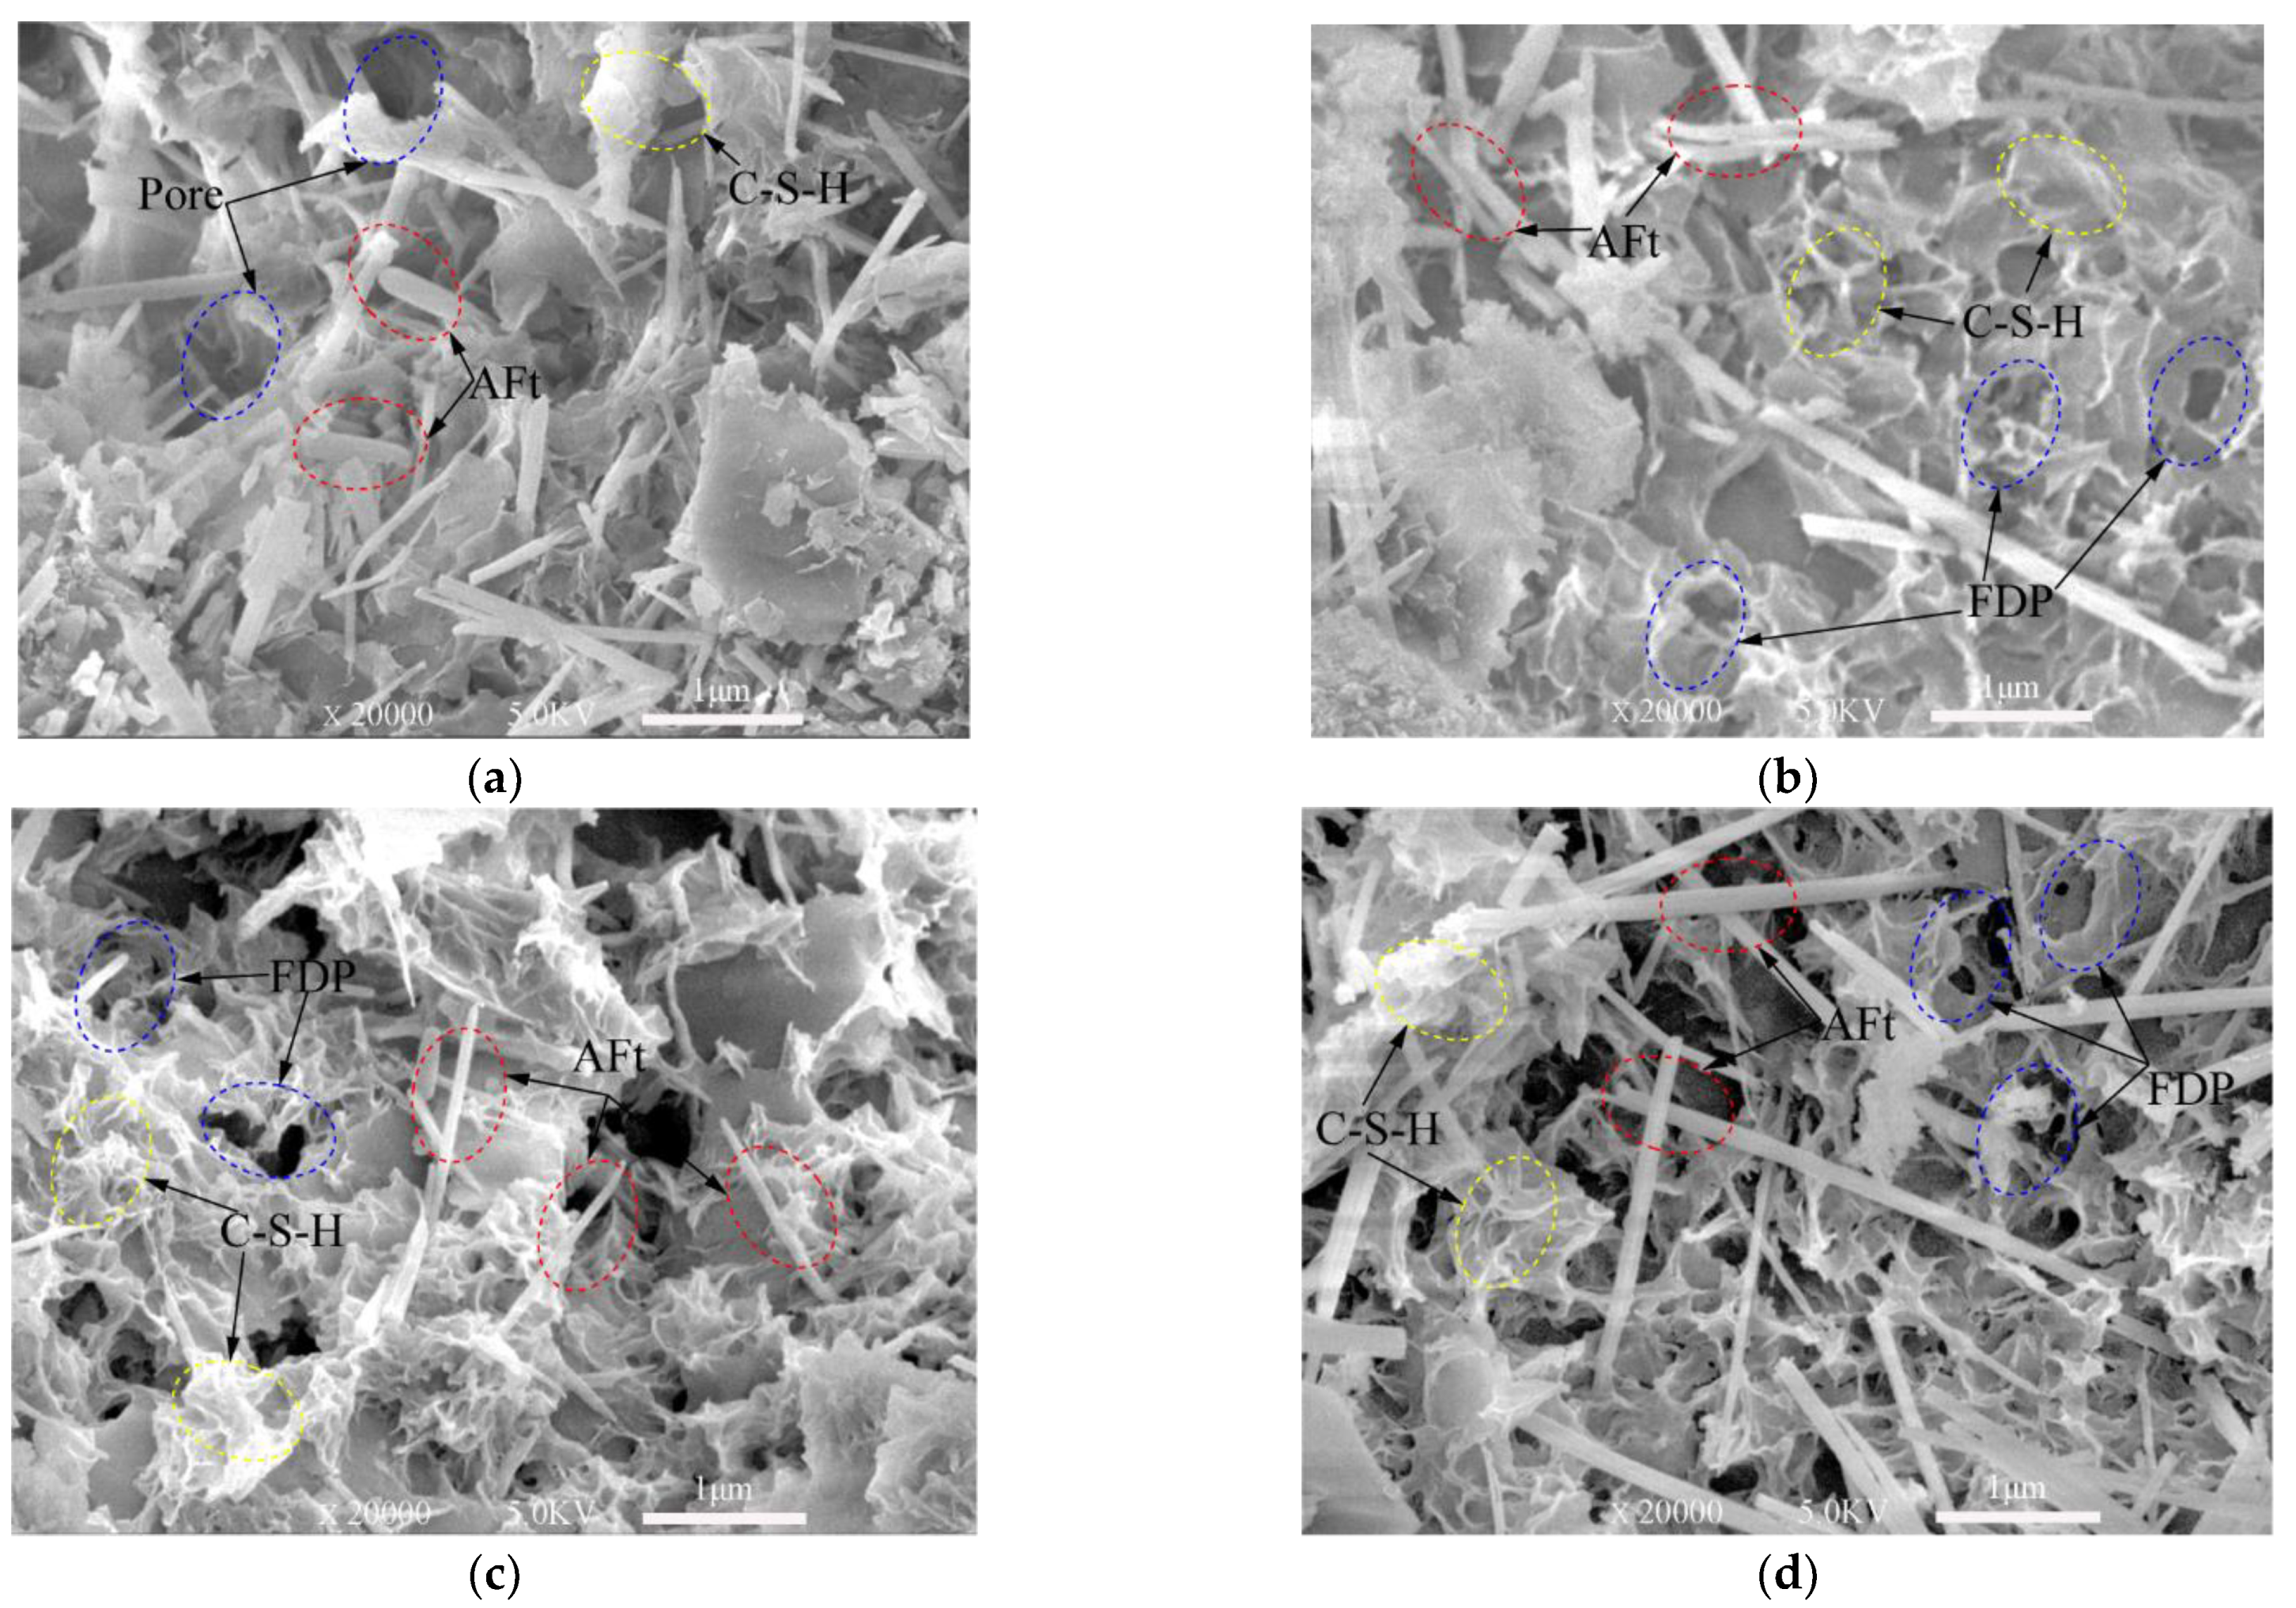
SEM images of 3-day samples under different freeze–thaw cycles. (a) Unfrozen; (b) After 5 freeze–thaw cycles; (c) After 10 freeze–thaw cycles; (d) After 20 freeze–thaw cycles.
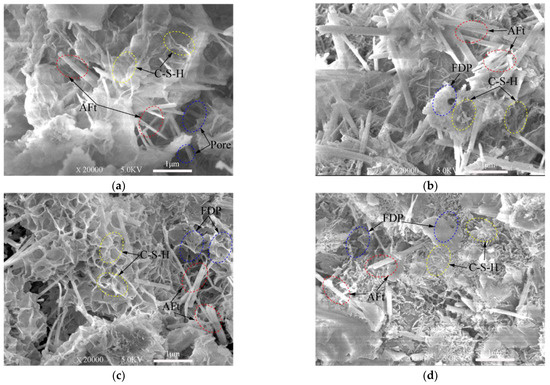
Figure 8.
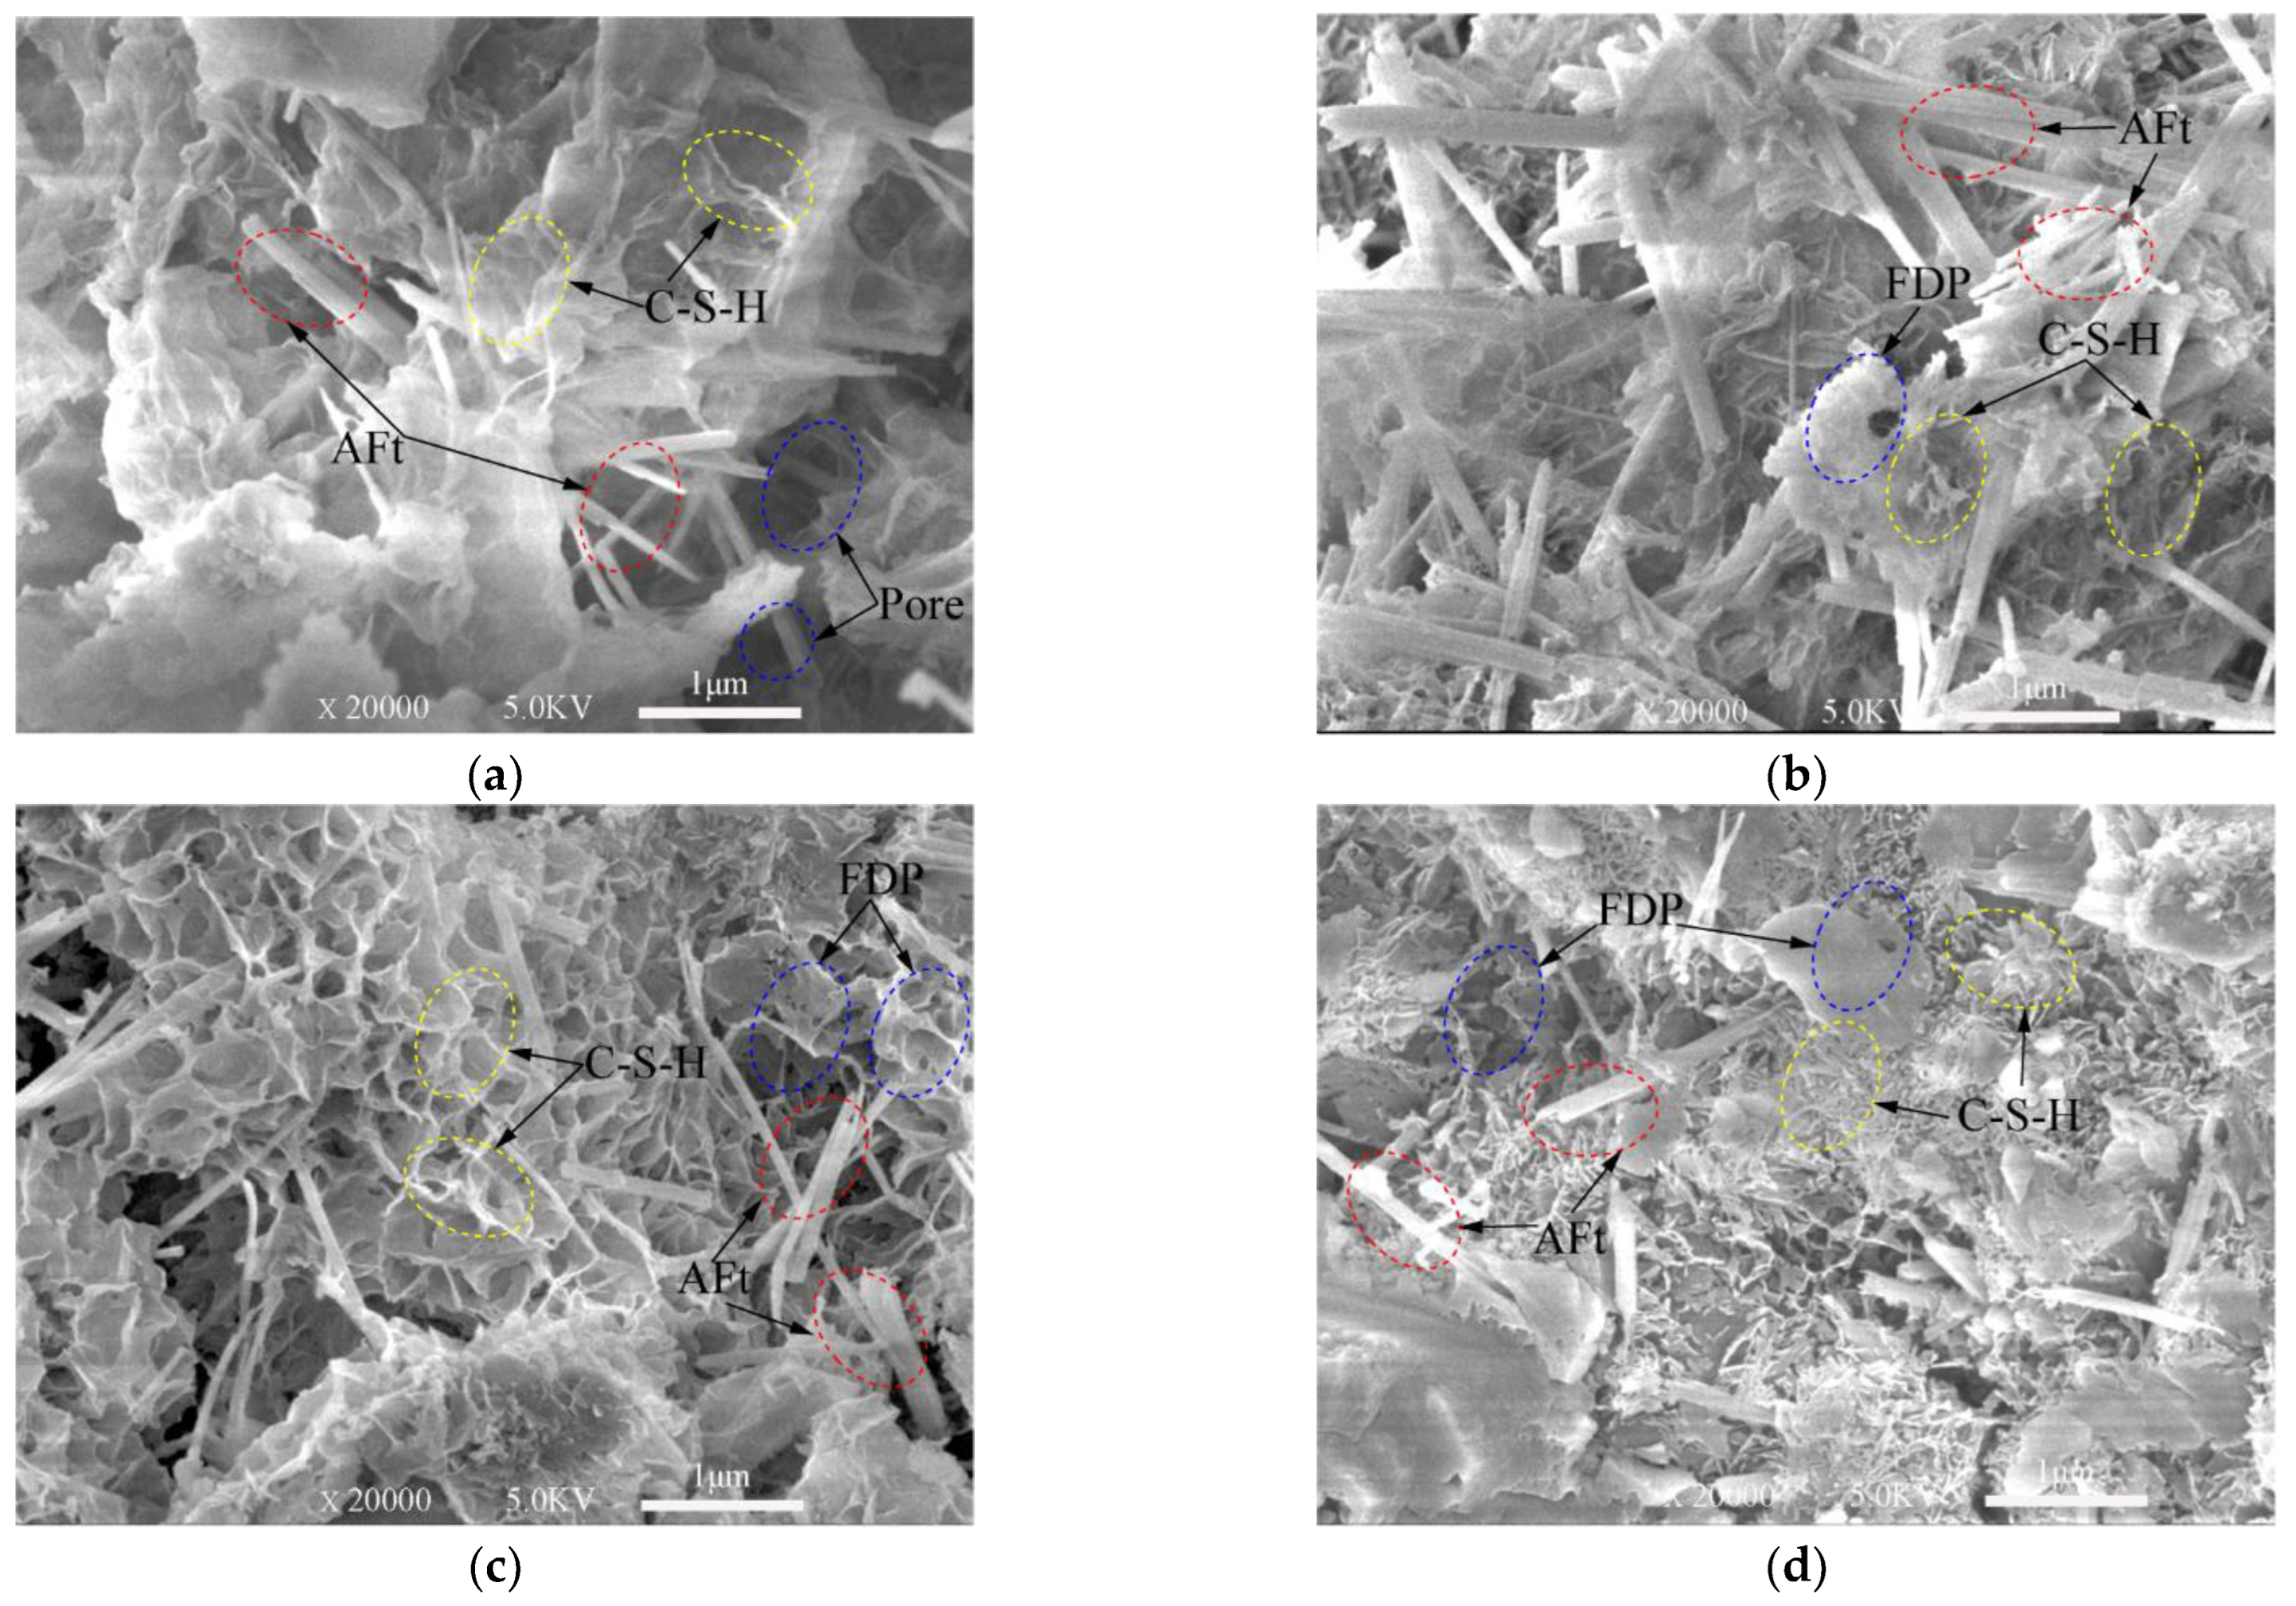
SEM images of 7-day samples under different freeze–thaw cycles. (a) Unfrozen; (b) After 5 freeze–thaw cycles; (c) After 10 freeze–thaw cycles; (d) After 20 freeze–thaw cycles.

Figure 9.
SEM images of 28-day samples under different freeze–thaw cycles. (a) Unfrozen; (b) After 5 freeze–thaw cycles; (c) After 10 freeze–thaw cycles; (d) After 20 freeze–thaw cycles.
Note: Aft (Ettringite crystal); C-S-H (calcium silicate hydrate); FDP: freeze–thaw cycles damaged pores.
The XRD test (Figure 3 and Figure 4) shows the hydration products of the cementitious material elements, such as Ca, Al, O, Si, S, etc. According to the knowledge of mineralogy crystal morphology analysis [47], ettringite is needle-like and calcium silicate hydrate is gel-like. These morphological features are very obvious in the SEM test images. These topographic features are very obvious in the SEM test images of Figure 7, Figure 8 and Figure 9. Figure 7a, Figure 8a and Figure 9a show SEM images of the 3-, 7- and 28-day samples, respectively. It can be seen that as the curing time increases, more and more C-S-H gels are produced and ettringites are surrounded by C-S-H gels. Obviously, only C-S-H gels can be seen on the surface for the 28-day samples. The dense internal structure of the hydration products makes the UCS values of the 28-day samples higher than those 3- and 7-day samples.
Figure 7 shows the SEM images of the samples cured for three days and then subjected to 0, 5, 10, 20 freeze–thaw cycles. Plenty of needle-like ettringites are observed in the matrix of the cement-based material in Figure 7a. Broken short columnar ettringite crystals due to the freeze–thaw damage can be observed in the pores in Figure 7b. In Figure 7c,d, needle-like crystals and C-S-H gels can be seen around the pores. However, it is obvious that there are a lot of pores on the surface of the gels, which are caused by the expansion of water converting to ice during the freeze–thaw cycles. Voids in the sample in Figure 7d increase compared with those in Figure 7b,c, indicating that the deterioration extent of the samples increases as the number of freeze–thaw cycles increases. It can also be seen from Figure 7b–d that, as the freeze–thaw cycles increased, proper and clear C–S–H gels in the samples still exist, even though they are damaged by the freeze–thaw cycles.
Figure 8 and Figure 9 show the SEM images of the samples subjected to 0, 5, 10, 20 freeze–thaw cycles after cured for 7-days and 28-days. These images demonstrate that the hardened samples are perhaps more able to withstand freeze–thaw cycles. Highly saturated fresh samples may be severely damaged by a few cycles. The saturated water in the pores can freeze during cooling process. This difference will become clearer when comparing Figure 7 with Figure 9. There are more pores damaged by freeze–thaw cycles in the 3-day samples.
Figure 7d, Figure 8d and Figure 9d show that the defects are mostly micro-voids after experiencing 20 freeze–thaw cycles. However, in most cases, the degradation by freeze–thaw cycles is characterized by the gradual formation of microcracks in the samples. In the freezing process, water is redistributed throughout the mix by moving to the colder areas. If freezing is rapid, water has little chance to move towards the colder areas, thus creating a nearly uniform distribution of ice crystals. However, these crystals can still damage the immature cement-based material and weaken the bonds between the cement-based materials.
From the analysis above, the samples with short curing time continues to hydrate in the freeze–thaw cycles. As the number of freeze–thaw cycles increase, the amount of hydration products increases. There are many pores inside the samples, which slows down the damage caused by the expansion of the ice crystal. Thus, the influence of the hydration reaction on the samples at this stage is dominant. However, since the amount of final hydration product is only related to the cementitious material, slurry concentration and lime-sand ratio (although affected by temperature), the degree of hydration reaction is gradually smaller but maintained as the freeze–thaw cycle progresses. At a certain curing time, the effect of the freeze–thaw cycles on the samples plays a major role, which is manifested microscopically as the degree of deterioration increases with the number of freeze–thaw cycles. Macroscopically, the UCS of the samples is lower when the degree of microscopical damage is high.
3.4. Pore Size Distribution of the Samples
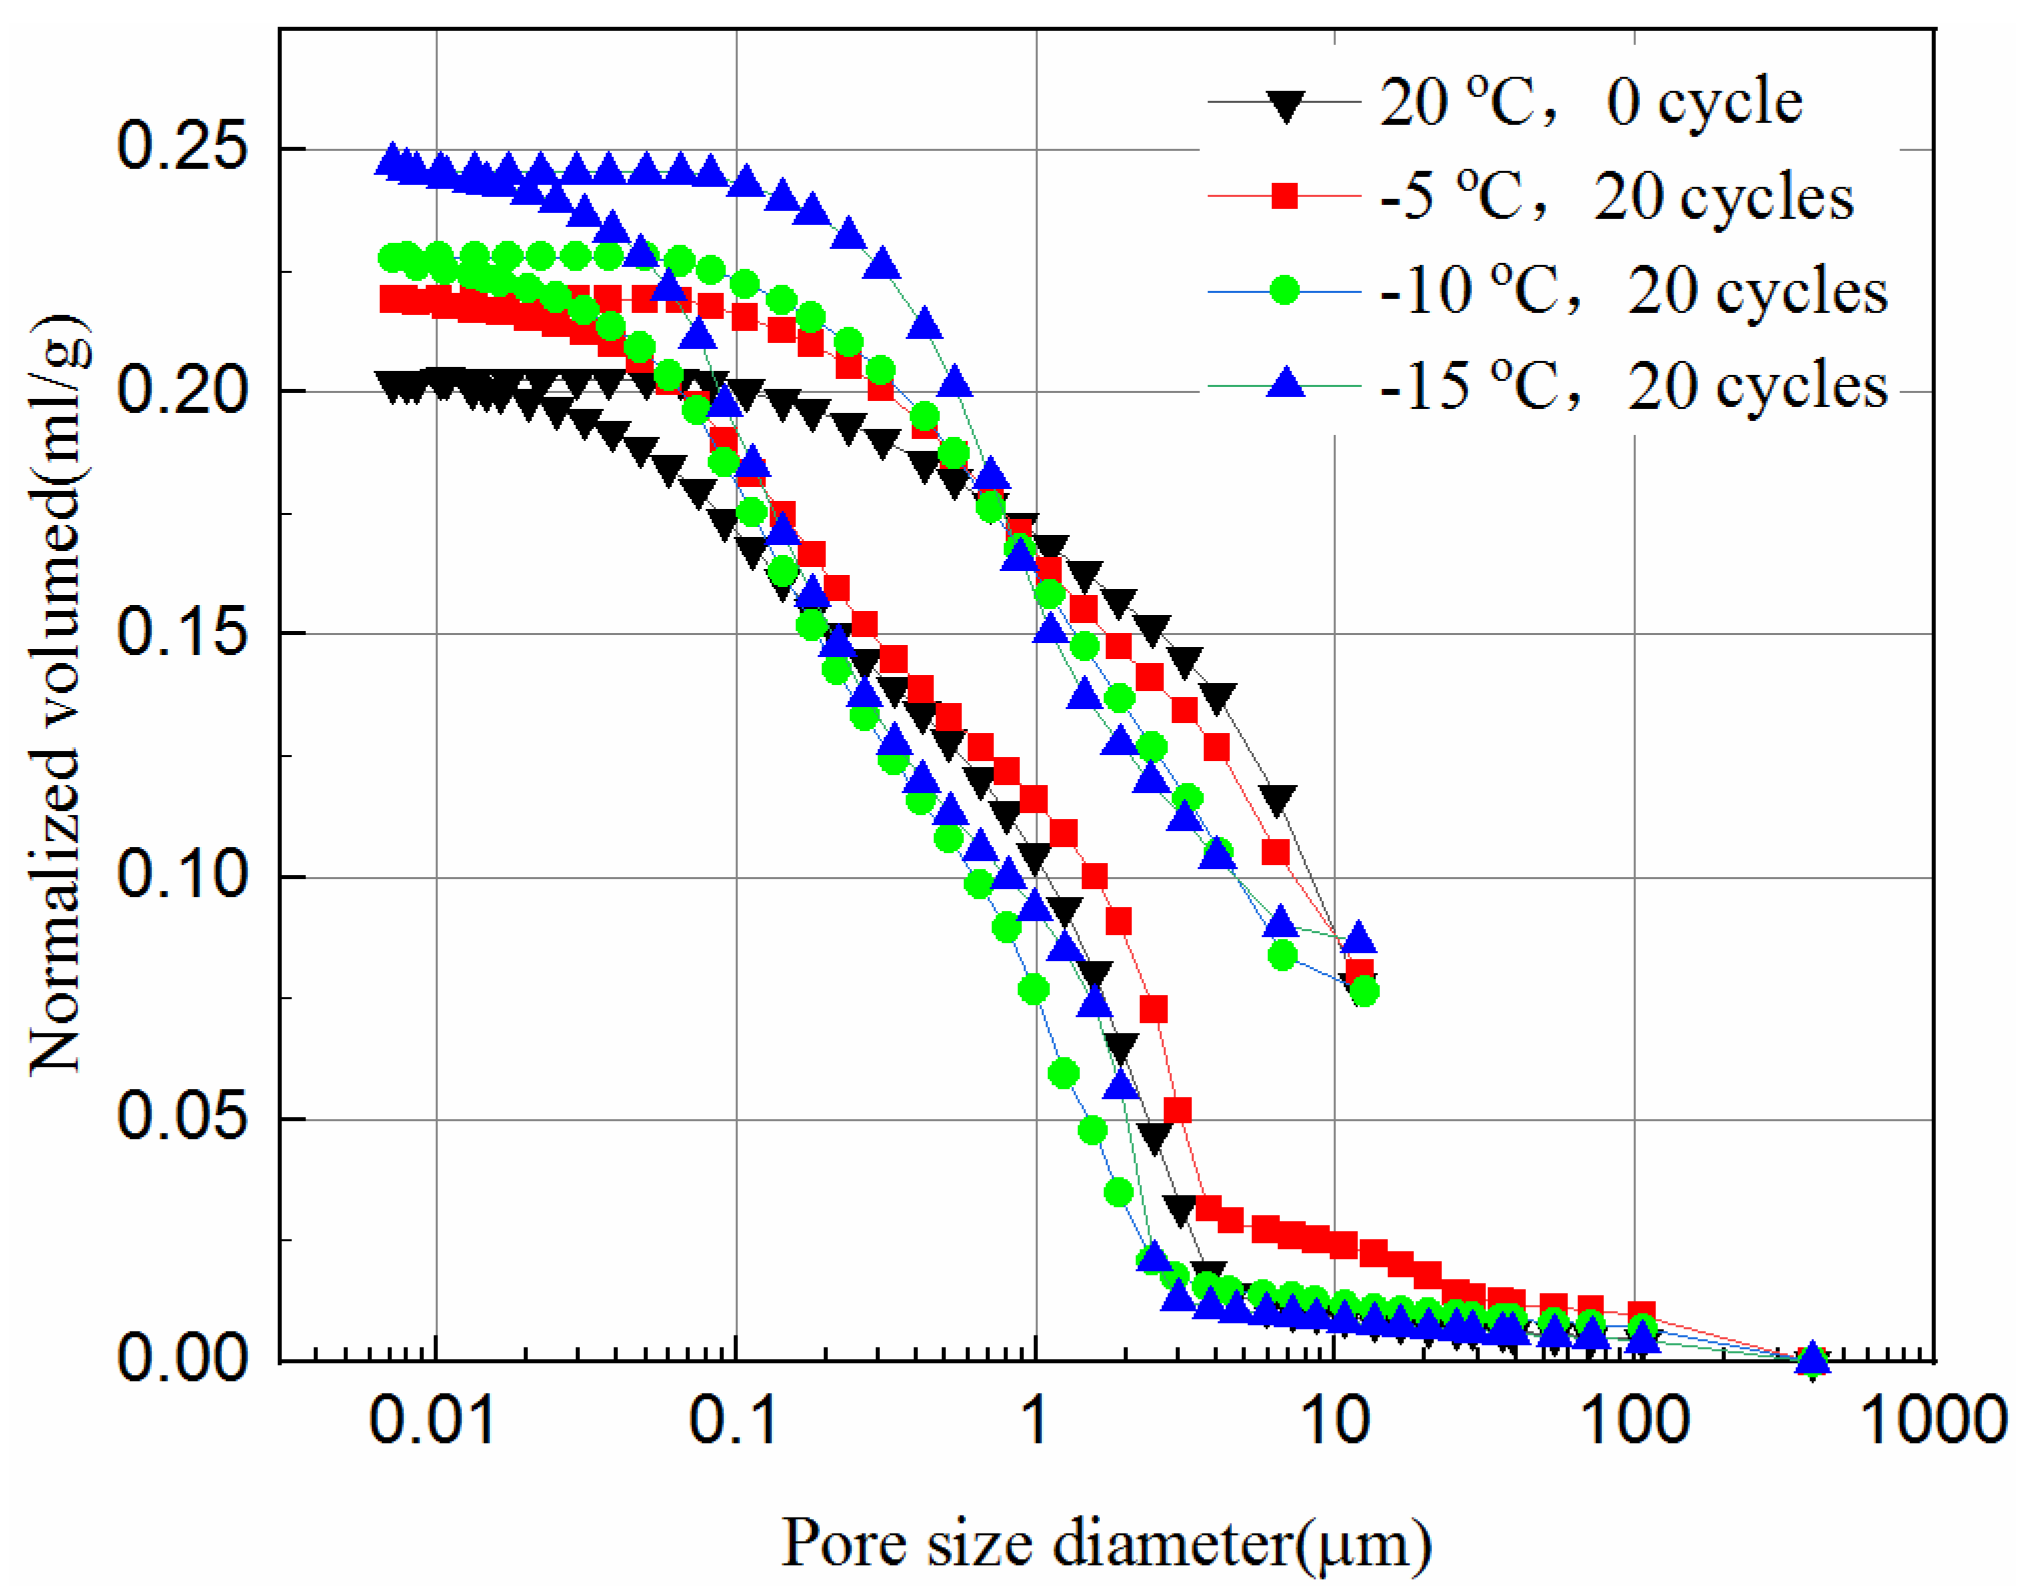
The MIP tests were carried out to study the effect of the freeze–thaw cycles on the pore size distribution of the tailings. In this study, the samples with 20 freeze–thaw cycles after cured for 7- and 28-days are chosen. The normalized volume from the MIP tests versus the pore diameter of the samples is plotted in Figure 10 and Figure 11. The normalized volume curves show the variations of the mercury volume with the different pore sizes. From Equation (1), the intrusion pressure is inversely related to the pore diameter. In the intrusion process, the total mercury intrusion volume increases with the increase of intrusion pressure.
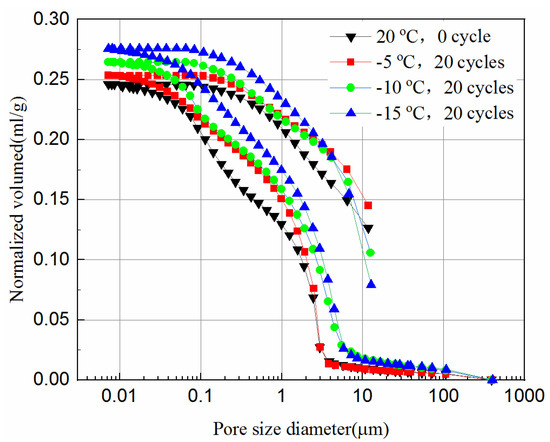
Figure 10.
Intrusion and extrusion curves of 7-day samples at different cooling temperature.
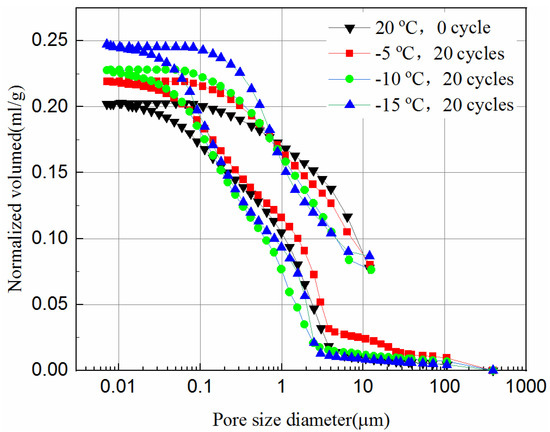
Figure 11.
Intrusion and extrusion curves of 28-day samples at different cooling temperature.
It can be seen from Figure 10 and Figure 11 that during the initial increase of external pressure, whether the samples were cured for 7-days or 28-days, the curves show similar trends. The intrusive volume of mercury increases slowly with the decrease of pore size, and the mercury mainly fills the gaps with larger diameters at this stage. For 7-day samples, the mercury mainly fills pores larger than 8.6 μm, but 2.8 μm for 28-day samples. It appears that tailing particles are redistributed to adapt to external pressure change during this process. The cumulative intrusive volume of mercury in the 7-day samples increases rapidly when the pore size is less than 2.5 μm. The cumulative intrusive volume of mercury in the 28-day samples increases rapidly when the pore size is less than 1.9 μm. This phenomenon indicates that there is a bottleneck effect during the invasion phase, and the external pressure forces the tailing particles to redistribute. After the mercury intrusion volume passes the bottleneck period, it will increase to a large value under a small pressure. This bottleneck period is the pressure required for the mercury liquid to destroy the pore wall. It can be seen that the starting point of the rapid increase in the volume of invaded mercury at different curing ages is different, and the starting points of the samples that were unfrozen and experienced 20 freeze–thaw cycles in the same curing time are similar. This shows that the curing time has a great impact on the development of pores, and the damage of freeze–thaw cycles to the pores may have a great impact at the micropore stage. However, even when the external pressure reaches the maximum value set by the instrument, it is still difficult for mercury to enter the smallest pores and closed pores. Thus, the mercury intrusion curve eventually tends to be moderate. The exit curve of mercury cannot return to the starting point because some mercury remains in the narrow pores, resulting in the exit of mercury less than the intrusion.
Comparing Figure 11 with Figure 10, the volume of mercury intrusion is reduced by 17.5%, 13.8%, 13.6%, 11.1% for samples after 20 freeze–thaw cycles at −5 °C, −10 °C, and −15 °C, respectively. The main reason for the decrease of mercury intrusion volume is that, as the curing time increases, the hydration products gradually accumulate and fill in the pores between the solid particles to make the internal structure more compact, which is supported from the UCS tests and the SEM tests. The hydration reaction of the 28-day samples has been completed, but the 7-day samples still have hydration reactions in the process of freeze–thaw cycles. The higher the freezing temperature are, the shorter the time needed to rise above zero, leading to longer hydration reaction time, and more hydration products in one freeze–thaw cycle. Likewise, the higher the freezing temperature is, the higher the reduction is in mercury intrusion volume. In Figure 10, for 7-day samples, the pore volume after 20 freeze–thaw cycles at freezing temperatures of −5 °C, −10 °C, and −15 °C is 3.1%, 7.6%, and 12.3% higher than that of unfrozen samples, respectively. In Figure 11, for 28-day samples, the pore volume after 20 freeze–thaw cycles at freezing temperatures of −5 °C, −10 °C, and −15 °C is 8.1%, 12.5%, and 21.1% higher than that of unfrozen samples, respectively. This observation is consistent with the UCS results of Figure 2c and it indicates that the porosity has a significant influence on the UCS of samples. It proves that the freeze–thaw cycles assist the pore development of the samples. The lower the temperature is, the more pore development there is. The increase in the pore volume of the 28-day samples is larger than that of the 7-day samples. This is because the hydration reaction of the 28-day samples is completed, while for the 7-day samples hydration continues, which slows down the development of pore volume to some extent.
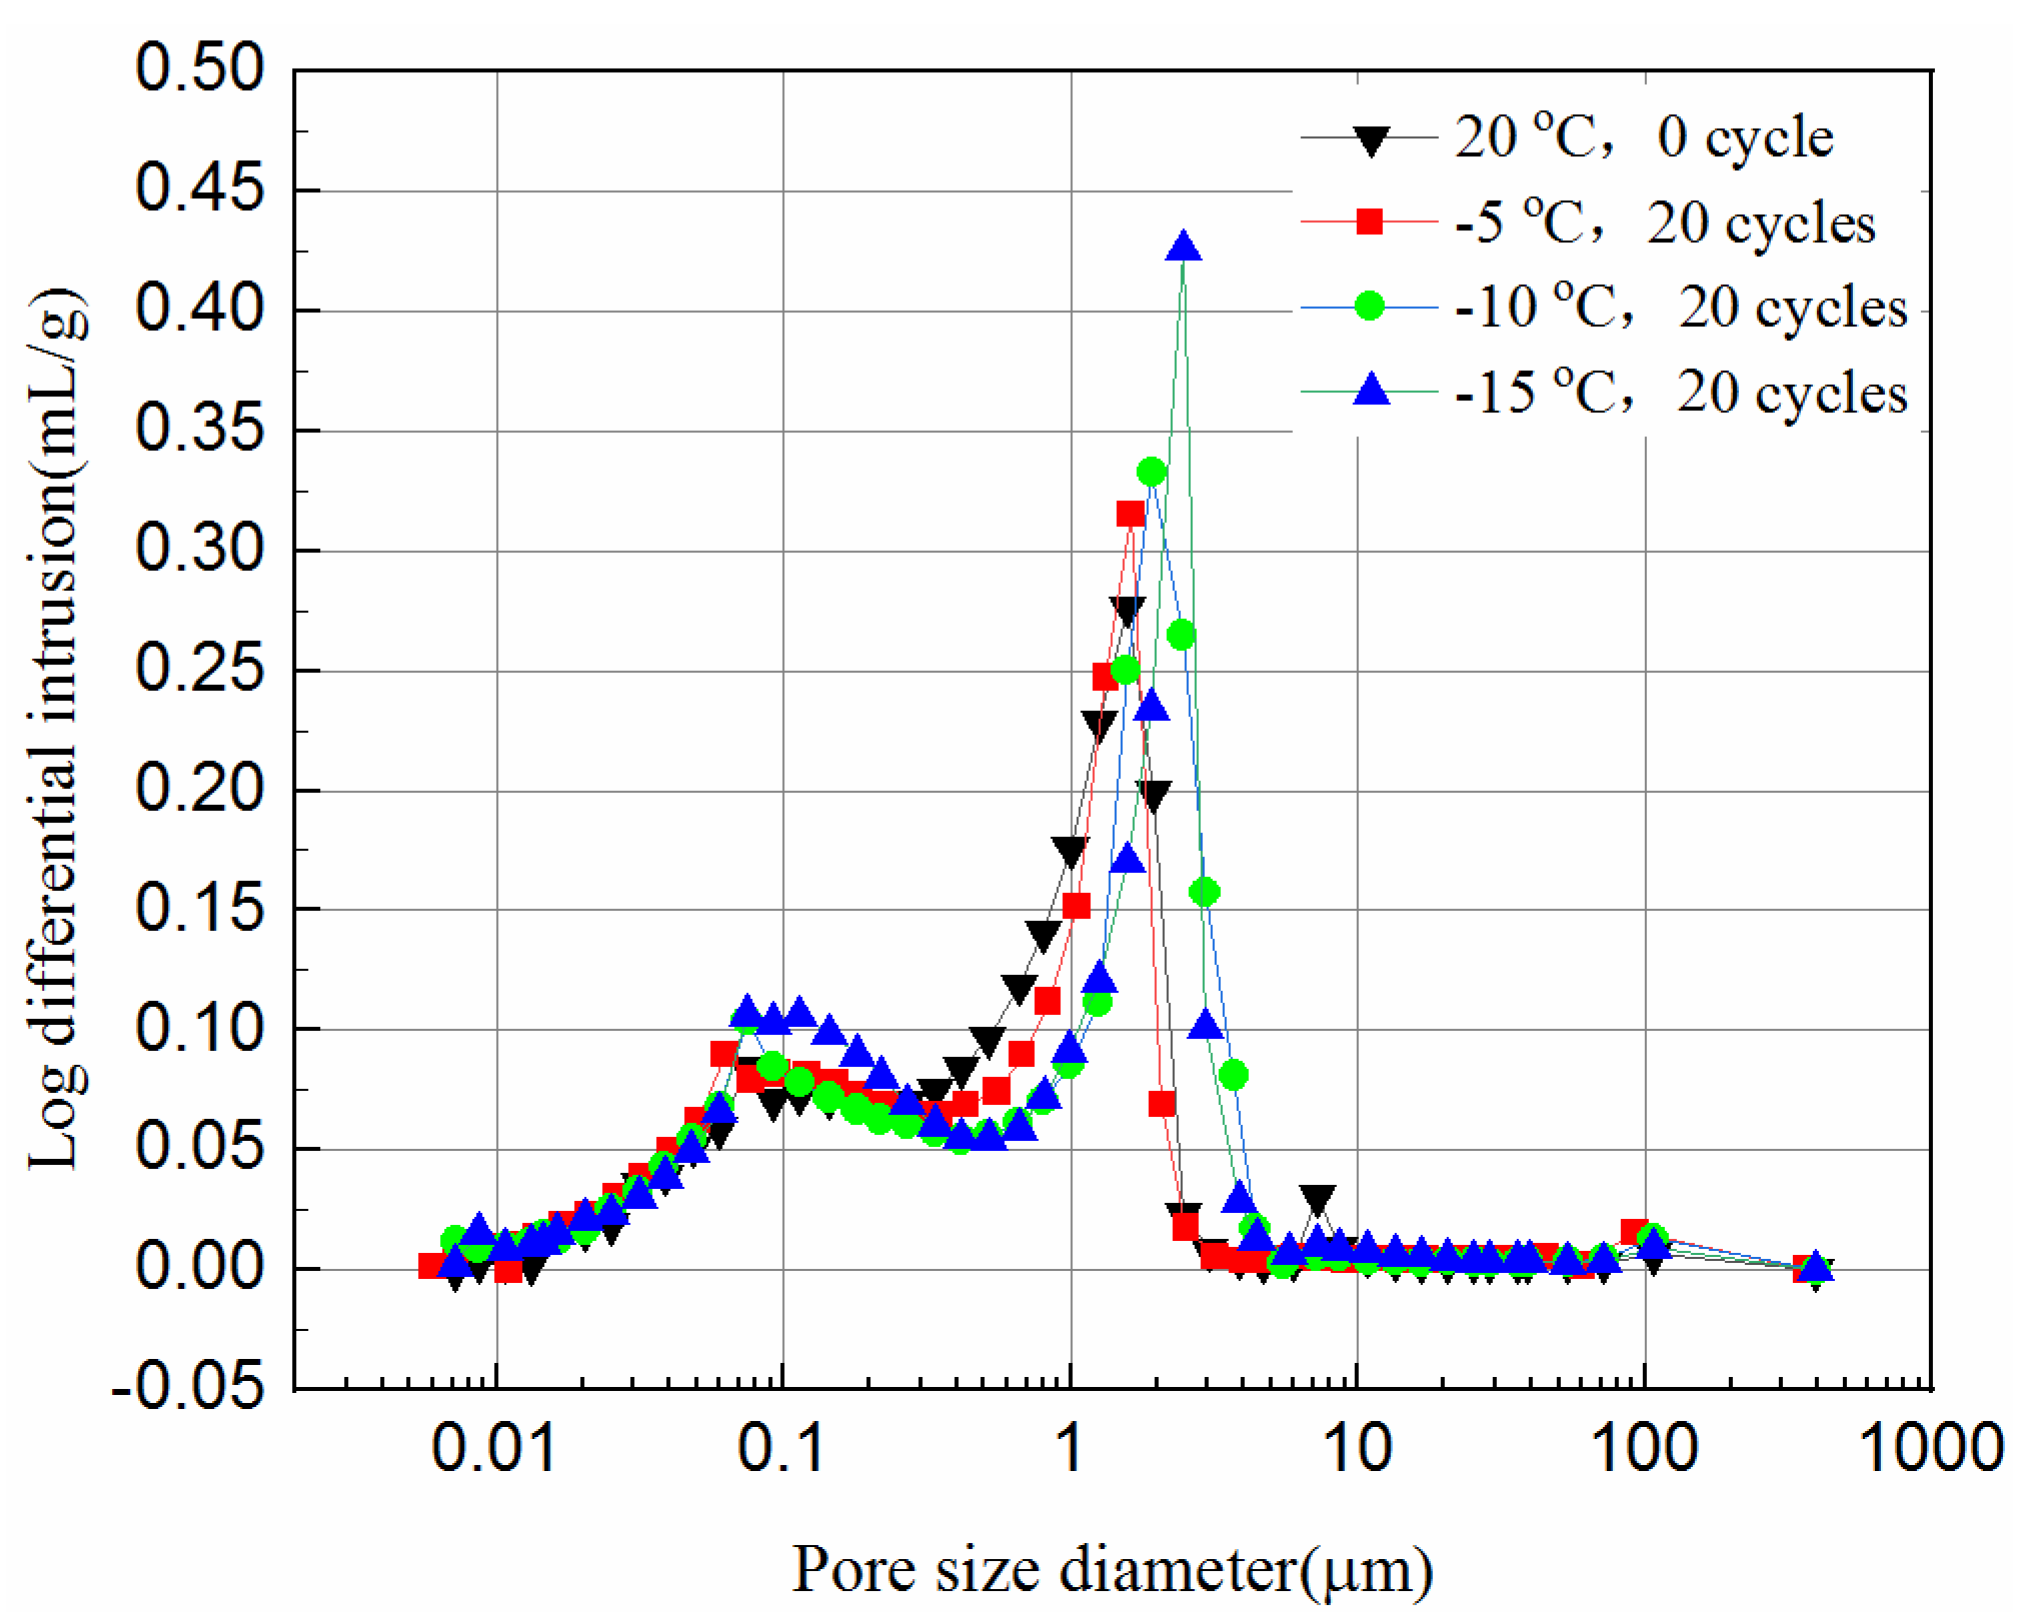
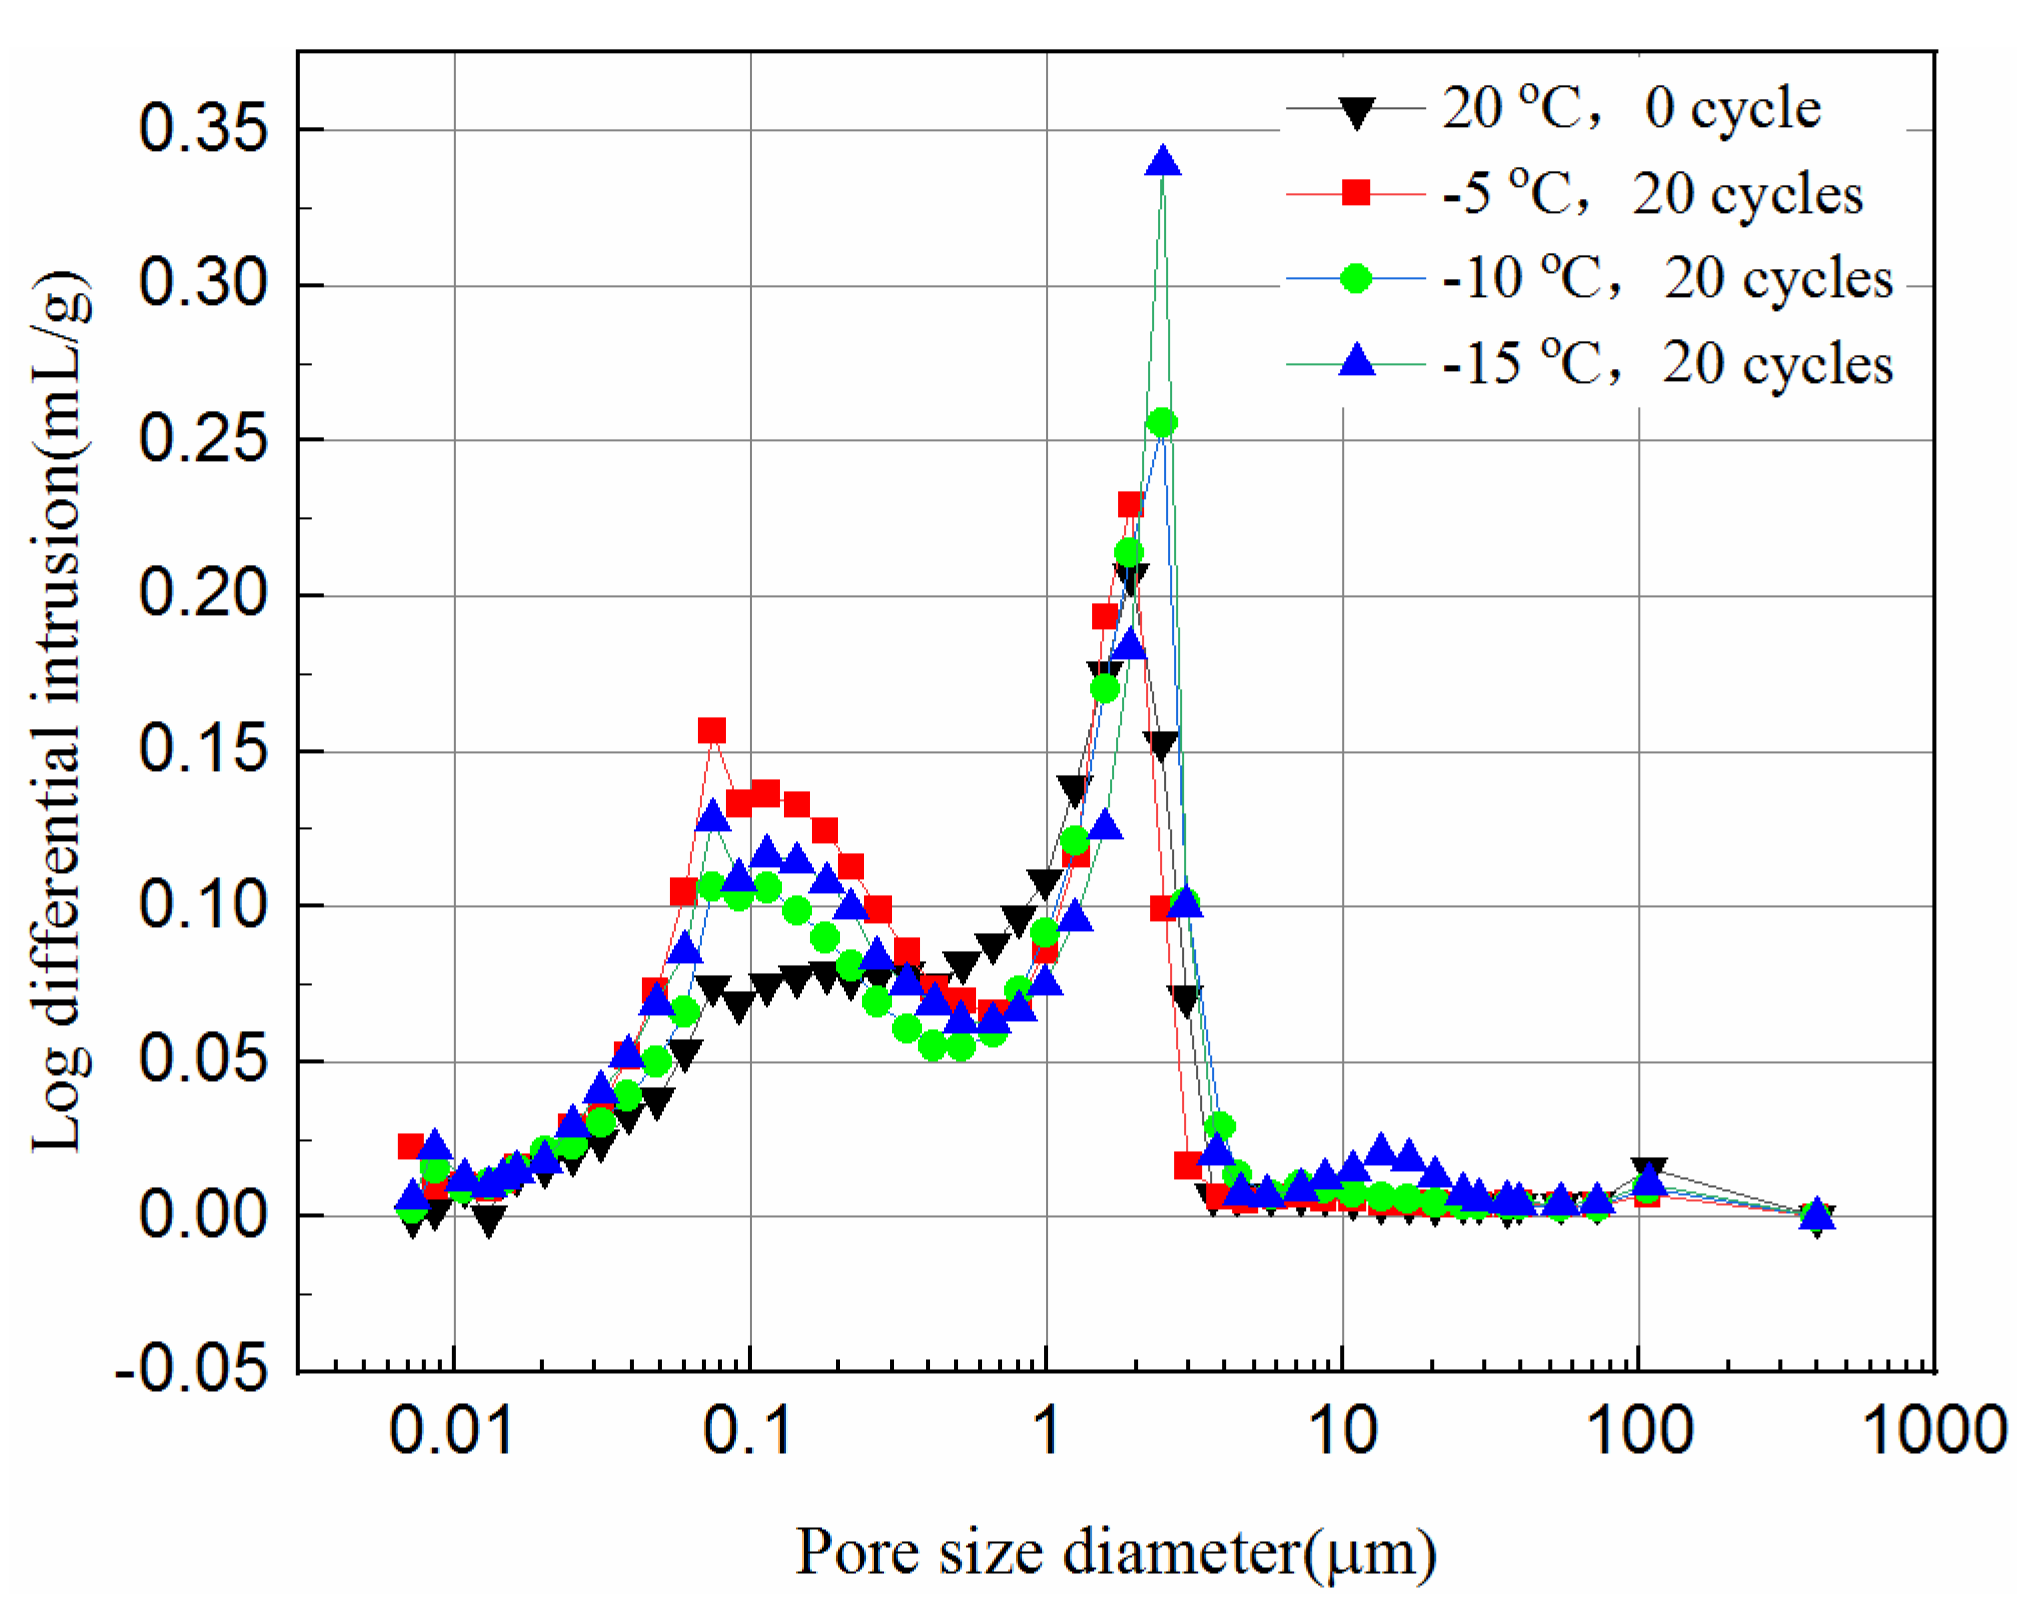
Figure 12 and Figure 13 present the log-differential mercury volume curves of samples at different cooling temperatures after 20 freeze–thaw cycles for both 7-day and 28-day curing times.
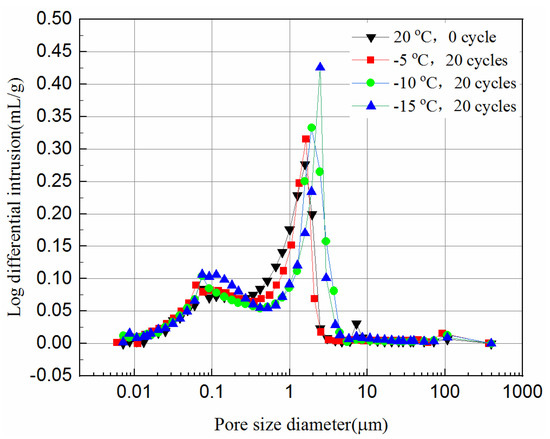
Figure 12.
Log-differential pore volume curves of 7-day samples at different cooling temperature.

Figure 13.
Log-differential pore volume curves of 28-day samples at different cooling temperature.
The variation of the log-differential mercury volume is the pore size distribution of the samples, where the abscissa values of the peak points are called the most probable pore sizes. It shows that the pores with the same sizes appear most within the samples. For these samples, the log-differential pore volume curves are mainly in the pore diameter ranging from 0.8 μm to 3.8 μm. In Figure 12, the most probable pore diameters of the 7-day samples frozen at −5 °C, −10 °C, −15 °C are 1.93 μm, 2.47 μm and 2.48 μm, respectively, after 20 freeze–thaw cycles, and increase by 0.7%, 21.9%, 29.1%, respectively, compared to the unfrozen samples. Figure 13 shows the most probable pore diameters of the 28-day samples frozen at −5 °C, −10 °C, −15oC are 1.62 μm, 1.91 μm and 2.47 μm, respectively, after 20 freeze–thaw cycles, increasing by 3.3%, 28.8% and 39.2%, respectively, compared to the unfrozen samples. The results show that whether the samples are cured for 7-days or 28-days, after freezing and thawing cycles, the most probable pore size is increasing, and the lower the freezing temperature is, the more probable the pore size increases, which indicates that the freezing temperature has a greater effect on samples. It also suggests that the freezing temperature has a significant effect on the micropores of the samples, which in turn affects the UCS of the samples.
4. Conclusions
In this paper, a comprehensive experiment was developed to investigate the impact of freeze–thaw cycles on the mechanical strength of the tailings reinforced with cement-based materials to mitigate environmental hazards and achieve sustainable production. Based on the test results and their analysis, the following conclusions can be reached:
- (1)
- Freeze–thaw has a positive effect on UCS of tailings samples in the first three cycles for short curing times of 3- and 7-days but has a negative effect on the UCS for a normal curing time of 28-days under all freeze–thaw cycles. The frozen temperature has slight effect on UCS reduction for short curing time but has little effect for normal curing time.
- (2)
- The larger the number of freeze–thaw cycles are, the more damage there is to the surface morphology and the matrix of the tailings, and the more severe the surface morphology damage is, the lower the UCS of the samples is.
- (3)
- The freeze–thaw cycles have no effect on phases of the hydration products. The higher the freezing temperature is, the greater the amount of hydration products. Fuller hydration would result in a higher UCS of the samples.
- (4)
- The mercury intrusion pressure is inversely related to the pore diameter of the samples. The lower the freezing temperature is the more mercury ingresses, and the most probable pore sizes increase after the freeze–thaw cycles, which in turn reduces the UCS of the samples.
From the results, we know freeze–thaw cycles have a significant impact on cemented tailings. In the application of real TSF embankment, when the ambient temperature drops to a certain value, we can consider taking thermal insulation measures for the TSF or increasing the amount of cementitious material to promote its hydration reaction. The freeze–thaw cycle creates cracks in the cemented tailings, and the TSF embankment is in danger of failure, we can reinforce the TSF embankment to make it stable and durable.
Temperature may not be the only factor for the change in strength. Next, we are going to study the amount of cementitious material and confining pressure on the stability of the cemented tailings in a low temperature environment, to find out the correlation among them; to determine under what conditions the amount of cementitious material should be increased, and under which circumstances the tailings dam should be strengthened, or if both should be carried out at the same time.
Author Contributions
P.D. and Y.H. conceived and designed the experiments; P.D., X.Z. and D.H. performed the experiments; S.C. and D.H. collected and analyzed the data; Y.H. contributed materials/analysis tools; P.D. and Y.H. wrote the paper. C.L. Writing-review & editing. Conceptualization: P.D. and Y.H.; Data curation, D.H.; Formal analysis, X.Z.; Funding acquisition, Y.H.; Investigation, X.Z. and S.C.; Methodology, P.D. and Y.H.; Resources, Y.H.; Software, D.H.; Supervision, Y.H.; Validation, D.H.; Visualization, S.C.; Writing—original draft, P.D.; Writing—review & editing, P.D. and C.L. All authors have read and agreed to the published version of the manuscript.
Funding
This work is supported by the National Natural Science Foundation of China (no.51674263) and the Fundamental Research Funds for the Central Universities (2011YZ02).
Data Availability Statement
The data presented in this study are available on request from the corresponding author.
Conflicts of Interest
The authors declare no conflict of interest.
References
- David, J.W. Lessons from Tailings Dam Failures—Where to Go from Here? Minerals 2021, 11, 853. [Google Scholar] [CrossRef]
- Liu, R.; Huang, F.; Du, R.; Zhao, C.; Li, Y.; Yu, H. Recycling and utilisation of industrial solid waste: An explorative study on gold deposit tailings of ductile shear zone type in China. Waste Manag. Res. 2015, 33, 570–577. [Google Scholar] [CrossRef]
- Zhang, J.; Liu, J. The Statistics and Causes of Dam Break and Leakage in Chinese Tailings Pond. Chin. Molybdenum Ind. 2019, 4, 10–14. [Google Scholar] [CrossRef]
- Yu, M.; Kong, X.; Huang, J.; Liu, J.; Li, J. Status of disposal of tailings as a solid waste and suggestions in China. Ind. Miner. Processing 2022, 1, 34–38, (In Chinese with English Abstract). [Google Scholar] [CrossRef]
- Bolaños-Benítez, V.; Van Hullebusch, E.; Lens, P.L.; Quantin, C.; Van De Vossenberg, J.; Subramanian, S.; Sivry, Y. (Bio)leaching Behavior of Chromite Tailings. Minerals 2018, 8, 261. [Google Scholar] [CrossRef] [Green Version]
- Anning, C.; Wang, J.; Chen, P.; Batmunkh, I.; Lyu, X. Determination and detoxification of cyanide in gold mine tailings: A review. Waste Manag. Res. 2019, 37, 1117–1126. [Google Scholar] [CrossRef] [PubMed]
- Park, I.; Tabelin, C.B.; Jeon, S.; Li, X.; Seno, K.; Ito, M.; Hiroyoshi, N. A review of recent strategies for acid mine drainage prevention and mine tailings recycling. Chemosphere 2019, 5, 588–600. [Google Scholar] [CrossRef] [PubMed]
- Sun, Q.; Wei, X.; Li, T.; Zhang, L. Strengthening Behavior of Cemented Paste Backfill Using Alkali-Activated Slag Binders and Bottom Ash Based on the Response Surface Method. Materials 2020, 13, 855. [Google Scholar] [CrossRef] [PubMed] [Green Version]
- Qin, X.B.; Liu, L.; Wang, P.; Wang, M.; Xin, J. Microscopic Parameter Extraction and Corresponding Strength Prediction of Cemented Paste Backfill at Different Curing Times. Adv. Civ. Eng. 2018, 4, 2837571. [Google Scholar] [CrossRef]
- Nasir, O.; Fall, M. Shear behavior of cemented pastefill–rock interfaces. Eng. Geol. 2008, 101, 146–153. [Google Scholar] [CrossRef]
- Zhang, Q.L.; Chen, Q.S.; Wang, X.M. Cemented Backfilling Technology of Paste-Like Based on Aeolian Sand and Tailings. Minerals 2016, 6, 132. [Google Scholar] [CrossRef] [Green Version]
- Opiso, E.M.; Tabelin, C.B.; Maestre, C.V.; Aseniero, J.P.J.; Park, I.; Villacorte-Tabelin, M. Synthesis and characterization of coal fly ash and palm oil fuel ash modified artisanal and small-scale gold mine (ASGM) tailings based geopolymer using sugar mill lime sludge as Ca-based activator. Heliyon 2021, 7, e06654. [Google Scholar] [CrossRef] [PubMed]
- Hou, Y.B.; Tang, J.; Wei, S.X. Study on Tailings Consolidation Emissions Technology. Chin. J. Met. Mine 2011, 40, 59–62, (In Chinese with English Abstract). [Google Scholar]
- Michael, P.; Arnel, B.; Aileen, O.; Bernardo-Arugay, I.; Resabal, V.J.; Villacorte-Tabelin, M.; Dalona, I.M.; Opiso, E.; Alloro, R.; Alonzo, D.; et al. Systems Approach toward a Greener Eco-efficient Mineral Extraction and Sustainable Land Use Management in the Philippines. Chem. Eng. Trans. 2021, 88, 1171–1176. [Google Scholar] [CrossRef]
- Silwamba, M.; Ito, M.; Hiroyoshi, N.; Tabelin, C.B.; Fukushima, T.; Park, I.; Jeon, S.; Igarashi, T.; Sato, T.; Nyambe, I.; et al. Detoxification of lead-bearing zinc plant leach residues from Kabwe, Zambia by coupled extraction-cementation method. J. Environ. Chem. Eng. 2020, 8, 104197. [Google Scholar] [CrossRef]
- Zhou, Z.; Ma, W.; Zhang, S.; Mu, Y.; Li, G. Effect of freeze-thaw cycles in mechanical behaviors of frozen loess. Cold Reg. Sci. Technol. 2018, 146, 9–18. [Google Scholar] [CrossRef]
- Qiao, Y.F.; Sun, W.; Jiang, J. Damage process of concrete subjected to coupling fatigue load and freeze/thaw cycles. Constr. Build. Mater. 2015, 93, 806–811. [Google Scholar] [CrossRef]
- Polat, R. The effect of antifreeze additives on fresh concrete subjected to freezing and thawing cycles. Cold Reg. Sci. Technol. 2016, 127, 10–17. [Google Scholar] [CrossRef]
- Polat, R.; Demirboga, R.; Karakoc, M.B.; Türkmen, I. The influence of light weight aggregate on the physical-mechanical properties of concrete exposed to freeze–thaw cycles. Cold Reg. Sci. Technol. 2010, 60, 51–56. [Google Scholar] [CrossRef]
- Cao, D.F.; Fu, L.Z.; Yang, Z.W. Experimental study on tensile properties of concrete after freeze-thaw cycles. J. Build. Mater. 2012, 15, 42–52. [Google Scholar] [CrossRef]
- Qureshi, A.; Bussière, B.; Benzaazoua, M.; Lessard, F.; Boulanger-Martel, V. Geochemical Assessment of Desulphurized Tailings as Cover Material in Cold Climates. Minerals 2021, 11, 280. [Google Scholar] [CrossRef]
- Hanjari, K.Z.; Utgenannt, P.; Lundgren, K. Experimental study of the material and bond properties of frost-damaged concrete. Cem. Concr. Res. 2011, 41, 244–254. [Google Scholar] [CrossRef] [Green Version]
- Hanjari, K.; PerKettil, K.L. Modelling the structural behaviour of frost-damaged reinforced concrete structures. Struct. Infrastruct. Eng. 2013, 9, 416–431. [Google Scholar] [CrossRef] [Green Version]
- Tang, Y.Q.; Li, J.; Wan, P.; Yang, P. Resilient and plastic strain behavior of freezing-thawing mucky clay under subway loading in Shanghai. Nat. Hazards 2014, 72, 771–787. [Google Scholar] [CrossRef]
- Xie, S.B.; Qu, J.J.; Xu, X.T.; Pang, Y. Interactions between freeze–thaw actions, wind erosion desertification, and permafrost in the Qinghai–Tibet Plateau. Nat. Hazards 2017, 85, 829–850. [Google Scholar] [CrossRef]
- Liu, L.; Ye, G.; Schlangen, E.; Chen, H.; Qian, Z.; Sun, W.; van Breugel, K. Modeling of the internal damage of saturated cement paste due to ice crystallization pressure during freezing. Cem. Concr. Comp. 2011, 33, 562–571. [Google Scholar] [CrossRef]
- Liu, L.; Shen, D.; Chen, H.; Sun, W.; Qian, Z.; Zhao, H.; Jiang, J. Analysis of damage development in cement paste due to ice nucleation at different temperatures. Cem. Concr. Comp. 2014, 53, 1–9. [Google Scholar] [CrossRef]
- Liu, L.; Wu, S.; Chen, H.; Haitao, Z. Numerical investigation of the effects of freezing on micro-internal damage and macro-mechanical properties of cement pastes. Cold Reg. Sci. Technol. 2014, 106, 141–152. [Google Scholar] [CrossRef]
- Tang, S.; Yao, Y.; Andrade, C.; Li, Z. Recent durability studies on concrete structure. Cem. Concr. Res. 2015, 78, 143–154. [Google Scholar] [CrossRef]
- Wang, Z.; Zeng, Q.; Wang, L.; Li, K.; Xu, S.; Yao, Y. Characterizing frost damages of concrete with flatbed scanner. Constr. Build. Mater. 2016, 102, 872–883. [Google Scholar] [CrossRef]
- Ma, Q.; Ma, D.; Yao, Z. Influence of freeze-thaw cycles on dynamic compressive strength and energy distribution of soft rock specimen. Cold Reg. Sci. Technol. 2018, 153, 10–17. [Google Scholar] [CrossRef]
- Liu, B.; Jiang, J.; Shen, S. Effects of curing methods of concrete after steam curing on mechanical strength and permeability. Constr. Build. Mater. 2020, 256, 119441. [Google Scholar] [CrossRef]
- Shin, M.; Park, D.; Seo, Y. Response of subsea pipelines to anchor impacts considering pipe–soil–rock interactions. Int. J. Impact Eng. 2020, 143, 103590. [Google Scholar] [CrossRef]
- Kalonji-Kabambi, A.; Bussière, B.; Demers, I. Hydrogeochemical Behavior of Reclaimed Highly Reactive Tailings, Part 2: Laboratory and Field Results of Covers Made with Mine Waste Materials. Minerals 2020, 10, 589. [Google Scholar] [CrossRef]
- Pokharel, M.; Fall, M. Combined influence of sulphate and temperature on the saturated hydraulic conductivity of hardened cemented paste backfill. Cem. Concr. Comp. 2013, 38, 21–28. [Google Scholar] [CrossRef]
- Fall, M.; Benzaazoua, M. Modeling the effect of sulphate on strength development of paste backfill and binder mixture optimization. Cem. Concr. Res. 2005, 35, 301–314. [Google Scholar] [CrossRef]
- Hou, Y.; Ding, P.; Han, D.; Zhang, X.; Cao, S. Study on the Preparation and Hydration Properties of a New Cementitious Material for Tailings Discharge. Processes 2019, 7, 47. [Google Scholar] [CrossRef] [Green Version]
- Li, W.; Fall, M. Sulphate effect on the early age strength and self-desiccation of cemented paste backfill. Constr. Build. Mater. 2016, 106, 296–304. [Google Scholar] [CrossRef]
- Luo, T.; Zhang, C.; Sun, C.; Zheng, X.; Ji, Y.; Yuan, X. Experimental Investigation on the Freeze–Thaw Resistance of Steel Fibers Reinforced Rubber Concrete. Materials 2020, 13, 1260. [Google Scholar] [CrossRef] [Green Version]
- Qiu, J.P.; Yang, L.; Sun, X.G.; Xing, J.; Li, S. Strength Characteristics and Failure Mechanism of Cemented Super-Fine Unclassified Tailings Backfill. Minerals 2017, 7, 58. [Google Scholar] [CrossRef] [Green Version]
- You, Z.M.; Lai, Y.M.; Zhang, M.Y.; Liu, E. Quantitative analysis for the effect of microstructure on the mechanical strength of frozen silty clay with different contents of sodium sulfate. Environ. Earth Sci. 2017, 4, 143. [Google Scholar] [CrossRef]
- Wu, S.Y.; Yang, J.; Yang, R.C.; Zhu, J.; Liu, S.; Wang, C. Investigation of microscopic air void structure of anti-freezing asphalt pavement with X-ray CT and MIP. Constr. Build. Mater. 2018, 178, 473–483. [Google Scholar] [CrossRef]
- Lee, J.K.; Shang, J.Q. Micropore Structure of Cement-Stabilized Gold Mine Tailings. Minerals 2018, 8, 96. [Google Scholar] [CrossRef] [Green Version]
- Zhang, Z.l; Cui, Z.D. Effects of freezing-thawing and cyclic loading on pore size distribution of silty clay by mercury intrusion porosimetry. Cold Reg. Sci. Technol. 2018, 145, 185–196. [Google Scholar] [CrossRef]
- Cui, Z.D.; Tang, Y.Q. Microstructures of different soil layers caused by the high-rise building group in Shanghai. Environ. Earth Sci. 2011, 63, 109–119. [Google Scholar] [CrossRef]
- Guo, B.; Zhou, Y.; Zhu, J.F.; Liu, W.; Wang, F.; Wang, L.; Jiang, L. An estimation method of soil freeze-thaw erosion in the Qinghai-Tibet Plateau. Nat. Hazards. 2015, 78, 1843–1857. [Google Scholar] [CrossRef]
- Zhang, Y.; Zhang, S.; Ni, W.; Yan, Q.; Gao, W.; Li, Y. Immobilisation of high-arsenic-containing tailings by using metallurgical slag-cementing materials. Chemosphere 2019, 223, 117–123. [Google Scholar] [CrossRef] [PubMed]


Publisher’s Note: MDPI stays neutral with regard to jurisdictional claims in published maps and institutional affiliations. |
© 2022 by the authors. Licensee MDPI, Basel, Switzerland. This article is an open access article distributed under the terms and conditions of the Creative Commons Attribution (CC BY) license (https://creativecommons.org/licenses/by/4.0/).