Article

Zun-Kholba Orogenic Gold Deposit, Eastern Sayan, Russia: Geology and Genesis

by
Bulat Batuevich Damdinov
1,*,
Nikolay Anatolyevich Goryachev
2,3,
Maria Leonidovna Moskvitina
1,
Ludmila Borisovna Damdinova
1,
Alexandra Dmitrievna Izvekova
1,
Vadim Nikolaevich Reutsky
4,
Victor Fedorovich Posokhov
1 and
Dmitry Alexandrovich Artemyev
5
1
Dobretsov Geological Institute of Siberian Branch of Russian Academy of Sciences, Sakh’yanovoi st. 6a, Ulan-Ude 670047, Russia
2
North-East Interdisciplinary Scientific Research Institute, Far East Branch of the Russian Academy of Sciences (NEISRI FEB RAS), 16 Portovaya Str., Magadan 685000, Russia
3
Institute of Geochemistry, Siberian Branch of the Russian Academy of Sciences (IGC SB RAS), 1a Favorskogo Str., Irkutsk 664033, Russia
4
V. S. Sobolev Institute of Geology and Mineralogy, Siberian Branch of the Russian Academy of Sciences (IGM SB RAS), 3 Ak. Kotyuga Ave., Novosibirsk 630090, Russia
5
Institution of Science South Urals Research Center of Mineralogy and Geoecology of the Urals Branch of the Russian Academy of Sciences (SU FRC MG UB RAS), Miass 455038, Russia
*
Author to whom correspondence should be addressed.
Minerals 2022, 12(4), 395; https://doi.org/10.3390/min12040395
Submission received: 3 February 2022 / Revised: 2 March 2022 / Accepted: 21 March 2022 / Published: 23 March 2022
(This article belongs to the Special Issue Gold Deposits in Russia: Geology, Mineralogy and Ore Genesis)

Abstract

:
In this paper, we present a new point of view on the deposit geology and genesis of the largest gold deposit in Eastern Sayan, Zun-Kholba. Quartz–sulfide replacement ores and shallow quartz veins are of great economic importance. At the deposit, quartz–pyrite ore bodies are dominant, whereas paragenetically late base metal-bearing quartz veins occur only at shallow levels. The study of the fluid inclusions, stable isotopes (C–O–S), and mineral geothermometry allowed us to determine the P–T conditions of ore deposition. It is established that the temperature of ore formation changed from 380 to 433 °C at the deepest levels of the deposit to 316 °C at the shallowest levels. The pressure estimates for gold deposition at 570–950 bar were calculated for the 1490-m level in the center of the deposit. The determined P–T conditions can help estimate the average depth of deposit formation at about 3.6 km. Ore mineral assemblages were formed from homogeneous fluids of low to moderate salinity (2.4–7.9 wt.% eq. NaCl). The sulfur isotope composition of sulfide minerals (δ34S = 0–4.6‰), as well as pyrite geochemistry, corresponds to that of older volcanogenic massive sulfide (VMS) occurrences, which are widespread within the Eastern Sayan ophiolitic belts. Lens-like fragments of metamorphosed VMS-type sulfide ores are also present in the Zun-Kholba deposit. The oxygen isotope data indicate a metamorphic origin for the ore-forming fluids. Migrating metamorphic fluids may have become enriched in gold, sulfur, and other metals during the flow through the complex ore-hosting lithologies, including ophiolitic bodies with sulfide-rich VMS fragments that are characterized by a relatively high content of gold and related ore elements. The obtained data allow us to suggest a metamorphic devolatilization model for the genesis of the Zun-Kholba gold deposit.

Graphical Abstract

1. Introduction

Orogenic gold deposits are formed within accretionary and collision orogenic belts. Hypozonal, mesozonal, and epizonal subtypes of such deposits are distinguished by their differences in depth of formation [1]. Moreover, they may differ in sources of ore-forming fluids and metals [2,3].
The P–T conditions and genesis of each of these deposit subtypes have been well-discussed in the recent literature. Most often, orogenic gold deposits do not have any genetic association with magmatism, and deposit host rocks are metamorphosed [4]. The origin of orogenic deposits is most commonly explained by the metamorphic or slab devolatilization model [5,6,7]. According to this model, gold-bearing fluids are generated from greenschist facies metamorphic rocks during amphibolite facies metamorphism followed by the migration and redeposition of gold. Nevertheless, some orogenic gold deposits may have formed from magmatic fluids [3,8,9].
The Zun-Kholba gold deposit is the largest past producer in Eastern Sayan, having yielded more than 50 tons of Au during past mining operations. However, deposit mining continues to a lesser extent. The Zun-Kholba is considered to be a typical orogenic gold deposit with a high sulfide content [10].
At the earliest publications origin of the Zun-Kholba deposit is assumed to be related to ore-forming fluids that were separated from Sumsunur series granitoids [11]. In this case, spatially associated deposits (Pioneer, Barun-Kholba, etc.) are suggested to represent different types of gold mineralization reflecting mineral zoning around a granitoid massif. Later, it was suggested that the main reason for the formation of gold mineralization is the processes of multiple tectonic transformations of rocks [12]. This model is based predominantly on the structural observations of the ore bodies. According to an alternative multistage model, ores of the Zun-Kholba deposit are a product of regeneration of Neoproterozoic weakly gold-bearing sulfide ores of submarine volcanogenic sedimentary origin [13]. However, actual mechanisms for the ores’ formation have not been established. Thus, hypotheses about the genesis of the deposit vary from an intrusion-related to a syn sedimentary with an overprinting hydrothermal activity model. There is no consensus yet. Moreover, features of the deposit geological structure are open to discussion. Ore mineralogy and geochemistry, despite the long-time mining history of the deposit, have been studied insufficiently. Important information about P–T–X parameters of ore formation, as well as stable isotope composition features of quartz–sulfide ores, has not been obtained earlier in detail.
In this paper, we suggest a new point of view on the deposit geology and genesis of the Zun-Kholba gold deposit obtained as a result of geological observations; a mineralogical stable (S, O, and C) isotope; and fluid inclusion studies and also using the materials published by predecessors.

2. Regional Geology and Tectonics

The Eastern Sayan Mountains form the southern margin of the Siberian Craton and are also located in the northern part of the Central Asian Orogenic Belt. The studied area during this research represents the southeastern part of Eastern Sayan that is also the northern part of the Tuva-Mongol microcontinent, which is the largest tectonic unit of the orogenic belt. The microcontinent is surrounded by ophiolitic sequences and active and passive continental margin rock series. A detailed description of the geological setting of the studied region has been published elsewhere [14]. Crystalline basement fragments of the Tuva-Mongol microcontinent form gneissic blocks with amphibolite and migmatite interlayers. The isotopic age of these rocks is about 2900 Ma [14]. The Late Neoproterozoic cover of the Tuva-Mongol microcontinent is composed of carbonate rocks with minor shales and sandstones. All parts of ophiolitic assemblages are present, but ultrabasic rocks are dominant. The ophiolites of Eastern Sayan are the oldest ophiolite rocks of the Central Asian Orogenic Belt accreted onto the Tuva-Mongol microcontinent [15]. Island arc rocks are represented by metamorphosed volcanic rocks of the Sarkhoy series and schists of the Oka terrane accretionary prism [14]. In the southeastern part of the region, terrigenous rocks of a passive continental margin form the Ilchir terrane. All sedimentary and volcanic assemblages are intruded by abundant magmatic rocks that formed at different stages of the tectonic development of the region.
The tectonic evolution of the southeastern part of Eastern Sayan began with the appearance of the Neoproterozoic Paleoasian Ocean about 1 billion years ago and in which primitive island arc complexes developed [14,16]. This stage ended about 800 million years ago with the accretion of ophiolites and island arcs to the Archean Gargan continental block, resulting in the formation of the Tuva-Mongol microcontinent. Subsequently, the Sarkhoy and Shishkhid island arcs were formed near the microcontinent margin [17]. From about 500 to 420 Ma, the microcontinent collided with the Siberian craton and formed an early part of the Central Asian Orogenic Belt. The early Paleozoic orogeny led to thee formation of most of the orogenic gold deposits in Eastern Sayan [18]. In the Late Paleozoic (ca. 380–280 Ma), shear deformation occurred throughout much of the Central Asian Orogenic Belt. The deformation events were caused first by collision of the Kazakhstan block with the Siberian Craton and, later, by collision of the East European Craton with the developing North Asian continent [19]. Numerous crushing zones in the frame of the Zun-Kholba deposit were formed due to the Paleozoic shear deformations that appeared throughout Eastern Sayan. During the deformations, two parts of granitoid pluton were displaced relative to each other (Figure 1).
The southeastern part of Eastern Sayan in the metallogenic zoning is the Oka ore province [20], which includes some large gold districts (Ilchir, Bokson-Gargan, Oka, and Khamsara) hosting numerous gold deposits [21]. The most significant economic orogenic gold deposits are located near the edge of the Archean Gargan block, a part of the basement of the Tuva-Mongol microcontinent and in spatial association with surrounding ophiolite belts. This area is known as the Urik-Kitoi gold ore zone or district [22]. This zone includes the largest gold deposit in East Sayan, the Zun-Kholba gold deposit.

3. Deposit Geology

The Zun-Kholba gold deposit was discovered in 1955 and subsequently explored during a long time period. Mining of the deposit began in 1992 and has continued until the present day. Mining of the deposit is presently nearing completion due to the great depth of the remaining ore. The main geological features of the deposit were described in detail in other scientific papers [11,12,13,22] and unpublished company reports.
The following rock assemblages are present in the Zun-Kholba gold deposit area: (1) Archean rocks of the Tuva-Mongol microcontinent basement, comprising granitic gneisses with amphibolites and migmatites; (2) Neoproterozic cover rocks of the Tuva-Mongol microcontinent that include sandy and silicified limestones of the Irkut suite with intercalated layers of carbonaceous shales; (3) ophiolitic rocks comprising metasomatically altered ultrabasites and basites transformed into listvenites and talc–carbonate rocks, as well as metamorphosed basalts and andesites associated with black shales; (4) 790 Ma [14] Sumsunur series granitoids comprising biotite and amphibole–biotite granodiorites, plagiogranites, biotite–hornblende diorites, and hornblende granites; and (5) rare lamprophyre and porphyry dikes of undetermined age.
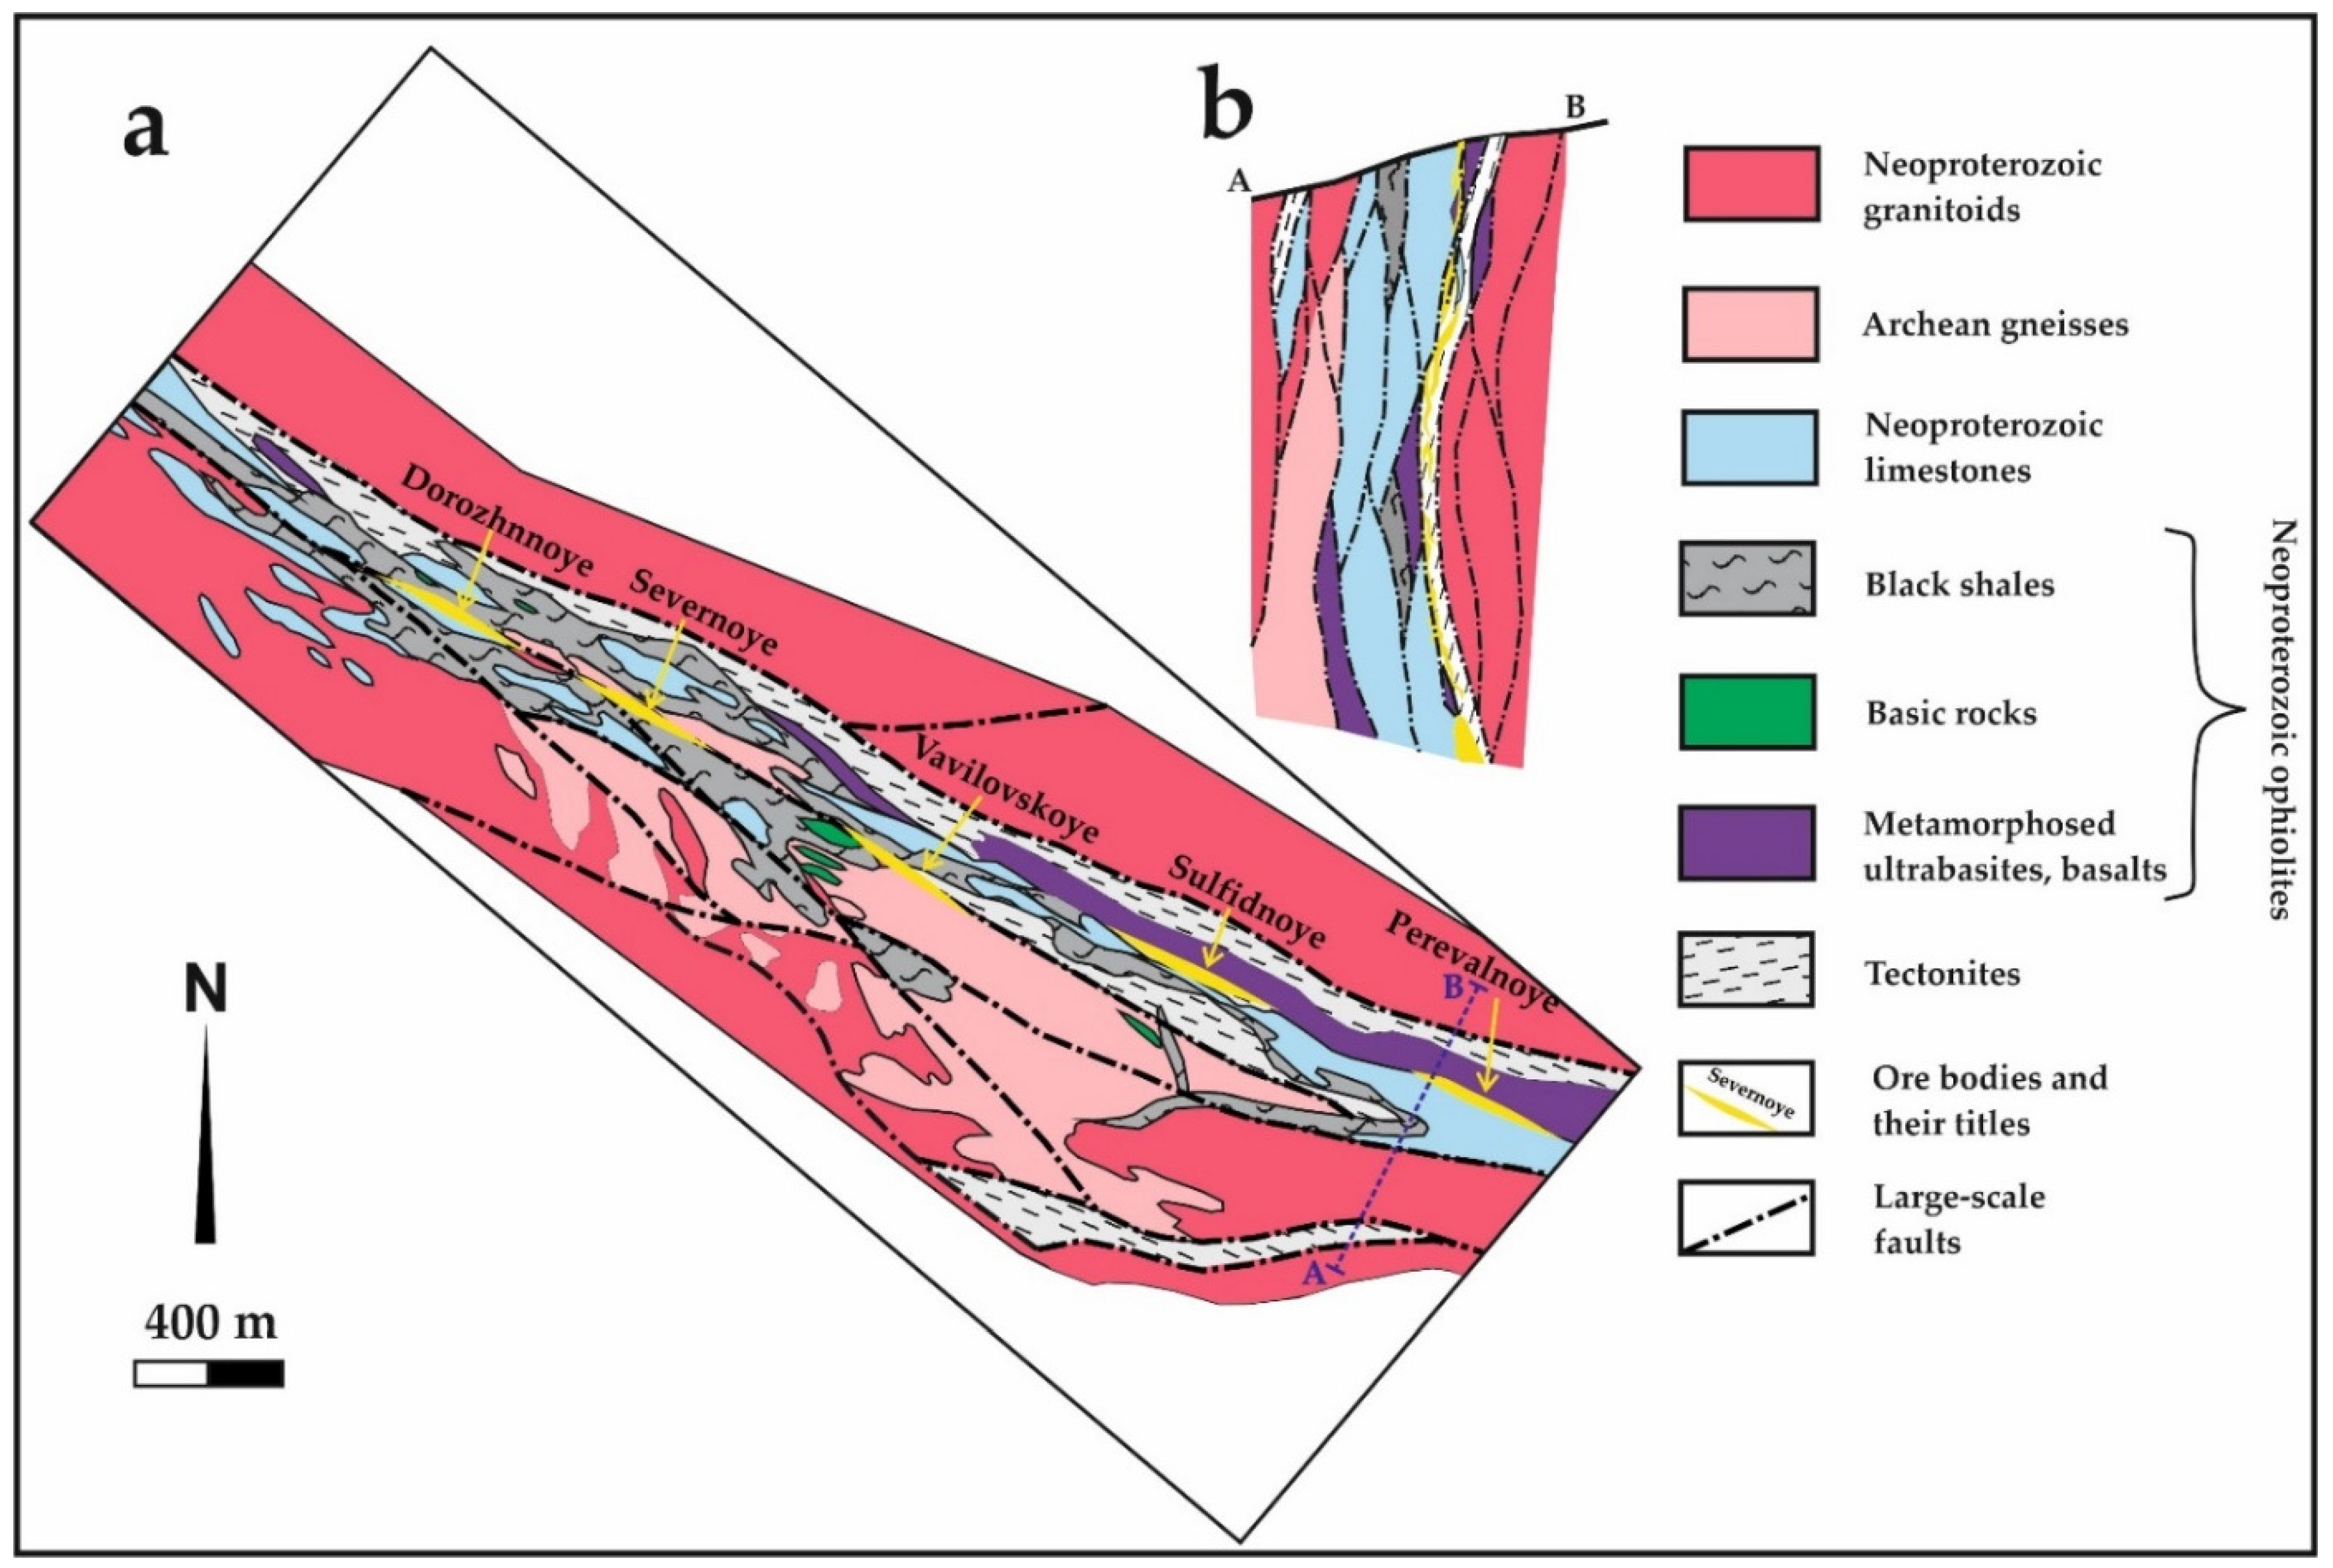
The Zun-Kholba deposit is restricted to the Kholba shear zone [23], which also controls some other gold deposits in the ore zone (e.g., Barun-Kholba and Haranur). The deposit is located in a large-scale lens-like zone (see Figure 1) of tectonic mélange. This lens-like structure is similar in shape to a transpressive duplex that is commonly steeply dipping or subvertical [24].
The mélange includes a mixture of granitoids, gneisses, ophiolites, carbonates, black shales, and other rocks that underlie the Zun-Kholba deposit area (Figure 2). These rock fragments are imbedded into finely crushed and altered tectonites (cataclasites). Hydrothermal alterations of many lithologies in the mélange are mostly evident by quartz–sericite zones, well-developed listvenites in the basic or ultrabasic rocks, and widespread silicification. The lamprophyre dike is inferred as a single body at the 1390-m horizon. This dike is intensely deformed and presents lens-like fragments in the ore zones, suggesting a pre-ore to syn-ore emplacement. In contrast, the porphyry dikes cut the ore zones and were emplaced post-ore.
Rare pyrite–pyrrhotite lens-like bodies are observed in the ore-hosting mélange zones as rare boudins. These bodies are analogous to the earlier studied pyrrhotite ores from ophiolites of Eastern Sayan [25]. They represent fragments of ancient VMS occurrences that were introduced to the ore field as a part of an ophiolite assemblage. The main ore bodies of the Zun-Kholba deposit represent quartz–sulfide replacement zones and quartz veins with locally as much as 40%–50% sulfides. Descriptions of the ore bodies and ore mineralogy are presented below.

4. Sampling and Analytical Methods

The Zun-Kholba gold deposit was mined to a depth of more than 1 km by underground operations. We conducted geological observations and collected samples on the 1260, 1290, 1340, 1390, 1440, 1490, 1740, 2032, 2134, and 2250-m levels, as well as from the surface of the deposit (about 2300 m). More than 200 samples of ores and host rocks were taken, which were pieces weighing from 300 g to 1 kg. Geological and structural studies were conducted on the Severnoye, Vavilovskoye, Sulfidnoye, and Dorozhnoye ore bodies. For this study, we collected samples mainly from the quartz–sulfide replacement ores characterized by different ratios of quartz to sulfide. In addition, massive pyrite–pyrrhotite ore lenses were sampled at the 1290-m level. At the surface (2250-m level), both quartz–sulfide replacement zones and sulfide-bearing quartz veins were sampled.
Individual grains of quartz, sulfide minerals, muscovite, and carbonate minerals were hand-picked from crushed ore samples using an optical microscope.
The sulfur isotope compositions of the sulfides were determined by a mass spectrometer (Delta V Advantage dual inlet mode) at the Shared research facilities for Multi-elemental and Isotope Research SB RAS (Novosibirsk). The isotopic composition of sulfur is expressed in δ34S notation in permil (‰) relative to the Canyon Diablo Troilite standard, and its analytical precision is about ±0.2‰.
The oxygen and carbon isotopic compositions were analyzed at Analytical Center “Geospectr” of Dobretsov Geological Institute, SB RAS, Ulan-Ude, Russia. The oxygen in the silicates was analyzed using laser fluorination, while the carbon and the oxygen in the carbonates were analyzed using the technique of decomposition of the sample by orthophosphoric acid with the Gasbench option at 60–70 °C for 2–4 h with CO2 extraction and its analysis. In this case, other silicate minerals (e.g., quartz or micas) do not have influence on the analysis results. All the measurements were carried out on a Finnigan MAT 253 mass spectrometer using a double-inlet system for oxygen in silicates and continuous helium flow for carbonates. The measurements were calibrated using international standards NBS-28 (quartz), NBS-30 (biotite) [26] for silicates, and NBS-18 and NBS-19 [27] for carbonates. The error of the obtained values did not exceed 0.2‰ to 0.3‰.
The chemical compositions of the minerals were analyzed at Geological Institute of SB RAS, using a LEO-1430 scanning electron microscope with an attached Inca-Energy energy-dispersion device for quantitative analysis. The lower detection limit of this method is about 0.1 wt.%. For mineral thermometry, the SEM-EDS analyses were converted to atomic percentages, and the relevant parameters (XFeS in sphalerite and NAg in electrum) were determined.
The trace elements in pyrite and pyrrhotite were studied using a New Wave Research UP-213 laser ablation system, coupled with an Agilent 7700x (Agilent Technologies, Santa Clara, CA, USA) plasma mass spectrometer in the South Urals Research Center of Mineralogy and Geoecology of the Urals Branch of the Russian Academy of Sciences (Miass, Russia). The measurements were carried out with an Nd: YAG UV source, frequency quadrupled (wavelength 213 nm) with the fluence settings of 3.0–3.5 J/cm2, repetition rate 10 Hz, and helium cell carrier gas and a flow rate of 0.6–0.65 L/min. The mass spectrometer settings were as follows: RF Power 1550 W, carrier gas Ar, flow rate 0.90–1.05 L/min, plasma gas flow (Ar) 15 L/min, and auxiliary gas flow (Ar) 0.9 L/min. Each analysis was performed in linear mode across the sulfide crystal with a laser spot size of 100 µm and speed of 10 μm/sec. The element contents were calibrated against reference materials USGS GSD-1g, USGS MASS-1, and UQAC-1 using 57Fe = 46.5 wt. % for pyrite as the internal standard.
The fluid inclusions (FI) in quartz were investigated by thermometry and cryometry. To determine the homogenization temperature, eutectic temperature and ice melting temperatures of aqueous solutions, and temperatures of dissolution of the daughter phases, a Linkam THMSG-600 microthermal camera with a temperature range from −196 to +600 °C was used. The standard instrumental measurement error was ±0.1 in the negative and ±5 °C in the positive temperature range. The bulk salinity of the solutions (eq. NaCl) was determined by cryometry data, according to Reference [28]. The salt composition was identified based on the eutectic temperature of the fluid using the data by Borisenko [29].

5. Results

5.1. Sturcture of the Ore Bodies

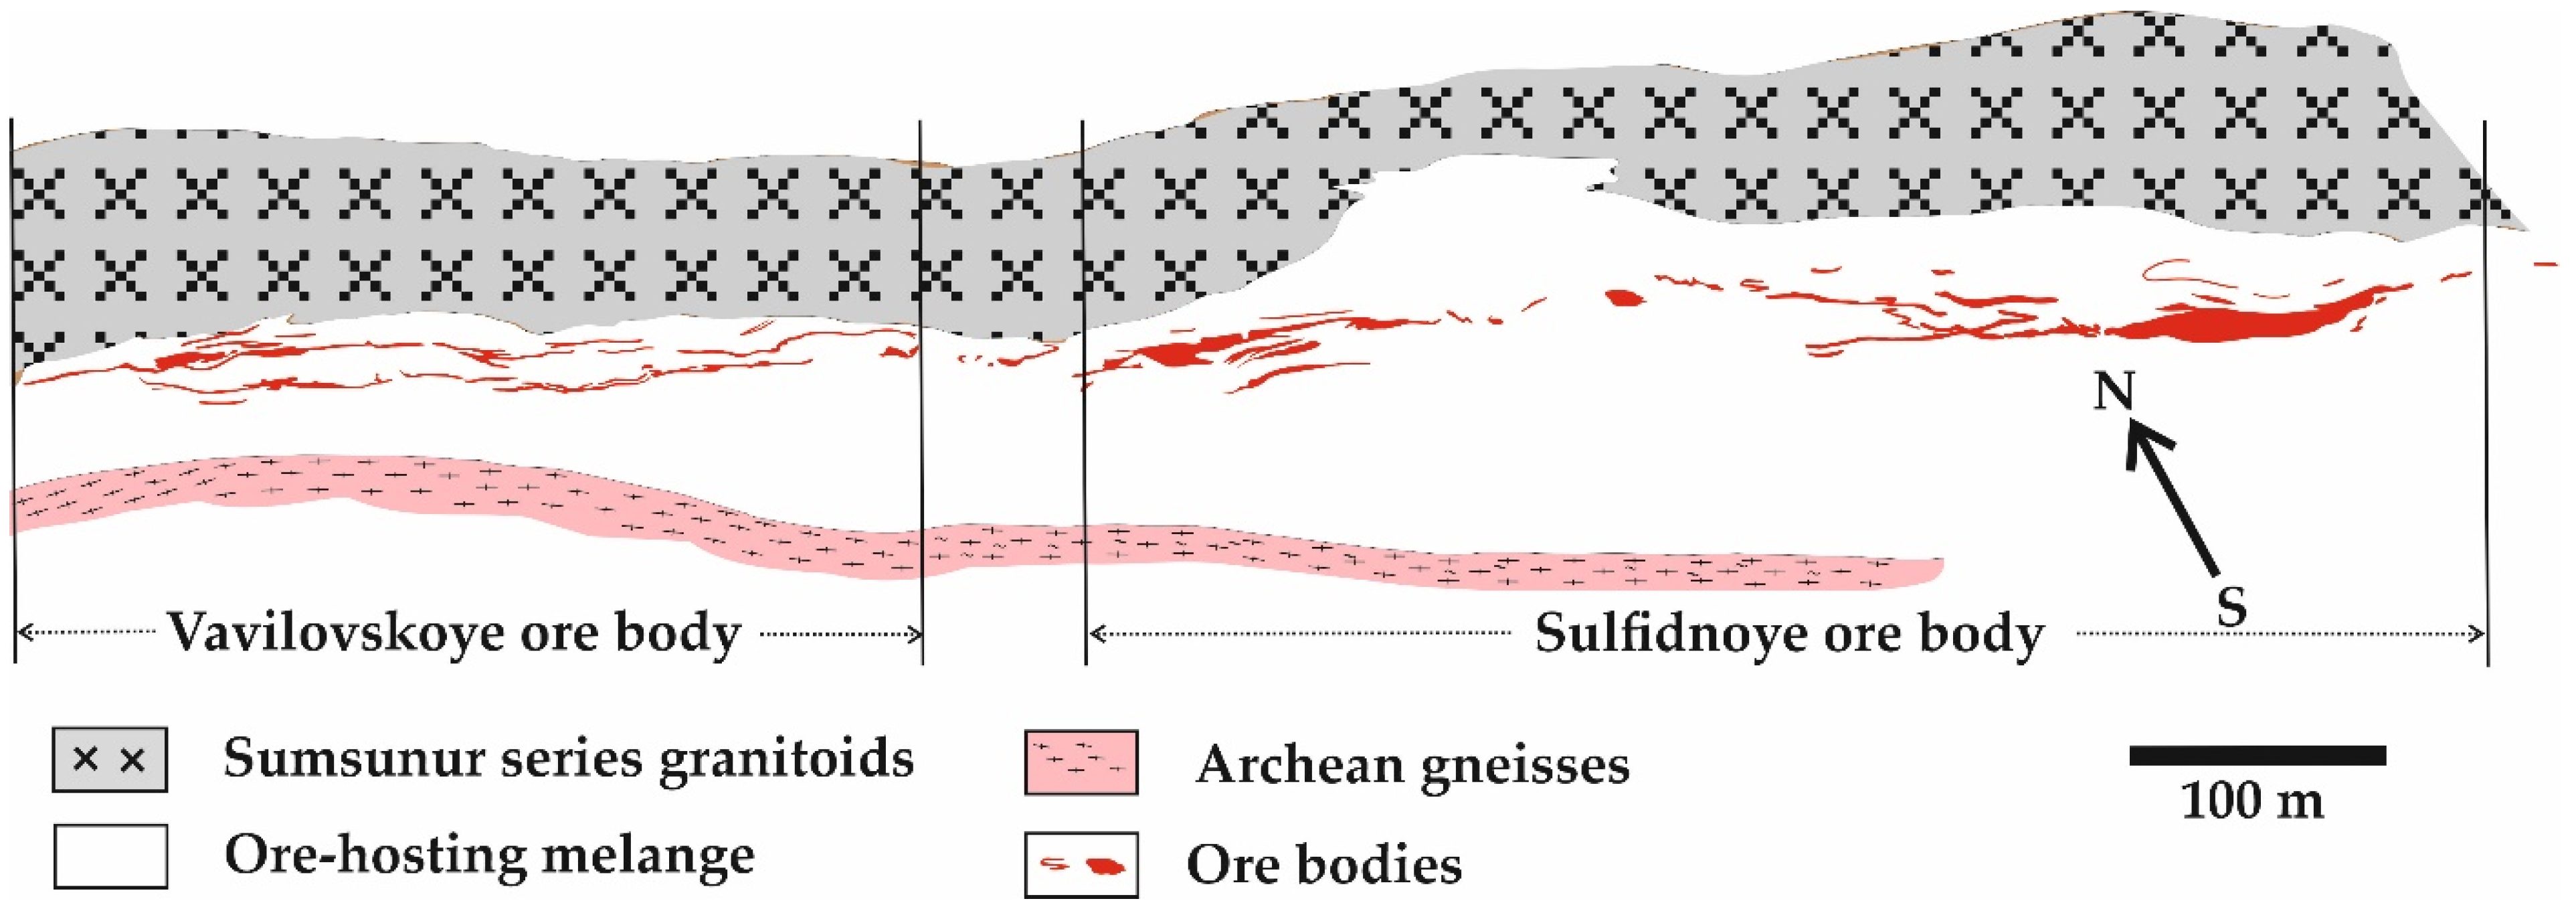
There are some ore bodies in the Zun-Kholba deposit: Dorozhnoye, Severnoye, Sulfidnoye, Vavilovskoe, and Perevalnoye (see Figure 2). Each ore body can be divided into several parts (for example, Severnoye-1 and Severnoye-2, etc.), which is caused by the inconsistency along the strike due to intense tectonic deformation. All of them are quartz–sulfide-mineralized zones that are confined into metasomatically altered cataclasites (tectonites). Near the surface, there are vein and vein-like bodies, whereas ore bodies transform with the depth into mineralized shear zones. The internal structure of the ore bodies is heterogeneous (Figure 3). Quartz–sulfide areas are most often lenticular bodies with sinuous boundaries, merging into larger extended quartz–sulfide zones. Inside the ore bodies, there are also barren areas, “windows”, the lengths of which can reach several tens of meters.
We studied four ore bodies—Severnoye, Vavilovskoe, Sulfidnoye and Perevalnoye.
The Severnoye ore body is located in the northwestern part of the deposit. The ore body has no distinct geological boundaries. It is often determined by sampling results, although sometimes its boundaries are identified by pinching out quartz–sulfide lenses and veins or gold-bearing host rocks. The total length of the ore body reaches 320 m, the thickness varies within 0.5–5 m, and the size increases with the depth.
The Vavilovskoye ore body is located between the Severnoye and Sulfidnoye ore bodies in the central part of the deposit. Below the 1740-m level, it is combined with the Severnoye and Sulfidnoye ore bodies. The length of the Vavilovskoye ore body is 96 m on the surface. With an increase in depth, its length increases to 500 m. The thickness is 0.15–0.8 m, with swells up to 4.5 m.
The Sulfidnoye ore body is the largest in the Zun-Kholba deposit. Its size increases with depth from 25 m on the surface (about the 2300-m level) to 600 m at the 1740-m level. Its thickness also increases with the depth from 1.0 to 1.5 m on the upper horizon of the deposit to 5 m on average at 1740 m (horizon of Gallery-12). The ore body is characterized by a regular alternation of swelling and pinching. Moreover, this alternation is observed both along the strike and along the dip. The length of the largest swelling is 130 m, and the thickness is 16 to 17 m.
The Perevalnoye is found only on the upper horizons of the deposit. It is a southeastern continuation of the Sulfidnoye ore body. Its length is 100–125 m, its thickness varies from 1.5 m to 2.0–2.5 m, and in swells, it reaches 8.0 m. It differs from the other ore bodies by a relatively high content of pyrrhotite among the sulfide minerals.
All the ore bodies are steeply (subvertical) dipping and have a lens-like morphology. Near the surface, they are represented by vein-like bodies that are transformed with the depth into mineralized crumple zones composed of a quartz–(carbonate)–sulfide assemblage. The bulk vertical extent of the ore bodies exceeds 1 km. The quartz–sulfide bodies lack clear boundaries and represent the products of silicification and sulfidization of tectonically fragmented and quartz–sericite-altered rocks, with the highest-grade ores formed in silicified and sulfidized limestone blocks (see Figure 3). The sulfide-bearing quartz veins occur only in the upper levels of the deposit, near the current surface. The composition of the ore bodies does not depend on the lithology of any host rock. Vertical zoning of the ores occurred as the base metal sulfides (galena, sphalerite, and chalcopyrite) increased at the upper levels of the deposit.
Previous age estimates for formation of the Zun–Kholba ores used 40Ar/39Ar dating methods on the tectonites and quartz–sericite-altered rocks. The measurements range from 386 to 354 Ma [18]. Most likely, these dates are rejuvenated, since we have no orogenic events at this time, except for the Early Paleozoic orogeny. The problem of reliable determination of the Zun-Kholba deposit age still remains.

5.2. Mineralogy of the Ores

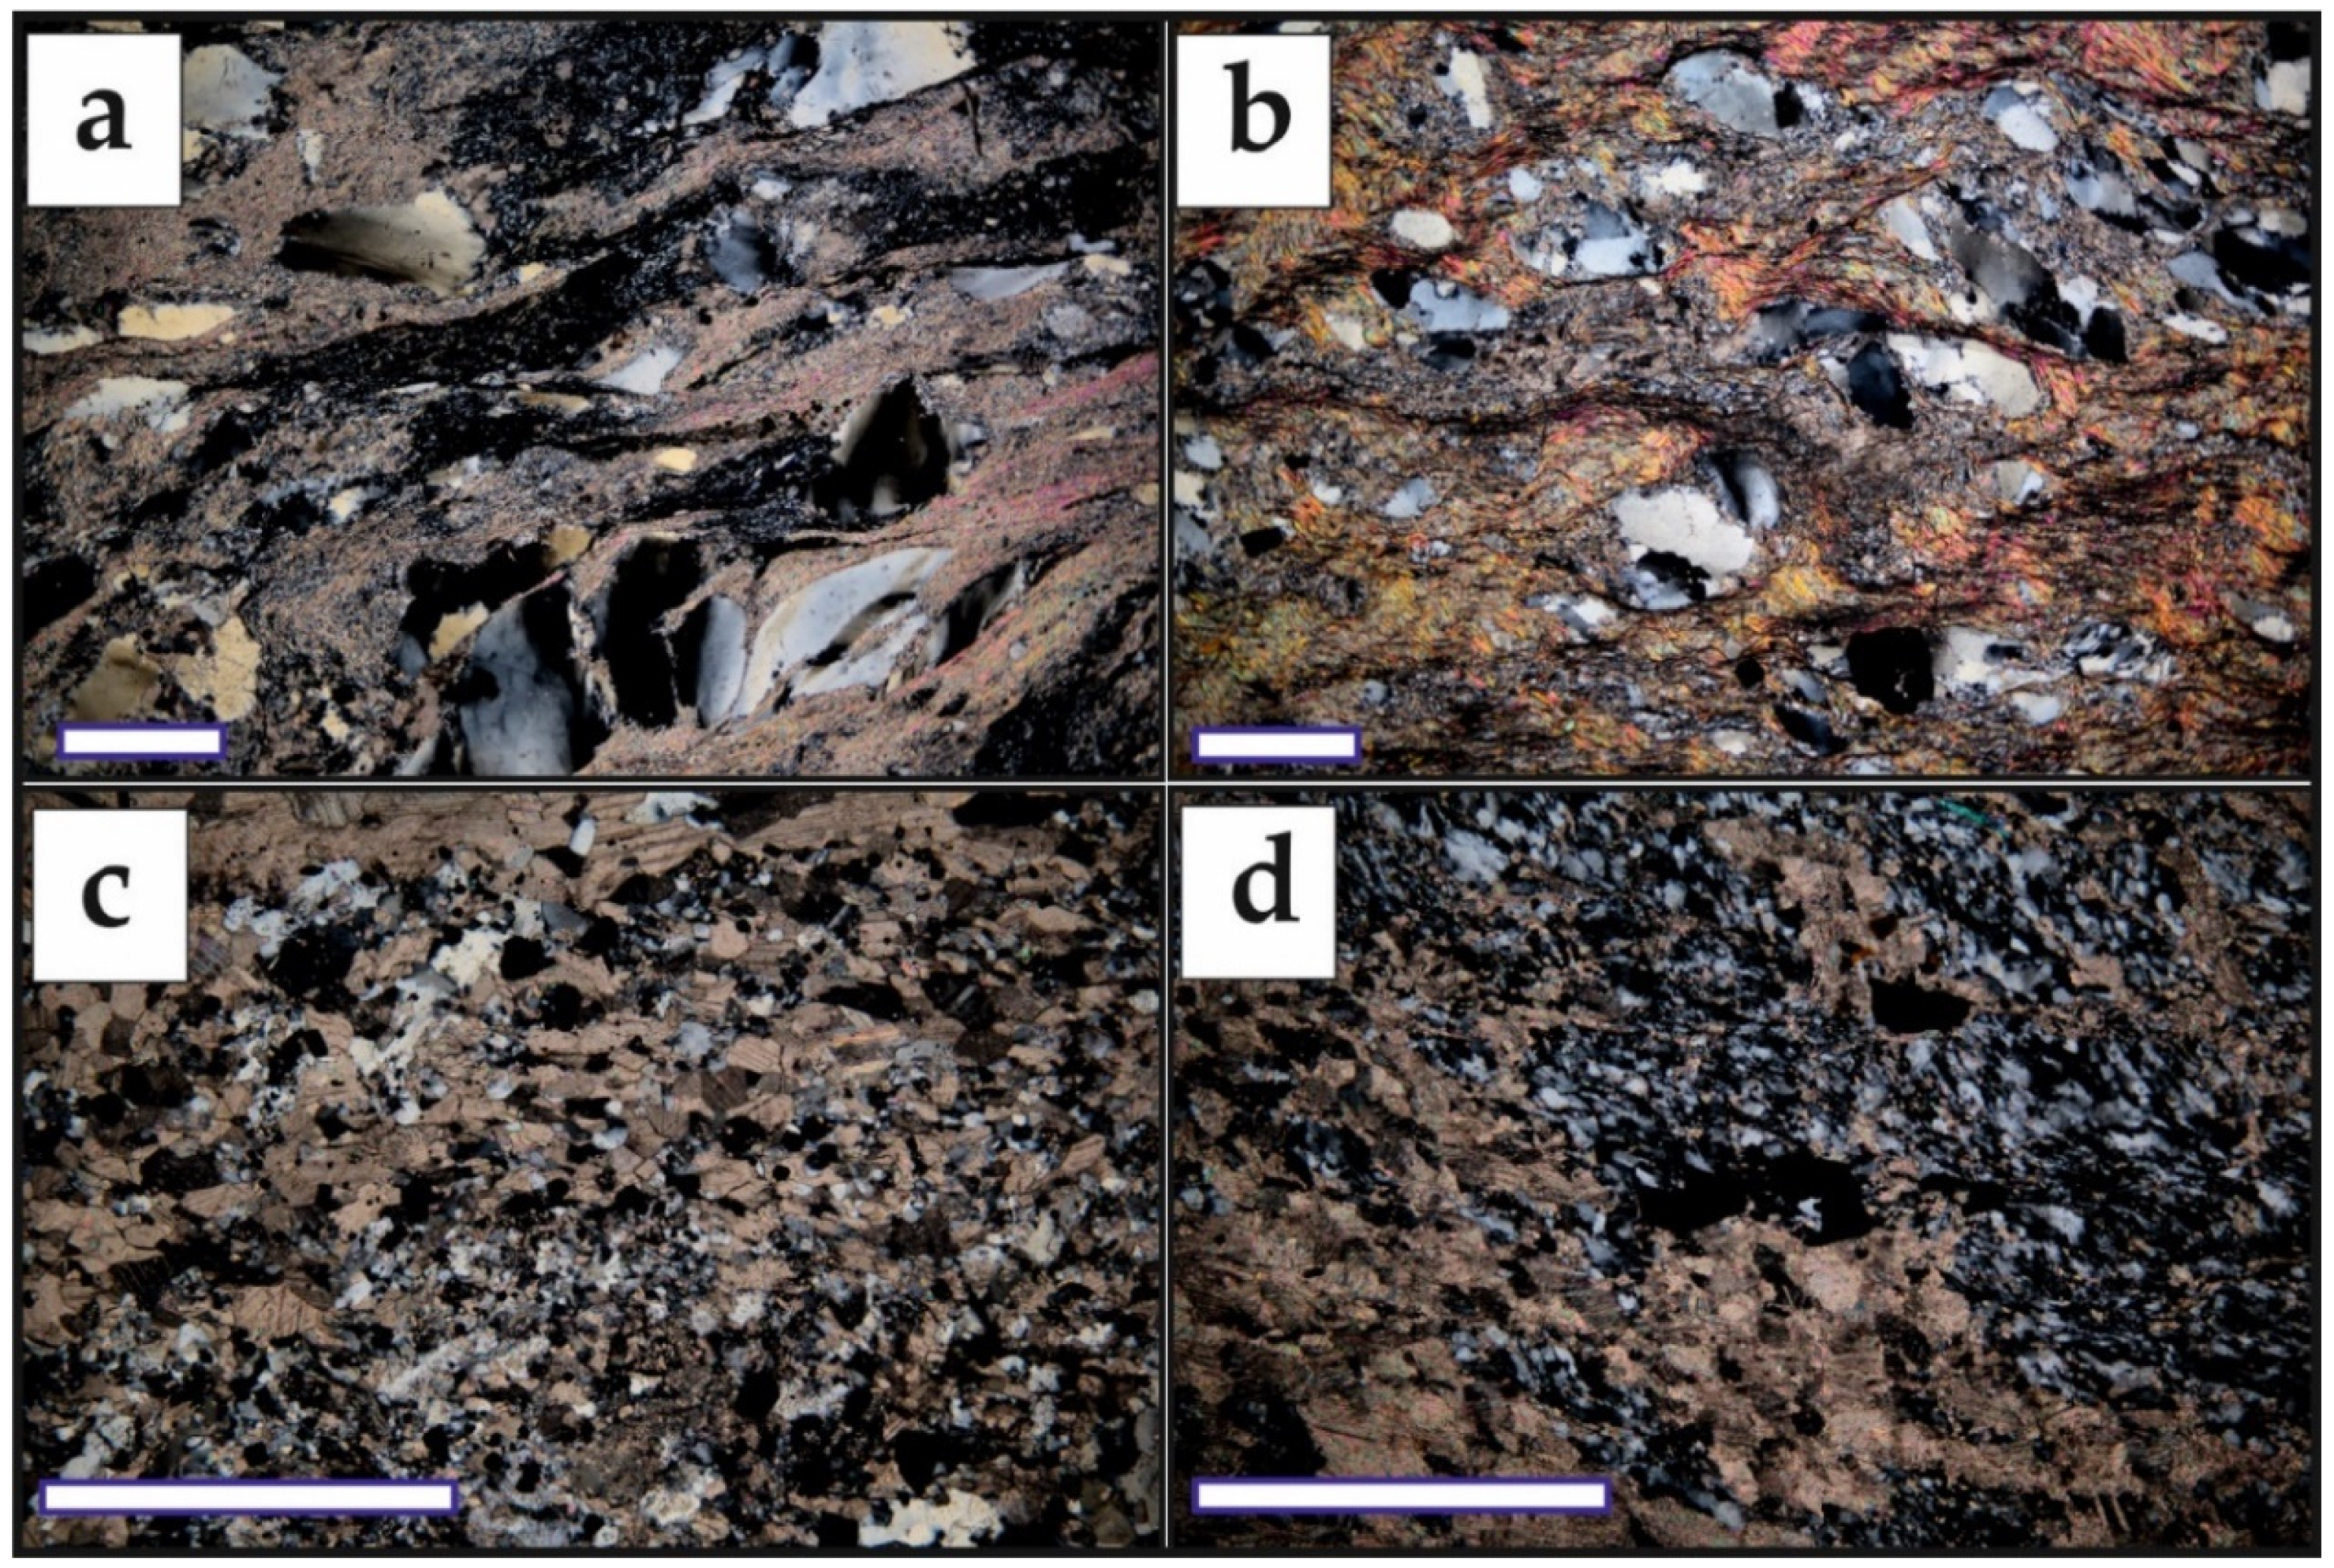
Altered host rocks. Ore-hosting rocks at the Zun-Kholba gold deposit have undergone intensive crushing and metasomatic alterations. Wall rock alterations at the Zun-Kholba gold deposit are mainly sericitization, silicification, and sulfidization. Moreover, ultrabasic rocks composing some blocks are listvenitized. These alterations characterize all the rocks that are mostly present as tectonites or cataclasites (e.g., crushed granitoids, gneisses, and ophiolitic rocks) and impure (silicified and sulfidized) limestones. These altered rocks often have flow textures indicating the metasomatic origin of the quartz–sulfide-mineralized zones (Figure 4).
Mineral composition of ores. The ore mineral composition of the Zun-Kholba gold deposit has been described in detail by previous workers [11,12,13,22]. The main ore minerals comprising the quartz–sulfide ores are presented in Table 1. Our study confirms the previous results, but we additionally identified some minerals such as millerite and vikingite. The most common ore mineral is pyrite. Pyrrhotite, sphalerite, galena, chalcopyrite, tetrahedrite, and native gold and rare arsenopyrite, hessite, native bismuth, scheelite, tetradymite, millerite, and vikingite were also identified. The main mineral assemblage in the quartz–sulfide ores is mainly independent of the wall rock composition.
Ore bodies are represented by two types of mineralizations: (1) quartz–pyrite and (2) quartz–base metal–sulfide (pyrite–chalcopyrite–sphalerite–galena). Among them, there are relics of pre-ore VMS sulfide (pyrite–pyrrhotite) bodies.
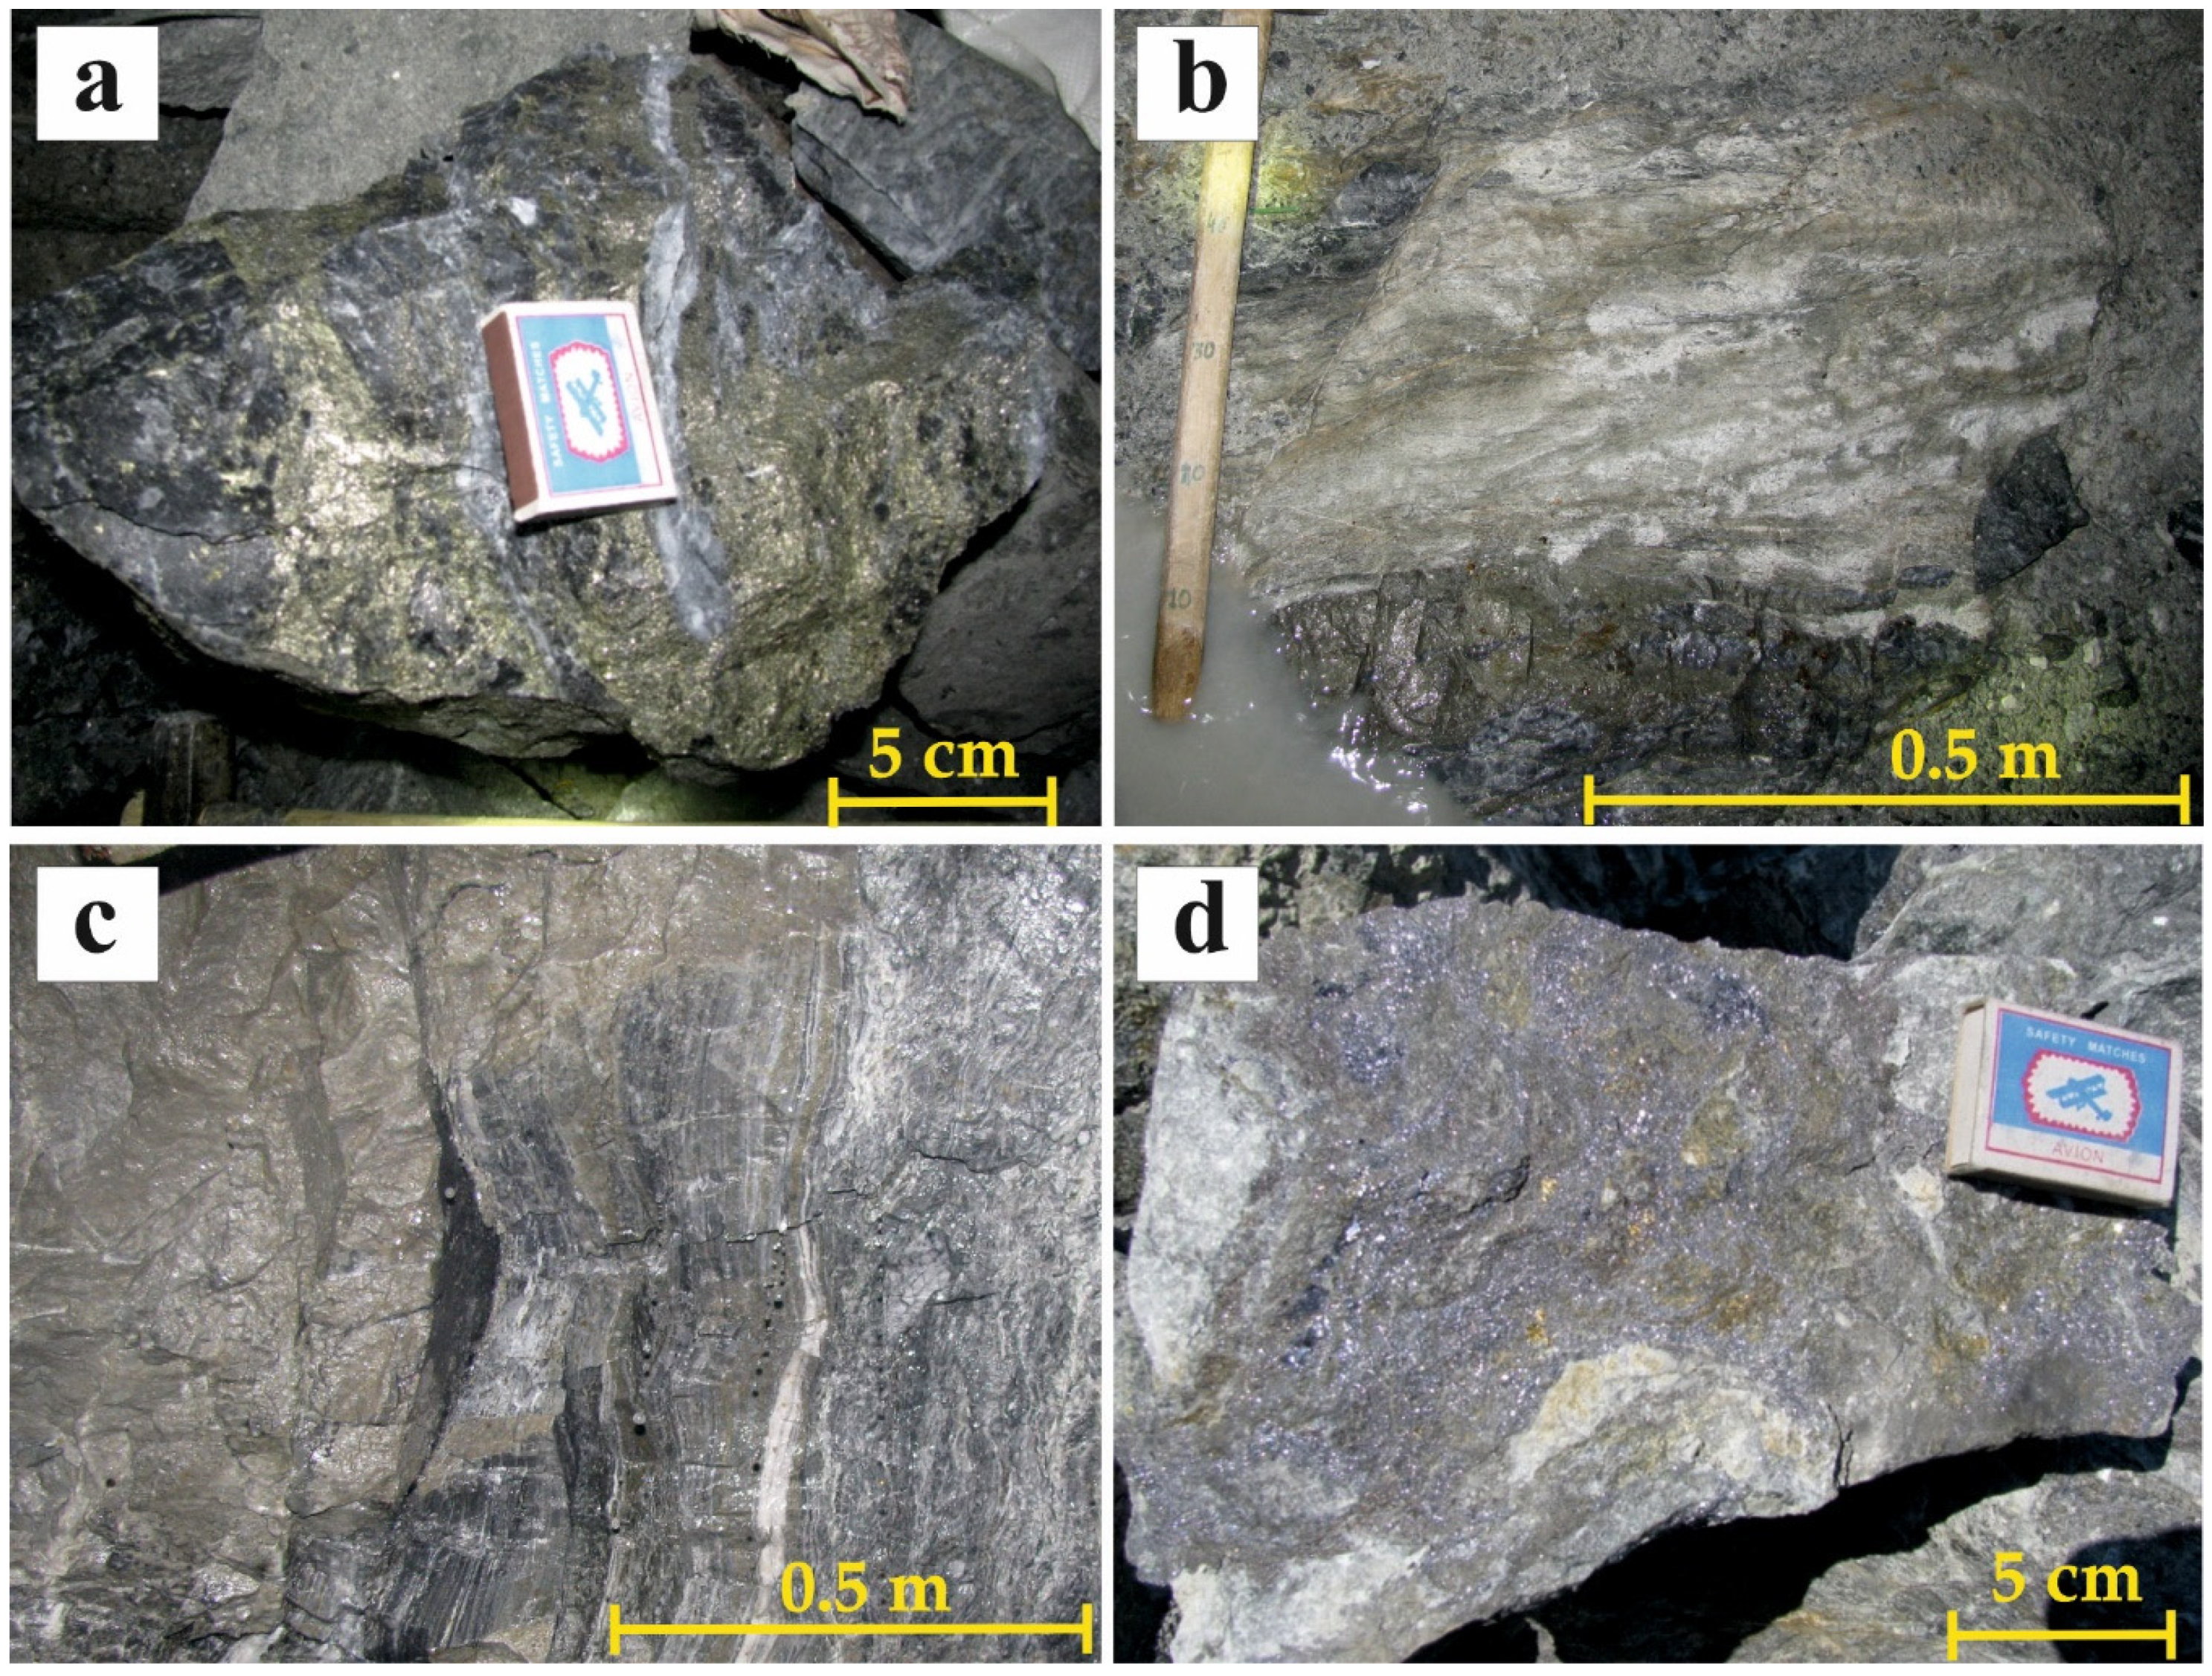
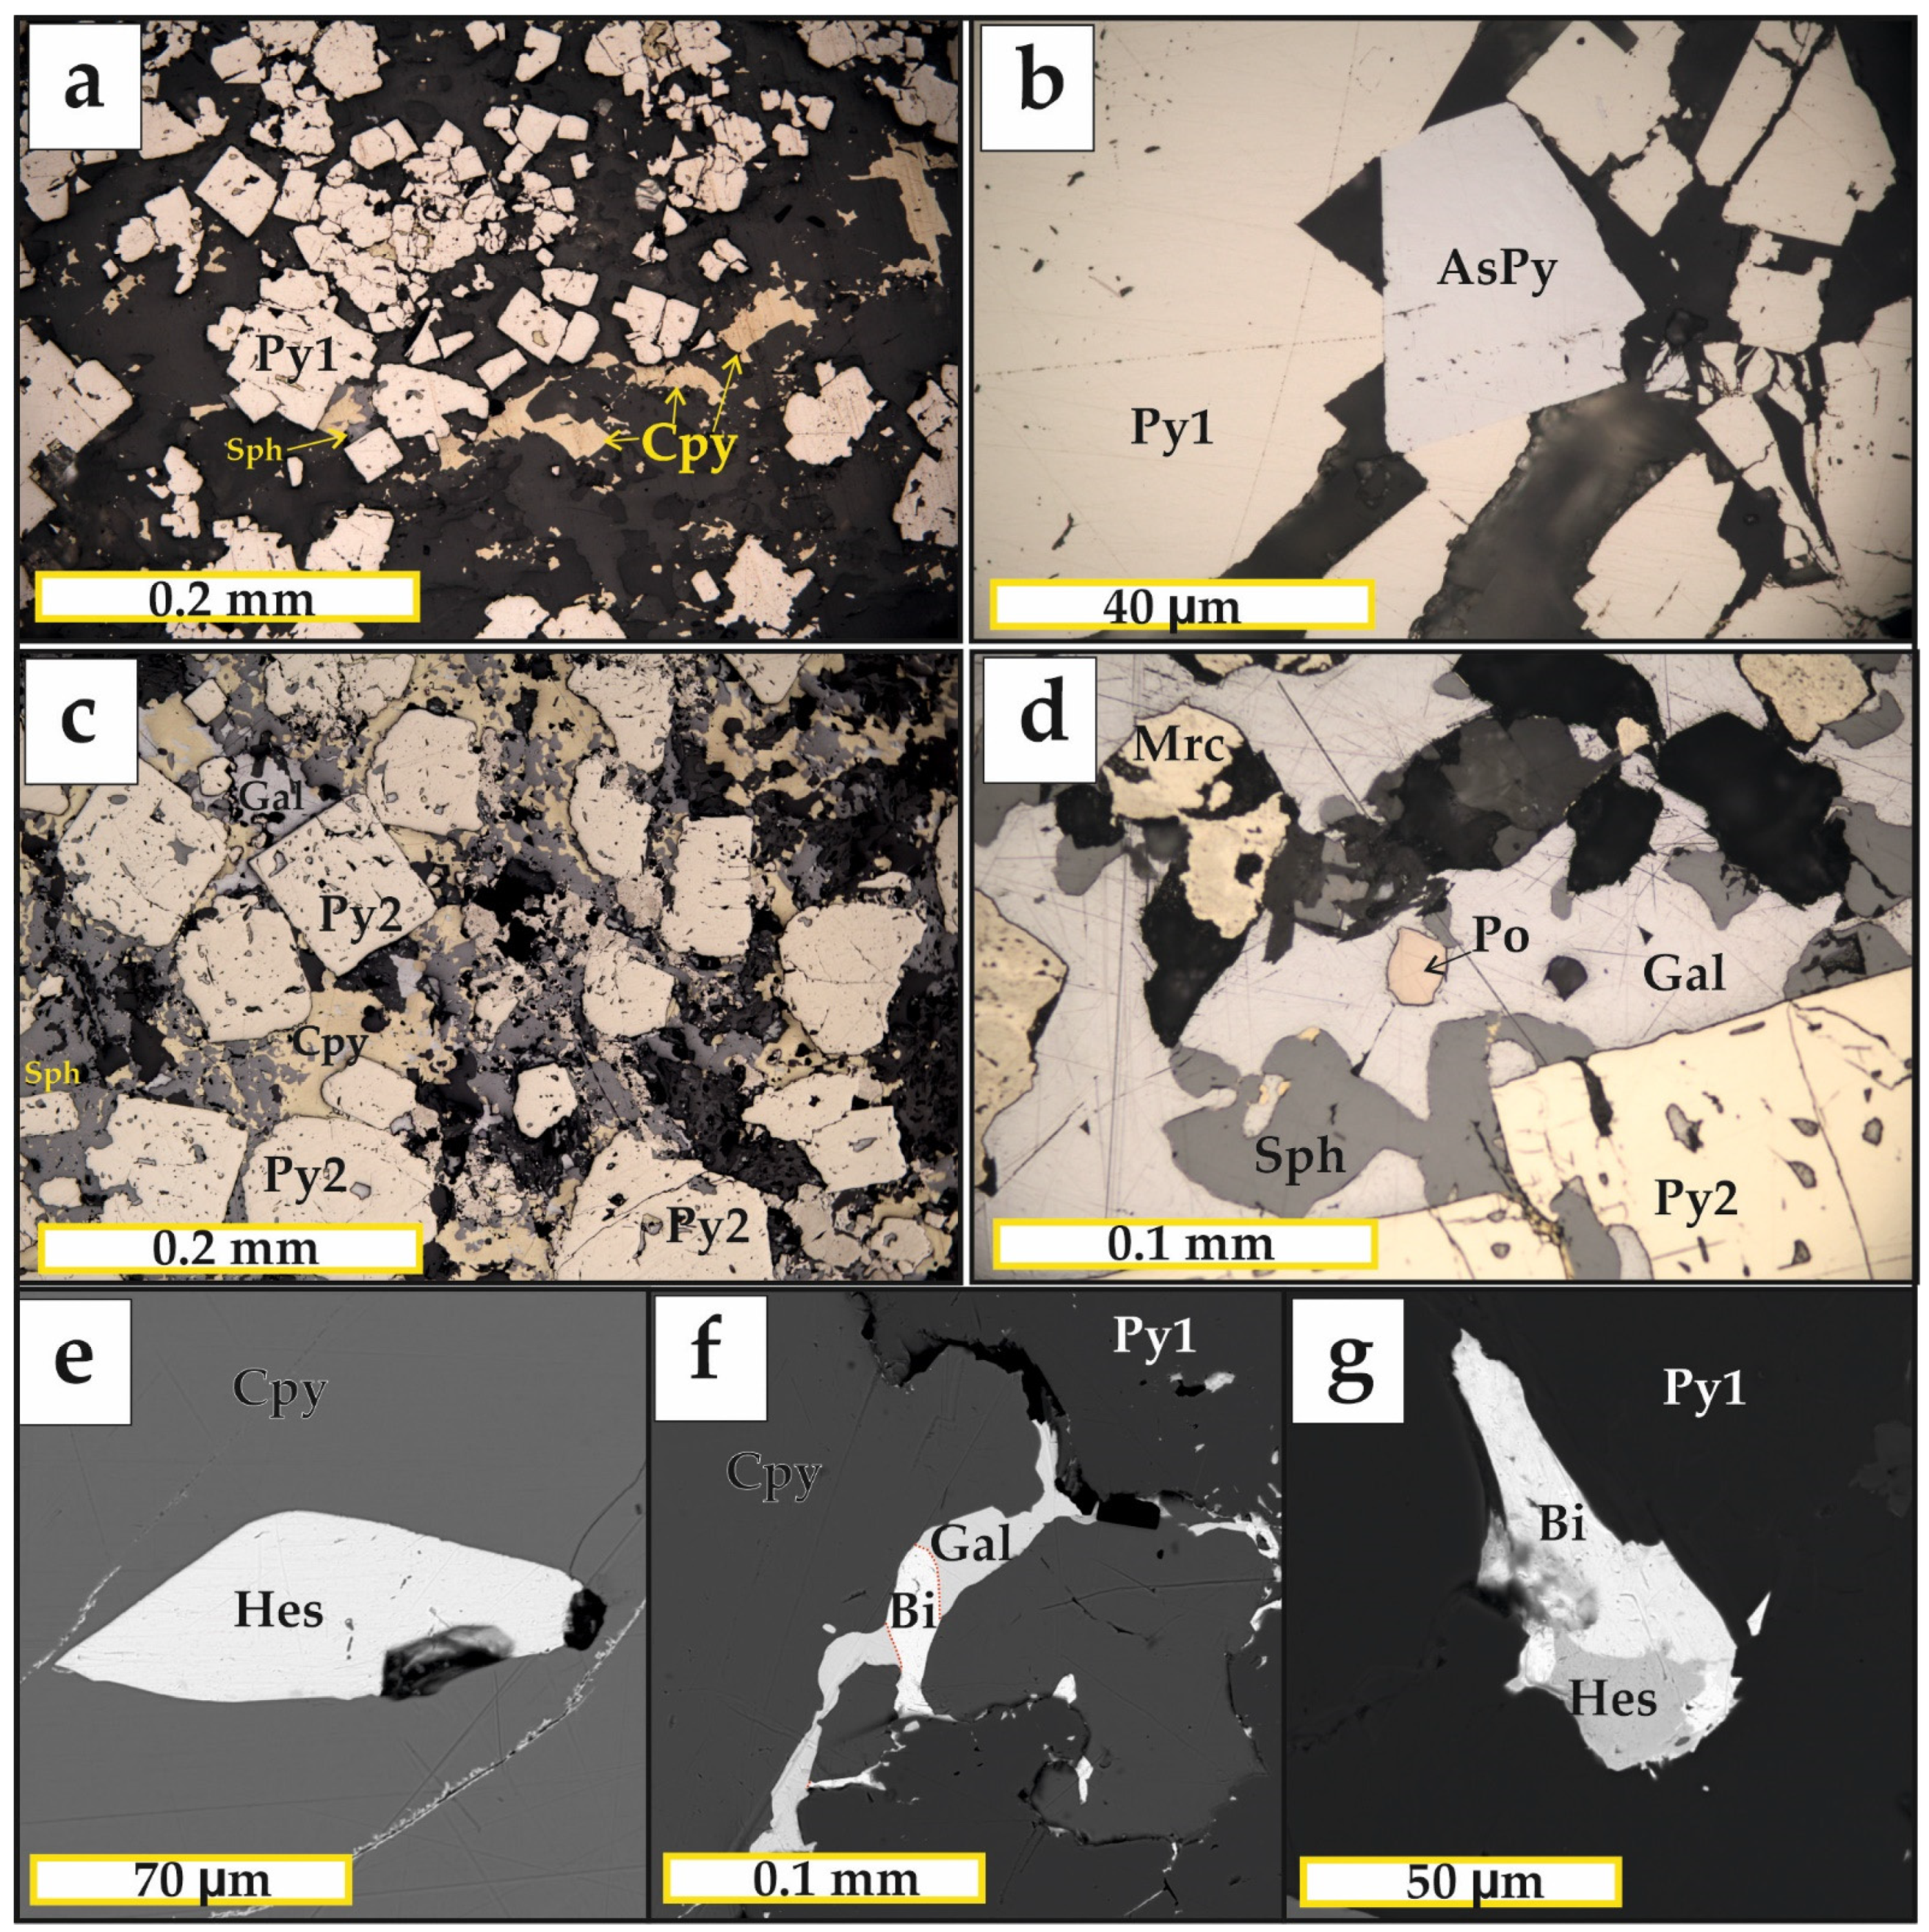
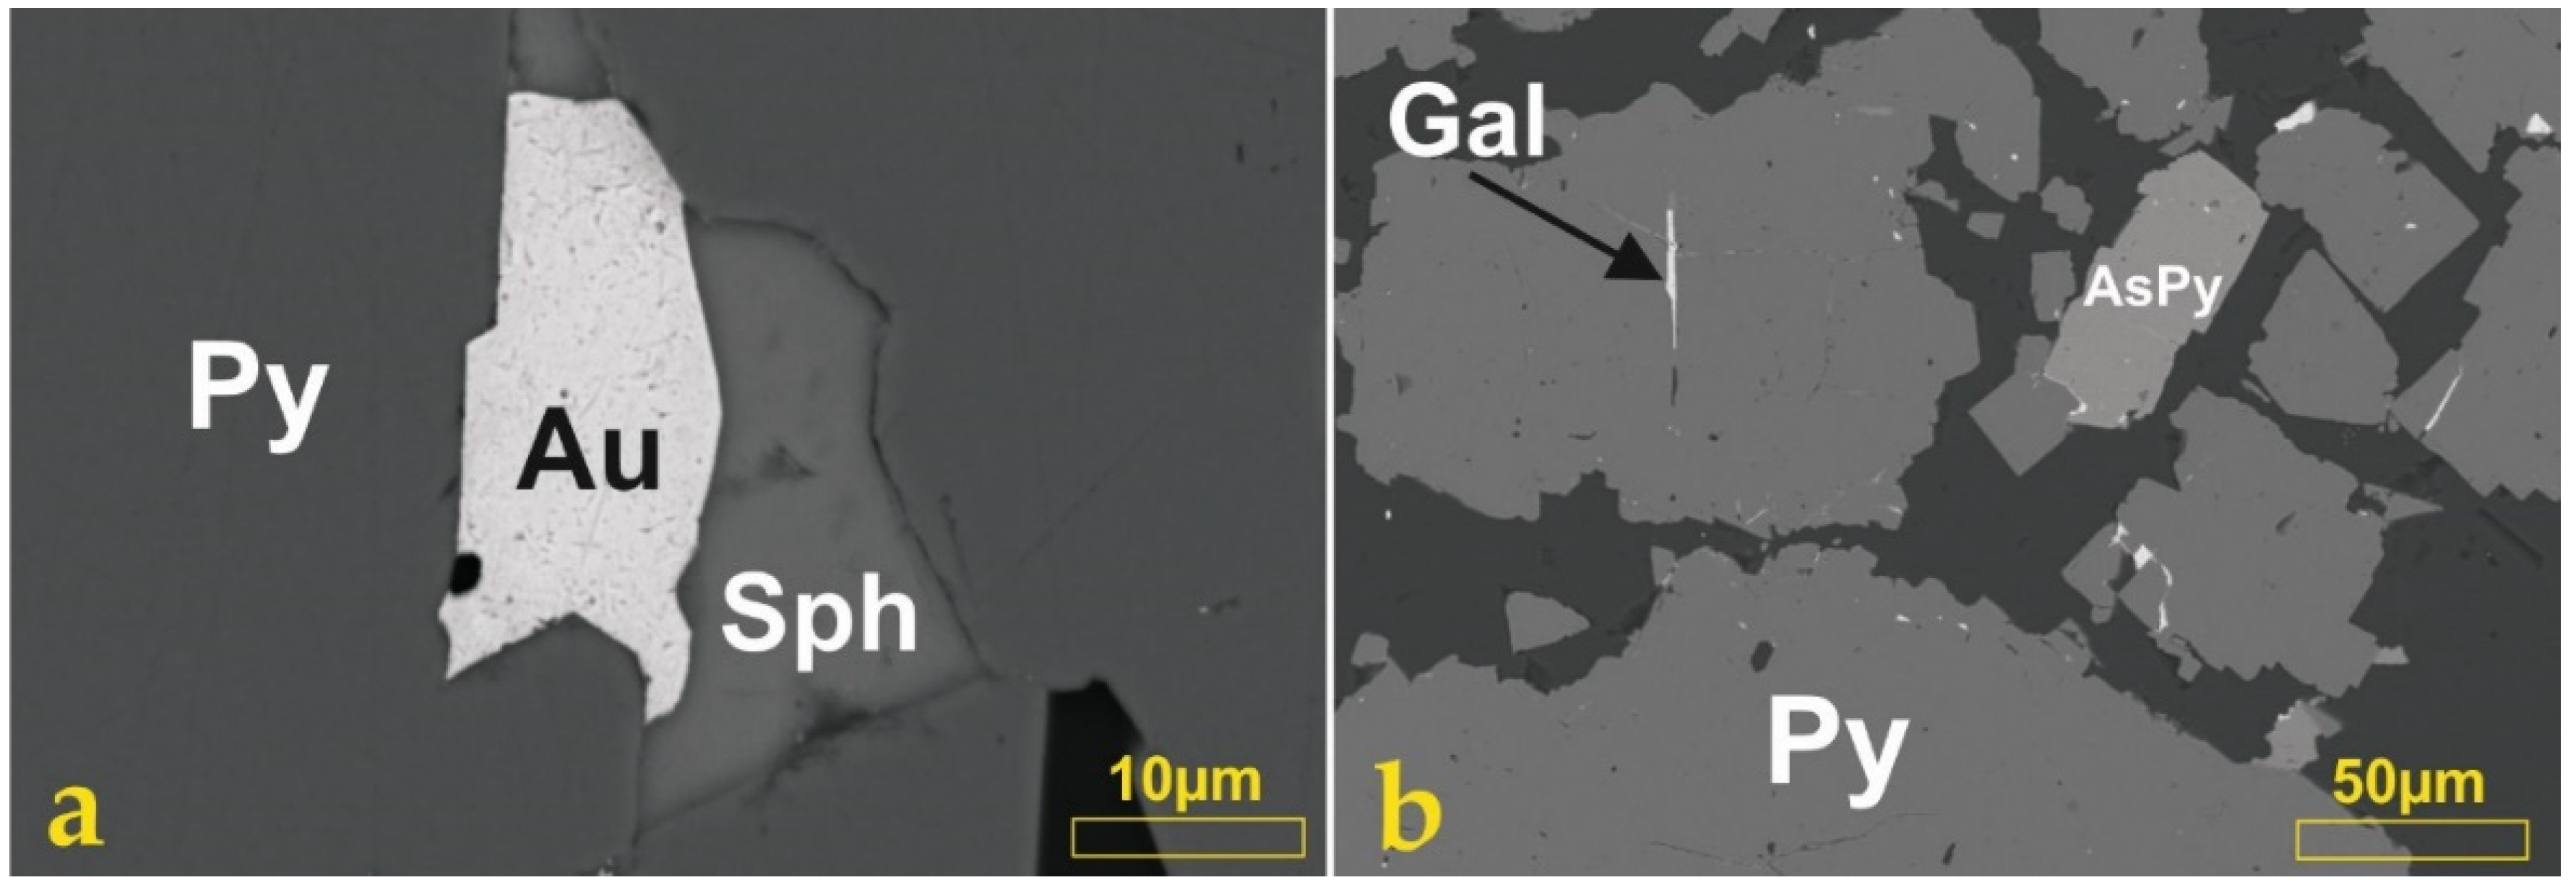
The predominant quartz–pyrite ores are composed of parallel bands of gray, dark gray, and white quartz; grayish-white carbonate; and nesting, veined, banded, and embedded sulfide assemblages (Figure 5a). These ores can replace different rock assemblages—cataclasites after granitoids and gneisses, schists, limestones, listvenites, etc. (Figure 5b,c) However, the ore composition is independent from the initial rocks that underwent replacing. The sulfide mineral content is up to 40%–50%, but most often, it is 20%–30%. The main sulfide mineral is pyrite, which is further indicated as pyrite-1 (Figure 6a). Minor ore-forming minerals are chalcopyrite, galena, sphalerite, arsenopyrite, and native gold, and rare minerals are Te- and Bi-bearing phases (hessite, native bismuth, tetradymite, and vikingite), (Figure 6f,g). Arsenopyrite is present only in associations with pyrite and forms euhedral crystals (Figure 6b).
Quartz–base metal–sulfide (pyrite–chalcopyrite–sphalerite–galena) ores are represented by sulfide-bearing quartz veins and veinlets that occur only in the upper levels of the deposit and in surface exposures. The sulfide mineral content is up to 50% (Figure 5d). The main ore minerals are pyrite, galena, sphalerite, chalcopyrite, and tetrahedrite, with minor pyrrhotite, marcasite, and rare hessite as sporadic micro-inclusions (Figure 6e). Pyrite prevails and forms aggregates of euhedral and subhedral crystals, which are partially corroded by relatively late base metal–sulfides (chalcopyrite, galena, and sphalerite) (Figure 6c,d). This pyrite is further indicated as pyrite2. Marcasite is minor, and it forms anhedral porous grains in association with base metal–sulfides (see Figure 6d). Probably, marcasite is formed as a product of pyrrhotite replacement. Rare pyrrhotite relics are similar in morphology to marcasite grains. Scheelite is present as rare subhedral grains at the ore mineral hosting a quart–sericite aggregate. Base metal–sulfides (sphalerite, galena, chalcopyrite, pyrrhotite, and marcasite) are present as compound assemblages corroding pyrite2 crystal aggregates (see Figure 6c,d). These base metal–sulfide assemblages also include tetrahedrite grains. All minerals of this assemblage are anhedral. Some rare minerals such as hessite, native bismuth, tetradymite, and vikingite form small anhedral lens-like grains and veinlets intersecting the earlier base metal–sulfides—chalcopyrite and pyrite are sometimes rare minerals that form small anhedral grains in quartz.
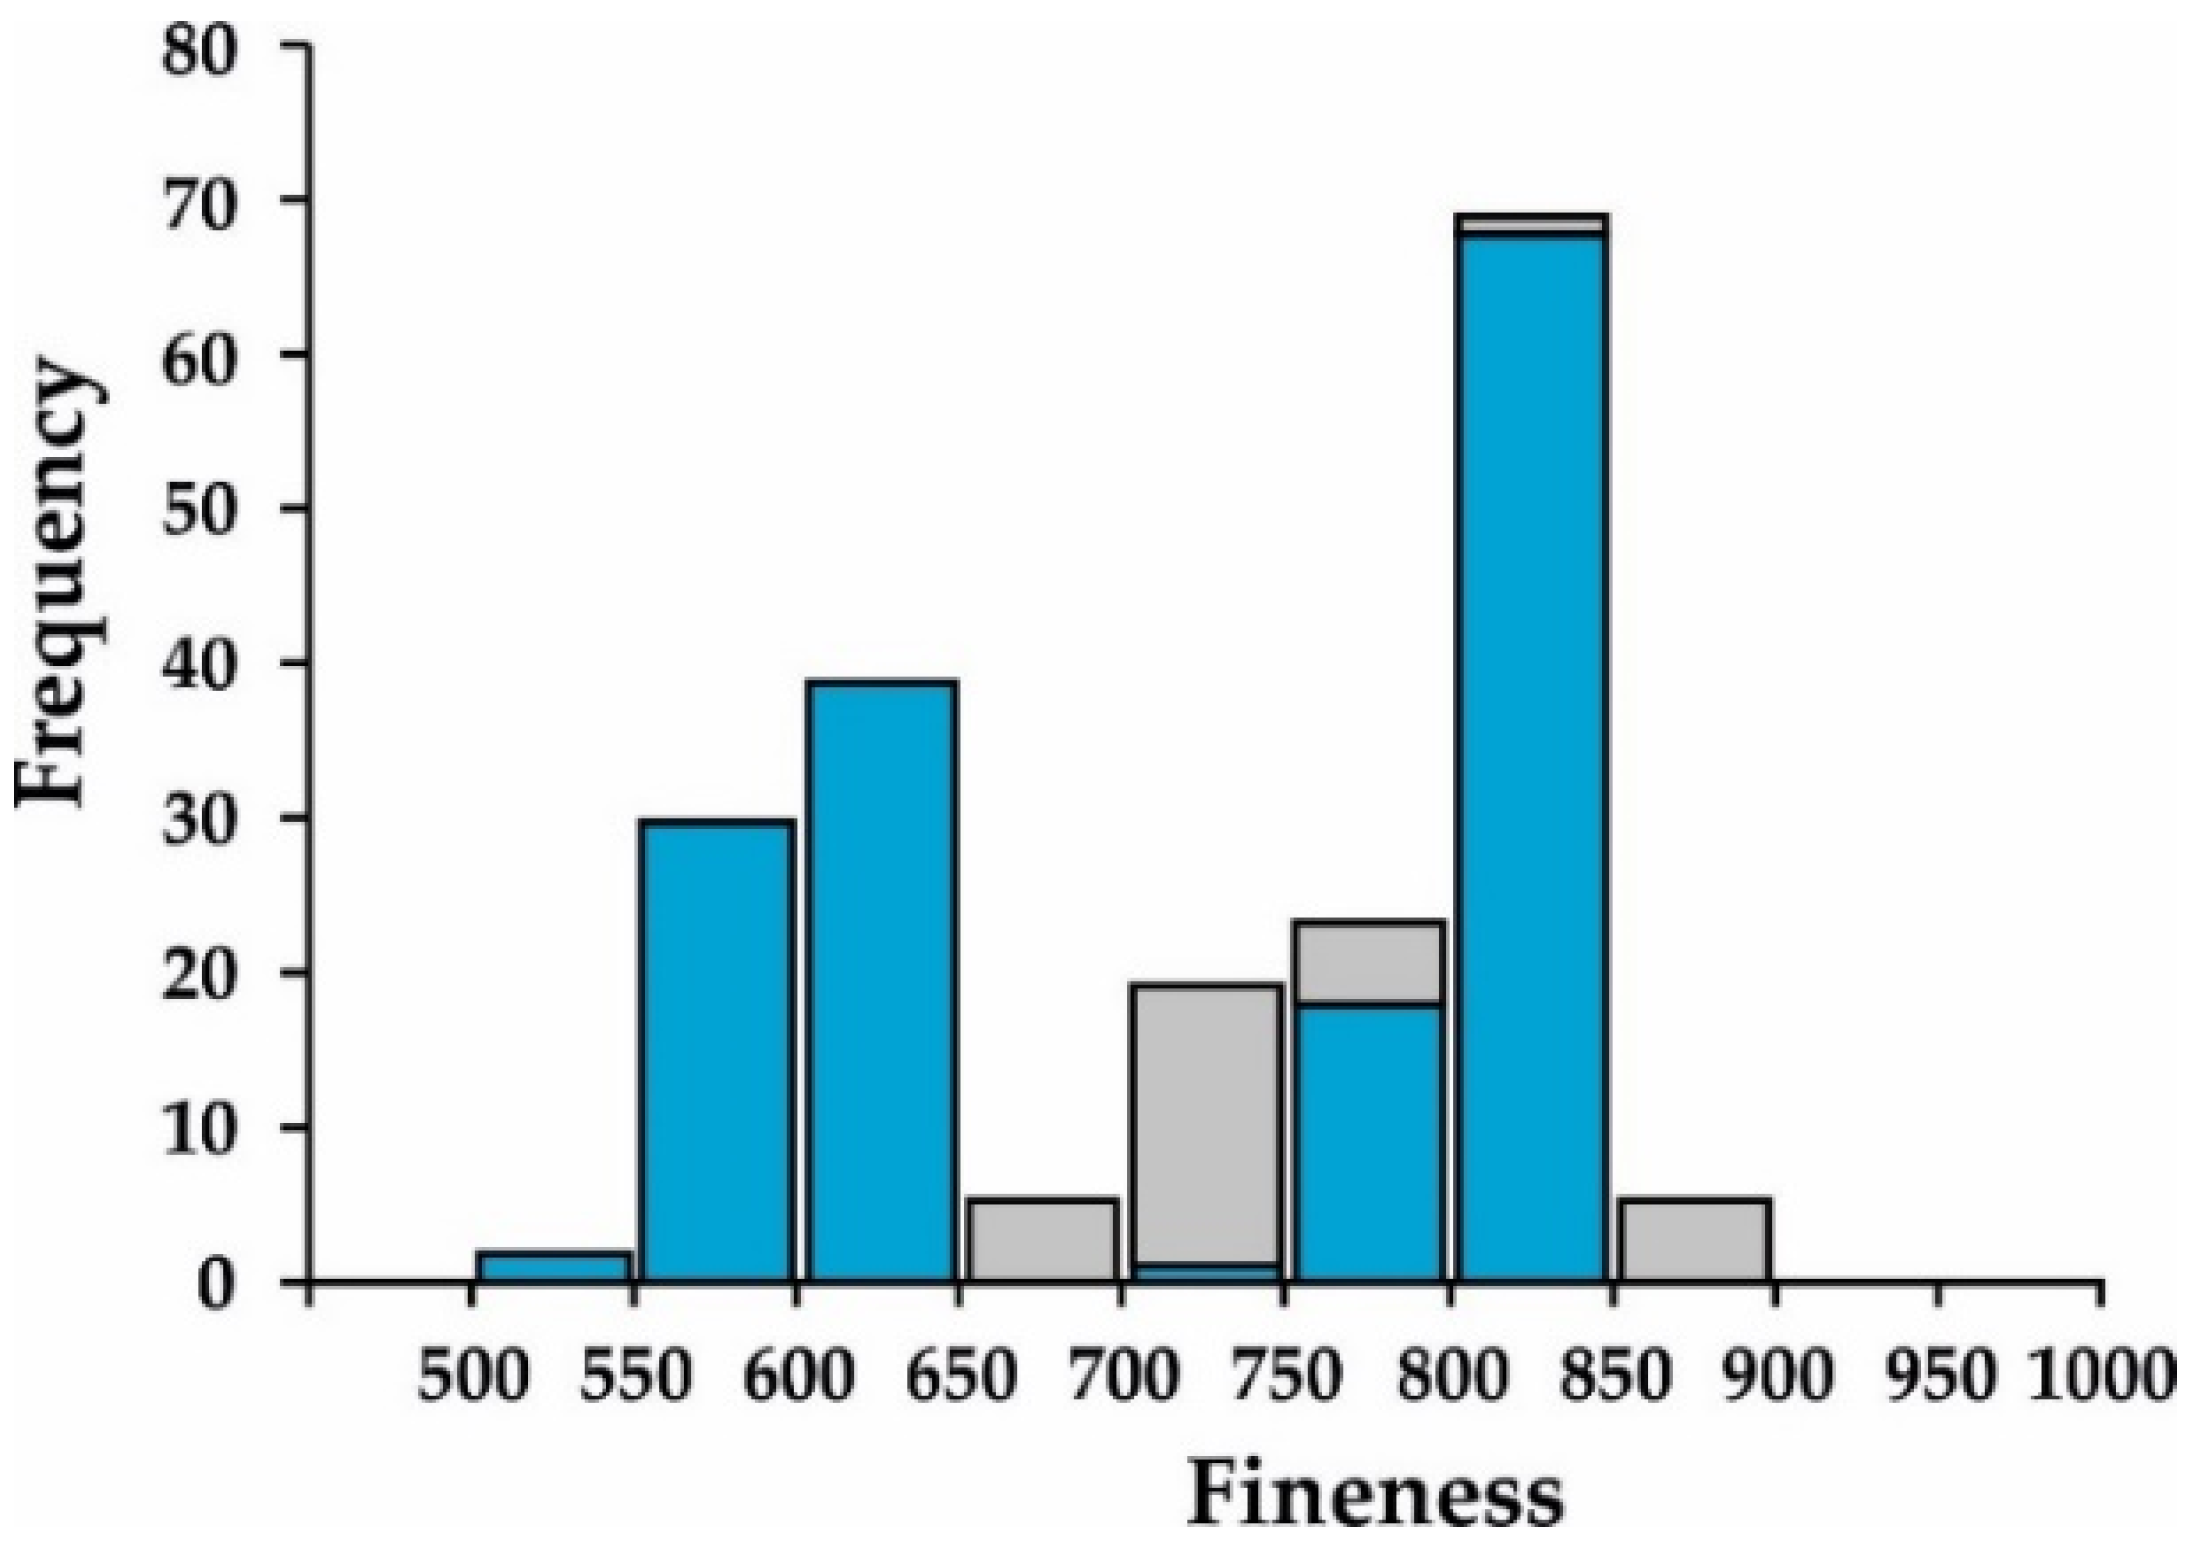
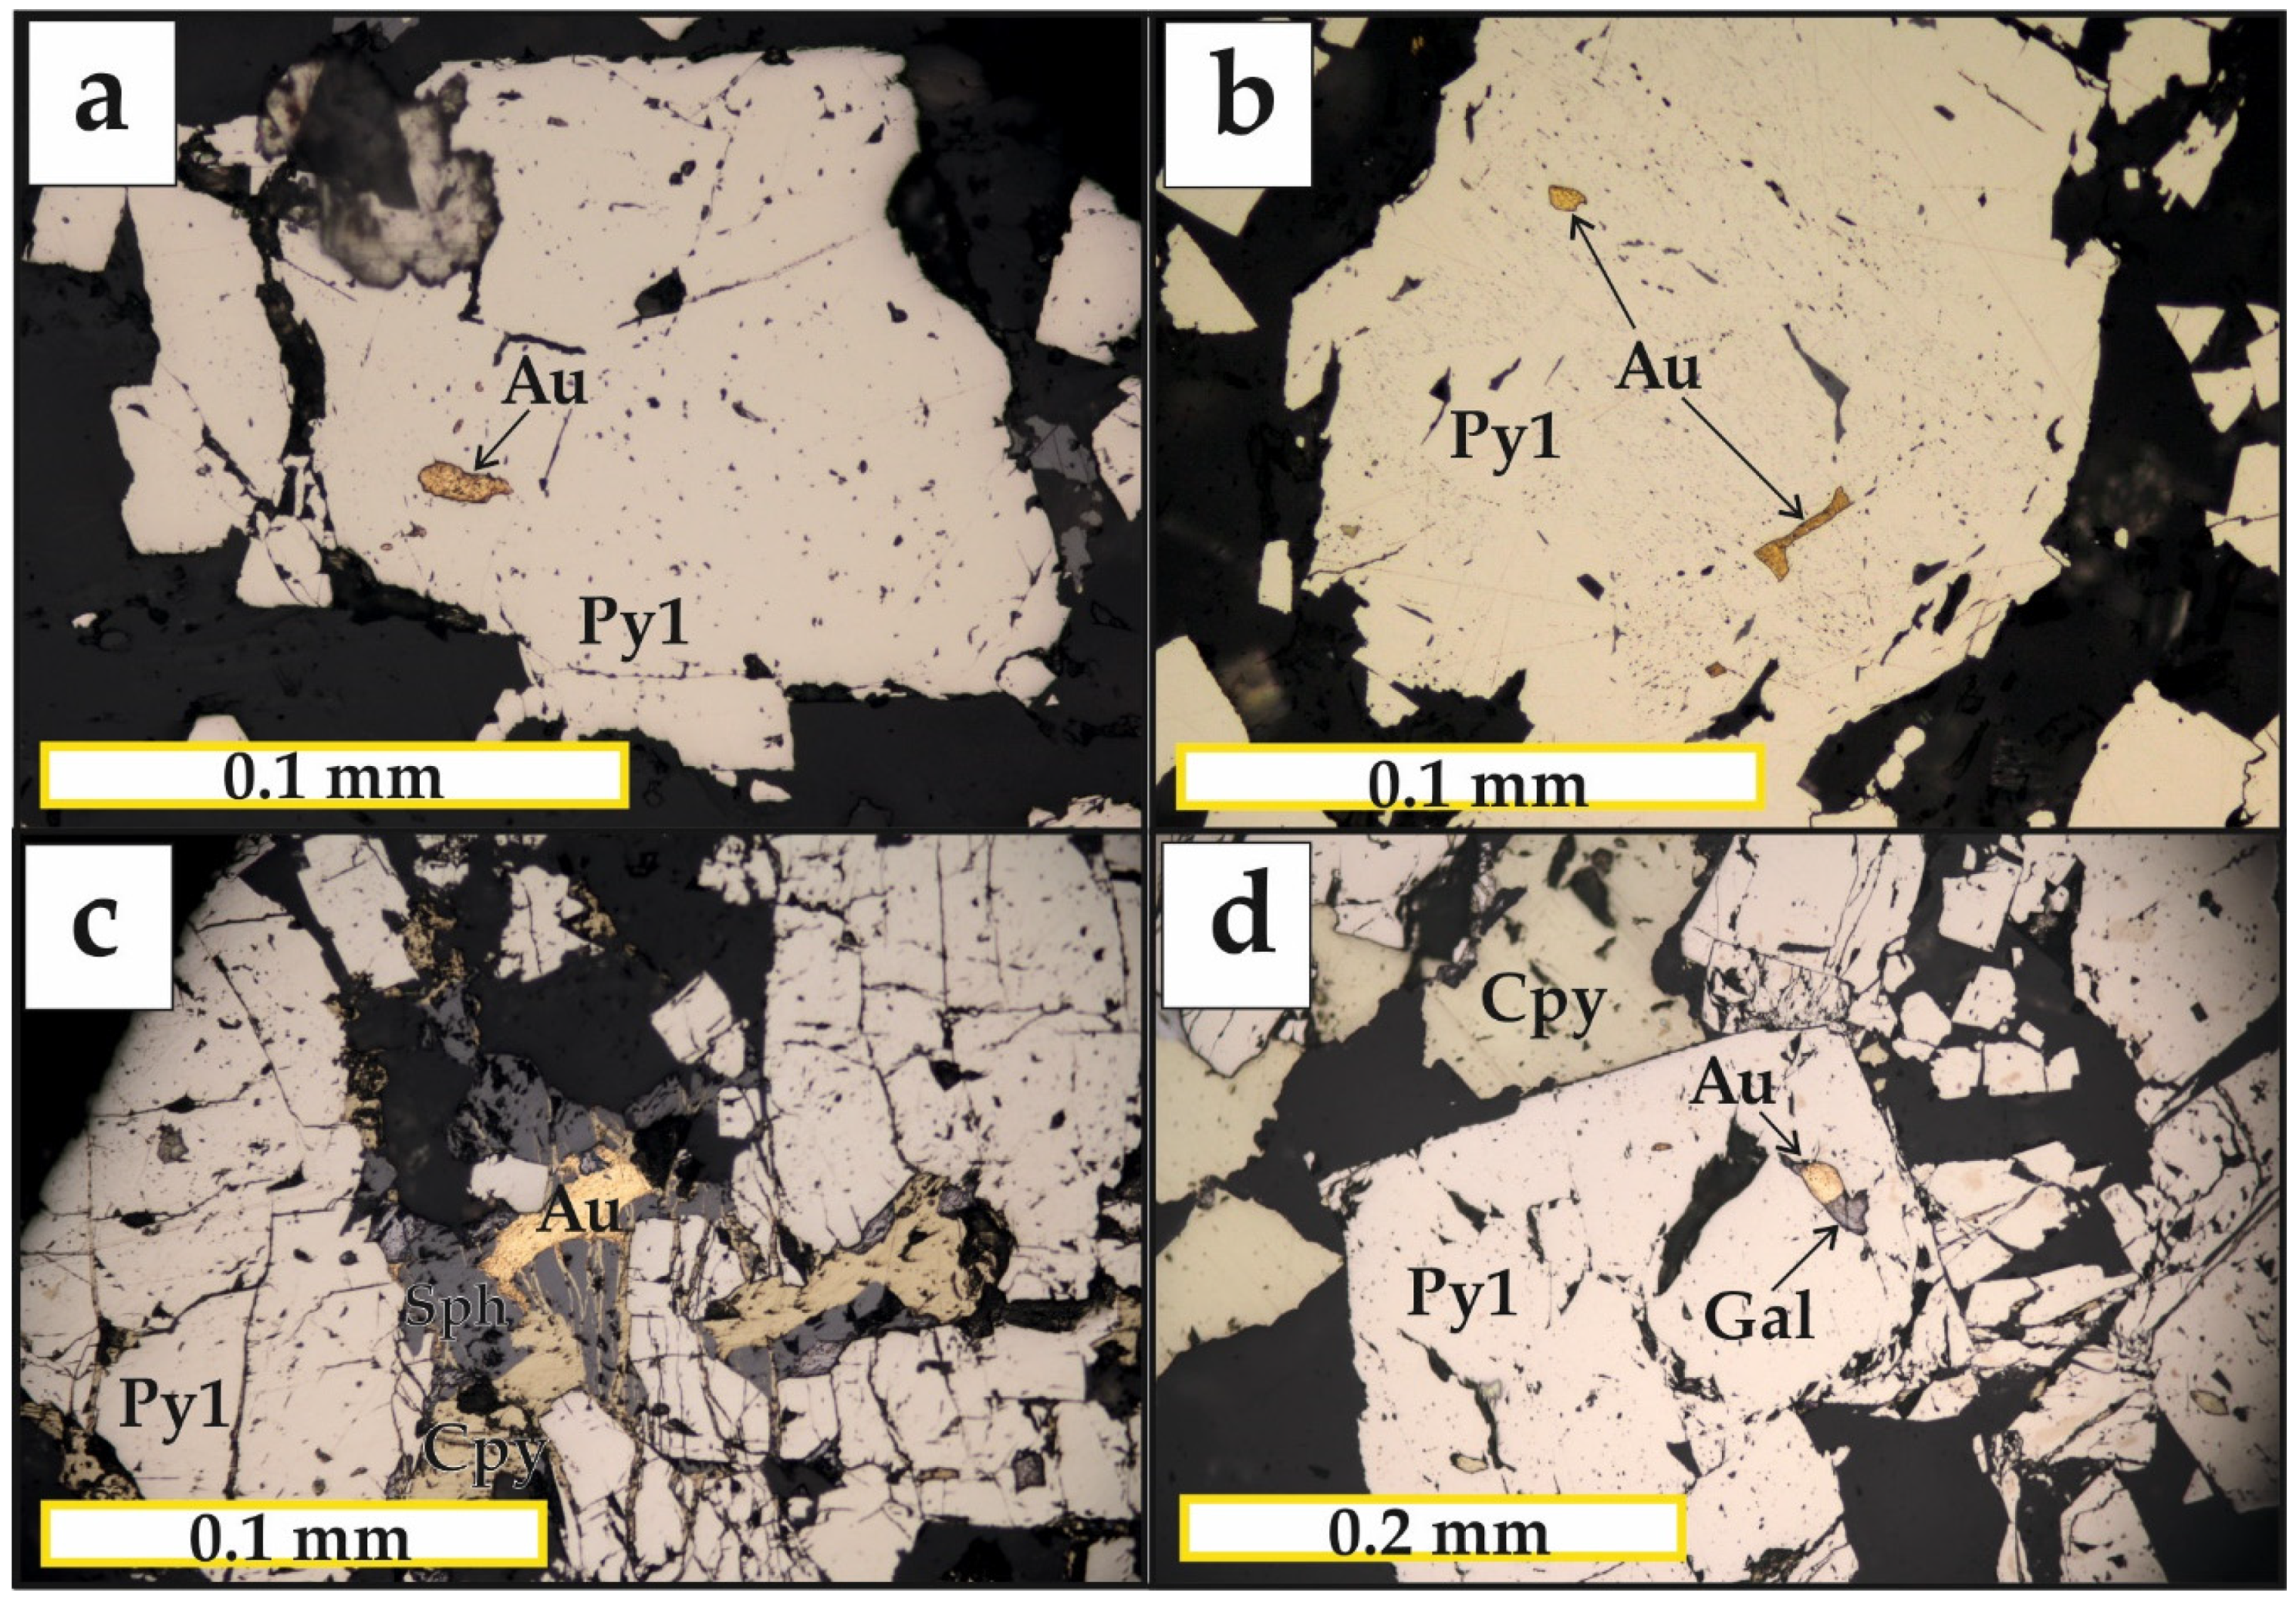
Native gold in the quartz–sulfide replacement ores is present as inclusions of various shapes in quartz and pyrite, often observed along the edges and in cracks of pyrite grains. Gold also forms aggregates with base metal–sulfides (galena, sphalerite, and chalcopyrite). According to chemical compositions, two gold types are distinguished: electrum with a fineness of 550–650‰ and medium-grade gold with a fineness of 750–850‰ (Figure 7). The medium-grade gold is associated with pyrite-1 (Figure 8a,b), whereas the low-grade gold (electrum) is associated with base metal–sulfides (Figure 8c,d). Additionally, Bi- and Te-bearing mineral assemblages contain low-grade gold, with modal fineness values of about 600‰. The gold composition is independent of the depth.
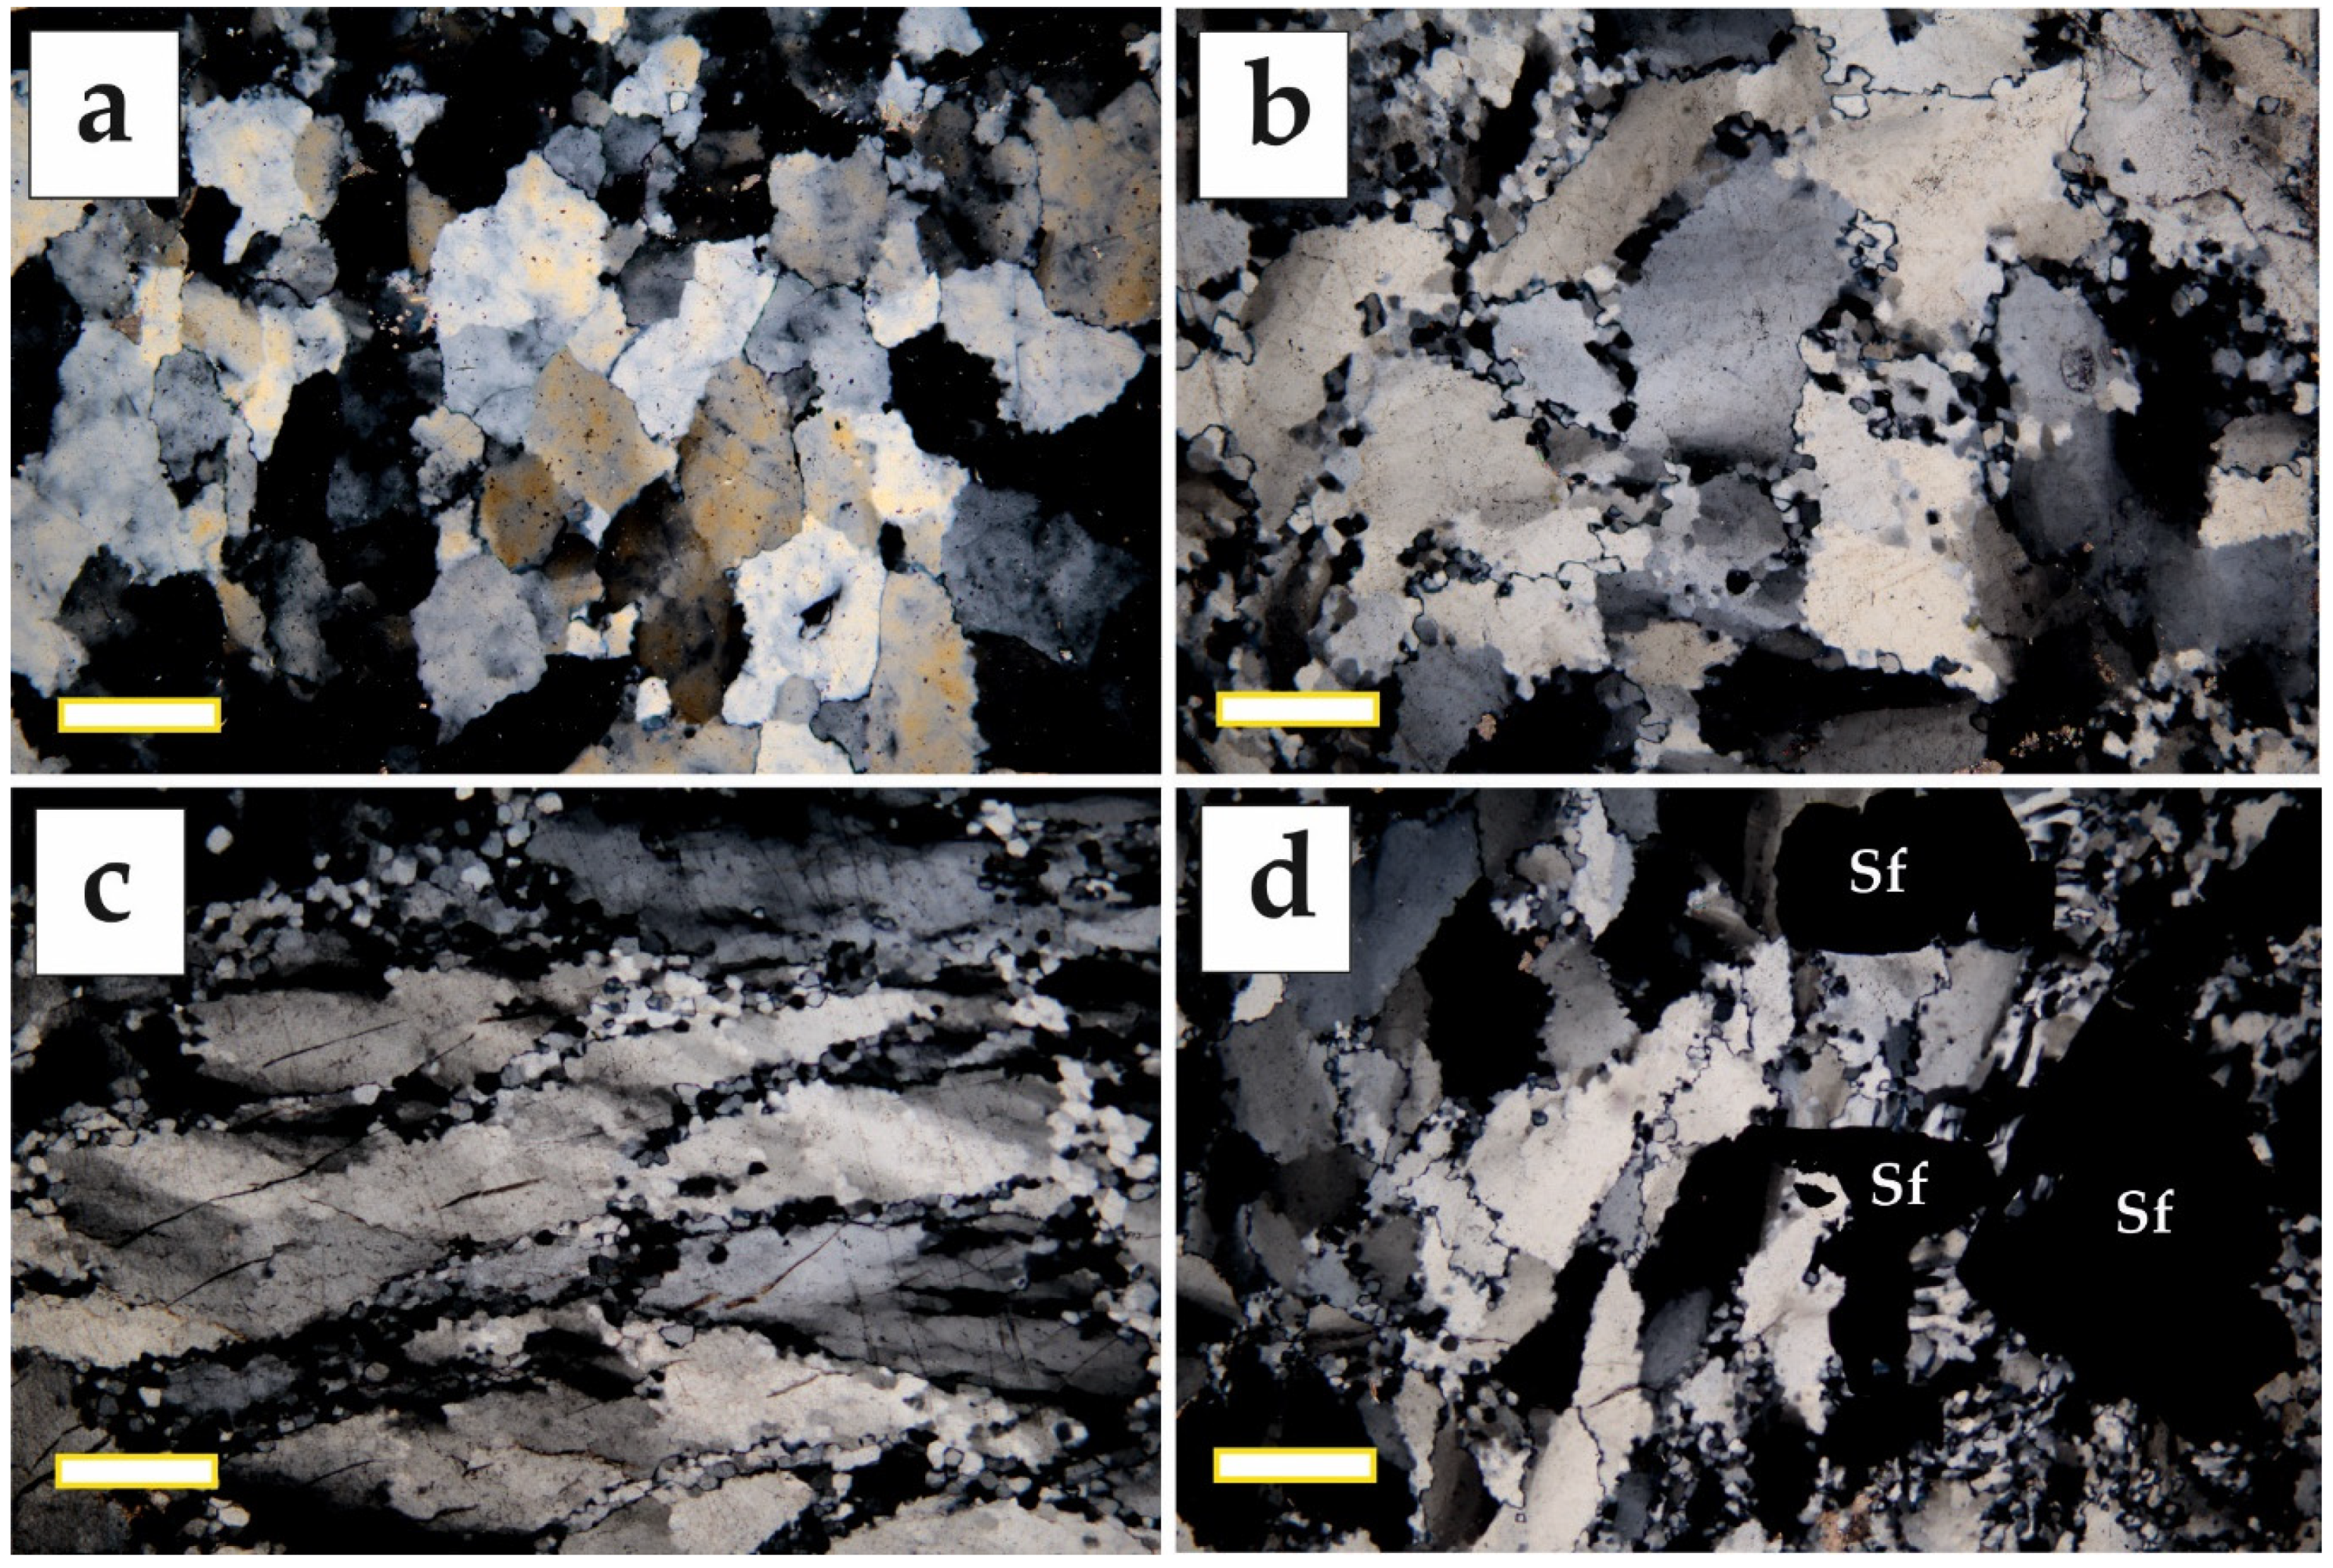
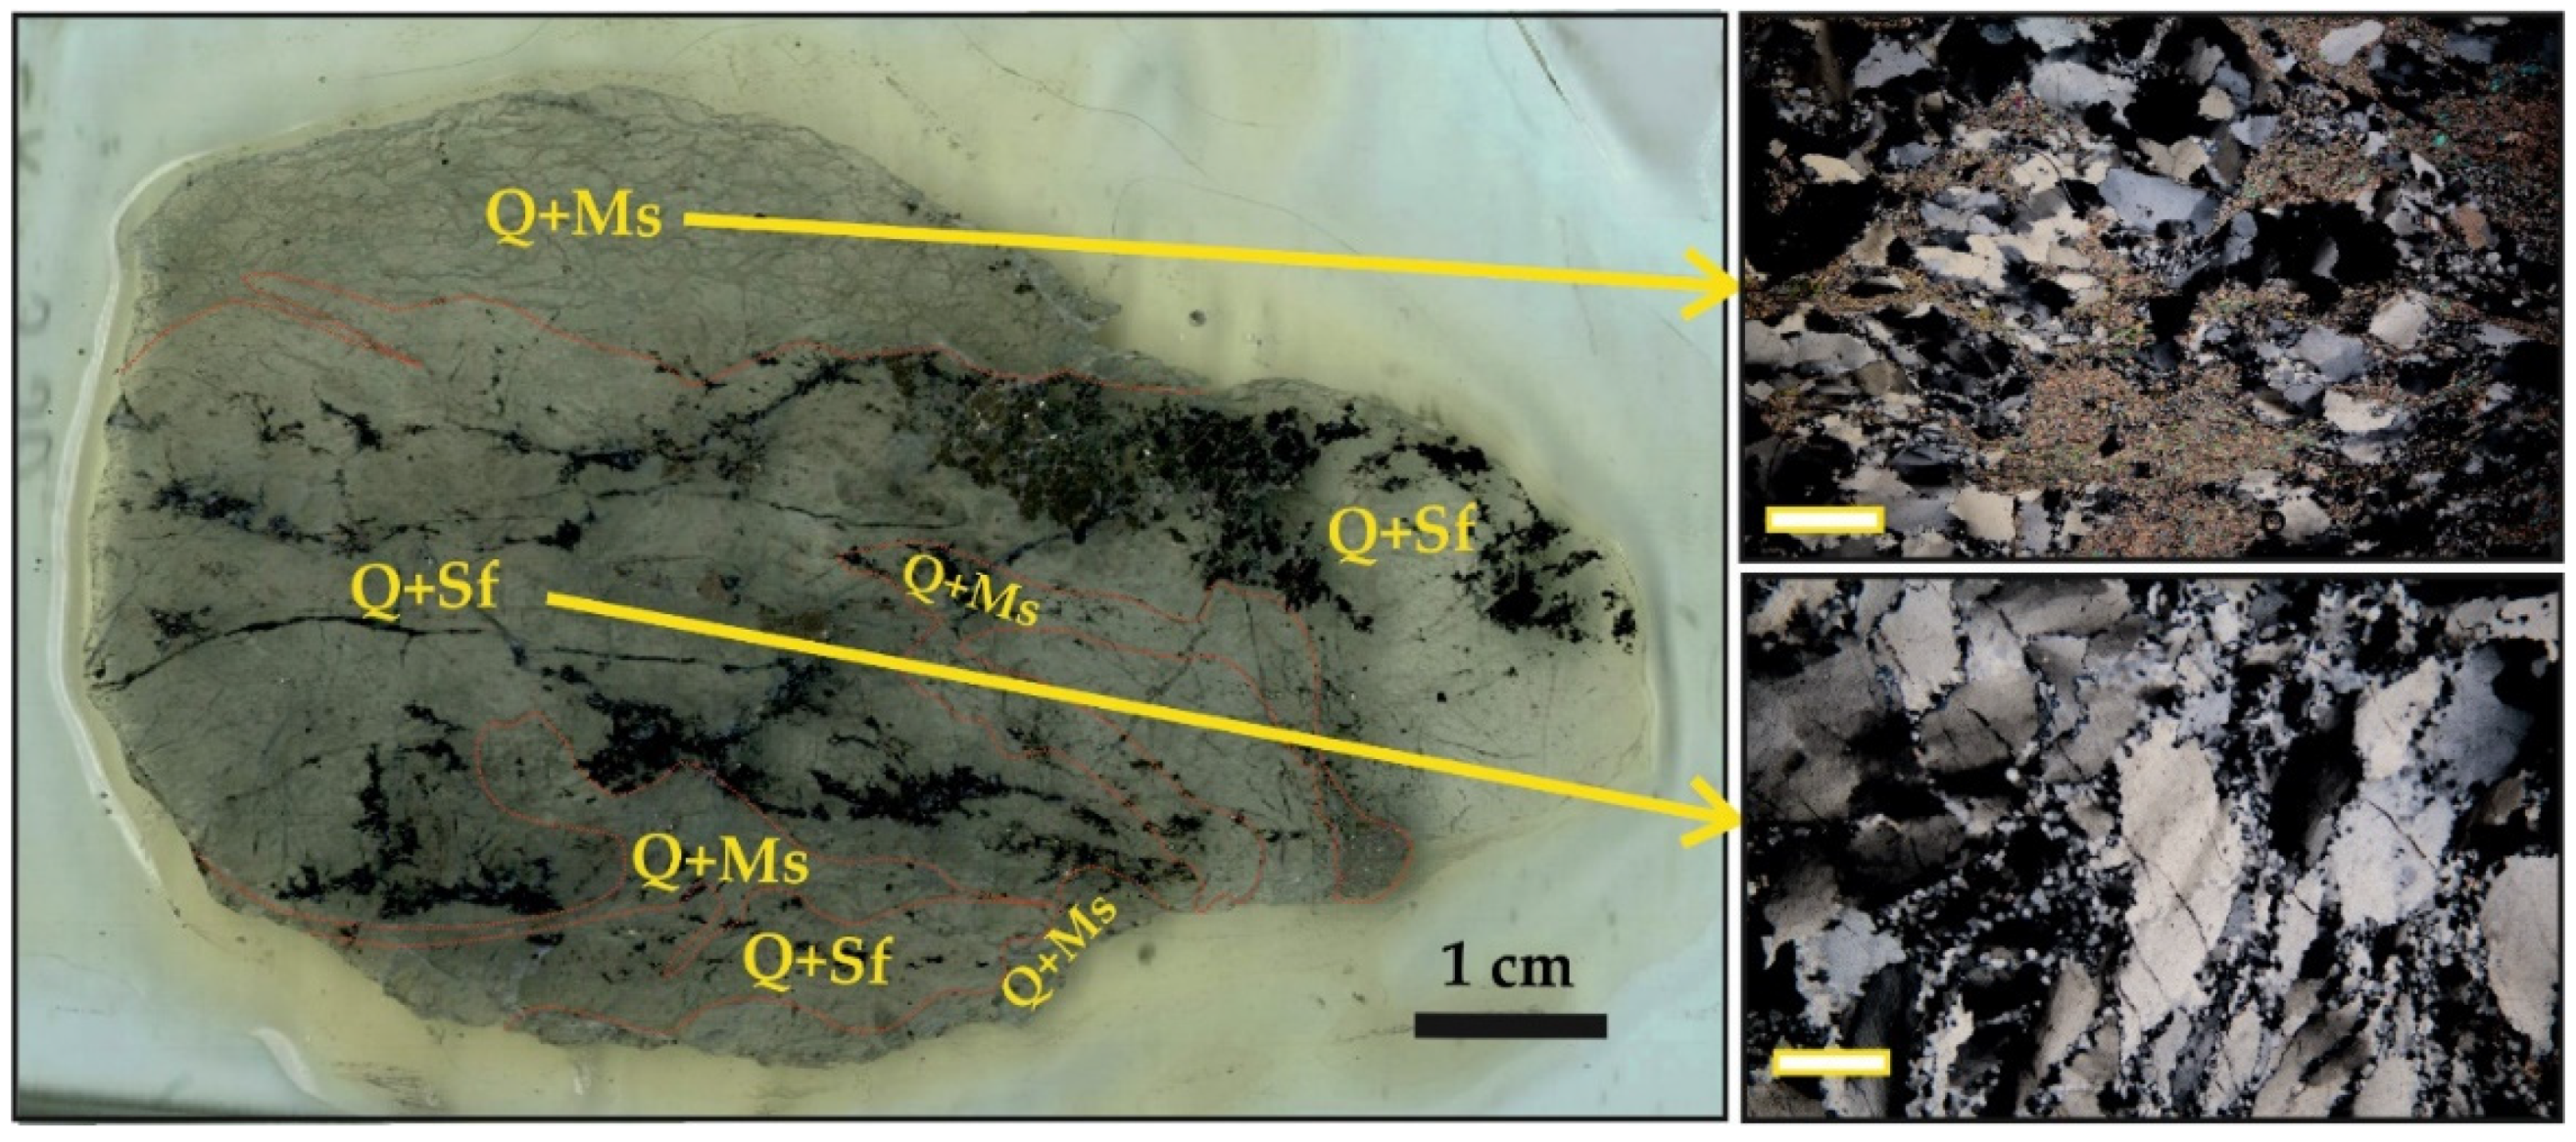
Quartz at quartz–sulfide ores predominantly has a granulate medium-grained microstructure (Figure 9a). Partially, relatively large grains are recrystallized at the grain boundaries where fine-grained quartz aggregates are formed (Figure 9b). Often, quartz aggregates are deformed (Figure 9c). Sulfide minerals are spatially associated with the recrystallized areas, although rarely can be present at the medium-grained matrix (granulated quartz) (Figure 9d). Carbonates and muscovite aggregates are present mostly as veinlets and disseminated grains at the fine-grained recrystallized quartz areas. According to the classification of quartz recrystallization mechanisms, the observed microstructure is similar to the bulging recrystallization with beginning of subgrain rotation recrystallization, which occurs at the temperature of about 400 °C [30].
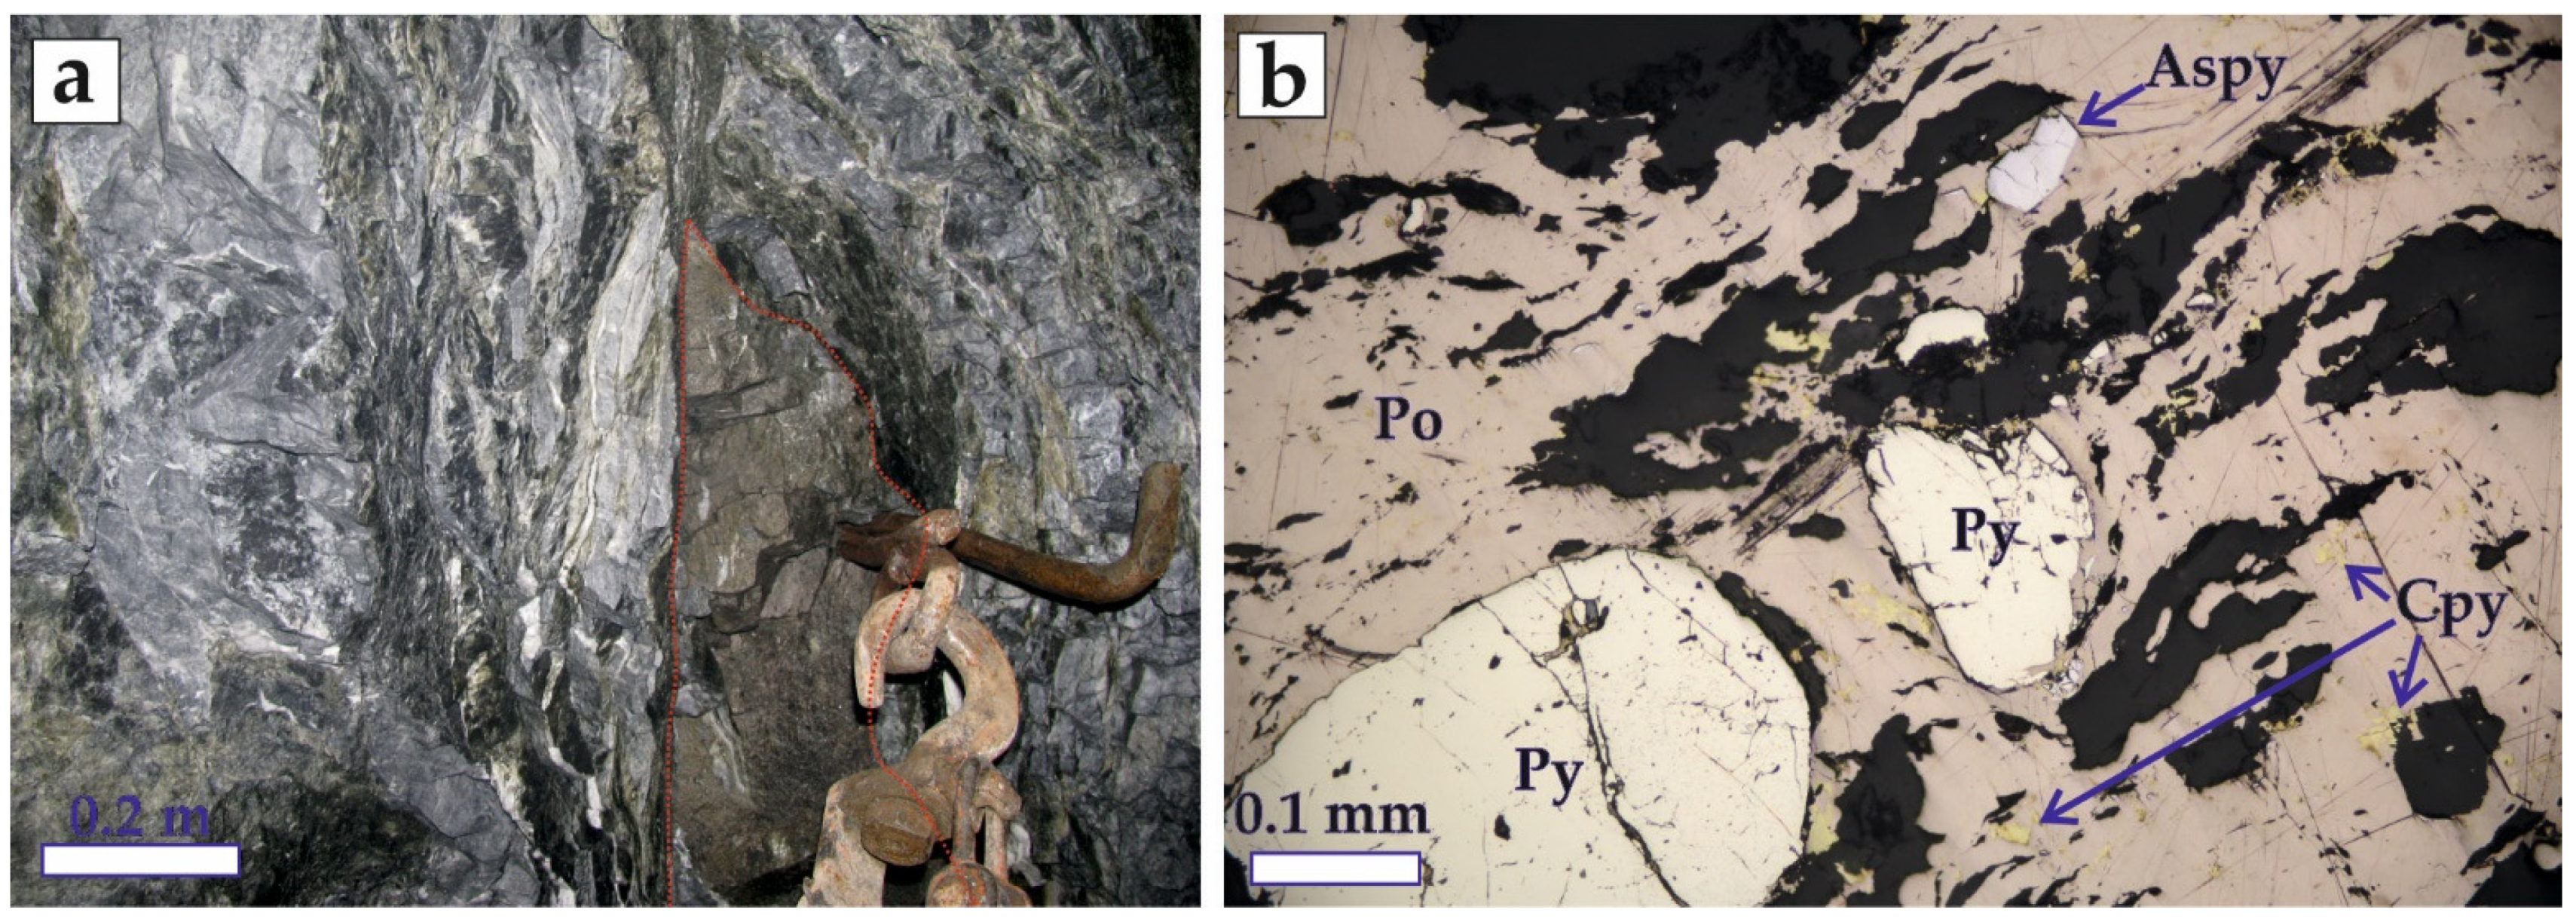
Pre-ore massive pyrite–pyrrhotite bodies. These bodies comprise up to 90% sulfides and the main mineral is pyrrhotite (Figure 10a). These ores contain round-shaped globular pyrite and irregular-shaped chalcopyrite as minor minerals, whereas sphalerite, galena and marcasite are rare (Figure 10b). Although the massive pyrrhotite is a pre-ore VMS occurrence, these sulfide boudins are overprinted by gold-sulfide mineralization formed during the main ore of the Zun-Kholba deposit formation. This has led to appearing of epigenetic (regarding to the VMS type relic ore minerals) sulfides (pyrite1, sphalerite, and galena), tellurides (tetradymite and hessite) and native gold. The gold fineness in the pyrite–pyrrhotite bodies is similar to the gold fineness of the quartz–pyrite association which is evidence of the epigenetic nature of this gold. The bodies have modal gold fineness values in the range of 700–750‰ (see Figure 7). Appearing of the epigenetic ore minerals is caused by the flow of ore-forming fluids through the pre-ore metamorphosed VMS-type pyrite–pyrrhotite bodies.
Based on the ore mineral relationships, three ore-forming mineral assemblages (quartz–pyrite, quartz-base metal-sulfide and Bi-telluride) have been identified. Precipitation of the quartz–pyrite assemblage with gold and minor base-metal sulfide occurred at deep levels of the deposit. This assemblage is accompanied by the wall-rock sericitization, sulfidization, and silicification. Some rare minerals, such as arsenopyrite, scheelite, and millerite, as well as relatively medium-grade native gold, were formed within the assemblage. The quartz-base metal sulfide assemblage is characterized by predominance of galena, sphalerite, chalcopyrite. Additionally, in this assemblage, pyrrhotite, marcasite, tetrahedrite, and low-grade native gold were formed. Minerals of this assemblage are particularly observed at the near-surface levels of the deposit. It allows to consider that this assemblage was formed slightly later than the main quartz–pyrite association given that fluid migration occurred up the section as well as with ore deposition temperature decreasing with reducing of the depth. The oldest third assemblage includes a small amount of the Bi- and Te-bearing minerals, such as native bismuth, hessite, tetradymite, vikingite, and low-grade native gold.
All the mineral assemblages were formed within single ore-controlling structure (shear-zone) which suggests single hydrothermal ore-forming system presence, where ore deposition occurred during the decreasing of P–T conditions. As a result, three multi-temperature mineral associations were formed at different levels of the deposit. Nevertheless, some inherent paragenetic associations are distinct and can be used for mineral and isotope geothermometry, such as electrum-sphalerite and arsenopyrite—pyrite pairs.
The bulk of the ore-forming mineral deposition sequence is shown in Table 2.
The distribution of ore-forming minerals in the deposit shows that the appearance of some minor minerals is influenced by the ore-hosting substrate. For example, the lamprophyre dike generates some bismuth, because all Bi-bearing minerals were diagnosed only near the dike, whereas Bi mineralization is absent in other parts of the deposit. Ore bodies hosting by listvenites contain small amounts of Ni-bearing minerals (millerite, pentlandite et al.). Scheelite is present within the ores which are replace the granitoid rocks. This distribution of minerals indicates that a part of the ore-forming components were mobilized from the ore-hosting wall rocks.

5.3. Pyrite and Pyrrhotite Geochemistry

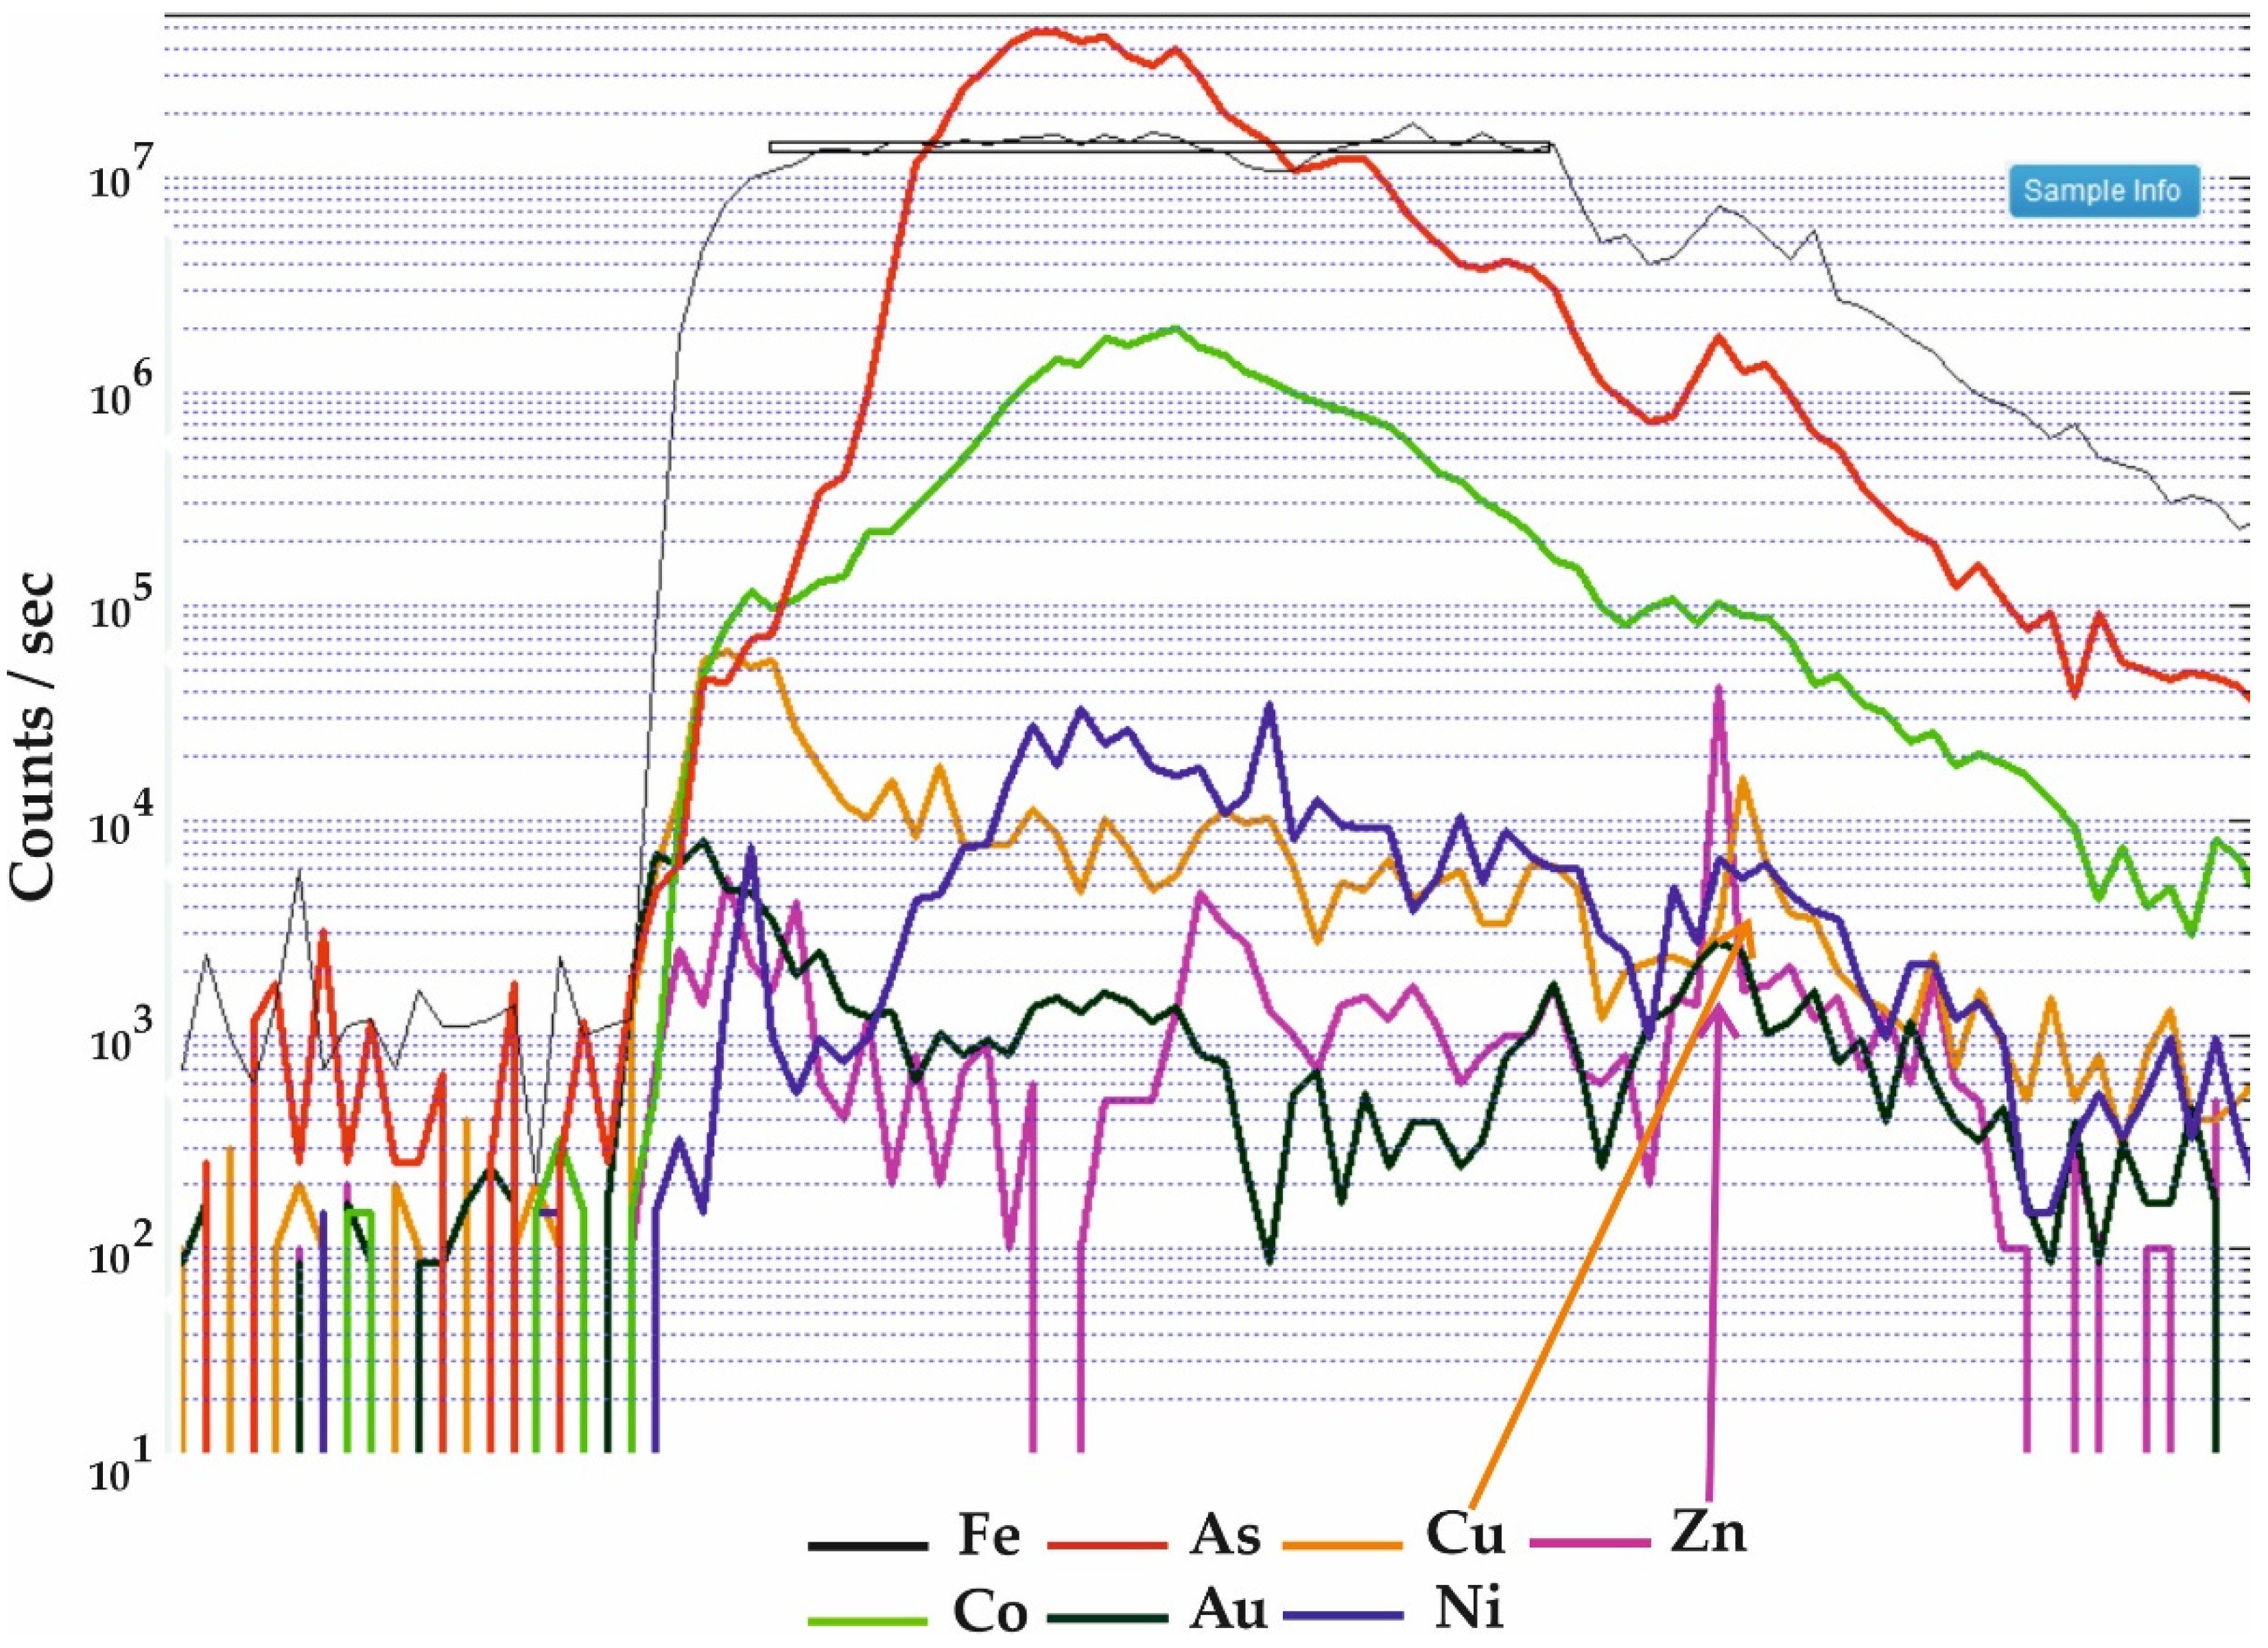
Concentrations of trace elements vary significantly, which is reflected in high values of the standard deviation. These variations are due to both the heterogeneity of trace element distribution in the pyrite structure and the presence of micro-inclusions of other sulfide minerals—galena, sphalerite, chalcopyrite, etc. It is known that distribution of trace elements in sulfide minerals is most often heterogeneous, and some elements are concentrated on the surfaces of sulfide grains that make up the mineral aggregate [31]. Micro-inclusions of other minerals are clearly observed as peaks in the laser ablation profiles and can be easily excluded from quantitative calculations (Figure 11). Due to the uneven distribution, the trace element concentrations have been averaged (Table 3). This made it possible to observe some geochemistry features of different species of pyrite and pyrrhotite.
Globular pyrite from the pyrite–pyrrhotite lens-like body (pre-ore), subhedral pyrite crystals from the main quartz–sulfide ores (Pyrite1) and from the quartz-base metal-sulfide ores (Pyrite2) have been analyzed. Pyrrhotite from the pre-ore lens-like pyrite–pyrrhotite bodies has been analyzed as well. All the values of element concentrations given in this chapter are average (see Table 3).
The pyrrhotite is characterized by low content of trace elements. Most of the analyzed elements are characterized by the concentrations from 0.05 to 11.67 ppm. Only Cu (1250 ppm) and Pb (623 ppm) concentrations are relatively high. In addition, Ge content (11.83 ppm) in pyrrhotite is relatively higher than in pyrites.
Compared to the pyrites from the main ores, the pre-ore globular pyrite is characterized by the highest contents of such elements as Co (1390 ppm), Cu (1287.6 ppm), Cr (15.16 ppm), Ge (11.8 ppm), Cd (30.98 ppm), Te (22.44 ppm), Au (2.66 ppm).
Pyrite from the main quartz–pyrite ores contains the highest concentrations of the following elements: Bi (49.98 ppm), Ag (50.67 ppm), Mo (0.99 ppm), and Se (5.6 ppm). Gold content is slightly less than in the globular pyrite (1.99 ppm).
A distinctive feature of the pyrite from the quartz-base metal-sulfide ores is high content of As (474 ppm), Zn (1244.7 ppm), Sb (11.93 ppm), and Ni (67.9 ppm). However, this pyrite is depleted in Bi, Te, Au, Ag. Contents of Au (0.65 ppm) and Ag (3.78 ppm) are significantly lower than for the other analyzed pyrites.
Based on the data on pyrite geochemistry, some trends in the concentrations of trace elements can be observed. Thus, from early (pre-ore globular pyrite) to late pyrites, there is a gradual decrease in concentrations of Co, Cu, Zn, Ge, Te, Au, and Pb, while content of As increases.
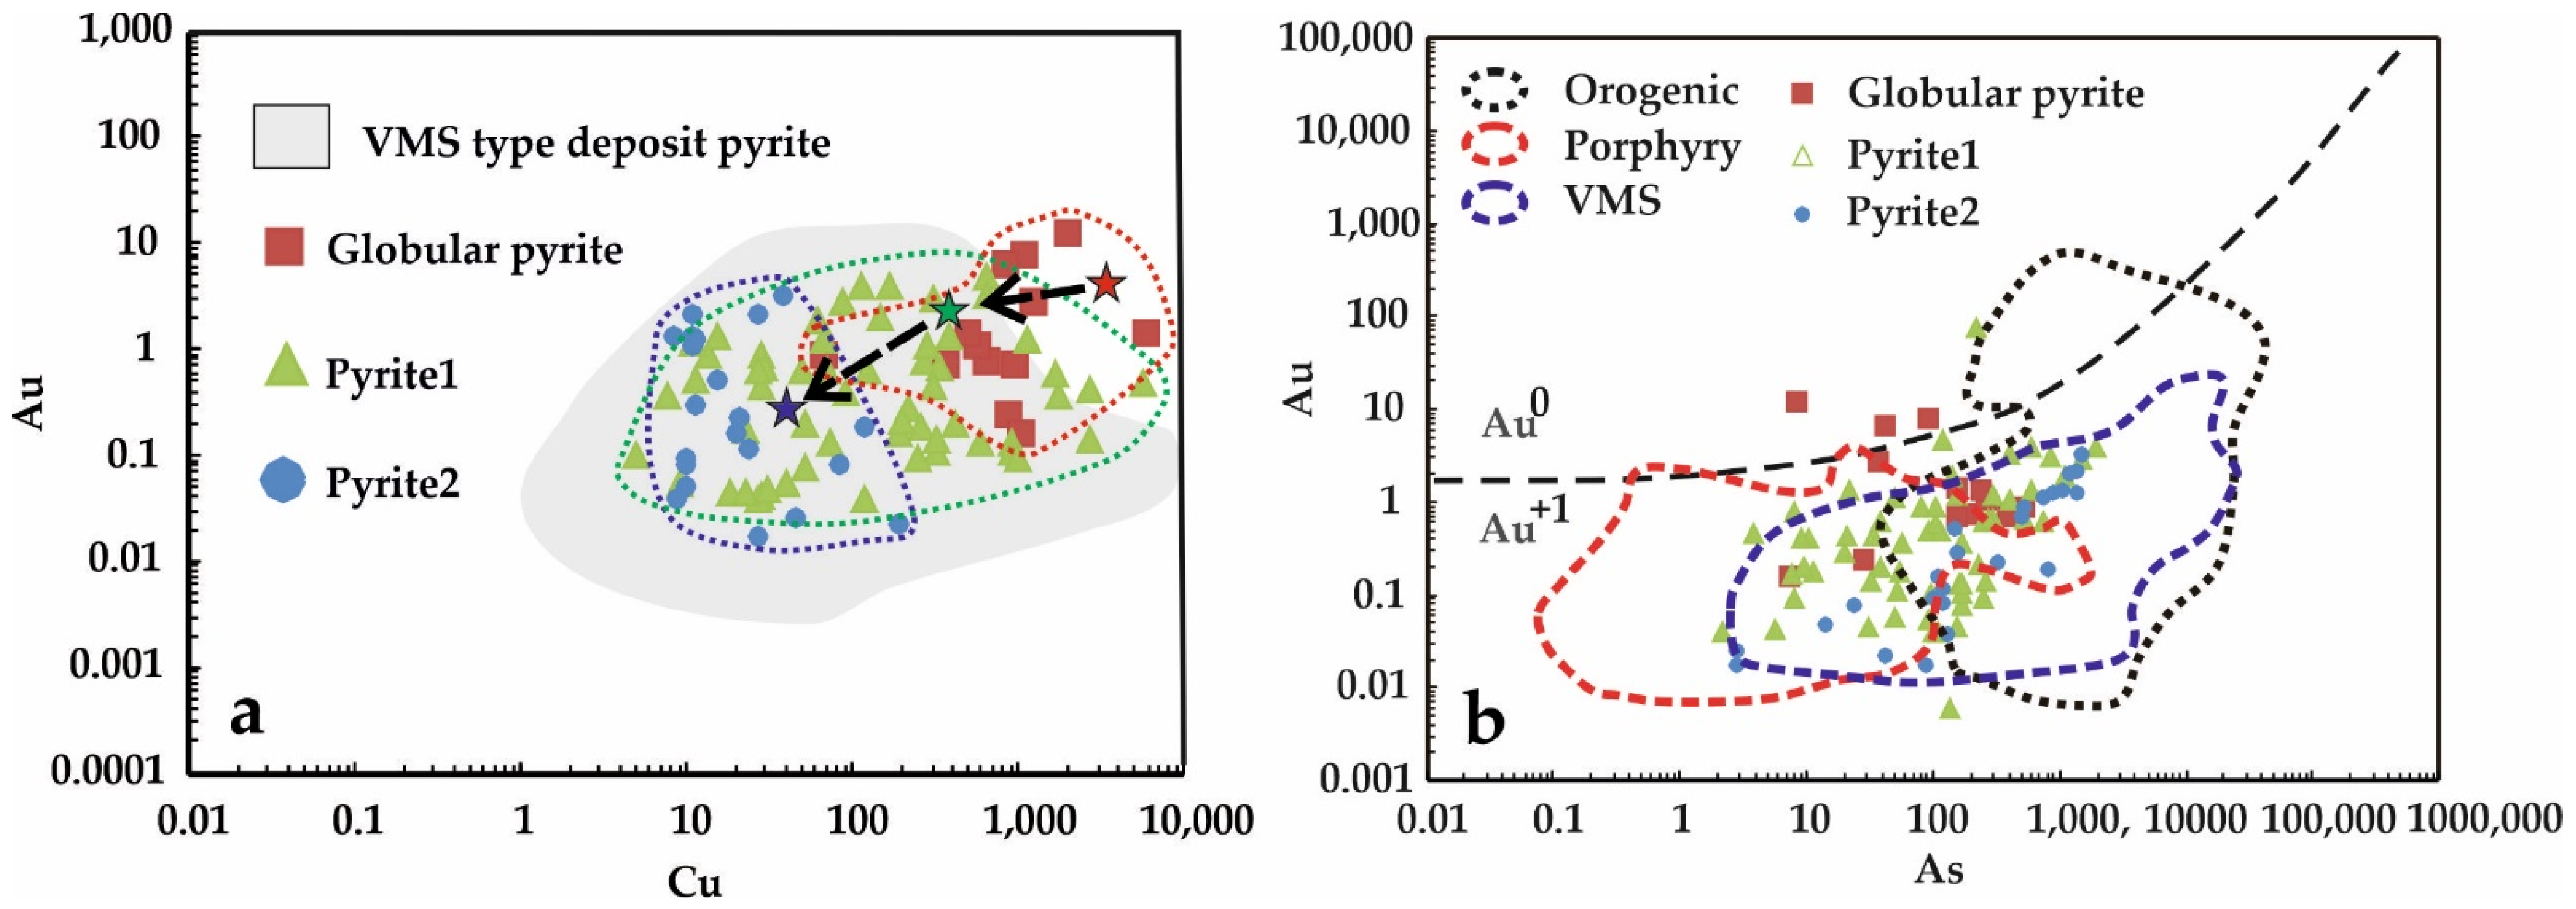
The Au–As and Au–Cu binary diagrams show the compositions of the analyzed pyrites. According to the data [32,33,34] pyrite composition fields for different types of gold deposits—orogenic, porphyry, and VMS are plotted. The Au–Cu diagram shows that contents of Cu and Au regularly decrease from early to late pyrites (Figure 12a). Such trend is especially well distinguished using the average values of the element concentrations (marked with stars in Figure 12a). On the Au–As diagram, plots of all the analyzed pyrites form compact fields also corresponding to the pyrite composition of VMS type deposits (Figure 12b).

5.4. Stable Isotope Compositions

5.4.1. Sulfur Isotopes

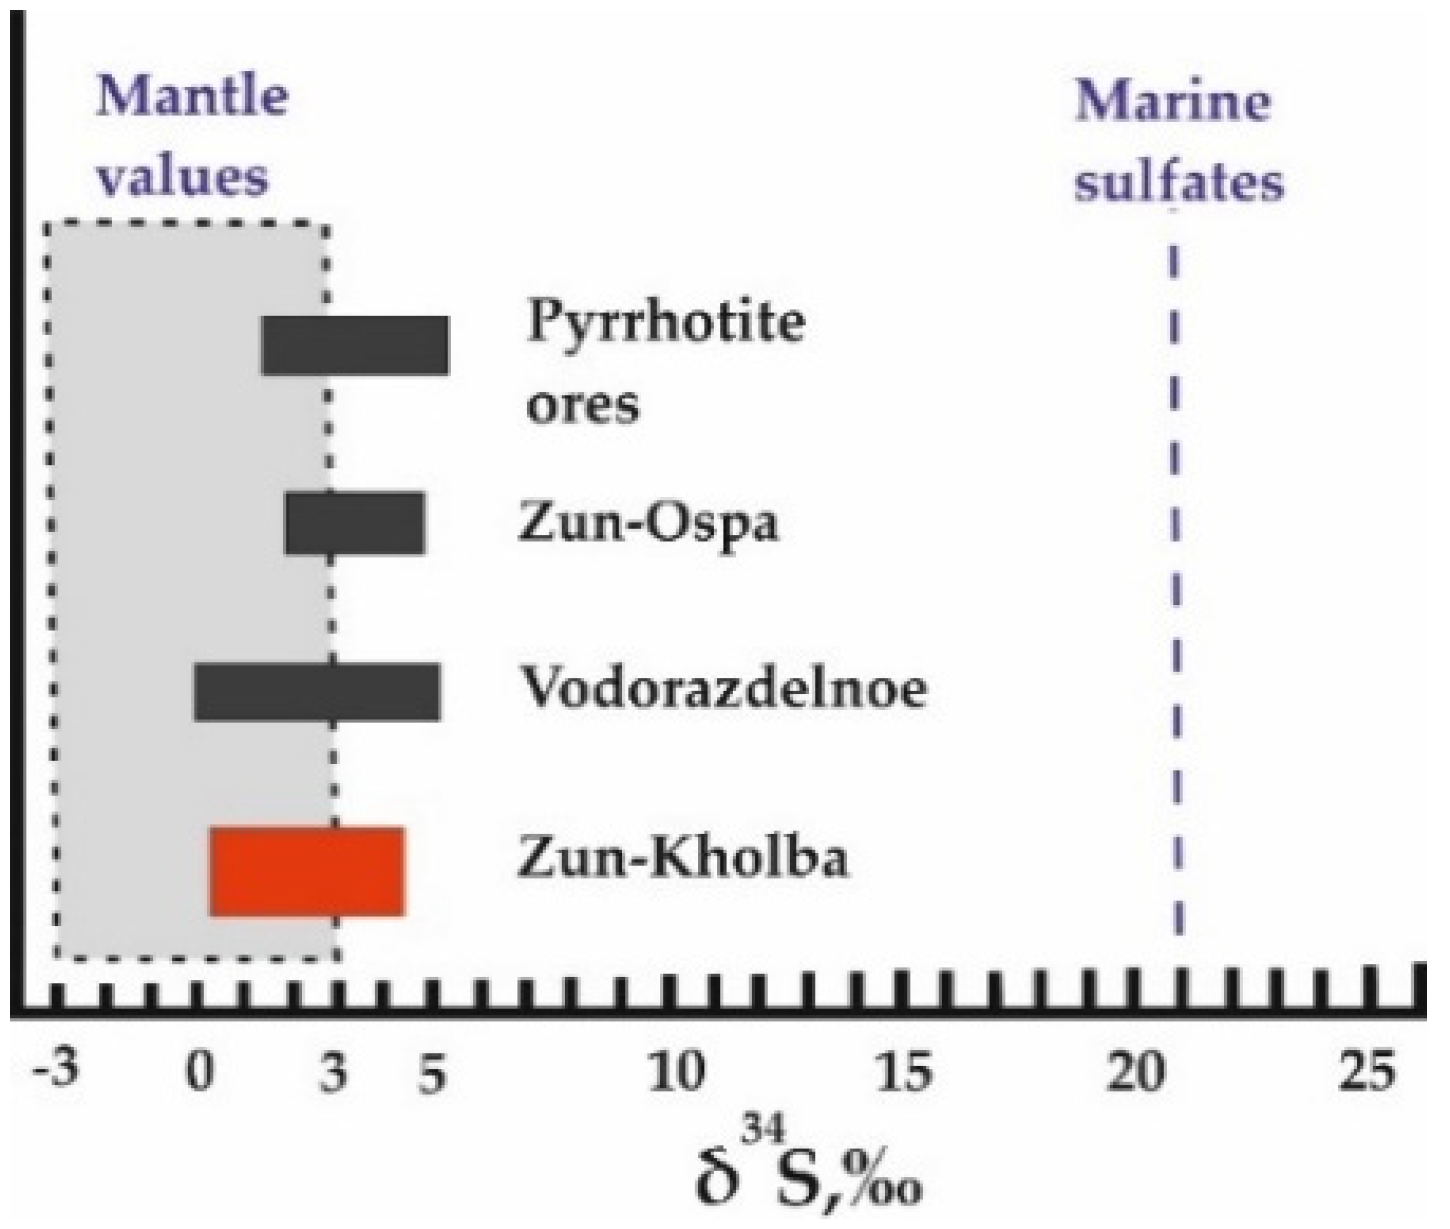
The results from the sulfur isotope study of the Zun-Kholba deposit ores show that the total range of δ34S values varies from 0.0 to +4.6‰ (Table 4). The sulfur isotope composition does not change vertically within the deposit. For pyrite, the values range from 0.2 to 4.6‰, for chalcopyrite from 1.3 to 2.3‰, and for pyrrhotite from 0.0 to 0.2‰. All the obtained values correspond to a deep (mantle) source of sulfur. The sulfur isotope measurements for the Zun-Kholba deposit are almost identical to those from other orogenic gold deposits in the southeastern part of Eastern Sayan (i.e., the Zun-Ospa and Vodorazdelnoe deposits) (Figure 13). All these deposits exhibit a sulfur isotope composition range corresponding to that of ophiolite associated pyrrhotite-rich VMS ores, which are metamorphosed analogues of ancient “black smokers” [25]. It is known that “black smokers” contain mantle-derived sulfur. A temperature calculation can be made for co-existing globular pyrite and pyrrhotite using the sulfur isotope ratios (sample Zk-97 and Zk-99-1, see Table 4). The resulting calculation shows a value of 433 °C when based on existing equations [35]. This temperature reflects the conditions in the deep part of the deposit during the replacement of pre-ore sulfide bodies (boudins) which was accompanied by isotopic equilibrium for pyrite–pyrrhotite. For this temperature, the sulfur isotope composition of H2S in equilibrium fluid was calculated. All the values fall into a narrow range from −0.6 to +3.4‰, corresponding to meteorite-like (mantle) sulfur. Calculations of fluid sulfur isotope composition values for the spatially associated pyrite2 and chalcopyrite at the near-surface levels (sample Zk-233, 2250 m, see Table 4) shows their nonequilibrium precipitation (chalcopyrite were formed later than pyrite2), although measured δ34S values are similar.

5.4.2. Oxygen and Carbon Isotopes

According to the quartz petrography it was established that medium-grained granulate quartz is predominant. Due to the small grains size as well as small amounts of the recrystallized quartz it is impossible to separate samples of these quartz generations. However, according to the articles [39,40], quartz deformation and recrystallization do not affect the oxygen isotopic composition considering that source of the both granulated and recrystallized quartz forming fluid most likely was single. Moreover, small amounts of the recrystallized quartz admixture cannot make a significant influence to the bulk isotopic composition. Therefore, the bulk quartz oxygen isotope composition allows us to identify some features of the oxygen isotopes distribution at the deposit. The δ18O values in quartz vary from 12.4 to 17.8‰ (Table 5). A slight decrease of the δ18O values with a decrease in depth (for example, levels 1490–1740–1840) is observed for some areas, although this pattern does not apply to the entire deposit. It is probably caused by some degree of fluid-rock interaction with varied lithological fragments within the deposit.
Another calculation of mineral formation temperature was completed based on the isotopic compositions of coexisting quartz and muscovite using published equations [41,42]. A quartz-muscovite pair was sampled at the deepest level of the mine (1260 m: sample Zk-330, see Table 5). The metasomatic nature of quartz–sulfide ores suggests that quartz and muscovite formation occurred contemporaneously as a result of the same process. The observed petrographic relationship between the quartz and muscovite (sericite) in the analyzed sample proved their simultaneous formation where joint quartz–sericite aggregates have been formed (Figure 14). The calculated value of 420 °C is similar to the temperature of the formation of the coexisting sulfides (433 °C, see above). The oxygen isotopic composition of the ore-forming fluid at the 1260 m level was thus estimated using this temperature and published equations [42]. For other levels the temperatures obtained by the mineral geothermometry were used. These temperature values are shown at the chapter 5.6. The bulk range of the δ18Ofl values is 6.0 to 13.1, where the near-surface ore has the lowest value (sample Zk-229, see Table 5).
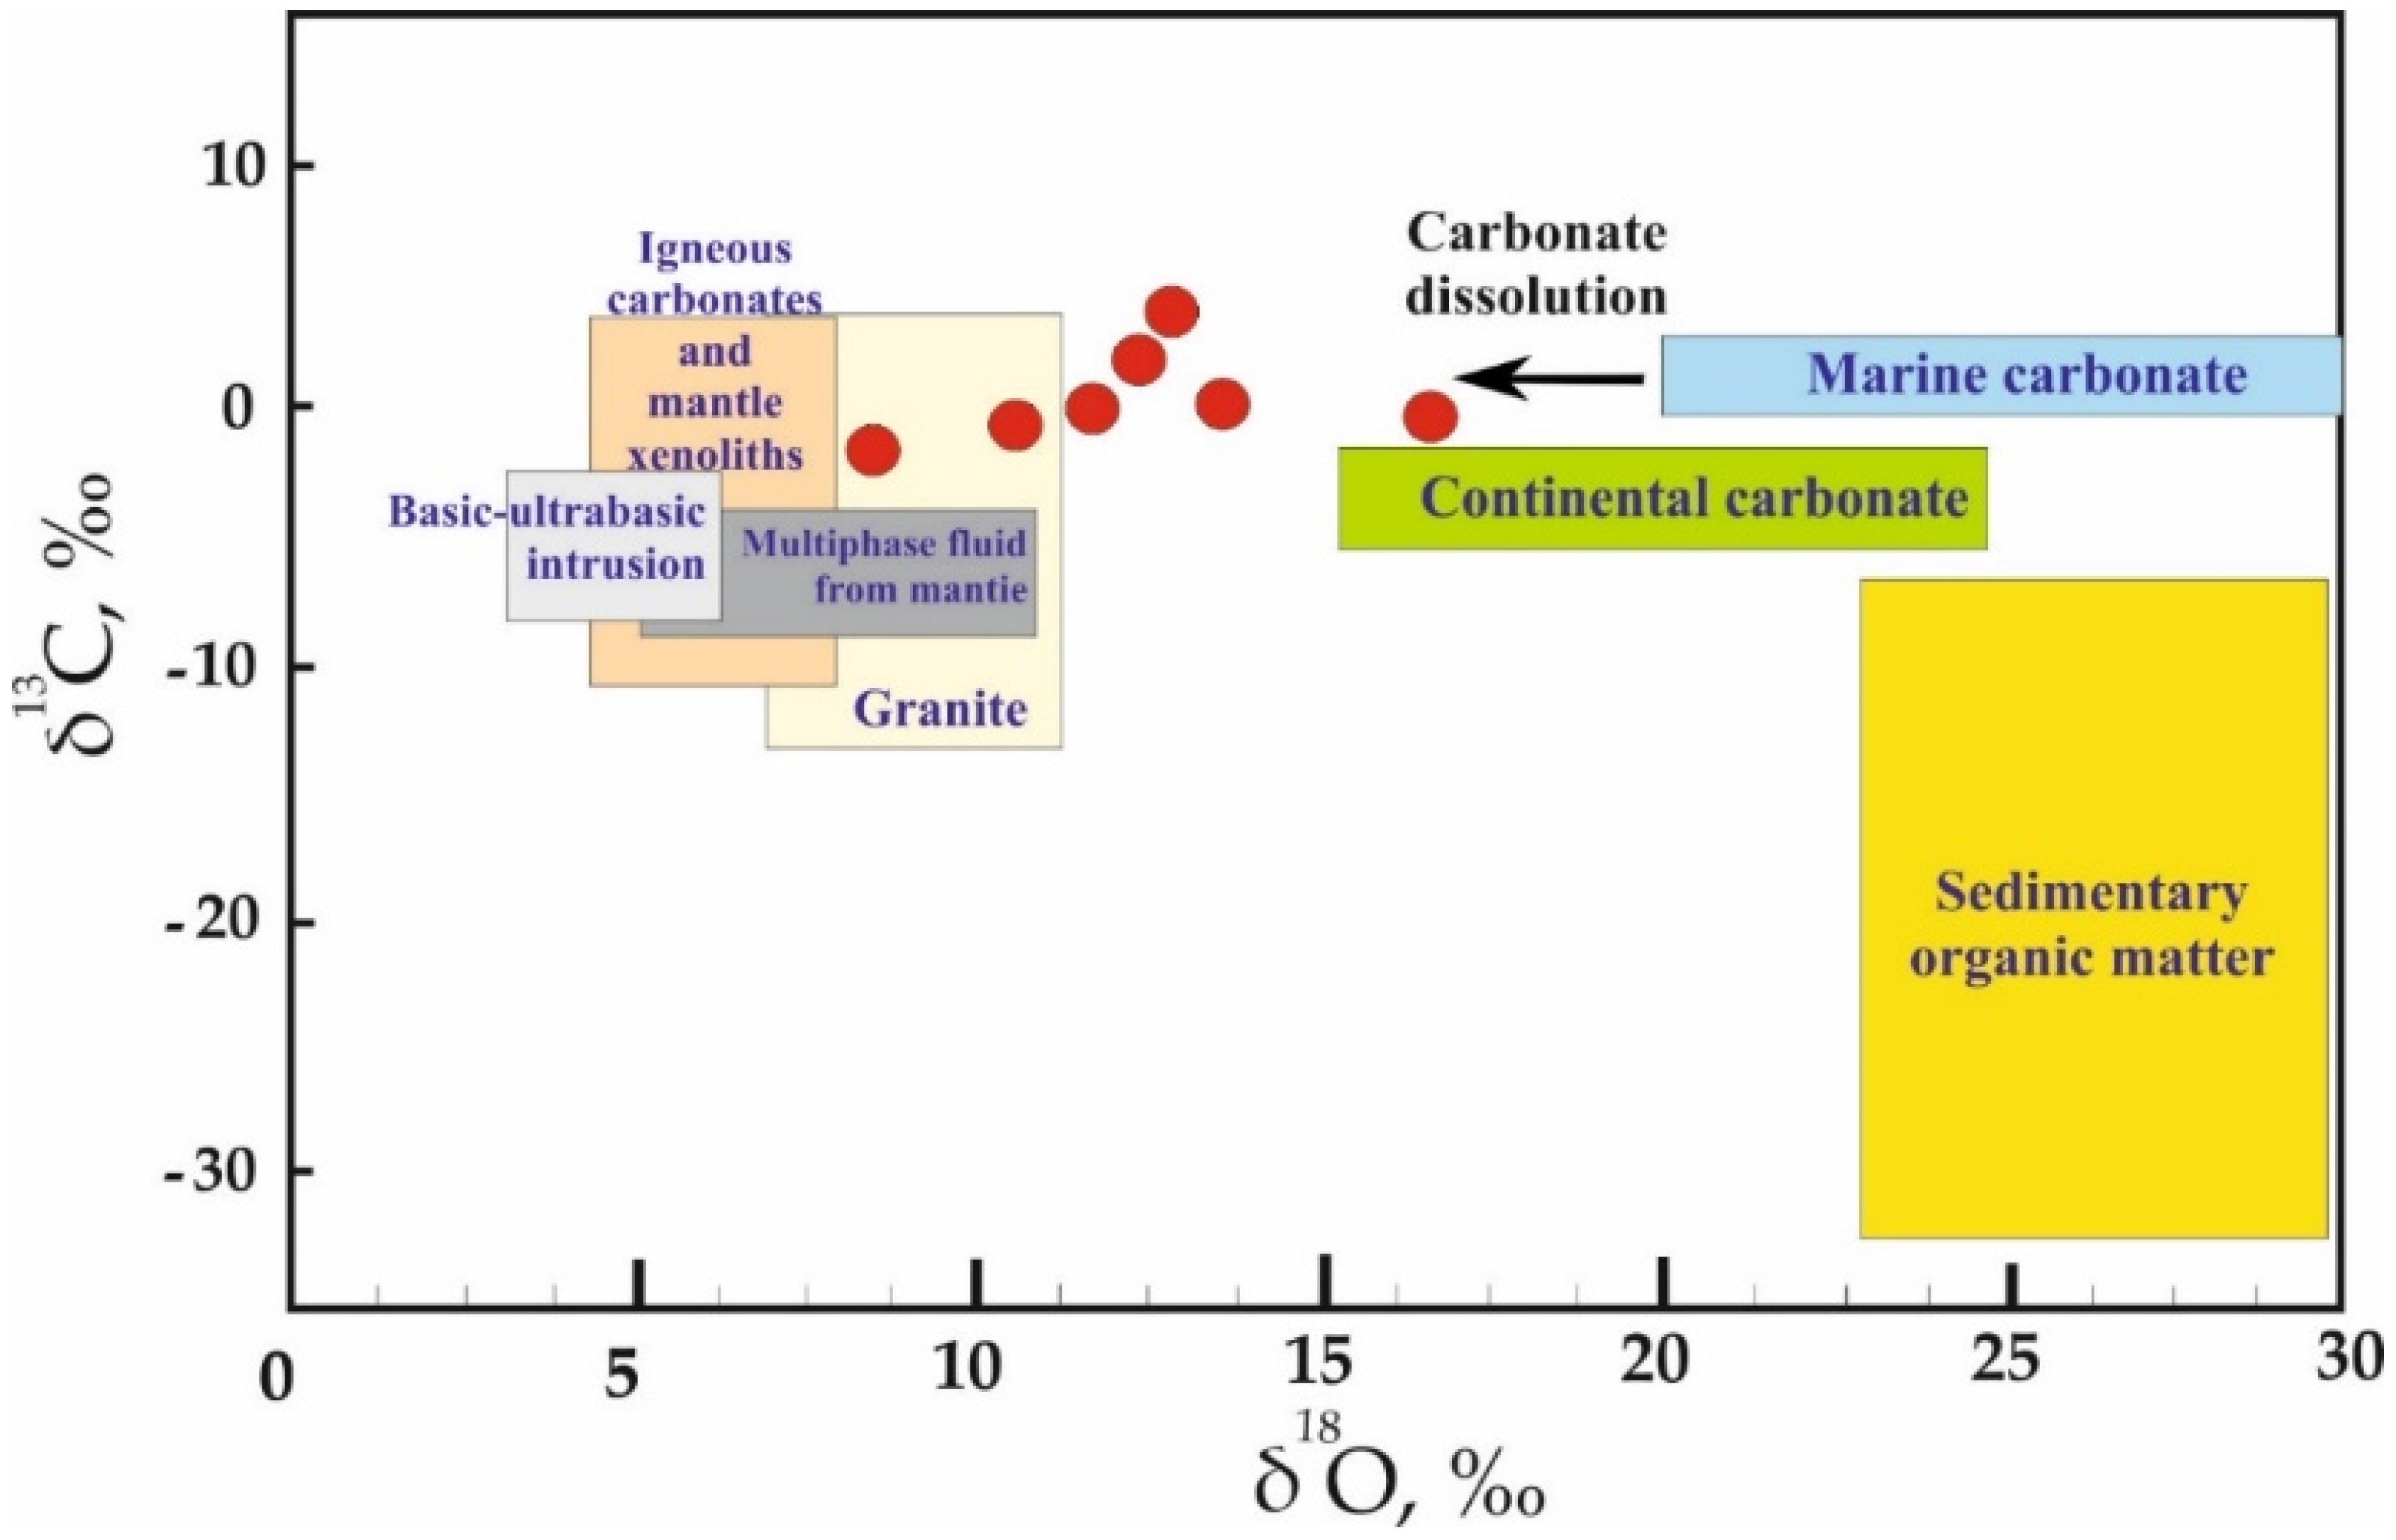
The study of the O and C isotopes from gold-bearing carbonates, which are present as partially silicified and sulfidized limestones, showed δ13C values varying from −1.72 to +1.18‰ and δ18O values varying from 8.0 to 16.1‰, (see Table 5). A δ13C versus δ18O diagram shows a shift in the carbonate isotope composition pointing towards mantle values (Figure 15).

5.5. Fluid Inclusion Study

The Zun-Kholba deposit is unfavorable for fluid inclusion study, because it contains an extremely low amount of primary fluid inclusions. This is caused by the intensive post-ore tectonic deformation destroying the majority of the ore-related inclusions (see Figure 9). We studied only 15 inclusions, which were amenable to useful micro-thermometric experiments. However, due to the small amounts of studied inclusions all defined parameters and conclusions can be considered as a preliminary.
The inclusions were found only in grey quartz with granulate medium-grained microstructure from the quartz–pyrite ores from the 1490 m level (see Figure 9a). Therefore, these inclusions were trapped during the early granulated quartz formation. The fluid inclusion study results are presented in Table 6.
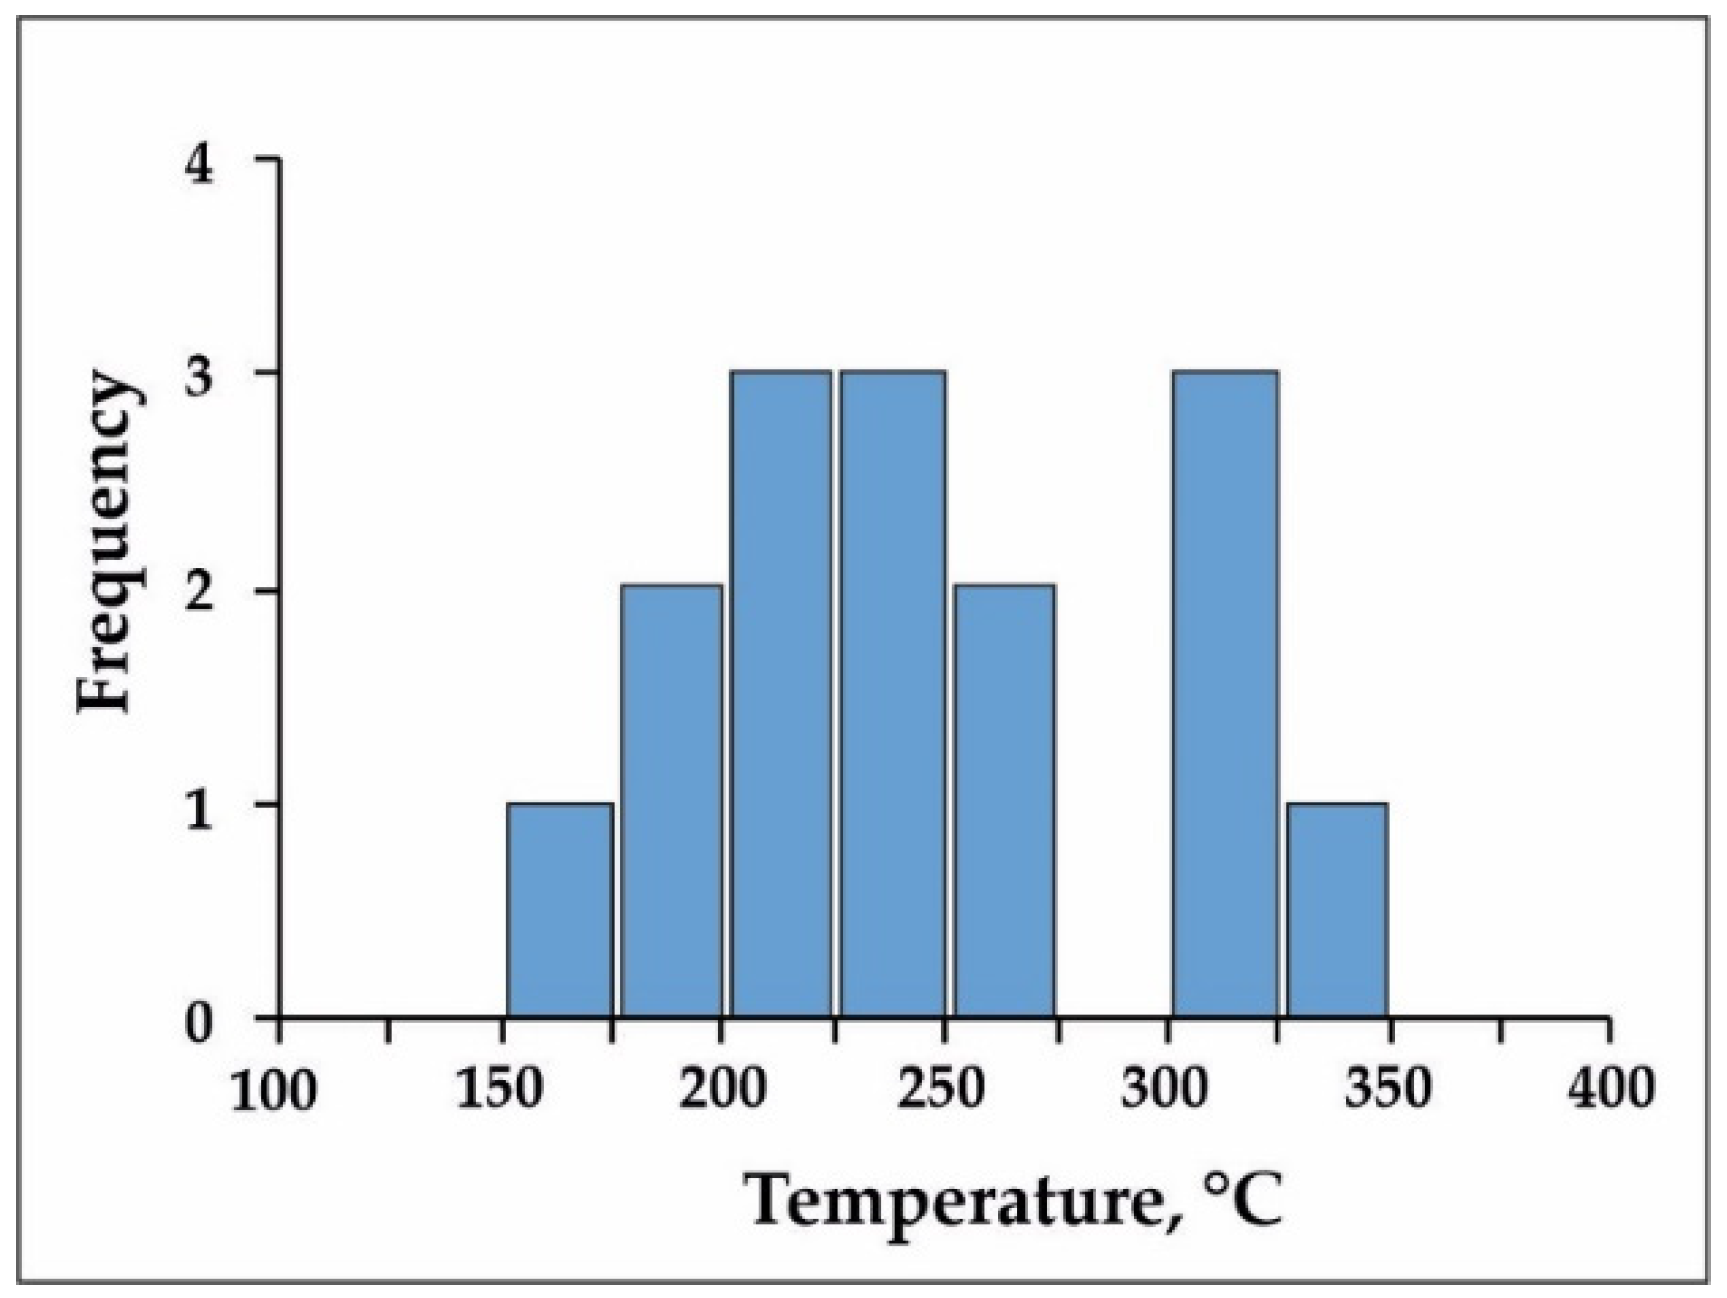
The studied fluid inclusions have drop-shaped, rounded, and irregular shapes. The size of the inclusions varies mainly from 5–8 microns, with some cases being up to 14 microns. All fluid inclusions are two-phase (vapor + liquid). Homogenization temperatures (Thom) of the inclusions fall into the interval of 168–340 °C. However, the distribution of the values is bimodal, which allows us to distinguish two generations of fluid inclusions differing by their temperatures of homogenization (Figure 16).
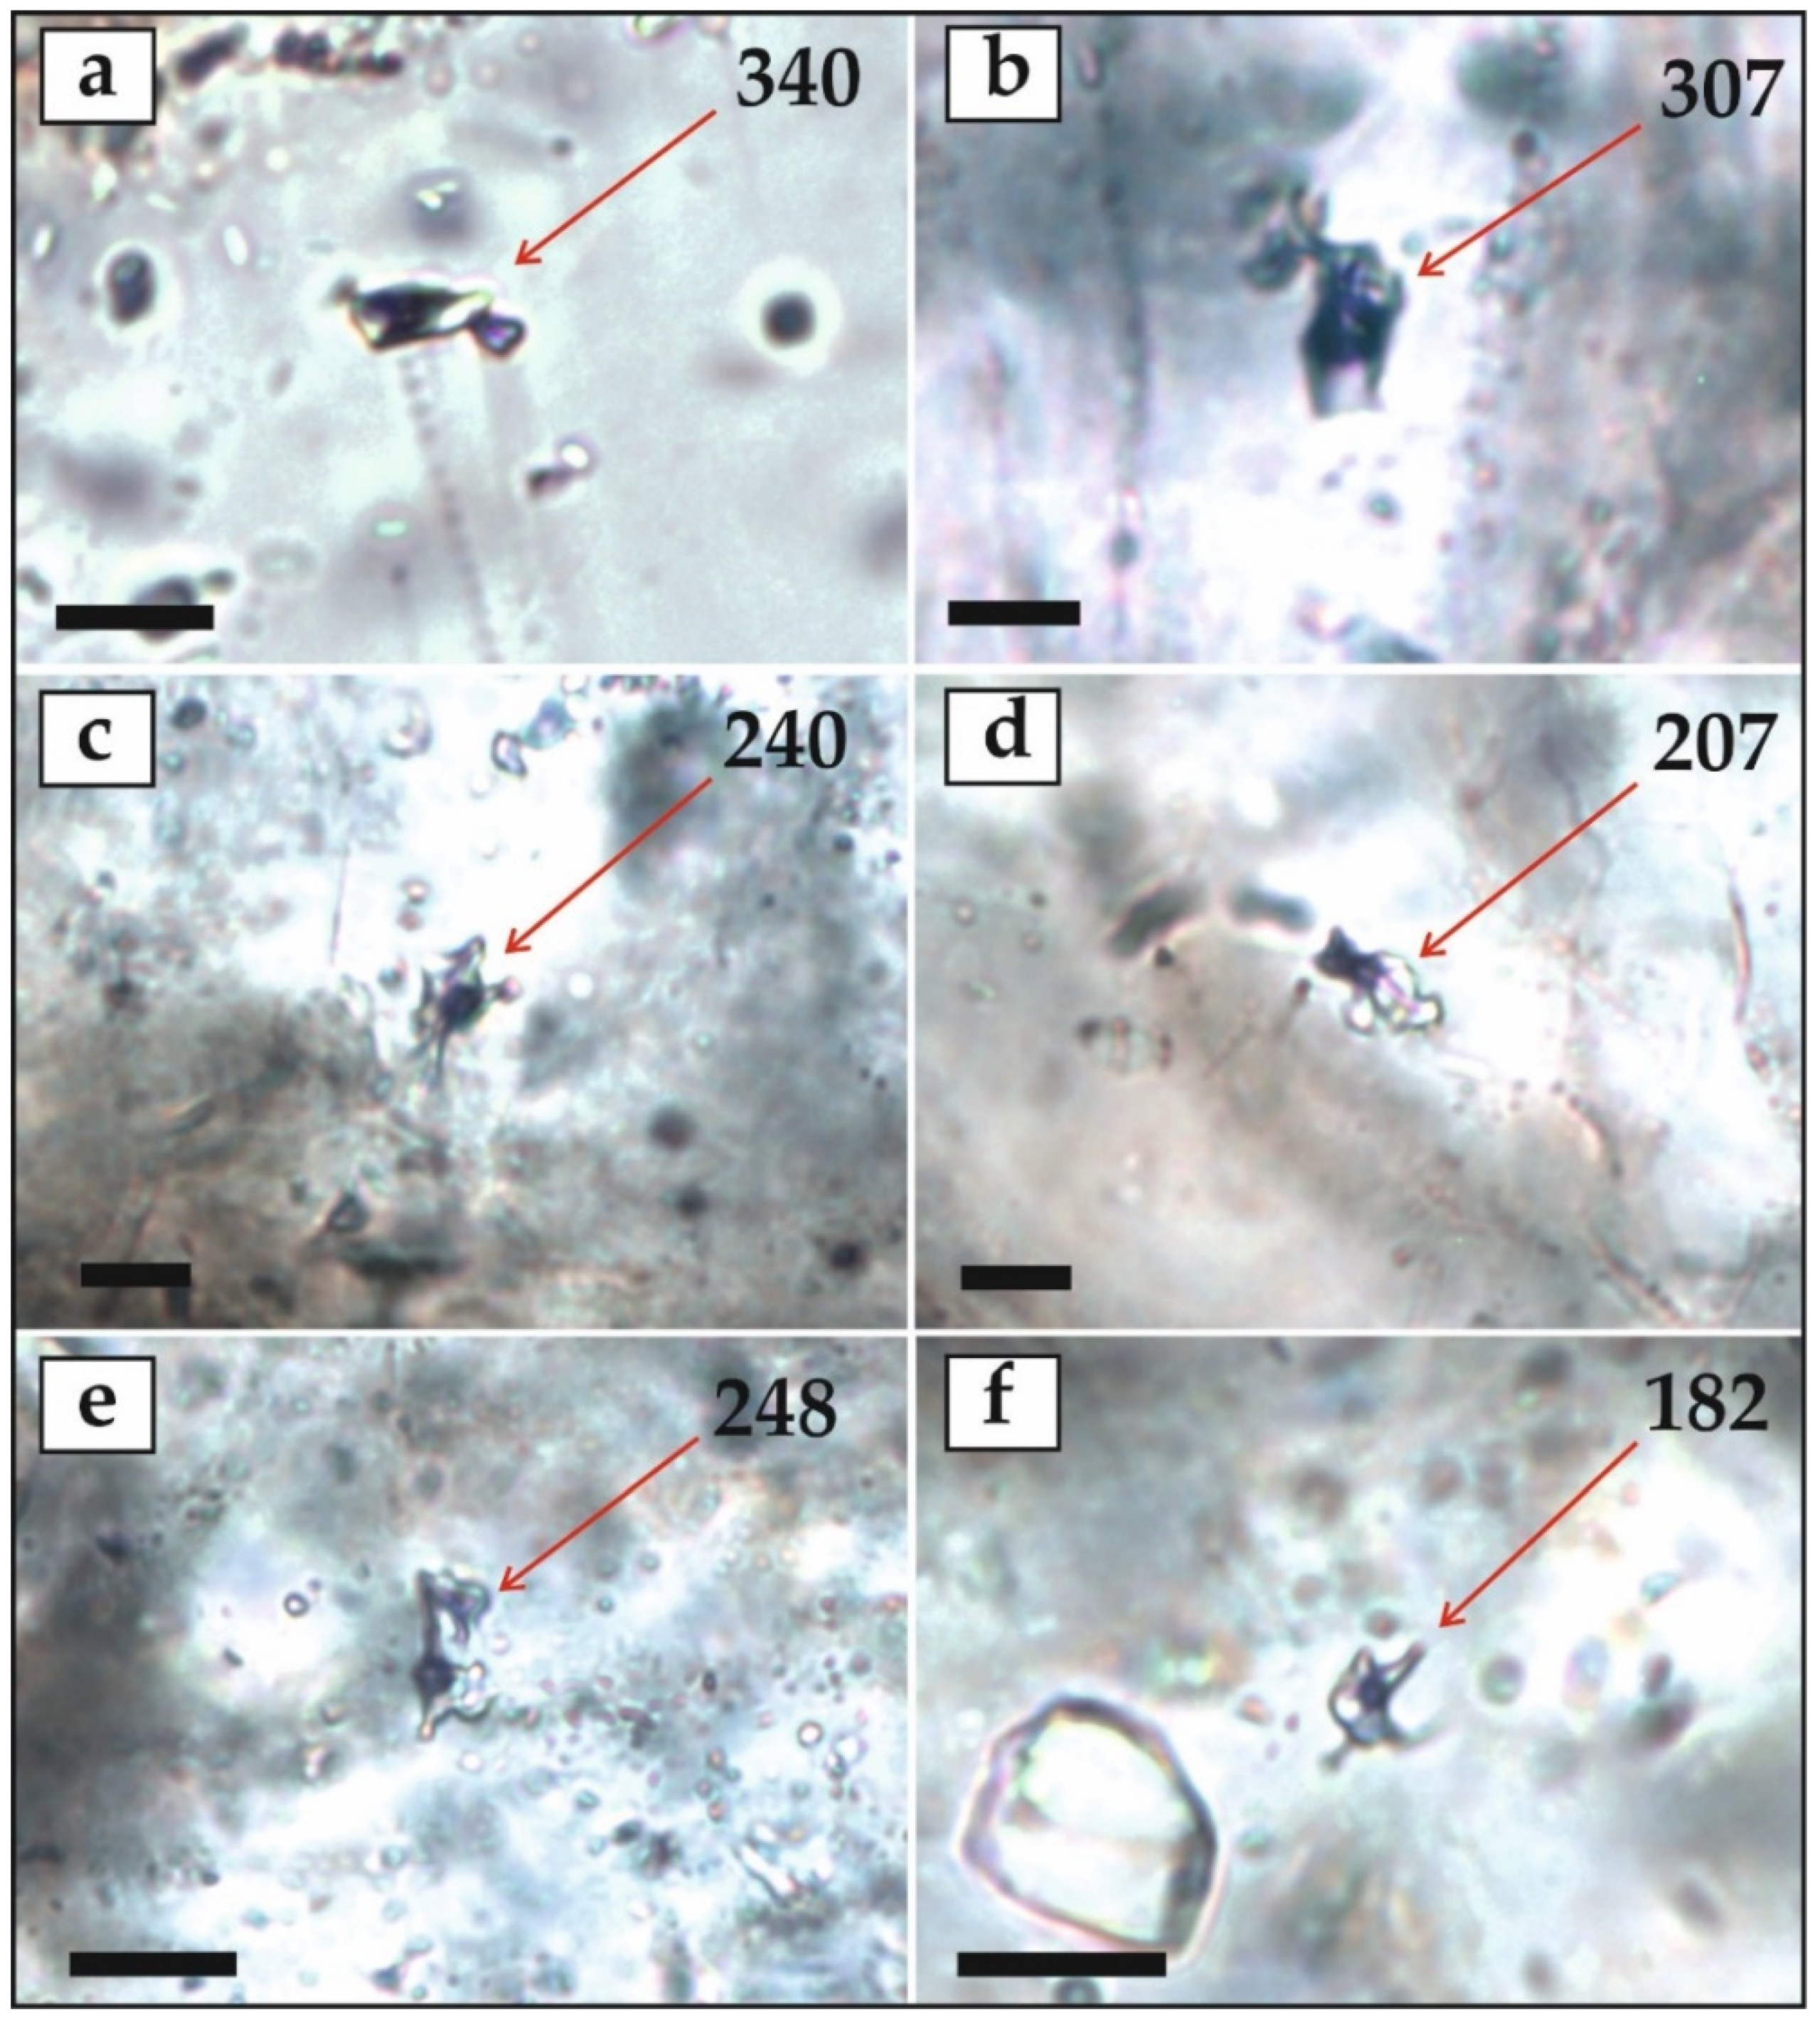
The homogenization temperatures for the relatively high-temperature mode range from 305–340 °C. These inclusions have even contours and are relatively rare (Figure 17a,b). The majority of the salinity values for these inclusions vary from 2.4 to 7.9 wt.% eq. NaCl, corresponding to low to moderate salinity fluids.
Relatively low-temperature inclusions have a wide range of homogenization temperature values from 168 to 280 °C. They have irregular shape with a sinuous contour (Figure 17c–f). The majority of salinities is also characterized by a large range of values from 0.9 to 9.2 wt.% eq. NaCl.
Eutectic temperatures (Teut) are similar for the both high- and low-temperature inclusions. The values the Teut vary from −38 to −37 °C, which indicates FeCl2 as the main salt component, probably with an admixture of Mg-, K-, and Na-bearing chlorides [29].
Appearing of the relatively low-temperature inclusions can be caused by the post ore deformations influence. Therefore, these inclusions study data were excluded during the pressure values calculations. Nevertheless, the similar eutectic temperatures allow to assume the genetic relation of both inclusion types.

5.6. Mineral Geothermometry

To determine the temperature of the ore minerals formation at the Zun-Kholba gold deposit, we used two mineral geothermometers: electrum–sphalerite and arsenopyrite (Table 7). The electrum-sphalerite geothermometer is based on distribution of sphalerite iron content (XFeS) and atomic amount of silver in co-existing native gold (electrum) (NAg) [44,45]. Paragenesis of sphalerite and electrum is determined by mineralogical observations (Figure 18a, see Figure 8c).
The geothermometry suggests that the temperature increases with increasing depth (Table 8). The samples from the deepest 1260 m level show an average temperature value of 437 °C. At intermediate depths at the 1490 m level, measurements have an average value of 382 °C, and at the near-surface 2134 m level, the average temperature value is 316 °C.
Arsenopyrite geothermometry is based on experimental studies of the dependence of arsenopyrite composition (S and As content) on temperature and sulfur fugacity in equilibrium with the Fe-S-bearing minerals such as pyrite and pyrrhotite. In the studied quartz–sulfide ores, the pyrite-arsenopyrite assemblage is established as at equilibrium (Figure 18b, see Figure 7b).
Temperature values were determined using the Fe-As-S phase diagram [46]. Our calculations are based on the chemical composition of the arsenopyrite associated with pyrite (see Table 8). Average values on all the levels vary from 357 to 393 °C, which corresponds to those of the moderate depth level obtained by electrum-sphalerite geothermometry. However, in this case, a relationship between temperature and depth of sampling is not observed.

5.7. Pressure Estimations

The pressure estimations could only be calculated using the high-temperature fluid inclusion data because the low-temperature inclusions had too wide of ranges for homogenization temperature and salinity values. This scatter prevents reliable determination of representative pressure values.
The estimation of mineral formation pressures is based on the average temperature value obtained by mineral geothermometry from the 1490 m level ores, because the fluid inclusions were studied in quartz from this level. The values used for calculating the average temperature are emphasized in bold italics in Table 8. The calculated average temperature is 388 °C. Based on an existing program [47], the pressures were calculated using measured fluid inclusion homogenization temperatures and bulk salinities of the high-temperature fluid inclusions in quartz. Pressure calculations are based on known PVTX properties of the H2O-NaCl system, micro-thermometric data from fluid inclusions, and independent data of the mineral-forming temperature. Obtained pressure values vary in the range of 0.57–0.95 kbar (see Table 6). According to the data [48] at a temperature of 388 °C, the critical curve configuration for the FeCl2-H2O system corresponds to the NaCl-H2O system critical curve. Therefore, we can consider the calculated pressures as being close to the true conditions of ore deposition.

6. Discussion

6.1. P–T Conditions of Ore-Formig Mineral Deposition

Comparison of the oxygen isotope and electrum-sphalerite thermometry results shows their temperature values convergence, reflecting the relatively high-temperature conditions of about 420–430 °C. The similar temperature values were obtained by the sulfur isotope geothermometer using the pyrite–pyrrhotite pair despite the controversy of their association. Temperatures of about 400 °C can be assumed based on the quartz microstructure. This concurrence of obtained data allow us to suggest these values as the most probable ore precipitation temperature conditions at the deep levels of the Zun-Kholba deposit. At the intermediate levels also the consistent temperature values (average value is 388 °C) of electrum-sphalerite and arsenopyrite geothermometers are observed. These values are consistent with the fluid inclusions trapping conditions considering the pressure correction. And the near-surface ores formation temperatures we can estimate using only electrum-sphalerite geothermometer (average value is 316 °C).
Thus determination of the temperature conditions at different levels of the Zun-Kholba deposit shows that the temperatures of ore formation decrease toward the surface. At the deep levels, temperature values range from 382–437 °C. The average temperature value for veins at the surface is 316 °C. Thus, the temperatures are significantly lower at shallower depth, which broadly correlates with the δ18Ofl value decreasing to 6‰ at shallow levels, whereas the deeper quartz samples range from 8.4–13.1‰. This can best be explained by mixing of meteoric water with the deeper hydrothermal fluids at the shallow depths as it was established for epithermal gold deposits [49]. However, it cannot be ruled out that the temperature reduction is caused by cooling of the fluids as they move upward [50].
The pressures of ore formation were determined for the intermediate level (1490 m) of the deposit and range from 570–950 bar. It is known that pressure can be a very variable parameter of an ore-forming hydrothermal system [51]. Pressure variations can be caused by changes in hydrostatic pressure due to the flow of the mineral-forming fluid through an inhomogeneous environment represented by rocks with contrasting competencies within a tectonic melange. In such an environment, local areas of pressure build-up may occur, causing variations in fluid pressure during consequential fracturing [52,53]. Pressure variations can also be a reason for the heterogeneity of the ore temperatures for the deep samples.
For a rough estimation of possible depth of the ore formation, we can use the highest pressure value of 950 bar. According to the lithostatic gradient (260 bar/km) this pressure value corresponds to the depth of about 3.6 km. The pressures were calculated for the ores sampled at the 1490 m level, which is 800 m below the uppermost level of mineralization at the modern-day surface. Considering that the Eastern Sayan is a mountainous Phanerozoic orogenic belt, the calculated depth of about 3.6 km is close to the true depth of ore formation. These P–T conditions, as well as the depth of ore formation, correspond to those of a mesozonal to epizonal orogenic gold deposit [1,2].
According to the phase diagram for the H2O-FeCl2 system [48], the obtained P–T parameters correspond to those reflecting a homogeneous supercritical fluid. This is also proven by the fact that all the examined fluid inclusions show petrographic evidence of homogeneous trapping. The recognition of FeCl2 as the main salt in the ore-forming fluid is consistent with pyrite being the dominant sulfide in the ore assemblage. Previously, it was established that iron chloride is the predominant salt in fluids forming quartz veins within the pyrrhotite ores from the ophiolitic shales within Eastern Sayan [25]. These pyrrhotite ores are widely distributed in the upper volcanosedimentary sequences of the Eastern Sayan ophiolite assemblage and represent metamorphosed fragments of VMS type ores (ancient “black smokers”) [25]. Ophiolitic rocks, as well as fragments of the massive pyrrhotite ores, are also found in the Zun-Kholba deposit area. It is further evidence of the ophiolitic rocks being involved in the gold ore formation process.

6.2. Deposit Genesis

Textures of quartz–sulfide ores show that the ore precipitation occurred due to the replacement of the ore-hosting tectonic melange rocks. A very well-developed quartz–sulfide assemblage replaces the limestones.
Due to the uneven distribution of different rock fragments in the ore-hosting mélange, the ore bodies are discontinuous, mostly composed of lenticular zones of quartz–sulfide assemblage. This is clearly observed from the morphology of the ore bodies (see Figure 3). Ore bodies have a subvertical extension where the total range of mineralization is more than 1 km. However, they have not yet been contoured in depth. Vertical zoning is occurred in the fact that under near-surface conditions, ores appear enriched in base metal sulfides and quartz-veined zones appear there. All of the above facts indicate the inflow of ore-forming fluids from the deep levels of the deposit.
The C–O isotope study of carbonates also shows the deep-source origin for the ore-forming fluid, with additional carbon added from the limestones. These deep-source fluids can be derived from the mantle rocks composing the subducted oceanic crust. Indication of fluid flow events are well observed in the textures of the wall rock alteration zones and in the quartz–sulfide ores (see Figure 4 and Figure 5). Therefore, it can be that one of the main factors for the ore formation is probably a change in fluid chemistry due to fluid-rock interaction, which is the result of the metasomatic replacement of the mélange rocks [54]. However, in the upper levels of the deposit, sulfide-bearing quartz veins provide evidence for crack-filling processes in the near-surface, as well as for the metasomatic replacement.
The key to indicating the genesis of the gold mineralization is to determine the origin of the ore-forming fluid. This fluid flowed through a major tectonic zone and re-deposited gold and related metals. Igneous rocks occurring in the deposit area are represented by granitoids of the Sumsunur complex. However, their age is Neoproterozoic whereas the gold mineralization is late Paleozoic and thus much younger than the granitoids. Lamprophyre dikes could be syn-gold in age, but their abundance is too limited in scale as to be responsible for the large volume of gold mineralization; only one small, deformed dike is recognized in the deposit. Moreover, it is possible that the lamprophyres were pre-gold. Therefore, there is no connection between ore formation and any magmatic event at the Zun-Kholba deposit.
Oxygen isotope study has shown that the δ18O values of the ore-forming fluid (6.0–13.1‰) are similar to the values of fluids from many orogenic gold deposits [2]. These values correspond to metamorphic water [55]. In the shallow part of the Zun-Kholba deposit, the low δ18O values suggest addition of meteoric water accompanied ore deposition. This mixing process can also cause a temperature decrease. Nevertheless, the primary source of the ore-forming fluid is dynamometamorphism of the underlying rock assemblages including ophiolites which were involved to the shear-zone. It allows us to suggest a metamorphic devolatilization model as the main ore-forming process.
Zones of high-pressure metamorphism (blueschist belts) trace large suture zones in the southeastern part of the Eastern Sayan [14,23]. Because the orogenic gold deposits of the studied region, including the Zun-Kholba, are spatially associated with ophiolite rocks, it can be assumed that relatively high-pressure and high-temperature metamorphism occurred in the deep parts of the Kholba shear zone. Our investigations of pyrrhotite ores from ophiolites allowed us to determine the conditions of metamorphism corresponding to the amphibolite facies [25]. According to the mentioned model of metamorphic devolatilization [5], the processes of ore-bearing fluid generation occurs under the conditions of the amphibolite facies of metamorphism.
All analyzed sulfides at the Zun-Kholba deposit have the similar sulfur isotope composition regardless of stage of mineral formation. It is evidence of the single source of sulfur for the deposit. The sulfur isotope values correspond to those described from both massive pyrrhotite-rich VMS ores from ophiolites and from other orogenic gold deposits of the Eastern Sayan (see Figure 13). All orogenic gold deposits in the southeastern part of Eastern Sayan are spatially associated with the ophiolite belt surrounding the Gargan Block. It allows us to suggest that ophiolites, including VMS type ore fragments, are the source of ore-forming components, particularly the sulfur and gold. It is consistent with the increased gold content in the East Sayan ophiolitic rocks [22,56]. VMS ores as a one of the sources of sulfur, gold and accompanied elements can explain the high sulfide contents at the Zun-Kholba deposit ores. According to the modern model for the origin of orogenic gold deposit subducted oceanic crust devolatilization is one of the main sources of gold and accompanying elements [6]. It explains the spatial association of Eastern Sayan orogenic gold deposits with ophiolite belts [20,21].
Low trace element concentrations in pyrrhotite confirm its metamorphic origin. It is suggested that pyrrhotite occurred due to the metamorphism of primary VMS ores generated by ancient black smokers. As a result, early Fe sulfides were converted to pyrrhotite depleted by trace elements during the phase transition pyrite → pyrrhotite. This mechanism is confirmed by the geochemistry of pyrites in the Zun-Kholba deposit. All the analyzed pyrites correspond to pyrites from VMS type deposits, which is reflected in the Au–As and Au–Cu binary diagrams (see Figure 12). Differences in geochemical characteristics of different pyrite species are due to the evolution of ore-forming elements during the formation of the deposit. Pre-ore globular pyrite is characterized by maximum concentrations of most trace elements, and Cu content is similar to copper concentration in pyrrhotite which proves their genetic relation. Increased contents of Bi and Mo in pyrite1 from the main quartz–pyrite ores are due to the influence of granitoid rocks (including gneisses), numerous fragments of which are present in the ore-hosting mélange. The successive decrease in contents of trace elements from pyrite1 (quartz–pyrite assemblage) to pyrite2 (quartz-base metal-sulfide assemblage) is explained by the crystallization of own mineral phases of these trace elements and their segregation from the pyrite structure [32]. In particular, sharp depletion of such elements as Bi, Te, Ag and Pb of pyrite2 is due to the crystallization of a relatively large volume of sulfosalts due to a decrease in the P–T parameters of ore deposition in near-surface conditions. Relatively low-temperature conditions for the formation of quartz-base metal-sulfide ores have been identified based on the data of thermometric studies.
The geological setting of the deposit-hosting lens-like structure shows that ophiolites, as well as fragments of the Tuva-Mongol microcontinent basement and its cover, were added into duplex structures during formation of the Kholba shear zone. These rock fragments were mixed to form a mélange and structurally confined between two parts of a granitoid massif. The generation of metamorphic fluids was caused by dynamic metamorphism in deep parts of the transpressive shear zone. The P–T conditions of dynamic metamorphism in shear zones can reach more than 500 °C and 8.5 kbar [57]. These conditions are sufficient for devolatilization of the wall rocks and metamorphic fluid generation [5]. Therefore, we consider the Zun-Kholba gold deposit formation to be consistent with the metamorphic devolatilization model.
The ore fluids were extracted from deep-seated metamorphic rocks underlying the Urik-Kitoi gold district. These source rocks may be the ancient subducted oceanic crust that was formed at the Tuva-Mongol microcontinent margin. Metamorphic fluids became enriched in gold, sulfur, and other metals during their flow through the ore-hosting environment. This environment consists of rock assemblages containing ophiolites and gneisses, which are characterized by a high gold content [56]. Probably the ophiolitic blocks contained significant amounts of VMS type sulfide ores, which provided a source of sulfur and most metals. Moreover, the bulk of the subducted oceanic crust was also relatively enriched in sulfur and some ore-forming elements, including gold [58]. The fragments of granitoids, dikes, and ultrabasic rocks contributed some elements that could explain the presence of Bi-, W-, Te-, Ni-, and Co-bearing phases in the epigenetic gold ores. These element enrichments are unusual for the Eastern Sayan orogenic gold deposits [21,36] although they are known to be present in other orogenic gold deposits [7,9,59,60]. At a depth of about 3–5 km, the ore formation began. The main factors controlling ore precipitation were probably changes in the chemistry of solutions as a result of water-rock interaction and decreases in the pressure and temperature of the rising fluid. In the near-surface, some amount of meteoric water was added into the gold-transporting metamorphic fluids. It led to an additional temperature decrease and precipitation of the base-metal sulfides in association with sulfosalts. Low pressure conditions near the surface caused the crack-filling quartz vein formation that hosts the base-metal sulfides.
Tectonic events that led to Eastern Sayan orogeny were caused by the Paleoasian Ocean closure at ca. 500–420 Ma [18]. In the late Paleozoic, shear deformation was widespread throughout much of the Central Asian Orogenic Belt including in Eastern Sayan. The Kholba shear zone developed during these tectonic events. The lens-like structure hosting the Zun-Kholba deposit probably was formed as a large transpressional zone. Transpressional shear zones often control the location of orogenic gold deposits [61,62]. The rocks of the Tuva-Mongol microcontinent basement and cover, as well as blocks of ophiolites and fragments of granitoids, were sheared together along this lens-like structural zone. All these lithologies within the mélange that hosts the Zun-Kholba deposit were sources for various ore-forming components.

7. Conclusions

  • Using different independent thermobarometric methods, it has been found that the formation of quartz–sulfide replacement ores in the Zun-Kholba gold deposit occurred at temperatures from 420–433 °C in the deepest part to 316 °C in the shallowest part of the deposit. Pressures during ore formation in the middle part of the deposit were 570–950 bar. The pressure and temperature of the ore formation decreased upwards.
  • The determined P–T parameters of ore formation allow us to classify the Zun-Kholba deposit as a mesozonal to epizonal orogenic gold deposit.
  • The ores were formed from homogeneous fluids of low to moderate salinity (2.4 to 7.9 wt.% eq. NaCl), where Fe chlorides were the dominant salt.
  • The sulfur isotope compositions, as well as pyrite geochemistry, show that the source of some ore-forming elements is ancient fragments of “black smokers” being hosted by ophiolitic blocks. These pre-ore VMS occurrences are scattered in the Zun-Kholba deposit area.
  • Oxygen isotope data prove the metamorphic origin of the ore-forming fluids with some mixing with meteoric waters at the shallow depths.
  • Ore formation at the Zun-Kholba deposit is consistent with the metamorphic devolatilization model, where the ophiolites containing sulfide ore fragments and partly host rocks were a source of gold, sulfur, and related ore-forming components.
  • The Zun-Kholba deposit was formed during the late Paleozoic deformation caused by the appearance of a regional transpressional shear zone.

Author Contributions

B.B.D. wrote the text of the article, conducted the research, and provided the funding. N.A.G. conducted research and took part in the data interpretation. M.L.M. carried out the mineralogical study. L.B.D. conducted the fluid inclusion study and interpreted the results. A.D.I. assisted in conducting the mineralogical study and performed the sample preparation. V.N.R. carried out the sulfur isotope study. V.F.P. carried out the oxygen and carbon isotope studies. D.A.A. carried out the LA-ICP-MS analysis of the pyrites and pyrrhotite. All authors have read and agreed to the published version of the manuscript.

Funding

This work was supported by the Ministry of science and higher education of the Russian Federation (project GIN SB RAS No. АААА-А21-121011390003-9).

Data Availability Statement

All reported results have been obtained during our research. Supplementary data are available on request.

Acknowledgments

The analytical work has been conducted at the Analytical Centre “Geospectr” of GIN SB RAS, Ulan-Ude, Russia, methods of stable isotope investigation were developed and supported under the state assignment of IGM SB RAS. The authors acknowledge Elena Khromova and Elena Khodyreva for conducting the analytical work.

Conflicts of Interest

The authors declare no conflict of interest.

References

  1. Groves, D.I.; Goldfarb, R.J.; Gebre-Mariam, M.; Hagemann, S.G.; Robert, F. Orogenic gold deposits: A proposed classification in the context of their crustal distribution and relationship to other gold deposit types. Ore Geol. Rev. 1998, 13, 7–27. [Google Scholar] [CrossRef]
  2. Goldfarb, R.J.; Groves, D.I. Orogenic gold: Common or evolving fluid and metal sources through time. Lithos 2015, 233, 2–26. [Google Scholar] [CrossRef]
  3. Ridley, J.R.; Diamond, L.W. Fluid chemistry of orogenic lode gold deposits and implications for genetic models. SEG Rev. 2000, 13, 141–162. [Google Scholar]
  4. Goldfarb, R.J.; Baker, T.; Dube, B.; Groves, D.I.; Hart, C.J.; Gosselin, P. Distribution, character and genesis of Gold Deposits in Metamorphic terranes. Econ. Geol. 100th Anniv. Vol. 2005, 407–450. [Google Scholar]
  5. Phillips, G.N.; Powell, R. Formation of gold deposits: A metamorphic devolatilization model. J. Metamorph. Geol. 2010, 28, 689–718. [Google Scholar] [CrossRef]
  6. Groves, D.I.; Santosh, M.; Deng, J.; Wang, Q.; Yang, L.; Zhang, L. A holistic model for the origin of orogenic gold deposits and its implications for exploration. Miner. Depos. 2020, 55, 275–292. [Google Scholar] [CrossRef]
  7. Kouhestani, H.; Pashidnejad-Omran, N.; Rastad, E.; Mohajjol, M.; Goldfarb, R.; Ghaderi, M. Orogenic gold mineralization at the Chah Bagh deposit, Muteh gold district, Iran. J. Asian Earth Sci. 2014, 91, 89–106. [Google Scholar] [CrossRef]
  8. Wang Ch Shao, Y.-J.; Evans, N.J.; Li, H.; Zhou, H.-D.; Huang, K.-X.; Liu, Z.-F.; Chen, Y.; Lai Ch Liu, Q.-Q. Genesis of Zixi gold deposit in Xuefengshan, Jiangnan Orogen (South China): Age, geology and isotopic constraints. Ore Geol. Rev. 2020, 117, 103301. [Google Scholar] [CrossRef]
  9. Izvekova, A.D.; Damdinov, B.B.; Damdinova, L.B.; Moskvitina, M.L. Gold-telluride mineralization in ore of Pionerskoe gold-quartz deposit (Eastern Sayan, Russia). Geol. Ore Depos. 2021, 63, 579–598. [Google Scholar] [CrossRef]
  10. Goldfarb, R.J.; Taylor, R.D.; Collins, G.S.; Goryachev, N.A.; Orlandini, O.F. Phanerozoic continental growth and gold metallogeny of Asia. Gondwana Res. 2014, 25, 48–102. [Google Scholar] [CrossRef]
  11. Feofilaktov, G.A. About the genetic relationship of gold mineralization wuth granitoid massifs of the Kytoi-Urik ore cluster (Eastern Sayan). In Ore-bearing capacity and structure of ore deposits of the Buryat Autonomous Soviet Socialist Republic. Proc. Geol. Dep. Buryat Branch Sib. Branch Acad. Sci. USSR Ulan-Ude 1970, 2, 10. (In Russian) [Google Scholar]
  12. Brazhnik, A.V. Zun-Kholba gold deposit. Ores Met. 1993, 3–6, 80–90. (In Russian) [Google Scholar]
  13. Zhmodik, S.M.; Dobretsov, N.L.; Mironov, A.G.; Roshchektaev, P.A.; Karmanov, N.S.; Kulikov, A.A.; Nemirovskaya, N.A.; Ochirov Yu, C. Mineralogical and geochemical signatures of hydrothermal-sedimentary origin of gold ore formation of the Kholba deposits, Eastern Sayan, Russia. Resour. Geol. Spec. Issue 1993, 17, 287–313. [Google Scholar]
  14. Kuzmichev, A.B. Neoproterozoic accretion of the Tuva-Mongolian massif, one of the Precambrian terranes in the Central Asian Orogenic Belt. In Composition and evolution of Central Asian Orogenic Belt: Geology, Evolution, Tectonics, and Models; Kroner, A., Ed.; Borntraeger Science Publishers: Stuttgart, Germany, 2015; pp. 66–92. [Google Scholar]
  15. Khain, E.V.; Bibikova, E.V.; Kroner, A.; Zhuravlev, D.Z.; Sklyarov, E.V.; Fedotova, A.A.; Kravchenko-Berezhnoy, I.R. The most ancient ophiolite of the Central Asian fold belt: U-Pb and Pb-Pb zircon ages for the Dunzhugur Complex, Eastern Sayan, Siberia, and geodynamic implications. Earth Planet. Sci. Lett. 2002, 199, 311–325. [Google Scholar] [CrossRef]
  16. Fedotova, A.A.; Khain, E.V. Tectonics of the South of the Eastern Sayan and Its Position in the Ural-Mongolian Belt; Scientific World: Moscow, Russia, 2002. (In Russian) [Google Scholar]
  17. Kuzmichev, A.B.; Larionov, A.N. Neoproterozoic island arcs in East Sayan: Duration of magmatism (from U-Pb zircon dating of volcanic clastics). Russ. Geol. Geophys. 2013, 54, 34–43. [Google Scholar] [CrossRef]
  18. Damdinov, B.B.; Zhmodik, S.M.; Travin, A.V.; Yudin, D.S.; Goryachev, N.A. New data on the age of gold mineralization in the southeastern part of Eastern Sayan. Dokl. Earth Sci. 2018, 479, 429–432. [Google Scholar] [CrossRef]
  19. Buslov, M.M. Tectonics and geodynamics of the Central Asian Fold belt: The role of Late Paleozoic large-amplitude strike-slip faults. Russ. Geol. Geophys. 2011, 52, 52–71. [Google Scholar] [CrossRef]
  20. Gordienko, I.V.; Roshtekhaev, P.A.; Gorokhovskiy, D.V. Oka ore district of the Eastern Sayan: Geology, structural-metallogenic zonation, genetic types of ore deposits, their geodynamic formation conditions, and outlook for development. Geol. Ore Depos. 2016, 58, 361–382. [Google Scholar] [CrossRef]
  21. Damdinov, B.B. Mineral types of gold deposits and regularities of their localization in Southeastern East Sayan. Geol. Ore Depos. 2019, 61, 118–132. [Google Scholar] [CrossRef]
  22. Mironov, A.G.; Zhmodik, S.M. Gold deposits of the Urik-Kitoi metallogenic zone (Eastern Sayan, Russia). Geol. Ore Depos. 1999, 41, 46–60. [Google Scholar]
  23. Zhmodik, S.M.; Postnikov, A.A.; Buslov, M.M.; Mironov, A.G. Geodynamics of the Sayan-Baikal-Muya accretion-collision belt in the Neoproterozoic-Early Paleozoic and regularities of the formation and localization of precious-metal mineralization. Russ. Geol. Geophys. 2006, 47, 183–197. [Google Scholar]
  24. Dewey, J.F.; Holdsworth, R.E.; Strachan, R.A. Transpression and transtension zones. In Continental Transpressional and Transtensional Tectonics; Geological Society; Holdsworth, R.E., Strachan, R.A., Dewey, J.F., Eds.; Special Publications: London, UK, 1998; pp. 1–14. [Google Scholar]
  25. Damdinov, B.B.; Damdinova, L.B.; Zhmodik, S.M.; Mironov, A.G. Gold-bearing pyrrhotite ores in East Sayan: Composition and Formation Conditions (by the Example of the Ol’ginskoe Ore Occurrence). Russ. Geol. Geophys. 2019, 60, 514–531. [Google Scholar] [CrossRef]
  26. Coplen, T.B. Normalization of oxygen and hydrogen data. Chem. Geol. 1988, 72, 293–297. [Google Scholar]
  27. Friedman, I.; O’Neil, J.; Cebula, G. Two new carbonate stable isotope standards. Geostand. Newsl. 1982, 6, 11–12. [Google Scholar] [CrossRef]
  28. Bodnar, R.J.; Vityk, M.O. Interpretation of microthermometric data for H2O-NaCl fluid inclusions. In Fluid Inclusions in Minerals, Methods and Applications; De Vivo, B., Frezzotti, M.L., Eds.; Virginia Tech: Blacksburg, VA, USA, 1994; pp. 117–130. [Google Scholar]
  29. Borisenko, A.S. Study of the salt composition of solutions of gas–liquid inclusions in minerals by the cryometric method. Russ. Geol. Geophys. 1977, 18, 16–27. [Google Scholar]
  30. Stipp, M.; Stunitz, H.; Heilbronner, R.; Schmid, S.M. The eastern Tonale fault zone: A ‘natural laboratory’ for crystal plastic deformation of quartz over a temperature range from 250 to 700 °C. J. Struct. Geol. 2002, 24, 1861–1884. [Google Scholar] [CrossRef]
  31. Tauson, V.; Lipko, S.; Smagunov, N.; Kravtsova, R.; Arsent’ev, K.Y. Distribution and segregation of trace elements during the growth of ore mineral crystals in hydrothermal systems: Geochemical and mineralogical implications. Russ. Geol. Geophys. 2018, 59, 1718–1732. [Google Scholar] [CrossRef]
  32. Dehnavi, A.S.; McFarlane, C.R.M.; Lentz, D.R.; Walker, J.A. Assessment of pyrite composition by LA-ICP-MS techniques from massive sulfide deposits of the Bathurst Mining Camp, Canada: From textural and chemical evolution to its application as a vectoring tool for the exploration of VMS deposits. Ore Geol. Rev. 2018, 92, 656–671. [Google Scholar] [CrossRef]
  33. Keith, M.; Smith, D.J.; Jenkin, G.R.T.; Holwell, D.A.; Dye, M.D. A review of Te and Se systematics in hydrothermal pyrite from precious metal deposits: Insights into ore-forming processes. Ore Geol. Rev. 2018, 96, 269–282. [Google Scholar] [CrossRef]
  34. Xie, J.; Tang, D.; Qian, L.; Wang, Y.; Sun, W. Geochemistry of sulfide minerals from skarn Cu (Au) deposits in the Fenghuangshan ore field, Tongling, Eastern China: Insights into ore-forming process. Ore Geol. Rev. 2020, 122, 103537. [Google Scholar] [CrossRef]
  35. Ohmoto, H.; Rye, R.O. Isotope of sulfur and carbon. In Geochemistry of Hydrothermal Deposits. Barnes, H.L., Ed.; John Wiley & Sons: New York, NY, USA, 1979; pp. 509–567. [Google Scholar]
  36. Airiyants, E.V.; Zhmodik, S.M.; Mironov, A.G.; Borovikov, A.A. Gold mineralization in siliceous-carbonate rocks of southeastern East Sayan. Russ. Geol. Geophys. 2007, 48, 389–399. [Google Scholar] [CrossRef]
  37. Damdinov, B.B.; Damdinova, L.B. Zun-Ospa Gold Deposit, Eastern Sayan: Geology, Ore Composition, and Genesis. Geol. Ore Depos. 2018, 60, 241–264. [Google Scholar] [CrossRef]
  38. Seal, R.R. Sulfur isotope geochemistry of sulfide minerals. Rev. Mineral. Geochem. 2006, 61, 633–677. [Google Scholar] [CrossRef]
  39. O’Hara, K.; Sharp, Z.; Moecher, D.; Jenkin, G.T. The effect of deformation on oxygen isotope exchange in quartz and feldspar and the significance of isotopic temperatures in mylonites. J. Geol. 1997, 105, 193–204. [Google Scholar] [CrossRef]
  40. Schulz, B.; Audren, C.; Triboulet, C. Oxygen isotope record on fluid-rock-SiO2 interaction during Variscan progressive deformation and quartz veining in the meta-volcanosefdiments of Belle-Ile (Southern Brittany). J. Struct. Geol. 2002, 24, 1281–1297. [Google Scholar] [CrossRef]
  41. Bottinga, Y.; Javoy, M. Comments on oxygen isotope geothermometry. Earth Planet. Sci. Lett. 1973, 20, 250–265. [Google Scholar] [CrossRef]
  42. Sharp, Z.D.; Gibbons, J.A.; Maltsev, O.; Atudorei, V.; Pack, A.; Sengupta, S.; Shock, E.L.; Knauth, L.P. A calibration of the triple oxygen isotope fractionation in the SiO2-H2O system and applications to natural samples. Geochim. Cosmochim. Acta 2016, 186, 105–119. [Google Scholar] [CrossRef] [Green Version]
  43. Zhang, Y.; Zhang, D.; Wu, G.; Di, Y.; Li, X.; Bu, X.; Liu, J. Origin of the Daping gold deposit in the Ailaoshan metallogenic belt, SW China: Insights from geology, isotope geochemistry and geochronology. Ore Geol. Rev. 2018, 96, 1–12. [Google Scholar] [CrossRef]
  44. Moloshag, V.P. Using of the mineral composition to the physical-chemical formation conditions of the sulfide ores from Ural. Lithosphere 2009, 2, 28–40. (In Russian) [Google Scholar]
  45. Shikazono, N. A comparison of temperatures estimated from the electrum–sphalerite–pyrite–argentite assemblage and filling temperatures of fluid implications from epithermal Au-Ag vein-type deposits in Japan. Econ. Geol. 1985, 80, 1415–1424. [Google Scholar] [CrossRef]
  46. Kretschmar, U.; Scott, S.D. Phase relations involving arsenopyrite in the system Fe-As-S and their application. Can. Mineral. 1976, 14, 364–386. [Google Scholar]
  47. Steele-MacInnis MLecumberri-Sanchez, P.; Bodnar, R.J. HokieFlincs_H2O-NaCl: A Microsoft excel spreadsheet for interpreting microthermometric data from fluid inclusions based on the PVTX properties of H2O–NaCl. Comput. Geosci. 2012, 49, 334–337. [Google Scholar] [CrossRef]
  48. Steele-MacInnis, M.; Lecumberri-Sanchez, P.; Bodnar, R.J. Synthetic fluid inclusions XX. Critical PTx properties of H2O–FeCl2 fluids. Geochim. Cosmochim. Acta 2015, 148, 50–61. [Google Scholar] [CrossRef]
  49. Simmons, S.F.; White, N.C.; John, D.A. Geological characteristics of epithermal precious and base metal deposits. Soc. Econ. Geol. 100th Anniv. Vol. 2005, 485–522. [Google Scholar]
  50. Tuba, G.; Kontak, D.J.; Choquette, B.G.; Pfister, J.; Hastie, E.C.; van Hees, E.H. Fluid diversity in the gold-endowed Archean orogenic systems of the Abitibi greenstone belt (Canada) I: Constraining the PTX of prolonged hydrothermal systems. Ore Geol. Rev. 2021, 135, 104221. [Google Scholar] [CrossRef]
  51. Prokofiev VYu Pek, A.A. Problems in estimation of the formation depth of hydrothermal deposits by data on pressure of mineralizing fluids. Geol. Ore Depos. 2015, 57, 1–20. [Google Scholar] [CrossRef]
  52. Lewis, J.C.; Byrne, T.B. History of metamorphic fluids along outcrop-scale faults in a Paleogene accretionary prism, SW Japan: Implications for prismscale hydrology. Geochem. Geophys. Geosyst. 2003, 4, 9007. [Google Scholar] [CrossRef] [Green Version]
  53. Sheldon, H.A.; Ord, A. Evolution of porosity, permeability and fluid pressure in dilatant fault post-failure: Implications for fluid flow and mineralization. Geofluids 2005, 5, 272–288. [Google Scholar] [CrossRef]
  54. Vilor, N.V.; Volkova, M.G.; Budyak, A.E.; Goryachev, N.A.; Pavlova, L.A.; Spiridonov, A.M.; Bryanskiy, N.V.; Danilov, B.S. Sulfoarsenide mineralization with gold in the crumpling zone on the East Trans-Baikal branch of the Mongol-Okhotsk Sutura (Pogromnoye deposit, Eastern Transbaikalia, Russia). Pac. Geol. 2021, 40, 33–50. [Google Scholar]
  55. Hoefs, J. Stable Isotope Geochemistry, 6th ed.; Springer: Berlin/Heidelberg, Germany, 2009; 285p. [Google Scholar]
  56. Grebenschikova, V.I.; Shmotov, A.P. Stages of formation of the Zun-Kholba gold-ore deposit (East Sayan). Geol. Geophys. 1997, 28, 756–764. [Google Scholar]
  57. Gongalves, P.; Poivlet, J.-C.; Oliot, E.; Trap, P.; Marquer, D. How does shear zone nucleate? An example from the Suretta nappe (Swiss Eastern Alps). J. Struct. Geol. 2016, 86, 166–180. [Google Scholar] [CrossRef]
  58. Pitcairn, I.K.; Craw, D.; Teagle, D.A. Metabasalts as sources of metals in orogenic gold deposits. Miner. Depos. 2015, 50, 373–390. [Google Scholar] [CrossRef]
  59. Budyak, A.E.; Bryukhanova, N.N. Selenium, bismuth, and mercury in black shale-hosted gold deposits of different genetic types. Geochem. Int. 2012, 50, 791–797. [Google Scholar] [CrossRef]
  60. Tarasova, Y.I.; Budyak, A.; Chugaev, A.; Goryachev, N.; Tauson, V.; Skuzovatov, S.Y.; Reutsky, V.; Abramova, V.; Gareev, B.; Bryukhanova, N. Mineralogical and isotope-geochemical (δ13C, δ34S and Pb-Pb) characteristics of the Krasniy gold mine (Baikal-Patom Highlands): Constraining ore-forming mechanisms and the model for Sukhoi Log-type deposits. Ore Geol. Rev. 2020, 119, 118–136. [Google Scholar] [CrossRef]
  61. Wilson, C.J.; Osborne, D.J.; Robinson JA Miller, J.M. Structural Constraints and Localization of Gold Mineralization in Leather Jacket Lodes, Ballarat, Victoria, Australia. Econ. Geol. 2016, 111, 1073–1098. [Google Scholar] [CrossRef] [Green Version]
  62. Zoheir, B.; El-Wahed, M.A.; Pour, A.B.; Abdelnasser, A. Orogenic Gold in Transpression and Transtension Zones: Field and Remote Sensing Studies of the Barramiya–Mueilha Sector, Egypt. Remote Sens. 2019, 11, 2122. [Google Scholar] [CrossRef] [Green Version]
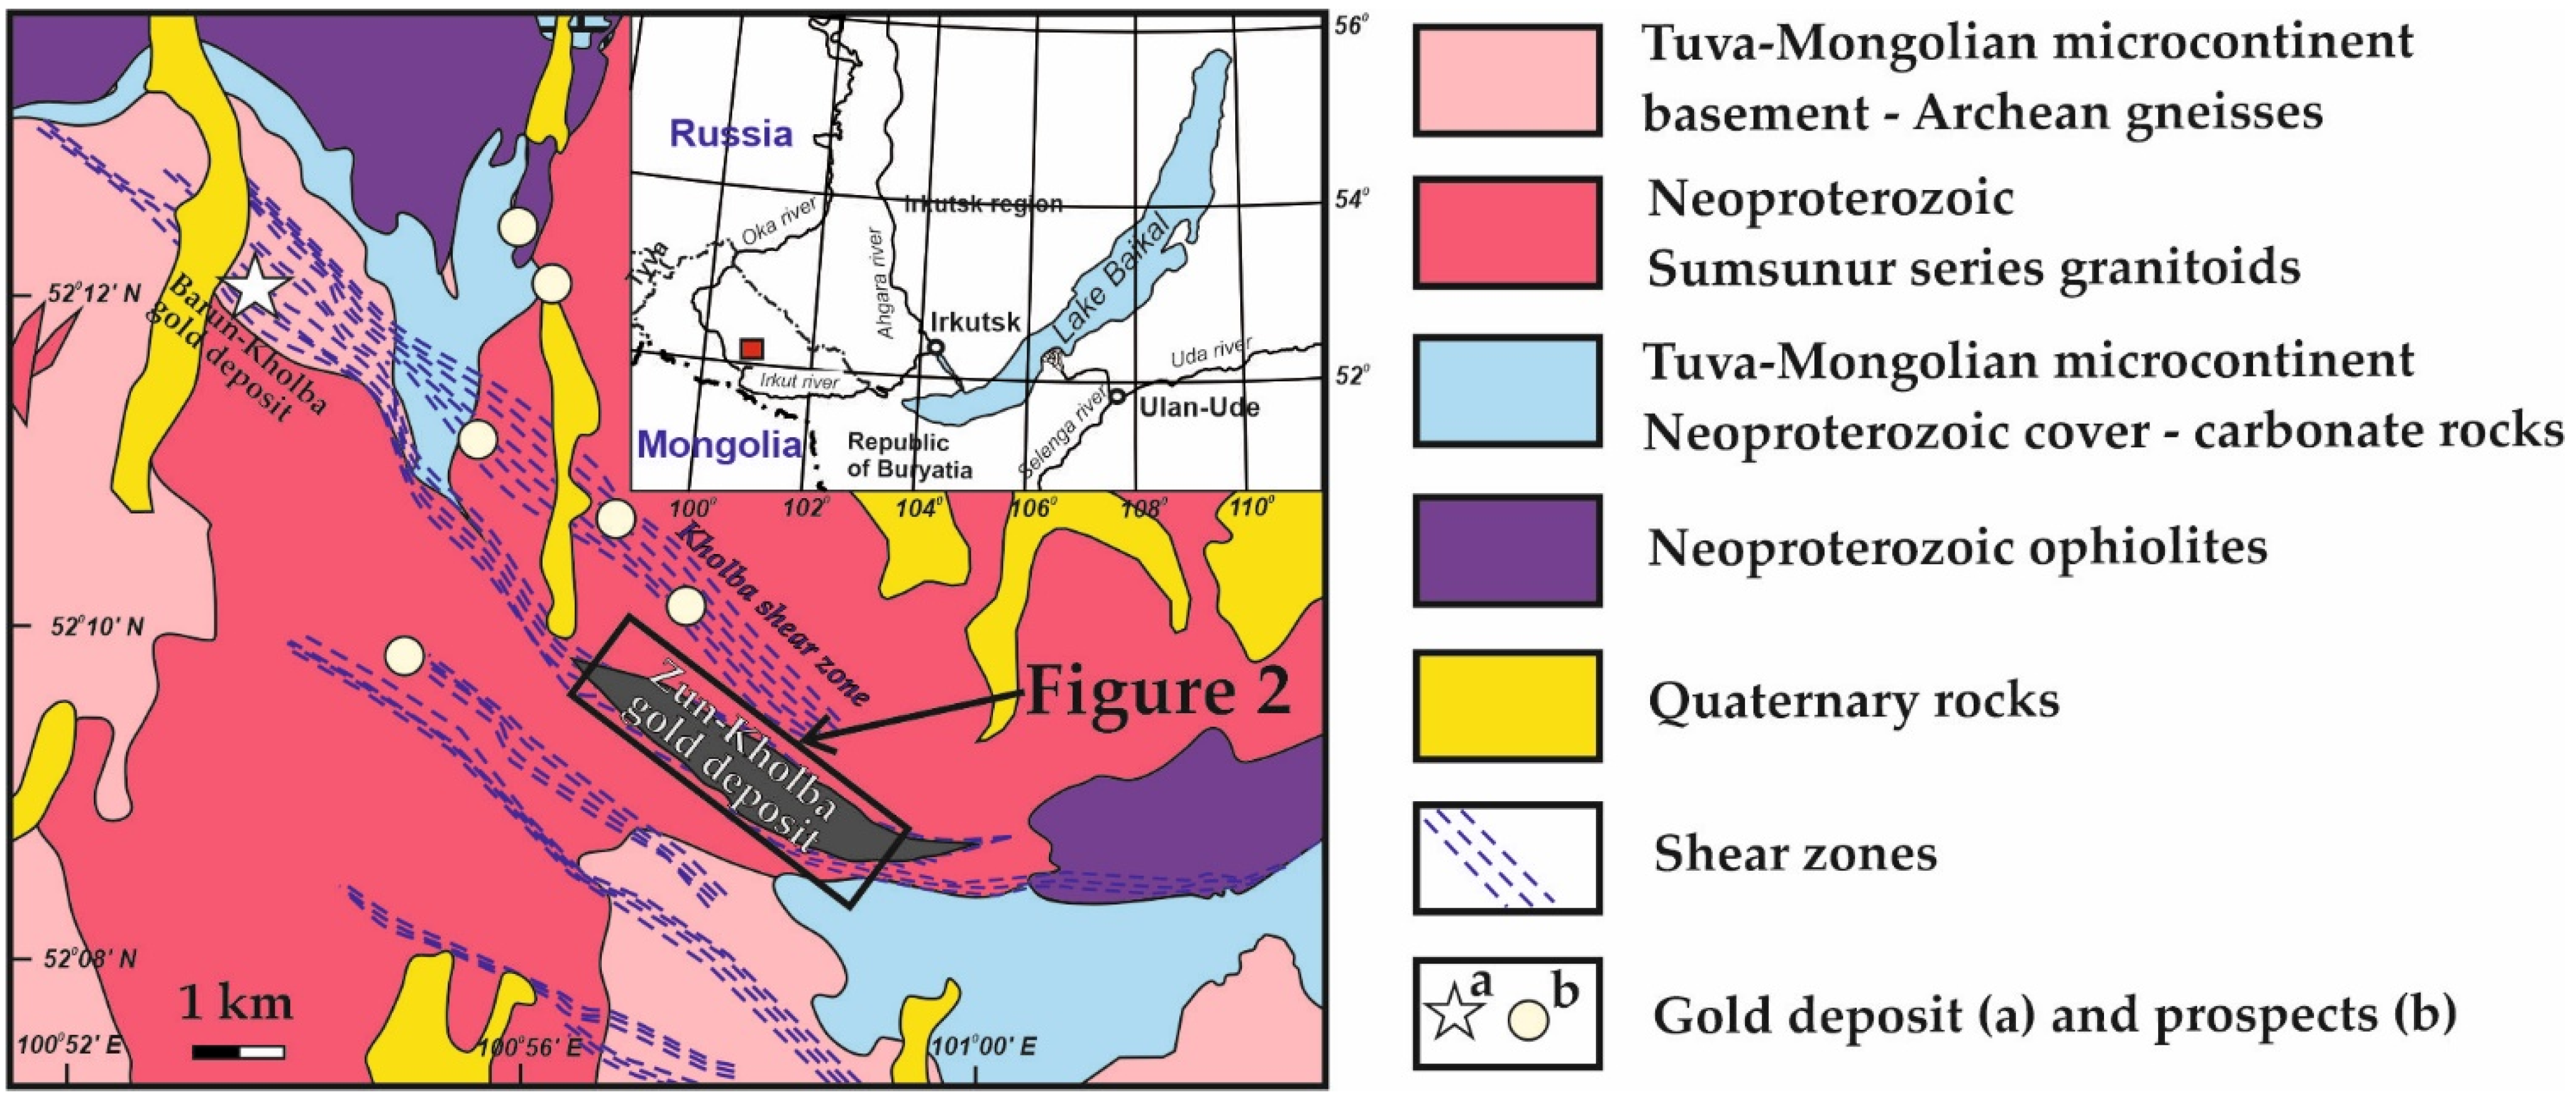
Figure 1. Regional geological setting of the Zun-Kholba gold deposit.
Minerals 12 00395 g001
Figure 2. Schematic geological map (a,b) section of the Zun-Kholba gold deposit (modified from References [13,20]).
Minerals 12 00395 g002
Figure 3. Morphology of the Vavilovskoye and Sulfdinoye ore bodies at the horizon of 1740 m.
Minerals 12 00395 g003
Figure 4. Thin section photos: (a,b) flow textures in the quartz–sericite-altered rocks, (c) highly sulfidized and silicified limestone, and (d) the flow texture in silicified limestone. Scale bar is 0.2 mm.
Minerals 12 00395 g004
Figure 5. Different ore types: (a) typical quartz–pyrite (with minor carbonate) ore, (b) quartz–pyrite ore is located at crushing zone cataclasites, (c) quartz–pyrite ore replacing the limestone, and (d) quartz–base metal–sulfide (pyrite–chalcopyrite–sphalerite–galena) ore.
Minerals 12 00395 g005
Figure 6. Microphotographs of the ore minerals: (a) general view of the quartz–pyrite assemblage; the pyrite1 crystal aggregate is partly replaced by base metal–sulfides (chalcopyrite and sphalerite); (b) arsenopyrite crystal in the pyrite1 crystal aggregate; (c) general view of the quartz–base metal–sulfide assemblage, with early pyrite (Py1) corroded by the predominant base metal–sulfide assemblage consisting of late pyrite (Py2), chalcopyrite (Cpy), sphalerite (Sph), and galena (Gal); (d) pyrrhotite grain in a base metal–sulfide aggregate; (e) lens-like hessite inclusion in chalcopyrite; (f) native bismuth lens cutting galena veinlet in chalcopyrite; and (g) intergrowth of native bismuth with hessite in pyrite1. (ad) Reflected light and (eg) backscattered electrons. Abbreviations: Py—pyrite, Cpy—chalcopyrite, AsPy—arsenopyrite, Sph—sphalerite, Gal—galena, Mrc—marcasite, Po—pyrrhotite, Hes—hessite, and Bi—native bismuth.
Minerals 12 00395 g006
Figure 7. Gold fineness distribution histogram for the quartz–sulfide ores (light blue). Gray—native gold from pyrite–pyrrhotite bodies.
Minerals 12 00395 g007
Figure 8. Native gold morphology: (a,b) medium-grade gold inclusions in pyrite1, (c) low-grade gold in association with sphalerite and chalcopyrite, and (d) low-grade gold in association with galena as an inclusion in pyrite1. Reflected light. Abbreviations: Py—pyrite, Au—native gold, Sph—sphalerite, Cpy—chalcopyrite, and Gal—galena.
Minerals 12 00395 g008
Figure 9. Quartz microstructures: (a) typical granulate medium-grained quartz aggregate; (b) granulate quartz with partly recrystallized fine-grained quartz at the grain boundaries; (c) deformed quartz with both medium- and fine-grained areas; (d) relationships of the quartz and sulfides (Sf). Thin section photos. Scale bar is 0.2 mm.
Minerals 12 00395 g009
Figure 10. Pyrite–pyrrhotite bodies: (a) lens-like boudin of pyrite–pyrrhotite ore in the ore-controlling cataclastic zone and (b) pyrite–pyrrhotite ore, a photo of the polished section: globular pyrite (Py) and arsenopyrite crystal (Aspy) among the pyrrhotite (Po) aggregate containing anhedral segregations of chalcopyrite. The pyrrhotite aggregate has flowing texture.
Minerals 12 00395 g010
Figure 11. Laser ablation profile in the pyrite2 grain. Small peaks of Zn and Cu (marked by arrows) are probably caused by the occurrence of chalcopyrite and sphalerite micro-inclusions.
Minerals 12 00395 g011
Figure 12. Binary Au–Cu (a) and Au–As (b) diagrams for the analyzed pyrites. Globular pyrite from the pre-ore pytite-pyrrhotite bodies; Pyrite1—pyrite from the main quartz–pyrite ores; Pyrite2—pyrite from the quartz-base metal-sulfide ores. Element concentrations in ppm.
Minerals 12 00395 g012
Figure 13. Sulfur isotope composition diagram for the Zun-Kholba gold deposit in comparison with other gold deposits of Eastern Sayan and pyrrhotite ores from ophiolitic sequences [25,36,37]. Mantle and marine sulfate values from Reference [38].
Minerals 12 00395 g013
Figure 14. Distribution of quartz–sulfide (Q + Sf) and quartz–sericite-muscovite (Q + Ms) aggregates in sample Zk-330. Polished plate and thin section photos. Scale bar is 0.2 mm.
Minerals 12 00395 g014
Figure 15. Plot of δ13CPDB vs. δ18OSMOW values for carbonates from the Zun-Kholba deposit (fields of different types of carbonate rocks from Reference [43]).
Minerals 12 00395 g015
Figure 16. Fluid inclusion homogenization temperature distribution histogram.
Minerals 12 00395 g016
Figure 17. Morphology of the studied fluid inclusions: (a,b)—relatively high-temperature fluid inclusions with even contours; (cf)—low-temperature fluid inclusions with sinuous contours. The numbers are homogenization temperatures. Scale line size is 10 µm.
Minerals 12 00395 g017
Figure 18. Mineral assemblages used for the geothermometry: (a)—native gold (electrum)—sphalerite; (b)—arsenopyrite—pyrite. Py—pyrite, Au—electrum, Sph—sphalerite, Gal—galena, AsPy—arsenopyrite.
Minerals 12 00395 g018
Table 1. Minerals comprising the quartz–sulfide ores of the Zun-Kholba gold deposit.
Quartz–Pyrite OresQuartz–Base Metal–Sulfide OresPre-Ore Massive Pyrite–Pyrrhotite Bodies (Boudins)
Main mineralsPyritePyrite, galena, sphaleritePyrite, pyrrhotite
Minor mineralsChalcopyrite, galena, sphalerite, arsenopyrite, native goldChalcopyrite, pyrrhotite, tetrahedrite, native goldSphalerite, galena, arsenopyrite, native gold
Rare mineralsNative bismuth, hessite (AgTe2), scheelite, tetradymite (Bi2Te2S), vikingite (Ag5Pb8Bi13S30)Cubanite, hessiteTetradymite, hessite
Table 2. Stages and the sequence of sulfide mineralization formation at the Zun-Kholba gold deposit.
MineralPre-Ore StageOre-Forming Minerals Deposition Sequence
Quartz Minerals 12 00395 i001
Carbonate Minerals 12 00395 i002
Globular pyrite Minerals 12 00395 i003
Pyrite1 Minerals 12 00395 i004
Pyrite2      Minerals 12 00395 i005
Arsenopyrite Minerals 12 00395 i006   Minerals 12 00395 i007
Chalcopyrite Minerals 12 00395 i008      Minerals 12 00395 i009
Scheelite Minerals 12 00395 i010
Mиллepит Minerals 12 00395 i011
Marcasite                   Minerals 12 00395 i012
Sphalerite Minerals 12 00395 i013            Minerals 12 00395 i014
Galena            Minerals 12 00395 i015
Ag-tetrahedrite            Minerals 12 00395 i016
Pyrrhotite Minerals 12 00395 i017           Minerals 12 00395 i018
Tetradymite                    Minerals 12 00395 i019
Native bismuth                    Minerals 12 00395 i020
Hessite                    Minerals 12 00395 i021
Vikingite                    Minerals 12 00395 i022
Native gold Minerals 12 00395 i023
Table 3. LA-ICP-MS analysis results for pyrite and pyrrhotite, ppm.
MineralSampleVCrMnCoNiCuGaZn
Globular pyrite, n = 13Mean0.2015.166.791390.1046.751287.670.31756.98
Min0.102.800.2824.372.5070.700.002.48
Max0.5057.0024.106730.00418.006200.001.882890.00
SD0.1217.557.751867.66112.061552.280.551008.40
Pyrite from the quartz–pyrite ores (Pyrite1), n = 61Mean0.210.737.95201.706.01443.520.11642.62
Min0.010.010.100.100.104.910.001.61
Max5.405.00165.001910.0030.605500.001.128570.00
SD0.090.142.9446.550.86110.610.03210.37
Pyrite from the quartz-base metal-sulfide ores (Pyrite2), n = 21Mean0.030.271.619.5467.9034.940.16267.92
Min0.010.010.050.310.538.390.001.48
Max0.071.4721.3074.00520.00192.000.501550.00
SD0.020.364.6817.59129.9543.940.21514.35
Pyrrhotite, n = 3Mean0.195.471.600.6211.671250.670.135.53
Min0.082.600.000.427.20172.000.033.80
Max0.378.604.800.8015.002620.000.268.30
MineralSampleGeAsSeMoAgInSnCd
Globular pyrite, n = 13Mean11.83172.642.240.4026.730.520.4830.98
Min10.847.850.140.012.400.020.080.08
Max12.53559.005.704.0088.003.093.00124.00
SD0.61166.301.511.0927.280.880.7940.50
Pyrite from the quartz–pyrite ores (Pyrite1), n = 61Mean7.76227.075.471.0151.260.230.7824.09
Min6.202.180.320.000.31 0.05
Max8.77191419.7021.6011004.9912.60345.00
SD0.0844.750.630.4923.690.100.258.69
Pyrite from the quartz-base metal-sulfide ores (Pyrite2), n = 21Mean6.99474.090.690.023.780.010.2426.65
Min6.482.860.030.000.220.000.080.10
Max7.5014961.900.0338.000.051.62260.00
SD0.22521.940.550.017.610.020.3370.63
Pyrrhotite, n = 3Mean14.770.353.131.588.470.030.190.53
Min14.600.240.500.026.440.010.120.28
Max14.900.476.203.7010.700.060.300.90
MineralSampleSbTeAuHgTlPbBi
Globular pyrite, n = 13Mean6.5122.442.660.290.201209.1518.32
Min1.301.510.150.070.0318.502.58
Max35.2069.0011.701.440.928000.0091.00
SD8.7421.863.520.410.232460.0823.46
Pyrite from the quartz–pyrite ores (Pyrite1), n = 61Mean2.739.902.021.830.04629.2150.27
Min0.030.140.010.040.015.750.27
Max15.17105.0078.0080.000.338650.00564.00
SD0.432.141.251.330.01181.2810.91
Pyrite from the quartz-base metal-sulfide ores (Pyrite2), n = 21Mean11.930.150.650.320.01582.120.06
Min0.320.000.020.010.004.450.01
Max212.000.493.222.100.056900.000.37
SD43.820.170.860.430.011683.310.08
Pyrrhotite, n = 3Mean0.612.870.060.000.05623.333.06
Min0.430.730.000.000.02430.002.24
Max0.876.100.140.080.08970.004.37
Note: SD—standard deviation.
Table 4. Sulfur isotope composition of the sulfide minerals.
Sampleδ34S, ‰δ34Sfl, ‰MineralLevel, m
1Zk-233-11.31.1Chalcopyrite2250
2Zk-233-21.1−0.1Pyrite22250
3Z-5741.60.4Pyrite22134
4Z-5321.30.1Pyrite22032
5Kh-542.8Pyrite11840
6Z-5051.1−0.1Pyrite11740
7Z-5081.50.3Pyrite11740
8Zkhl-41.80.6Pyrite11490
9Zkhl-62.51.3Pyrite11490
10Zkhl-101.80.6Pyrite11490
11Zkhl-301.70.5Pyrite11490
12Zkhl-311.20Pyrite11490
13Zkhl-322.61.4Pyrite11490
14Zkhl-3320.8Pyrite11490
15Zk-601−0.2Pyrite11440
16Zk-680.4−0.8Pyrite11440
17Zk-720.3−0.9Pyrite11390
18Zk-941.50.3Pyrite11340
19Zk-970−0.6Pyrrhotite1290 *
20Zk-99-10.6−0.6Globular pyrite1290 *
21Zk-99-20.2−0.4Pyrrhotite1290
22Zkh-82.32.1Chalcopyrite
23Kh-8992.81.6Pyrite
24Kh-90731.8Pyrite
25Kh-9102.51.3Pyrite
26Kh-16742.81.6Pyrite
27Kh-9773.82.6Pyrite
28Kh-97942.8Pyrite
29Kh-10074.63.4Pyrite
Note: *—samples for calculating the temperature of the mineral formation.
Table 5. Carbon and oxygen isotope composition of carbonates, muscovite, and quartz.
Num.Sampleδ13C, ‰δ18O, ‰δ18Ofl, ‰MineralLevel
1.Kh-410.4211.9 Carbonate1840
2.Kh-571.1812.0 Carbonate1840
3.Kh-700.213.3 Carbonate1840
4.Kh-102−0.5311.1 Carbonate1840
5.Kh-106−1.728.0 Carbonate1840
6.Kh-128−1.1610.2 Carbonate1740
7.Z-7020.1216.1 Carbonate
8.Zk-229 12.46.0Quartz2250
9.Zk-322 15.79.3Quartz2165
10.Zk-323 16.19.7Quartz2165
11.Zk-326 14.88.4Quartz2165
12.З-546 13.39.4Quartz2032
13.Kh-21 13.39.4Quartz1840
14.Kh-97 15.811.9Quartz1840
15.Z-517 14.29.5Quartz1740
16.Sev-3 17.512.8Quartz1490
17.Zkhl-20 17.813.1Quartz1490
18.Zkhl-8 17.813.1Quartz1490
19.Zk-62 16.411.7Quartz1440
20.Zk-330 10.29.3Muscovite *1260
21.Zk-330-1 13.29.3Quartz *1260
22.Zk-310-2 15.411.5Quartz1260
Note: *—samples used for calculating the temperature of the mineral formation. Temperatures of the δ18Ofl calculations are: level 1260 m—420 °C; levels 1440–1740 m—380 °C; levels 1840–2032 m—316 °C.
Table 6. Fluid inclusion study results.
Num.SampleTeutTIce melt.ThomBulk Salinity, wt.% eq. NaClP, kbar
°C
High-Temperature FI
1Zkhl-22−37−53407.90.57
2Zkhl-22−37−3.83256.20.71
3Zkhl-20−37−1.43072.40.87
4Zkhl-22−38−3.63055.90.95
Low-Temperature FI
5Zkhl-20−38−3.52755.7
6Zkhl-22−37−1.32682.2
7Zkhl-21−38−62489.2
8Zkhl-20−38−0.62401.1
9Zkhl-20 −3.42355.6
10Zkhl-22−38−3.42255.6
11Zkhl-20−37−0.52080.9
12Zkhl-20−37−2.82074.7
13Zkhl-20−37−1.51852.6
14Zkhl-20−37−3.51825.7
15Zkhl-22−37−1.51682.6
Table 7. Chemical composition of minerals used for thermometry.
MineralFeZnCdAsS
Sphalerite1.8–7.7
3.8
59.7–65.2
61.9
0–1.3
0.91
32.1–33.9
33.1
Arsenopyrite30.3–38.1
35.6
38.8–45.4
42.4
19.9–24.1
21.1
Note: in the numerator the range of values, in the denominator—the mean value.
Table 8. Mineral geothermometry results.
Num.SampleNAgElectXFeSSphAsars, at%T, °CLevel
1Z-5800.51980.0591 3182134
2Z-5800.52930.0591 3142134
3Z-5800.52660.0591 3152134
Average0.52520.0591 316
4Z-5060.30490.1126 4641740
5Zkhl-100.34680.0670 4091490
6Zkhl-100.45040.0670 3541490
Average0.39860.0670 382
7ZK-3350.26060.0389 4371260
8ZK-3350.24620.0469 4581260
9ZK-3350.25500.0469 4511260
10ZK-3350.25410.0469 4521260
11ZK-3350.25780.0469 4491260
12ZK-3350.25800.0469 4491260
13ZK-3350.26060.0469 4471260
Average0.28940.0567 437
14Z-506 27.852711740
15Z-506 30.843991740
16Z-506 30.343771740
17Z-506 29.143261740
18Z-506 30.703931740
19Z-506 29.703501740
20Z-506 30.533851740
Average 29.87357
21Zkhl-10 30.884001490
22Zkhl-10 30.553861490
23Zkhl-12 30.713931490
Average 30.71393
24ZK-95 29.563441290
25ZK-95 30.123681290
26ZK-95 29.973621290
27ZK-99 30.343771290
28ZK-99 30.383791290
29ZK-99 30.203711290
30ZK-99 29.903591290
31ZK-335 29.953611260
32ZK-335 29.693501260
Average 30.01363
Note: 1–13 electrum-sphalerite; 14–32 arsenopyrite thermometry; Elect—electrum, Sph—sphalerite.
Publisher’s Note: MDPI stays neutral with regard to jurisdictional claims in published maps and institutional affiliations.