Article

A Contribution towards a More Sustainable Cement: Synergy of Mill Scales, Greek Wet Fly Ash, Conventional Raw Materials and Clinkering Temperature

by
Maria D. Kamitsou
1,2,
Dimitra G. Kanellopoulou
1,2,
Angeliki Christogerou
1,2 and
George N. Angelopoulos
1,2,*
1
Department of Chemical Engineering, Caratheodory 1, University of Patras, 26504 Rio, Greece
2
INVALOR: Research Infrastructure for Waste Valorization and Sustainable Management, Caratheodory 1, University Campus, 26504 Patras, Greece
*
Author to whom correspondence should be addressed.
Minerals 2022, 12(3), 324; https://doi.org/10.3390/min12030324
Submission received: 27 January 2022 / Revised: 23 February 2022 / Accepted: 1 March 2022 / Published: 5 March 2022
(This article belongs to the Special Issue Valorization of Metallurgical and Mining Residues and Wastes)

Abstract

:
Portland cement is the most common type of cement and one of the most important ingredients in concrete. Concrete, on the other hand, is the most used building material worldwide just behind the water with an increasing usage trend in infrastructure for the upcoming years. During the production process of cement, massive CO2 emissions are released into the environment, while large amounts of raw materials and energy are consumed. In the present study, Portland type cement was prepared in laboratory-scale by Greek Wet Fly Ash and Mill Scales, as well as conventional raw materials such as limestone, shale and lava. The experiments were conducted at 1450 °C and 1340 °C. The fired compositions were characterized by XRD, Q–XRD, optical microscopy, SEM/EDS and the concrete specimens were tested for their compressive strength. The results indicated that formation of cement clinker at lower temperatures (1340 °C) is feasible with the combined use of natural raw materials and industrial byproducts following the standard production route of cement industries. Finally, the so-obtained cement presented compressive strength values comparable to the conventional ones fired at 1450 °C.

1. Introduction

Cement is a basic building material, with a global production of 4.1 Gt/year (2020 world production) [1]. It contributes significantly to the building of our cities and therefore the development of our culture, mainly due to its special characteristics, namely strength, durability, longevity, resilience, etc., in combination with its competitive price. Cement production requires raw materials rich in the oxides CaO, SiO2, Al2O3 and Fe2O3. Their common abbreviations, in industry and research of cement, is C, S, A and F respectively [2,3,4]. In order to produce Portland cement, raw materials rich in these oxides are mixed and fired at temperatures usually up to 1450 °C. Therefore, the clinker of Portland cement consists mainly of 4 basic mineralogical phases; tricalcium silicate or alite (C3S), dicalcium silicate or belite (C2S), Tetracalcium aluminoferrite or ferrite (C4AF) and tricalcium aluminate or celite (C3A) [3,4].
During cement production, it is estimated that almost 680 kg total CO2 emissions per ton of cement are released into the environment in two ways, ranking the cement industry among the largest CO2 emitters in the world [5,6]. This quantity of CO2 is released in two ways: 60% directly, due to decomposition upon heating of CaCO3 found in limestone [3,7] and 40% indirectly, due to the thermal energy consumption required for the production process [3,6]. Moreover, the cement industry is a large energy consumer with a typical energy requirement for Portland cement production, 440–3845 MJ/t of cement, from the quarry to packaging [8,9]. The need for reuse, waste recovery, reduced energy consumption and minimization of carbon footprint is imperative and concerns many of the scientific and industrial cement research in the last decades [8,10,11,12].
Therefore, according to a number of researchers [8,13,14,15,16,17] the reduction of CO2 emissions in Portland cement production, is possible by applying the circular economy principles, i.e., using alternative fuels in cement kilns and/or using recycled/secondary byproducts as raw materials (wastes) and/or changing the chemistry of cement. These “new types of cement” are often called “low energy cements”. The most common problems these types of cement may face are the low initial strength of the produced mortars [18,19] and the “dust effect” due to the formation of γ-belite (γ-C2S) [18]. The above disadvantages are proposed to be addressed in several ways [13,14,15,16,17]. However, to our knowledge, no study exists that utilizes industrial secondary products such as Iron Lamination Scales (ILS), Greek Wet Fly Ash (WFA) and at the same time lower clinkering temperature. The present study attempts to do so.
The cement chemistry implies that alite is formed as a result of the reaction of CaO and C2S. Under optimal conditions, eutectic melt is formed and alite can be formed at a temperature of 1338 °C [20], while for all the other main phases, namely belite (C2S), calcium aluminate (C3A) and ferrite (C4AF), the temperature of formation is below 1300 °C [3]. In addition, C2S crystallizes in five main structures [21] (α, αH′, αL′, β and γ) depending on the clinkering temperature and all of them, except γ-structure, have very good hydraulic properties. Ono [22] showed that during rapid cooling a significant proportion of belite remains in the α-form between lamellas of the disordered β-form. However, γ-C2S is thermodynamically stable at room temperature and is favored by slow cooling [18]. So, in order to stabilize the desired belite structures, there are two ways: by adding certain oxides that act as stabilizers [23,24,25,26] or rapid cooling. On one hand, β-C2S is stabilized by the addition of B2O3, Na2O, K2O, BaO, MnO2, Cr2O3, SO3 and combinations of them. Also, α- and α’-C2S are stabilized by using MgO, A12O3, Fe2O3, BaO, K2O, P2O5 and Cr2O3 [25]. On the other hand, rapid cooling could be achieved in various ways, such as using water, compressed air, liquid nitrogen and carbon tetrachloride [27]. However, the use of water as a refrigerant resulted in a reduction in strength of the produced cement, and carbon tetrachloride led to the collapse of the natural structure of the clinker phases [27,28]. The most effective cooling method is achieved with the use of liquid nitrogen, but it presents difficulties in its use. Therefore, the most efficient cooling method is the compressed air blowing and simultaneous breaking of the clinker.
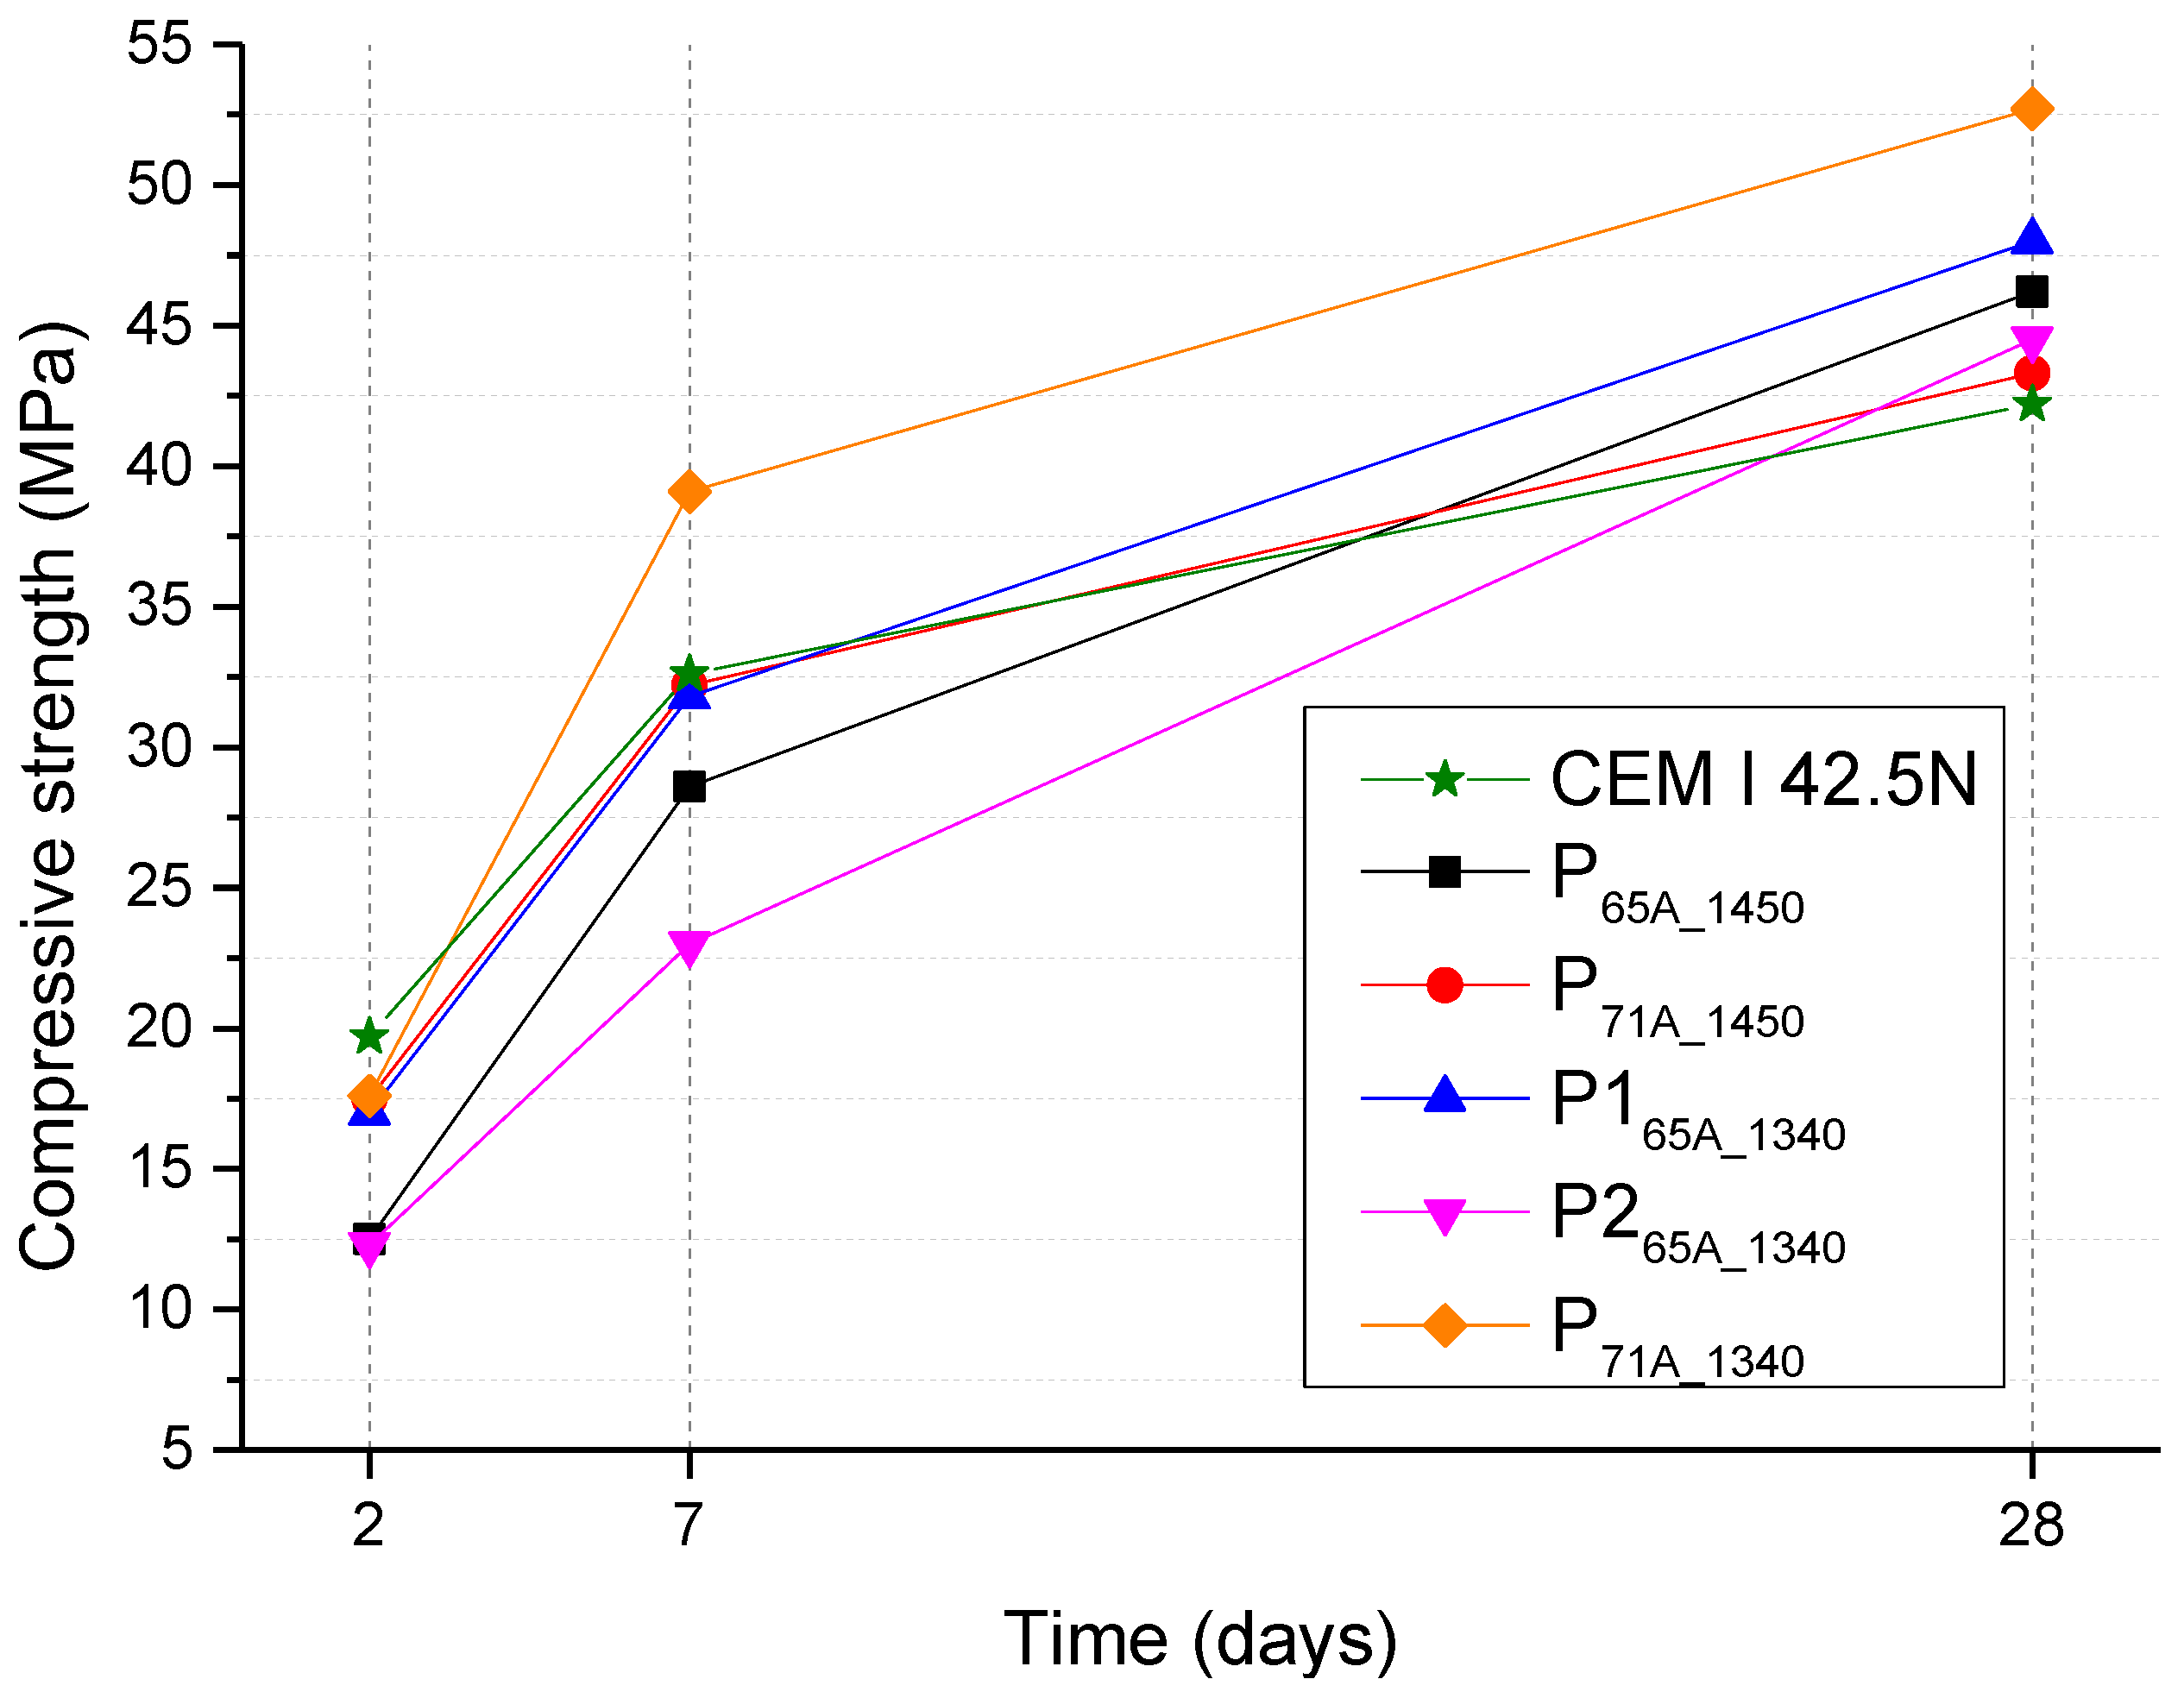
Therefore, the cement compositions of this study were fired over 1300 °C, at 1340 °C, in order to form alite in the clinkers. This was confirmed by the performance of preliminary tests. The produced cement was designed to be Portland cement with more than 65% wt. of C3S, in order to avoid low initial strength.
Moreover, this study investigated the reduction in the use of quarry raw materials and their partial replacement with industrial byproducts in the raw meal, along with the reduction of clinkering temperature. The main goal was to produce an alternative Portland cement yielding comparable compressive strength values to commercial ones. Under this prism, two syntheses were designed containing 65% wt. and 71% wt. of alite, and their formation was based on the synergy of conventional raw materials, byproducts and clinkering temperatures. In this case, two different temperatures were studied at 1450 °C and 1340 °C, respectively. Additionally, a commercial Portland clinker (CEM I 42.5N) was also analyzed for comparative reasons. Finally, the used byproducts comprised of Greek Wet Fly Ash (WFA) and Mill Scales, which are rich in SiO2 and Fe2O
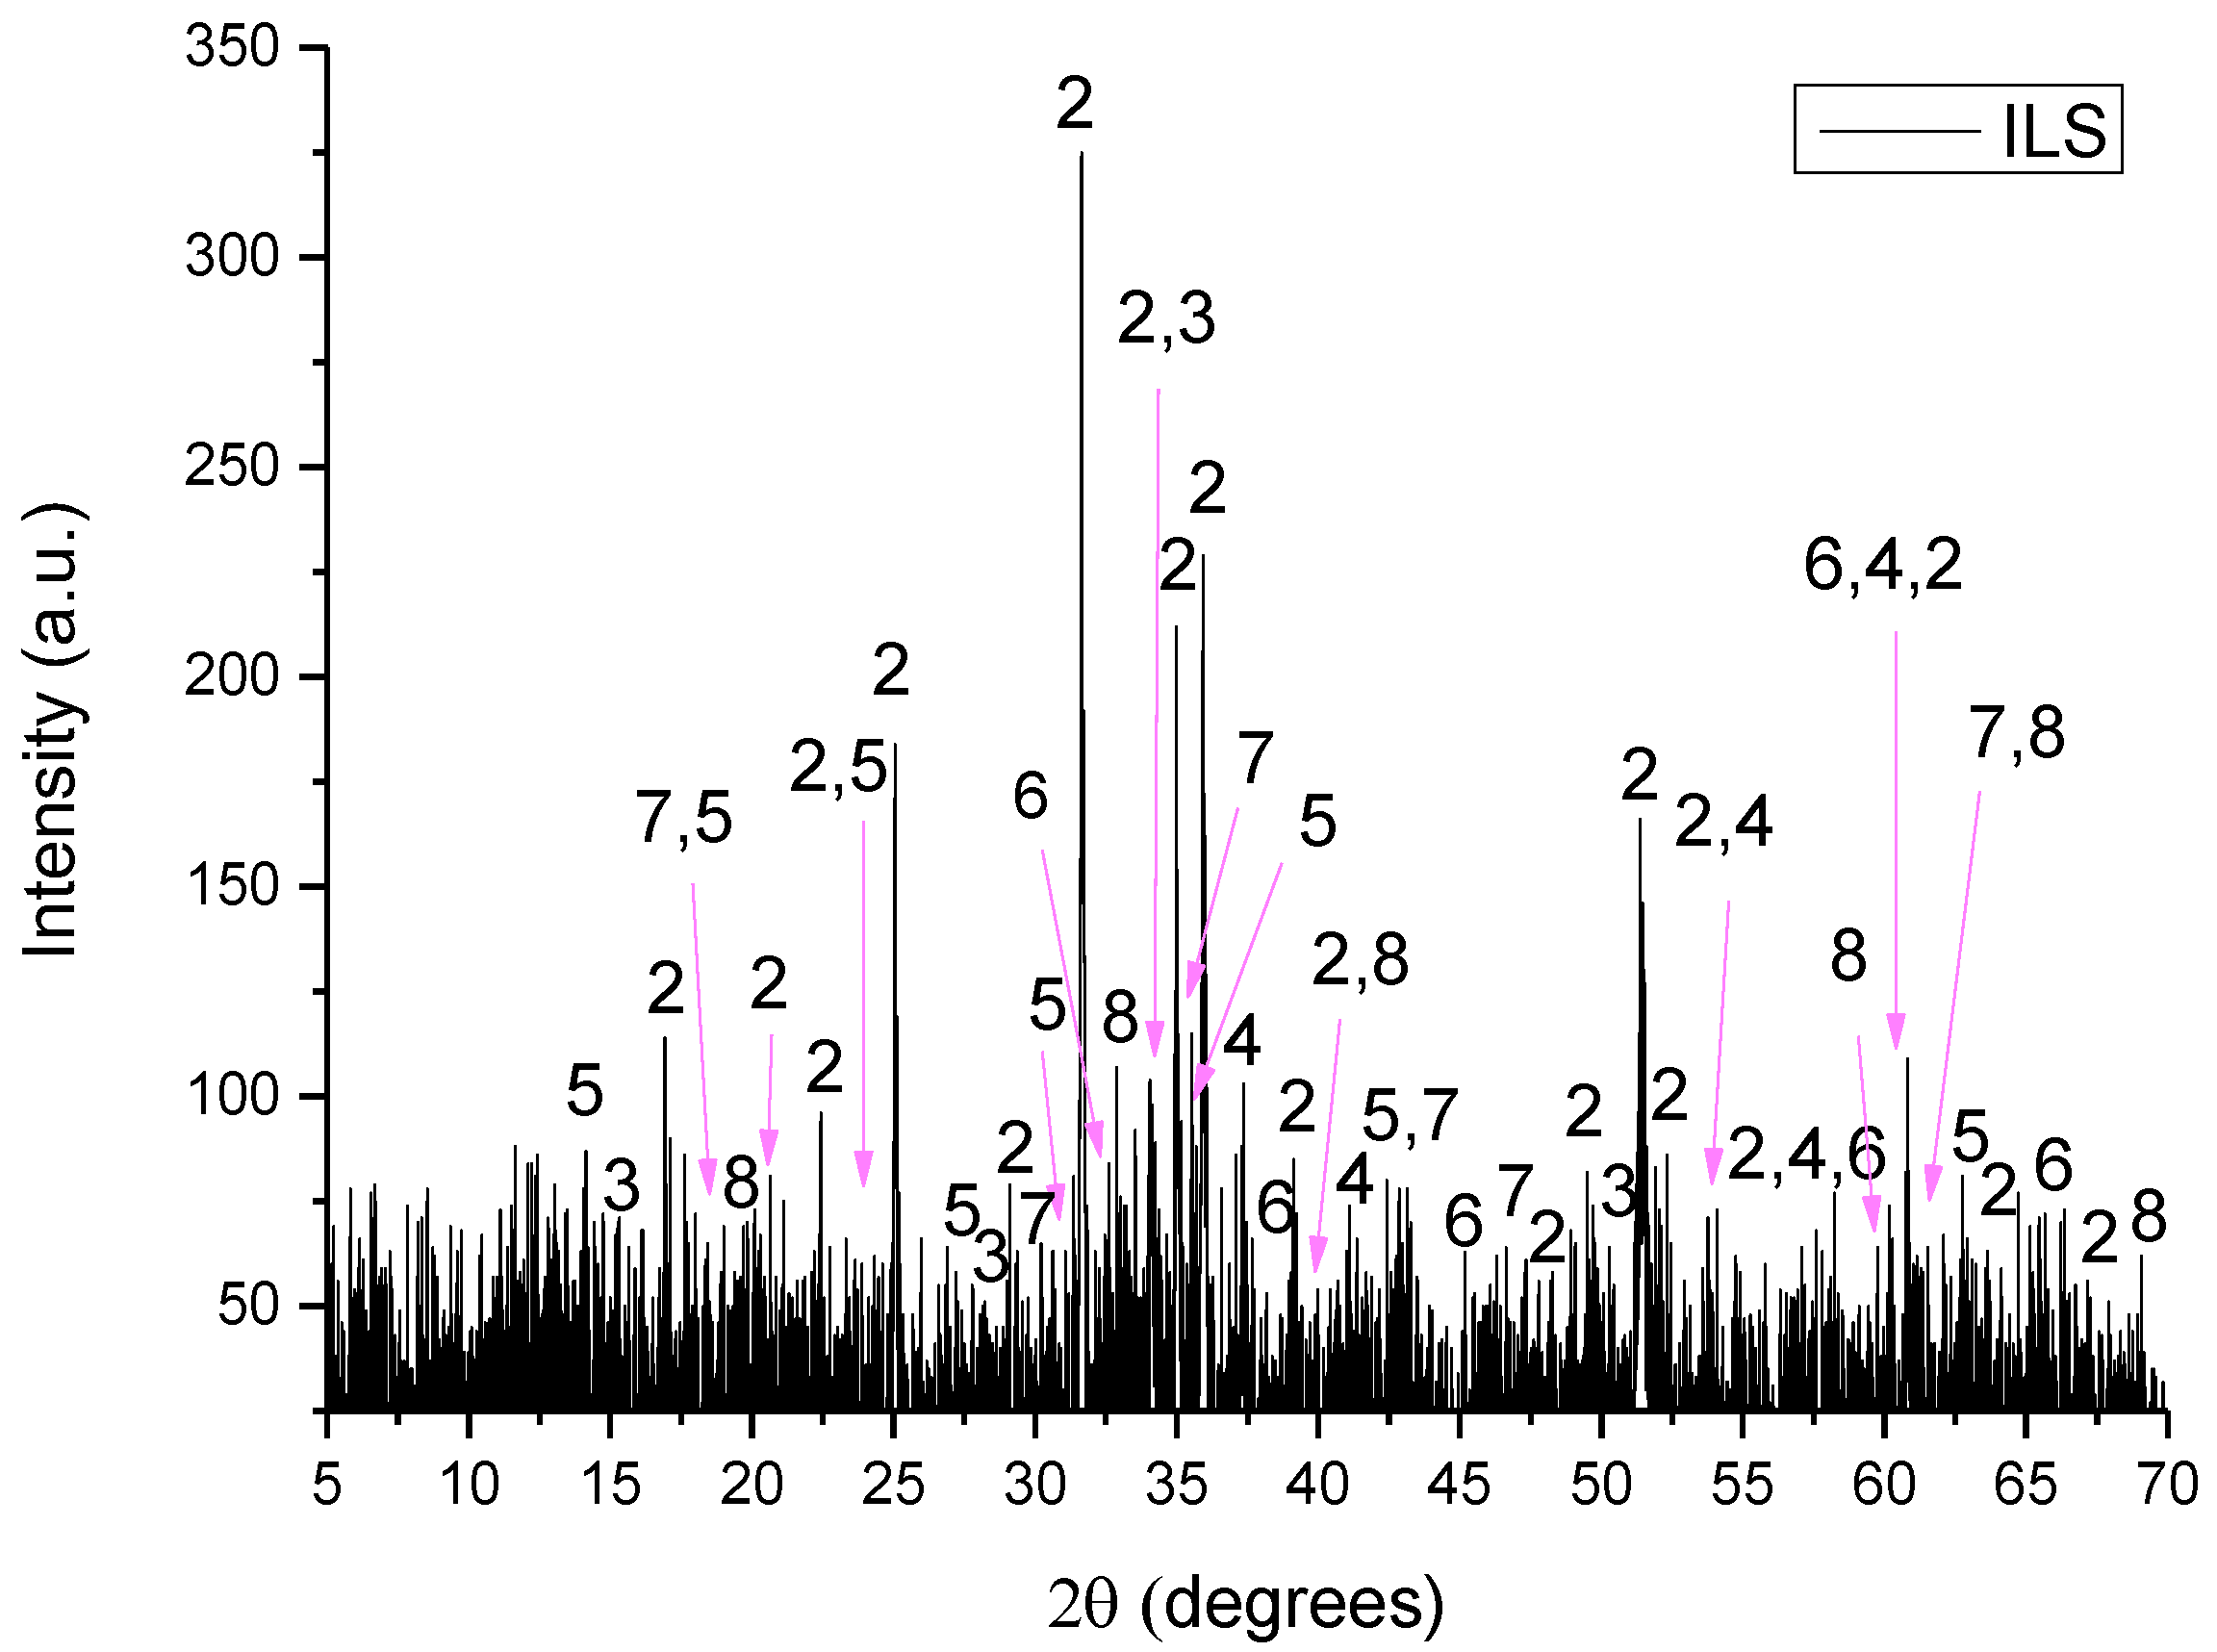
3 respectively. The type of Mill Scales used in this study are Iron Lamination Scales and are denoted as ILS from this point forward. ILS is a byproduct of the steel production and derives from the process of lamination of iron at high temperatures. The quantity of ILS produced in the steel mills constitutes about 10–15% wt. of the total supply quantity of the kiln, with the result that the metallurgical slags are one of the largest in quantity industrial byproducts [
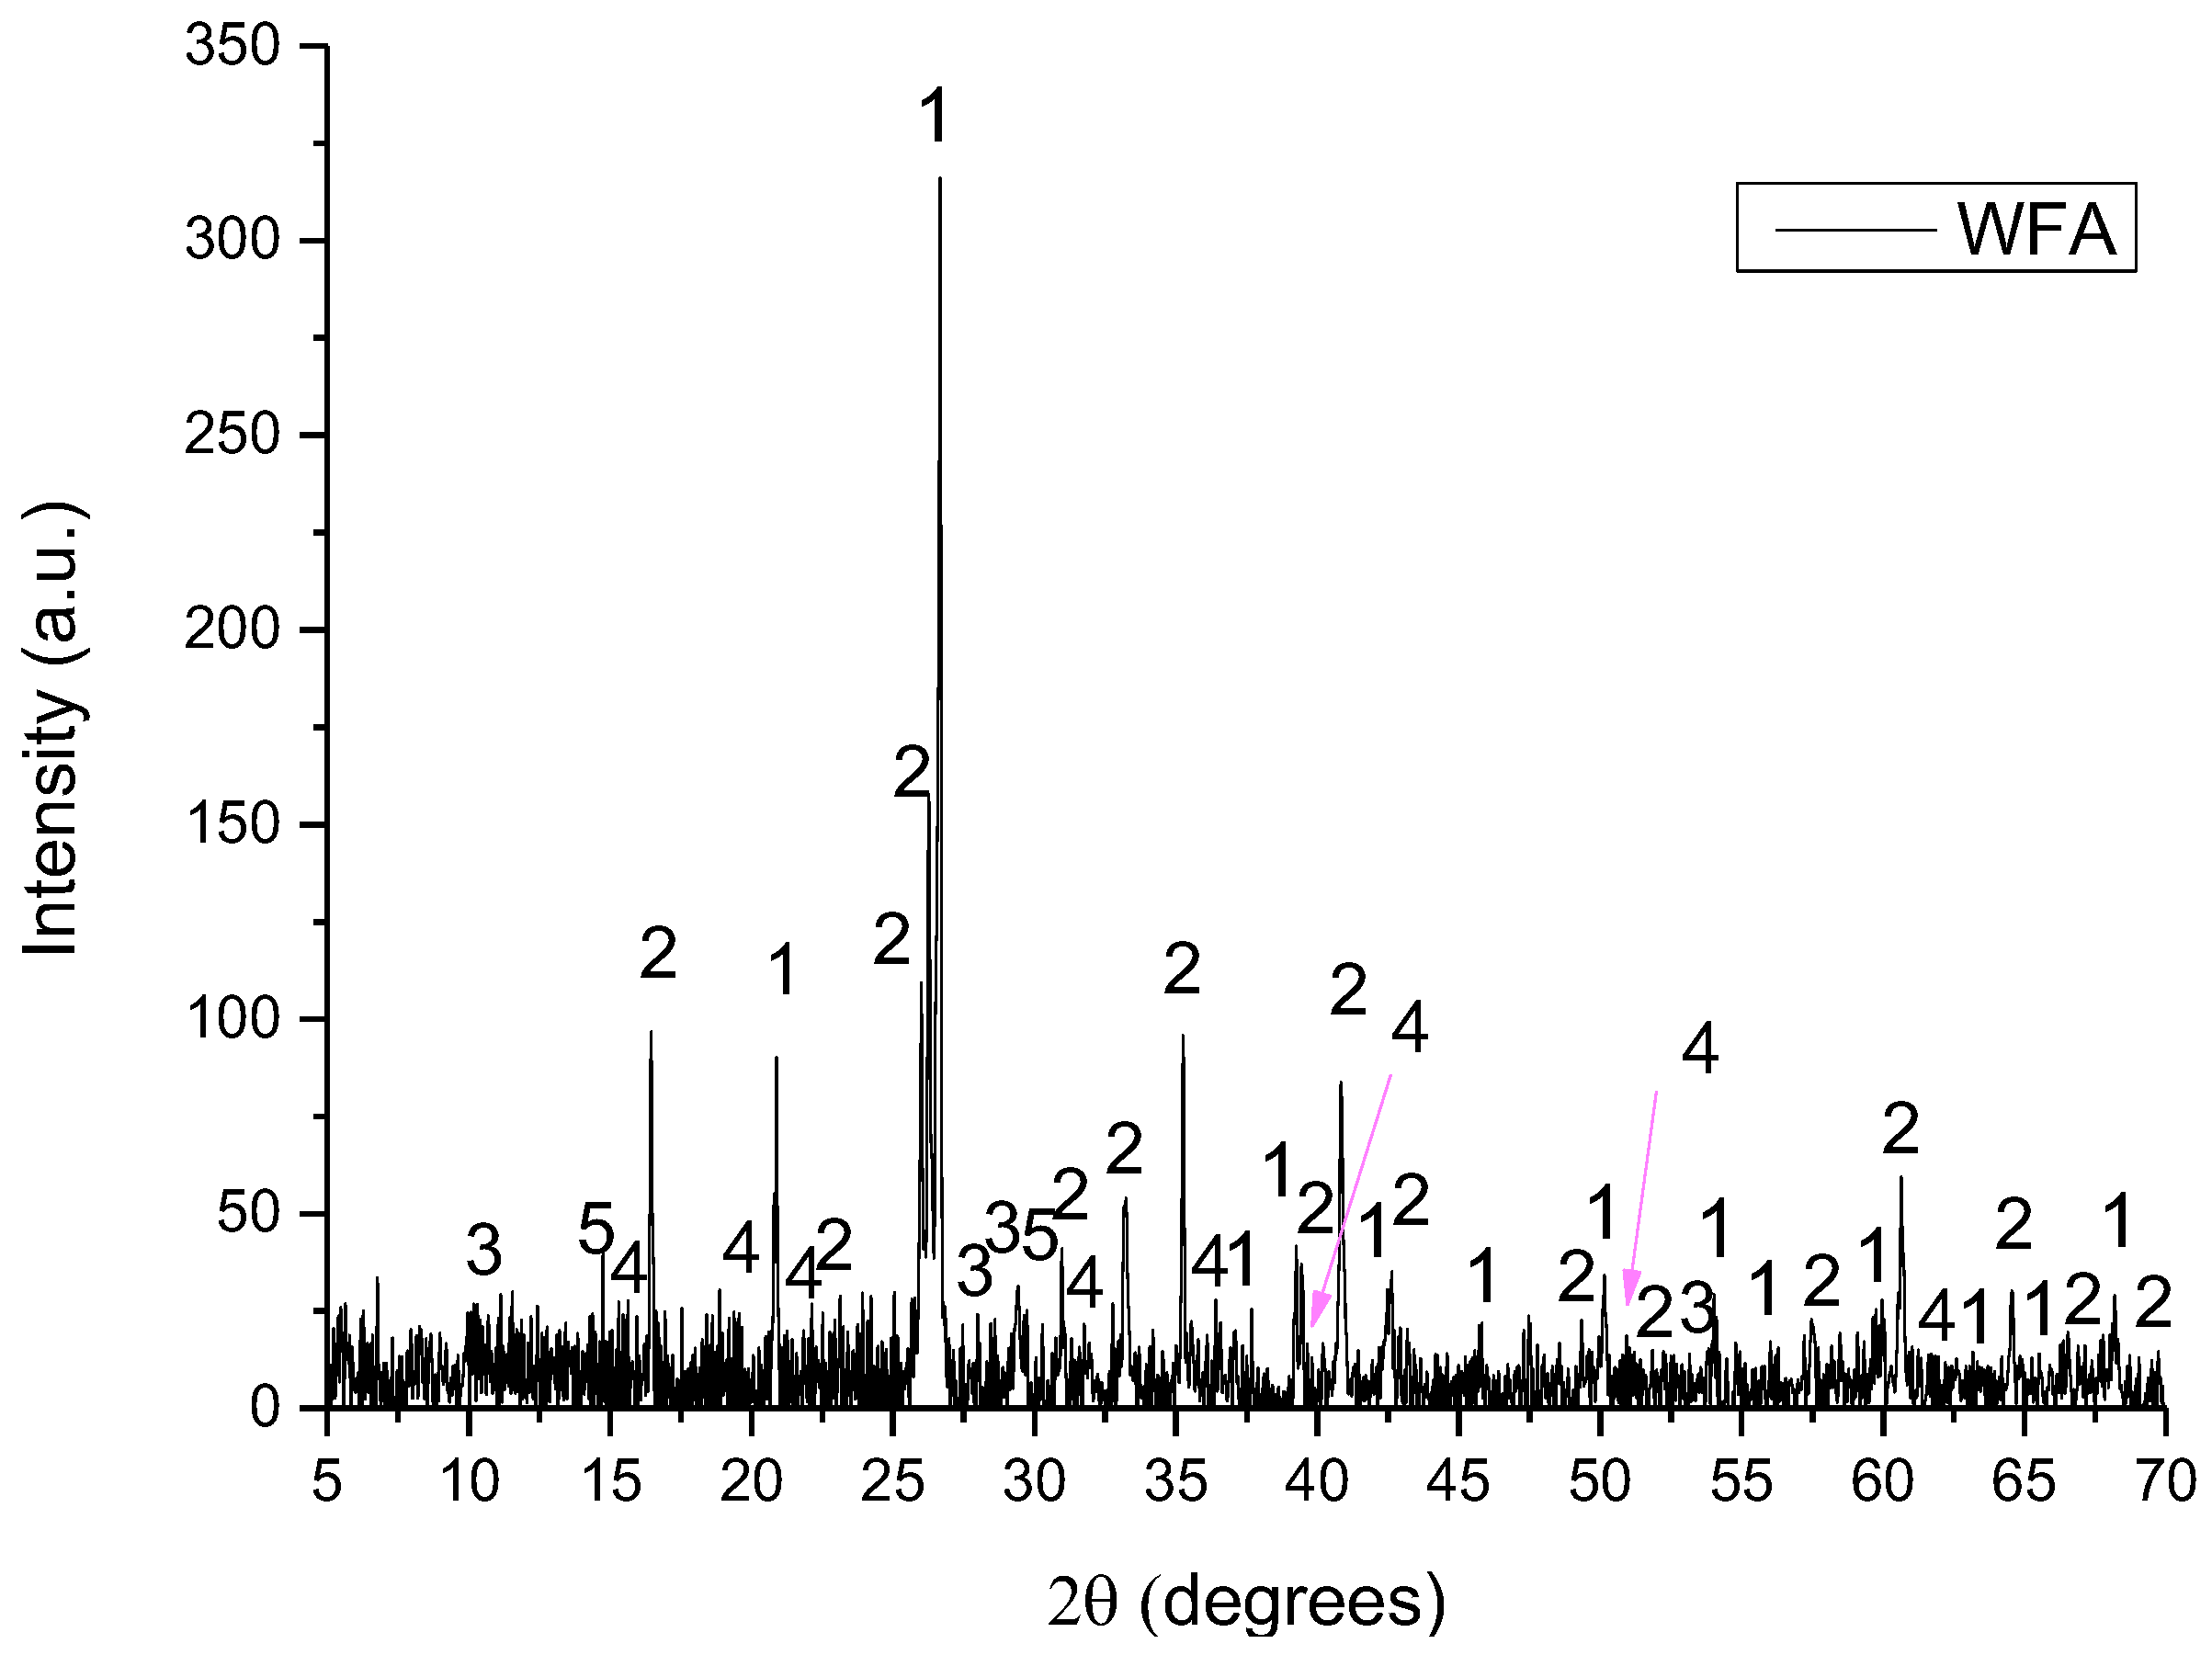
29]. WFA, on the other hand, is a fine-grained material of spherical glass particles, which is obtained by electrostatic or mechanical precipitation in the exhaust gases of dry combustion furnaces of powdered carbon or lignite, in thermal power plants [30,31,32]. WFA constitutes 85–90% wt. of the total ash produced in the plant and its global production is about 488.5 Mt/y [33,34], and in Greece, it amounts to 12 Mt/y [31].

2. Materials and Methods

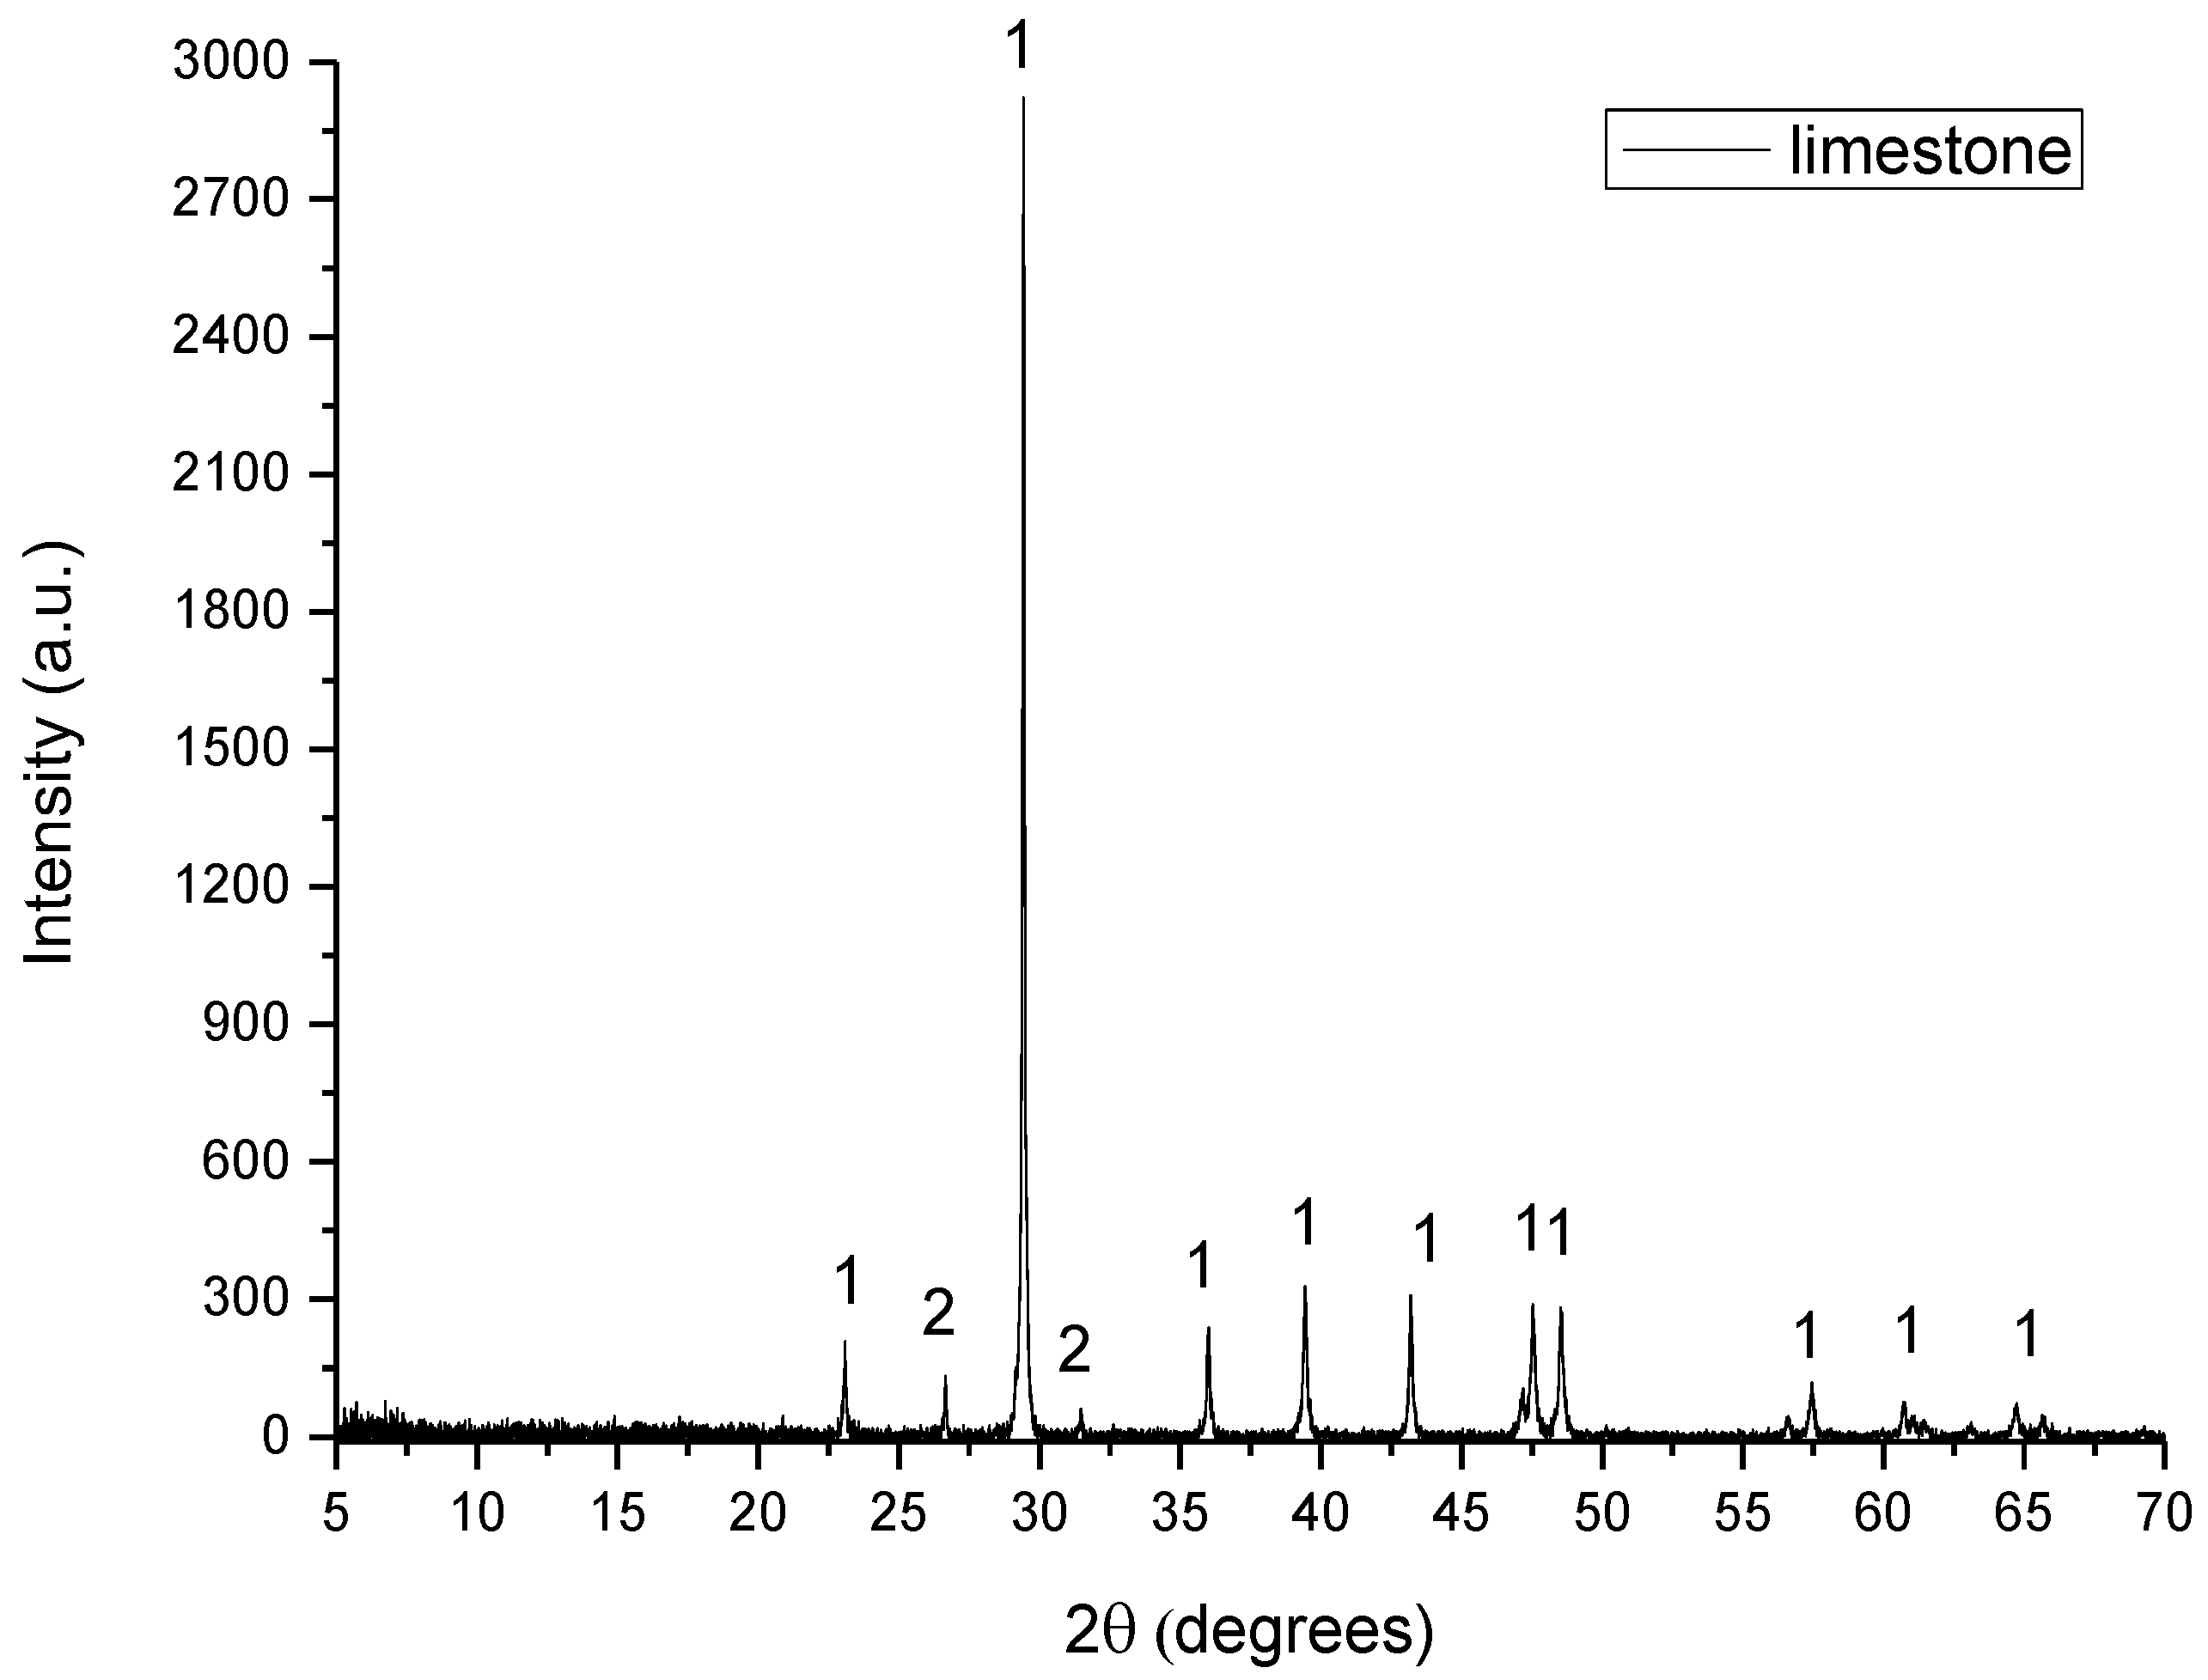
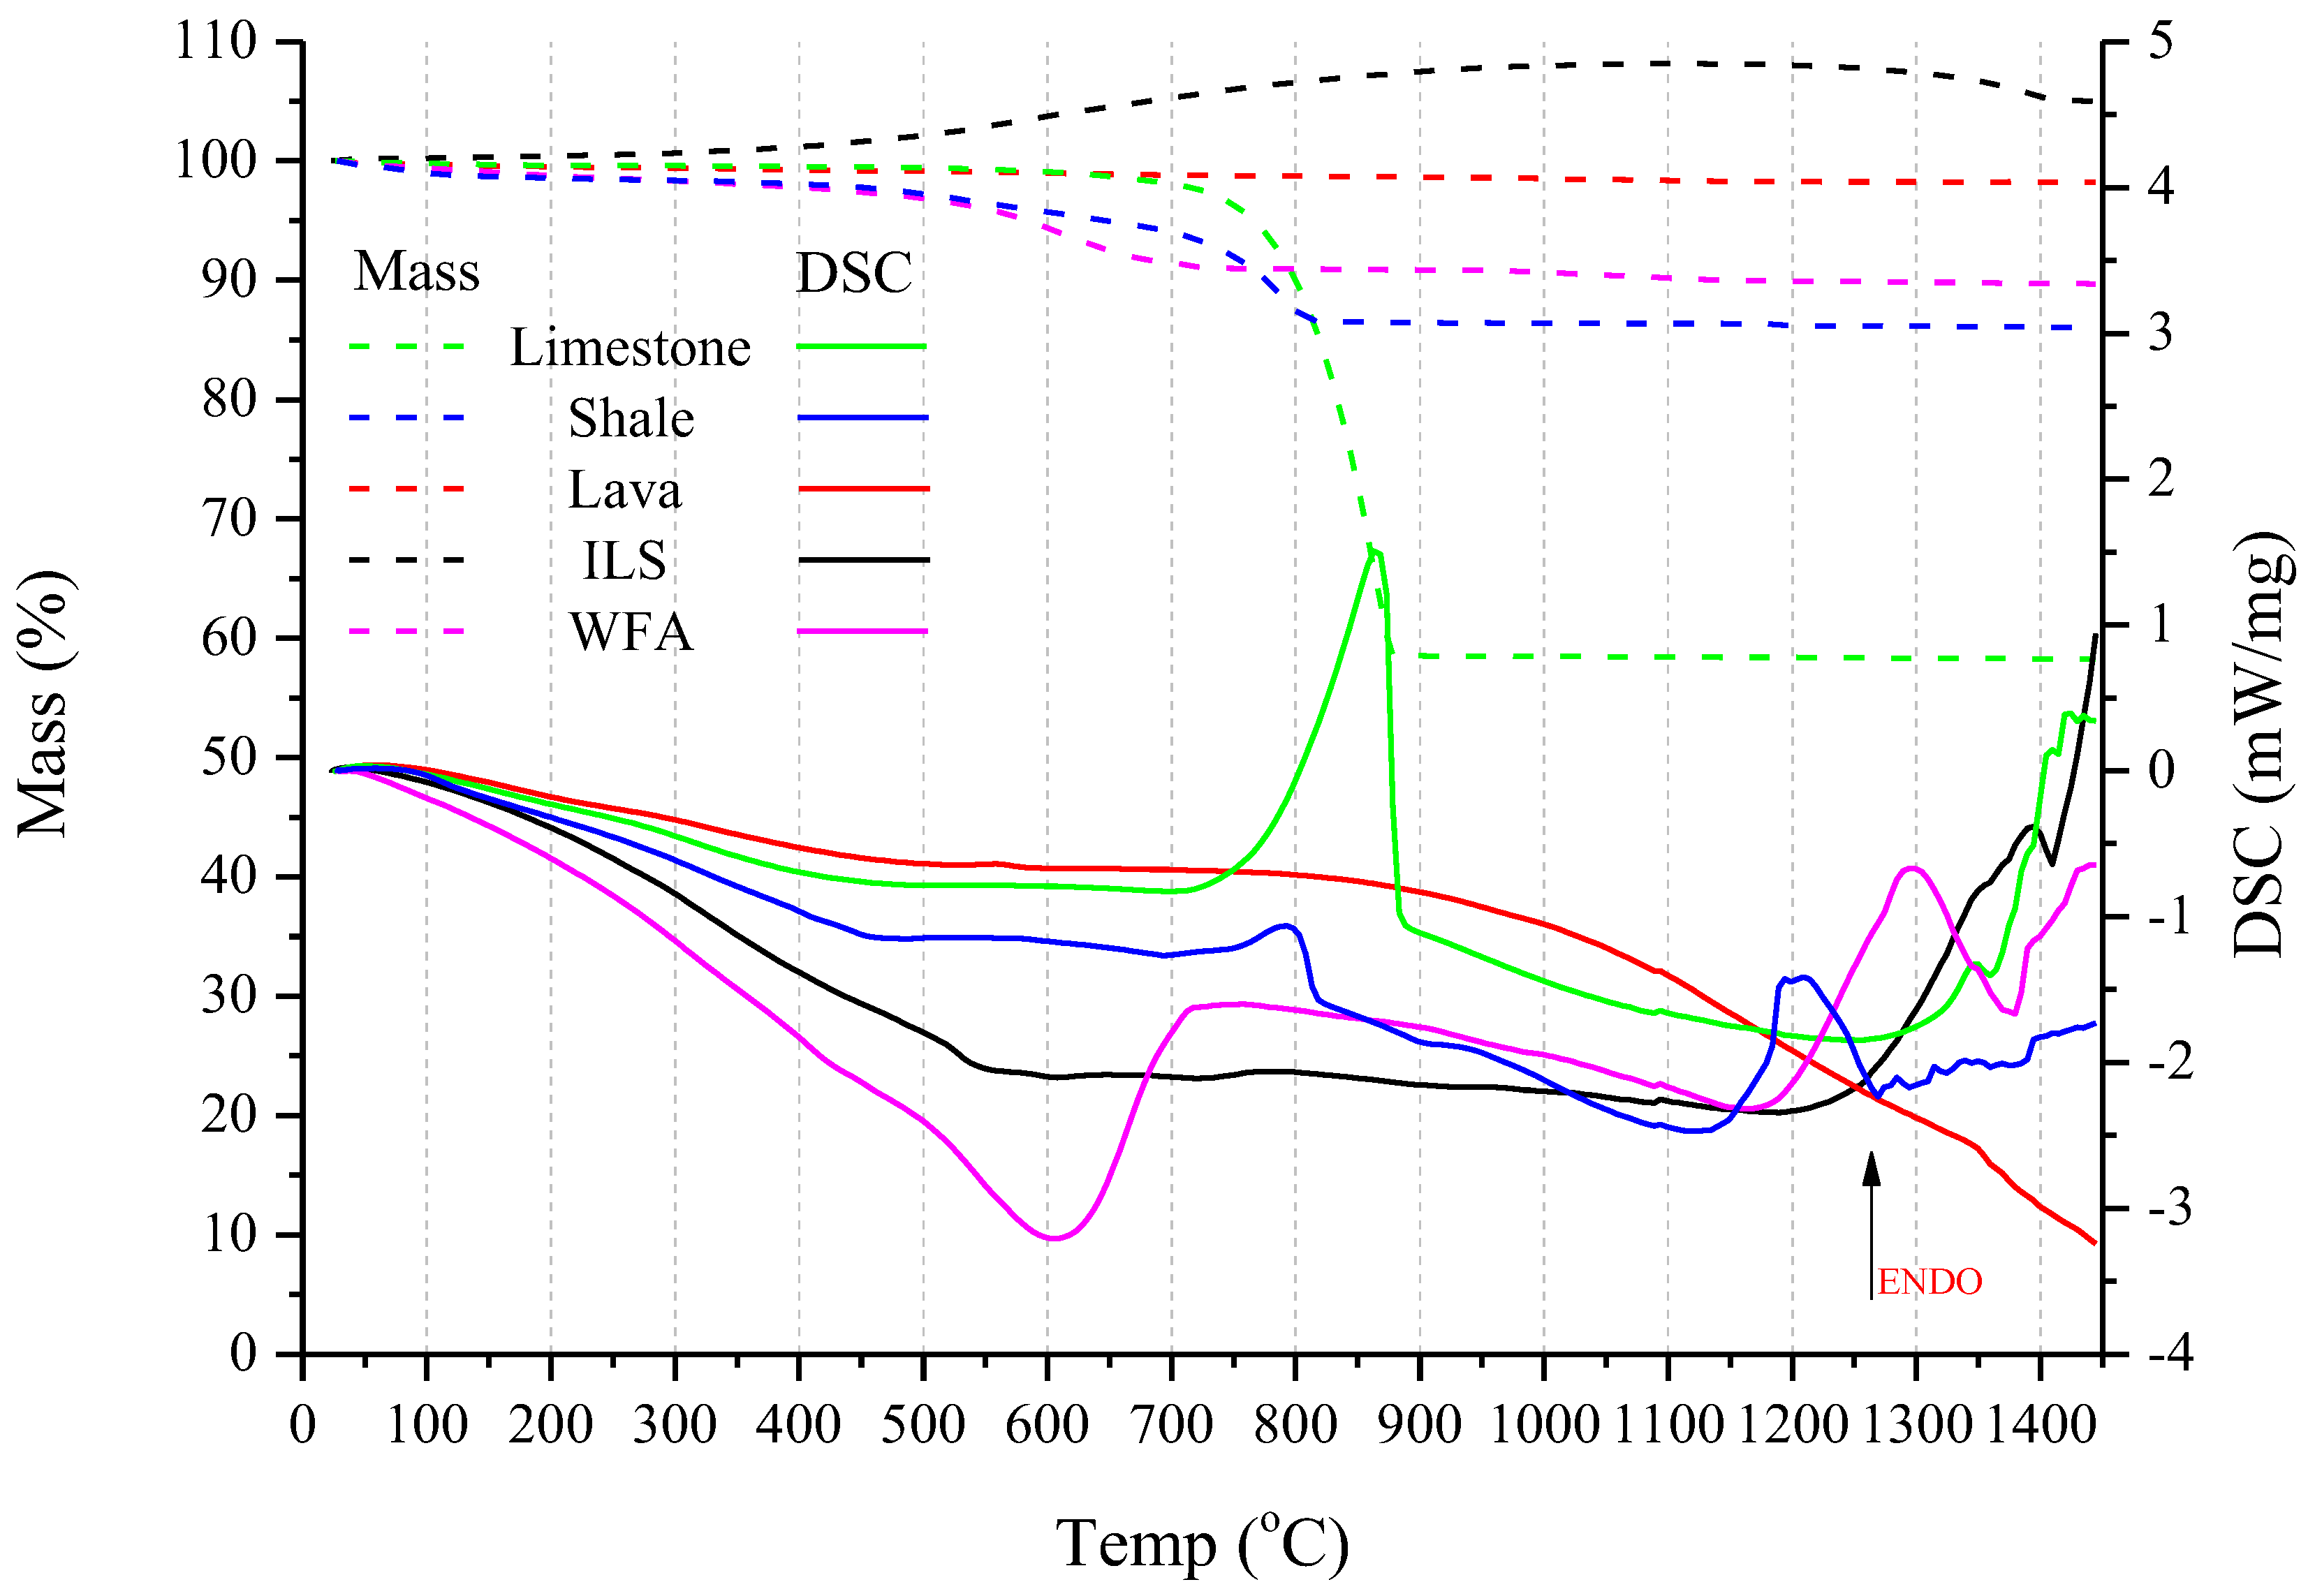
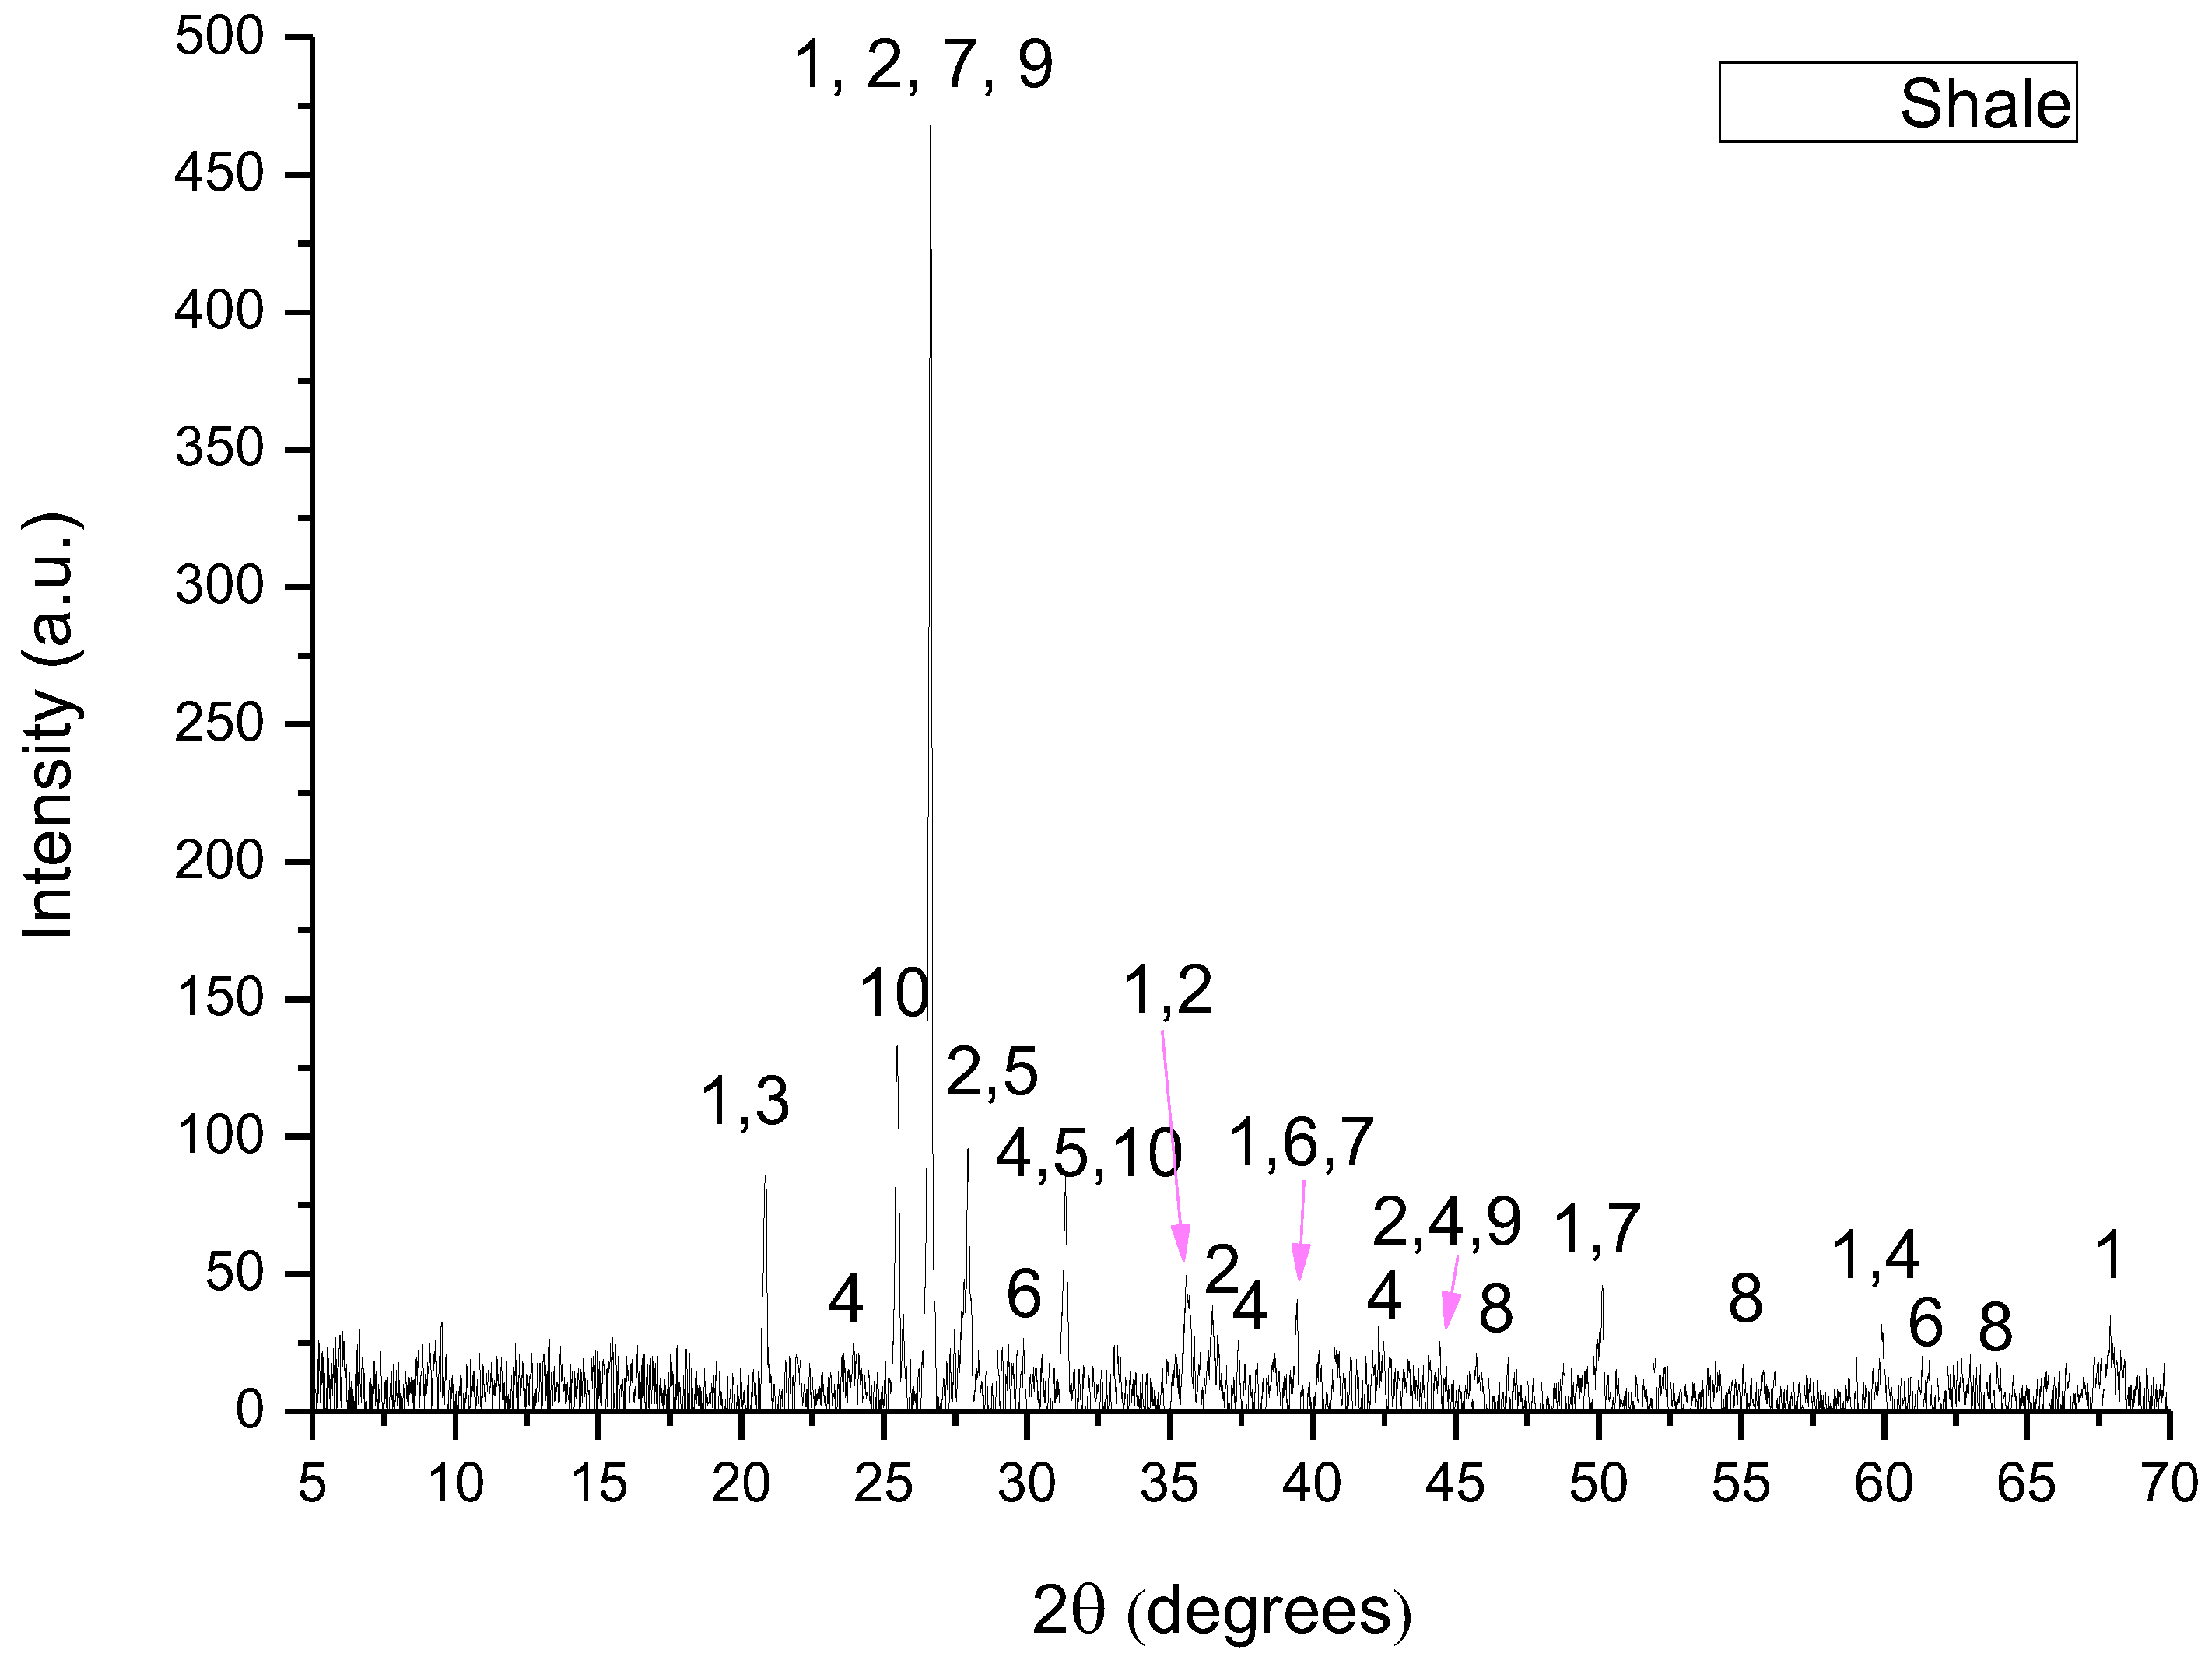
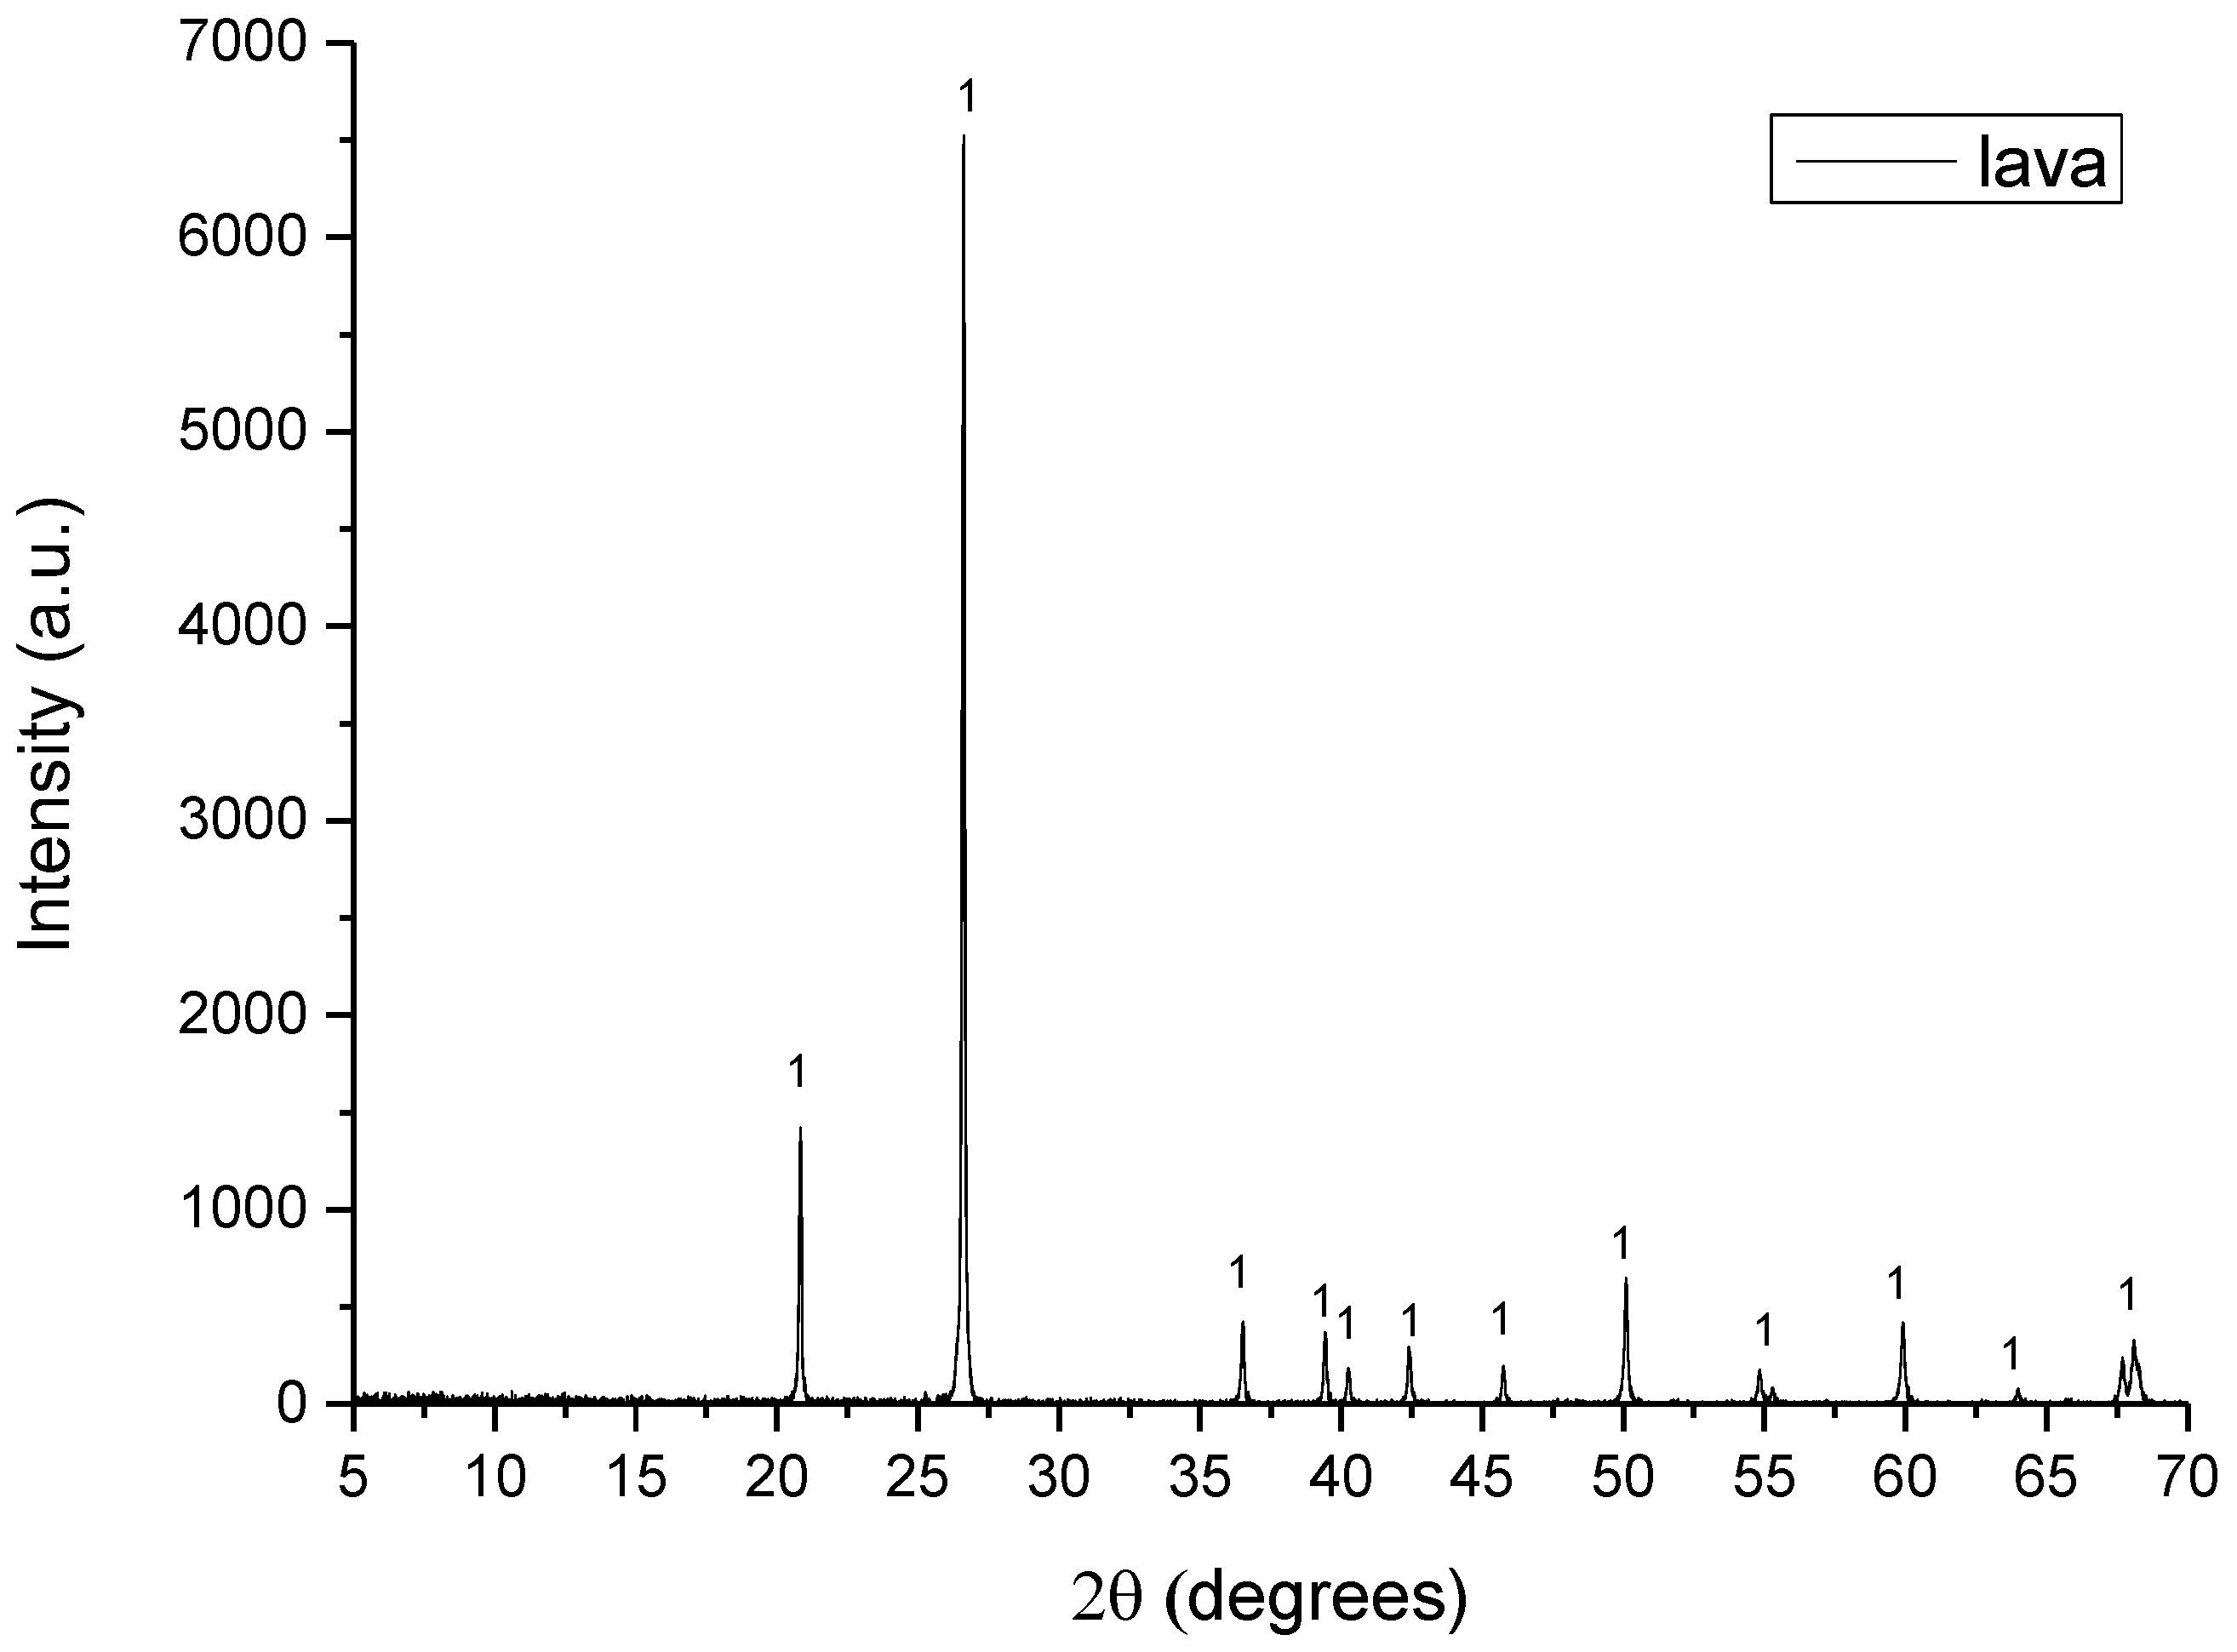
The raw materials used for the preparation of the raw meals were limestone, shale, lava, ILS and WFA. Limestone and shale are quarried raw materials which are typical in cement production due to their oxide content in CaO, SiO2, Al2O3 and Fe2O3. Lava is the solidified form of the magmatic material (Τ = 700–1200 °C). WFA is a byproduct rich in SiO2 and some Al2O3, while ILS is rich in Fe2O3 and some SiO2.
All raw materials were dried at 100 °C, for 24 h and ground in a planetary disc mill (Siebtechnik TS 100, Siemens, Mülheim an der Ruhr, Germany) to achieve particle size less than 90 μm. Their chemical composition was analyzed by XRF (ARL9800XP, Thermo Fisher, Waltham, MA, USA). The Loss On Ignition, LOI, was calculated by heating at 950 °C, according to EN 1744-1: 2009 [35].
The D8–Advance Bruker instrument, using Cu–Kα1 radiation at 40 kV and 40 mA, was used for XRD analysis. The diffractograms were recorded in the 5–70°, 2θ range, with a 0.01° step size and 1°/min scanning speed. The crystalline phases were identified using DIFFRACplus EVA® software Bruker–AXS based on the ICDD Powder Diffraction File.
Thermal analysis was performed by Simultaneous TGA/DSC, using a Netzsch (Selb, Deutschland) STA 449F3 with a 10 °C/min heating rate, up to 1450 °C, in a static air, using Al2O3 crucibles.
For this study, two different compositions of Portland clinkers were designed and prepared on a laboratory scale. The clinkers were designed as P65A with 65% wt. and P71A with 71% wt. alite, respectively, and the demand on raw materials were calculated for each experiment by means of an MS Excel, based on XRF-LOI analysis and Bogue equations [3], assuming thermodynamic equilibrium. Then, the ground and sieved <90 μm raw materials were mixed in the calculated ratios. The meals were homogenized and pellets of 12–15 mm diameter were formed by hand with a minimum addition of deionized water. The pellets were dried at 100 °C for over 20 h, then placed in a tailor-made magnesia–chrome refractory crucible (P201) and covered by a lid of the same material. Each of the two compositions was fired in a Super Kanthal resistance furnace of Nabertherm (Lilienthal, Germany) Mod: HT08/17. In order to find the optimum firing temperature and heating profile of the clinkers (P65A and P71A), preliminary firing tests were performed at different temperatures and heating profiles. The optimum heating profile, for each temperature (
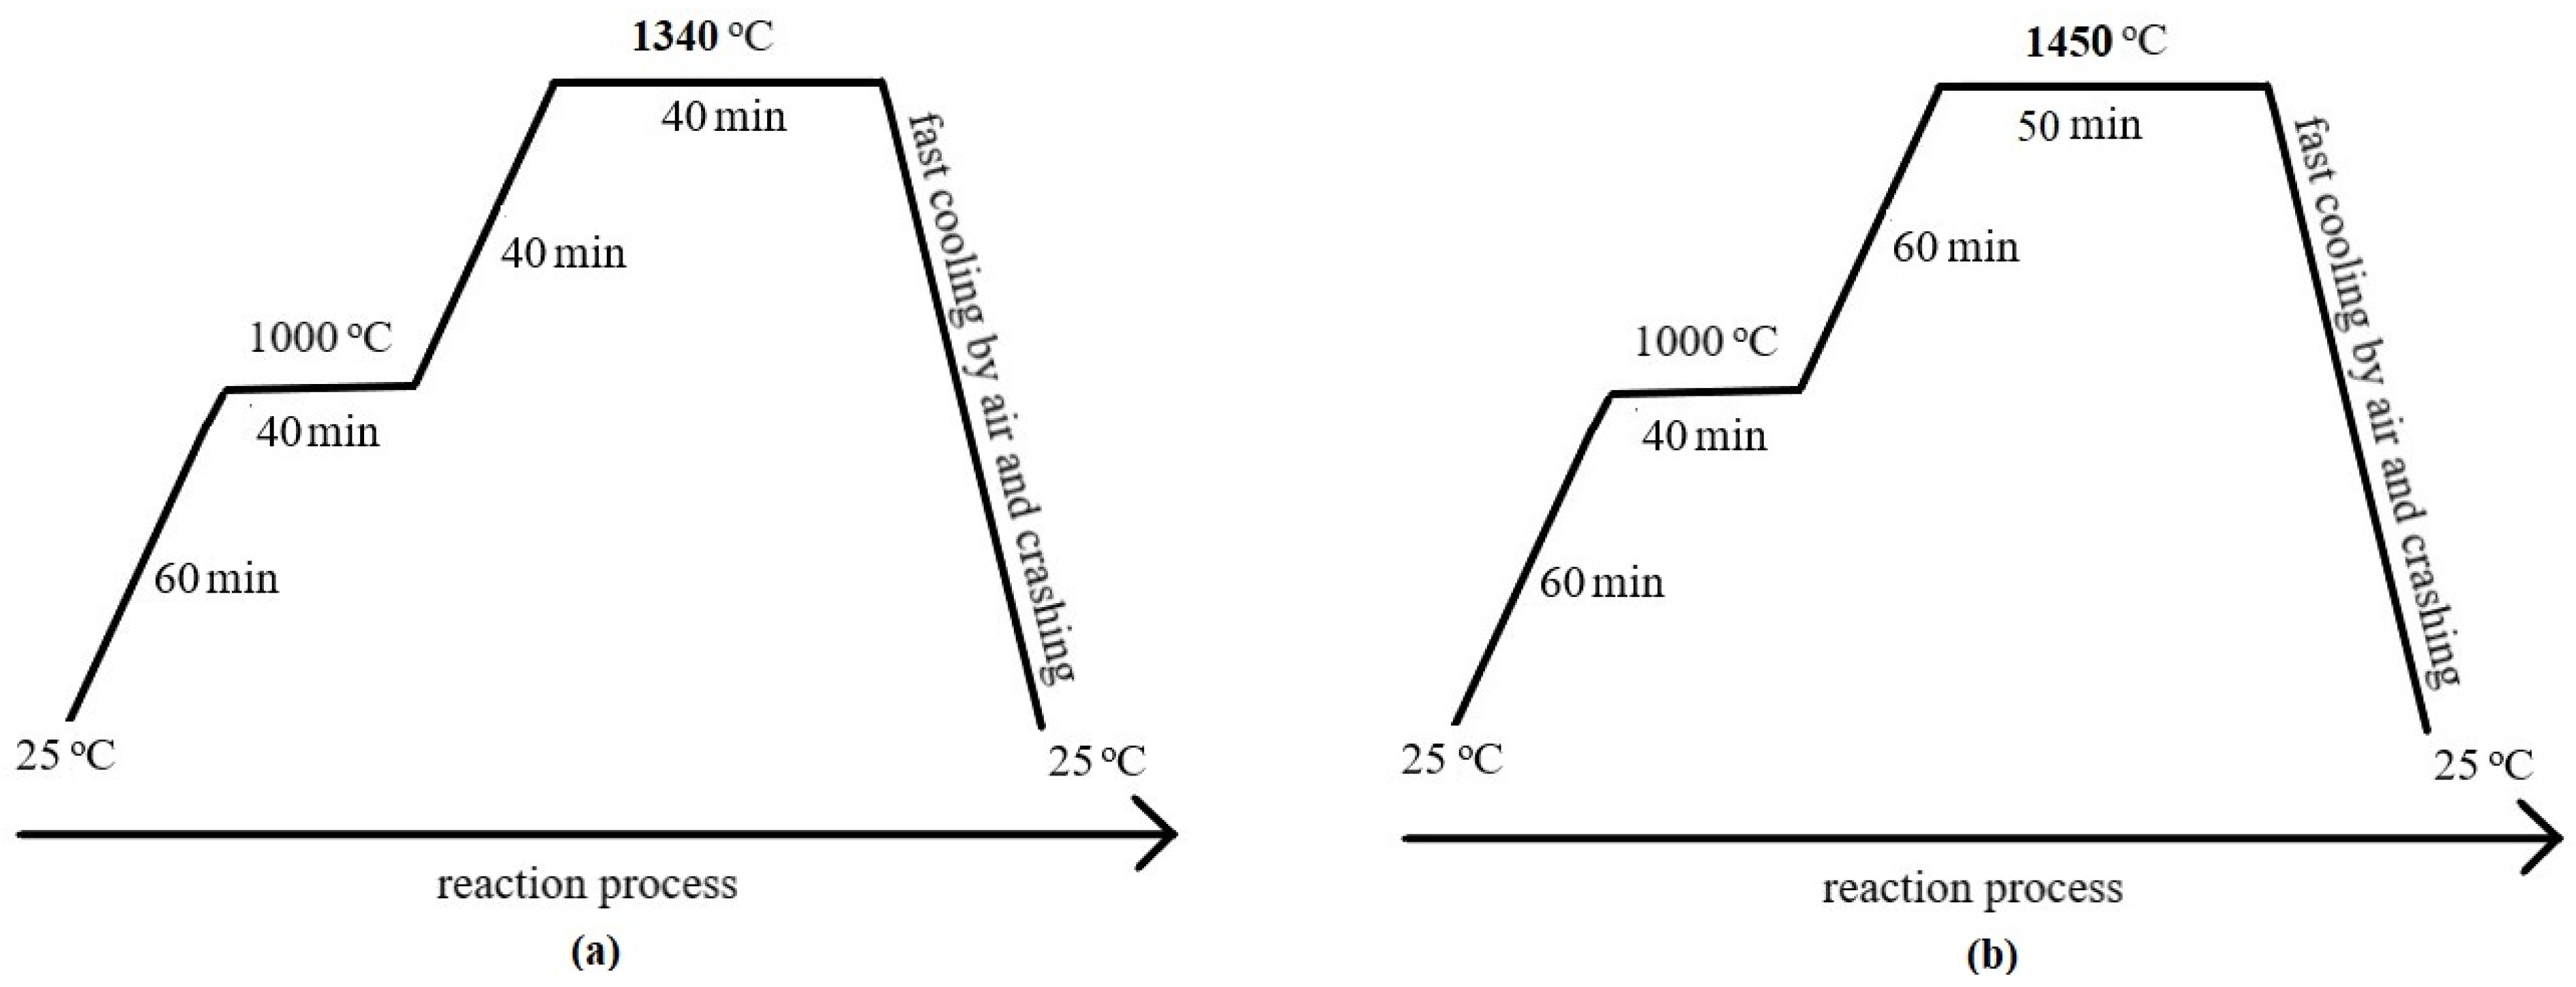
Figure 1), was determined based on the best clinkerization process which was indicated by the lowest value of free calcium oxide [36,37] and the developed microstructure. The evaluation of these findings led to the conclusion that the major phases of clinker can be formed at temperatures lower than the normal of OPC. The heating profile (Figure 1) followed a heating rate of 16.25 °C/min up to 1000 °C and soaking time for 40 min. However, to reach the 1450 °C and 1340 °C, lower rates were applied to 7.5 °C/min and 8.5 °C/min, respectively. Moreover, soaking time at 1450 °C was 50 min while at 1340 °C was 40 min. To stabilize the αH– and β–belite polymorphic forms, the clinkers were cooled rapidly by simultaneous application of air and crushing by a hammer [22,28,37,38,39].
The obtained clinkers were studied in two forms: as half pieces of the fired pellets for microscopy observations and as powders for all the other tests. Additionally, a commercial clinker, CEM I 42.5N, with the same raw materials, was studied for comparison reasons. The produced clinkers were ground, according to EN 196-6 [40], for 150 s per 125 g with the planetary disc mill. Tests were, also, performed for the determination of unreacted free lime content, f(CaO), using the ethylene glycol method [36] and an indicator mixture [37]. For the determination of the specific weight, the test method described in ASTM C188-95 [41] was carried out.
The produced powdered clinkers were analyzed by XRF (ARL9800XP, Thermo Fisher, Waltham, MA, USA) and their mineralogical phases of them were determined by Bruker D8-Advance XRD. Diffraction patterns were measured in the 2θ range of 10–70°, using Cu Ka1 radiation of 40 kV and 30 mA, with a 0.01° step size and a scan speed of 1 deg/min. XRD and quantitative Rietveld analysis were performed using TOPAS 5 software. For the accuracy of the results, adjustments have been performed concerning instrument geometry, background, sample displacement, detector type and mass absorption coefficients of the refined phases.
Finally, cement mortar specimens were formed with dimensions of 40 mm × 40 mm × 160 mm, in accordance with the EN 196-1 [42]. The materials used for their preparation comprised of ground clinkers, 5% wt. gypsum and CEN Standard sand. The water to cement ratio in the concrete mix was 0.5. The curing of the test samples occurred in the molds which were stored in a moist air cabinet at 20 ± 1 °C and 90% humidity for 24 h and after demolding, they were kept apart from each other and submerged in water at 20 ± 1 °C until their test age. Compressive strength tests of the concrete specimens were carried out at 2, 7 and 28 days using a TONICOMP III press (Toni Technik, Berlin, Germany) with a loading rate of 2400 ± 200 N/s.
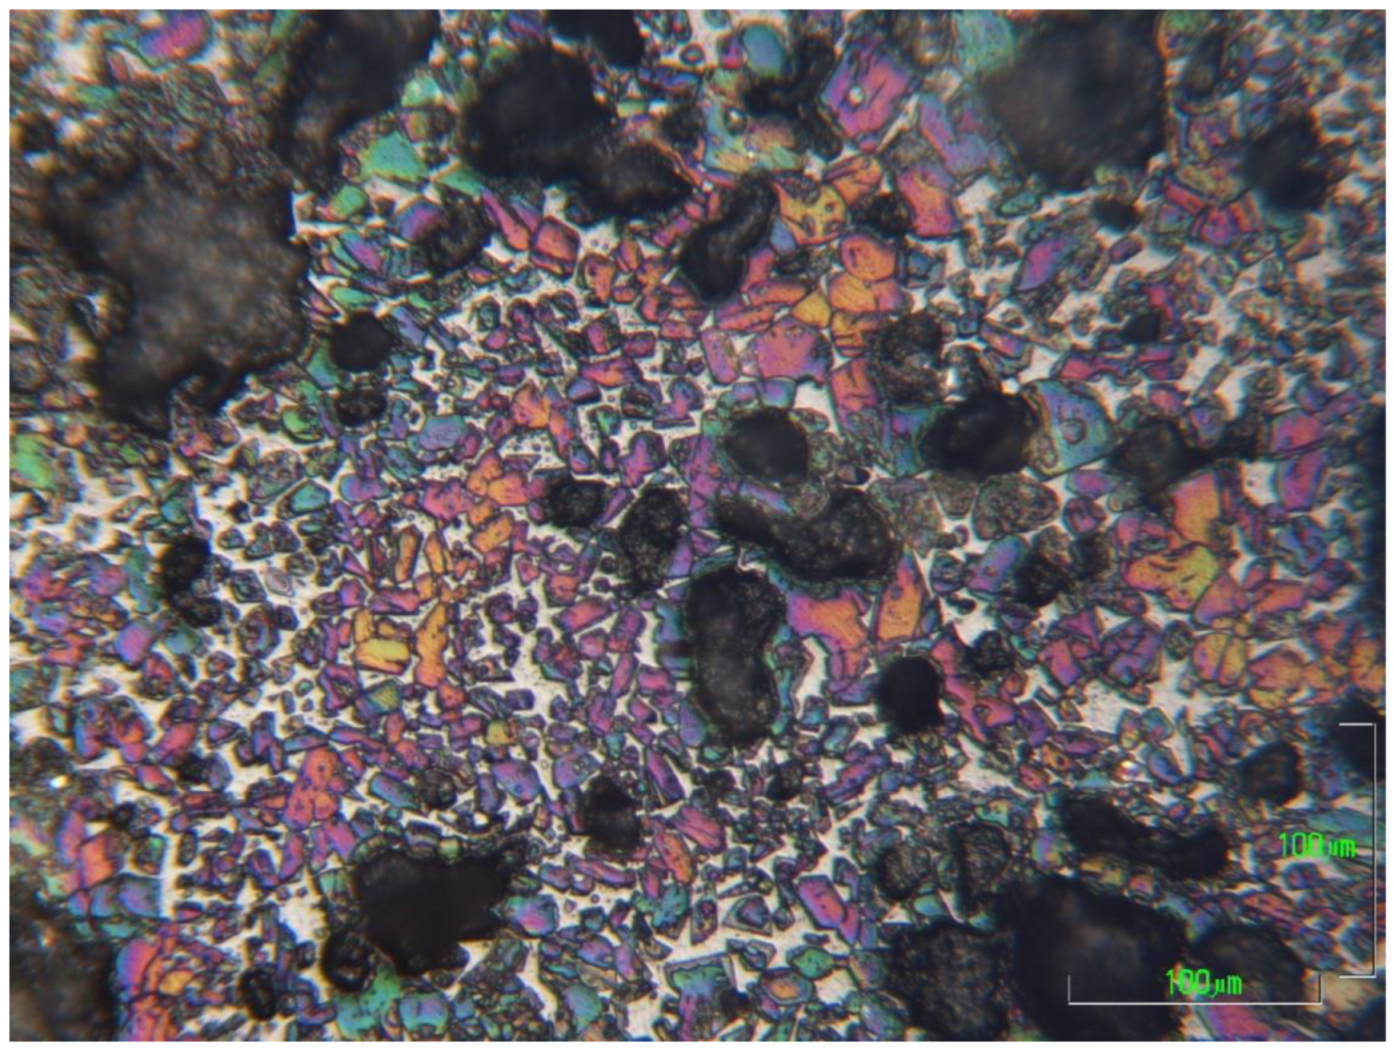
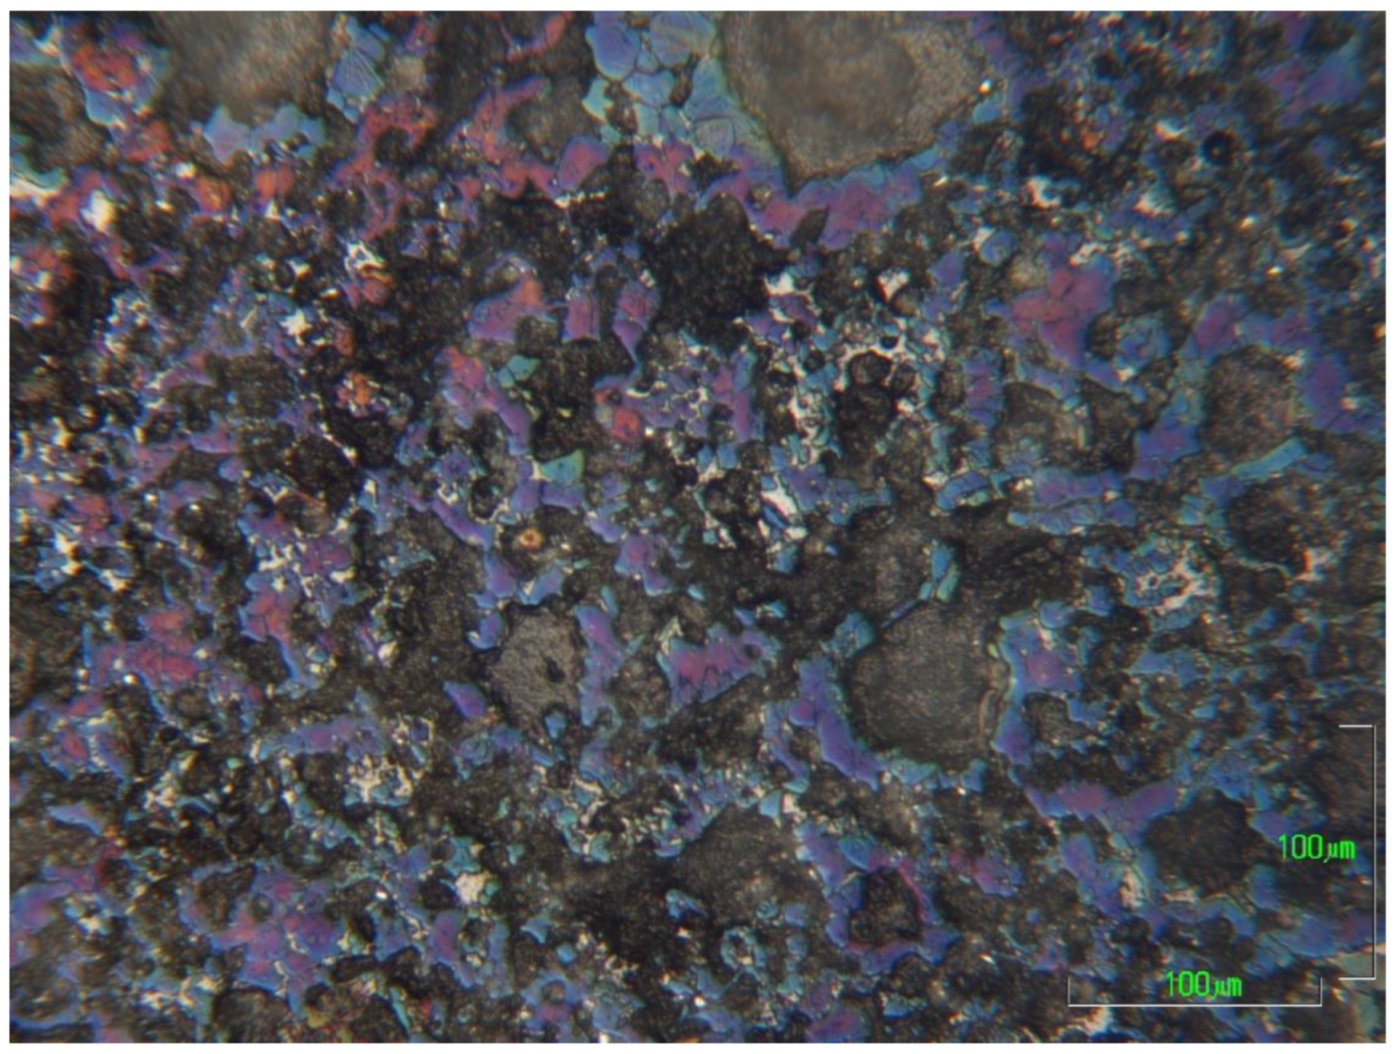
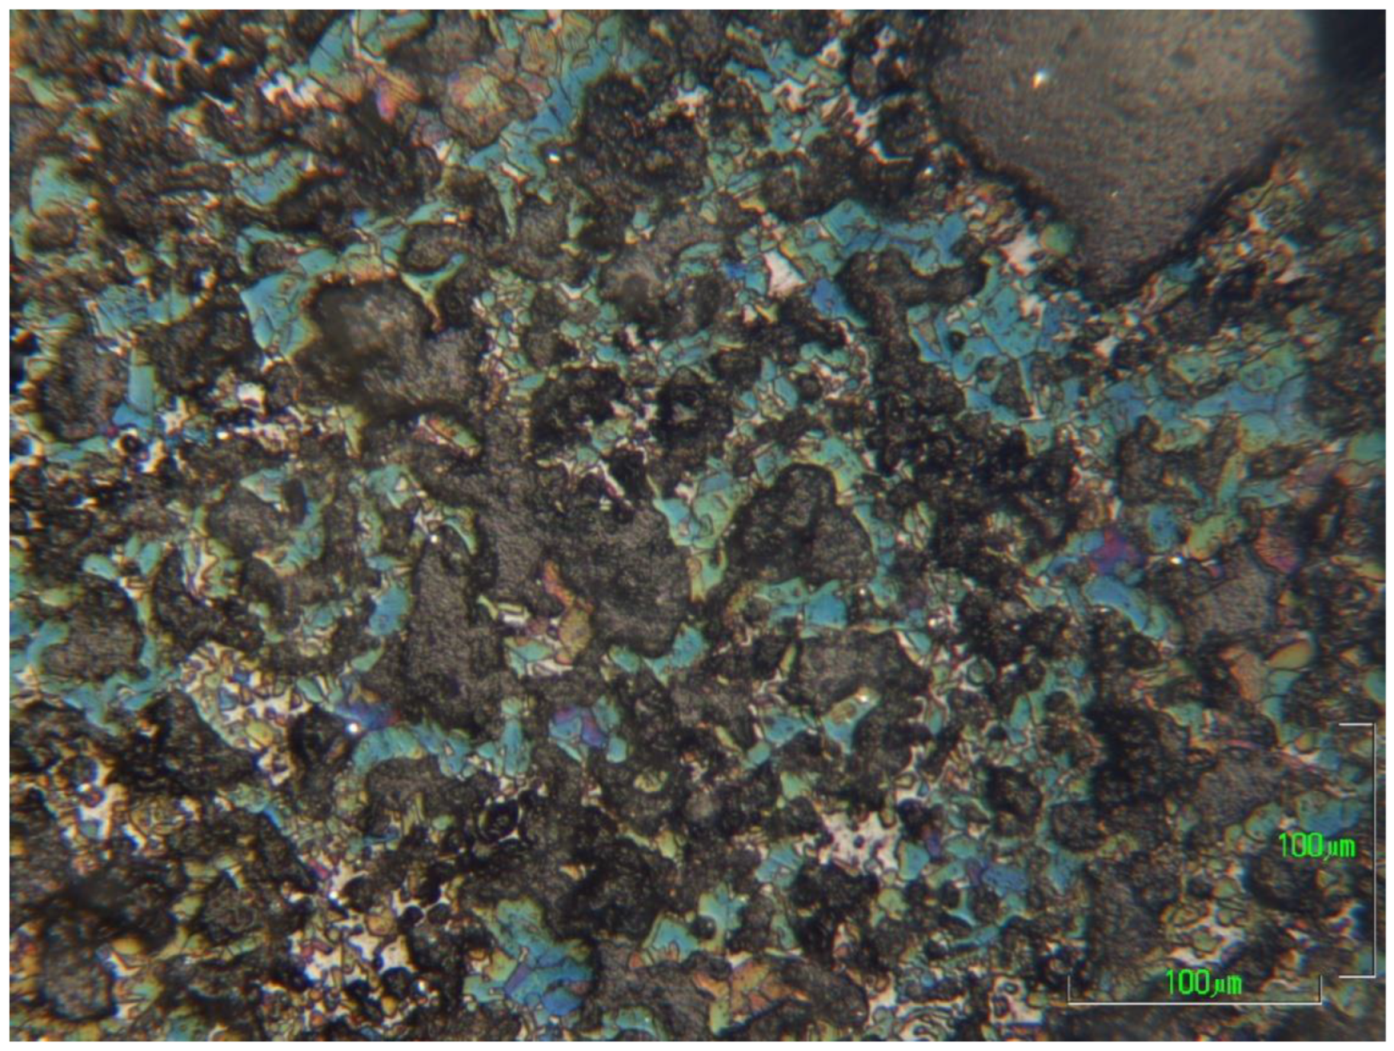
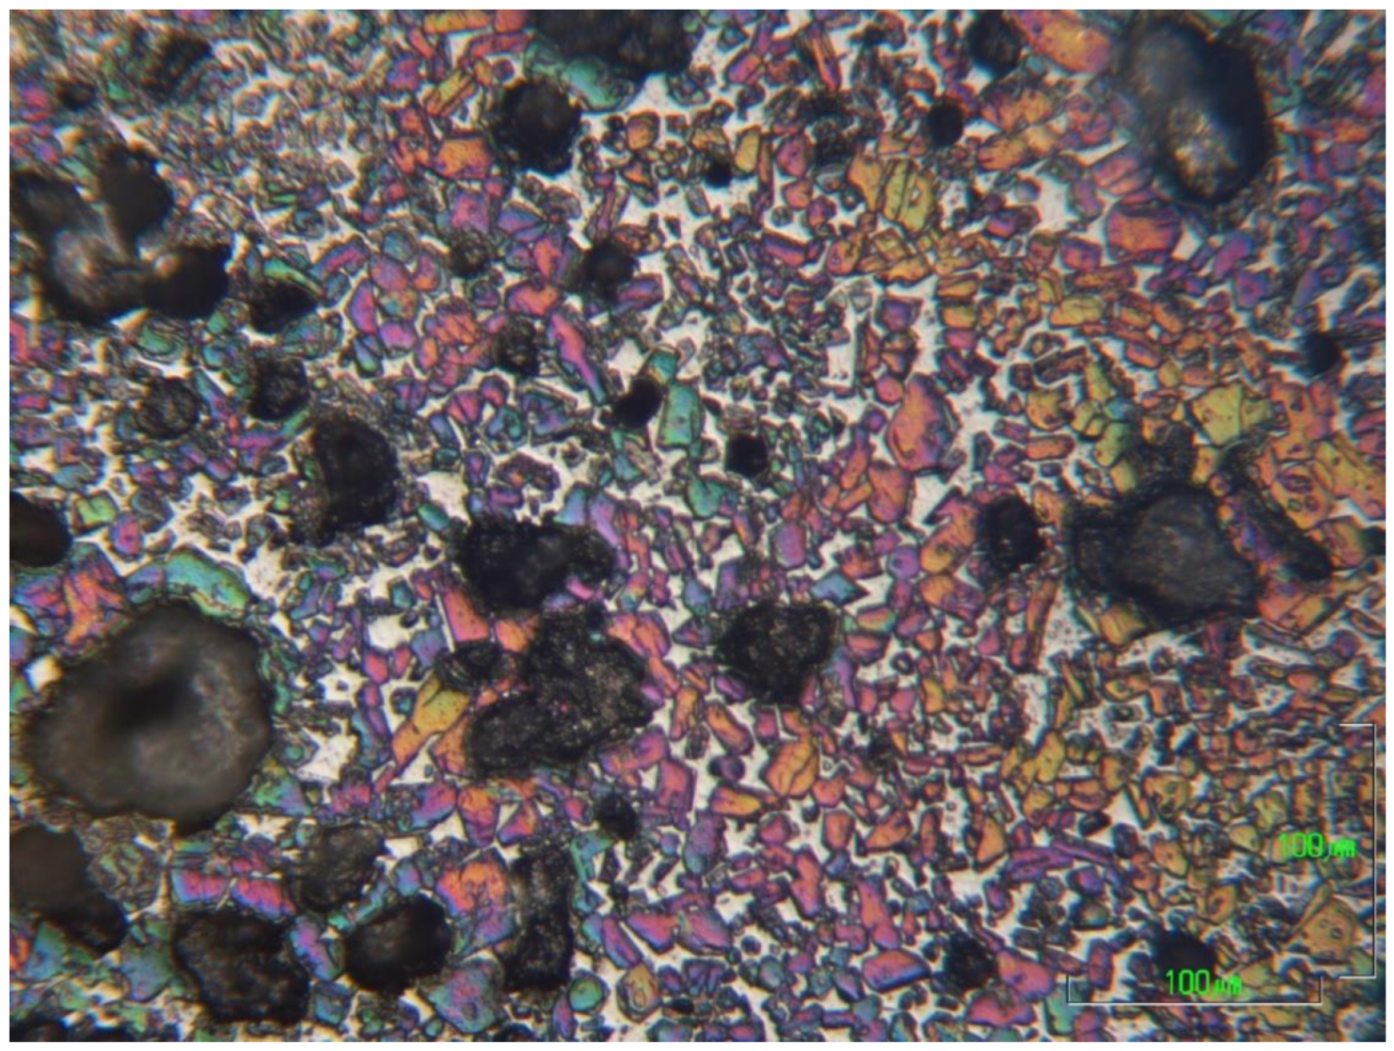
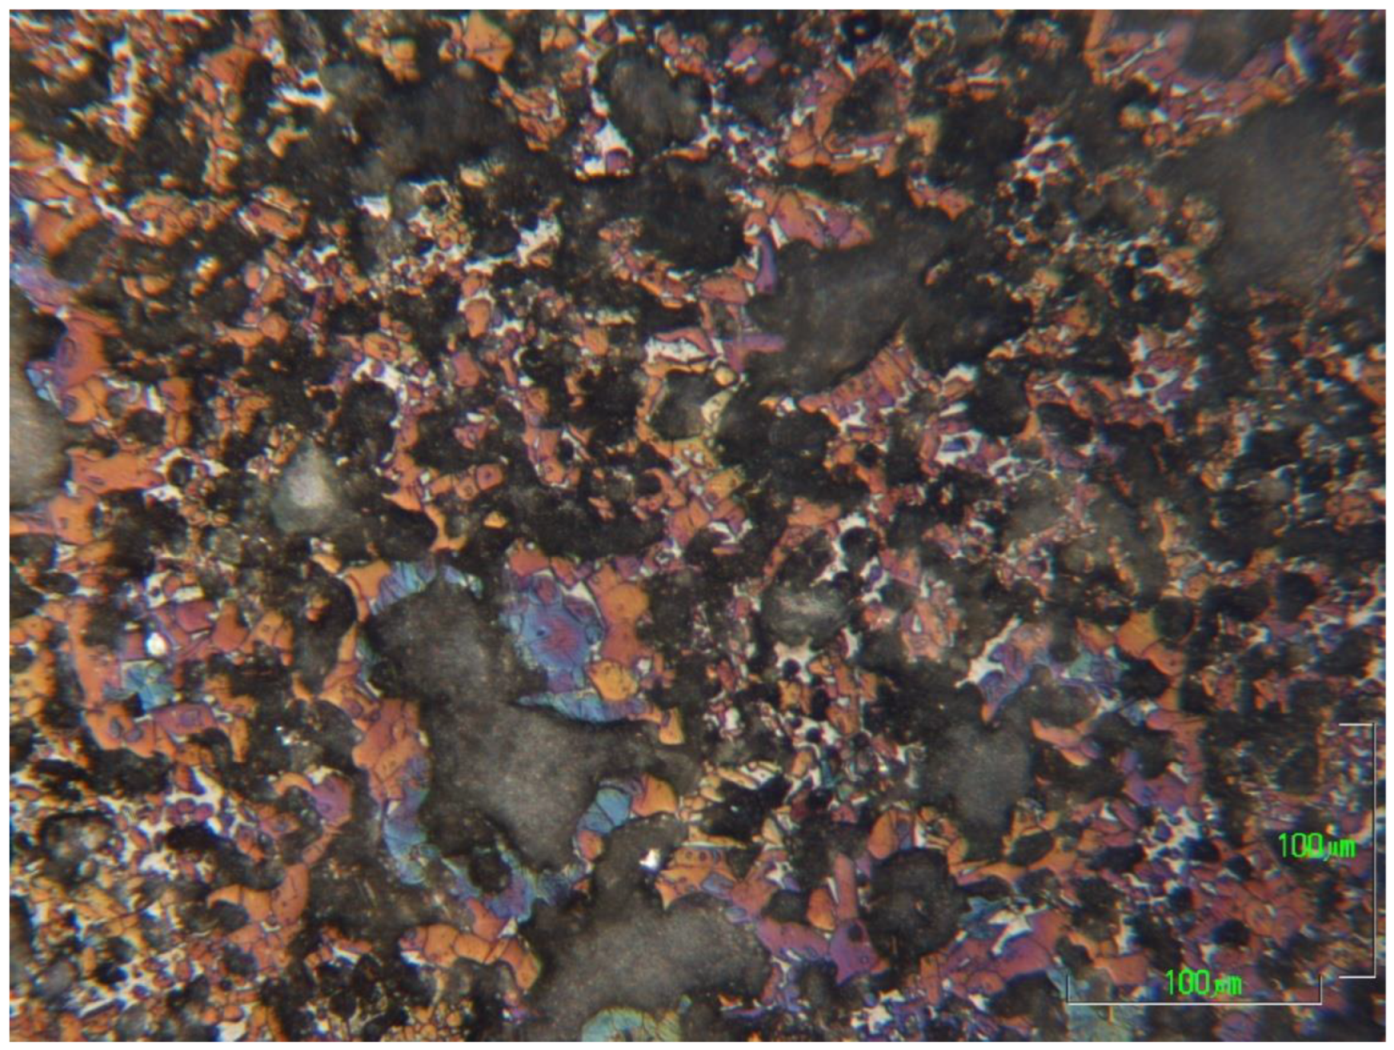
For the optical microscopy, half pieces of the clinkers were mounted in nonconductive resin, by PRONTOPRESS-2 (Struers, CLE, USA). The sample processing included gradual grinding on a rotating wheel (Buehler Metaserv, Motopol 12, Coventry, UK) using SiC abrasive papers from P500 to P4000 and ethylene alcohol (>97%) as a lubricant. Finally, the sample surfaces were etched with 1% Nital [43,44] for 5–7 s, depending on the sample, dried by air and immediately observed by optical microscopy (Metalloplan Leitz with attached DS camera head DS–5M Nikon and Camera control unit DS–L1).
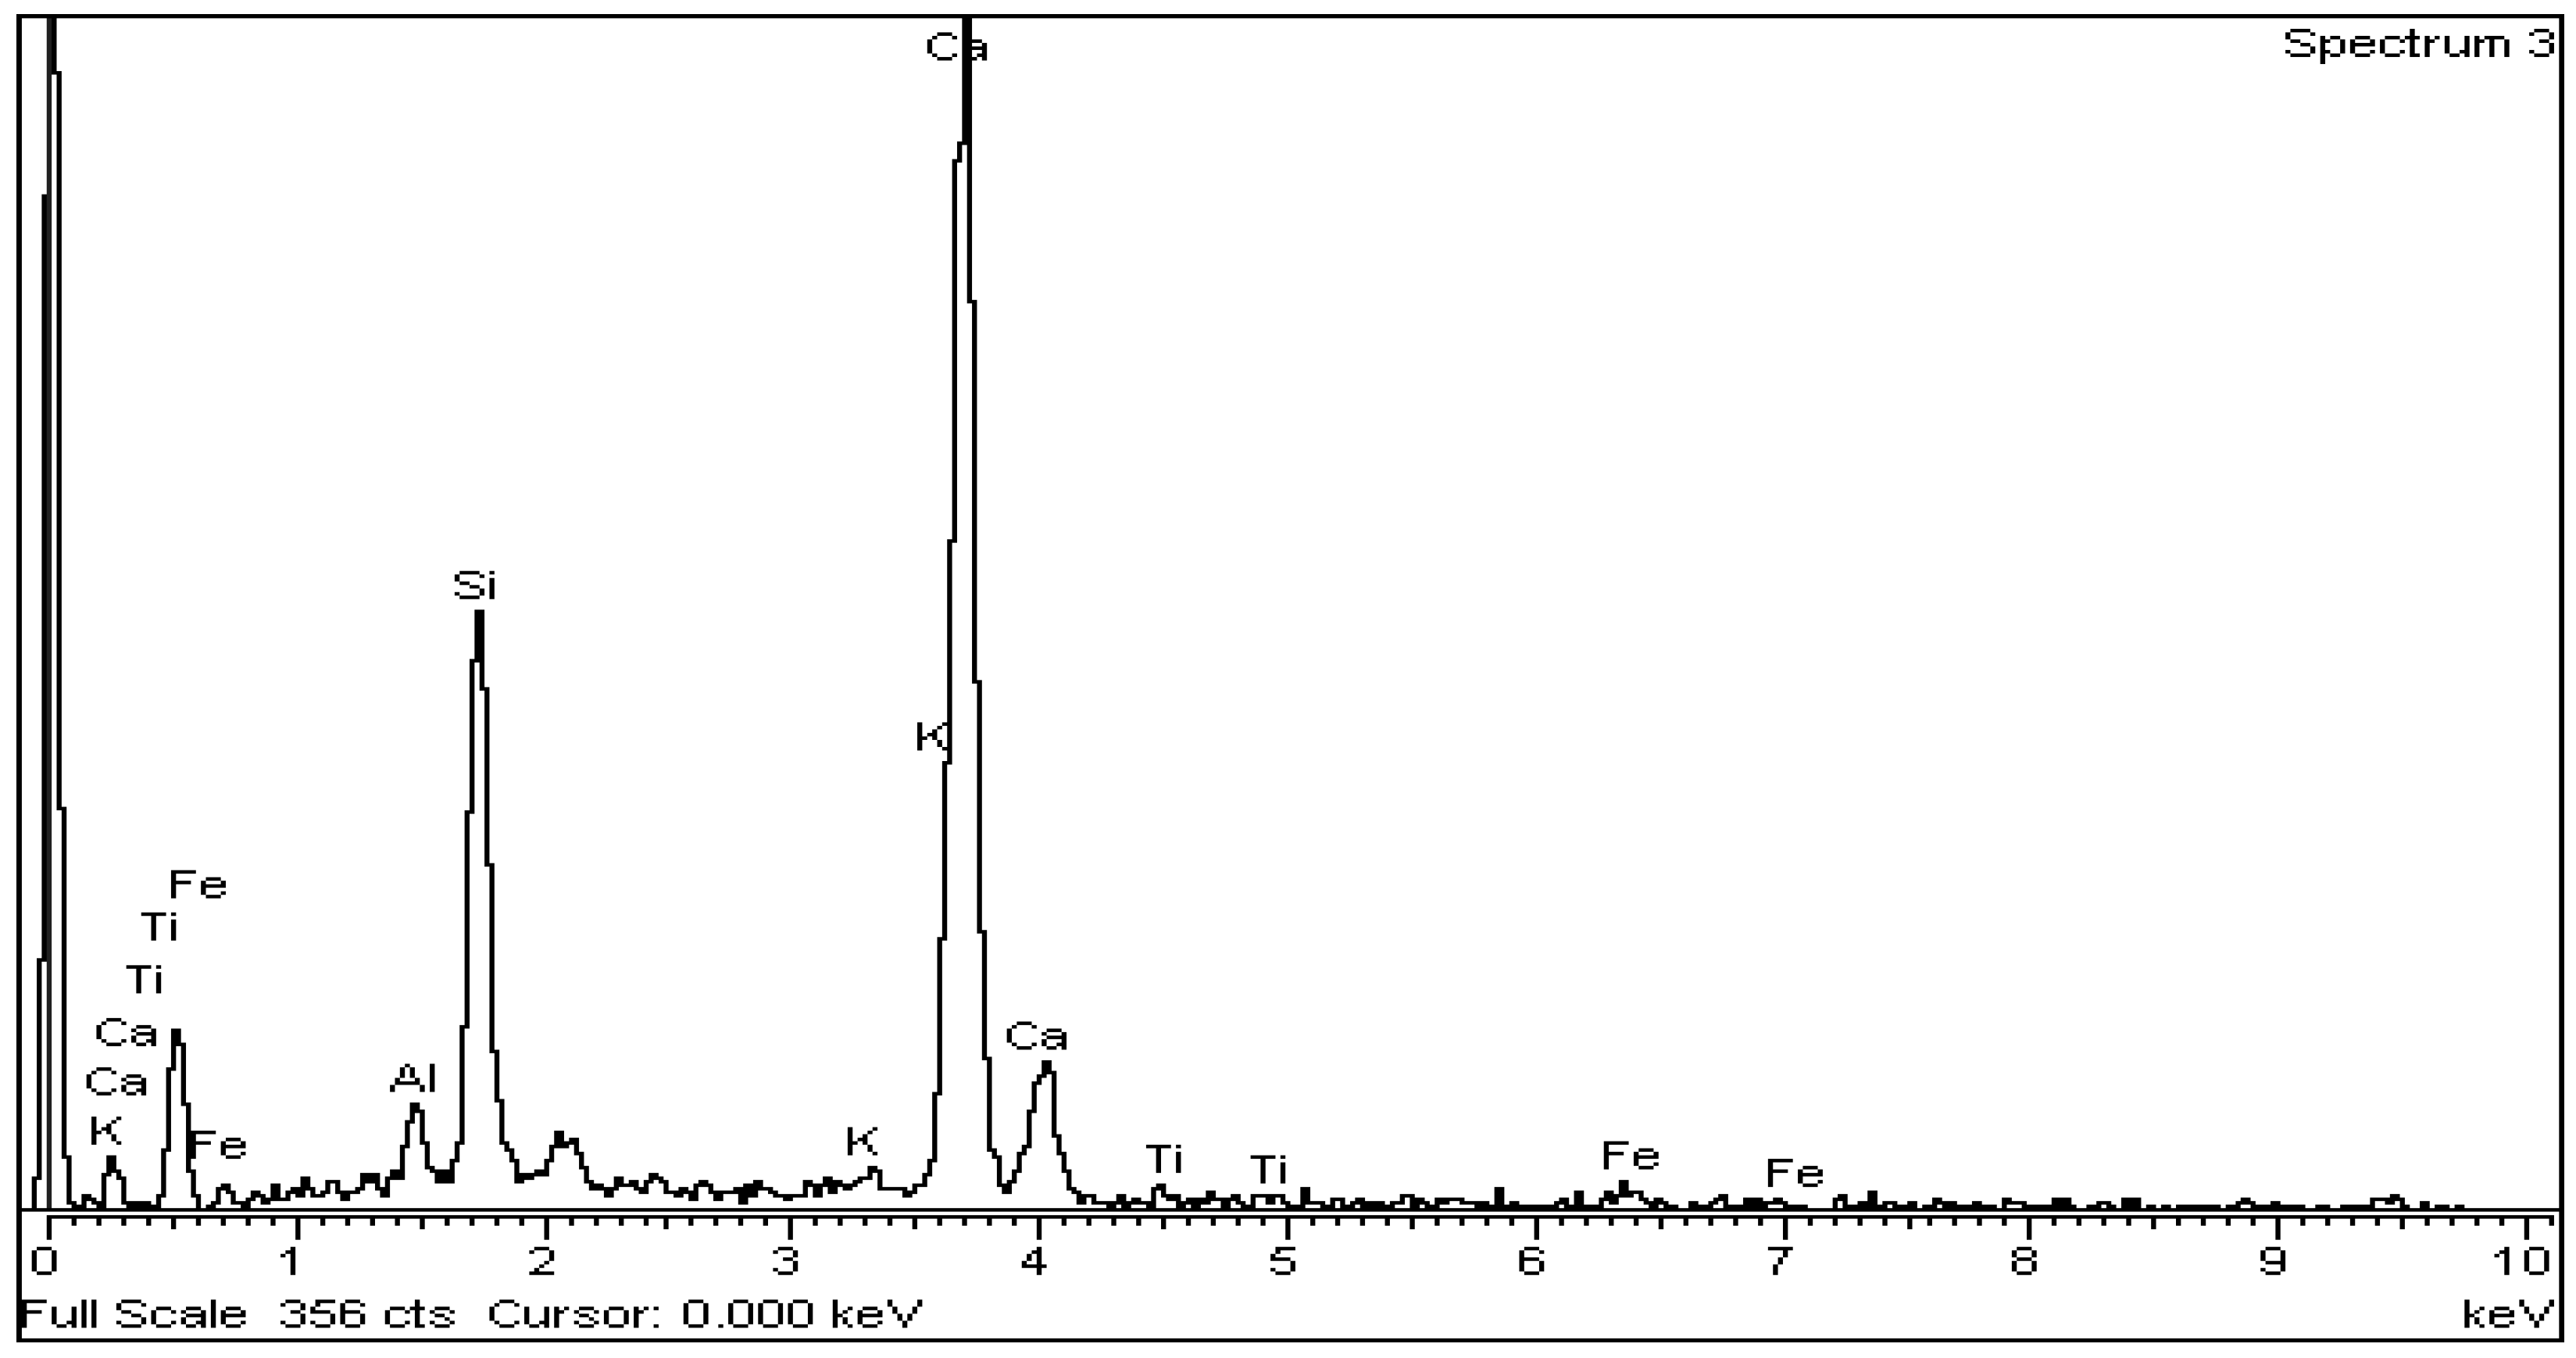
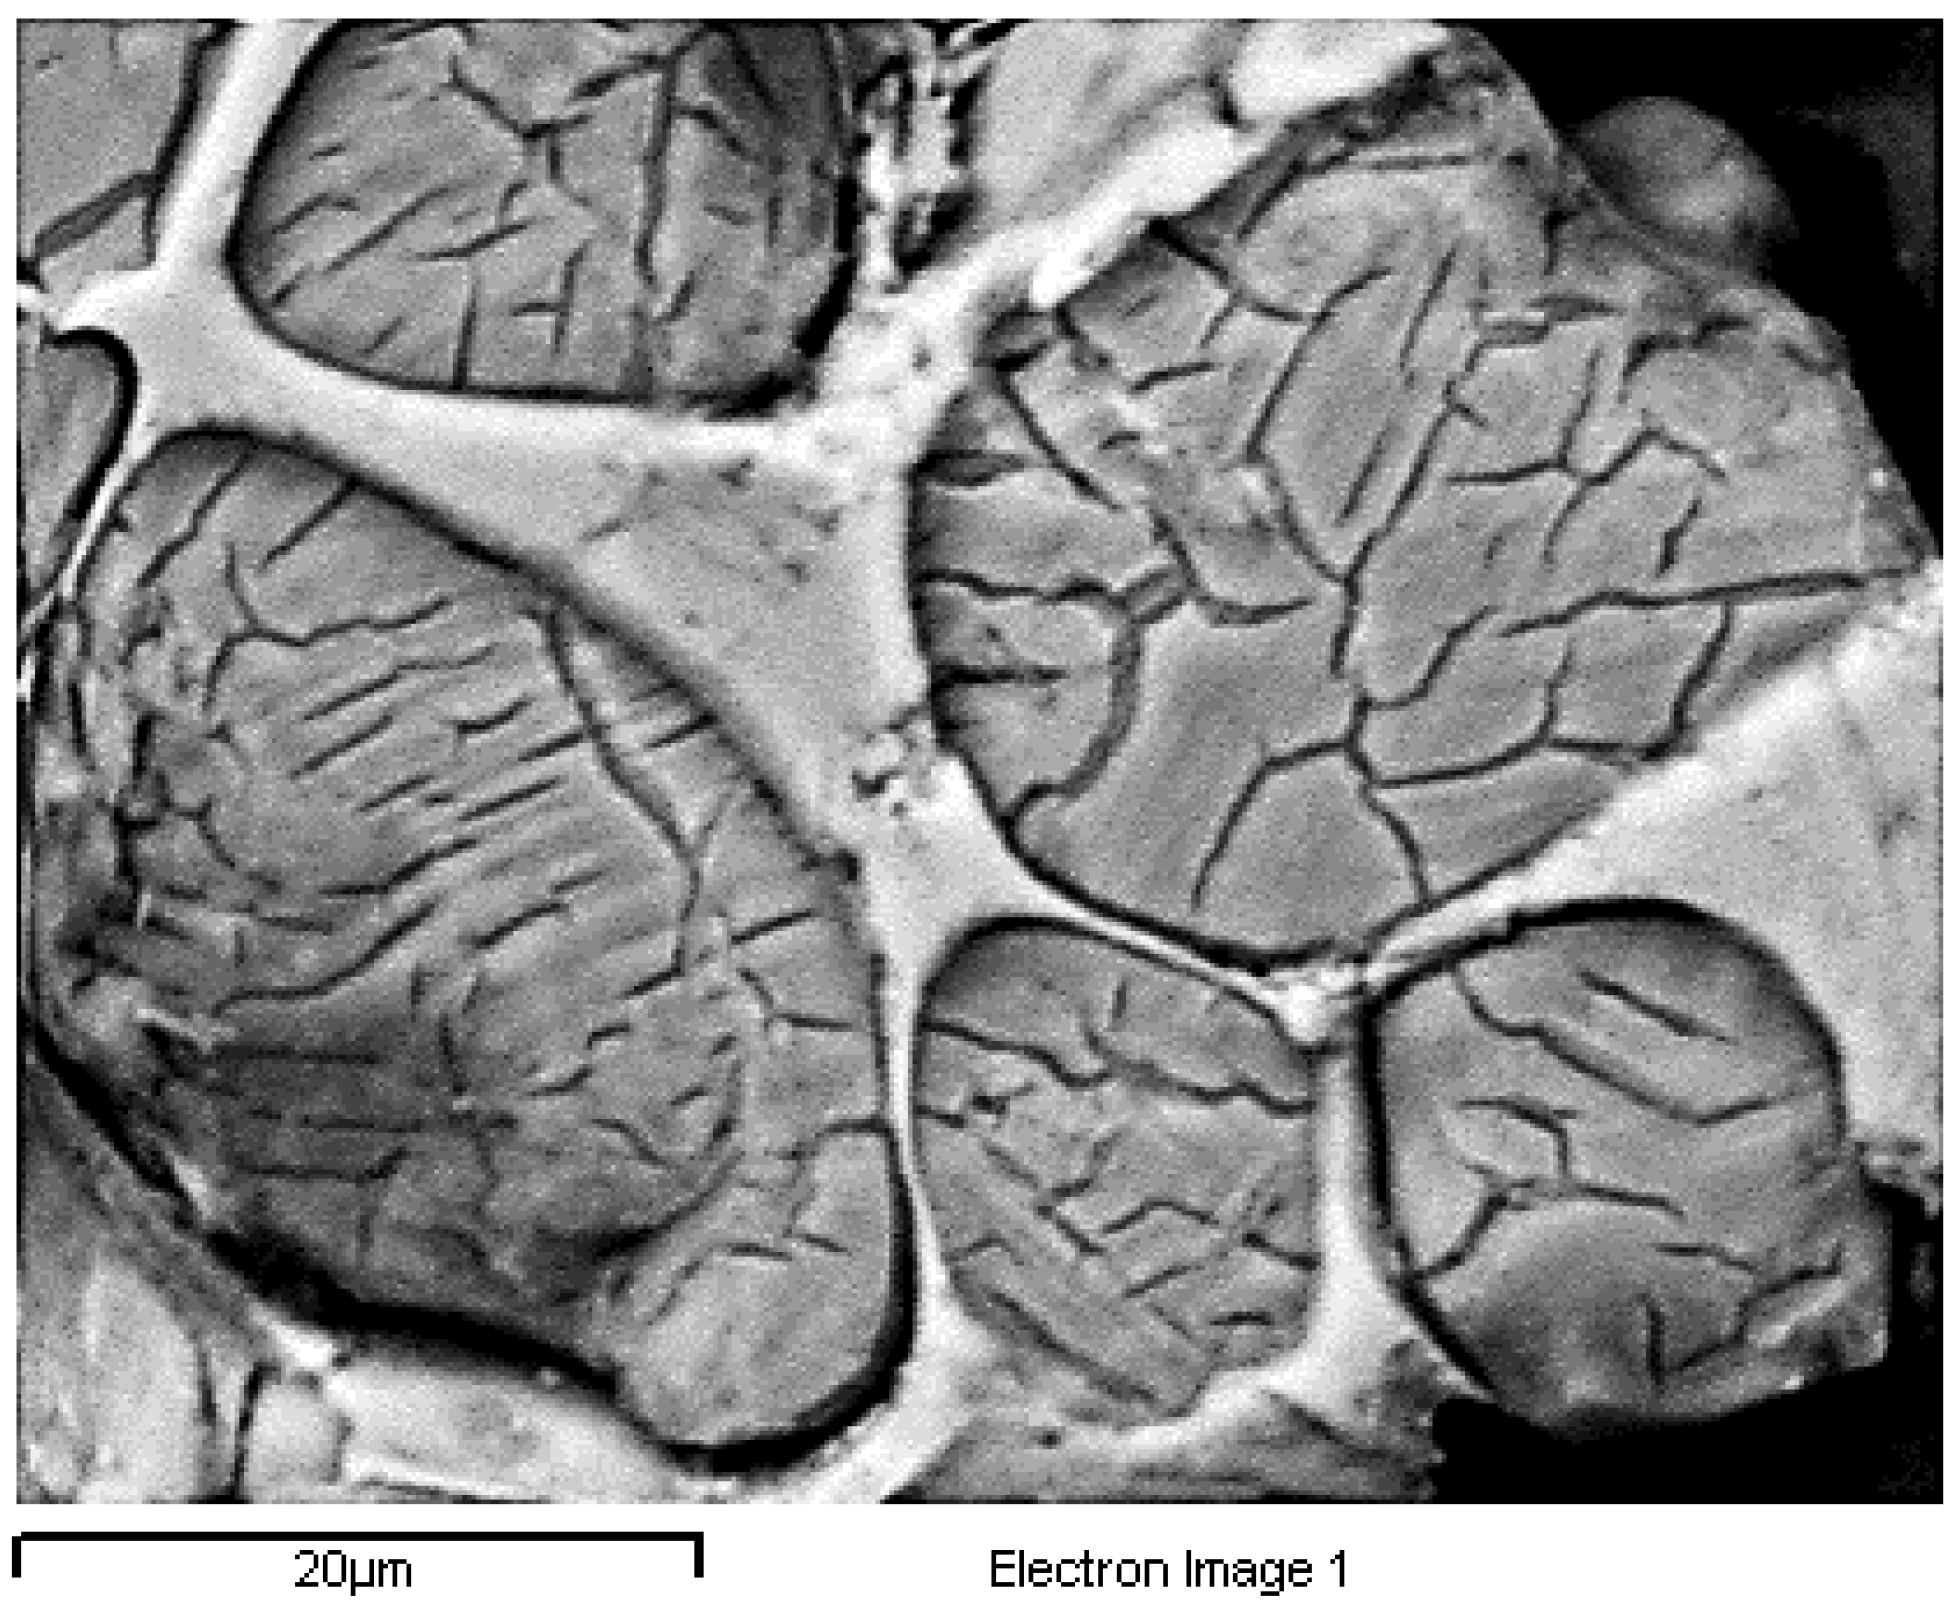
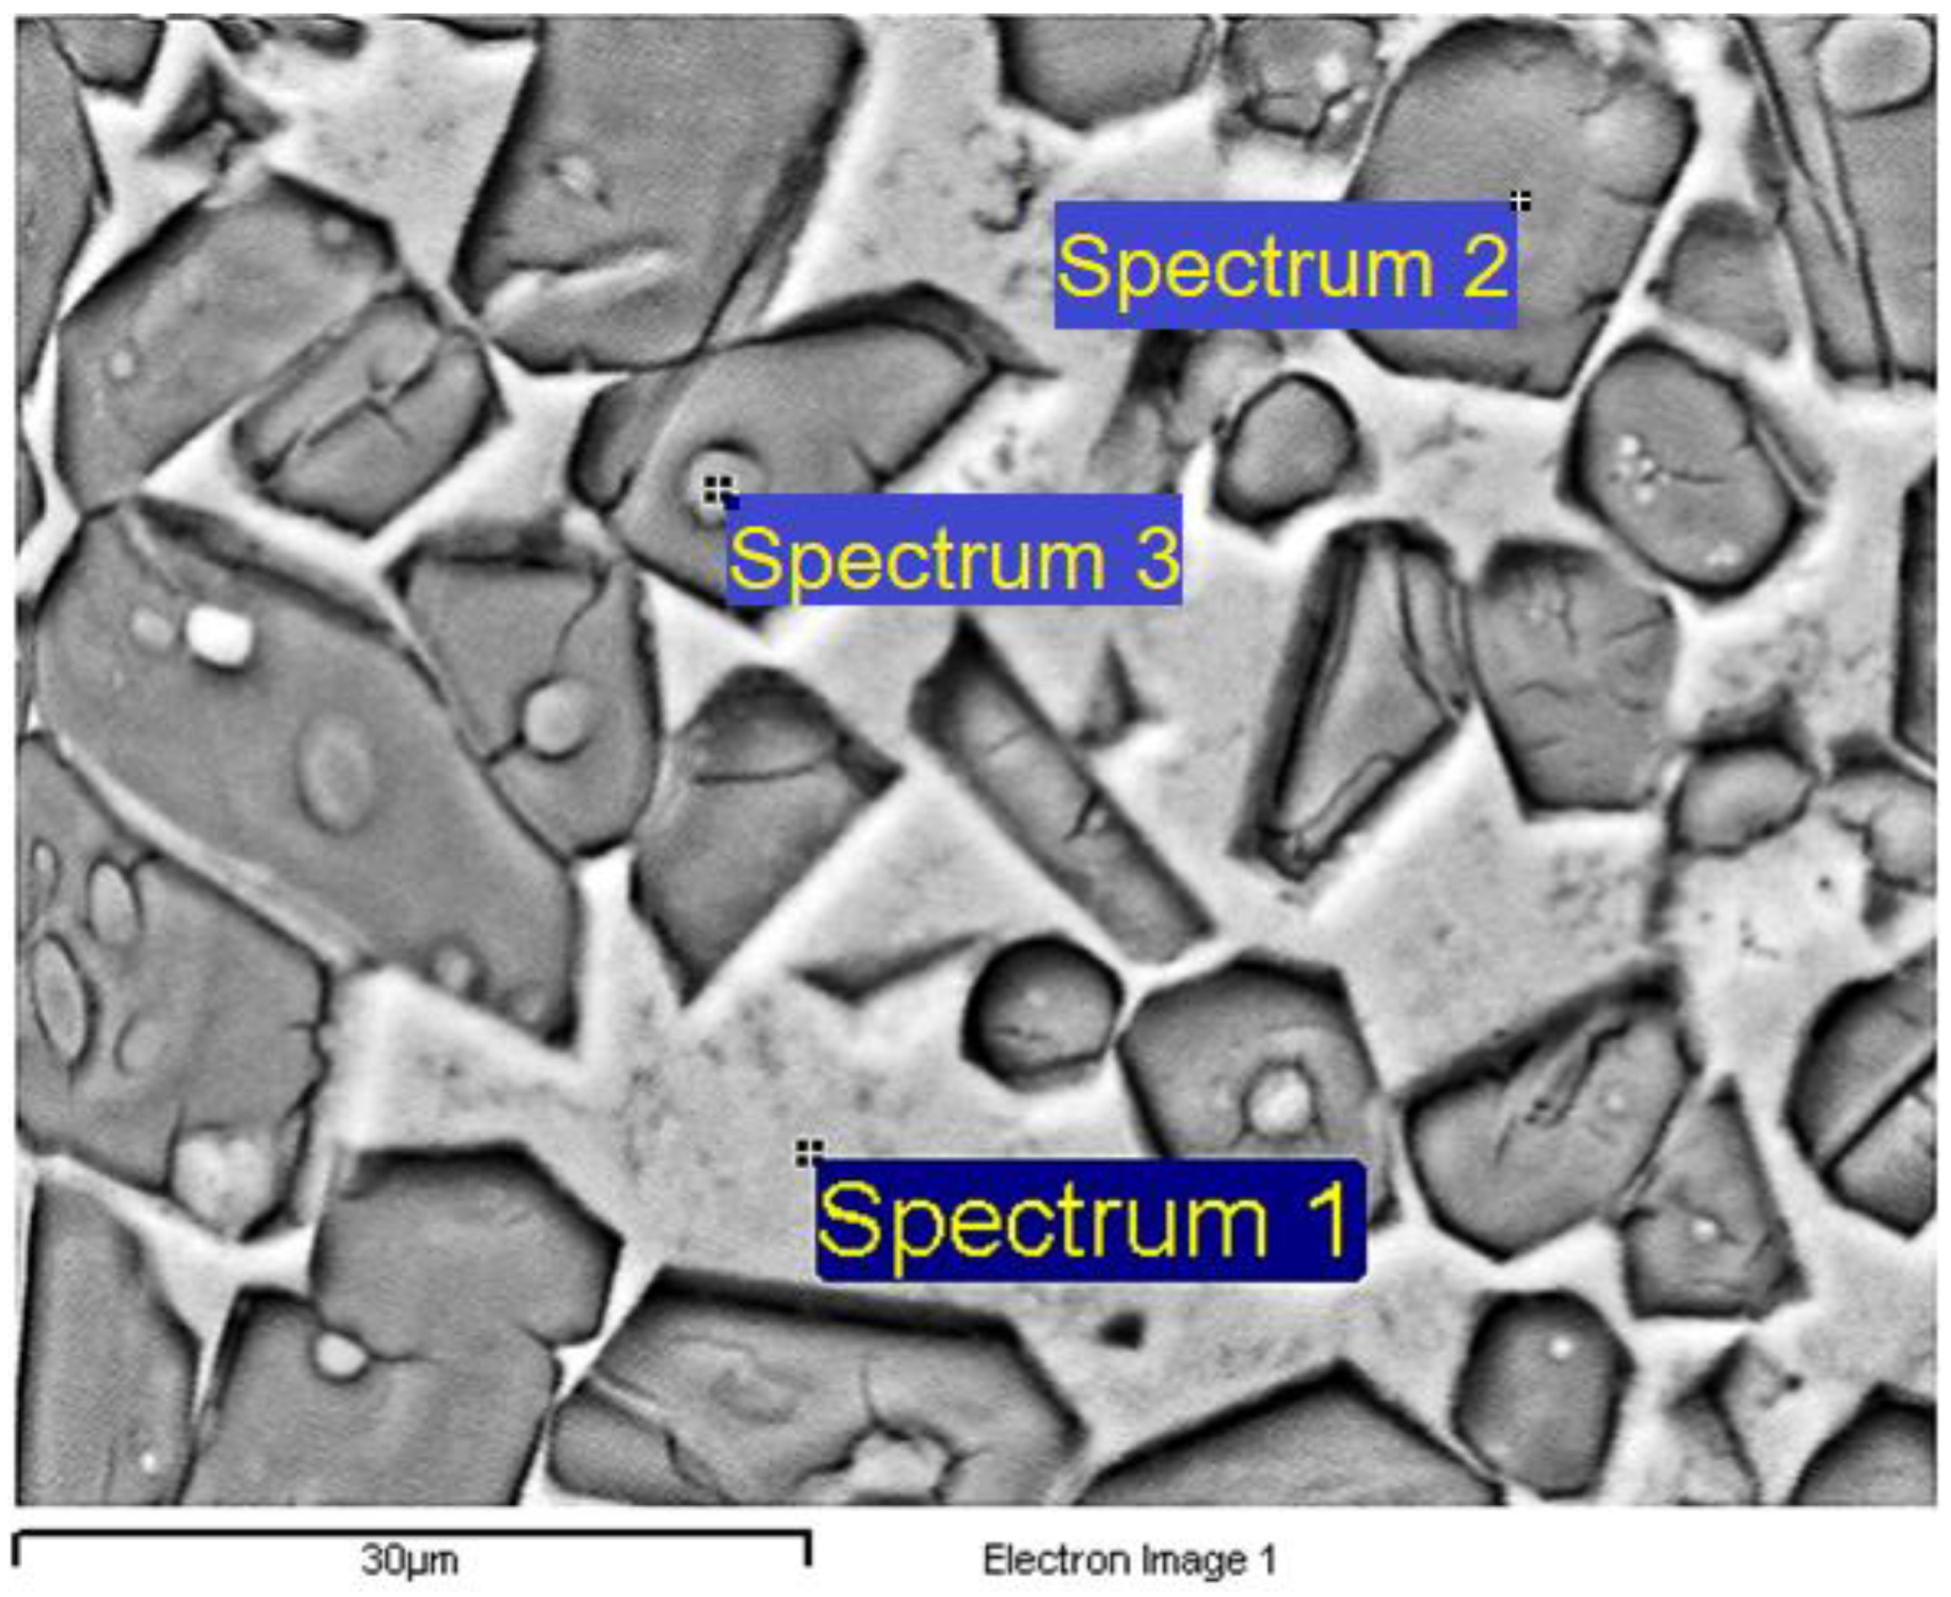
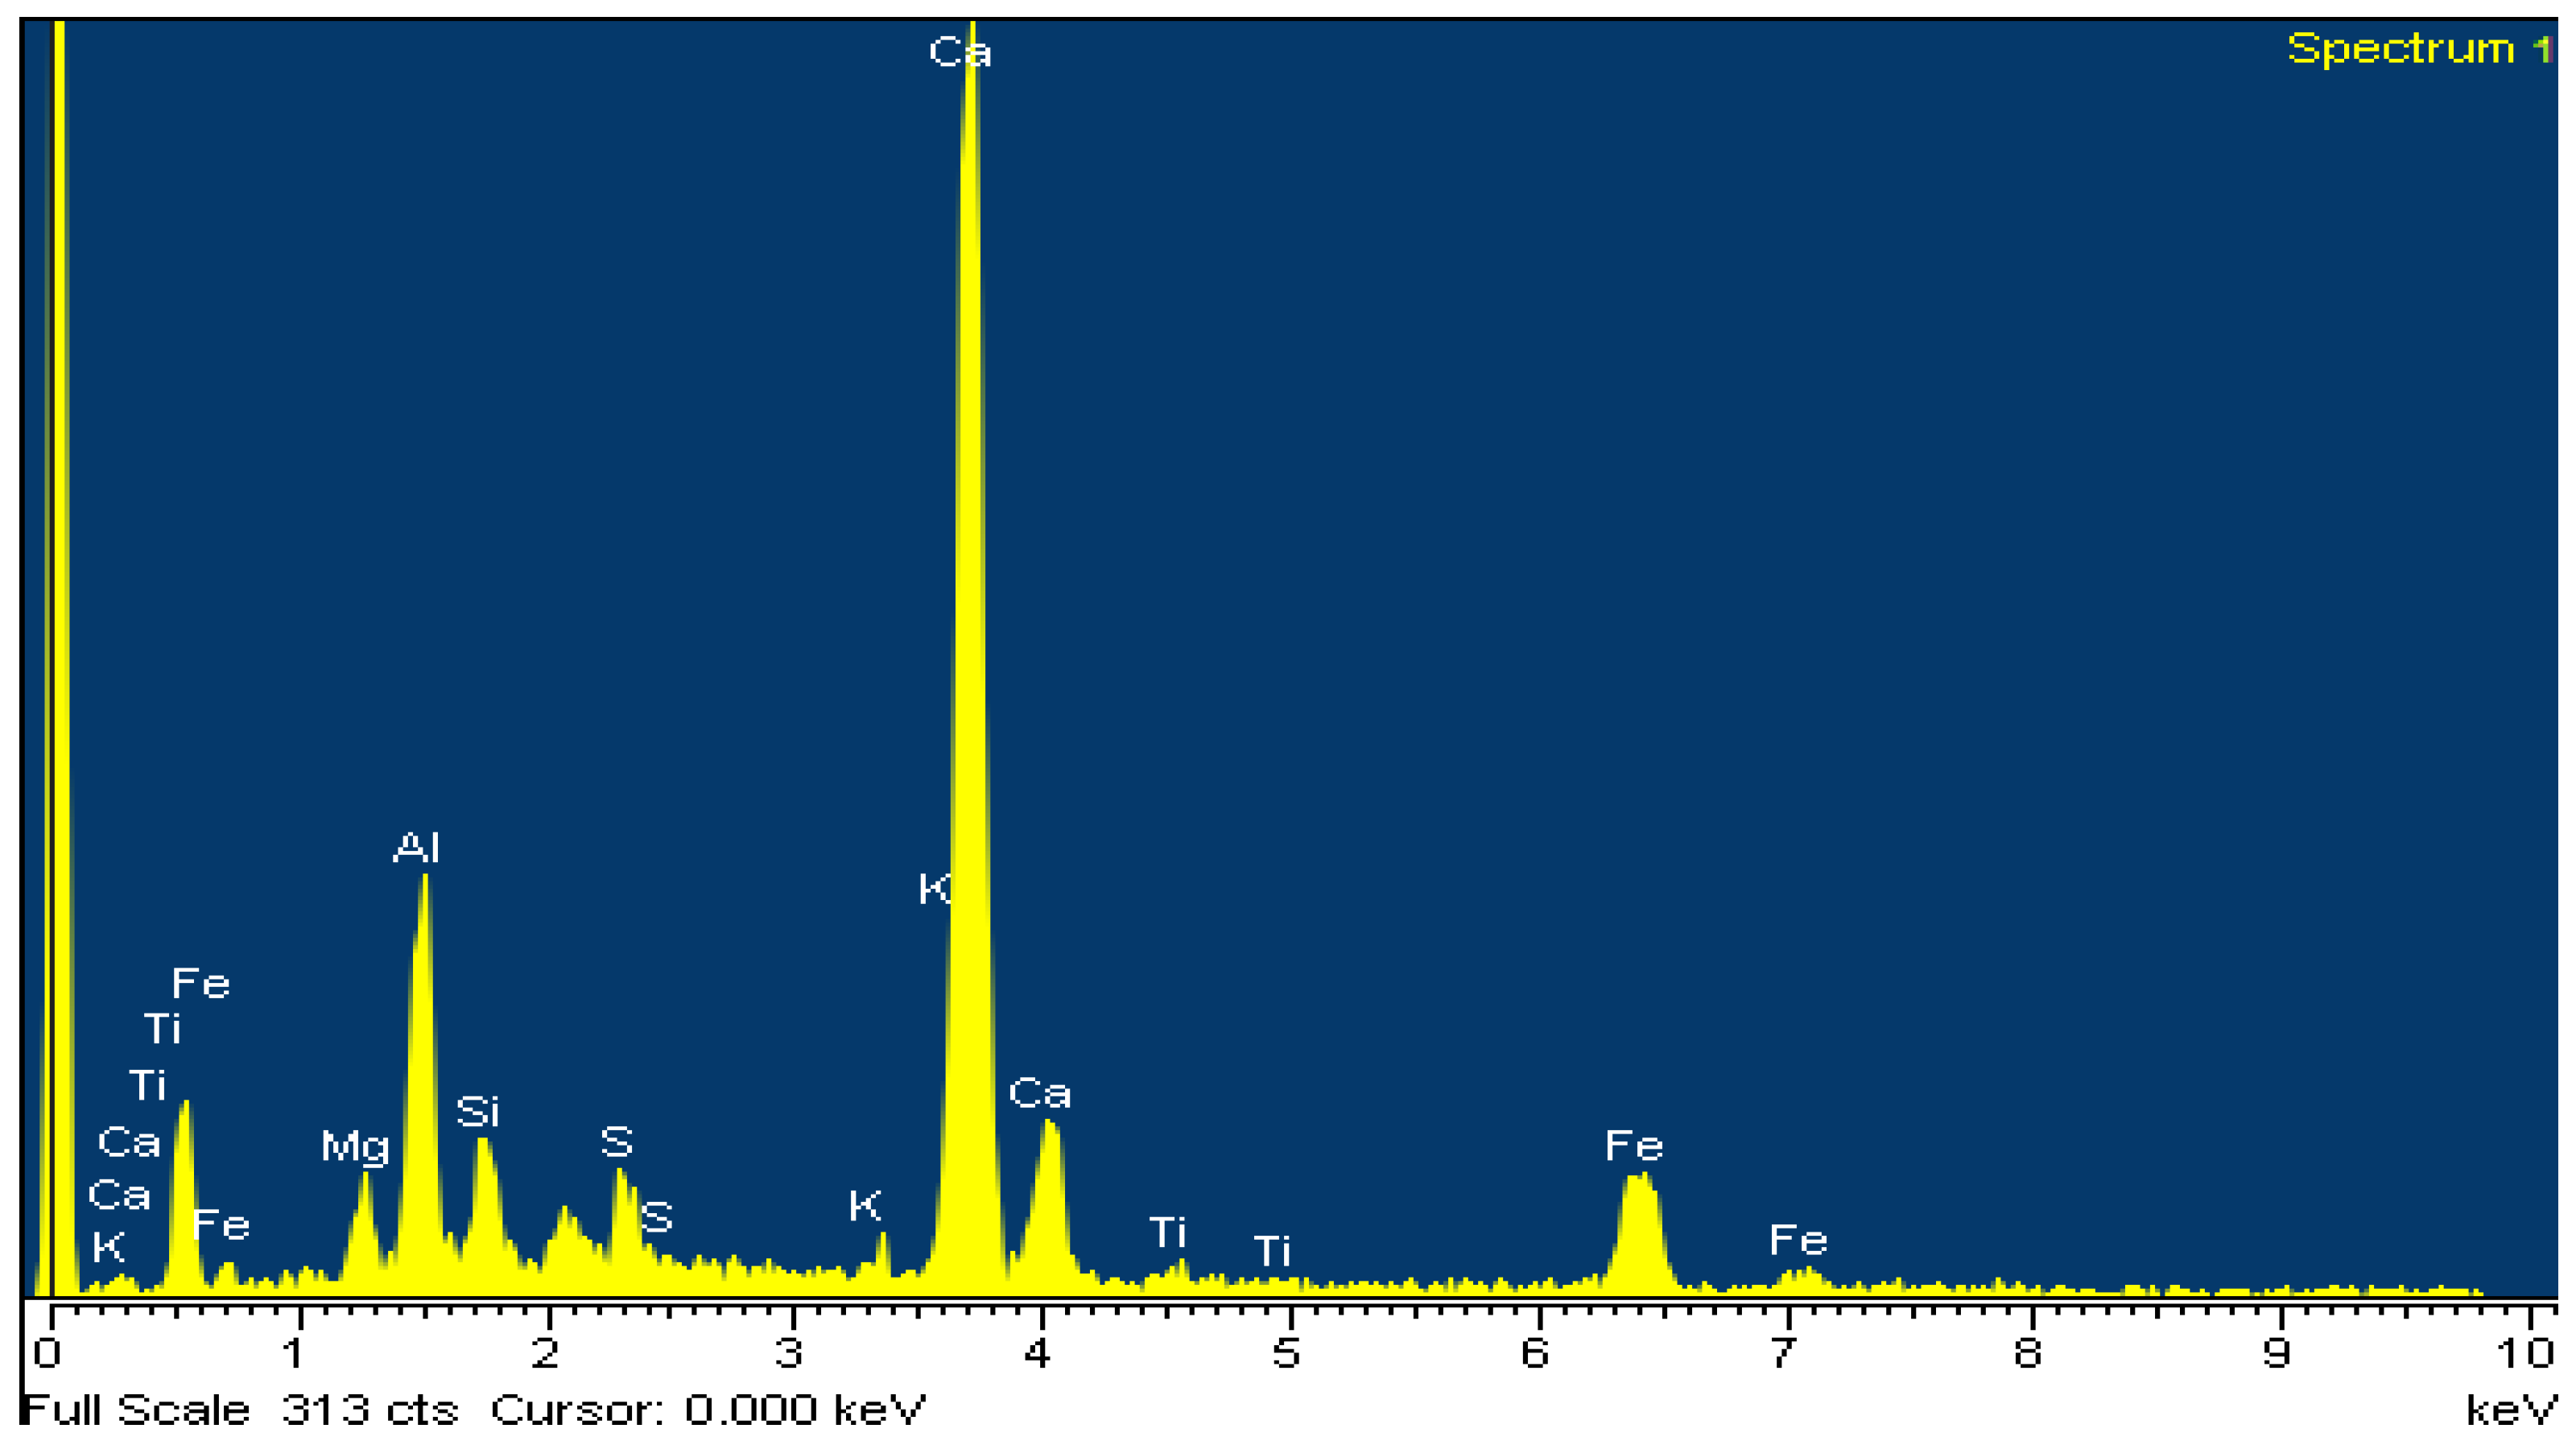
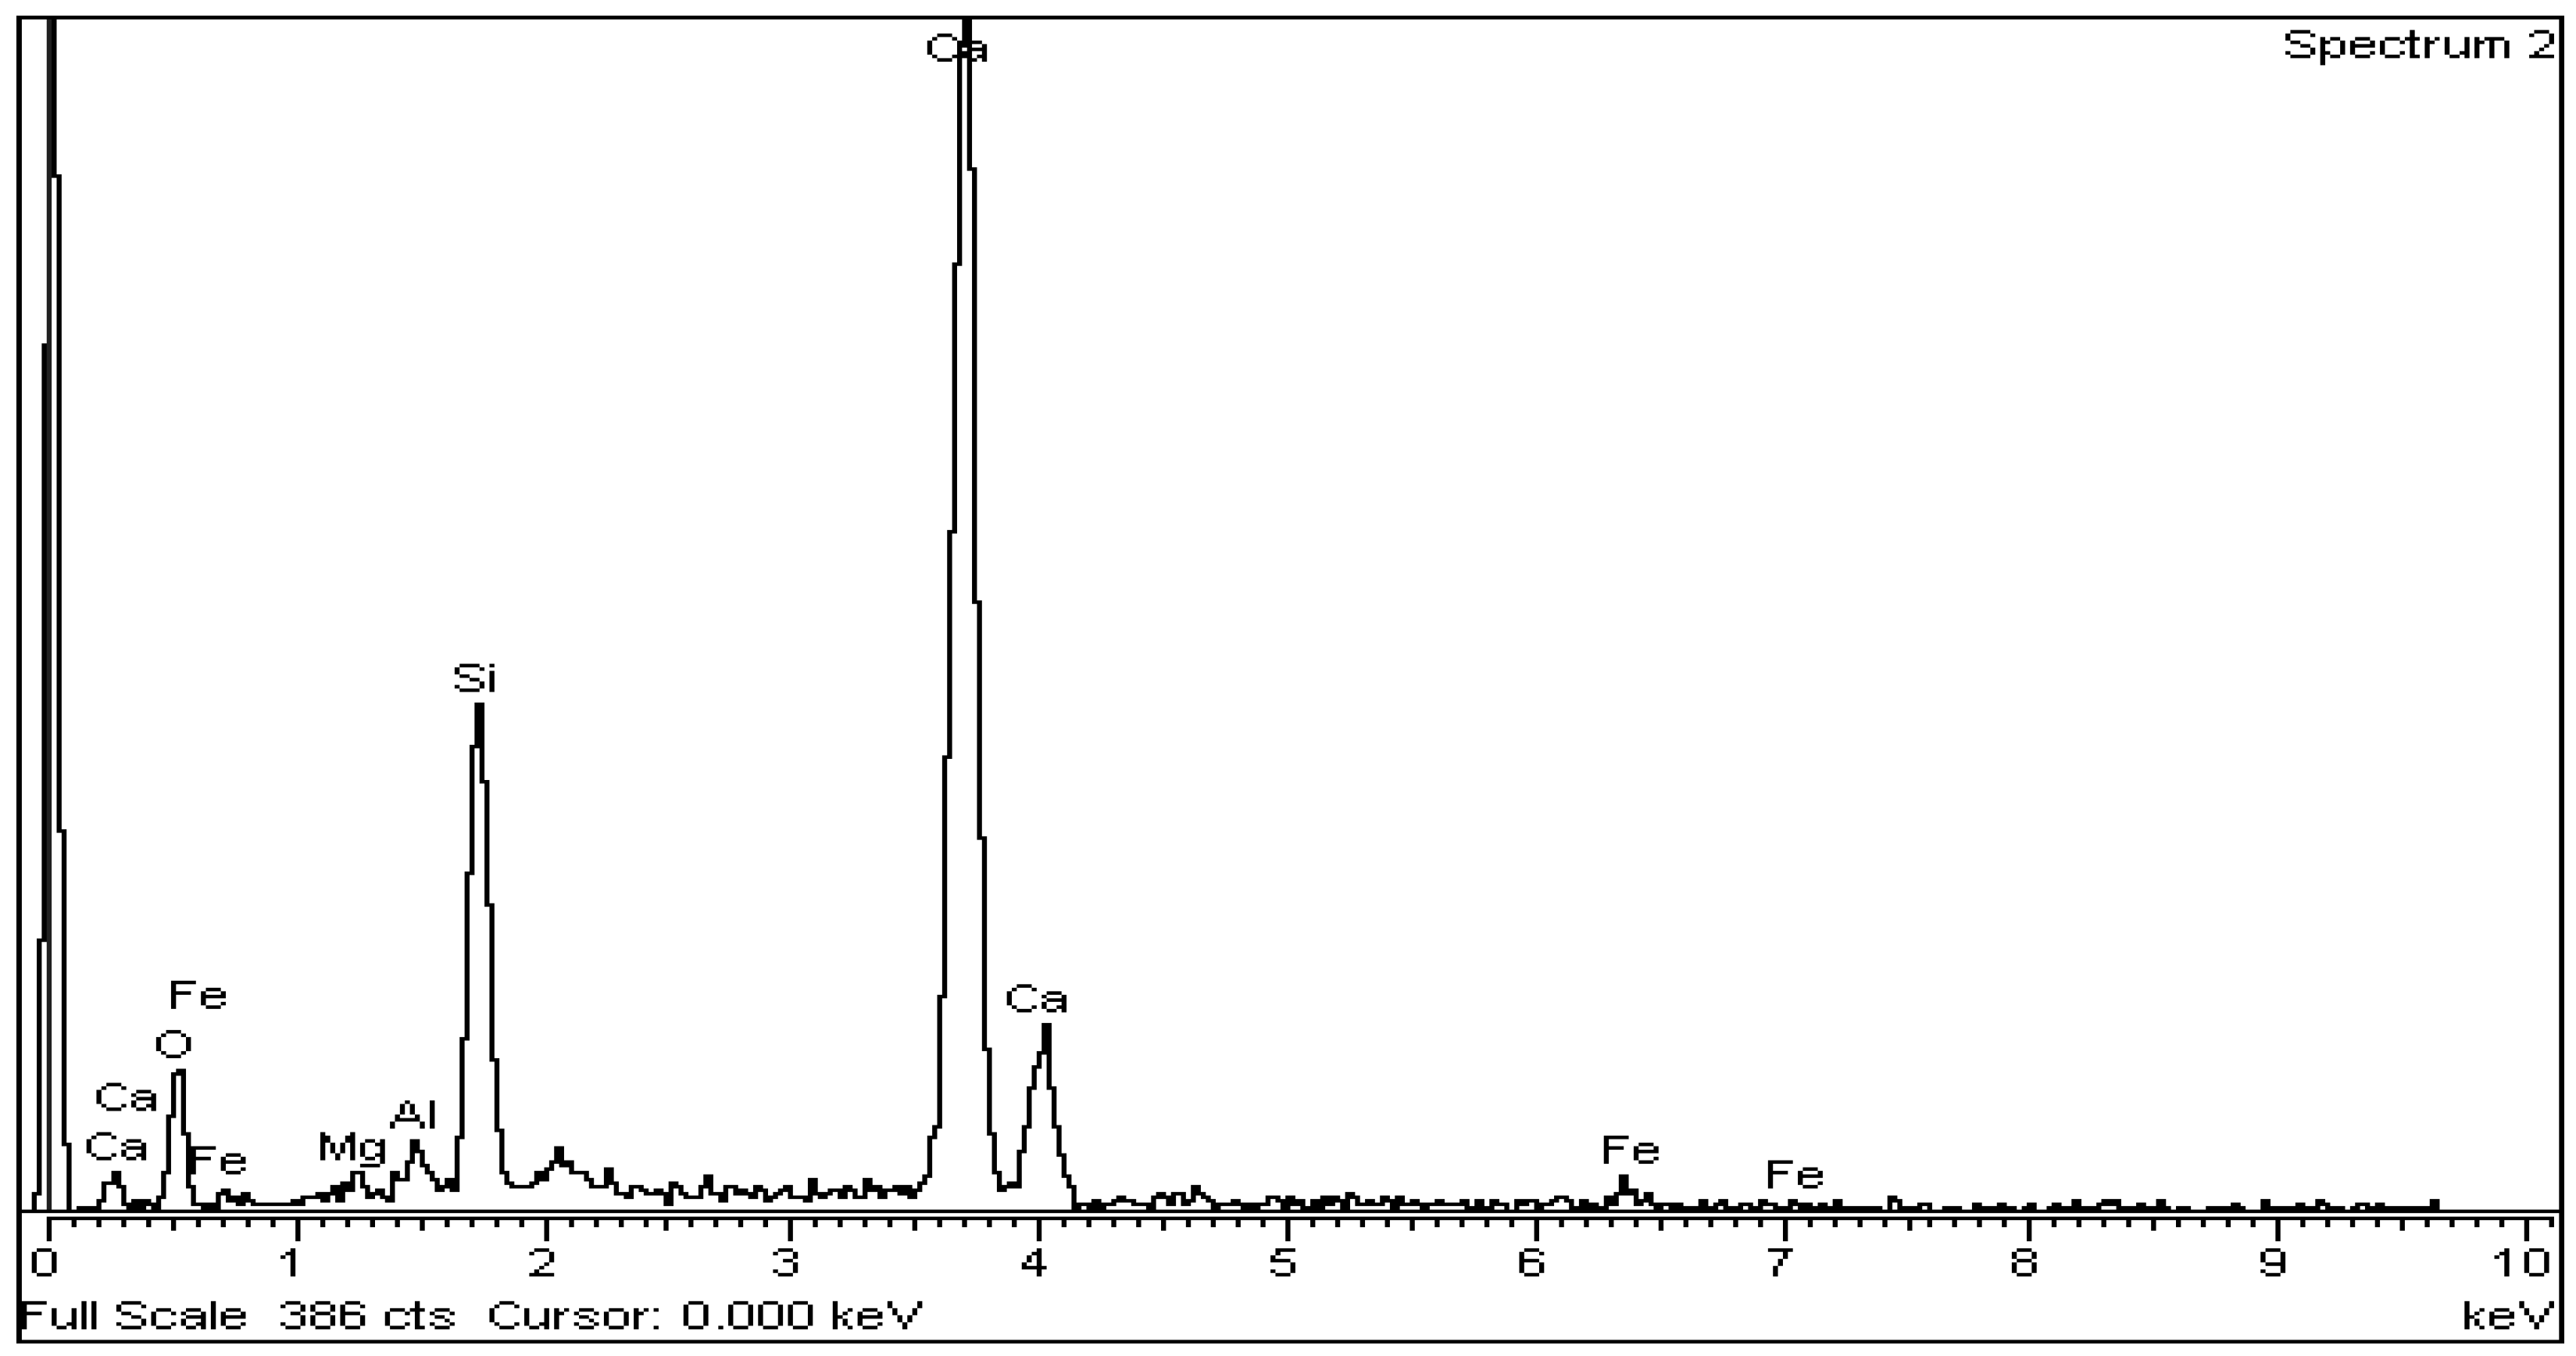
For the microstructural observation, the surfaces were polished again using a diamond paste of 1 μm (DP-Paste M, Struers, CLE, USA) on a synthetic cloth (MD-Nap, Struers, CLE, USA) and DP Lubricant Red (Struers, CLE, USA). The morphology of the microstructure and X-ray microanalysis of carbon-coated surfaces was performed by SEM/EDS (JSM 5600 of Jeol, Tokyo, Japan).

3. Results and Discussion

3.1. Characterization of Raw Materials

Τhe dried raw materials were chemically analyzed by XRF and the results are presented in Table 1.
In Figure 2, Figure 3, Figure 4, Figure 5 and Figure 6 are presented the XRD patterns for all raw materials that were used for the clinker formation.
Subsequently, the XRD patterns (Figure 2, Figure 3, Figure 4, Figure 5 and Figure 6) showed that:
  • Limestone consisted of calcite (CaCO3) and quartz (SiO2).
  • Shale consisted of quartz (SiO2), illite ((K,H3O)(Al,Mg,Fe)2(Si,Al)4O10[(OH)2,(H2O)]), kaolinite (Al2Si2O5(OH)4), dolomite (CaMg(CO3)2), albite (NaAlSi3O8), calcite (CaCO3), microcline (KAlSi3O8), muscovite (KAl2(AlSi3O10)(F,OH)2), clinochlore ((Mg,Fe)3(Si,Al)4O10(OH)2·(Mg,Fe)3(OH)6) and hematite (Fe2O3).
  • Lava consisted of quartz (SiO2).
  • WFA consisted of quartz (SiO2), mullite (Al6Si2O13), indialite (Mg2Al4Si5O18), andalusite (Al2(SiO4)O) and potassium silicate (K6Si3O9).
  • ILS consisted of iron oxide (Fe2O3), sys-fayalite (sys-Fe2SiO4), sys-portlandite (sys -Ca(OH)2), wrestite (FeO), maghemite (Fe21.16O31.92), γ-aluminum oxide (γ-Al2O3), sys-magnetite (sys-Fe3O4) and brucite (Mg(OH)2).
The STA analysis for all raw materials from 25 to 1450 °C is presented in Figure 7. TG curves are with dashed lines, while DSC ones are with solid lines.
According to Figure 7, in STA analysis it can be observed that the major mass losses occurred up to 600 °C for WFA and above 700 °C for limestone and shale. Lava presented no mass loss in the temperature range tested due to its calcined nature (700–1200 °C). ILS showed a 10% mass gain after 550 °C, which was due to the crystalline transformation of the contained iron oxide into hematite (α-Fe2O3) [45]. TGA curves of limestone and shale present progressive mass losses of moisture and hydroxyl groups until 750 °C.
The endothermic peak of limestone at 850 °C is typical for the decomposition of carbonate phases [3,45]. Respectively, the small endo peak at about 820 °C for shale is due to phase transitions of the contained feldspatic and illite type minerals [45]. The wide DSC peak at 1150–1250 °C indicates the formation of nepheline (Na₃KAl₄Si₄O₁₆), which at 1254 °C is assumed to convert to the cubic stuffed cristobalite, carnegieite [45,46].
In the case of lava, thermal effects were not detected on the DSC curve under the applied experimental conditions, but the wide drop above 870 °C might be attributed to the inversion of quartz to tridymite [47].
In the case of ILS, the endothermic peak at 1392 °C, indicates austenite (γ -Fe) is transformed into cubic ferrite, δ-Fe [48]. Moreover, at 1430 °C the endo peak accompanied by a mass loss in TGA indicates the melting of hematite [45].
The wide DSC curve of WFA at 600 °C is linked to the equilibrium changes between a-Quartz and b-Quartz polymorphs and the existence of mixtures of the two quartz structures [45,47,49]. The small exothermic peak before 1200 °C may be related to the rapid crystallization of mullite and/or quartz [50]. Also, the endothermic peak just before the exothermic one at 1300 °C and 1350 °C, respectively, represents a small change in entropy [50], which in combination with the phyllosilicate, Kaolinite-Serpentine group, indicates a change in ion structure, oxygen and restructuring of the crystalline forms [45,50].

3.2. Design of Raw Meals and Production

The new clinkers, namely P65A and P71A, were designed (Table 2) by means of MS Excel, using XRF analysis of raw materials (Table 1) and the predictions of the Bogue equations [2]. Main target was to maintain LSF over 90% and the clinkers to contain 65% wt. and 71% wt. alite respectively (Table 3). In order to produce Portland cement, the lime saturation factor (LSF) was kept over 92% [4,18], whereas the alumina (AM) and silica modulus (SM) varied from 0.94% to 1.28% and 2.50% to 3.02%, respectively, similar to those followed in the production of OPC. Therefore, the formation of Portland cements with 65% wt. and 71% wt. of alite was studied using two mixtures of both raw materials and byproducts prepared at two temperatures, either at 1450 °C or lower at 1340 °C. The liquid phase, consisting of C4AF and C3A, was maintained at 15–18% wt. according to common Portland cement [51].

3.3. Clinker Characterization

All raw meals were prepared and fired at two different peak temperatures, 1340 °C and 1450 °C, producing 4 types of clinkers, P65A_1450, P71A_1450, P65A_1340 and P71A_1340, following the firing profiles presented in Figure 1. The clinker P65A_1340 was prepared with two slightly different cooling rates. The corresponding results are shown in columns as P165A_1340 and P265A_1340. Clinker P165A_1340 had a slower cooling rate than the other clinkers, according to the results of f(CaO), but it was decided to be studied as well.
Subsequently, both clinker types (P65A and P71A) were ground in batches of 125 g for 150 s achieving a fineness of approximately 3000 cm2/g (Table 4). Table 4 presents the results of f(CaO), fineness and specific weight. The specific weight of the produced cements was similar to the commercial CEM I 42.5N cement (3.16 g/cm3). Free lime, f(CaO), is within the appropriate limits for OPC (0.2–4%) [51] for all tested clinkers.
As the total content in oxides of the clinkers is not affected by temperature, Table 5 presents the XRF analysis of the laboratory clinkers P65A_1450, P165A_1340 and P265A_1340, grouped as P65A, and P71A_1450 and P71A_1340, grouped as P71A, as well as of the commercial clinker CEM I 42.5N.
In the XRF analysis (Table 5) alkalis (K2O and Na2O), SO3 and MgO are in acceptable percentages for cement production [52]. In addition, as they exist in small percentages, it is anticipated not to affect the stability of α- and β-C2S [23,24,25,26]. Only by considering the sum of C2S and C3S at the samples of 1450 °C, there is some accordance between the two methods as also mentioned in other studies in the literature [4,53,54]. This hypothesis is also confirmed by experiments P165A_1340 and P265A_1340 (Table 6) in which the only difference is the cooling rate of the clinker, but they presented significantly different percentages of α- and β-belite.
The main four mineralogical phases identified in all studied clinkers were: alite (C3S), belite (C2S) and its polymorphs (α-, β- and γ-), ferrite (C4AF) and celite (C3A). In Table 6, the estimated compositions of clinkers for the main four crystallographic phases by Q-XRD and by Bogue equations are presented respectively. The other minor phases formed such as gehlenite, mayenite, perovskite, langbeinite, periclase, yeelimite, anhydrite, aphthitalite and quartz were excluded from Table 6 as their content was less than 2% wt.
Firstly, in Table 6, Bogue predictions and the Rietveld method deviate from each other mainly on the values of C3S and C2S. Previous studies have shown this too [4,53,54]. Moreover, C4AF was maintained at 12 ± 2% wt. for all the produced clinkers and consistent with those of Bogue equations. The results of the Rietveld method on C3A are also consistent with those of Bogue equations, except C3A of P265A_1340. In that case, 0.5% wt. of C3A indicates low content of Al2O3 in the mixture, while an excess of Fe2O3 is excluded as the percentage of C4AF of P165A_1340 is almost the same as that of P265A_1340. In the literature, few discussions exist concerning the clinkering process [53,54,55,56]. The difference between the percentages of formation of belite and alite is attributed to the different final clinkering temperatures. Solid-phase reactions do not favor the formation of alite, even at relatively eleveted temperatures ie. at 1450 °C. However, the formation of alite is favored in the presence of a molten phase, for example, in the presence of Fe2O3 [20].
Secondly, the free lime value of P265A_1340 (Table 4) is higher than the rest ones and in addition, this sample presents the lower alite and the higher belite content (Table 6). Therefore, it can be concluded that the process of alite formation has not been completed, and unrelated CaO still remains. Moreover, comparing the results for the compositions P165A_1340 and P265A_1340 in Table 4 and Table 6, it is observed that the free lime decreases as the belite turns to alite. As P165A_1340 had a slower cooling rate than the other clinkers, there are some γ-C2S crystals in its composition [3].
Finally, the results confirm that rapid cooling maintains the formed phases at the tested temperatures. Especially when comparing compositions P165A_1340 and P265A_1340, rapid cooling appears to stabilize αH- and β-belite-which have better hydraulic properties.

3.4. Strength Results and Discussion

The mortars of cement specimens for compressive strength tests were prepared with 95% wt. clinker, 5% wt. gypsum and 0.5 water/cement ratio according to EN 196-1 [42]. The results of the compressive strength test are presented in Table 7 and Figure 8. The experimental compressive strength values have a ±3 to ±4 MPa deviation, which is not presented in Table 7 and Figure 8. In addition, Table 7 presents the characteristic compressive strength values required to characterize a cement as type CEM I 42.5N and CEM I 52.5N according to EN 197-1 [57].
The effect of cement composition on its strength has been extensively studied in the 80s and 90s. It was proved to be complex and dependent on various factors and not just a statistically cumulative function of the strengths of the participating mineral phases of the clinker [58,59,60,61,62,63].
P265A_1340 is the specimen with the highest amount of belite and the lowest of alite. As alite is responsible for early compressive strength, the specimen possesses the lowest early compressive strength of all samples. Specimen P265A_1340 presents lower compressive strength than P165A_1340, which is attributed to its lower alite content according to Table 7 [63]. On the other hand, the lowest 28th-day strength value among the laboratory-produced specimen belongs to P71A_1450, probably, due to the respectively low C2S content.
Furthermore, the group of P71A-cements presented higher compressive strength (except that of 28th-day strength of P71A_1450), than the group of P65A-cements in each temperature, respectively. This was attributed to the higher C3S content. Comparing the specimens P71A_1450 and P71A_1340, the higher values of compressive strength were presented by the latter which has lower the clinkering temperature of 1340 °C. The same conclusion emerges from the comparison of the P165A_1340 and P65A_1450 specimens. Moreover, CEM I 42.5N presented the lowest 28th-day compressive strength value.
The initial strength can be affected by C4AF content [37,61,63], which in the present case was 12 ± 2.5% wt. Moreover, from the experimental results it can be assumed that the hydration reactions were slightly faster in the case of P71A_1450, P165A_1340, P71A_1340 than in the case of CEM I 42.5N specimens, as during the 2nd curing day, they presented compressive strength lower than CEM I 42.5N. On the 7th day of curing, the best compressive strength values were ascribed to P71A_1340 presenting 39.1 MPa, followed by CEM I 42.5 Ν, P71A_1450 and P165A_1340 which present 32 MPa.
In conclusion, the compressive strength values (Table 8) obtained for all the produced specimens, with fineness 3000 cm2/gr, are conforming to the compressive strength of a CEM I-42.5N class, according to EN 197-1 [57]. Moreover, P71A_1340 presented the higher compressive strength for all curing days. According to the above results, P71A_1340 mortar conforms with a CEM I-52.5N class cement [57].

3.5. Optical Microscopy

The images of optical microscopy of the five laboratory-produced clinkers are presented in Figure 9, Figure 10, Figure 11, Figure 12 and Figure 13. The round crystals indicate belite (C2S) and the polygonal ones alite (C3S) [43]. The grey mass between the crystals is the amorphous phase, a mixture of C4AF and C3A [43]. The observed samples present a rather increased number of pores which are depicted as black or dark grey areas [43].
Figure 9, Figure 10, Figure 11, Figure 12 and Figure 13 do not clearly depict the difference in concentration between the alite and belite phases in the five clinkers. In any case, a multicolored canvas is observed consisting of blue, brown, green, purple and black crystals. The round crystals present belite (C2S) and the polygonal ones alite (C3S) [43]. The light grey areas of the amorphous phase consist of a mixture of C4AF and C3A, which forms the liquid phase at the time of clinkering [43]. Finally, the cloudy black or dark grey areas are free CaO filled pores. [43].
Figure 9 (P65A_1450) and Figure 12 (P71A_1450) present a typical cross-sectional view of alite clinker samples. Figure 9 and Figure 12 are full of large angular alite crystals with a small distance between them and intense iridescence. Their Q-XRD results presented in Table 6 indicate that difference in composition, namely 13% wt. and 20% wt. respectively, does not affect the optical image of the crystals.
Comparing the three 1340 °C-clinkers (Figure 10, Figure 11 and Figure 13), it is observed that their pores are dark grey, i.e., lighter than the dark black ones on Figure 9 and Figure 12 of the 1450 °C-clinkers, indicating the higher amount of free CaO. Moreover, the crystals of these Figure 10, Figure 11 and Figure 13 are joined and not fully formed, making it difficult to separate them into belite and alite crystals, as they are in transition probably due to insufficient soaking time. Finally, the liquid phase is less in Figure 9 and Figure 12 of the 1450 °C fired clinkers, as expected.

3.6. SEM and EDS

An observation of the crystallographic phases of P71A_1450 by SEM is depicted in Figure 14 and Figure 15. In these figures, the amorphous phase, C4AF and C3A, are depicted in light grey between the rounded dark grey crystals of belite, as well as the polygonal dark grey crystals of alite [43]. Moreover, round crystals of belite have been detected within the alite crystals as Figure 15 depicts. In Figure 14 round belite crystals are presented, which are consisted of α-belite with fine lamellas of disordered β-belite [22,43], as Q-XRD (Table 6) detected.
The above is confirmed by EDS analysis on Spectrums 1-3 of Figure 15. In particular, Figure 16 and Table 8 present the EDS analysis of the point “spectrum 1” of Figure 15. Figure 17 and Table 9 present the EDS analysis of the point “spectrum 2” and finally, Figure 18 and Table 10 of the point “spectrum 3”.
Finally, the size of crystals of the formed belite (Figure 14) varies from 10 to 30 μm, a size which indicates high hydraulic activity and confirms the adequate burning time of the clinkers according to Ono, 1981 [43,64].
Figure 15 is typical for the produced clinkers at 1450 °C. The gradual transformation of belite to alite is clearly presented. EDS analysis on Spectrums 1 to 3 of Figure 15, confirms the main crystallographic phases of the Portland cement clinker namely alite, belite, aluminate and ferrite. Spectrum 2 and Spectrum 3 of Figure 15show the points where EDS analysis of alite and belite was performed respectively.
Finally, the size of the formed alite crystals varies from 8 to 20 μm (Figure 15), a size which indicates excellent hydraulic activity [41], confirming the good strength results, and quick heating rate of the firing process [41] according to Ono, 1981 [64].

4. Conclusions

The cements produced in this study do not require changes in the existing production route of industries. Moreover, the use of Portland cement has been established worldwide and there is no need to re-integrate the product into the market. The main results can be summarized as:
  • The cements produced in this study can be characterized as Portland-type ones.
  • The raw mix design comprises of conventional raw materials and industrial byproducts such as Greek Wet Fly Ash (WFA) and Iron Lamination Scales (ILS) and therefore are contributing to sustainability.
  • The synergy of raw materials and clinkering temperatures was successfully examined by different analyses and characterization techniques by appropriate cement standards.
  • The carbon footprint can be positively affected mainly due to the reduction of the firing temperature and the use of byproducts.
  • Comparing the produced cements of the same composition, the same fineness and the same water ratio addition, the best compressive strength is presented by the ones with the lower clinkering temperature, i.e., at 1340 °C.
  • All produced cements can be classified under CEM I-42.5N class with higher initial compressive strength values.
  • The cement produced with higher alite content and lower clinkering temperature, P71A1340, can be classified as CEM I-52.5N class according to EN 197-1 [46].
  • Finally, the main principle of circular economy is followed, since byproducts are used as raw materials for the production of a more useful material, which in the present case is cement.

Author Contributions

Conceptualization and methodology, M.D.K.; software M.D.K., A.C. and D.G.K.; validation, G.N.A. and M.D.K.; formal analysis, M.D.K.; investigation, M.D.K. and D.G.K.; data curation, M.D.K.; writing—original draft preparation, M.D.K.; writing—review and editing, M.D.K., A.C., D.G.K. and G.N.A.; supervision, G.N.A.; project administration, G.N.A. All authors have read and agreed to the published version of the manuscript.

Funding

This research received no external funding.

Data Availability Statement

The data presented in this study are available on request from the corresponding authors.

Acknowledgments

The authors acknowledge the support of this work by the project “INVALOR: Research Infrastructure for Waste Valorization and Sustainable Management” (MIS 5002495) which is implemented under the Action “Reinforcement of the Research and Innovation Infrastructure”, funded by the Operational Program “Competitiveness, Entrepreneurship and Innovation” (NSRF 2014–2020) and co-financed by Greece and the European Union (European Regional Development Fund), TITAN SA, Cement Company for raw materials supply and strength measurements and Institute of Geology and Mineral Exploitation (I.G.M.E.) for SEM microscopy and EDS analysis.

Conflicts of Interest

The authors declare no conflict of interest. The funders had no role in the design of the study; in the collection, analyses, or interpretation of data; in the writing of the manuscript, or in the decision to publish the results.

References

  1. USA Geological Survey. USGS Science for a Changing World. Mineral Commodity Summaries 2021; USA Geological Survey: Reston, VA, USA, 2021; p. 43. ISBN 978-1-4113-4398-6. [Google Scholar]
  2. Bogue, R.H. Origin of the special chemical symbols used by cement chemists. J. Portland Cem. Assoc. 1961, 3, 20–21. [Google Scholar]
  3. Del Strother, P. Manufacture of Portland Cement. In Lea’s Chemistry of Cement and Concrete, 5th ed.; Butterworth-Heinemann: Oxford, UK, 2019. [Google Scholar] [CrossRef]
  4. Taylor, H.F.W. Cement Chemistry; Academic Press: New York, NY, USA, 1990. [Google Scholar]
  5. TITAN Cement Group. Integrated Annual Report (IAR 2020). 2020. Available online: https://www.titan-cement.com/newsroom/annualreports/ (accessed on 10 October 2021).
  6. TITAN Cement Group. Accelerating Our Efforts to Tackle Climate Change. Available online: https://www.titan-cement.com/sustainability/environment/climate-change/ (accessed on 10 October 2021).
  7. Locher, F.W. Cement-Principles of Production and Use; Vbt Verlag Bau U. Technik: Dusseldorf, Germany, 2005; ISBN 3762531013. [Google Scholar]
  8. Justnes, H. Alternative Low-CO2 “Green” Clinkering Processes. Rev. Mineral. Geochem. 2012, 74, 83–99. [Google Scholar] [CrossRef]
  9. Koumpouri, D. Exploitation of EAF Slags as a Material in Ecofriendly Cement of Belize Type. Ph.D. Thesis, Department of Chemical Engineering, University of Patras, Patras, Greece, 2011. [Google Scholar]
  10. Barrett, J. The roles of carbon dioxide and water vapour in warming and cooling the Earth’s troposphere. Spectrochim. Acta Part A Mol. Biomol. Spectrosc. 1995, 51, 415–417. [Google Scholar] [CrossRef]
  11. Sharp, J.H.; Lawrence, C.D.; Yang, R. Calcium sulfoaluminate cements-low energy cements, special cements or what? Adv. Cem. Res. 1999, 11, 3–13. [Google Scholar] [CrossRef]
  12. Young, J.F.; Khan-Afridi, M.U. Innovative Cements. In Innovations in Portland Cement Manufacturing, 1st ed.; Bhatty, J.I., Miller, F.M., Kosmatka, S.H., Eds.; Portland Cement Association: Skokie, IL, USA, 2004. [Google Scholar]
  13. Subba Rao, V.V.; Narang, K.C. Potentials for making active belite cements with chromium oxide as modifier. Zem.-Kalk-Gips 1987, 40, 434–437. [Google Scholar]
  14. Gutt, W.; Osborne, G.J. The effect of potassium on the hydraulicity of dicalcium silicate. Cem. Technol. 1970, 1, 1–5. [Google Scholar]
  15. Gies, A.; Knöfel, D. Influence of alkalis on the composition of belite-rich cement clinkers and the technological properties of the resulting cements. Cem. Concr. Res. 1986, 16, 411–422. [Google Scholar] [CrossRef]
  16. Rajczyk, K.; Nocun-Wczelik, W. Studies of belite cement from barium containing by-products. In Proceedings of the 9th International Congress on the Chemistry of Cement, New Delhi, India, 23–28 November 1992; Volume II, pp. 250–254. [Google Scholar]
  17. Harrison, T.; Jones, M.R.; Lawrence, D. The Production of Low Energy Cements. In Lea’s Chemistry of Cement and Concrete, 5th ed.; Hewlett, P.C., Ed.; Elsevier Butterworth-Heinemann: Oxford, UK, 2019. [Google Scholar]
  18. Lawrence, C.D. The Production of Low-Energy cements. In Lea’s Chemistry of Cement and Concrete, 4th ed.; Hewlett, P.C., Ed.; Elsevier Butterworth-Heinemann: Oxford, UK, 1998. [Google Scholar]
  19. Gartner, E. Industrially interesting approaches to “low-CO2” cements. Cem. Concr. Res. 2004, 34, 1489–1498. [Google Scholar] [CrossRef]
  20. Odler, I. Hydration, Setting and Hardening of Portland Cement. In Lea’s Chemistry of Cement and Concrete; Hewlett, P.C., Ed.; Elsevier Butterworth-Heinemann: Oxford, UK, 1998; p. 286. [Google Scholar]
  21. Niesel, K. The importance of the α’L–α’H transition in the polymorphism of dicalcium silicate. Silic. Ind. 1972, 37, 136. [Google Scholar]
  22. Ono, Y. Microscopical estimation of burning condition and quality of clinker. In Proceedings of the 7th International Congress on the Chemistry of Cement, Paris, France, 19–21 September 1980; Volume I, pp. 206–211. [Google Scholar]
  23. Kolovos, K.; Loutsi, P.; Tsivilis, S.; Kakali, G. The effect of foreign ions on the reactivity of the CaO-SiO2-Al2O3-Fe2O3 system Part I. Anions. Cem. Concr. Res. 2001, 31, 425–429. [Google Scholar] [CrossRef]
  24. Kolovos, K.; Tsivilis, S.; Kakali, G. The effect of foreign ions on the reactivity of the CaO-SiO2-Al2O3-Fe2O3 system Part II. Cations. Cem. Concr. Res. 2002, 32, 463–469. [Google Scholar] [CrossRef]
  25. Gosh, S.N.; Rao, P.B.; Paul, A.K.; Raina, K. The chemistry of dicalcium silicate mineral. J. Mater. Sci. 1979, 14, 1554–1556. [Google Scholar] [CrossRef]
  26. Gosh, A.; Chopra, S.; Young, J.F. Microstructural characterization of doped dicalcium silicate polymorphs. J. Mater. Sci. 1983, 18, 2905–2914. [Google Scholar]
  27. Stark, J.; Muller, A.; Schrader, R.; Ruempler, K.; Dahm, B. Active belite cement Part I: Objectives, Experimental, Program, preliminary Results/Ueber aktiven belit-zement I: Zielstellung, versuchsprogramm, erste ergebnisse. Silikattechnik 1979, 30, 357–362. [Google Scholar]
  28. Karkhanis, S.V.; Page, C.H.; Rishi, B.K.G.; Parameswaran, P.S.; Chatterjee, A.K. Technology of cement manufacture from low grade limestone and new approaches for quality control. In Proceedings of the 2nd International Symposium on Cement and Concrete, Beijing, China, 5–8 September 1989; Volume 2, p. 377. [Google Scholar]
  29. Aeiforos. Mill Scale. Available online: www.aeiforos.gr/mill_scale (accessed on 20 December 2020).
  30. EN 450-1: 2010. Flying Ash for Concrete-Part 1: Definition, Specifications and Compliance Criteria. European Committee for Standardization: Brussels, Belgium, 2010.
  31. Eskioglou, P. Use and Economy of Fly Ash. Available online: http://users.auth.gr/~pxeskio/ (accessed on 5 April 2021).
  32. Flying Ashes (V, W). Available online: Portal.tee.gr/portal/page/portal/MATERIAL_GUIDES/P_CEMENT/ts2.4.htm (accessed on 5 April 2021).
  33. Dwivedi, A.; Kumar Jain, M. Fly ash–waste management and overview: A Review. Recent Res. Sci. Technol. 2014, 6, 30–35. [Google Scholar]
  34. Loehr, T.; Leithner, R.; Stamatelopoulos, G.; Gerdes, R. Mathematical Modelling and Optimization of a 325-Megawatt Brown-Coal-Fired Power Plant Unit Using the ENBIPRO Energy Budgeting Program/Nachrechnung und Optimierung Eines 325 MW-Braunkohleblockes mit dem Energie Bilanz Programm ENBIPRO. In Proceedings of the Conference: VDI Meeting: Industrial management-Energy Supply Systems-Power Plants-Distribution Networks-Municipal/Industrial Utilities, Darmstadt, Germany, 12–13 March 1996; VDI-Berichte: Düsseldorf, Germany; pp. 123–131, ISBN 3-18-091252-9. [Google Scholar]
  35. EN 1744-1: 2009. Tests for Chemical Properties of Aggregates. Chemical Analysis. European Committee for Standardization: Brussels, Belgium, 2009; p. p. 17.
  36. Javellana, M.P.; Jawed, I. Extraction of Free Lime in Portland Cement and Clinker by Ethylene Glycol. Cem. Concr. Res. 1982, 12, 399–403. [Google Scholar] [CrossRef]
  37. Kamitsou, M.D.; Kanellopoulou, D.G.; Christogerou, A.; Kostagiannakopoulou, C.; Kostopoulos, V.; Angelopoulos, G.N. Valorization of FGD and Bauxite Residue in Sulfobelite Cement Production. Waste Biomass Valorization 2020, 11, 5445–5456. [Google Scholar] [CrossRef]
  38. Stark, J.; Muller, A.; Schrader, R.; Ruempler, K.; Mielke, I. Active belite cement Part III: Demarcation of the field of existence of active belite cement/Ueber aktiven belit-zement. 3: Abgrenzung des existenzgebietes von aktiven belit-zement. Silikattechnik 1980, 31, 168–171. [Google Scholar]
  39. Stark, J.; Rumpler, K.; Schrader, R.; Muller, A.; Dahm, B.; Rudolph, R. Active belite cement Part II: Influence of cooling on cement strength/ Ueber aktiven belit-zement. II: Einfluss des kuehlregimes auf die zementfestigkeit. Silikattechnik 1980, 31, 50–52. [Google Scholar]
  40. EN 196-6: 2010. Methods of Testing Cement—Part 6: Determination of Fineness. European Committee for Standardization: Brussels, Belgium, 2010.
  41. ASTM C188-95: 2003. Standard Test Method for Density of Hydraulic Cement. ASTM International: West Conshohocken, PA, USA, 2003.
  42. EN 196–1: 2005. Methods of Testing Cement—Part 1: Determination of Strength. European Committee for Standardization: Brussels, Belgium, 2005.
  43. Campbell, H.D. Microscopical Examination and Interpretation of Portland Cement and Clinker, 2nd ed.; Portland Cement Association: Washington, DC, USA, 1999. [Google Scholar]
  44. Ono, Y. Ono’s Method, Fundamental Microscopy of Portland Cement Clinker; Chichibu Onoda Cement Corporation: Sakura, Japan, 1995. [Google Scholar]
  45. Mackenzie, R.C. Differential Thermal Analysis; Academic Press: London, UK, 1970; Volume 1. [Google Scholar]
  46. Ivanova, V.P. Termogrammy mineralov. [Thermograms of minerals]. Zap. Vses. Miner. Obshch. 1961, 90, 50–90. [Google Scholar]
  47. Fenner, C.N. Stability relations of the SiO2 minerals. Am. Mineral. 1913, 33, 337–345. [Google Scholar]
  48. Bhadeshia, H.K.D.H. The Theory and Significance of Retained Austenite in Steels. Ph.D. Thesis, Darwin College, Cambridge, UK, 1979. [Google Scholar]
  49. Nagasawa, K. Differential thermal analysis studies on the high-low inversion of vein quartz in Japan. J. Earth Sci. 1953, 1, 156–176. [Google Scholar]
  50. Holdridge, D.A.; Vaughan, F. The Differential Thermal Investigation of Clays; Mackenzie, R.C., Ed.; Mineralogical Society: London, UK, 1957; pp. 98–139. [Google Scholar]
  51. Jackson, P.J. Portland Cement: Classification and Manufacture, In Lea’s Chemistry of Cement and Concrete, 4th ed.; Hewlett, P.C., Ed.; Elsevier Butterworth-Heinemann: Oxford, UK, 1998. [Google Scholar]
  52. Harrisson, A.M. Constitution and Specification of Portland Cement. In Lea’s Chemistry of Cement and Concrete, 5th ed.; Butterworth-Heinemann: Oxford, UK, 2019. [Google Scholar]
  53. Aranda, M.A.; De la Torre, A.G.; León-Reina, L. Rietveld quantitative phase analysis of OPC clinkers, cements and hydration products. Rev. Mineral. geochem. 2012, 74, 169–209. [Google Scholar] [CrossRef] [Green Version]
  54. Walenta, G.; Füllmann, T. Advances in quantitative XRD analysis for clinker, cements, and cementitious additions. Powder Diffr. 2004, 19, 40–44. [Google Scholar] [CrossRef] [Green Version]
  55. Peterson, V.K.; Ray, A.S.; Hunter, B.A. A comparative study of Rietveld phase analysis of cement clinker using neutron, laboratory X-ray, and synchrotron data. Powder Diffr. 2006, 21, 12–18. [Google Scholar] [CrossRef]
  56. Nicholas, B.W. Understanding Cement; WHD Microanalysis Consultant Ltd.: Rendlesham, UK, 2010. [Google Scholar]
  57. EN 197-1:2000. Cement-Part 1: Composition, Specifications and Conformity Criteria for Common Cements. European Committee for Standardization: Brussels, Belgium, 2000.
  58. Osbaeck, B.; Jons, E.S. The influence of the content and distribution of alkalies on the hydration properties of Portland cement/Influence du contenu et de la repartition des alcalis sur les proprietes d’ hydratation du ciment Portland. In Proceedings of the 7th International Congress on the Chemistry of Cement, Paris, France, 30 June–4 July 1980; Volume II, pp. 135–140. [Google Scholar]
  59. Odler, I.; Wonnemann, R. Effect of alkalies on Portland cement hydration II. Alkalies present in form of sulphates. Cem. Concr. Res. 1983, 13, 771–777. [Google Scholar] [CrossRef]
  60. Odler, I.; Abdul-Maula, S. Investigations on the relationship between porosity structure and strength of hydrated Portland cement pastes III. Effect of clinker composition and gypsum addition. Cem. Concr. Res. 1987, 17, 22–30. [Google Scholar] [CrossRef]
  61. Beaudoin, J.J.; Ramachandran, V.S. A new perspective on the hydration characteristics of cement phases. Cem. Concr. Res. 1992, 22, 689. [Google Scholar] [CrossRef]
  62. Scharf, H.; Odler, I. Intrinsic bond properties of hydrates formed in the hydration of pure clinker minerals. In Proceedings of the 9th International Congress on the Chemistry of Cement, New Delhi, lndia, 23–28 November 1992; Volume IV, pp. 265–270. [Google Scholar]
  63. Herfort, D.; Macphee, D.E. Components in Portland Cement Clinker and Their Phase Relationships. In Lea’s Chemistry of Cement and Concrete, 5th ed.; Butterworth-Heinemann: Oxford, UK, 2019. [Google Scholar]
  64. Ono, Y. Microscopical Observation of Clinker for the Estimation of Burning Condition, Grindability, and Hydraulic Activity. In Proceedings of the Third International Conference on Cement Microscopy, Houston, TX, USA, 16–19 March 1981; International Cement Microscopy Association: Coarsegold, CA, USA; pp. 198–210. [Google Scholar]
Figure 1. Diagram of firing temperature profile for the clinker preparation (a) at 1340 °C and (b) at 1450 °C.
Minerals 12 00324 g001
Figure 2. XRD pattern of limestone, where 1: calcite and 2: quartz.
Minerals 12 00324 g002
Figure 3. XRD pattern of shale where 1: quartz, 2: illite, 3: kaolinite, 4: dolomite, 5: albite, 6: calcite, 7: microcline, 8: hematite, 9: muscovite and 10: clinochlore.
Minerals 12 00324 g003
Figure 4. XRD pattern of lava where 1: quartz.
Minerals 12 00324 g004
Figure 5. XRD pattern of WFA with Low Pass FFT Filter of wetashka 2_B, where 1: quartz, 2: mullite, 3: indialite, 4: andalusite and 5: potassium silicate.
Minerals 12 00324 g005
Figure 6. XRD pattern of ILS where 1: iron oxide, 2: sys-fayalite, 3: sys-portlandite, 4: wrestite, 5: maghemite, 6: γ-aluminum oxide, 7: sys-magnetite, 8: brucite and 9: hydrogen aluminum silicate.
Minerals 12 00324 g006
Figure 7. TGA/DSC curves of Limestone are presented in green, Shale in blue, Lava in red, ILS in black, and WFA in magenta. TG curves are with dashed lines and DSC with solid lines.
Minerals 12 00324 g007
Figure 8. Compressive strength results for 2, 7 and 28 days of all cements.
Minerals 12 00324 g008
Figure 9. Image of optical microscopy of P65A_1450.
Minerals 12 00324 g009
Figure 10. Image of optical microscopy of P165A_1340.
Minerals 12 00324 g010
Figure 11. Image of optical microscopy of P265A_1340.
Minerals 12 00324 g011
Figure 12. Image of optical microscopy of P71A_1450.
Minerals 12 00324 g012
Figure 13. Image of optical microscopy of P71A_1340.
Minerals 12 00324 g013
Figure 14. Belite crystals with lamellas of P71A_1450.
Minerals 12 00324 g014
Figure 15. Round belite of P71A_1450 remained within alite crystals at 1700×.
Minerals 12 00324 g015
Figure 16. Analysis of amorphous phase of point “Spectrum 1” of Figure 15.
Minerals 12 00324 g016
Figure 17. EDS analysis for alite crystal of point “Spectrum 2” of Figure 15.
Minerals 12 00324 g017
Figure 18. EDS analysis for belite crystal of point “Spectrum 3” of Figure 15.
Minerals 12 00324 g018
Table 1. XRF analysis and LOI of raw materials.
OxidesConcentration (% wt.)
LimestoneShaleLavaWFAILS
CaO51.578.000.327.351.23
SiO24.2656.9796.9047.4629.20
Al2O30.7815.780.5127.573.48
Fe2O30.597.120.233.6959.20
MgO0.443.551.810.29
SO30.250.921.241.24
Na2O0.100.930.830.14
K2O0.164.210.000.810.88
CuO1.27
ZnO1.67
TiO20.690.620.27
MoO30.59
PbO0.000.16
BaO0.210.10
LOI40.932.500.848.81(−)6.72
Table 2. Designed compositions for the raw meals of P65A and P71A.
Raw MaterialsExperiments
(% wt.)P65AP71A
Limestone82.081.4
Shale7.511.9
Lava6.02.5
ILS2.51.8
WFA2.02.4
Table 3. Designed compositions of crystal phases for P65A and P71A based on Bogue equations.
Mineralogical Phases (% wt.)P65AP71A
C3S65.171.1
C2S19.710.8
C4AF12.411.9
C3A3.36.6
% LSF92.2996.88
AM0.941.28
SM3.022.51
Table 4. Free lime (f(CaO)), fineness (Blaine) and specific weight (Wsp) of the studied clinkers.
ExperimentP65A_1450P165A_1340P265A_1340P71A_1450P71A_1340CEM I 42.5Ν
f (CaO)%0.41.62.60.61.60.6
Blaine (cm2/g)302029203030303030103000
Wsp (g/cm3)3.223.203.233.203.183.16
Table 5. XRF results for the clinkers of P65A, P71A and CEM I 42.5Ν.
OxidesConcentration (% wt.)
P65AP71ACEM I 42.5Ν
SiO222.622.021.1
Al2O34.34.94.7
Fe2O33.84.14.0
CaO67.266.465.7
MgO1.01.21.1
SO30.20.21.5
K2O0.70.90.7
Na2O0.20.30.2
Table 6. Main crystallographic phases of clinkers by Bogue predictions and Rietveld results by Q-XRD.
Mineralogical PhasesP65AP65A_1450P165A_1340P265A_1340P71AP71A_1450P71A_1340CEM I 42.5Ν
(% wt.)BogueRietveldBogueRietveldRietveld
C3S65.174.459.949.471.174.063.167.8
αH–C2S7.010.526.65.212.90.5
β–C2S1.00.54.10.01.012.8
γ–C2S0.12.20.00.00.50
C2S (total)19.78.113.230.710.85.214.413.3
C4AF12.410.014.614.311.912.410.813.2
C3A3.32.72.70.56.67.34.51.4
Table 7. Strength results of the produced cement specimens. Characteristic values of CEM I 42.5N and CEM I 52.5N [57] cement classes are also presented.
Time (Days)Compressive Strength (MPa)
P65A_1450P165A_1340P265A_1340P71A_1450P71A_1340CEM I 42.5NCEM I 42.5N [57]CEM I 52.5N [57]
212.517.012.317.517.619.7≥10 ± 2≥20 ± 2
728.631.823.032.239.132.6--
2846.248.044.543.352.742.242.5 ± 2.5 ≤ S ≤ 62.5≥52.5 ± 2.5
Table 8. EDS analysis of amorphous phase of point “Spectrum 1” of Figure 15.
ElementApp/ConcIntensity Corrn.Weight%Weight% SigmaAtomic%Compd%FormulaNumber of Ions
Na0.420.60890.620.390.720.84Na2O0.11
Mg0.850.58691.310.281.432.17MgO0.21
Al8.810.701111.400.4911.2621.54Al2O31.69
Si1.680.75342.030.271.924.34SiO20.29
K1.651.16291.290.330.881.55K2O0.13
Ca36.331.048531.440.8720.9143.99CaO3.13
Fe18.480.843319.881.459.4925.58FeO1.42
O 32.041.0653.38 8.00
Totals 100.00 Cation sum6.99
Table 9. EDS analysis for alite crystal of point “Spectrum 2” of Figure 15.
ElementApp/Conc.Intensity Corrn.Weight%Weight% SigmaAtomic%Compd%FormulaNumber of Ions
Na K0.100.68960.150.340.170.20Na2O0.02
Mg K0.260.65960.420.210.440.70MgO0.06
Al K1.060.78331.420.221.342.68Al2O30.19
Si K10.420.929911.790.4010.6825.22SiO21.54
K K0.421.19160.370.320.240.44K2O0.03
Ca K46.361.040646.901.0029.7565.62CaO4.28
Fe K3.070.80993.991.411.825.14FeO0.26
O 34.960.9455.57 8.00
Totals 100.00 Cation sum6.40
Table 10. EDS analysis for belite crystal of point “Spectrum 3” of Figure 15.
ElementApp ConcIntensity Corrn.Weight%Weight% SigmaAtomic%Compd%FormulaNumber of Ions
Na K0.270.70200.430.330.470.58Na2O0.07
Mg K0.020.66670.030.220.030.04MgO0.00
Al K1.520.79482.140.271.984.04Al2O30.28
Si K11.000.929813.190.4311.7728.22SiO21.67
K K1.081.17281.030.330.661.24K2O0.09
Ca K39.951.030843.230.9727.0260.49CaO3.84
Ti K0.340.72810.520.400.270.87TiO20.04
Fe K2.560.81073.521.411.584.53FeO0.22
O 35.920.9856.23 8.00
Totals 100.00 Cation sum6.23
Publisher’s Note: MDPI stays neutral with regard to jurisdictional claims in published maps and institutional affiliations.

