Article

Quantification of Lithium and Mineralogical Mapping in Crushed Ore Samples Using Laser Induced Breakdown Spectroscopy

1
ELEMISSION Inc., 3410, Thimens Blvd., Montréal, QC H4R 1V6, Canada
2
Département de Géologie et de Génie Géologique, Université Laval, 1065 Avenue de la Médecine, Québec, QC G1V 0A6, Canada
3
Optics Laboratory, INPT, Avenue Allal Al Fassi, Rabat, Morocco
*
Author to whom correspondence should be addressed.
Minerals 2022, 12(2), 253; https://doi.org/10.3390/min12020253
Submission received: 17 January 2022 / Revised: 2 February 2022 / Accepted: 13 February 2022 / Published: 16 February 2022

Abstract

:
This article reports on the quantification of lithium and mineralogical mapping in crushed lithium ore by laser-induced breakdown spectroscopy (LIBS) using two different calibration methods. Thirty crushed ore samples from a pegmatite lithium deposit were used in this study. Representative samples containing the abundant minerals were taken from these crushed ores and mixed with resin to make polished disks. These disks were first analyzed by TIMA (TESCAN Integrated Mineral Analyzer) and then by a LIBS ECORE analyzer to determine the minerals. Afterwards, each of the thirty crushed ore samples (<10 mm) were poured into rectangular containers and analyzed by the ECORE analyzer, then mineral mapping was produced on the scanned surfaces using the mineral library established on the polished sections. For the first method the lithium concentrations were inferred from the empirical mineral chemistry formula, whereas the second one consisted of building a conventional calibration curve with the crushed material to predict the lithium concentration in unknown crushed materials.

1. Introduction

The mining industry is faced with the challenge of improving the success rate of discoveries while reducing costs at a time when future mineral reserves come, for example, from deeper, lower-grade deposits or from mining processes with more complex extraction and processing. To meet these challenges and respond to society’s demands for critical and strategic metals, new methodologies and technologies are required [1]. The increased future demand for lithium, a critical and strategic metal, results from the rapid emergence of technological sectors related to renewable energies and transportation [1]. In 2020, 71% of the world’s lithium consumption was used for the manufacture of lithium-ion batteries [2]. Lithium is therefore a key metal, and its supply is a priority for high-tech companies in Asia, Europe and the United States. In Australia, the development of the mining industry for the exploration, extraction and concentration of lithium from pegmatites deposits has made this country the world’s leading producer [2,3].
This article proposes an ultra-fast and inexpensive automated method of instrumental analysis that will accelerate decision-making in lithium exploration and exploitation. To this end, recent advances in laser-induced breakdown spectroscopy (LIBS) allows the quantitative measurement of the elemental composition of ores and rocks, as well as elemental and mineralogical imaging both in the laboratory [4,5,6,7] and in a field setting [8,9,10]. Using a laser, plasma is created on the surface of materials. This plasma interacts with the sample by the ablation of a small amount of material and the resulting optical emissions related to the de-excitation of the plasma are collected and then a spectrum is plotted. Each chemical element emits at specific wavelengths and the intensity of the emission is directly related to the elemental concentration [7]. The analysis of a wide range of chemical elements is possible using LIBS. Moreover, only LIBS can provide simultaneous rapid quantitative measurements of lithium and other light elements (e.g., H, Be, B, C, O, F) [11]. Lithium in ores and minerals cannot be measured directly with conventional instrumental methods such as X-ray fluorescence spectrometry or scanning electron microscope techniques because the fluorescence yield is very low for Li and the matrix can absorb the Li-Kα wavelength. Although a stochiometric calculation of the chemical composition of Li-bearing minerals can be attained with SEM indirectly, direct microanalytical mapping of lithium can only be achieved with the use of specialized instruments such as secondary ion mass spectrometry (SIMS) [12]. In a pioneering study, Fabre et al. [13] demonstrated the potential of LIBS for measuring quantitatively lithium in Li-bearing minerals (spodumene and petalite) and other geological materials by fusing SiO2 at 1300 °C the samples and reference standards. This was followed by the work of Fabre et al. [14], Sweetapple et al. [15], and more recently Ytsma and Dyar [11], Lawley et al. [16], Romppanen et al. [17] using laboratory or field portable instruments. A series of LIBS laboratory instruments (CORIOSITY and ECORE) have been developed for chemical and mineralogical characterization, and readers are referred to the variety of applications that have recently been published [18,19,20,21,22,23].
Mineral resource evaluations of lithium pegmatite deposits are usually calculated at a cut-off grade of 0.4 to 0.6% Li2O (0.19–0.28% Li) with reported average ore grades ranging from 1% and up to 3% Li2O (0.46–1.4% Li) [1,2,24,25,26,27,28]. This range of lithium concentrations will be used for establishing the calibration curves. Mineral processing generally aims at producing a spodumene mineral concentrate of ~6% Li2O (2.79% Li).
By providing a real-time Li concentration analysis during mining operations, LIBS can help minimize operating costs and therefore increase the overall competitiveness of mining companies. Our method should allow the rapid identification of ore and waste rock and also the quantification of lithium in spodumene versus other lithium-bearing minerals. This enables better performance of the process plant as each lithium mineral requires different operation parameters and therefore better recovery is achieved. In addition, the sum of detailed mineralogical information should facilitate the environmental management of tailings resulting from mining as well as environmentally friendly mining site rehabilitation. To the best of our knowledge, this is the first demonstration that LIBS can be used to quantify lithium contained directly in crushed pegmatite ore. This high throughput analysis study opens the door to real-time process monitoring of the feeds in ore processing facilities.

2. Materials and Methods

2.1. Crushed Lithium Ore Samples

Thirty crushed lithium ore samples were provided by AXT Pty collected from Pilbara minerals mine located in Australia. Each sample weighs between 3–5 kg. The grain size of those crushed ores ranged between 0.1 and 10 mm. Table 1 shows the concentration of lithium for each of the 30 samples, obtained by Inductively coupled plasma–atomic emission spectroscopy (ICP-AES). Initially, some of the thirty crushed materials composed of minerals were put into resin to make polished sections in order to be analyzed by the automated mineralogy technique TIMA (TESCAN, Brno, Czech Republic), the diameter of those polished sections was 25.5 mm. These polished sections were subsequently coated with a nanometric carbon layer prior to SEM. They were analyzed using TIMA to determine the abundant minerals in the crushed lithium ores.

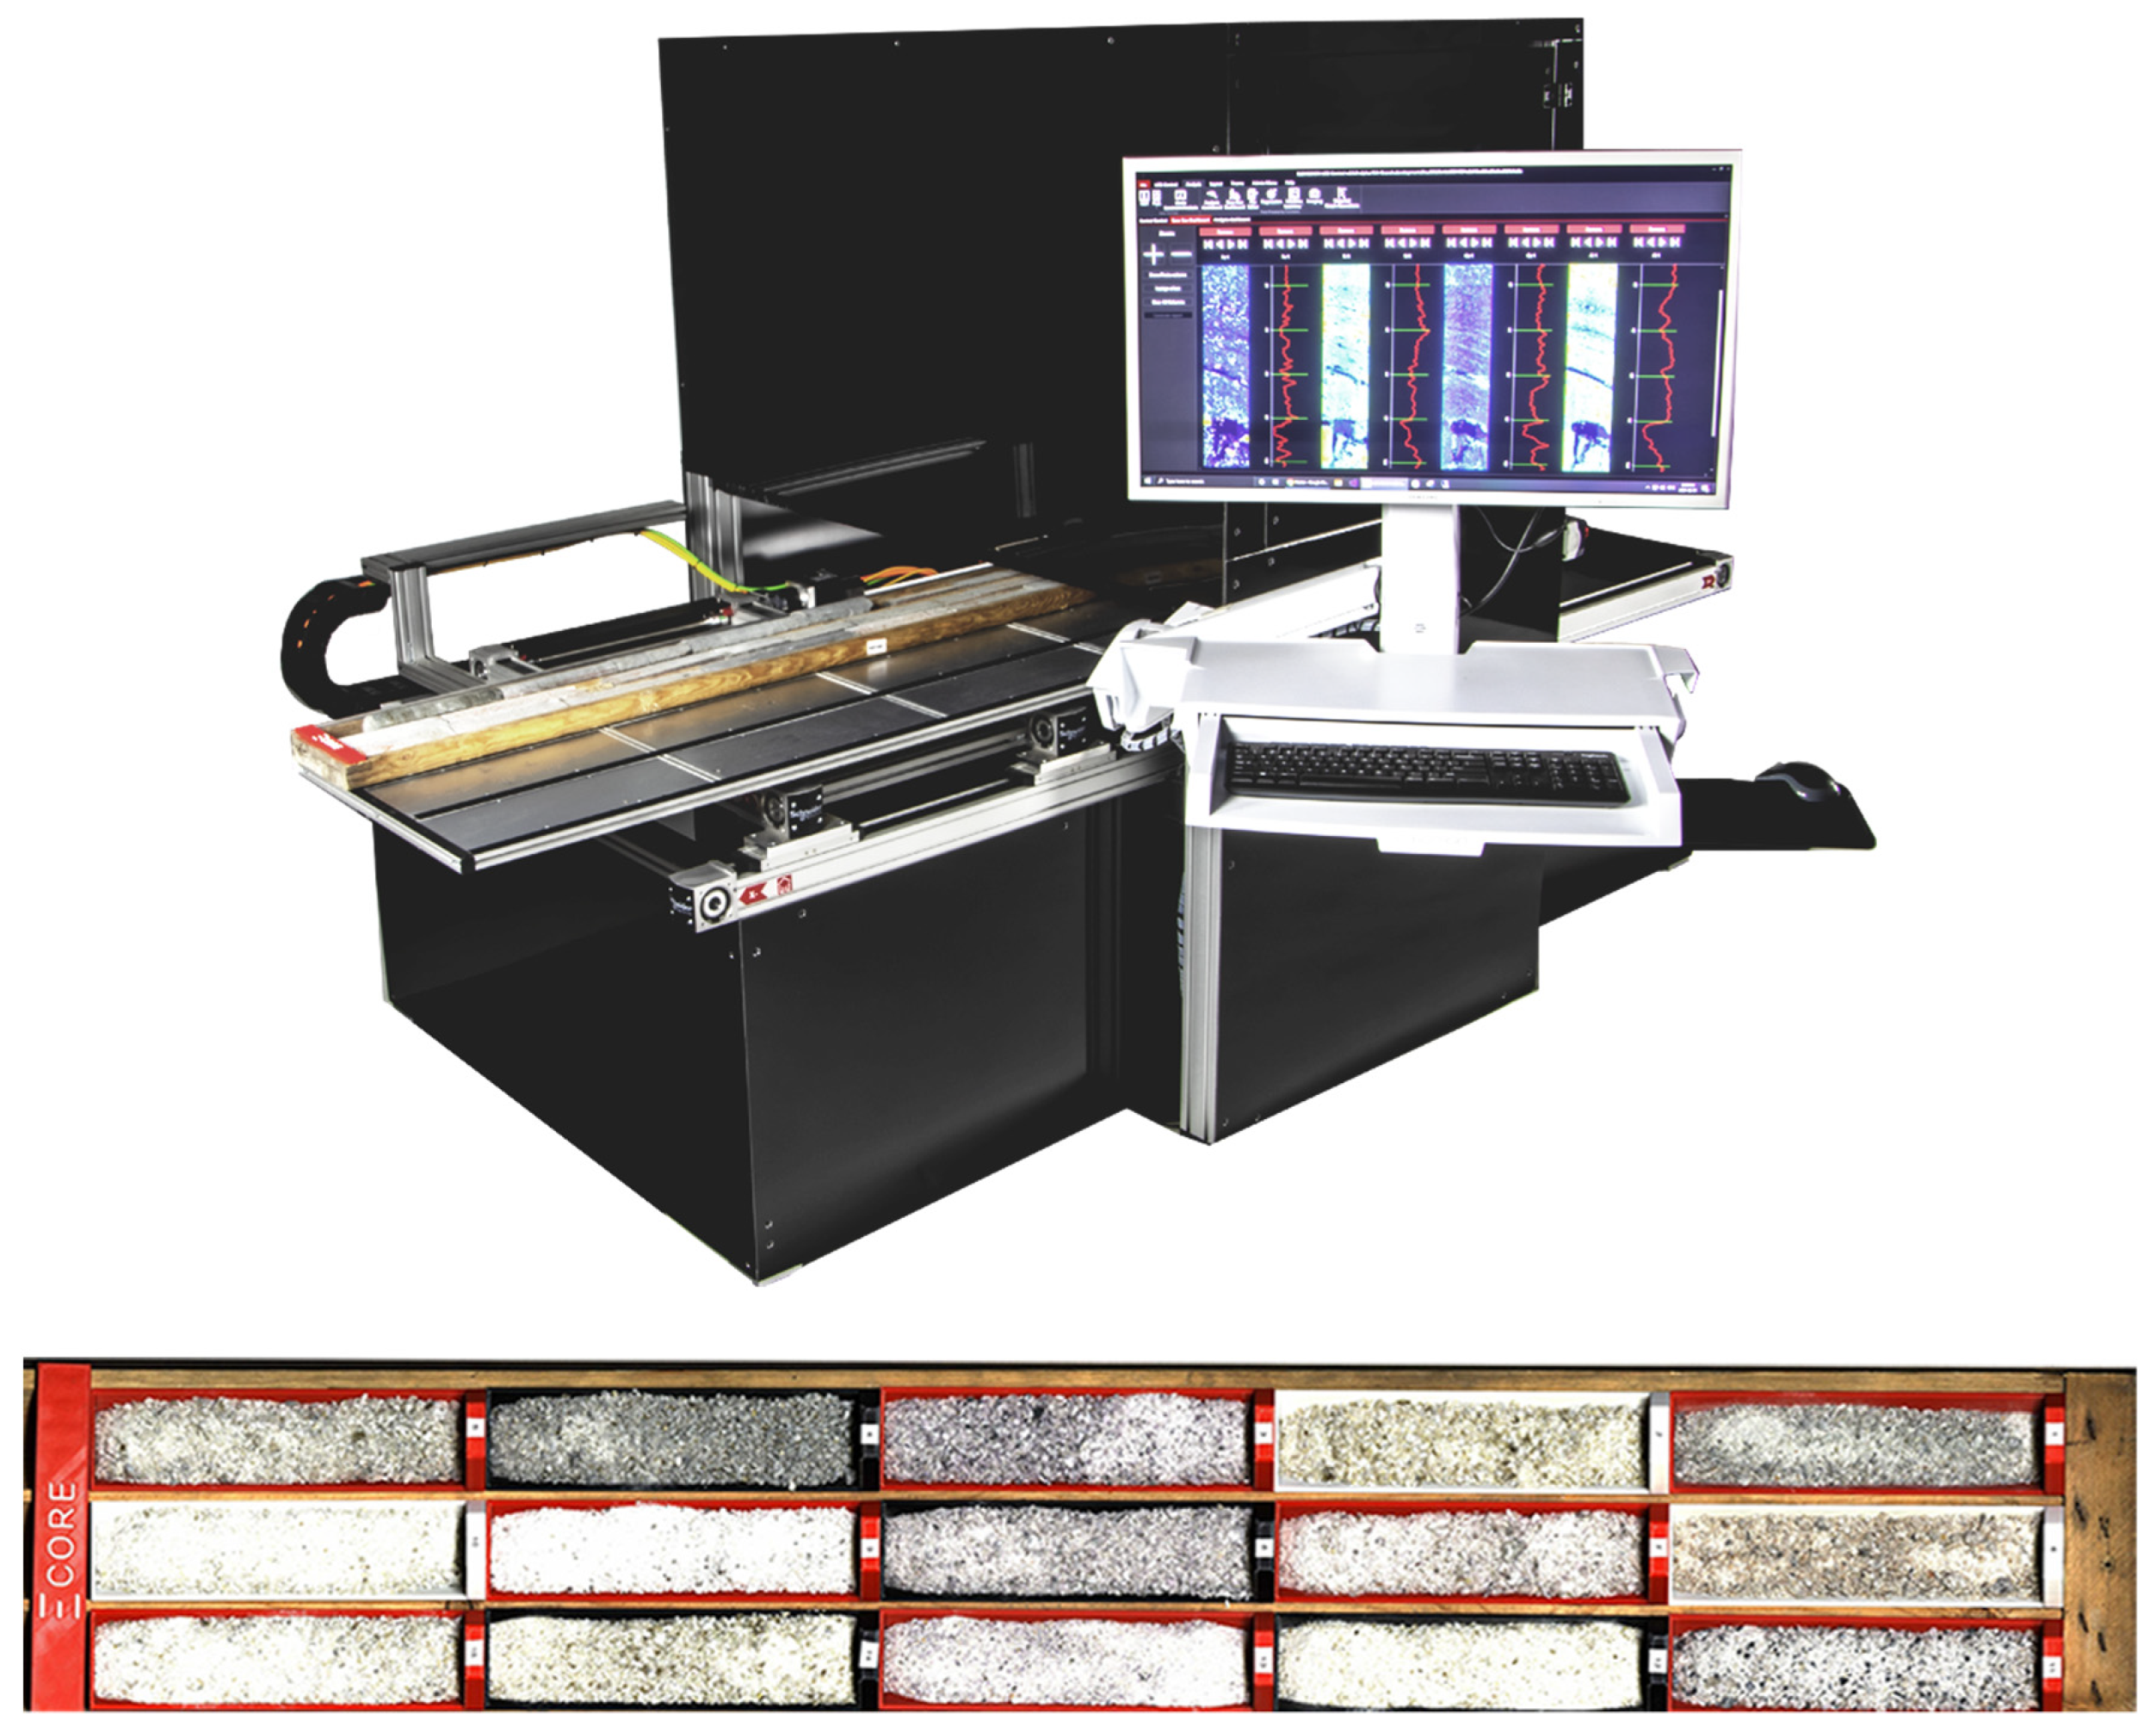
2.2. ECORE LIBS Analyzer

In this study, all the LIBS experiments were performed using LIBS ECORE drill core analyzer manufactured by ELEMISSION Inc. (Montréal, QC, Canada) as shown in Figure 1. The ECORE analyzer is a fully automated commercial drill core scanner instrument that integrates electronics, the laser source, the spectrometer, the 2-axis translation table. It can accept all type of drill core box and core sizes, cutting boats (up to 64 boats of 19 cm of length), and press pellets (between 300 and 600), and the ablation chamber. This system is also equipped with a 3D laser profiling system to ensure the sample is positioned at the focal plane (minimum spot size) within a range of less than 30 µm precision ensuring an optimal positioning of the 6 mm Rayleigh zone (depth-of-field). When the laser fires on ore fragments that are out of the system depth-of-field, there is normally a little or no laser-induced plasma generated. In practice, this is characterized by nearly flat baseline spectra and the data are not considered by the software as XY pixels with no data in the hyperspectral data cube. In addition, a high-resolution optical camera and high-intensity LEDs give the end-user a fast and high-fidelity picture of the full core tray to be added to the LIBS-generated images.
The laser-induced plasma emission is collected by standard achromatic lenses to warrant a minimum chromatic shift over the entire spectrum. The sensitivity on a wide bandwidth is consequently enhanced. The optical signal is then spectrally resolved using an optical spectrometer that covers 220 to 950 nm. The spectrometer is equipped with a CMOS detector which is controlled by proprietary ultrafast electronics. The unique custom electronics allow a camera readout of 1000 full frames per second. The ELEDIT software which control the ECORE is equipped with a machine learning artificial intelligence algorithm allowing the identification of minerals of the analyzed samples, it also allows the establishing of uni and multi-variate calibration curves of the desired chemical element. In the undergoing work 15 boats were put on the tray of ECORE to be analyzed, once the scan is done another 15 boats were then analyzed and so on.
For each sample of the thirty crushed ores, a sub-sample of approximately 180 g was taken and spread into a rectangular container having dimensions of 19 × 4.7 cm2, those sub-samples will be identified as the calibration set from now on. A scan of 25 × 25 mm2 with a step size of 0.1 mm (with a laser spot of 50 µm in diameter) was performed on the surface of each sample from the calibration set using the ECORE, then the translation plate was moved 25 mm and a new scan on the adjacent area performed. This procedure was repeated 6 times covering a total scanned area of 25 × 150 mm2 per container and resulting in 378,006 laser shots and spectra per sample scan. Using the ECORE scanning speed of 1000 Hz, about 6.3 min were needed for each sample scanned. It is important to note that for development purposes the reference samples were largely oversampled to learn about the non-uniformity of crushed ore which explains the relatively long analysis time of 6.3 min per sample. From the same crushed ore samples another 180 g were also taken and treated as unknown samples, those sub-samples will be identified as the validation set from now on. Each sample from the validation set was spread into the rectangular container described above, a scan area of 25 × 25 mm2 was randomly performed on the surface of each sample resulting in 63,001 laser shots and spectra per scan, in 1 min.

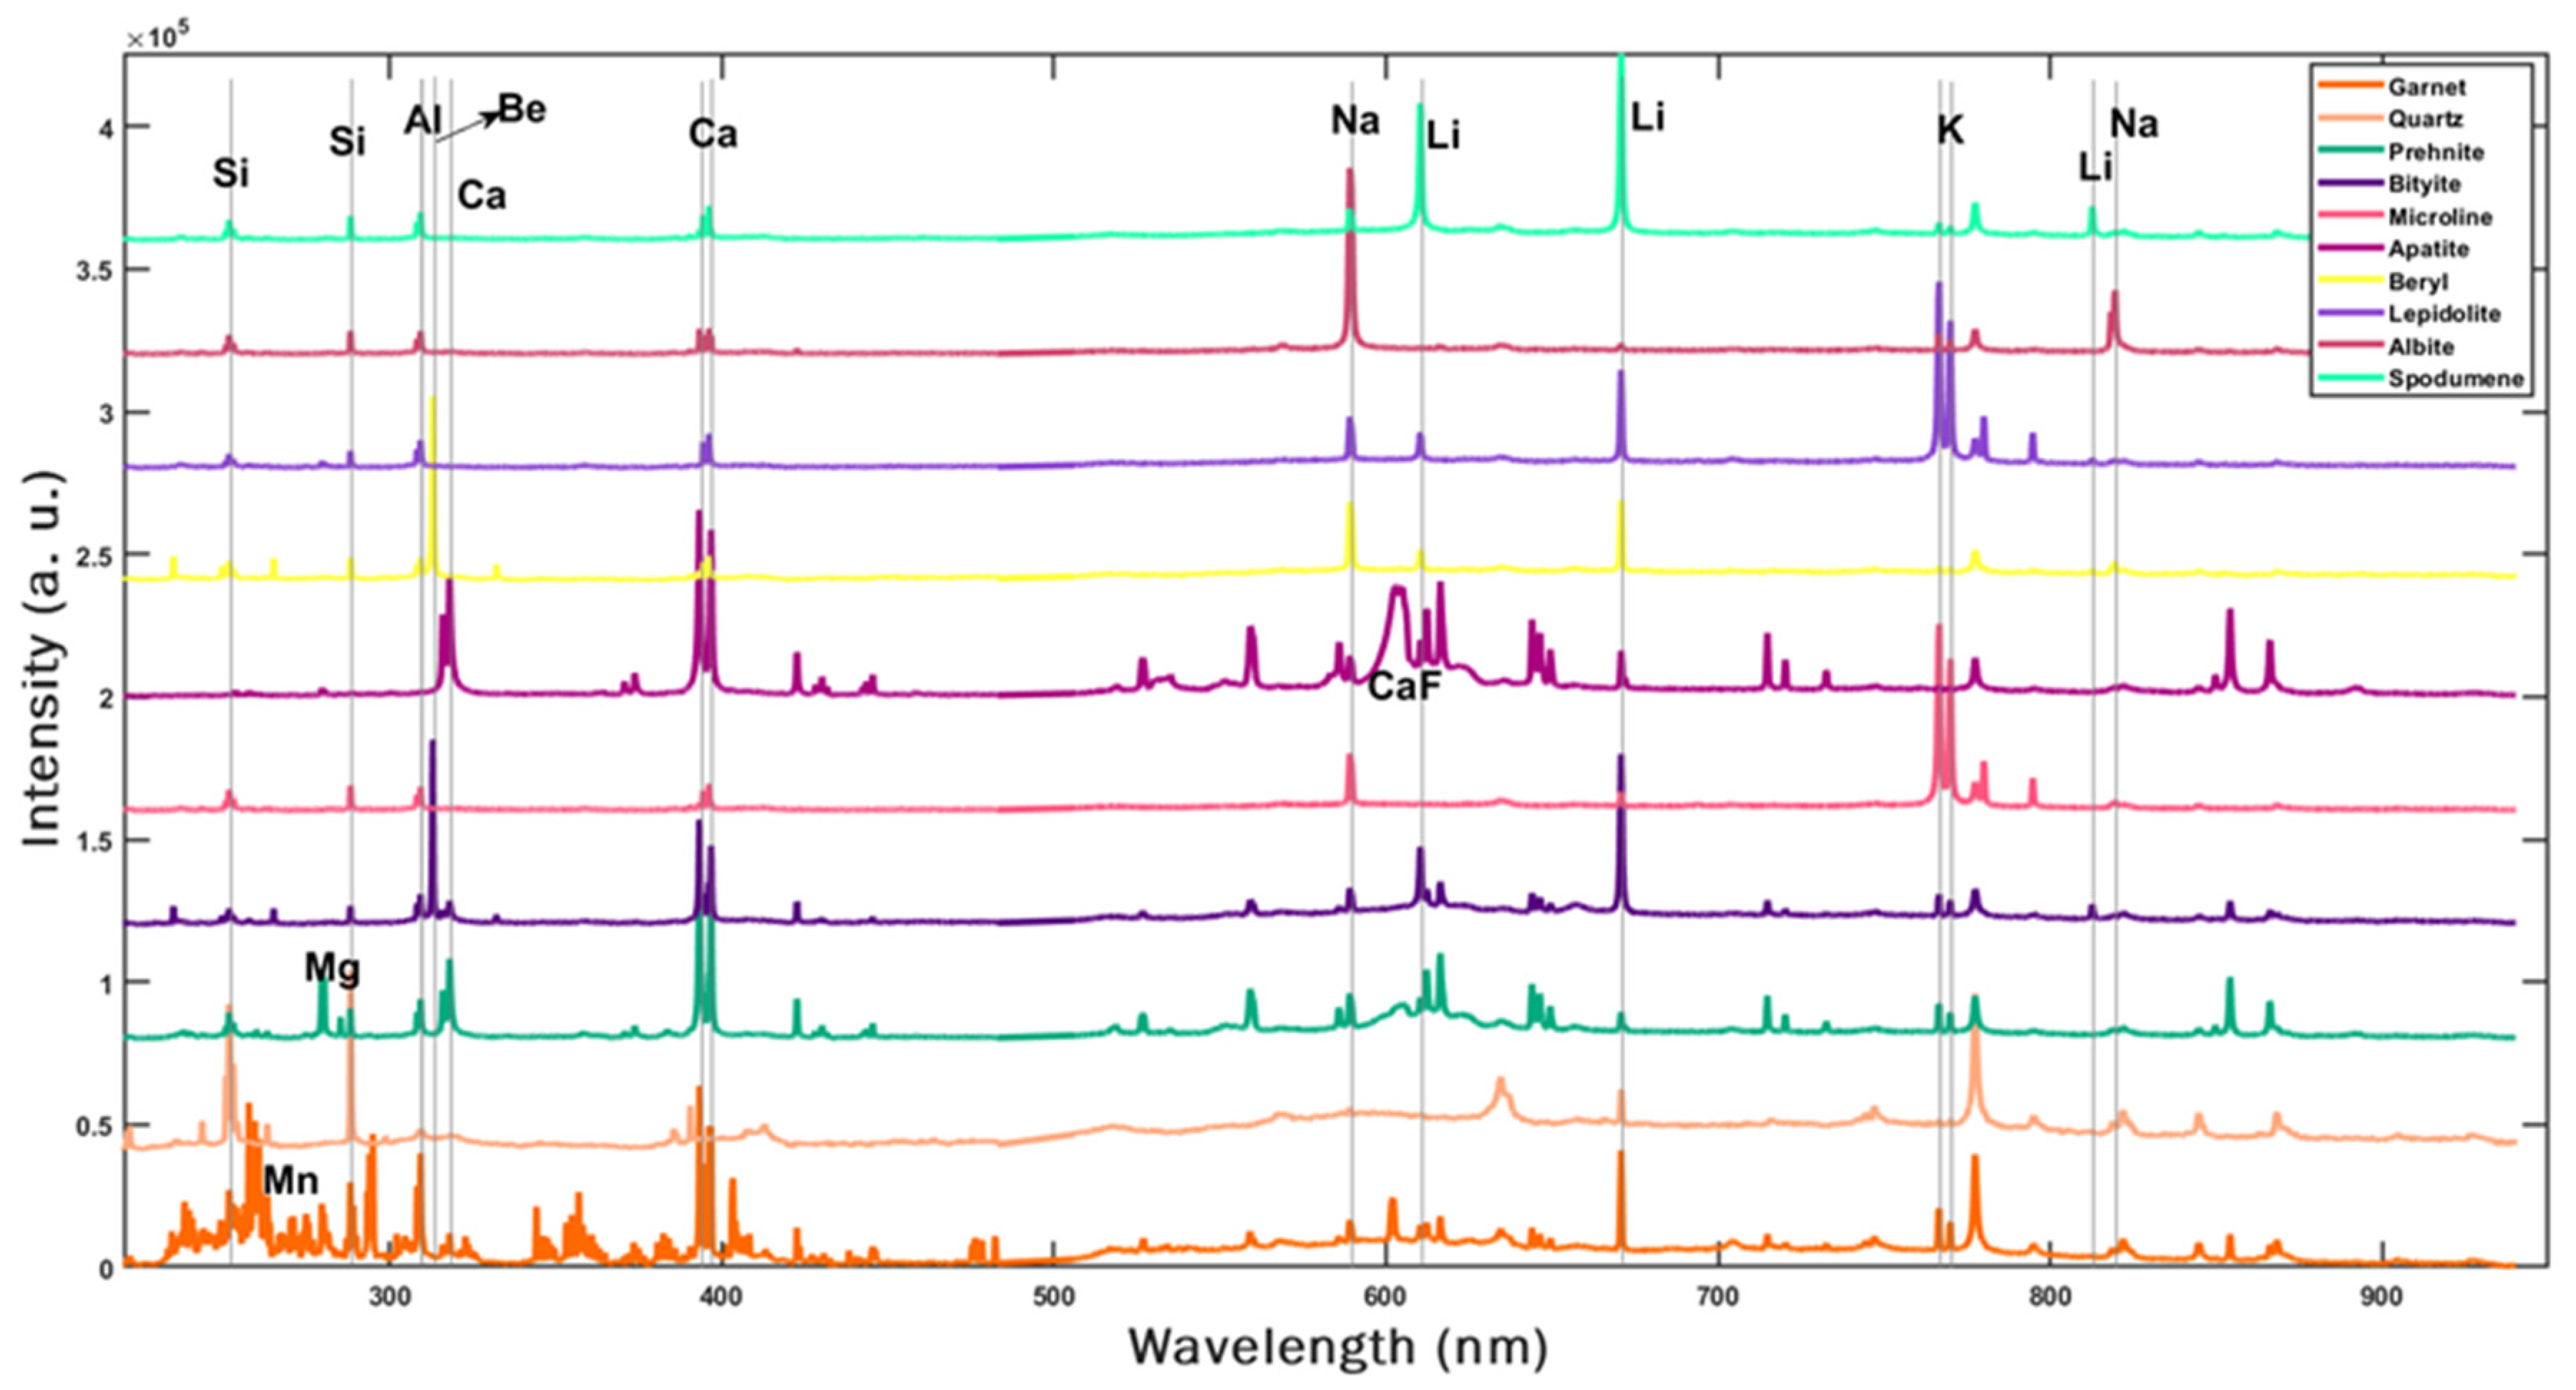
2.3. Quantitative Analysis and Data Processing

In this study, two different methods were used to provide quantitative analysis of lithium in crushed ore samples. For the first method the lithium concentrations were inferred from the empirical mineral chemical formula whereas the second one consisted of building a conventional calibration curve with the crushed material and then using it to predict the lithium concentration in unknown crushed materials. For the first method, the above-mentioned polished sections were analyzed by TIMA and the mineral distributions were provided, these polished sections were then scanned by the ECORE LIBS analyzer in order to determine the major minerals. Further reading on this mineral library calculation and instrument description can be found elsewhere [20,21,23]. Once the various minerals were defined, the samples of the calibration set spread in the rectangular containers were scanned and the modal distributions of minerals depicted. The empirical chemical formula of each mineral available on the Webmineral mineralogy database was then used to infer the concentration of lithium for each ore sample. However, for the second method, the samples of the calibration set were analyzed as described above and then a calibration, which related the lithium LIBS signals to its reference concentrations (ICP–AES) for each sample, was plotted. For univariate calibration of lithium, the emission net and emission intensity of the lithium peak (continuum corrected) have been used. This calibration was then used to predict lithium concentrations for the samples of the validation set analyzed in the same way.

3. Results and Discussion

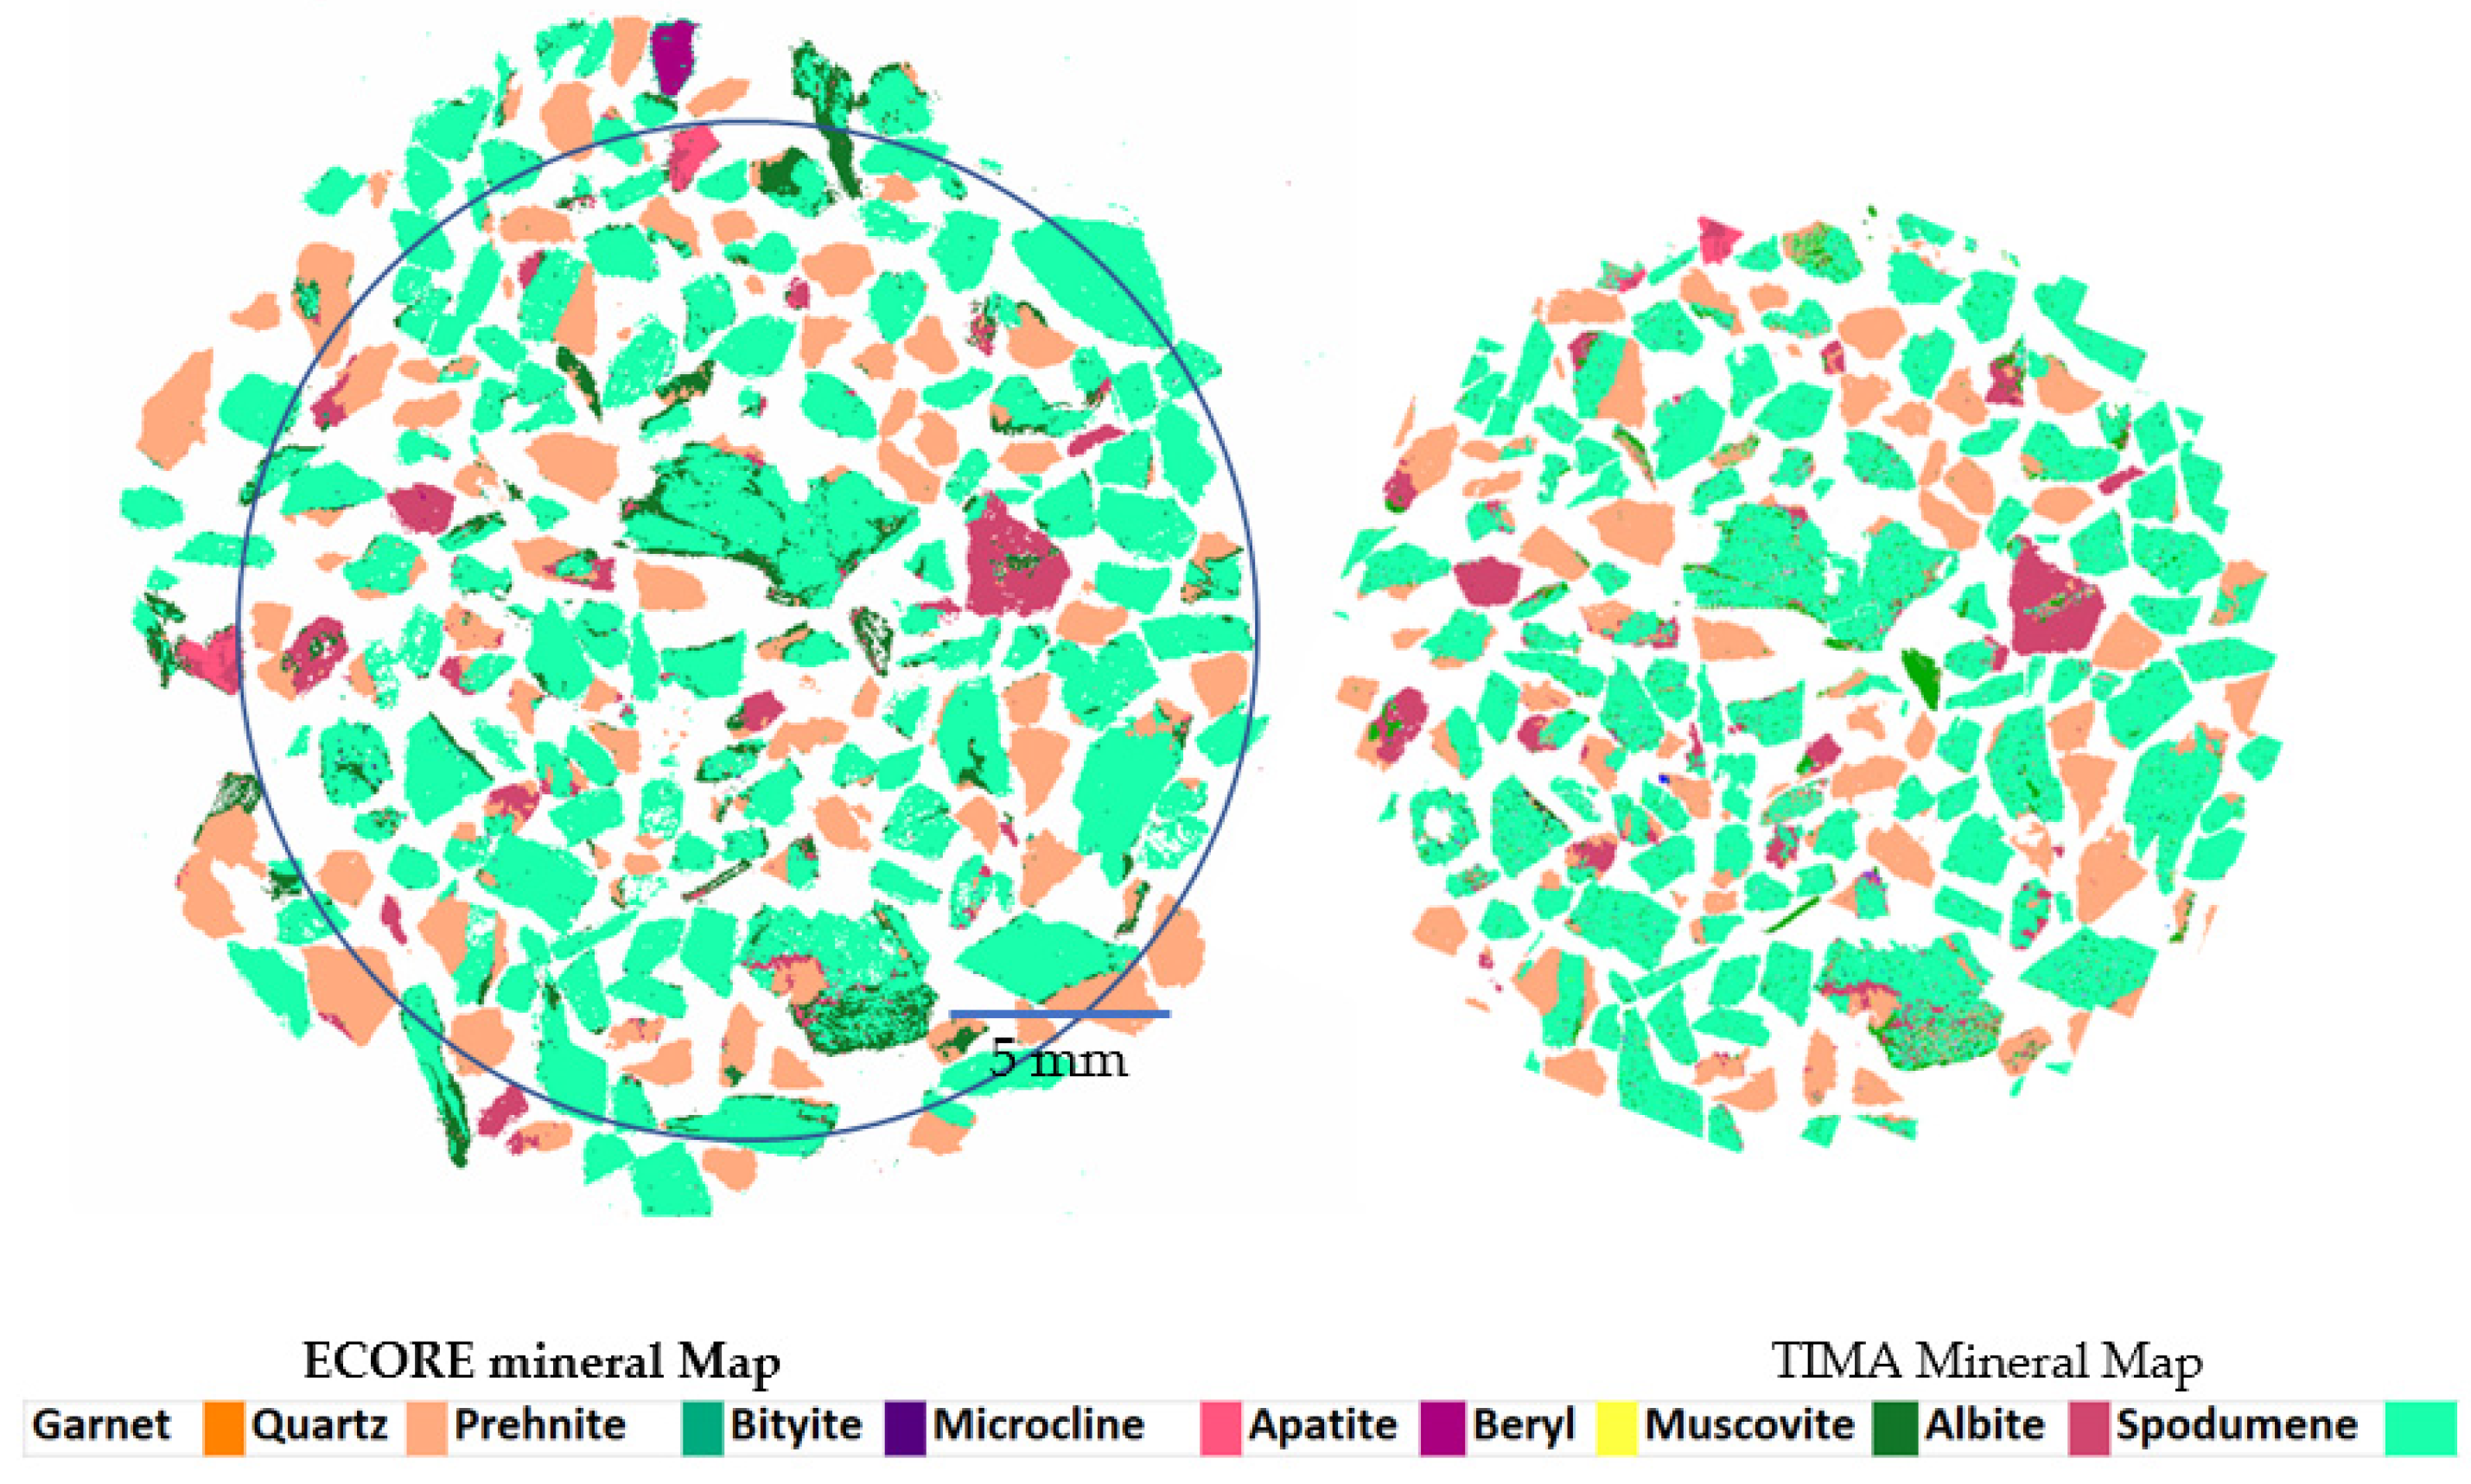
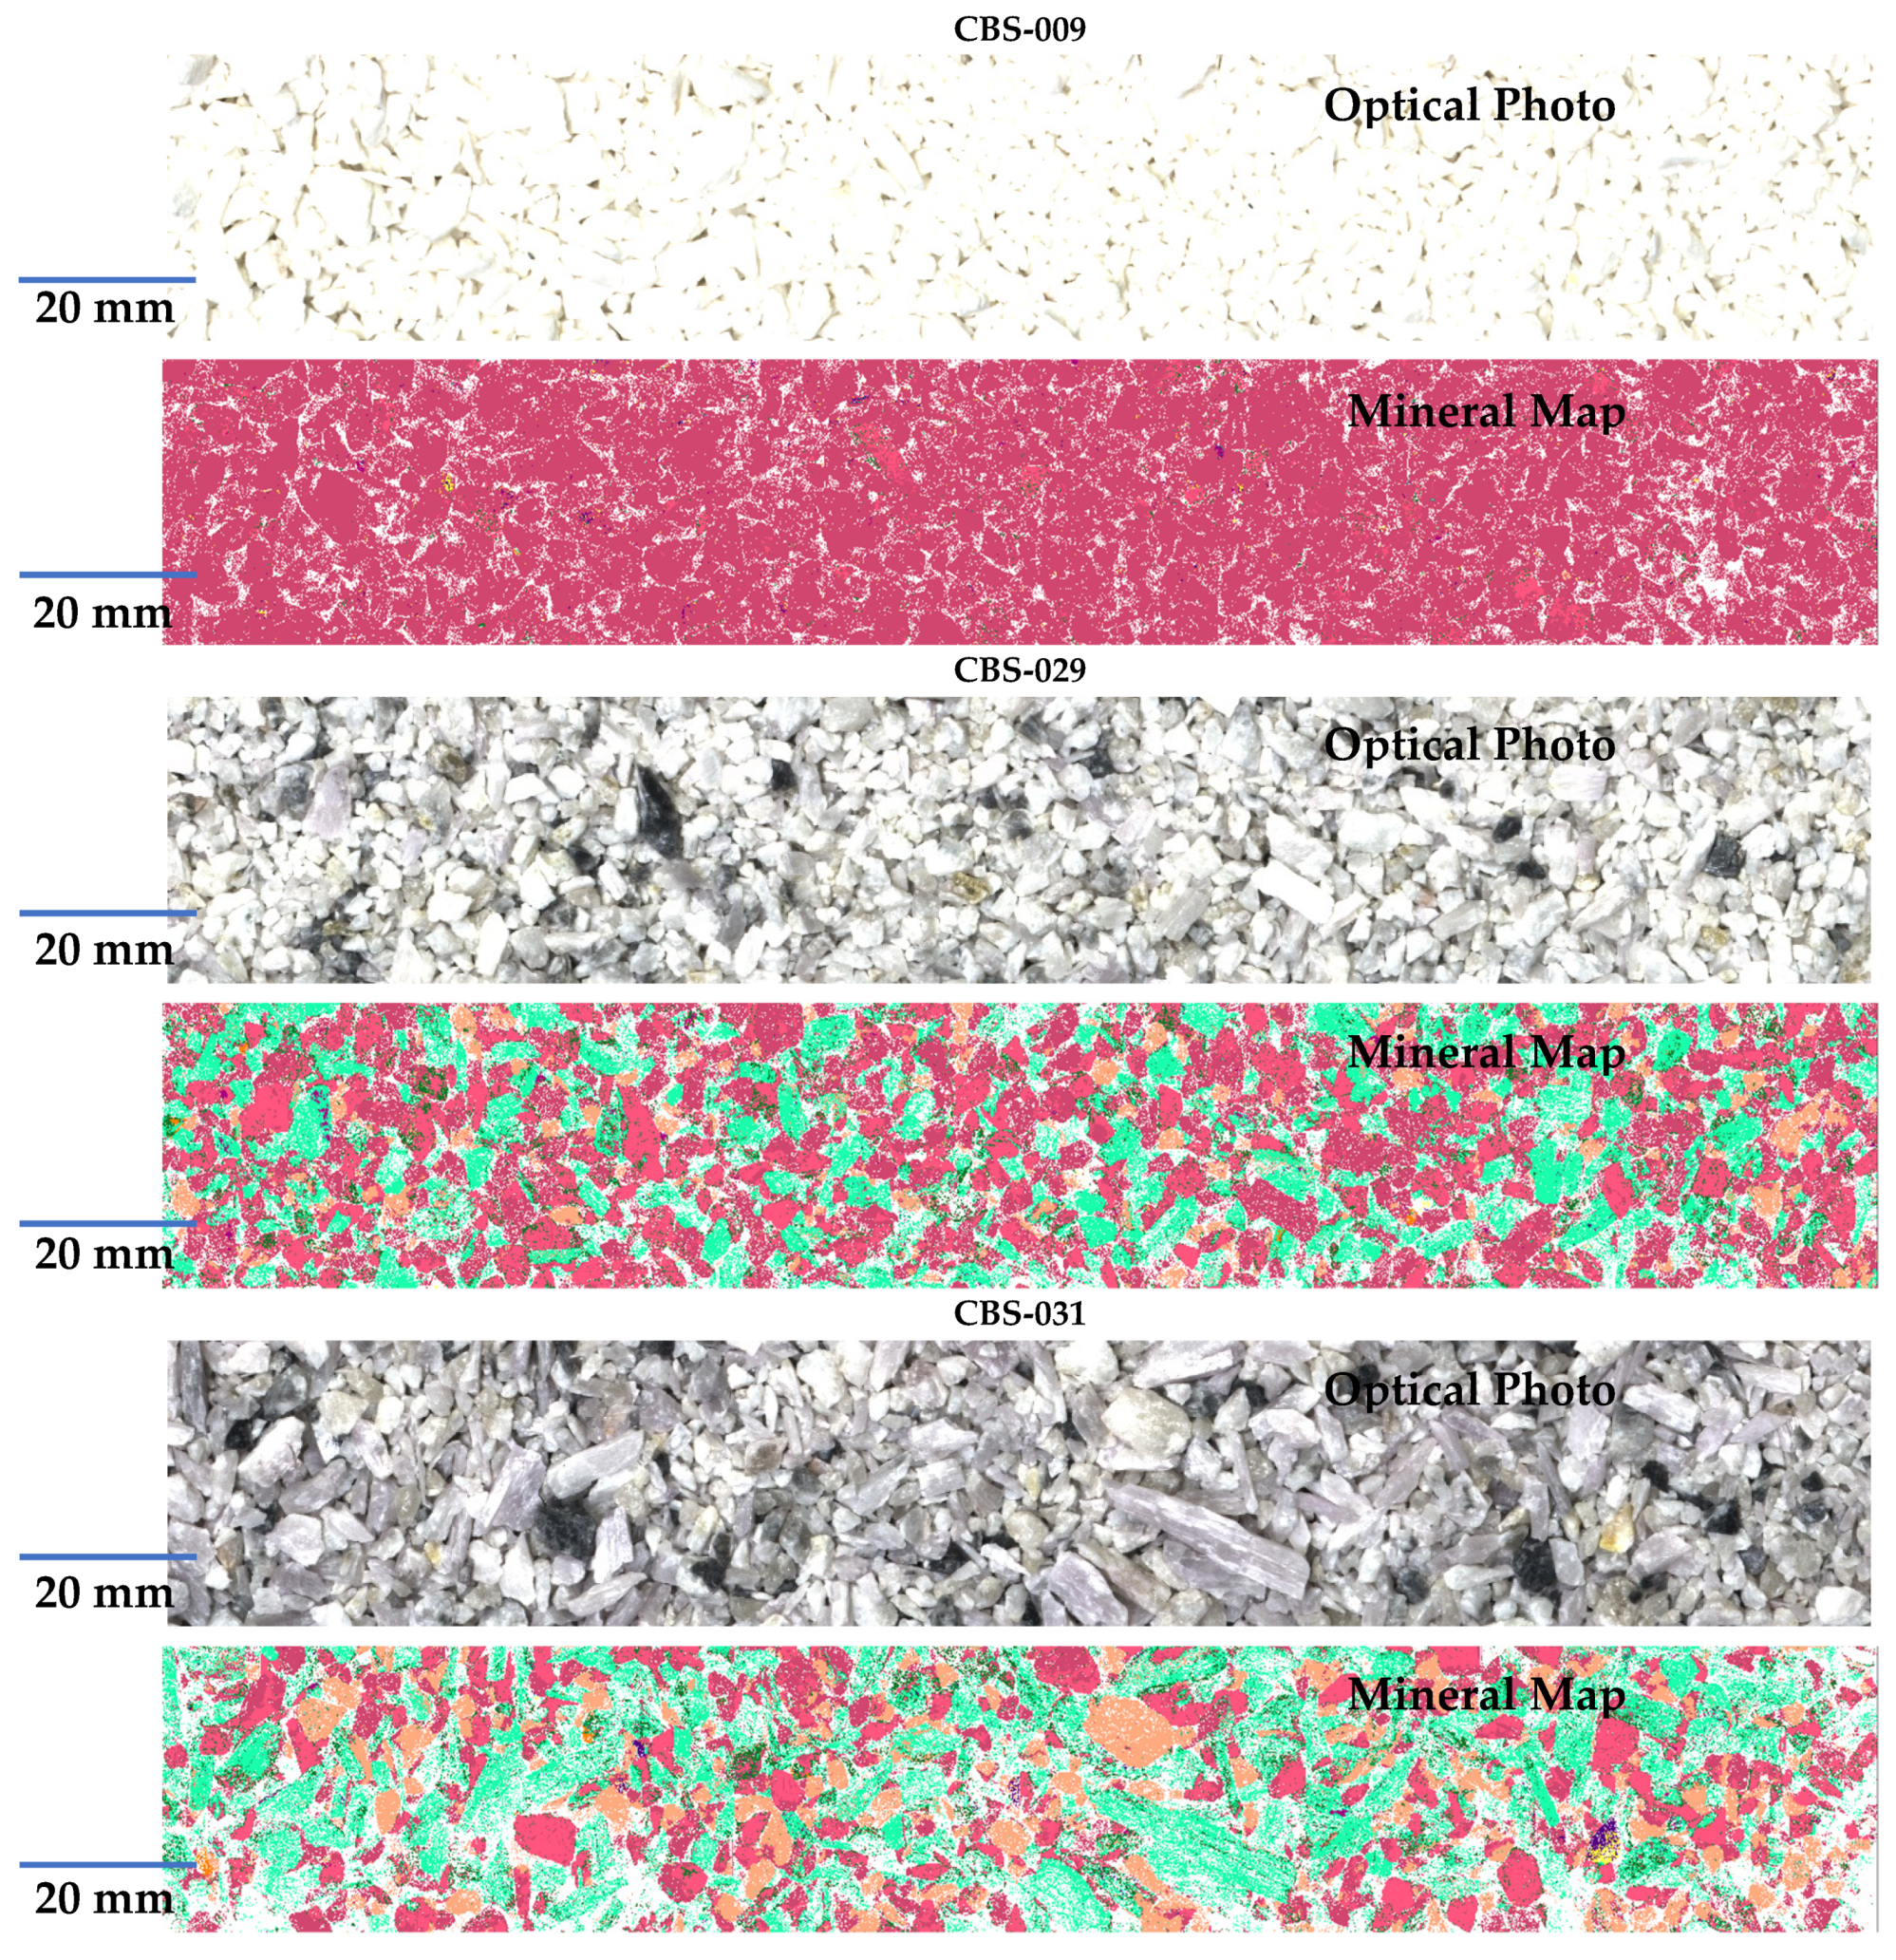
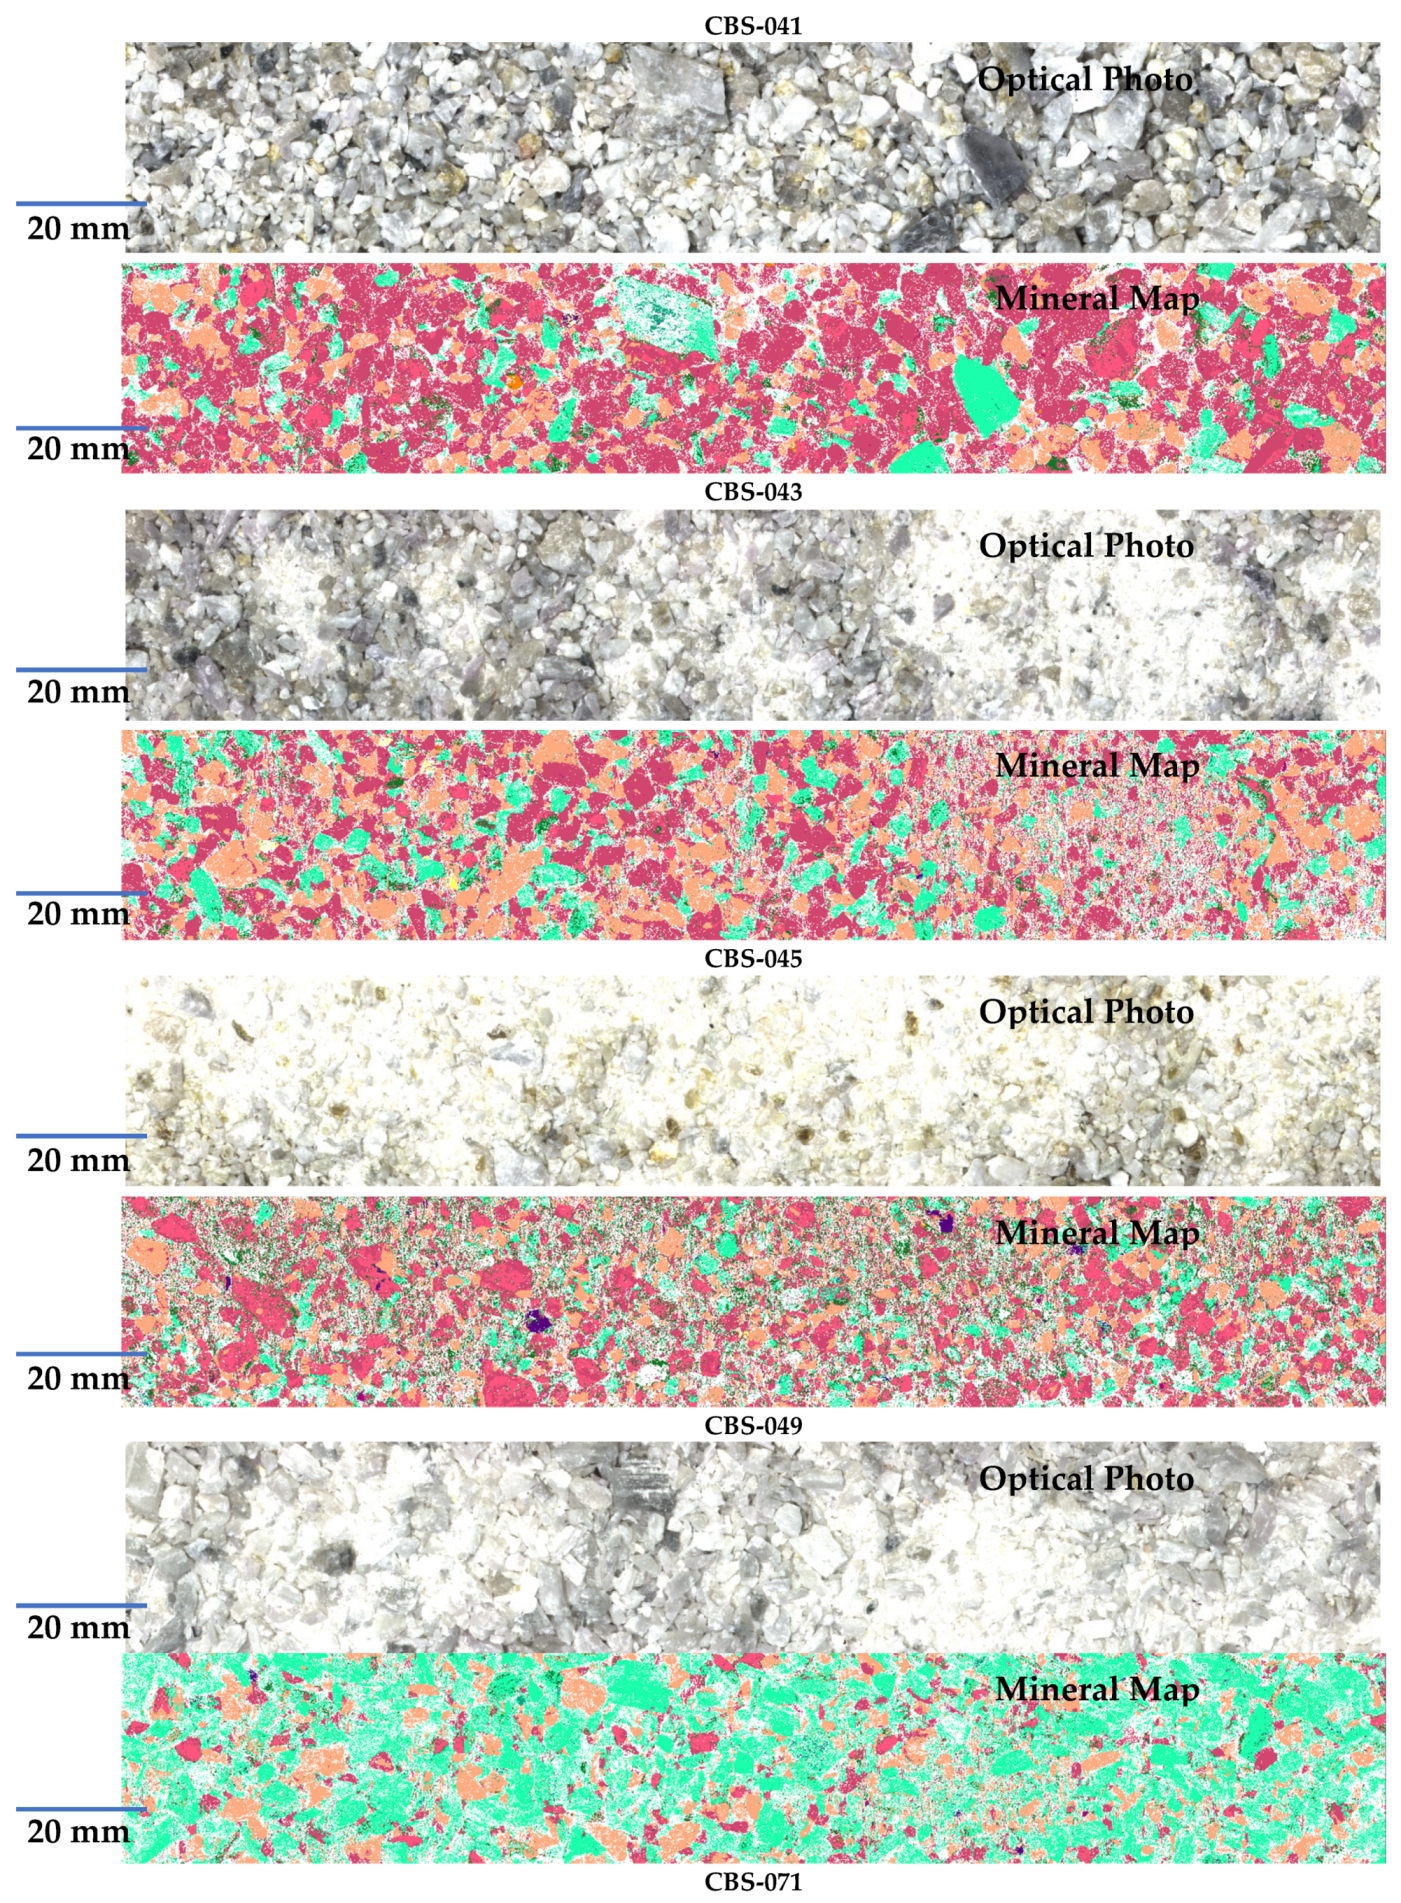
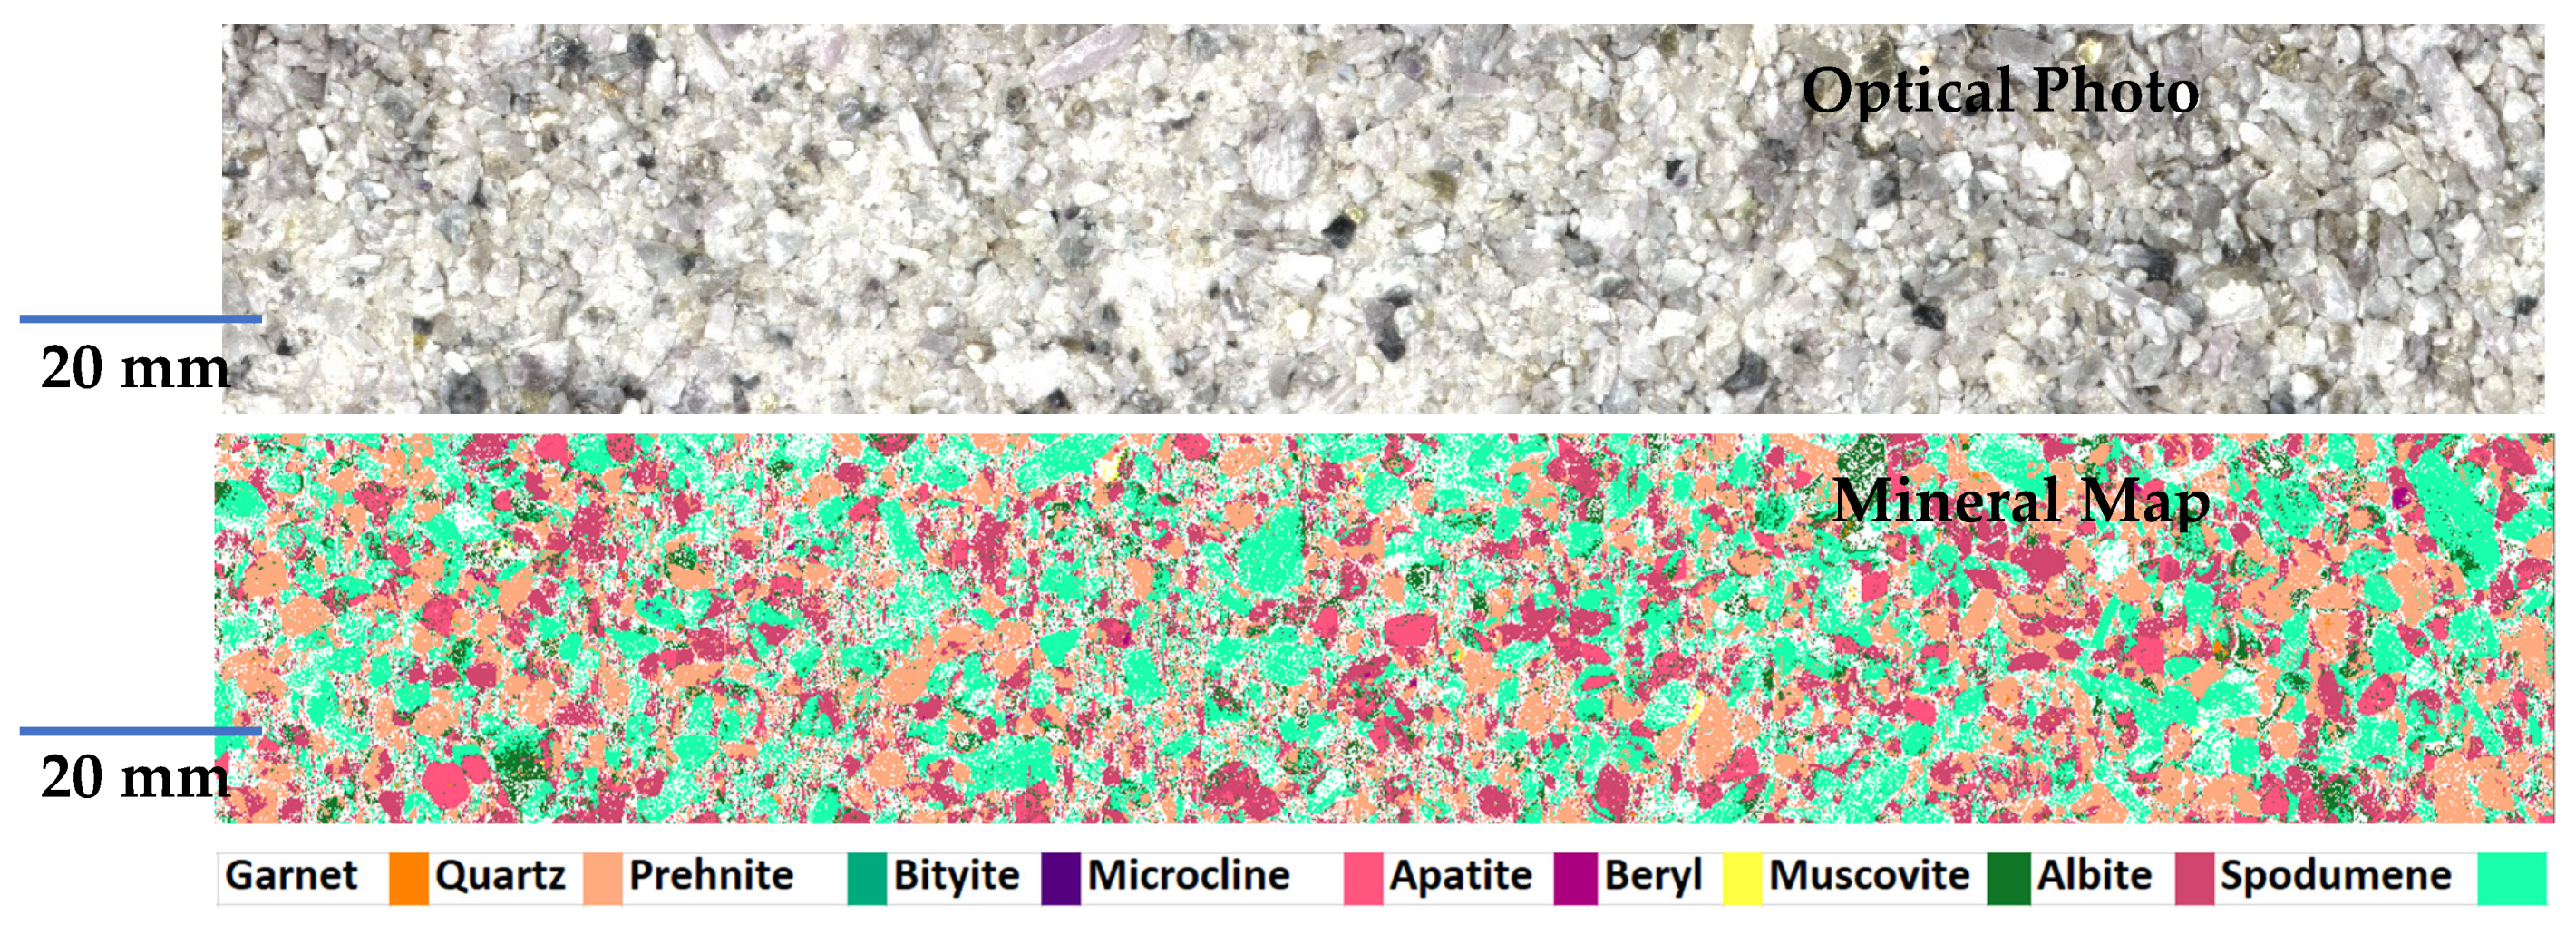
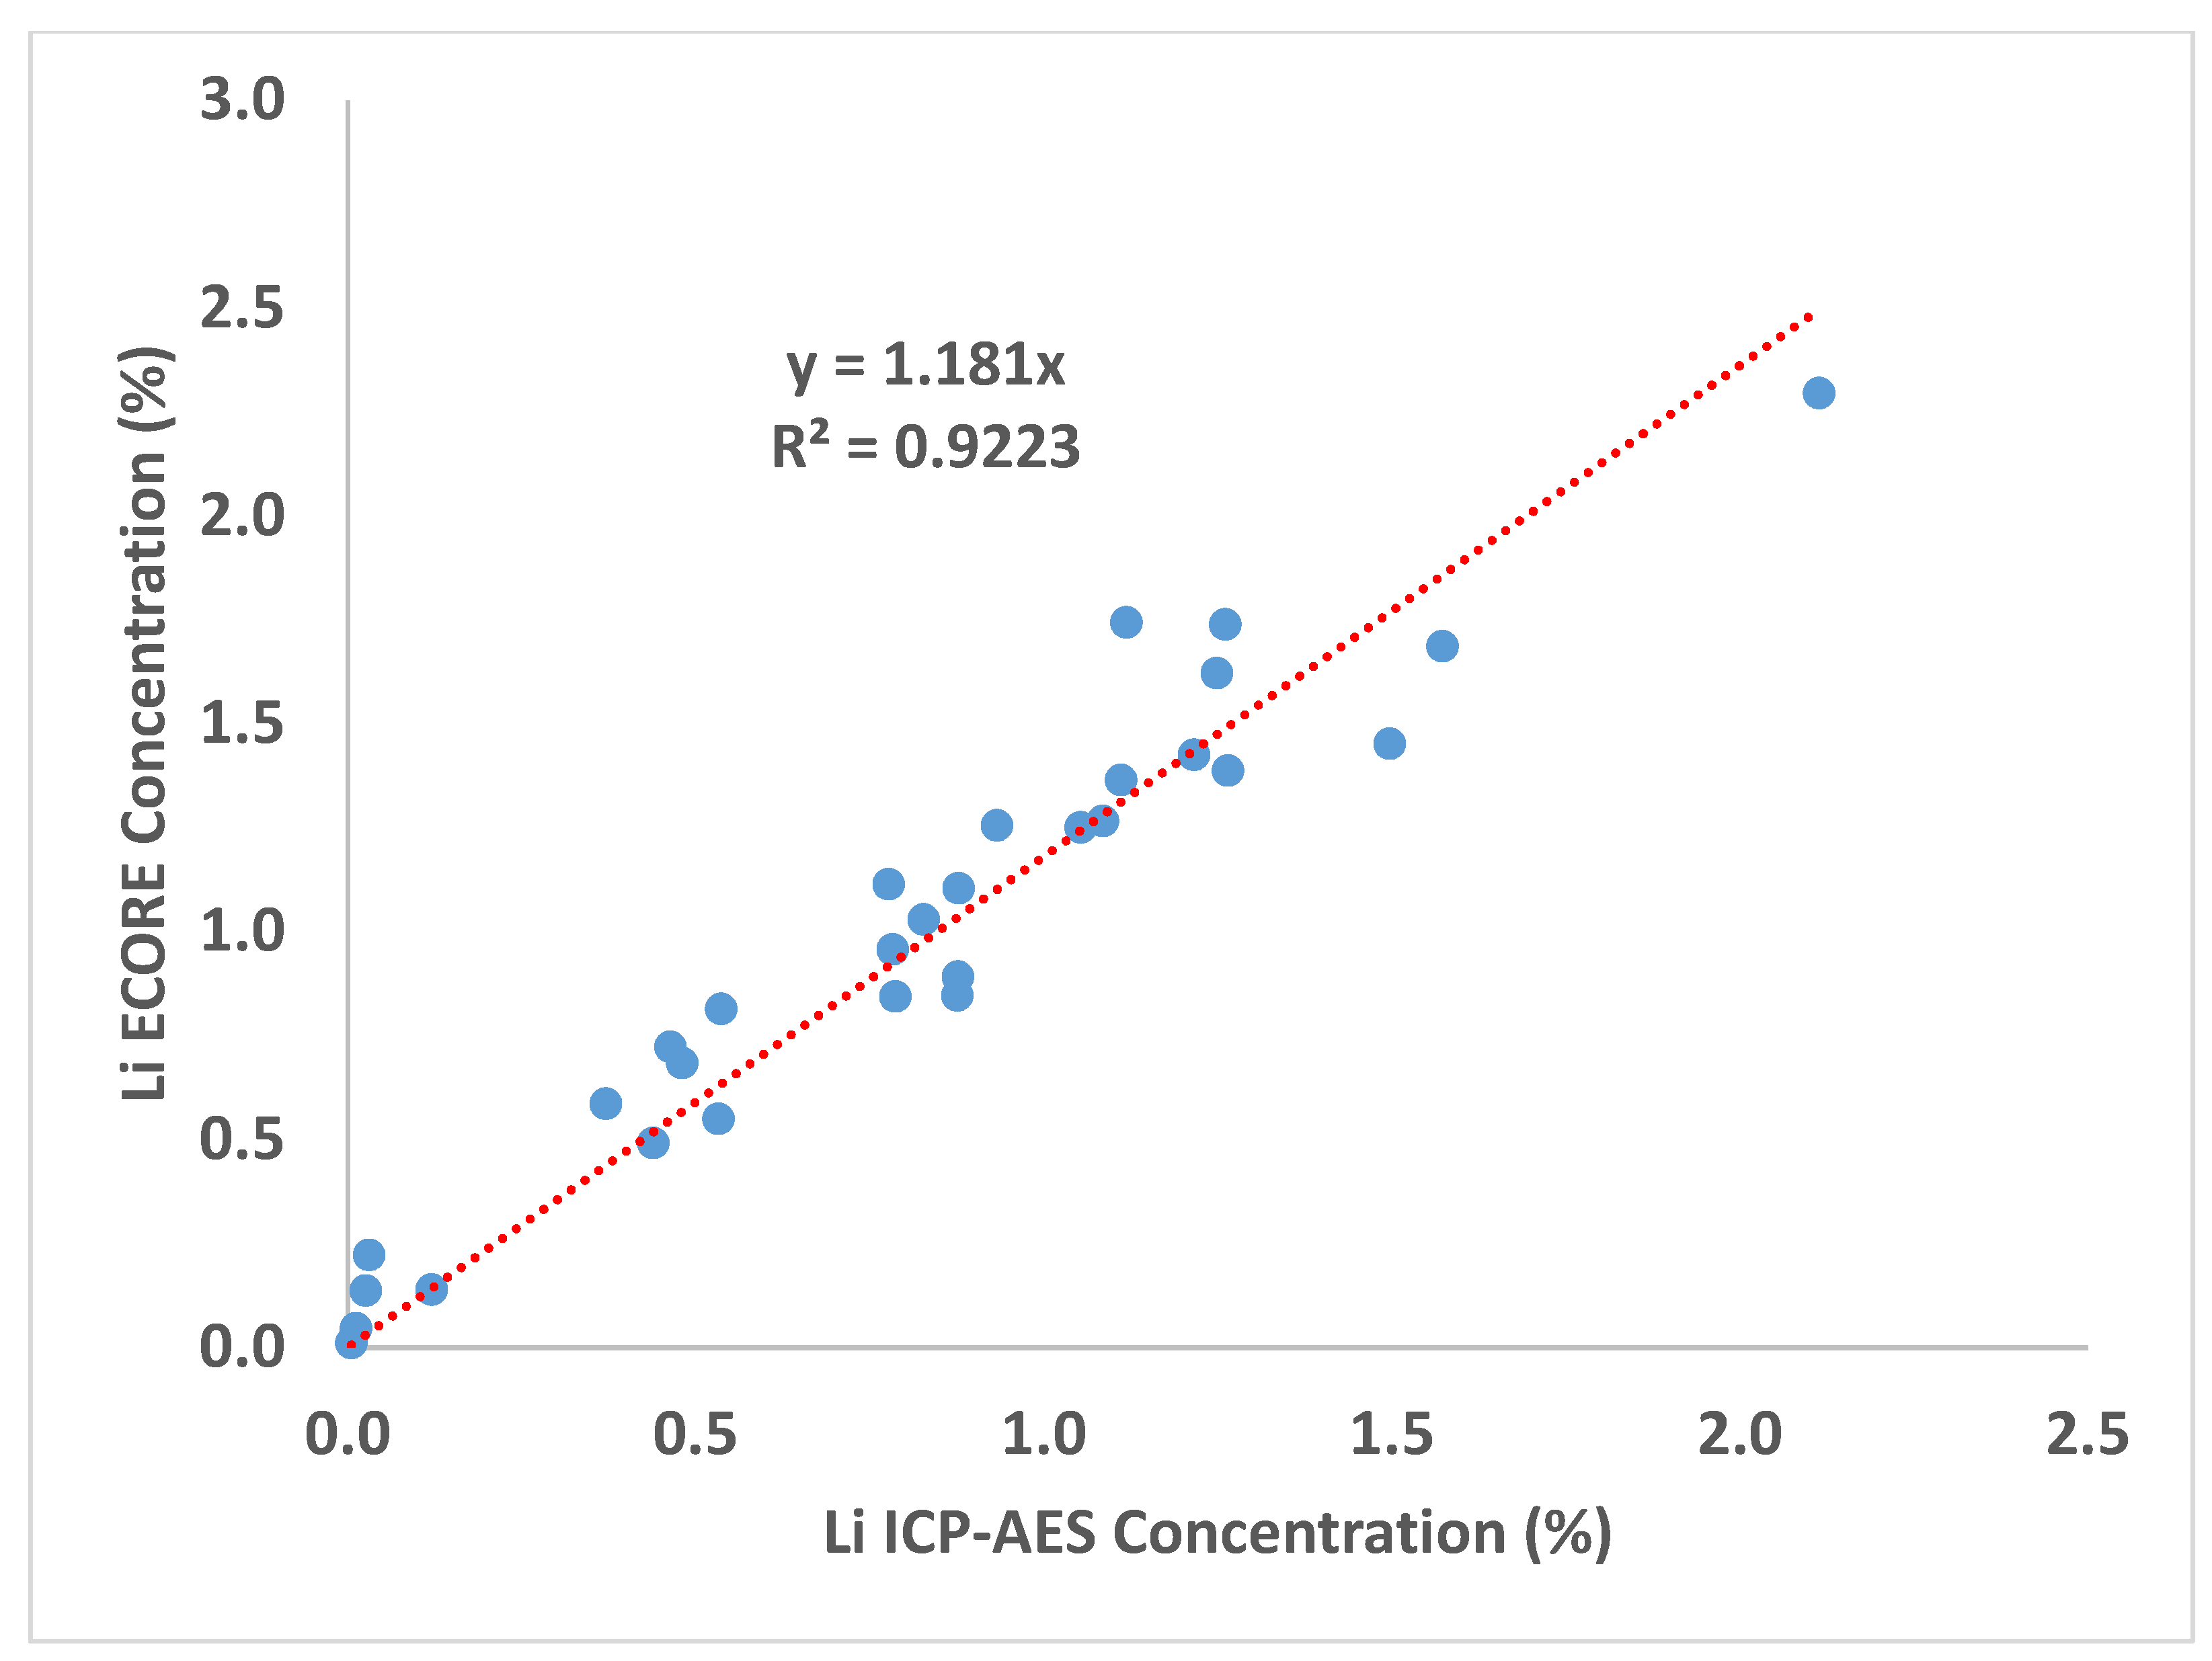
3.1. Quantitative Analysis Based on Mineral Composition

Figure 2 shows the spectra of the 10 identified minerals in the polished sections namely: garnet (in great majority spessartine end-member), quartz, prehnite, bityite, microcline, apatite, beryl, muscovite, albite and spodumene. It is important to note in Figure 2 the presence of a molecular band emission from the calcium fluoride (CaF) for apatite. Each major mineral element’s emission lines were identified on the spectra, and of noticeable interest in pegmatite ores is the capacity for LIBS to measure the light elements Li, Be, Na and Mg. Table 2 shows the chemical composition of the identified minerals as well as their lithium content. As it can be seen, spodumene and bityite are the 2 minerals which contain lithium, and their concentrations are 3.73 wt.% and 1.79 wt.% respectively.
Figure 3 shows the ECORE vs TIMA mineral maps obtained from one of the analyzed polished sections used to define the minerals in order to be used on the crushed lithium ore. Ten minerals were found in these disks. Figure 3 and Table 3 shows good agreement between the ECORE and TIMA mineral maps, six minerals were found in this single disk namely spodumene, quartz, albite, microcline, muscovite and apatite. The other minerals (garnet, prehnite, bityite, and beryl) were found in the other polished sections (data not shown). Table 2 shows the percentage of each mineral determined by ECORE and TIMA in the polished section of Figure 3. Very similar results were achieved by both techniques. It is worth noticing that the discrepancy between the TIMA and ECORE results for microcline and apatite is due to the larger area scanned by the ECORE. For instance, on the top of the ECORE mineral map, an area of apatite was detected; however, no obvious area attributed to apatite was detected in the TIMA mineral map. The same observation is valid for microcline.
Figure 4 shows the optical photos and the mineral maps for a selection of eight samples of the calibration set. For each sample split into the above-described container, the top image is an optical high-resolution photo of the crushed ore whereas the image at the bottom represents the mineral distribution using the ten identified minerals. These minerals were used as input parameters to feed the artificial intelligence algorithm implemented in the ECORE analyzer in order to generate mineral mapping on the surface of the samples of the calibration set. For more details about this algorithm the interested reader is referred to references cited therein [21,22,23]. Furthermore, in Figure 4 one can observe that the crushed lithium ore under study is composed mainly of four minerals namely quartz, spodumene, albite and microcline and that the remaining minerals are in minor amounts. For instance, in the samples CBS-031 and CBS-045 a trace amount of bityite was detected, in the sample CBS-041 small areas of garnet were detected, in the samples CBS-031 and CBS-043 a small number of pixels were attributed to beryl, muscovite was almost detected in all the samples but in minor abundance.
Once the mineral maps for all the samples of the calibration set were generated, the percentage of minerals containing lithium were calculated and then combined to the chemical composition for each mineral to infer the lithium concentration of each sample. It is worth noticing that the ore samples with a high concentration of lithium have a higher attribution of spodumene as can be seen on the mineral map of the sample CBS-049 (lithium concentration is about 2.11% (w/w)). For the ore sample CBS-009 almost no spodumene was detected and the sole phase identified was albite, which explains the very low concentration of lithium (0.005%) in this sample. Therefore, and as expected, the contribution of lithium in those ore samples is directly correlated to the amount of spodumene.
Figure 5 shows the concentrations of lithium for the ore samples of the calibration set obtained by ECORE vs. those obtained by ICP-AES. This figure shows good linear correlation between ECORE and the reference concentrations with R² = 0.981. Part of this discrepancy based on the linear correlation coefficient could be due to the fact that the reference concentrations were determined using a random sub-sample of a few tens of grams from a sample of 3 to 5 kg of pulverized and “homogenized” crushed material, and that this sub-sampling may not be uniform and that every mineral may not be liberated evenly and hence settling related to sample density issues may have occurred. Thus, some bias (difference between a measured value and a reference value) should be expected between the sampled mass of material used for the laboratory analysis and the remaining crushed material used in this study. In fact, the ECORE is sampling a larger quantity of material and improving the representativity, leading to better accuracy, of the measurement compared with the single measurement of wet chemical assays. The reader should keep in mind that the bias between predicted and reference values might be caused by the latter.

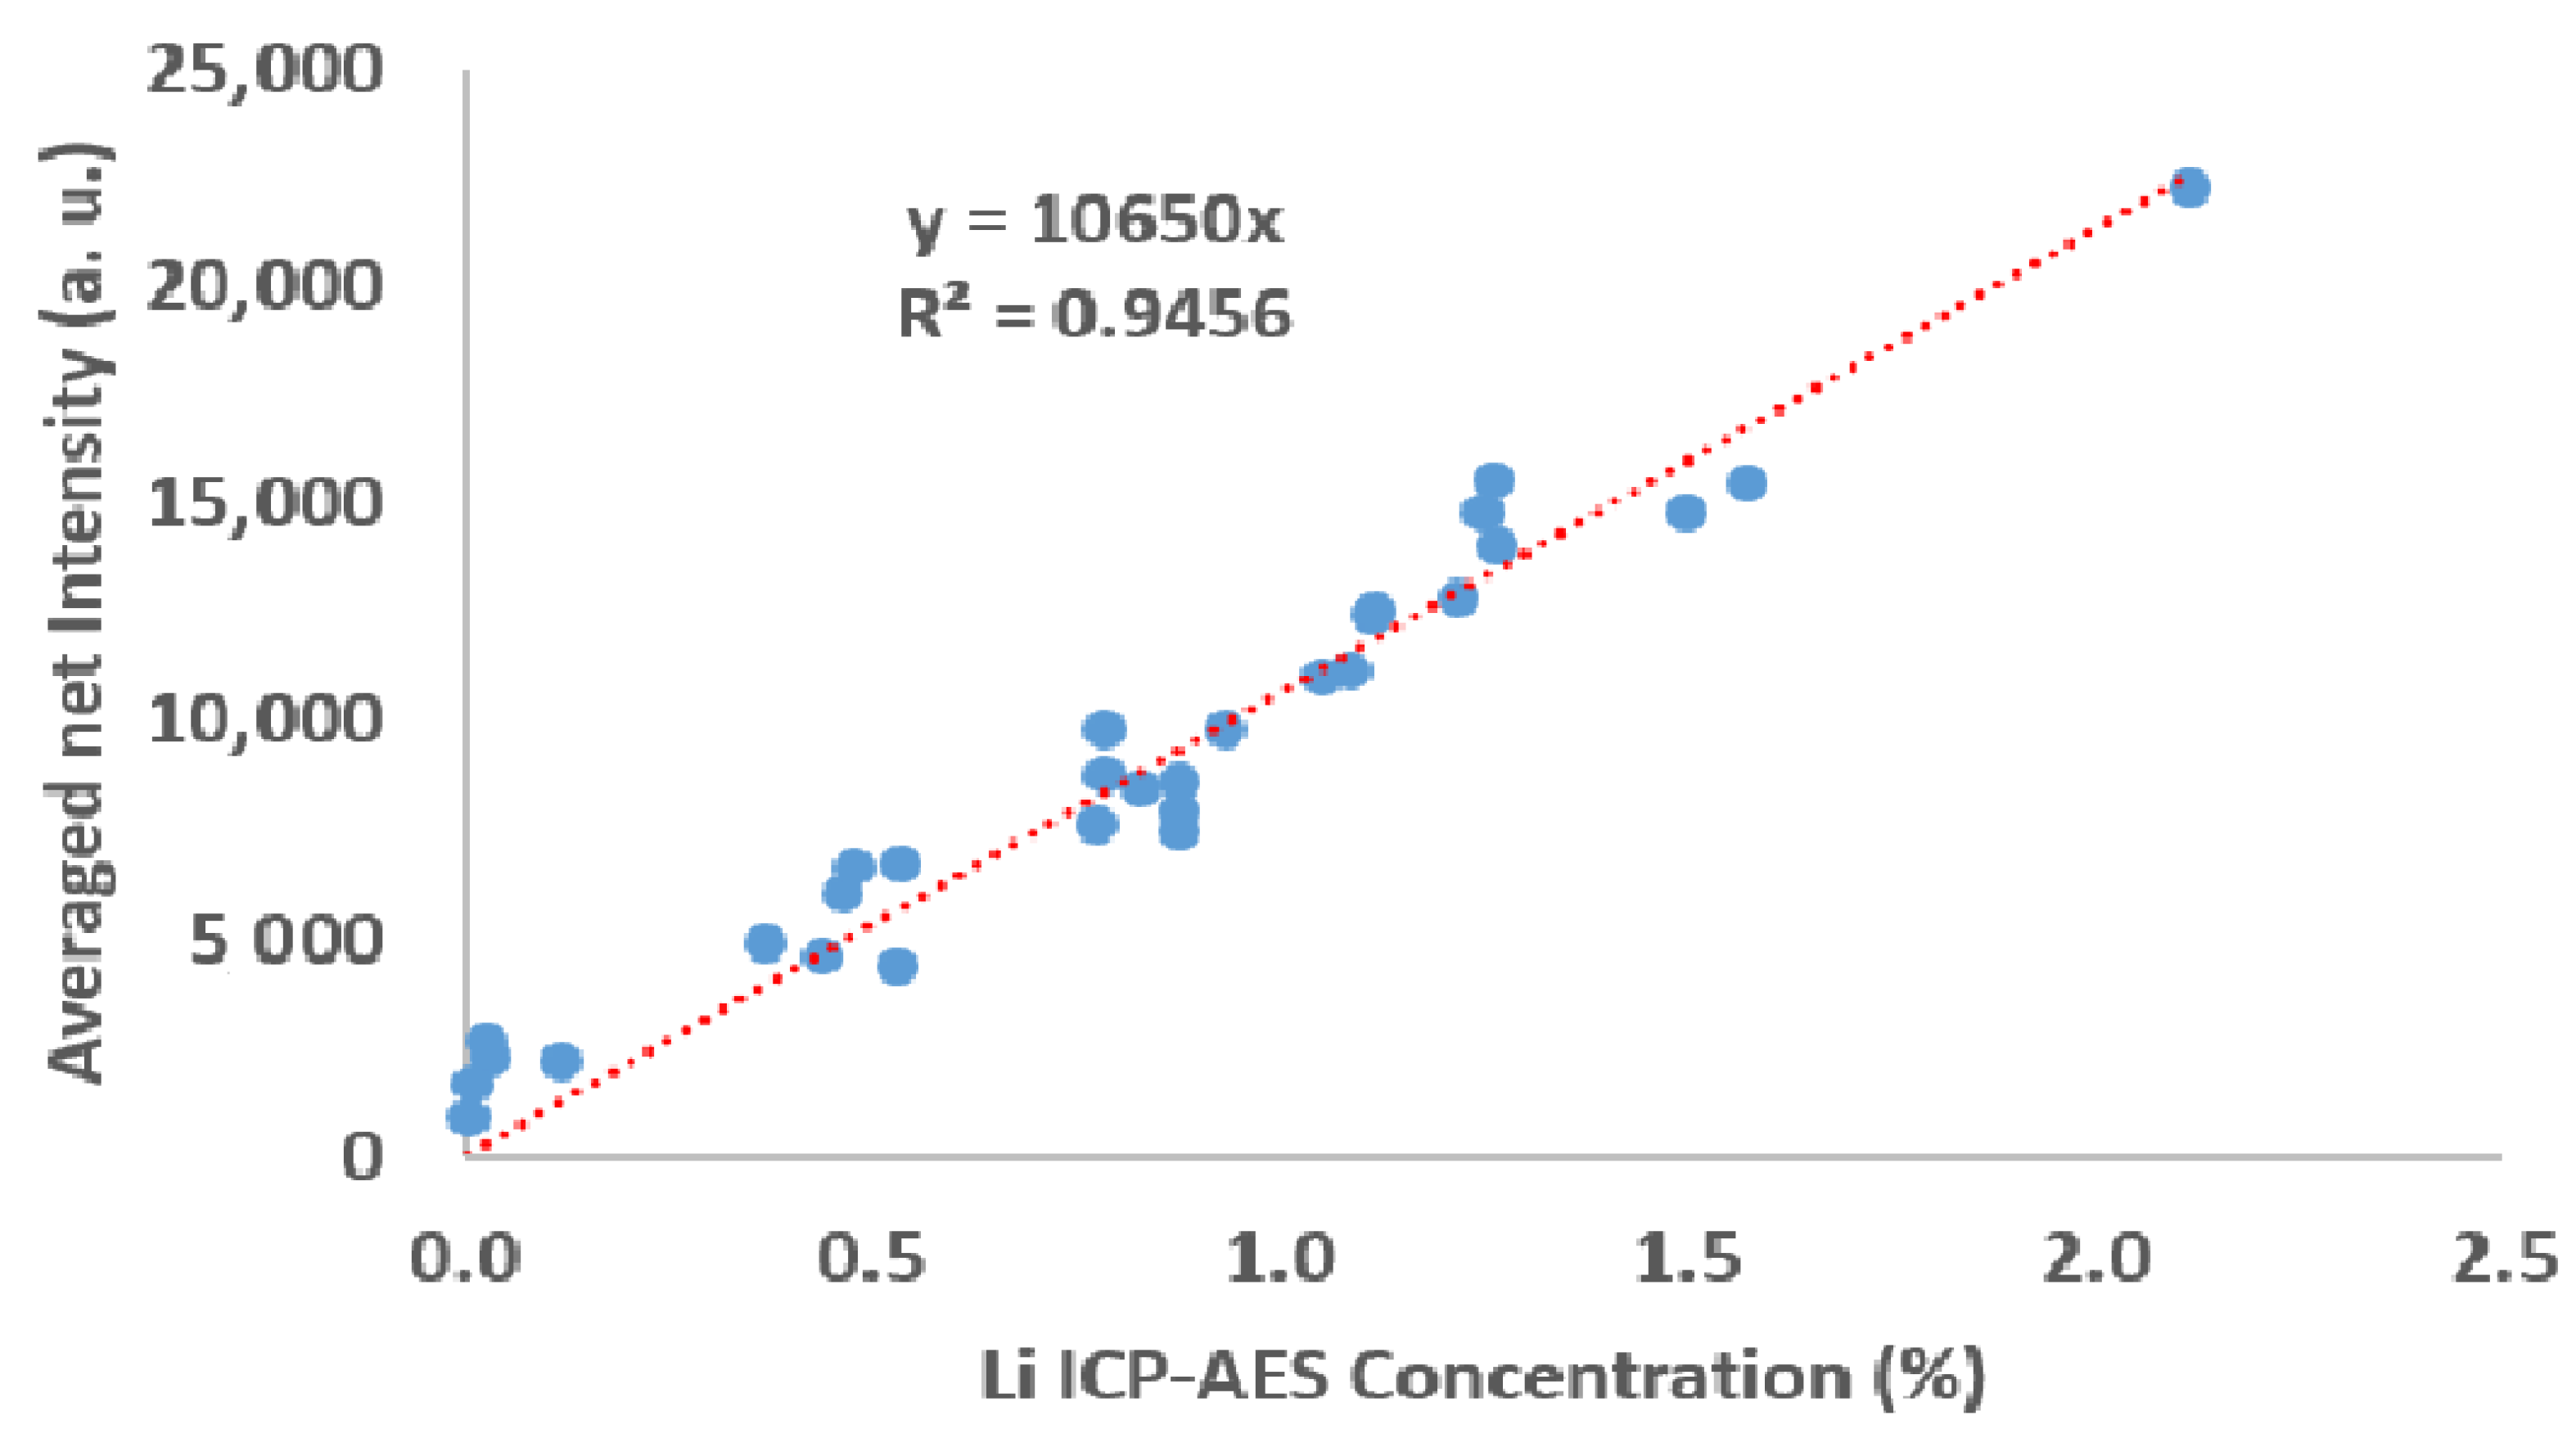
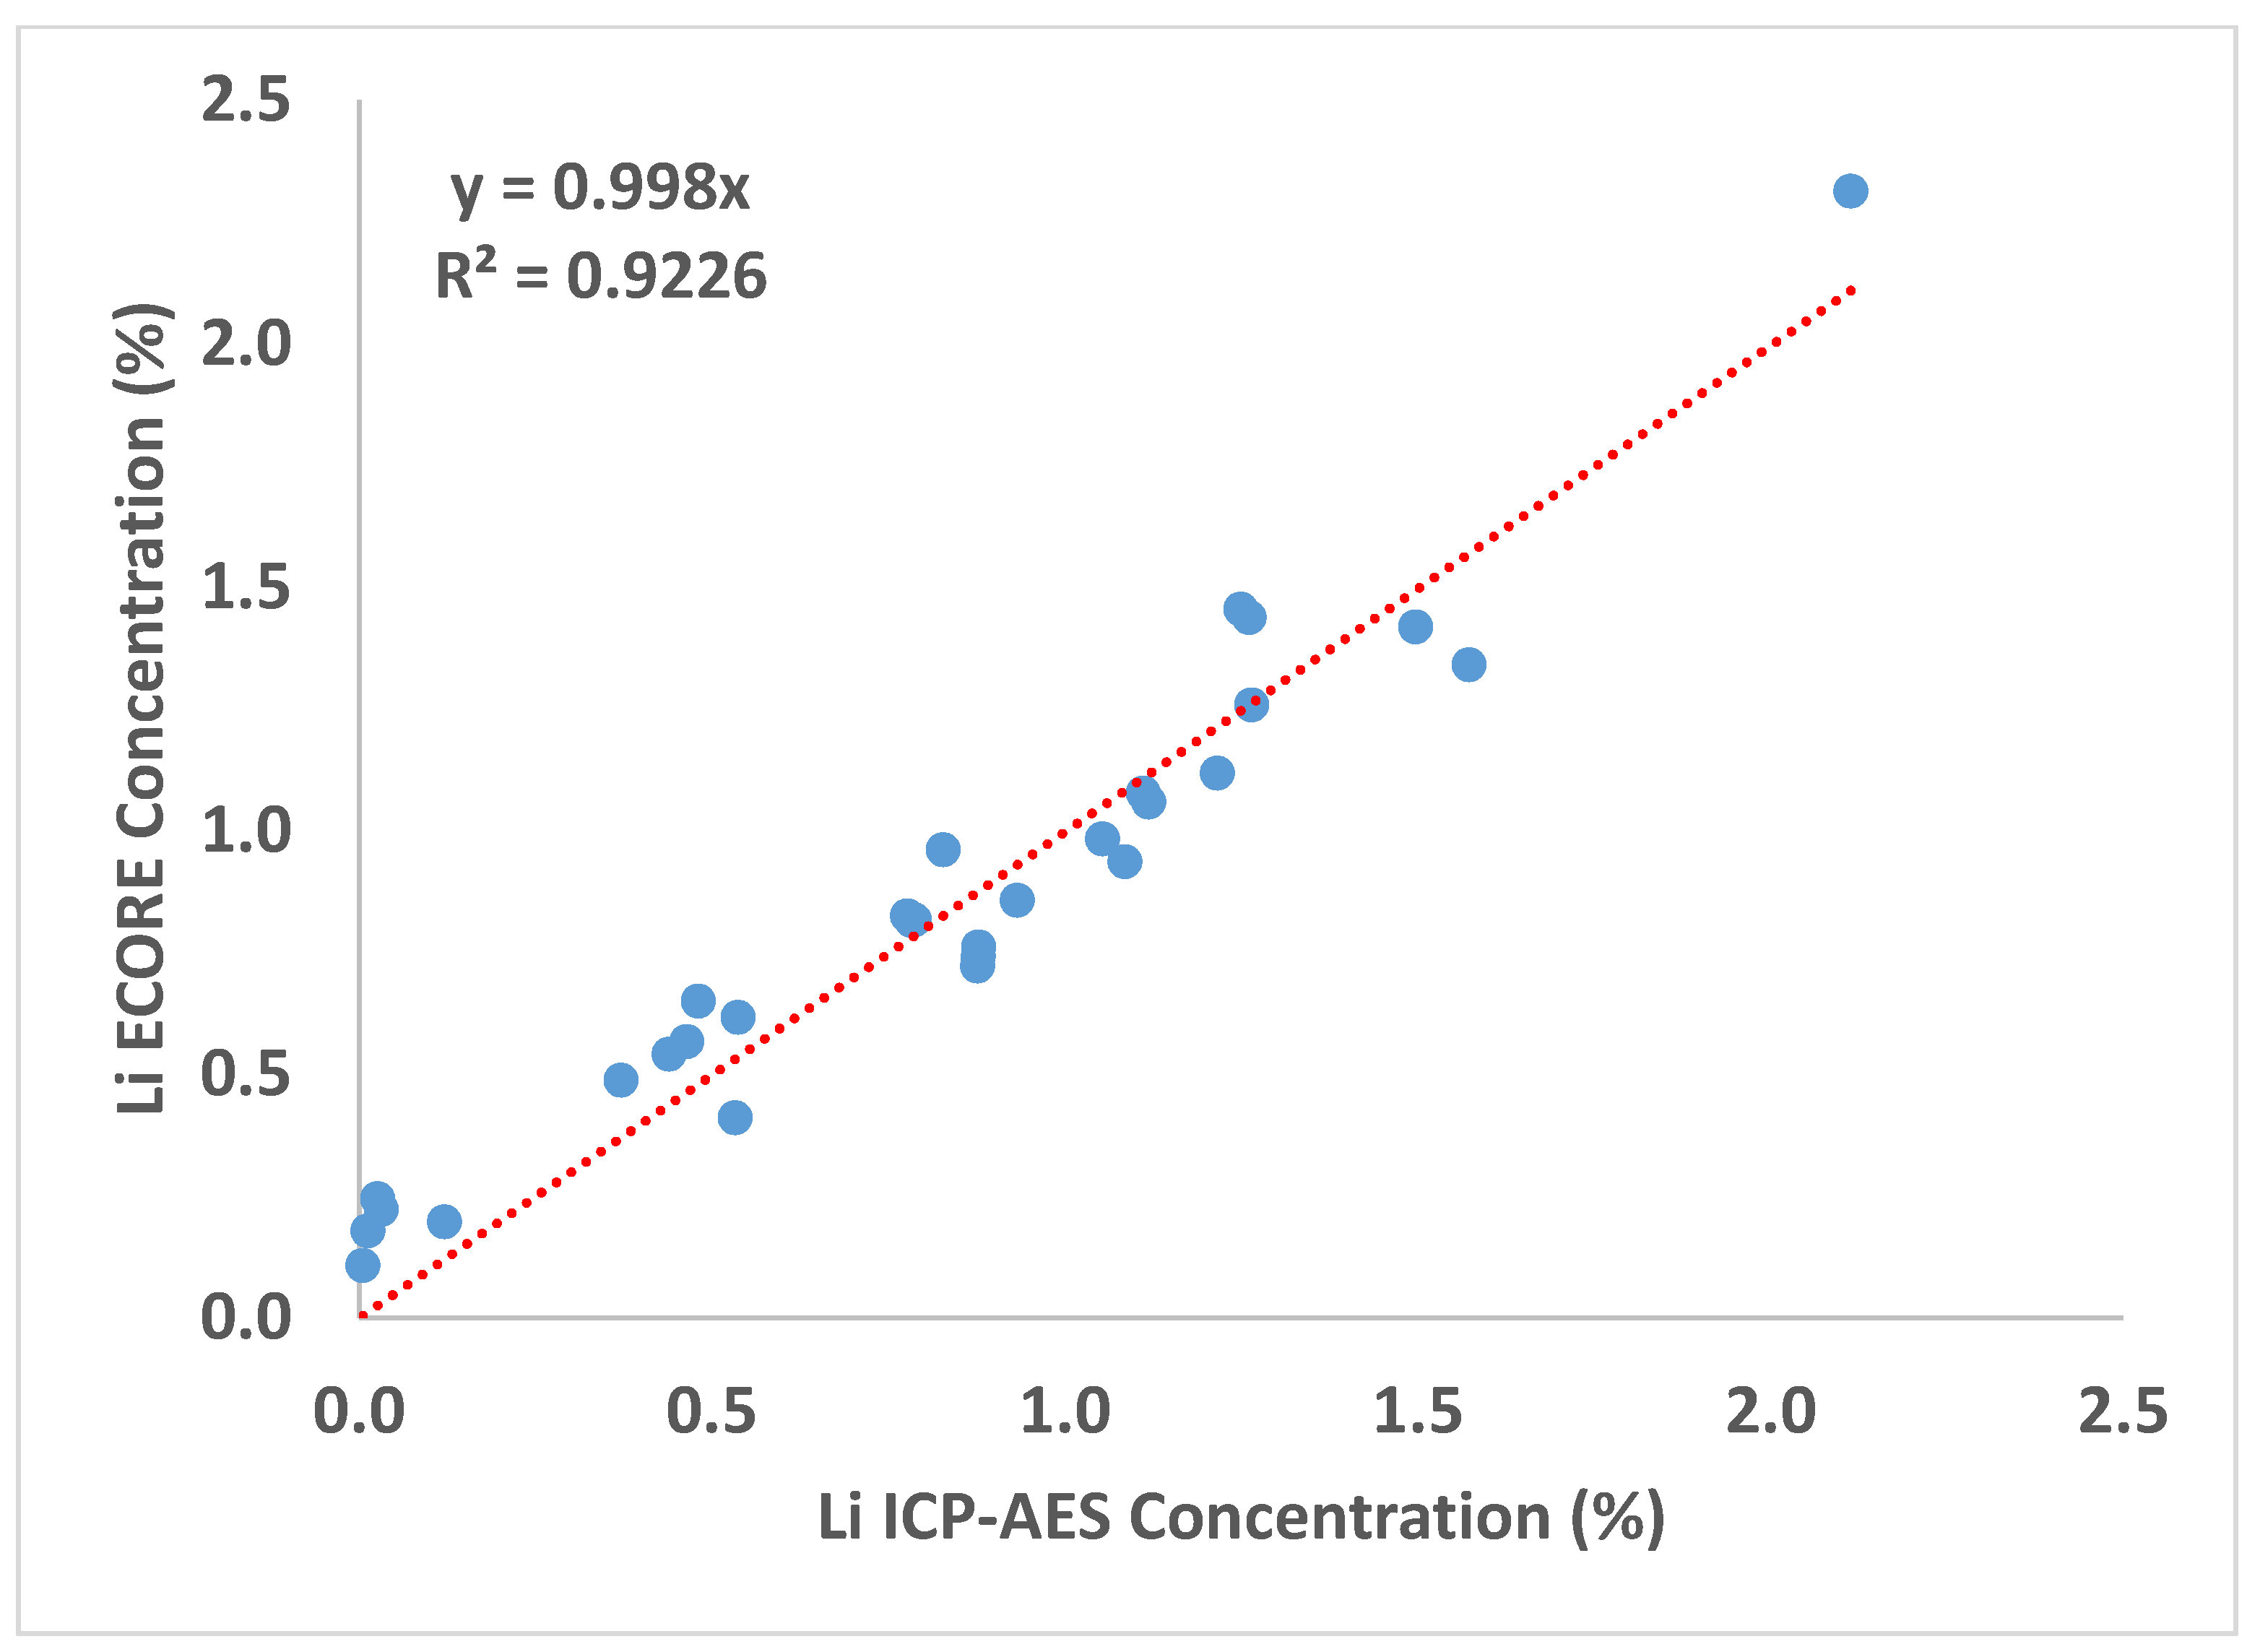
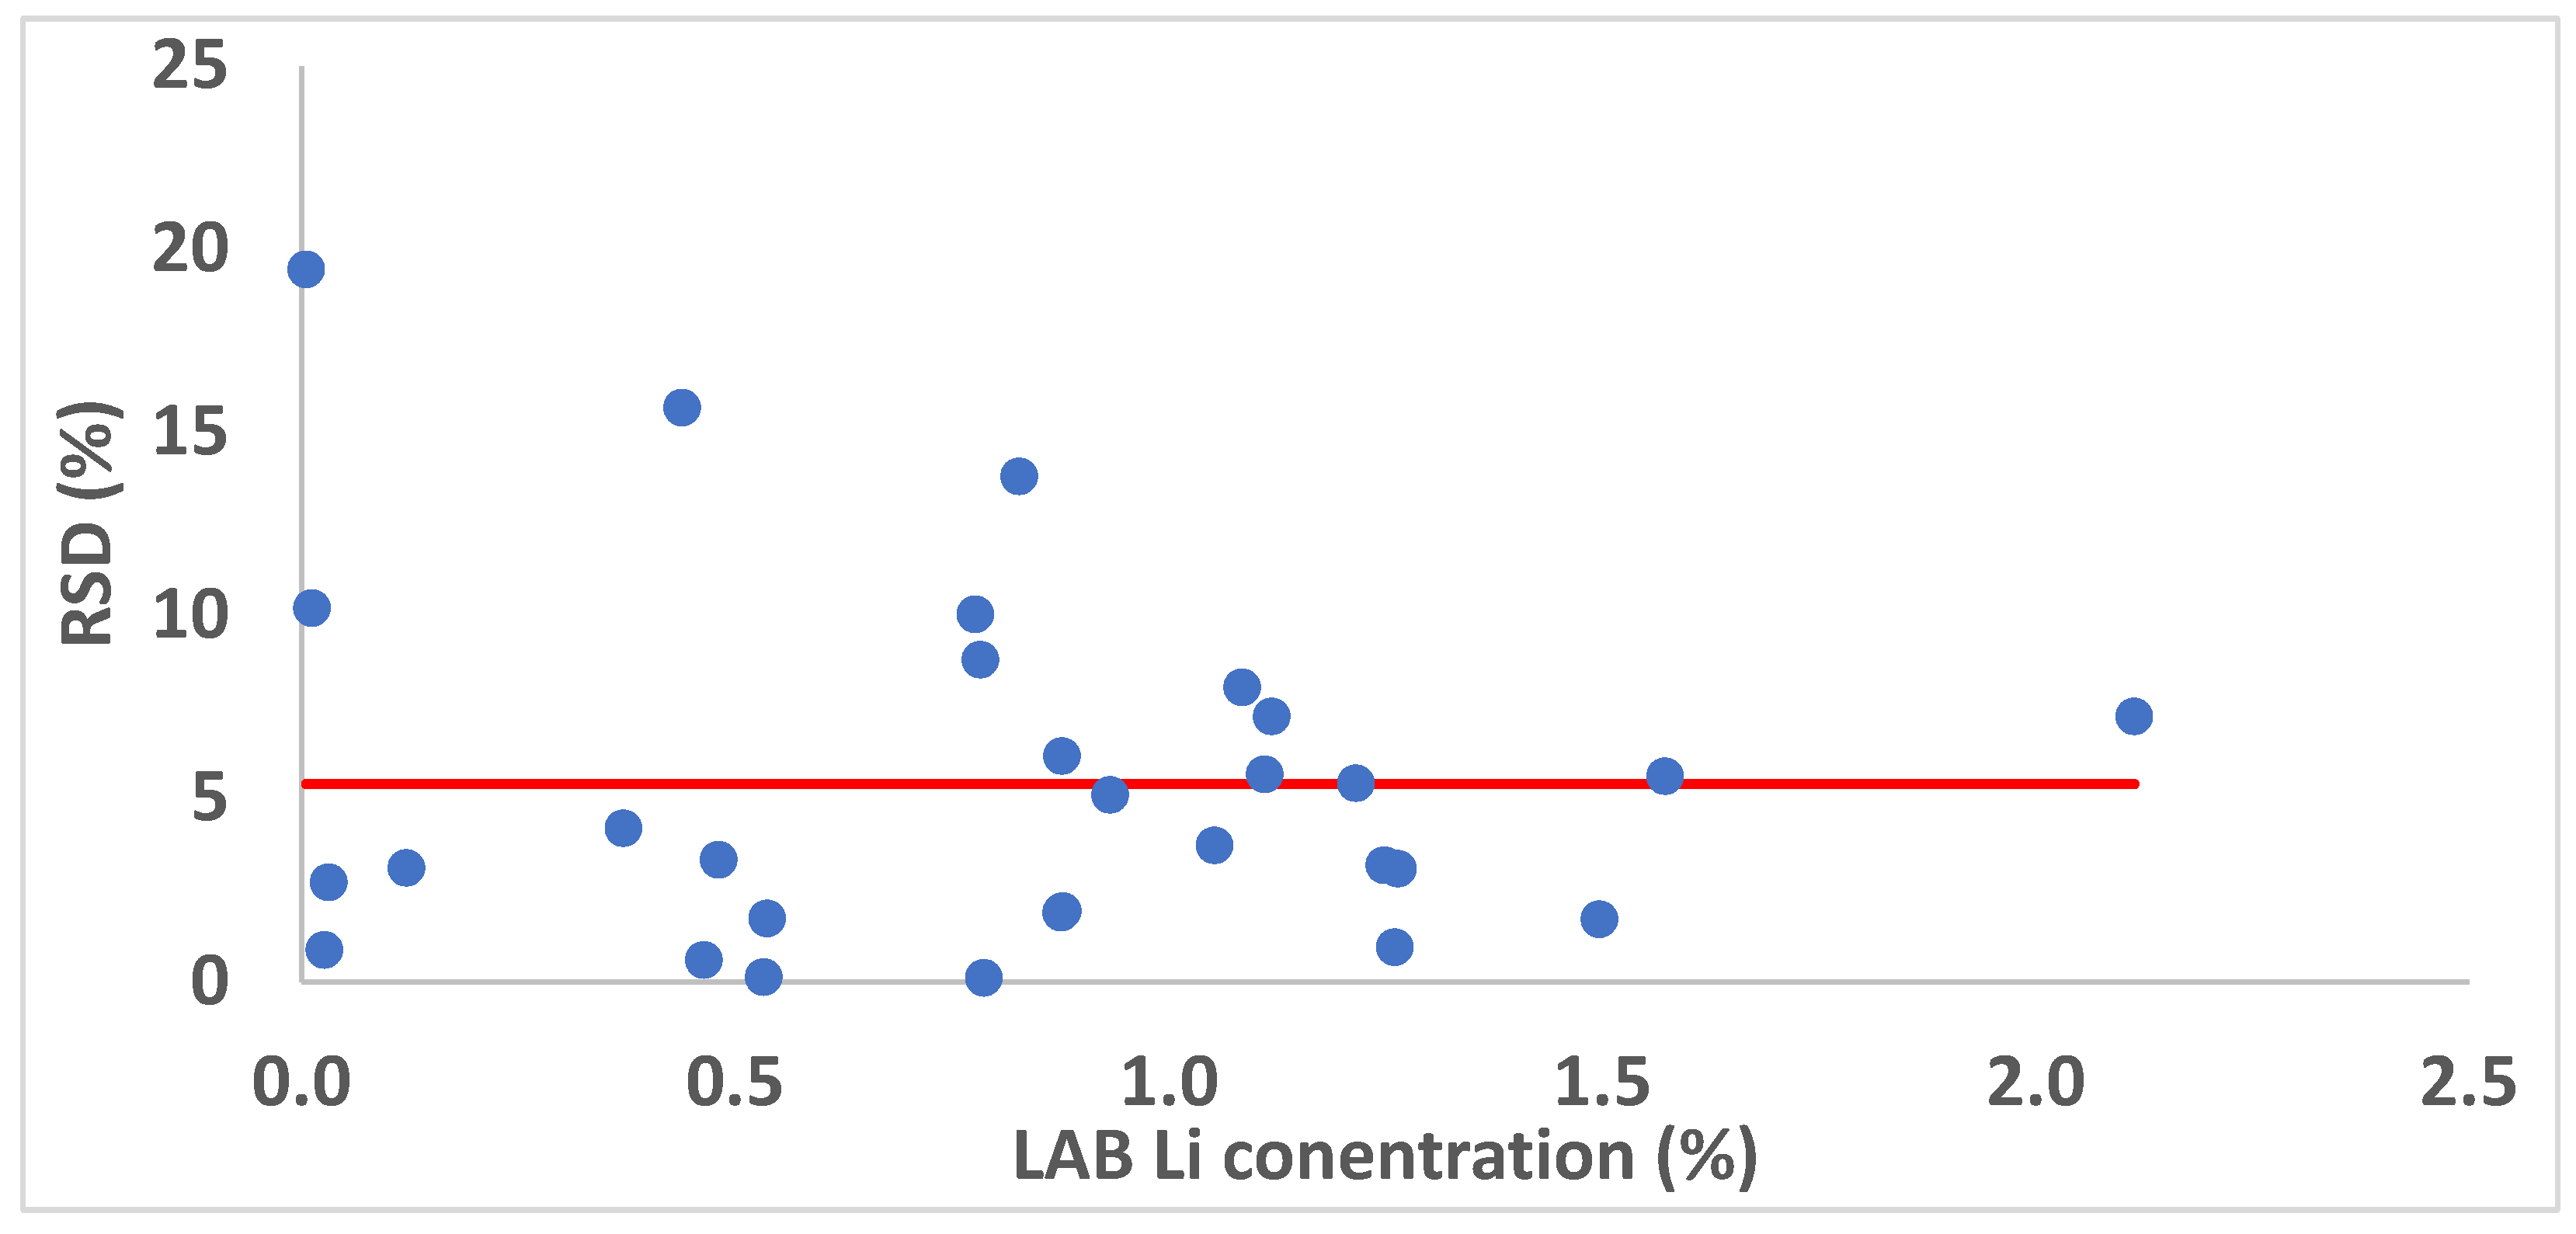
3.2. Matrix-Matched Univariate Calibration

In this section the signal of the lithium line for each sample of the calibration set was plotted as a function of the lithium concentration obtained by ICP–AES. In this study the lithium line at 610.36 nm was used. The most prominent line at 670.78 nm was not used because it was suffering from self-absorption due to the high lithium concentration, whereas the one at 812.64 nm was not sensitive enough for low concentrations. For each ore sample from the calibration set, the lithium net intensity signal at 610.36 nm was extracted for each pixel then those intensities were averaged to the overall pixels to obtain one intensity value for each sample. Figure 6 shows the lithium intensity for the 610.36 nm line as a function of lithium concentration obtained by ICP-AES. A good linear correlation with a coefficient of determination (R2) of 0.987 was obtained.
As it was mentioned above 63,001 laser shots and spectra were obtained for each sample of the validation set. The lithium net intensity at 610.36 nm was extracted for each spectrum and then averaged over all the 63,001 laser shots. Finally, the net intensity of the all-ore samples from the validation set was put into the equation of regression obtained (using the calibration set) in Figure 6 in order to predict their concentrations. Figure 7 shows the lithium concentration obtained by the ECORE as a function of those obtained by ICP–AES, good correlation between the lithium concentration obtained using the proposed LIBS-based approach and those obtained by ICP–AES method was demonstrated with a R2 = 0.982. Moreover, the regression slope value of 0.998, which is very close to 1 for a linear fit, demonstrates the good agreement between the LIBS values and the ICP-AES one. Again, the representativeness of the large surface ECORE sampling compared with a traditional sample-splitting and subsampling followed by classical wet chemistry should be considered as the potential source for explaining the dispersion of the points on the regression curve.
It is worth noticing that although the two methods for the quantification of lithium show similar behavior in terms of their correlation coefficient, conventional calibration shows better accuracy because its regression slope was close to unity, whereas the slope for the first method was about 1.18 which slightly departs from unity.
The results reported in this study demonstrate the potential for the quantification of lithium and its distribution in minerals at a mine site laboratory where real time chemistry and mineralogy are required for effective mining, grade control and process plant optimization. The technique is also suitable for the sorting of lithium crushed ore samples which have different particle sizes moving on a conveyer belt in almost real time to divert the desired minerals from the undesired minerals and hence increase the recoverable lithium. Additionally, this would reduce the amount of material sent to the laboratory to monitor the process, which would result in reducing costs and delays compared with conventional methods, providing a new tool for analytical chemists and process engineers. Furthermore, this study shows the potential of a high 1 kHz sampling rate of the ore which leads to better accuracy thus improving the representativity by increasing the sampling.
Figure 8 shows the relative standard deviation of the lithium concentration obtained by ECORE for the first and the second sets of samples as a function of lithium ICP–AES concentration. As it can be seen in Figure 8, relative standard deviation is less than 15% for the samples with lithium concentrations higher than 0.6%.

4. Summary and Conclusions

This paper demonstrates the capability of the ECORE to measure accurately the concentration of lithium in crushed pegmatite ore samples without any sample preparation. Good correlation between the lithium concentrations obtained by ICP–AES and those obtained by ECORE using the two proposed method was achieved. Repeatability reported in terms of relative standard deviation (RSD%) was less than 15% for the crushed samples having lithium concentration higher than 0.6% which meets the need in terms of accuracy at the cut-off lithium grade (about 0.6%). This study proposes a new high sampling procedure that ensures the representativeness of the analysis of large amounts of material. Moreover, the results were obtained in conditions simulating a process analyzer installed over a conveyor belt to monitor the process continuously in real-time with a COBRA (Continuous On-Belt Real-time Analyzer) LIBS process analyzer. Finally, this is a step forward in the implementation of a high throughput LIBS system on a conveyer belt in order to monitor the lithium concentration in real-time for exploitation application.

Author Contributions

Conceptualization, L.Ç.Ö., F.R.D. and N.A.; Data curation, K.R., A.Y. and L.Ç.Ö.; Formal analysis, K.R., A.Y., L.Ç.Ö. and N.A.; Funding acquisition, L.Ç.Ö. and F.R.D.; Investigation, K.R., M.C., L.Ç.Ö., F.R.D. and N.A.; Methodology, K.R., A.Y., L.Ç.Ö. and N.A.; Project administration, L.Ç.Ö. and F.R.D.; Resources, M.C., A.Y. and N.A.; Software, A.Y. and N.A.; Supervision, L.Ç.Ö., F.R.D. and N.A.; Validation, K.R., A.Y., L.Ç.Ö., F.R.D. and N.A.; Visualization, K.R., A.Y., L.Ç.Ö. and F.R.D.; Writing—original draft, K.R., M.C. and F.R.D.; Writing—review & editing, K.R., M.C., L.Ç.Ö. and F.R.D. All authors have read and agreed to the published version of the manuscript.

Funding

This research received no external funding.

Data Availability Statement

Not applicable.

Acknowledgments

Authors would like to thank Melissa Narbey, Zofia Swierczek, Alejandro Fayad, and Jing Li for contributing to the TIMA experiments, management, and coordination of communication between the different entities. In addition, the authors would like thank Pilbara Minerals for providing the assayed samples.

Conflicts of Interest

The authors declare no conflict of interest.

References

  1. Schulz, K.J.; DeYoung, J.H., Jr.; Seal, R.R., II; Bradley, D.C. (Eds.) Critical Mineral Resources of the United States-Economic and Environmental Geology and Prospects for Future Supply; USGS: Reston, VA, USA, 2017; 797p. [CrossRef]
  2. Australian Critical Minerals Prospectus 2020. Australian Government, Australian Trade and Investment Commission, Geoscience Australia, Dept. of Industry, Science, Energy and Resources. 2020; 172p. Available online: www.austrade.gov.au/ArticleDocuments/5572/Australian_Critical_Minerals_Prospectus.pdf (accessed on 2 February 2022).
  3. U.S. Geological Survey. Mineral Commodity Summaries 2021; USGS: Reston, VA, USA, 2021; 200p. [CrossRef]
  4. Rifai, K.; Laflamme, M.; Constantin, M.; Vidal, F.; Sabsabi, M.; Blouin, A.; Bouchard, P.; Fytas, K.; Castello, M.; Kamwa, B.N. Analysis of gold in rock samples using laser-induced breakdown spectroscopy: Matrix and heterogeneity effects. Spectrochim. Acta B 2017, 134, 33–41. [Google Scholar] [CrossRef]
  5. Jolivet, L.; Leprince, M.; Moncayo, S.; Sorbier, L.; Lienemann, C.-P.; Motto-Ros, V. Review of the recent advances and applications of LIBS based imaging. Spectrochim. Acta B 2019, 151, 41–53. [Google Scholar] [CrossRef]
  6. Fabre, C. Advances in Laser-Induced Breakdown Spectroscopy analysis for geology: A critical review. Spectrochim. Acta B 2020, 166, 105799. [Google Scholar] [CrossRef]
  7. Harmon, R.S.; Senesi, G.S. Laser-induced breakdown spectroscopy—A geochemical tool for the 21st century. Appl. Geochem. 2021, 120, 104929. [Google Scholar] [CrossRef]
  8. Harmon, R.S.; Lawley, C.J.M.; Watts, J.; Harraden, C.L.; Somers, A.M.; Hark, R.R. Laser-Induced Breakdown Spectroscopy—An emerging analytical tool for mineral exploration. Minerals 2019, 9, 718. [Google Scholar] [CrossRef] [Green Version]
  9. Ytsma, C.R.; Knudson, C.A.; Dyar, M.D.; McAdam, A.C.; Michaud, D.D.; Rollosson, L.M. Accuracies and detection limits of major, minor, and trace element quantification in rocks by portable laser-induced breakdown spectroscopy. Spectrochim. Acta B 2020, 171, 105946. [Google Scholar] [CrossRef]
  10. Senesi, G.S.; Harmon, R.S.; Hark, R.R. Field-portable and handheld laser-induced breakdown spectroscopy: Historical review, current status and future prospects. Spectrochim. Acta B 2021, 175, 106013. [Google Scholar] [CrossRef]
  11. Ytsma, C.R.; Dyar, M.D. Accuracies of lithium, boron, carbon, and sulfur quantification in geological samples with laser-induced breakdown spectroscopy in Mars, Earth, and vacuum conditions. Spectrochim. Acta B 2019, 162, 105715. [Google Scholar] [CrossRef]
  12. Schirmer, T.; Wahl, M.; Bock, W.; Kopnarski, M. Determination of the Li distribution in synthetic recycling slag with SIMS. Metals 2021, 11, 825. [Google Scholar] [CrossRef]
  13. Fabre, C.; Boiron, M.C.; Dubessy, J.; Chabiron, A.; Charoy, B.; Crespo, T.M. Advances in lithium analysis in solids by means of laser-induced breakdown spectroscopy: An exploratory study. Geochem. Cosmochim. Acta 2002, 66, 1401–1407. [Google Scholar] [CrossRef]
  14. Fabre, C.; Maurice, S.; Cousin, A.; Wiens, R.C.; Forni, O.; Sautter, V.; Guillaume, D. Onboard calibration igneous targets for the Mars Science Laboratory Curiosity rover and the Chemistry Camera laser induced breakdown spectroscopy instrument. Spectrochim. Acta B 2011, 66, 280–289. [Google Scholar] [CrossRef]
  15. Sweetapple, M.T.; Tassios, S. Laser-induced breakdown spectroscopy (LIBS) as a tool for in situ mapping and textural interpretation of lithium in pegmatite minerals. Am. Min. 2015, 100, 2141–2151. [Google Scholar] [CrossRef]
  16. Lawley, C.J.M.; Somers, A.M.; Kjarsgaard, B.A. Rapid geochemical imaging of rocks and minerals with handheld laser-induced breakdown spectroscopy (LIBS). J. Geochem. Explor. 2021, 222, 106694. [Google Scholar] [CrossRef]
  17. Romppanen, S.; Pölönen, I.; Häkkänen, H.; Kaski, S. Optimization of spodumene identification by statistical approach for laser-induced breakdown spectroscopy data of lithium pegmatite ores. Appl. Spectrosc. Rev. 2021. [Google Scholar] [CrossRef]
  18. Rifai, K.; Doucet, F.; Özcan, L.; Vidal, F. LIBS core imaging at kHz speed: Paving the way for real-time geochemical applications. Spectrochim. Acta B 2018, 150, 43–48. [Google Scholar] [CrossRef]
  19. Rifai, K.; Özcan, L.; Doucet, F.; Vidal, F. Quantification of copper, nickel and other elements in copper-nickel ore samples using laser-induced breakdown spectroscopy. Spectrochim. Acta B 2020, 165, 105766. [Google Scholar] [CrossRef]
  20. Rifai, K.; Özcan, L.Ç.; Doucet, F.R.; Rhoderick, K.; Vidal, F. Ultrafast elemental mapping of platinum group elements and mineral identification in platinum-palladium ore using Laser Induced Breakdown Spectroscopy. Minerals 2021, 10, 207. [Google Scholar] [CrossRef] [Green Version]
  21. Rifai, K.; Michaud-Paradis, M.-C.; Swierczek, Z.; Doucet, F.R.; Özcan, L.Ç.; Fayad, A.; Li, J.; Vidal, F. Emergences of new technology for ultrafast automated mineral phase identification and quantitative analysis using the CORIOSITY Laser-Induced Breakdown Spectroscopy (LIBS) system. Minerals 2021, 10, 918. [Google Scholar] [CrossRef]
  22. Mohamed, N.; Rifai, K.; Selmani, S.; Constantin, M.; Doucet, F.; Özcan, L.Ç.; Sabsabi, M.; Vidal, F. Chemical and mineralogical mapping of platinum-group elements ore samples using LIBS and µ-XRF. Geostand. Geoanal. Res. 2021, 45, 539–550. [Google Scholar] [CrossRef]
  23. Michaud-Paradis, M.-C.; Doucet, F.R.; Rifai, K.; Özcan, L.Ç.; Azami, N.; Vidal, F. ECORE: A new fast automated quantitative mineral and elemental core scanner. Minerals 2021, 11, 859. [Google Scholar] [CrossRef]
  24. Champion, D. Australian Resource Reviews: Lithium 2018; Geoscience Australia: Canberra, Australia, 2019; 12p. Available online: https://d28rz98at9flks.cloudfront.net/126759/ARR_Lithium_2018.pdf (accessed on 2 February 2022).
  25. Critical Minerals Projects in Australia 2020. Australian Government, Australian Trade and Investment Commission, Geoscience Australia, Dept. of Industry, Science, Energy and Resources. 2020; 62p. Available online: www.austrade.gov.au/ArticleDocuments/5572/Critical_Minerals_Projects_in_Australia.pdf (accessed on 2 February 2022).
  26. Bowell, R.J.; Lagos, L.; de LosHoyos, C.R.; Declercq, J. Classification and characteristics of natural lithium resources. Elements 2020, 16, 259–264. [Google Scholar] [CrossRef]
  27. Feasibility Study Update NI 43-101 Technical Report Quebec Lithium Project La Corne Township; Canada Lithium Corp.: Québec, QC, Canada, 2011; 184p.
  28. Ibarra-Gutiérrez, S.; Bouchard, J.; Laflamme, M.; Fytas, K. The potential of lithium in Québec for the electric vehicle market: State of the art, opportunities and challenges. Int. J. Min. Reclam. Envirion. 2021, 36, 68–80. [Google Scholar] [CrossRef]
Figure 1. ECORE LIBS drill core scanner.
Minerals 12 00253 g001
Figure 2. LIBS spectra for the ten identified minerals in the polished sections obtained using ECORE.
Minerals 12 00253 g002
Figure 3. Mineral maps obtained by ECORE and TIMA.
Minerals 12 00253 g003
Figure 4. Optical photos (top) of eight representative crushed ore sample split in the above-described containers and ECORE mineral maps (bottom).
Minerals 12 00253 g004aMinerals 12 00253 g004bMinerals 12 00253 g004c
Figure 5. Li ECORE concentration vs ICP-AES concentration.
Minerals 12 00253 g005
Figure 6. Li averaged net intensity of line 610.36 nm of the calibration set as a function of Li concentration obtained by ICP-AES.
Minerals 12 00253 g006
Figure 7. Li ECORE predicted concentrations of line 610.36 nm of the validation set vs Li ICP–AES concentrations.
Minerals 12 00253 g007
Figure 8. Relative standard deviation of the ECORE Li concentration between the first set and the second one as a function of Li concentrations obtained by ICP–AES (red line correspond to average RSD).
Minerals 12 00253 g008
Table 1. Concentration in % (weight/weight) of lithium for the thirty lithium ore samples as obtained by ICP–AES.
Sample IDCBS-087CBS-085CBS-080CBS-083CBS-091CBS-077CBS-078CBS-075CBS-079CBS-065
Reference [Li] (%)0.1210.0311.2650.3711.0530.5331.0851.2610.0120.876
Sample IDCBS-067CBS-055CBS-073CBS-051CBS-039CBS-043CBS-049CBS-071CBS-009CBS-093
Reference [Li] (%)0.8780.4640.0261.1110.8770.7872.1141.2490.0050.933
Sample IDCBS-069CBS-033CBS-057CBS-045CBS-031CBS-041CBS-029CBS-007CBS-027CBS-021
Reference [Li] (%)1.4970.8280.5370.7771.5730.4811.1190.4390.7831.216
Table 2. Chemical composition of the ten minerals defined from the polished sections as well as the lithium concentration estimated for each mineral obtained from Webmineral.
Mineral Formula[Li] %
Garnet Mn2+3Al2Si3O12 + Fe2+3Al2Si3O120
QuartzSiO20
PrehniteCa2Al2Si3O10(OH)20
BityiteCaLiAl3Be(Si2O10)(OH)21.79
MicroclineKAlSi3O80
ApatiteCa5(PO4)3F0
BerylBe3Al2Si6O180
MuscoviteKAl3Si3O10(OH)1.8F0.20
AlbiteNa0.95Ca0.05Al1.05Si2.95O80
SpodumeneLiAl(Si2O6)3.73
Table 3. Percentage of minerals as found by ECORE and TIMA.
Mineral LIBS (%)TIMA (%)
Spodumene62.564.9
Quartz2222.9
Albite5.25.7
Muscovite4.53.5
Microcline20.85
Apatite10.017
beryl0.010.018
Garnet0.020.03
Prehnite 0.10.12
Bityite00
Others2.671.92
Publisher’s Note: MDPI stays neutral with regard to jurisdictional claims in published maps and institutional affiliations.

