Abstract
Beryl occurs in the ancient Roman mines at Wadi Nugrus, South Eastern Desert of Egypt. It ranges from small crystals to 10 mm in size, and it varies in color, appearing as bright green, pale green, dark green and brown-green with biotite inclusions. The trace and minor elements were analyzed by the SIMS method. The two rims are richer in Cs, Na, Mg, Fe, Sc, V, Rb and H2O than cores but are poor in Mn, Ca, Co, Sr and Li. The bright-green rim is richer than the pale-green one in Na, P, K, Ca, Fe, Rb, Cs and F, but poorer in Mg and Li. The alkaline elements (Cs, Na, Rb) and Fe correlate with the color zoning, and where beryl crystals have a maximum of these elements, the green color is strong and bright. The emerald of Wadi Nugrus has similarities with the geological setting of the Canadian emeralds. Emeralds occur along the contact zone between biotite schists, pegmatites and quartz veins. A large-scale interaction between Be-bearing magmatic fluids from granites and related pegmatites took place with hydrothermal fluids enriched in Cr, V, Sc, Mg and Ca after percolation through pre-existing serpentinite and talc carbonates, metagabbros and biotite schists and additional fluids bearing H2O, NaCl and CO2.
1. Introduction
The demands for beryllium metal (Be), oxides and alloys are steadily increasing their importance in atomic energy programs. It is well known that the mineral beryl (Be3Al2Si6O18) is one of the main resources for beryllium worldwide. This could be related to its versatile application, especially in nuclear industries, and it is used as a basic material in space shuttles and nuclear reactors [1,2,3]. On the other hand, beryl has various colors and durability that have made it a fascinating gemstone from the ancient periods to recent times. The different varieties of beryl are distinguished as colorless to white (goshenite), pale green to dark green (emerald, contains traces of Cr3+ and V3+), yellow or golden (heliodor, contains trace amounts of Fe3+), light blue (aquamarine, contains traces of Fe2+), dark blue beryl (maxixe, contains traces of Fe2+ and Fe3+), pink or rose (morganite, contains impurities of Mn2+) and red (bixbite, contains traces of Mn3+) [4,5,6,7,8].
Several occurrences were intensively explored for beryl all over the world. The paragenetic types of beryl mineral can be categorized from different geological settings worldwide according to [9,10,11] as follows: (1) highly evolved granites (S-type) and associated pegmatites [11,12,13,14,15,16,17,18,19,20,21]; (2) hydrothermal beryllium ore deposits related to metasomatized granites (e.g., greisen) [8,22,23,24,25,26]; (3) volcanogenic hosted beryllium deposits [14]; (4) emerald-bearing schist [3,8,17,18,27,28]; (5) carbonate-hosted beryllium ore deposit [6,14].
The Arabian Nubian Shield (ANS) has resulted from the collision during the Cryogenian–Ediacaran periods between East and West Gondwana [29]. Collision zones extend from the Middle East southward through Egypt, Sudan, Eritrea, Ethiopia, Somalia, Saudi Arabia, Yemen, Oman and Jordan (Figure 1a) and are dated from 700 and 580 Ma [30].
The ANS is a treasury of economic mineralization and could be categorized as follows: (1) the subduction stage dated ~870–635 Ma (first one), which is composed of island arc volcano–sedimentary associated with plutonic rocks [30]; (2) the continental collision stage dated ~630–580 Ma (second stage); and (3) the postcollision stage dated 580–540 Ma (third stage). The second and third stages are distinguished by the sedimentary basins’ development that accompanies calc-alkaline to alkaline igneous intrusion [31,32,33,34]. The basement rocks of the Eastern Desert of Egypt represent the western part of the ANS [35] (Figure 1a,b).
Beryl was an important emerald resource worldwide during the Roman era, especially in the northeastern part of Africa. In Egypt, beryl was mined in the Eastern Desert since antiquity. Intensive mining explorations of beryl were made by Romans wh`o built settlements that are very close to the “Cleopatra’s Mines” at Wadi Sikait in the vicinity of ancient emerald mining of Wadi Nugrus [36,37]. The Egyptian favorable environs of beryl in the Precambrian basement rocks can be categorized into two paragenetic types: (1) emerald in mica-schists and (2) beryl in granitoids [23,38,39,40].
However, granitoids bearing Be can be categorized into two types as follows: (1) peraluminous granites, Ta > Nb+Sn+Be±W-enriched, such as Li-rich albite granite (e.g., Nuweibi and Abu Dabbab areas), and (2) metasomatized granites, Nb >> Ta+Be+Sn+Mo+W-enriched, such as alkali feldspar granite (e.g., Homr Mukpid, Homr Akarim and Qash Amir areas) [23].
According to Abdalla and Mohamed [23], EPMA data showed that emeralds from mica schist at Wadi Sikait and Um Kabu (Egypt) are mainly composed of SiO2 and Al2O3 with average values of 65.12 and 15.06 wt%, respectively. The trace and minor elements, including TiO2, Cr2O3, FeO, MnO, NiO, MgO, CaO, Na2O and K2O, have average contents of 0.02, 0.13, 0.45, 0.03, 0.02, 2.33, 0.01, 1.8 and 0.04 wt%, respectively. The average water content is 2.38 wt%.
Shaw and Bunbury [41], based on EPMA data, stated that emeralds from Wadi Sikait (Egypt) were mainly composed of SiO2 and Al2O3 with average values of 64.52, 13.52 and 13.1 wt%, respectively. In contrast, trace and minor elements including TiO2, Cr2O3, FeO, MnO, MgO, CaO, Li2O, Na2O and K2O have average values of 0.01, 0.13, 0.3, 0.02, 2.53, 0.03, 0.02, 1.61 and 0.04 wt%.
The genesis of green emeralds from Sikait, Zabara and Umm Kabo in the South Eastern Desert of Egypt is an important subject. Grundmann and Morteani [42] showed that emerald-bearing schists and quartz veins could be interpreted as a result of (a) the major shear zone of the Wadi Nugrus which controls an extensive alkali-metasomatism followed by postmagmatic fluids; (b) an alternative interaction between pegmatites and the pre-existing rocks varying from basic to ultrabasic rocks; and (c) syn- to post-tectonic regional metamorphism and Na-metasomatism.

Figure 1.
(a) Geologic map showing the Arabian Nubian Shield (ANS); (b) geologic map showing the basement rocks of Neoproterozoic age in the Eastern Desert of Egypt [35]; (c) geological map of Wadi Nugrus, South Eastern Desert, Egypt, after [43,44,45,46].
As mentioned before, beryl mineralization occurs in different geological settings, but we focused on trace and minor element geochemistry of beryl from the ancient Roman sites. This work aims at investigating the zonation of beryl mineralization and the behavior of trace and minor elements from the marginal (rim) and central (core) zones, as well as beryl genesis in the Wadi Nugrus area, South Eastern Desert of Egypt.
2. Geologic Setting
The present work shows that the exposed basement rocks of Wadi Nugrus (Figure 1c) can be arranged from the oldest rock types to the youngest ones [43,44,45,46] as follows:
Biotite gneisses occur in the northern part of the mapped area (Figure 1c). These rocks are medium- to coarse-grained, greyish-white to pale pink colors, low to moderate relief. They are essentially composed of quartz, K-feldspar, plagioclase and biotite. Biotite gneisses are highly deformed, sheared, altered and affected by the deformational history of the pre-Pan-African gneisses and migmatites [43,47].
Mylonite (cataclastic) rocks occur in the northern part of the Wadi Nugrus area and are fine- to medium-grained, low in relief and capped by metasediments through thrust fault. They are composed of quartz, K-feldspar, plagioclase, muscovite and subordinate amounts of biotite. These rocks were highly deformed, altered and mylonitic fabric that resulted from ductile and brittle deformations. The studied area was dissected by shear zones having NNW–SSE, N–S and NE–SW trends [48,49]. Mylonites are considered as one of the important rocks bearing rare-metal mineralization in the studied area. They are enriched in uraninite, kasolite, uranophane, thorite, uranothorite, zircon, ishikawaite, columbite, fergusonite, xenotime, synchysite and cassiterite, as well as fluorite, apatite, barite and galena [47,50,51,52].
Serpentinites and talc carbonate (ultramafite) rocks are distributed as small masses, cavernous, fine- to medium-grained, and low to moderate in relief. They are pale gray to dark gray, violet-brown patches which characterize serpentinites and associated talc carbonates. These rocks are distinguished by their softness and are mainly composed of serpentinite, talc carbonates and magnesite minerals with chromite. The serpentinite rocks were thrust over metasediments, and the thrust fault strikes NE–SW and dips SE [48,49].
Metagabbros (ophiolitic gabbros) are widely distributed in the Wadi Nugrus as an elongated belt having NW–SE direction (Figure 1c). They are hard and medium- to coarse-grained and have black to dark gray colors. These rocks show low to moderate relief and are composed mainly of plagioclase, hornblende and pyroxene. The metagabbros are obducted on mylonites and intruded by the pegmatites.
Metasediments are represented by schists. They are highly foliated, lineated and fine-grained; they have low to moderate relief, whitish-grey to dark grey colors and NW–SE and NE–SW trends [48,49]. They are essentially composed of hornblende schists, mica schists and graphite schists. These rocks were intruded by muscovite granite and pegmatites and represent roof pendants on top of them. Quartz veins crosscut these rocks (Figure 2a,b). Ancient Roman mines were used for green beryl exploration (Figure 2c,d). These mining processes resulted in huge mine dumps containing significant amounts of beryl.
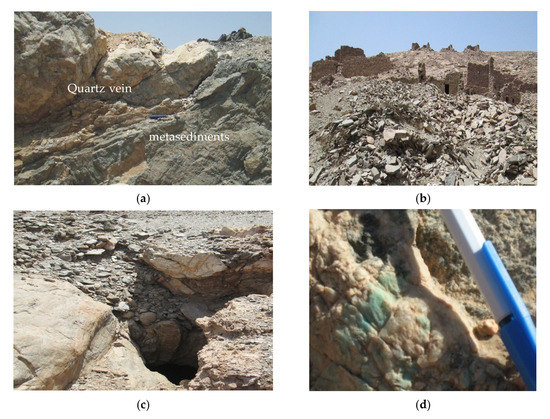
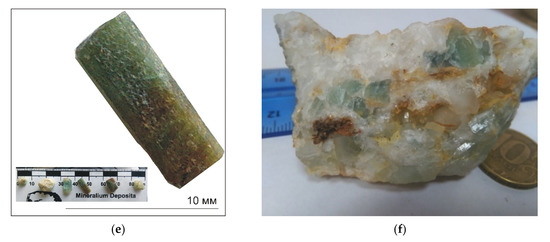
Figure 2.
(a) Quartz vein crosscut metasediments; (b,c) ancient Roman sites for beryl exploration; (d) green beryl (emerald) in quartz vein; (e) dark-green to brown-green emerald; (f) pale-green emerald in quartz.
Garnet muscovite granites occur as an elongate belt having NW–SE trend in the Um Solimate area. The granite has moderate to high relief and is highly fractured, jointed, cavernous and altered. It is distinguished by pink to reddish-pink colors; medium- to coarse-grained; and composed mainly of K-feldspar, plagioclase, quartz, muscovite and biotite, in addition to garnet. Um Solimate granites have been intruded into biotite gneisses, mylonites and metasediments and were crosscut by pegmatites and dikes.
Garnet muscovite granitic pegmatites vary from large to small masses that intruded all the pre-existing different basement rocks in the eastern part of Wadi Nugrus (Figure 1c). They occur as elongated belts having NW–SE trends and host xenoliths of different shapes and sizes. These rocks are very coarse-grained, composed mainly of megacrysts of K-feldspar, quartz muscovite and biotite in addition to garnet. Pegmatites are enriched in rare-metal mineralization, especially Bi–Ni–Ag–Nb–Ta in addition to U and Th [46]. They were crosscut by basic dikes as well as quartz veins bearing tourmaline and beryl (Figure 1c and Figure 2d–f). Greenish beryl crystals occur in the pegmatites, within the muscovite-rich zones, especially outer to intermediate zones, and crystals reach up to 3 cm long (Figure 2d–f). Beryl also occurs as disseminated grains in quartz veins crosscut by metasediments and muscovite granite.
3. Materials and Methods
Pure beryl samples were obtained from the ancient mining dumps along the contact between metasediments and pegmatites of Wadi Nugrus, South Eastern Desert of Egypt (Figure 1c), using crude sieving followed by hand picking.
During the preparation of the standard epoxy mount (1-inch diameter) with minerals, the crystal was cut perpendicular to the prism faces (the elongation axis) in order to be able to study the growth zoning of beryl along the traverse from the center (core) to the edge (rims) of the crystal in a plane parallel to the basal pinacoid. The cross-section, probably, mainly characterizes the composition of the growth zones of the {10 0} prism face (Figure 3a).
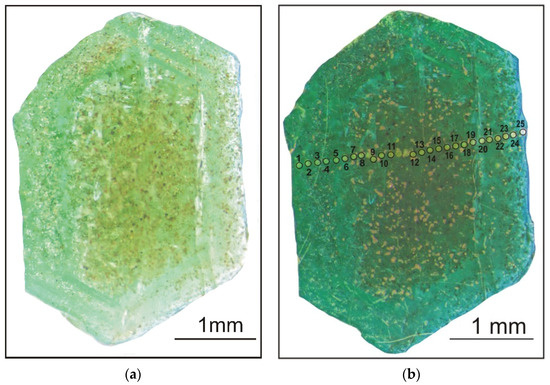
Figure 3.
Natural zoned beryl crystal from the Wadi Nugrus, South Eastern Desert, Egypt, without gold coating (a) and transverse section of the studied beryl (with gold coating) and 25 analytical points (b).
The contents of trace and minor elements, water and volatiles in beryl were determined by secondary ion mass spectrometry (SIMS) using a Cameca IMS-4f ion microprobe at the Yaroslavl branch of the Institute of Physics and Technology (IPT) named after K.A. Valiev, Russian Academy of Sciences. The basics of the measurement technique corresponded to those reported in [53,54,55,56].
The analyses were carried out in two steps using different protocols for the determination of volatiles (Cl, F, H) and light (B, Li) impurity elements and the main set (Na, Mg, P, K, Ca, Sc, Ti, V, Cr, Mn, Fe, Co, Ni, Ga, Rb, Cs). Primary O2− ions were accelerated to about 14.5 keV and focused at the sample surface into a spot about 20−30 µm in diameter. The intensity of primary ion current was 5 nA (protocol «volatiles») and 1.5 nA (main protocol). Positive secondary ions were collected from an area of 10 μm (protocol «volatiles») or 25 μm (main protocol) in diameter, limited by a field aperture. Molecular and ion clusters were energy-filtered using an offset voltage of −100 V, with an energy window of 50 eV. Three counting cycles were carried out with a discrete transition between mass peaks within a given set. The counting time was varied depending on signal intensity and was determined automatically by statistical control. The maximum counting time for any species in each cycle was 30 s.
The absolute concentrations of each element were calculated from the measured intensities of positive single-atom secondary ions (Ii), which were normalized to the intensity of secondary 30Si+ ions (I_30Si), using the relative sensitivity factors Ki: Ci = Ii/I_30Si × Ki × C_SiO2.
Calibration curves were based on the measurements of the set of well-characterized standard samples [57]. Quantification of phosphorus, scandium, iron, nickel and cobalt was carried out taking into account isobaric mass peak interference:
- The phosphorous content was estimated using a stripping procedure. The contribution of 30Si1H+ to the measured intensity of mass peak at 31 a.m.u. was determined from intensity 29Si+ and known abundances of natural silicon isotopes:
28Si1H+/30Si+ = I(29 a.m.u.)/30Si+ − 1.517
30Si1H+/30Si+ = 28Si1H+/30Si+/29.875
31P+/30Si+ = I(31 a.m.u.)/30Si+ − 30Si1H+/30Si+
- 2.
- When quantifying scandium, the subtraction of 29Si16O+ + 28Si17O+ ion signal in the range of 45 a.e.m. required additional measurement of signal intensity at the 44th mass (28Si16O+ + 44Ca+). The contribution of 44Ca+ was estimated by recalculating from measured 42Ca+ intensity and known natural calcium isotope abundances [58].
- 3.
- The 56Fe+ and 59Co+ signal was corrected regarding a Si2+ cluster ion spectrum, assuming that the Si+/Si2+ intensity ratio for this matrix is known and varies slightly if the sample charging level is controlled.
- 4.
- The contribution of 46Ti16O+ was taken into account when calculating nickel concentration by measuring the 62nd nickel isotope. TiO+ signal intensity was estimated by measuring 47Ti+ ion current intensity, and 47Ti+/46Ti16O+ was measured in standard glasses. Because Ti concentration in beryl is low (15–34 ppm), the corrected Ni concentration is very close to the uncorrected one.
Ion probing of water required known approaches to decrease the background level. Before measurements, each sample was kept for at least 12 h in a mass spectrometer’s analytical chamber, where high vacuum conditions were maintained. Analysis was preceded by the ion sputtering of conducting gold film and a surface pollutant layer at the area to be analyzed. Then the procedure of auto adjustment of the sample potential was applied. The static primary beam spot overlapped the field of view of the secondary ion optics (10 µm in diameter) centered at the presputtered crater (~40 × 40 μm). An anhydrous silicate (olivine) grain was introduced into each sample mount to measure the 1H+/30Si+ ion current ratio based on calibration relationships:
C[H2O]/C[SiO2] = (I(1H+) − I(1H+)bg)/I(30Si+) × RSF × K(SiO2)
C[H2O] and C[SiO2] are H2O and SiO2 concentrations in wt.%; I(1H+), I(1H+)bg and I(30Si+) are measured secondary ion intensities in imp/s; I(1H+)bg is the background signal intensity; and RSF is the relative sensitivity factor. The correction coefficient K(SiO2) takes into account the dependence of RSF on SiO2 concentration for which linear approximation was used:
K(SiO2) = (1 − (SiO2 − 50) × 0.0185)
Calibrations were obtained using samples of natural and artificial glasses (like NIST glasses) (in all, 28 standard samples), covering a wide range of variation in SiO2 (41 ÷ 77 wt%) and water (0.1 ÷ 8 wt.%) concentrations [59,60,61,62,63] (unpublished data of R.E. Bocharnikov). The results of calibration show that the maximum deviation from the reference value was no more than 15%, and the calculation error was 7%.
A similar approach was used for calculating fluorine and chlorine concentrations. The method for determining fluorine in silicate matrices is published in [64].
Standard glass NIST-610 [65] was used as a monitor before an analytical session. The trace and minor element detection limit ranges mainly from 0.005 to 0.010 ppm. The trace element measurement error did not exceed 10% for concentrations higher than 1 ppm and 20% for concentrations in the range of 0.1–1 ppm.
The analytical points (n = 25) are presented in Figure 3b, comprising the beryl sample’s rim and core parts. The points are labeled as 1–5 (bright-green rim), 20–25 (pale-green rim), and 6–19 (green-brown) for the core.
4. Results
4.1. Characteristics of Beryl Mineralization
The beryl crystals from Wadi Nugrus are dominated by hexagonal prisms, elongate with marked zoning. The selected beryl crystal was characterized by transparent and green beryl (emerald) on a polished surface with a zonal change in color (Figure 3a). The color transparency and saturation vary from the bright-green rim (spots 1–5) on the left side of the beryl crystal, to the brown-green core (spots 6–19), to the pale-green rim (spots 20–25) on the right side that could reveal zoning for a number of trace and minor elements (Figure 3a,b and Table 1). The transparent area of the rim part on the left side through the cross-section is most likely indicating a large number of gas–liquid inclusions [20]. The selected spots are listed on the profile are chosen in such a way to cover the different colors in the zoned beryl crystal from core to both rims. The direction of the profile itself is selected in order to avoid inclusions and cracks.

Table 1.
Representative trace and minor element concentrations (ppm) in the analyzed beryl from Wadi Nugrus, South Eastern Desert, Egypt.
4.2. Compositional Zoning of Beryl
The concentrations of representative trace and minor elements (in ppm) in the analyzed beryl crystal from Wadi Nugrus, South Eastern Desert, Egypt, are given in Table 1, and their spatial distribution is represented in Figure 4a–v. The chemical zoning is visualized through profile from the bright-green rim, through the brown-green core, to the pale-green rim (spots 1–25) as mentioned (Figure 3 and Figure 4, Table 1).
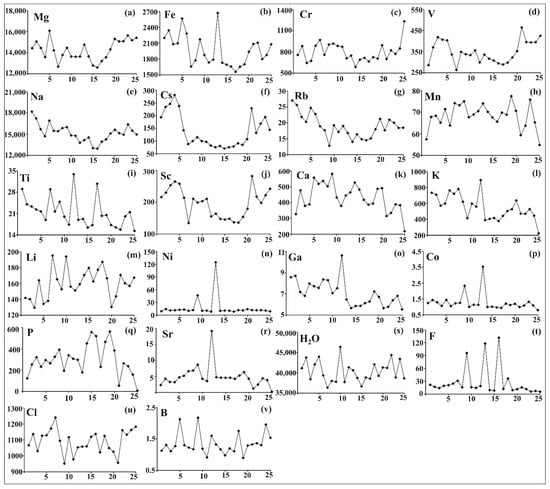
Figure 4.
Zoning of the distribution of trace and minor elements (ppm) in the analyzed beryl from Wadi Nugrus, South Eastern Desert, Egypt. Zoning profiles for: (a) Mg in (ppm); (b) Fe in (ppm); (c) Cr in (ppm); (d) V in (ppm); (e) Na in (ppm); (f) Cs in (ppm); (g) Rb in (ppm); (h) Mn in (ppm); (i) Ti in (ppm); (j) Sc in (ppm); (k) Ca in (ppm); (l) K in (ppm); (m) Li in (ppm); (n) Ni in (ppm); (o) Ga in (ppm); (p) Co in (ppm); (q) P in (ppm); (r) Sr in (ppm); (s) H2O in (ppm); (t) F in (ppm); (u) Cl in (ppm); (v) B in (ppm).
The distribution of trace and minor elements is consistent with the color zoning of beryl. The two rims show higher concentrations of Cs, Na, Mg, Fe, Sc, V and Rb than the core, but they contain low content of Mn, Ca and Li (Figure 4, Table 1).
Mg content in both rims and core of the crystal has nearly U-shaped zoning (Figure 4a). The average values of Mg are 14,714, 15,279 and 13,634 ppm in the bright-green rim, pale-green rim and brown-green core, respectively. Mg value is 16,077 ppm at spot 5 and 12,590 ppm at spot 16 (Figure 4a, Table 1).
Fe content shows average values of 2257, 1980 and 1853 ppm, corresponding to the bright-green rim, pale-green rim and brown-green core, respectively. In the core of the zoned beryl crystal, Fe content reaches 2671 ppm at spot 13 and decreases to 1558 ppm at spot 17, showing bell-shaped zoning (Figure 4b, Table 1). However, the distribution of Fe in both rims does not change in the same way dramatically when compared with Mg, which has U-shaped zoning (Figure 4b).
Cr is identified as one of the main chromophore elements and has nearly asymmetric U-shaped zoning, with average content values of 771, 880 and 777 ppm, corresponding to the bright-green rim, pale-green rim and brown-green core, respectively.
The core is characterized by its uniform distribution of these trace and minor elements (Figure 4d–g,j). The bright-green rim shows high average values of 16,569, 239, 23.9 and 245 ppm for Na, Cs, Rb and Sc, respectively, while the pale-green rim shows a high average value of 404 ppm for V (Table 1). The distributions of V, Na, Cs, Rb and Sc have U-shaped zoning with marked enrichment in both rims.
The distribution of Mn is characterized by a bell-shaped array with a markedly enriched core. The average values of Mn content are 66.0, 64.9 and 70.4 ppm in the bright-green rim, pale-green rim and brown-green core, respectively. The highest values are 77 and 76 ppm, recorded at spots 19 and 23 (Figure 4h, Table 1).
The distribution of Ti is very complex and does not show clear zoning (Figure 4i). The more transparent edge (bright-green rim) is characterized by a high average value of 24.1 ppm for Ti, while the average values 17.7 and 22.1 ppm of Ti concentrations correspond to the pale-green rim and brown-green core (Table 1).
The distribution of Ca, in general, varies within color zoning crystals with a markedly enriched core with bell-shaped features (Figure 4k). Ca contents are not stable, fluctuating with a marked spike in contents followed by a decrease towards the boundaries. Average contents of Ca are 426, 355 and 468 ppm, corresponding to the bright-green rim, pale-green rim and brown-green core, respectively (Table 1).
The distribution of K differs along the zoned beryl crystal (Figure 4l). It shows the highest value (895 ppm) at spot 12, showing a bell shape, followed by low contents at the crystal boundaries. The average values of K are 675, 462 and 546 ppm in the bright-green rim, pale-green rim and brown-green core, respectively (Figure 4l, Table 1).
The distribution of Li shows higher contents in the core than in both rims and is bell-shaped. The averages of Li are 142, 155 and 168 ppm in the bright-green rim, pale-green rim and brown-green core, respectively (Figure 4m, Table 1).
The concentrations of Ni, Ga and Co are lower than 14 ppm (Figure 4n–p, Table 1), with the exception of two spots (9 and 14) having 47 and 125 ppm of Ni. The distribution of Ni and Co shows a bell shape, followed by a decrease at the crystal boundaries.
The distribution of P is similar to Ca, having a bell shape with a more enriched core (average 364 ppm) than the two rims (245 and 185 ppm for bright-green and pale-green rims, respectively) (Figure 4q, Table 1).
Sr is distinguished by low contents and has a marked bell-shaped distribution at spot 12 (19 ppm) followed by a decrease in concentration at rims (Figure 4r, Table 1).
The distribution of volatiles (H2O, Cl and F) does not show defined zoning (Figure 4s–u). The water contents have average values of 41,884, 41,315 and 39,418 ppm for the bright-green rim, pale-green rim and brown-green core, respectively. The same level of water content is well observed at spot 10 (core) and reached 46,383 ppm, whereas the F and Cl contents at spot 10 show marked depletion (Figure 4t,u). The Cl contents generally show higher average values in both rims than in core: 1097, 1103 and 1084 ppm for the bright-green rim, pale-green rim and brown-green core, respectively (Figure 4u, Table 1). On the contrary, the average contents of F have the highest value (38.6 ppm) in the core, whereas 18.4 and 9.42 ppm values correspond to the bright-green rim and pale-green rim (Figure 4t, Table 1). B distribution shows low contents, and zoning features are not manifested (Figure 4v).
4.3. Binary Correlation Diagrams Using Trace and Minor Elements
Based on the plots of binary diagrams, we can say that the content of the elements Na, Mg and V versus Cs increases from the center of the crystal to its edge. In this case, the edge parts are depleted in Mn, Li and F versus Cs when compared with the central zone (Figure 5a–f). The plot of the binary Fe–Mg diagram shows a noticeable positive correlation with an obvious enrichment of the edge zone of the crystal (Figure 5g).
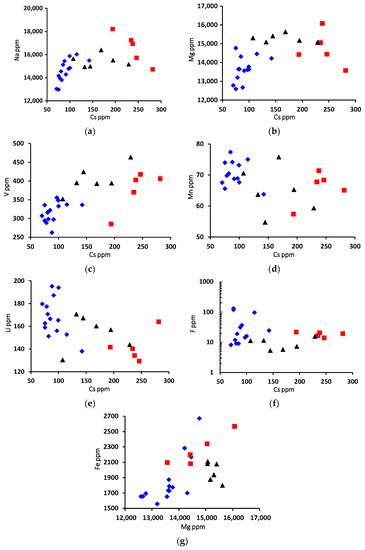
Figure 5.
Binary diagrams show the correlation of trace and minor elements (ppm) in beryl from Wadi Nugrus, South Eastern Desert, Egypt. Symbols are the same as in all of the following diagrams: red square for bright-green rim (spots 1–5), black triangle for pale-green rim (spots 20–25) and blue lozenge for brown-green core (spots 6–19) of beryl crystal. (a) Na vs. Cs; (b) Mg vs. Cs; (c) V vs. Cs; (d) Mn vs. Cs; (e) Li vs. Cs; (f) F vs. Cs; (g) Fe vs. Mg binary diagrams.
4.4. Biotite Inclusions
There is a noticeable large amount of mica in the crystals, especially biotite, distributed evenly over the zones of crystal growth. The central zone is enriched with inclusions compared to edge zones. This distribution of biotite also affects the crystal’s color and adds a brown tint to the central zone (Figure 3a).
The distribution of trace and minor elements shows an obvious higher content in the core, especially at spots B1, B2 and B3 with values of 7606, 2143 and 1553 ppm for K; 24,199, 18,072 and 18,270 ppm for Mg; 6076, 3062 and 3029 ppm for Fe; and 448, 158 and 108 ppm for Ti, than in other areas, which could be a good indicator of biotite inclusions (Figure 6).
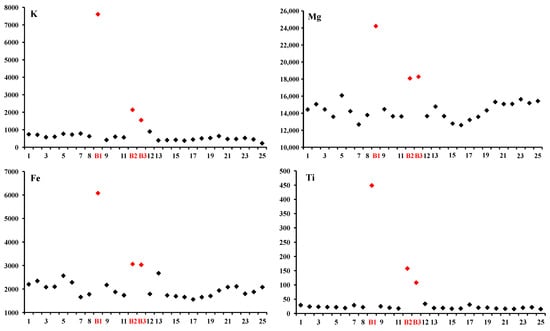
Figure 6.
K, Mg, Fe and Ti as good indicators of biotite inclusion through zoning profiles of beryl from Wadi Nugrus, South Eastern Desert, Egypt.
5. Discussion
5.1. Petrogenetic Aspects of Beryl
The garnet muscovite granite and related pegmatites affected the pre-existing ultramafites of serpentinite and talc carbonates, metagabbros and metasediments (schists) along their contacts, forming mineralized contact zones enriched in rare-metal mineralization. Pegmatites are late magmatic stages which are derived from garnet muscovite granite enriched in uraninite, coffinite, uranothorite, thorianite, zircon, monazite, columbite, microlite, uranopyrochlore, xenotime, barite, apatite, galena and fluorite, as well as noble metal mineralization such as argentite, native Ni and Bi with beryl and tourmaline [46].
The serpentinite and talc carbonates have MgO contents of 43.8–45.7 wt% with an average of 44.8 wt%, Cr contents of 2426–2709 ppm with an average 2648 ppm and V contents of 14–42 ppm with an average 29 ppm, whereas the metagabbros reach up to 9.3 wt%, 281 ppm and 201 ppm for MgO, Cr and V, respectively, at Sol Hamed, South Eastern Desert of Egypt [66,67]. On the other hand, Be reached up to 604 and 1700 ppm in granitic pegmatites (albite or sodic aplite dike) in the Wadi Sikait and Wadi Nugrus areas, South Eastern Desert of Egypt [44]. BeO in green beryl from quartz tourmaline veins and from phlogopite schist rocks ranges from 13.36 to 13.83 wt% [27] in Kafubu, Zambia. Be could be related to metasomatic transfer via interaction of granitic pegmatite fluids with its contact ultramafic rocks [44]. At the contact between pegmatites enriched in Be and serpentinite and related talc carbonates enriched in Cr and V, the metasomatic fluids can dissolve quartz as well as Cr and V that could be remobilized from serpentinite bearing chromite, and Be could come from pegmatites to form green emerald.
The successive intrusion of muscovite granite could help to form the nature of the emerald from Wadi Nugrus, with pegmatites as well as quartz-bearing beryl arising from exsolution of a fluid/pegmatite enriched in volatile-rich magma bearing H2O, NaCl and CO2, which is similar in situation to aquamarine genesis in Canada [68,69] (Figure 7).
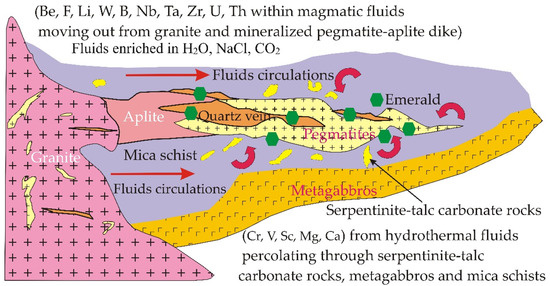
Figure 7.
Genetic model (modified after Groat et al. [68] and Beal and Lentz [69]) for green beryl (emerald) along the mineralized contact between metasediments and pegmatites at Wadi Nugrus, South Eastern Desert of Egypt.
The gem zone of emerald in the study area is developed from fluids: fluid (1) enriched by Mg, Cr and V from serpentinite and related talc carbonate and metagabbros with fluid (2) enriched in Be as well as F, Li, W, B, Nb, Ta, Zr, U and Th from muscovite granite and their pegmatite. The abundance of beryl within the contact zones of pegmatites with metasediments suggests that beryl is formed from two heterogeneous natural fluid circulations. So, the emerald present within certain veins could be formed from a hydrothermal fluid enriched in the elements that are necessary for emerald formation from the muscovite granite and related pegmatites during progressive crystallization with the pre-existing basement rocks of the study area.
The emerald is associated with intensive fluid–rock interactions, including K- and Na-metasomatism of granitic pegmatites. This type of genetic pathway emerald is mostly common worldwide [70,71,72,73].
5.2. Trace and Minor Element Geochemistry as a Guide for Paragenetic Beryl Mineralization
The binary correlation diagram between the alkaline+light elements and transition elements + Ca + Mg shows a positive correlation trend in the analyzed beryl from brown-green core to bright-green rim. The bright-green rim shows higher contents in alkaline+light elements than do the other spots of brown-green core and pale-green rim. It obviously shows that each crystal zone’s chemical composition has an individual trend (Figure 8).
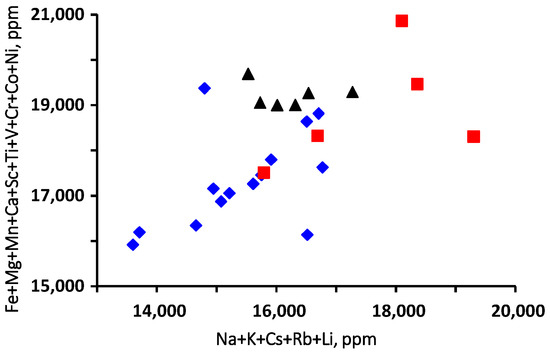
Figure 8.
Binary diagram shows the correlation between transition+Ca+Mg and alkaline+light elements in the analyzed zoning of beryl from Wadi Nugrus, South Eastern Desert, Egypt. Symbols are the same as in Figure 5: red square for bright-green rim (spots 1–5), black triangle for pale-green rim (spots 20–25) and blue lozenge for brown-green core (spots 6–19) of beryl crystal.
The Na/Li and Li/Cs relationship of alkalis in beryl could be a good indicator to reflect the geochemical features and genesis of mineral-forming fluid [13]. Neiva and Neiva [74] mention a decrease in both ratios during fractionation. Cs/Na, on the other hand, is a direct measure of fractionation [75] and should correlate negatively with Mg/Fe along with the fractionation trend. The binary diagram of Na/Li versus Li/Cs (Figure 9a) shows that higher Na/Li characterizes the bright-green rim with a near-constant Li/Cs value, whereas analyses show a slight increase in Li/Cs values with a decrease in Na/Li values characterizing the pale-green rim to the brown-green core. The Na/Li–Li/Cs diagram shows an obvious negative correlation towards the brown-green core (Figure 9a). During fluid evolution, Na and Cs increased from brown-green core to bright-green rim and may be responsible for the color zoning of the analyzed beryl. Na-metasomatism (albitization) could affect the high Na and Cs contents in rims [23,44].
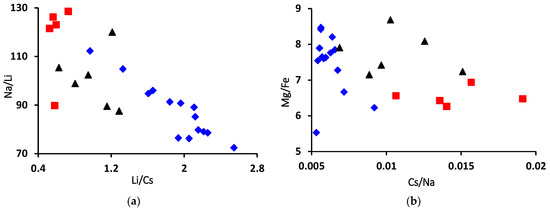
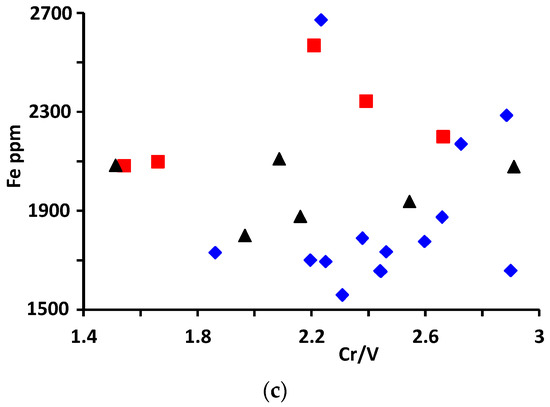
Figure 9.
(a) Na/Li vs. Li/Cs ratios, (b) Mg/Fe vs. Cs/Na ratios and (c) Fe vs. Cr/V ratio plots in the analyzed beryl from Wadi Nugrus. Symbols are the same as in Figure 5: red square for bright-green rim (spots 1–5), black triangle for pale-green rim (spots 20–25) and blue lozenge for brown-green core (spots 6–19) of beryl crystal.
The Mg/Fe ratio is an indicator for the rock’s chemical composition in which the mineral-forming fluids have interacted, and the alkalis characterize the chemical composition of these fluids. Thus, the fluids could be evolved to different degrees that are responsible for the formation of beryl mineralization. The Mg/Fe ratio is high in the brown-green core with constant Cs/Na (Figure 9b). The binary diagram shows a marked negative correlation towards the bright-green rim (Figure 9b).
The binary diagram of the Cr/V ratio versus Fe is represented in Figure 9c. All the analyzed beryl shows that the Cr/V ratio varies between 1.51 and 2.91, while Fe varies between 1558 and 2670 ppm. The distribution of the analyzed beryl from Wadi Nugrus is similar to emerald from Afghanistan (Panjsher Valley), which is characterized by Cr/V ratios that vary between 0.83 and 2.64 and Fe values from 781 to 2530 ppm [18].
The emerald deposits of Swat Valley, Santa Terezinha de Goiás and Habachtal have formed during the interaction of metamorphic rocks with magmatic fluids, with high Cs concentration in emeralds from the Santa Terezinha. The binary diagram between Na/Li and Cs/Ga ratios [76] strengthens this hypothesis. Figure 10 shows that beryl from Wadi Nugrus, Egypt, occurs in the same chemical field as the emerald deposits from Swat Valley, Santa Terezinha de Goiás and Habachtal.
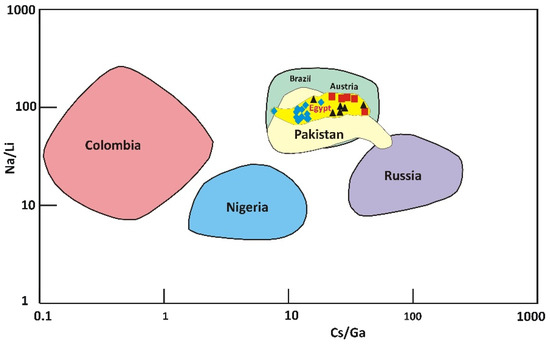
Figure 10.
Na/Li vs. Cs/Ga binary discrimination diagram indicates the relationships between beryl from Wadi Nugrus, South Eastern Desert, Egypt, and different localities worldwide (Russia, Nigeria, Colombia, Santa Terezinha, Habachtal and Swat Valley) according to [76]. The diagram shows that the chemical ratios of Cs/Ga and Na/Li of emerald from Santa Terezinha de Goiás (Brazil), Swat Valley (Pakistan), and Habachtal (Austria) fall in the same field. Symbols are the same as Figure 5: red square for bright-green rim (spots 1–5), black triangle for pale-green rim (spots 20–25) and blue lozenge for brown-green core (spots 6–19) of beryl crystal.
The studied beryl is characterized by a high Cs/Ga ratio with a mean of 31.0, 12.9 and 26.8 for bright-green rim, brown-green core and pale-green rim, respectively. It is similar to Swat Valley, Santa Terezinha de Goiás and Habachtal emerald deposits, indicating appreciable Cs contents (pointing to a magmatic source) and a high Na/Li ratio related to higher Na concentration [58]. The analyzed beryl contains high mean H2O contents of 4.19, 3.94 and 3.86 wt% for bright-green rim, brown-green core and pale-green rim, respectively. This feature of high mean H2O content is similar to that determined for Habachtal (3.1 wt.%, n = 3), Santa Terezinha de Goiás (2.9 wt.%, n = 5) and Swat Valley (3.4 wt.%, n = 1) [17,70,77]. This could be probably a genetic Be–Cs source for emerald in these deposits, i.e., magmatic intrusions with huge fluid circulation indicative of metasomatism in a metamorphic environment (schist in Wadi Nugrus).
The Fe–Rb, Fe–Cs, Rb–Cs and Li–Fe discrimination diagrams (Figure 11) were used to differentiate between emeralds from Wadi Nugrus, South Eastern Desert, Egypt, and those worldwide [78]. The analyzed beryl spots from the Wadi Nugrus fall into the field of Russia (Urals) using Fe–Rb; straddle the boundary line between the fields of Afghanistan, Ethiopia and Russia (Urals) using Fe–Cs; and gravitate towards the fields of Russia (Urals), Brazil and Ethiopia using Rb–Cs and the fields of China and Afghanistan using Li–Fe.
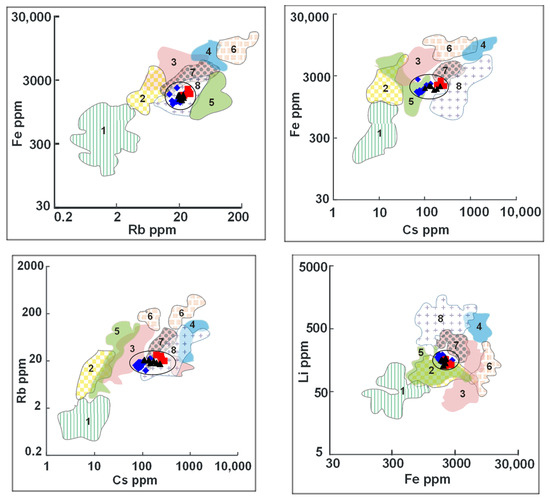
Figure 11.
Fe vs. Rb, Fe vs. Cs, Rb vs. Cs and Li vs. Fe binary discrimination diagrams show the relationships of trace and minor elements (ppm) between beryl from Wadi Nugrus, South Eastern Desert, Egypt, and beryl from various localities after Saeseaw et al. [78]. Compositional fields of beryl from various occurrences: 1—Colombia; 2—China; 3—Brazil; 4—Zambia; 5—Afghanistan; 6—Madagascar; 7—Ethiopia; 8—Russia (Urals). Symbols are the same as Figure 5: red square for bright-green rim (spots 1–5), black triangle for pale-green rim (spots 20–25) and blue lozenge for brown-green core (spots 6–19) of beryl crystal.
Figure 12a–c shows the elemental average content values of emerald from Wadi Nugrus (Egypt) and worldwide according to Aurisicchio et al. [58].
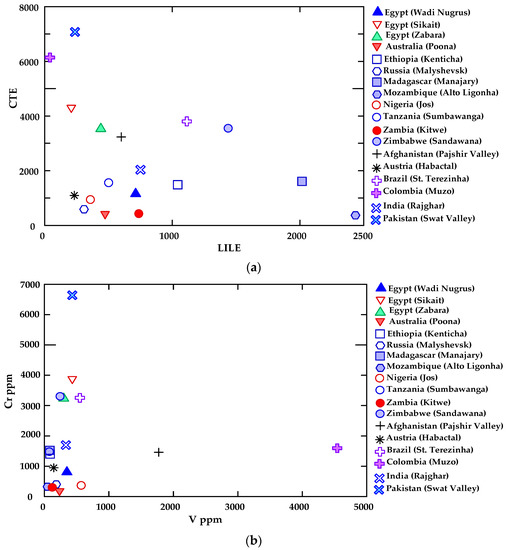
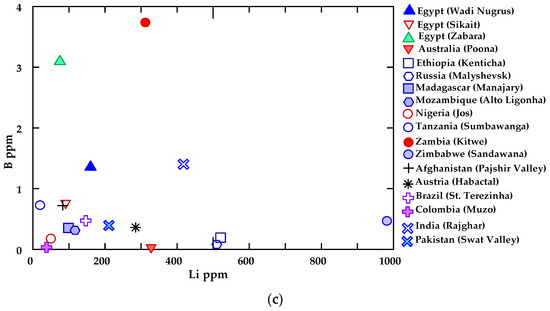
Figure 12.
(a) Chromophore and transition element (CTE) vs. large ion lithophile element (LILE), (b) Cr vs. V and (c) B vs. Li binary diagrams show a comparison between beryl from Wadi Nugrus and beryl from other locations worldwide according to Aurisicchio et al. [58], using average trace and minor elements (ppm) of the analyzed emeralds.
These binary diagrams present the relations of the chromophore and transition elements (CTEs) (Cr and V) versus large ion lithophile elements (LILEs) (Rb, Ba, K, Sr, Cs), Cr versus V and B versus Li.
All emeralds from the studied area and worldwide have low concentrations of Ba, Sr and B. Emerald from Wadi Nugrus (Egypt) has an average value of 714 ppm for LILEs, which is higher than the values reported for emeralds originating from Colombia, Egypt (Sikait), Austria, Pakistan, Russia, Nigeria, Egypt (Zabara), Australia and Tanzania, according to Aurisicchio et al. [58] (Figure 12a). The CTEs in emerald from Wadi Nugrus (Egypt) show higher concentration (reaching 1149 ppm) than those from Mozambique, Austria, Zambia, Russia, Nigeria and Australia, according to Aurisicchio et al. [58] (Figure 12a). However, emeralds from Mozambique show the highest LILE content (with an average of 2436 ppm) and lower CTE content (with an average of 365 ppm). In contrast, emeralds from Pakistan display the highest CTE content (average 7068 ppm) and a lower content of LILEs (average 238 ppm) (Figure 12a).
The average contents of emerald from Wadi Nugrus (Egypt) show a higher concentration of V (349 ppm) and Cr (800 ppm) than those from Australia, Zambia, Mozambique and Russia, according to Aurisicchio et al. [58] (Figure 12b). On the other hand, emeralds from Pakistan present the highest Cr content (average 6635 ppm) and a low V content (average 433 ppm), while those from Colombia exhibit the highest V content (average 4543 ppm) and an average Cr content of 1591 ppm, according to Aurisicchio et al. [58] (Figure 12b).
Emeralds from Wadi Nugrus show a higher concentration of B (average 1.35 ppm) than those worldwide according to Aurisicchio et al. [58], except those from Egypt (Zabara) and Zambia with average B concentrations of 3.09 and 3.73 ppm, respectively (Figure 12c). Emeralds from Wadi Nugrus display a higher concentration of Li (average 160 ppm) than those from Egypt (Sikait), Egypt (Zabara), Madagascar, Nigeria, Tanzania, Afghanistan, Brazil and Colombia, according to Aurisicchio et al. [58]. Although emerald from Zimbabwe shows the highest Li content (average 983 ppm), it contains B in lower concentrations (average 0.46 ppm), according to Aurisicchio et al. [58] (Figure 12c).
6. Conclusions
- Beryl from Wadi Nugrus shows high contents of large ion lithophile elements (LILEs), especially Rb, K and Cs, but it has low concentrations of Sr and B.
- Cs, Na, Mg, Fe, Sc, V, Rb and H2O show a U-shaped pattern in the zoned emerald, indicating markedly enriched rims compared with the core, whereas Mn, Ca, Co, Sr and Li have bell-shaped zoning with markedly enriched core compared to both rims. On the other hand, Cr, Ti, K, Ni, Ga, F, Cl and B have no marked zoning (or very complex zoning).
- The bright-green rim exhibits higher contents of Na, P, K, Ca, Fe, Rb, Cs and F than the pale-green rim but contains Mg and Li in low concentrations. The alkaline elements (Cs, Na, Rb) and Fe are responsible for the color zoning.
- Granites and related pegmatites and aplite dikes are considered good sources for Be, which interacted with hydrothermal fluids enriched in Cr, V, Sc, Mg and Ca from the pre-existing ultramafic and mafic rocks in addition to fluids bearing water, NaCl and CO2.
- Emerald from Wadi Nugrus displays a higher concentration of LILEs than the emeralds from Colombia, Egypt (Sikait), Austria, Pakistan, Russia, Nigeria, Egypt (Zabara), Australia and Tanzania, while the chromophore and transition elements (CTEs) (Cr and V) have higher contents in the studied emerald than in emeralds from Mozambique, Austria, Zambia, Russia, Nigeria and Australia.
Author Contributions
Conceptualization, A.E.A.G., S.G.S. and M.A.A.; methodology, S.G.S. and A.K.G.; software, A.E.A.G., S.G.S. and A.K.G.; validation, A.E.A.G., S.G.S. and M.A.A.; formal analysis, S.G.S., A.E.A.G. and A.K.G.; investigation, A.E.A.G. and M.M.G.; resources, M.A.A. and M.M.G.; data curation, S.G.S., A.E.A.G. and A.K.G.; writing—original draft preparation, A.E.A.G.; writing—review and editing, A.E.A.G., A.E., S.G.S., A.K.G., M.A.A. and M.M.G.; visualization, S.G.S. and A.E.A.G.; supervision, S.G.S., A.E., M.A.A. and A.V.N.; project administration, S.G.S., A.K.G., A.E., A.E.A.G., M.A.A. and M.M.G.; funding acquisition, A.E. All authors have read and agreed to the published version of the manuscript.
Funding
Research of beryl geochemistry was partly supported by a State contract of the Institute of Precambrian Geology and Geochronology of the Russian Academy of Sciences (No. FMUW-2022-0005). The article processing charge (APC) was covered by “Dunarea de Jos” University of Galati, Romania.
Data Availability Statement
Data are contained within the article.
Acknowledgments
We thank Evgeny Potapov and Sergey Simakin who assisted with measuring beryl trace and minor element compositions. The authors Antoaneta Ene and Ahmed Abdel Gawad acknowledge the support of “Dunarea de Jos” University of Galati, Romania, through grant No. RF3621/2021.
Conflicts of Interest
The authors declare no conflict of interest.
References
- Pahler, R.E. The role of beryllium in the Atomic Energy Program. In The Metal Beryllium, 5th ed.; White, D.W., Burke, J.E., Eds.; The American Society for Metals: Cleveland, OH, USA, 1995; Chapter II-B. [Google Scholar]
- Grew, E.S. Mineralogy, petrology and geochemistry of beryllium: An introduction and list of beryllium minerals. Rev. Mineral. Geochem. 2002, 50, 1–76. [Google Scholar] [CrossRef]
- Barton, M.D.; Young, S. Non-pegmatitic deposits of beryllium: Mineralogy, geology, phase equilibria and origin. Rev. Mineral. Geochem. 2002, 50, 591–691. [Google Scholar] [CrossRef]
- Černý, P. Mineralogy of beryllium in granitic pegmatites. Rev. Mineral. Geochem. 2002, 50, 405–444. [Google Scholar] [CrossRef]
- Simmons, W.B.; Pezzotta, F.; Shigley, J.E.; Beurlen, H. Granitic pegmatites as sources of colored gemstones. Elements 2012, 8, 281–287. [Google Scholar] [CrossRef]
- Sardi, F.E.G. Pegmatitic beryl as indicator of melt evolution: Example from the Velaco district, Pampeana pegmatite province, Argentina and review of worldwide occurrences. Can. Mineral. 2014, 52, 809–836. [Google Scholar] [CrossRef]
- London, D. Reading Pegmatites: Part 1—What Beryl Says. Rocks Miner. 2015, 90, 138–153. [Google Scholar] [CrossRef]
- Surour, A.A.; Omar, S.A.M. Historiography and FTIR spectral signatures of beryl crystals from some ancient Roman sites in the Eastern Desert of Egypt. Environ. Earth Sci. 2020, 79, 520. [Google Scholar] [CrossRef]
- Groat, L.A.; Giuliani, G.; Marshall, D.D.; Turner, D. Emerald deposits and occurrences: A review. Ore. Geol. Rev. 2008, 34, 87–112. [Google Scholar] [CrossRef]
- Arif, M.; Henry, D.J.; Moon, C.J. Cr-bearing tourmaline associated with emerald deposits from Swat, NW Pakistan: Genesis and its exploration significance. Am. Mineral. 2010, 95, 799–809. [Google Scholar] [CrossRef]
- Daneshvar, N.; Azizi, H.; Asahara, Y.; Tsuboi, M.; Minami, M.; Mohammad, Y.O. Geochemistry and genesis of beryl crystals in the LCT pegmatite type, Ebrahim-Attar mountain, Western Iran. Minerals 2021, 11, 717. [Google Scholar] [CrossRef]
- Abdalla, H.M.; El-Sayed, A.A.; El-Afandy, A.H. Geochemical and mineralogical investigation of Wadi Ghazala beryl occurrence, SE Sinai, Egypt: An example of abyssal Be-pegmatites. Egypt J. Geol. 2001, 45, 151–168. [Google Scholar]
- Bidny, A.S.; Baksheev, I.A.; Popov, M.P.; Anosova, M.O. Beryl from deposits of the Ural Emerald Belt, Russia: ICP–MS–LA and infrared spectroscopy study. Geologiya 2011, 2, 34–41. [Google Scholar] [CrossRef]
- Foley, N.K.; Jaskula, B.W.; Piatak, N.M.; Schulte, R.F.; Beryllium Schulz, K.J.; DeYoung John, J.H., Jr.; Seal, R.R., II; Bradley, D.C. Beryllium; U.S. Geological Survey: Reston, VA, USA, 2017.
- Bačík, P.; Fridrichová, J.; Uher, P.; Rybár, S.; Bizovská, V.; Luptáková, J.; Vrábliková, D.; Pukančík, L.; Vaculovič, T. Octahedral substitution in beryl from weakly fractionated intragranitic pegmatite Predné Solisko, Tatry Mountains (Slovakia): The indicator of genetic conditions. J. Geosci. 2019, 64, 59–72. [Google Scholar] [CrossRef]
- Bačík, P.; Fridrichová, J. The site occupancy assessment in beryl based on bond-length constraints. Minerals 2019, 9, 641. [Google Scholar] [CrossRef]
- Giuliani, G.; Groat, L.A.; Marshall, D.; Fallick, A.E.; Branquet, Y. Emerald deposits: A review and enhanced classification. Minerals 2019, 9, 105. [Google Scholar] [CrossRef]
- Karampelas, S.; Al-Shaybani, B.; Mohamed, F.; Sangsawong, S.; Al-Alawi, A. Emeralds from the most important occurrences: Chemical and spectroscopic data. Minerals 2019, 9, 561. [Google Scholar] [CrossRef]
- Lyalina, L.M.; Selivanva, E.A.; Zozulya, D.; Ivanyuk, G.Y. Beryllium mineralogy of the Kola Peninsula, Russia—A review. Minerals 2019, 9, 12. [Google Scholar] [CrossRef]
- Gavrilchik, A.K.; Skublov, S.G.; Kotova, E.L. Features of trace element composition of beryl from the Uralian Izumrudnye kopi. Mineralogy 2021, 7, 32–46. [Google Scholar] [CrossRef]
- Shen, J.-Q.; Hu, Z.-K.; Cui, S.-Y.; Zhang, Y.-F.; Li, E.-Q.; Liang, W.; Xu, B. A study on beryl in the Cuonadong Be-W-Sn polymetallic deposit, Longzi County, Tibet, China. Crystals 2021, 11, 777. [Google Scholar] [CrossRef]
- Laurs, B.M.; Dilles, J.H.; Snee, L.W. Emerald mineralization and metasomatism of amphibolite, Khaltaro granitic pegmatite hydrothermal vein system, Haramosh mountains, northern Pakistan. Can. Mineral. 1996, 34, 1253–1286. [Google Scholar]
- Abdalla, H.M.; Mohamed, F.H. Mineralogical and geochemical investigation of emerald and beryl mineralization, Pan-African belt of Egypt: Genetic and exploration aspects. J. Afr. Earth Sci. 1999, 28, 581–598. [Google Scholar] [CrossRef]
- Gavrilenko, E.V.; Calvo Pérez, B.; Castroviejo Bolibar, R.; Garcia Del Amo, D. Emeralds from the Delbegetey deposit (Kazakhstan): Mineralogical characteristics and fluid-inclusion study. Mineral. Mag. 2006, 70, 159–173. [Google Scholar] [CrossRef]
- Abdalla, H.M. Mineralogical and geochemical characterization of beryl-bearing granitoids, Eastern Desert, Egypt: Metallogenic and exploration constraints. Resour. Geol. 2008, 59, 121–139. [Google Scholar] [CrossRef]
- Gavrilchik, A.K.; Skublov, S.G.; Kotova, E.L. Trace element composition of beryl from the Sherlovaya Gora deposit, Southeastern Transbaikalia, Russia. Zap. RMO Proc. Russ. Mineral. Soc. 2021, 2, 1–14. (In Russian) [Google Scholar]
- Seifert, A.V.; Žaček, V.; Vrána, S.; Pecina, V.; Zachariáš, J.; Zwaan, J.C. Emerald mineralization in the Kafubu area, Zambia. Bull. Geosci. 2004, 79, 1–40. [Google Scholar]
- Khaleal, F.M.; El-Bialy, M.Z.; Saleh, G.M.; Ibrahim, W.S.; El Dawy, M.N. The Geology, geochemistry and mineralogy of beryl mineralization in Zabara area, South Eastern Desert, Egypt. Int. J. Min. Sci. 2019, 5, 18–34. [Google Scholar]
- Stern, R.J. Arc assembly and continental collision in the Neoproterozoic East African orogen: Implications for the consolidation of Gondwana. Annu. Rev. Earth Planet. Sci. 1994, 22, 319–351. [Google Scholar] [CrossRef]
- Moghazi, A.M.; Ali, K.A.; Wilde, A.; Zhou, Q.; Andersen, T.; Andresen, A.; Abu El-Enen, M.M.; Stern, R.J. Geochemistry, geochronology, and Sr-Nd isotopes of the Late Neoproterozoic Wadi Kid volcano-sedimentary rocks, Southern Sinai, Egypt: Implications for tectonic setting and crustal evolution. Lithos 2012, 154, 147–165. [Google Scholar] [CrossRef]
- Bentor, Y.K. The crustal evolution of the Arabo-Nubian massif with special reference to the Sinai Peninsula. Precambr. Res. 1985, 28, 1–74. [Google Scholar] [CrossRef]
- Beyth, M.; Stern, R.J.; Altherr, R.; Kroner, A. The Late Precambrian Timna igneous complex. Southern Israel—Evidence for comagmatic-type sanukitoid monzodiorite and alkali granite magma. Lithos 1994, 31, 103–124. [Google Scholar] [CrossRef]
- Johnson, P.R. Post-amalgamation basins of the NE Arabian shield and implications for Neoproterozoic III tectonism in the northern East African orogen. Precambr. Res. 2003, 123, 321–338. [Google Scholar] [CrossRef]
- Eyal, M.; Litvinovsky, B.; Jahn, B.M.; Zanvilevich, A.; Katzir, Y. Origin and evolution of post-collisional magmatism: Coeval Neoproterozoic calc-alkaline and alkaline suites of the Sinai Peninsula. Chem. Geol. 2010, 269, 153–179. [Google Scholar] [CrossRef]
- Liégeois, J.P.; Stern, R.J. Sr–Nd isotopes and geochemistry of granite–gneiss complexes from the Meatiq and Hafafit domes, Eastern Desert, Egypt: No evidence for pre-Neoproterozoic crust. Int. J. Earth Sci. 2010, 57, 31–40. [Google Scholar] [CrossRef]
- Harrell, J.A. Archeological geology of the world’s first emerald mine. Geosci. Can. 2004, 31, 69–76. [Google Scholar]
- Sidebotham, S.E.; Nouwens, H.M.; Hense, A.M.; Harrell, J.A. Preliminary report on archaeological fieldwork at Sikait (Eastern Desert of Egypt) and environs, 2002–2003. Sahara 2004, 15, 7–30. [Google Scholar]
- Surour, A.A.; Takla, M.A.; Omar, S.A.M. EPR spectra and age determination of beryl from the Eastern Desert. Egypt. Ann. Geol. Surv. Egypt 2002, 25, 389–400. [Google Scholar]
- Takla, M.A.; Surour, A.A.; Omar, S.A.M. Mapping, source of beryllium and genesis of some beryl occurrences in the Eastern Desert of Egypt. Ann. Geol. Surv. Egypt 2003, 26, 153–182. [Google Scholar]
- Omar, S.A.M. Mineralogical and fluid inclusions evidence for the genesis of Umm Addebaa-Umm Kabu beryl belt, South Eastern Desert. Egypt. Nucl. Sci. Sci. J. 2016, 5, 1–14. [Google Scholar]
- Shaw, I.; Bunbury, J. A Petrological Study of the Emerald Mines in the Egyptian Eastern Desert, Lthics at the Millannium; Moloney, N., Shott, M.J., Eds.; Archaeopress: London, UK, 2003; pp. 203–213. [Google Scholar]
- Grundmann, G.; Morteani, G. Multi-stage emerald formation during Pan-African regional metamorphism: The Zabara, Sikait, Umm Kabo deposits, South Eastern desert of Egypt. J. Afr. Earth Sci. 2008, 50, 168–187. [Google Scholar] [CrossRef]
- Ibrahim, M.E.; Saleh, G.M.; Ibrahim, I.H.; Azab, M.S.; Khamis, A.A.; Oraby, F.; Abu El-Hassan, E.A.; Ragab, A.A. Geologic and ground spectrometric prospecting of the Abu Rusheid-Sikait shear zones, South Eastern Desert, Egypt. In Proceedings of the 7th Arab Conference on the Peaceful Uses of Atomic Energy, Sanaa, Yemen, 4–8 December 2004. [Google Scholar]
- Harraz, H.Z.; Hassan, A.M.; Furuyama, K. The Wadi Sikait complex: A fertile-post-collisonal granite-pegmatite suite, Eastern Desert, Egypt. Ann. Geol. Surv. Egypt 2005, XXVIII, 1–35. [Google Scholar]
- Ali, M.A.; Abdel-Razek, Y.A. Study of the geologic features and uranium content of the cataclastic rocks at Wadi Sikait, south Eastern Desert, Egypt by SSNTDs. J. Rad. Nucl. Appl. 2020, 5, 111–118. [Google Scholar]
- Ali, M.A.; Abdel Gawad, A.E.; Ghoneim, M.M. Geology and mineral chemistry of uranium and thorium bearing minerals in rare-metal (NYF) pegmatites of Um Solimate, South Eastern Desert of Egypt. Acta Geol. Sin. 2021, 95, 1568–1582. [Google Scholar] [CrossRef]
- Ali, M.A.; Lentz, D.R.; Hall, D.C. Mineralogy and geochemistry of Nb-, Ta-, Sn-, U-, Th-, and Zr-bearing granitic rocks from Abu Rusheid shear zones, South Eastern Desert, Egypt. Chin. J. Geochem. 2011, 30, 226–247. [Google Scholar] [CrossRef]
- Assaf, H.S.; Ibrahim, M.E.; Zalata, A.A.; El Metwally, A.A.; Saleh, G.M. Polyphase folding in Nugrus–Sikait area, South Eastern Desert, Egypt. JKAU Earth Sci. 2000, 12, 1–10. [Google Scholar] [CrossRef]
- Fowler, A.; El Kalioubi, B. The Migif–Hafafit gneissic complex of the Egyptian Eastern Desert: Fold interference patterns involving multiply deformed sheath folds. Tectonophysics 2002, 346, 247–275. [Google Scholar] [CrossRef]
- Saleh, G.M.; Abdallah, S.A.; Abbas, A.A.; Dawood, N.A.; Rashed, M.A. Uranium mineralizations of Wadi Sikait mylonites, Southeastern Desert, Egypt. J. Geol. Min. Res. 2012, 3, 86–104. [Google Scholar] [CrossRef]
- Abdel Gawad, A.E.; Ali, M.A.; Ghoneim, M.M.; El-Taher, A. Natural radioactivity and mineral chemistry aspects of rare metal mineralisation associated with mylonite at Wadi Sikait, South Eastern Desert, Egypt. Int. J. Environ. Anal. Chem. 2021, 1–18. [Google Scholar] [CrossRef]
- Abdellah, W.M.; Khalafalla, M.S.; Abu Khoziem, H.A.; El Hussaini, O.M. Physical and chemical processes of Abu Rusheid cataclastic rocks for recovering niobium, zirconium and uranium compounds. Physicochem. Probl. Miner. Process. 2021, 57, 137–154. [Google Scholar] [CrossRef]
- Smirnov, V.K.; Sobolev, A.V.; Batanova, V.G.; Portnyagin, M.V.; Simakin, S.G.; Potapov, E.V. Quantitative SIMS analysis of melt inclusions and host minerals for trace elements and H2O. Eos Trans. Spring Meet. Suppl. AGU 1995, 76, 270. [Google Scholar]
- Nosova, A.A.; Narkisova, V.V.; Sazonova, L.V.; Simakin, S.G. Minor elements in clinopyroxene from Paleozoic volcanics of the Tagil island arc in the Central Urals. Geochem. Int. 2002, 40, 219–232. [Google Scholar]
- Fedotova, A.A.; Bibikova, E.V.; Simakin, S.G. Ion-microprobe zircon geochemistry as an indicator of mineral genesis during geochronological studies. Geochem. Int. 2008, 46, 912–927. [Google Scholar] [CrossRef]
- Portnyagin, M.; Almeev, R.; Matveev, S.; Holtz, F. Experimental evidence for rapid water exchange between melt inclusions in olivine and host magma. Earth Planet. Sci. Lett. 2008, 272, 541–552. [Google Scholar] [CrossRef]
- Jochum, K.P.; Stoll, B.; Herwig, K.; Willbold, M.; Hofmiann, A.W.; Amini, M.; Aarburg, S.; Abouchami, W.; Hellebrand, E.; Mocek, B.; et al. MPI-DING reference glasses for in situ microanalysis: New reference values for element concentrations and isotope ratios. Geochem. Geophys. Geosyst. 2006, 7, Q02008. [Google Scholar] [CrossRef]
- Aurisicchio, C.; Conte, A.M.; Medeghini, L.; Ottolini, L.; De Vito, C. Major and trace element geochemistry of emerald from several deposits: Implications for genetic models and classification schemes. Ore Geol. Rev. 2018, 94, 351–366. [Google Scholar] [CrossRef]
- Danyushevsky, L.V.; Eggins, S.M.; Falloon, T.J.; Christie, D.M. H2O abundance in depleted to moderately enriched mid-ocean ridge magmas; Part I: Incompatible behaviour, implications for mantle storage, and origin of regional variations. J. Petrol. 2000, 41, 1329–1364. [Google Scholar] [CrossRef]
- Kamenetsky, V.S.; Everard, J.L.; Crawford, A.J.; Varne, R.; Eggins, S.M.; Lanyon, R. Enriched end-member of primitive MORB melts: Petrology and geochemistry of glasses from Macquarie island (SW Pacific). J. Petrol. 2000, 41, 411–430. [Google Scholar] [CrossRef]
- Shishkina, T.A.; Botcharnikov, R.E.; Holtz, F.; Almeev, R.R.; Portnyagin, M.V. Solubility of H2O and CO2-bearing fluids in tholeiitic basalts at pressures up to 500 MPa. Chem. Geol. 2010, 277, 115–125. [Google Scholar] [CrossRef]
- Tamic, N.; Behrens, H.; Holtz, F. The solubility of H2O and CO2 in rhyolitic melts in equilibrium with a mixed CO–H2O fluid phase. Chem. Geol. 2001, 174, 333–347. [Google Scholar] [CrossRef]
- Sobolev, A.V.; Chaussidon, M. H2O concentrations in primary melts from island arcs and mid-ocean ridges: Implications for H2O storage and recycling in the mantle. Earth Planet. Sci. Lett. 1996, 137, 45–55. [Google Scholar] [CrossRef]
- Portnyagin, M.V.; Simakin, S.G.; Sobolev, A.V. Fluorine in primitive magmas of the Troodos ophiolite complex, Cyprus: Analytical methods and main results. Geochem. Int. 2002, 40, 625–632. [Google Scholar]
- Rocholl, A.B.E.; Simon, K.; Jochum, K.P.; Bruhn, F.; Gehann, R.; Kramar, U.; Luecke, W.; Molzahn, M.; Pernicka, E.; Seufert, M.; et al. Chemical characterisation of NIST silicate glass certified reference material SRM 610 by ICP-MS, TIMS, LIMS, SSMS, INAA, AAS and PIXE. Geostand. Newsl. 1997, 21, 101–114. [Google Scholar] [CrossRef]
- El Mezayen, A.M.; Heikal, M.A.; El-Feky, M.G.; Shahin, H.A.; Abu Zeid, I.K.; Lasheen, S.R. Ultramafic hosting talc, chromite and uranium-bearing magnesite of sol hamed ophiolites South Eastern Desert, Egypt; petrology, geochemistry and tectonic evolution. Ann. Geol. Surv. Egypt 2018, 35, 71–96. [Google Scholar]
- Sedki, T.; Ali, S.; Haroun, A.; Mohamed, H.A. Geochemistry dataset of the Sol Hamed Neoproterozoic ophiolitic serpentinites, southern Eastern Desert, Egypt. Data Brief 2019, 25, 104393. [Google Scholar] [CrossRef] [PubMed]
- Groat, L.A.; Giuliani, G.; Marshall, D.D.; Turner, D. Emerald. In Geology of Gem Deposits; Groat, L.A., Ed.; Mineralogical Association of Canada: Québec, QC, Canada, 2007; Volume 37, pp. 79–100. [Google Scholar]
- Beal, K.; Lentz, D.R. Aquamarine beryl from Zealand Station, Canada: A mineralogical and stable isotope study. J. Geosci. 2010, 55, 57–67. [Google Scholar] [CrossRef]
- Marshall, D.; Downes, P.J.; Ellis, S.; Greene, R.; Loughrey, L.; Jones, P. Pressure–temperature-fluid constraints for the Poona emerald deposits, Western Australia: Fluid inclusion and stable isotope studies. Minerals 2016, 6, 130. [Google Scholar] [CrossRef]
- Santiago, J.S.; Souza, V.S.; de Filgueiras, B.C.; Jiménez, F.A.C. Emerald from the Fazenda Bonfim deposit, northeastern Brazil: Chemical, fluid inclusions and oxygen isotope data. Braz. J. Geol. 2018, 48, 457–472. [Google Scholar] [CrossRef]
- Walton, L. Exploration Criteria for Colored Gemstone Deposits in Yukon; Open File 2004–10; Geological Survey of Canada: Ottawa, ON, Canada, 2004; 184p.
- Giuliani, G.; Cheilletz, A.; Zimmermann, J.-L.; Ribeiro-Althoff, A.M.; France-Lanord, C.; Féraud, G. Les gisements d’émeraude du Brésil: Genèse et typologie. Chron. Rech. Minière 1997, 526, 17–61. [Google Scholar]
- Neiva, A.M.R.; Neiva, J.M.C. Beryl from the granitic pegmatite at Namivo, Alto Ligonha, Mozambique. Neues Jahrb. Mineral. Abh. 2005, 181, 173–182. [Google Scholar] [CrossRef]
- Uher, P.; Chudík, P.; Bačík, P.; Vaculovič, T.; Galiová, M. Beryl composition and evolution trends: An example from granitic pegmatites of the beryl-columbite subtype, Western Carpathians, Slovakia. J. Geosci. 2010, 55, 69–80. [Google Scholar] [CrossRef][Green Version]
- Schwarz, D. The Geographic Origin Determination of Emeralds; InColor Special Issue; International Colored Gemstone Association: Hong Kong, China; New York, NY, USA, 2015; pp. 98–105. [Google Scholar]
- Giuliani, G.; France-Lanord, C.; Zimmermann, J.-L.; Cheilletz, A.; Arboleda, C.; Charoy, B.; Coget, P.; Fontan, F.; Giard, D. Composition of fluids, δD of channel H2O and δ18O of lattice oxygen in beryls: Genetic implications for Brazilian, Colombian and Afghanistani emerald deposits. Int. Geol. Rev. 1997, 39, 400–424. [Google Scholar] [CrossRef]
- Saeseaw, S.; Renfro, N.D.; Palke, A.C.; Sun, Z.; McClure, S.F. Geographic origin determination of emerald. Gems Gemol. 2019, 55, 614–646. [Google Scholar] [CrossRef]
Publisher’s Note: MDPI stays neutral with regard to jurisdictional claims in published maps and institutional affiliations. |
© 2022 by the authors. Licensee MDPI, Basel, Switzerland. This article is an open access article distributed under the terms and conditions of the Creative Commons Attribution (CC BY) license (https://creativecommons.org/licenses/by/4.0/).