Abstract
We investigate the magnetic fabrics and microstructures of diamagnetic rocksalt samples from the Sedom salt wall (diapir), Dead Sea Basin, as possible strain markers. A comprehensive study of anisotropy of magnetic susceptibility (AMS), combined with magnetic, microtextural, geochemical and mineralogical analyses allows us to depict the deformation mechanisms and to reveal the mineral sources of the AMS. The rocksalts are composed of halite as the major mineral phase (>80%) and anhydrite as a minor phase (5–20%), and have an average magnetic susceptibility value of −13.4 ± 0.7 × 10⁻⁶ SI. Ferromagnetic and paramagnetic minerals make a negligible contribution to the bulk magnetic properties of the samples. The AMS indicates and reveals significant anisotropy with the maximum susceptibility axis (K1) subparallel to the bedding strike, although the cubic halite crystals are isotropic. Polarizing microscope and SEM images show preferred alignment of needle-like anhydrite crystals parallel to the direction of the K1 axis. Petrographic investigation of gamma irradiated thin sections reveals the deformation recorded in the microstructures of the rocksalts and points to a dominant contribution by dislocation creep, although both dislocation creep and pressure solution were active deformation mechanisms. We infer that during dislocation creep, the thin bands of anhydrite crystals deform along with the surrounding halite grains. We suggest that although the shape preferred orientation of halite grains is not indicative of finite strain because of resetting by grain boundary migration, the preferred orientation of the anhydrite crystals may be. These results suggest that the AMS of the rocksalts provides a textural proxy that reflects deformation processes of the rocksalts, despite their very low magnetic susceptibility.
1. Introduction
Salt structures (diapirs) are generally associated with large amounts of deformation as the rheological properties of rocksalts enable them to deform and flow under gravitational and tectonic stress [1,2]. Recording the internal deformation within salt structures is important for gaining a better understanding of the kinematics and deformation mechanisms of salt flow (e.g., [3]). This understanding is critical when using salt bodies as potential waste repositories, hydrocarbon targets and salt-cavern gas storages (e.g., [1,4,5,6]).
The anisotropy of magnetic susceptibility (AMS) reflects the mineral and grain shape orientations and is used as a kinematic indicator for studying deformation and flow of rocks [7]. Most studies focus on rocks that have a strong magnetic response due to ferromagnetic (sensu lato) minerals such as Fe oxides and/or paramagnetic minerals such as phyllosilicates (e.g., [8]). Only a few studies are reported on rocks that have weak magnetic response controlled by diamagnetic minerals [9,10,11,12,13,14,15,16,17,18,19]. Characterizing the low-field AMS of diamagnetic rocksalts is especially challenging due to the weak diamagnetic response and the cubic crystal symmetry of halite [20].
The AMS describes the rock magnetic susceptibility tensor (k) with maximum, intermediate and minimum principal susceptibility axes, K1, K2 and K3 eigenvectors, respectively, which correspond to k1 ≥ k2 ≥ k3 eigenvalues [21]. Most minerals have intrinsic anisotropic susceptibility with a strong correlation to their crystallographic axes. Minerals exhibit a wide range of susceptibility values of several orders of magnitude, and also varied intrinsic anisotropies, indicating that the magnetic susceptibility tensor for a rock specimen strongly depends on the relative abundances of the composing minerals (e.g., [22,23,24]). For orthorhombic and hexagonal crystals, one of the AMS axes is generally subparallel to the crystal symmetry axis, i.e., their long dimension [25]. However, high symmetry cubic crystals such as halite are expected to be magnetically isotropic [26,27].
Natural rocksalts contain predominantly diamagnetic halite crystals with some accessory evaporitic minerals such as sylvite, carnallite, anhydrite and gypsum. Halite and sylvite are cubic and, hence, are not expected to have an intrinsic AMS. Anhydrite and carnallite are orthorhombic and are expected to have AMS axes co-axial to the crystallographic axes with the “easy” magnetization direction subparallel to the c-axis and the “hard” magnetization along the basal plane (a,b) [7]. Gypsum is monoclinic and may have AMS subparallel to the crystallographic axes. Only a few studies test the possibility of using AMS as a strain marker in rocksalts [28,29,30,31,32,33]. Previous studies showed that pure halite has magnetic susceptibility value of −14.5 × 10⁻⁶ SI [33]. The susceptibility values of natural rocksalts become less negative (or positive) if Fe oxides and/or phyllosilicates are present. Heinrich et al. [32] show that the AMS of rocksalts from the Zechstein Basin (Germany) is controlled by the combination of accessory ferromagnetic hematite and magnetite and paramagnetic phyllosilicates. They suggest that the AMS of rocksalts is reliable only for “impure” samples with threshold mean susceptibilities greater than −5 × 10⁻⁶ SI. Otherwise, the rocksalts contain predominantly cubic halite crystals and are too “pure” for AMS analysis.
In the course of studying the AMS of the intrasalt shale beds within the Sedom salt wall (diapir) in the Dead Sea Basin [29], we collected a few rocksalt samples to test their AMS as a potential strain marker. It turned out that the samples have negative (diamagnetic) susceptibility values that are quite close to those of pure halite-bearing rocks and are more negative than the threshold value suggested by Heinrich et al. [32] for use in AMS studies. Nevertheless, these samples showed reproducible results, suggesting that the rocksalts have reliable and reproducible AMS. We therefore conducted a series of tests to elucidate the origin of these fabrics, including comprehensive magnetic, microtextural, geochemical and mineralogical analyses, and including an investigation of gamma irradiated thin sections, aiming to correlate the AMS with the deformation mechanisms recorded in the microstructures of the diamagnetic rocksalts. In this paper, we show that rocksalts with a very weak diamagnetic response may be useful for AMS analysis if they contain, in addition to halite, diamagnetic accessories such as anhydrite.
2. Geologic Setting
The Sedom salt wall in the Dead Sea Basin is located along the segmented Dead Sea Fault (DSF) system, a continental transform boundary between the Arabian and African plates (or Sinai subplate) (Figure 1a). Several elongate depressions are located along the DSF, reflecting local transtension [34]. The Dead Sea Basin is approximately a 150 km long, 16 km wide, 12 km deep, rhomb-shaped, pull-apart graben that formed between longitudinal left-stepping sinistral faults [35]. The basin fill comprises Neogene siliciclastics, evaporites and post-evaporitic lacustrine and fluvial sediments [36]. The top of the evaporate series is found at depths of ~5 km in the center of the basin and at ~2 km in the margins (Figure 1b) [36]. The evaporite series known as the Sedom Formation of Upper Miocene age [37] is ~1500–2000 m thick [38,39]. It crops out and forms the Sedom salt wall, and is divided into five members, the Karbolet and the Lot Salt members, the Bnot Lot Shale Member, the Me’arat Sedom Salt Member and the Hof Shale and Salt Member [38] (Figure 1b). The Lot Salt Member forms the backbone of the diapir and has an overall thickness of 700–1000 m, consisting of rocksalts with fine anhydrite and gypsum layers.
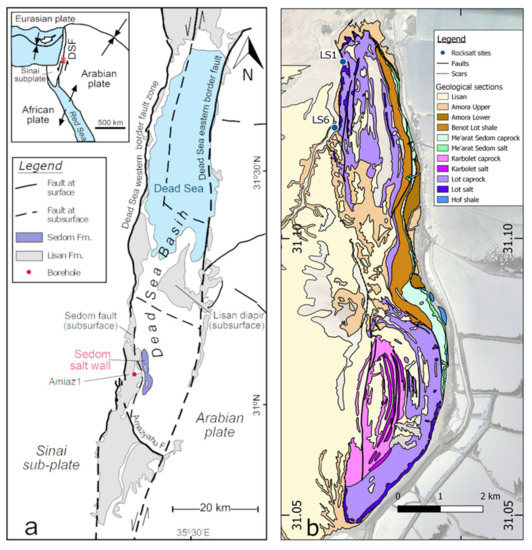
Figure 1.
(a) Tectonic setting of the Dead Sea Fault (DSF) system. Red box marks the study area in the Dead Sea Basin. The exposed Sedom salt wall is shown in purple. Fault traces are from Sneh and Weinberger [48]. (b) Detailed geological map of Mount Sedom (after Agnon et al. [49]) showing sampling localities (LS1 and LS6) at the NW part of the Sedom salt wall.
The Sedom salt wall is an active diapir, which forms a ~10 km long and 2 km wide north–south trending topographical ridge that rises ~240 m above the level of the Dead Sea Ponds (currently 410 m below sea level). In previous works, we have documented the structure of the salt wall [39,40,41], its current [42,43] and past [44,45] uplift rates and phases of active and passive diapirism [46]. Recently, we studied the internal deformation of 200 m thick intrasalt shale beds exposed along the salt wall by means of AMS, showing that mechanically they were distinct from the encasing flowing salt [29].
3. Methods
3.1. Sampling
We sampled two accessible outcrops of rocksalt in the northwestern flank of the Sedom salt wall (LS1, Lat. 31.115484°, Lon. 35.373238°; LS6, Lat. 31.113320°, Lon. 35.373419°). The beds dip 67°/065° (LS1) and 40°/259° (LS6, overturned bed), and belong to the Lot Salt Member, which consists of almost pure halite [38]. We collected 12 and 9 oriented specimens from LS1 and LS6, respectively (Figure 1). The cylindrical specimens were drilled with salt-saturated brine taken from the nearby Dead Sea Ponds, preventing dissolution of the cores during sampling (see also [47]).
3.2. Magnetic Properties
3.2.1. Low Field Susceptibility
The magnetic susceptibility was measured using an Agico KLY-5 Kappabridge in a low magnetic field of 750 A/m (peak field) and frequency of 1220 Hz, at the Geological Survey of Israel. To characterize the paramagnetic component (if any), the magnetic susceptibility of six representative samples was measured at a low temperature of 77 K. The measurements were performed after cooling the samples in liquid nitrogen using an Agico KLY-4 Kappabridge in a low magnetic field of 450 A/m (average field) and frequency of 875 Hz (see [50] for more information about the technique).
3.2.2. AF Curves
Alternating field (AF) demagnetization curves were measured for two representative samples in order to characterize the coercivity of the ferromagnetic component. The samples were magnetized in a DC field of 500 µT and AC field of 100 mT and then the magnetization was measured in 5 to 10 mT AF demagnetization steps up to 100 mT. Magnetization and demagnetization were acquired using an Agico LDA-3A coil, and the magnetization was measured using an Agico JR-6A magnetometer at the Geological Survey of Israel.
3.2.3. Hysteresis Loops
A vibrating sample magnetometer (VSM) hysteresis loop conduced to a representative sample in order to characterize the field-dependent magnetic behavior and the hysteresis properties of the Lot rocksalt. The magnetization was measured under increasing fields from zero to high fields of 1 T, and then backward to −1 T (M-H curves). At high magnetic fields, the ferromagnetic components are saturated and only the diamagnetic and paramagnetic components are reacting. In that manner, the slope of the curve at high fields reflects the relations and dominancy of these components. The hysteresis properties of the curve characterize only the ferromagnetic component. The measurements were performed using a Princeton Measurements micro-VSM device at the Institute for Rock Magnetism (IRM), University of Minnesota.
3.2.4. Low-Temperature Magnetic Properties
Low-temperature magnetic properties of a representative sample were measured in order to identify possible crystallographic transitions at low temperatures, e.g., Verwey transition in magnetite–titanomagnetite or Morin transition in hematite. The experiment was conducted for a small amount of (~3 mm3 in volume) powder of the rocksalt sample. The magnetization of the sample was measured during cooling in zero magnetic field from room temperature down to 2.1 K, then pulsed (2.5 T) and heated back to room temperature. The measurement was performed using a Quantum Design MPMS-5S superconducting susceptometer at the Institute for Rock Magnetism (IRM), University of Minnesota (Minneapolis, MN, USA).
3.2.5. Temperature-Dependent Susceptibility
Temperature-dependent susceptibility between ~25 and 700 °C was measured for two representative samples in order to recognize typical Curie temperatures of ferromagnetic minerals. The measurements were performed using an Agico KLY-4S Kappabridge and CS-3 furnace in argon atmosphere at the Geological Survey of Israel.
3.3. Magnetic Fabrics
3.3.1. RT-AMS
The room temperature AMS (RT-AMS) was measured using an Agico KLY-5 Kappabridge in a low magnetic field of 750 A/m (peak field) and frequency of 1220 Hz and using the “slowly spinning specimen” method (see [51]) at the Geological Survey of Israel. To validate the reliability of the RT-AMS we performed reproducibility tests for representative samples: (1) Ten repetitive measurements of a single sample, performed on different days; (2) four repetitive measurements for the entire samples of one locality, performed on different days; and (3) six measurements of samples that were drilled from a rocksalt block in different directions.
3.3.2. LT-AMS
To identify the possible contribution of paramagnetic carriers of the AMS, we measured the low-temperature AMS (LT-AMS) of six representative samples. The LT-AMS was measured at 77K, the boiling temperature of liquid nitrogen, which enhanced the effect of paramagnetic minerals. LT-AMS was measured according to the procedure presented by Issachar et al. [50] at a low magnetic field of 450 A/m and a frequency of 976 Hz with a KLY-4S Kappabridge (Agico Inc.) at the Geological Survey of Israel. The samples were cooled in a liquid nitrogen bath for 50 min before the first measurement and for 5 min between axial and mean susceptibility measurements. The Kappabridge coil was protected from the cold sample with a thin silicon sheet, and the samples were wrapped with a Teflon layer to prevent ice condensation.
3.3.3. AARM
To identify the possible contribution of ferromagnetic carriers of the AMS, we measured the anisotropy of anhysteretic remanence magnetization (AARM) of six samples. The AARM describes the magnetic fabric of just the ferromagnetic minerals by measuring magnetization in the absence of a magnetic field, after being magnetized along different directions using a weak direct magnetic field (DC) superimposed on a stronger alternating magnetic field (AC) that decays with time [52]. The AARM measurements were performed in AC field of 80 mT and DC field of 400 mT using an LDA-3/AMU-1 AF demagnetizer/magnetizer and a JR-6 spinner magnetometer (Agico Inc.) at the Geological Survey of Israel.
3.3.4. AMS Parameters
The parameters used to characterize the magnetic fabrics, including the mean susceptibility (km = [k1 + k2 + k3]/3), degree of anisotropy (P = k1/k3), shape of anisotropy (T = ln(F) − ln(L)/ln(F) + ln(L)), magnetic lineation (L = k1/k2) and magnetic foliation (F = k2/k3) were calculated according to Jelinek [53] using the Anisoft 4.2 software package (www.agico.com, accessed on 1 April 2018). To quantify the statistical significance of the measurements, we considered the F-test values, a statistical test for anisotropy based on the least-square method [54].
3.4. Microstructure Analyses
To better understand the microstructure of the rocksalts and to correlate it with the AMS fabrics, we studied thin sections of two representative samples by optical microscopy (polarizing microscope) and a scanning electron microscope (SEM). The samples were first measured by AMS and then were cut along a plane containing the K1 and K3 eigenvectors for thin sections. The microstructure and the chemistry were analyzed by an SEM, model FEI Quanta 450, equipped with an EDS detector.
Further microstructural analysis of gamma irradiated thin sections was performed based on a representative sample of the Lot Salt Member. They were cut in a dry laboratory with a diamond saw and cooled by a small amount of slightly under-saturated salt brine to reduce mechanical damage. The gamma irradiated thin sections were dry-polished to a thickness of approximately 50 µm to allow decorated microstructures to be visible. To create a negative topography at grain boundaries and subgrain boundaries, the samples were chemically etched with slightly under-saturated brine and flushed with a stream of n-hexane using the technique described in [55]. The thin sections were imaged in reflected and transmitted light on a Zeiss optical microscope with the stitching panorama function of the ZEN imaging software. To decorate crystal defect structures, samples were irradiated in the FRM-II research reactor at the TU Munich in Garching with varying dose rates between 6 and 11 kGy h−1 to a total dose of 4 MGy at a constant temperature of 100 °C [56,57,58].
3.5. Chemical and Mineralogical Analyses
The chemical composition of a representative sample was analyzed by an Optima 3300 ICP-OES and by X-ray diffraction (XRD) using a Philips PW1730/1710. Samples were loaded into a sample holder by side-loading and measured using CuKα radiation. Mineral phase identification and semi-quantification were performed using HighScore Plus® software (Version 4.0, Malvern Panalytical, Almelo, The Netherlands) based on the ICSD database. All the chemical and mineralogical measurements were performed at the Geological Survey of Israel.
4. Results
4.1. Magnetic Properties
The average room temperature (kmRT) and the low-temperature (kmLT) susceptibility values of the Lot rocksalt samples are −13.36 ± 0.75 × 10⁻⁶ SI and −13.28 ± 0.32 × 10⁻⁶ SI, respectively (Figure 2b). kmRT/kmLT ratio is 1.005 ± 0.018. The similarity of kmLT and kmRT indicates the absence of paramagnetic minerals such as clays and phyllosilicates (Figure 2b). Nevertheless, the AF curves indicate that the samples were fully demagnetized at 60 mT, suggesting the presence of low-coercivity ferromagnetic minerals that carry the remanence magnetization (Figure 2c). The raw VSM data indicate negative slope line, suggesting a constant diamagnetic response at low and high fields (Figure 2d). The slope-corrected curve indicates negligible amounts of ferromagnetic contents, as the saturated value is 10−8 Am2. Nevertheless, the characterization of the ferromagnetic component is not feasible due to the low amount of ferromagnetic minerals. The results of the low-temperature magnetic properties experiment (MPMS) indicate constant magnetization during cooling and a monotonic decrease during heating (Figure 2e). The temperature-dependent susceptibility curves indicate constant susceptibility during heating and cooling, suggesting negligible amounts of ferromagnetic minerals such as Fe oxides (Figure 2f), supported by the lack of evidence for typical ferromagnetic mineral transitions (i.e., Verwey and Morin transitions).
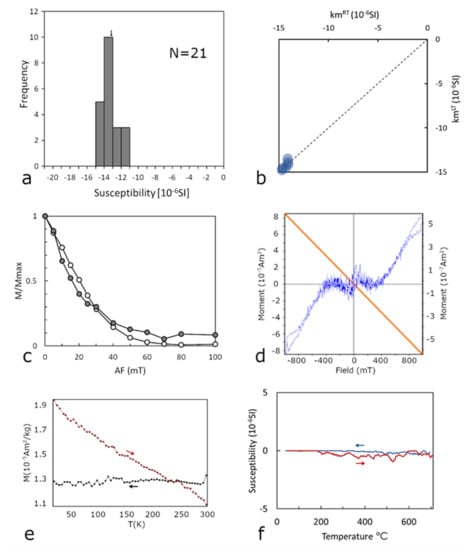
Figure 2.
Magnetic properties of rocksalt samples from the Sedom salt wall. (a) Frequency of magnetic susceptibility values indicating narrow range of negative values of −13.4 ± 0.7 × 10⁻⁶ SI (black arrow). (b) Room temperature (kmRT) versus low-temperature (kmLT) susceptibility showing similar values, indicating the absence of paramagnetic minerals (see [24]). The dashed line represents kmLT/kmRT = 1. (c) AF demagnetization curves of two representative samples indicating the presence of low-coercivity ferromagnetic minerals. (d) Raw curve (orange) of VSM data indicating diamagnetic dominancy, and slope-corrected curve (blue), showing a noisy ferromagnetic effect. (e) MPMS data showing the magnetization in zero field cooling (black) and after 2.5 T pulse heating (red), with lack of evidence for ferromagnetic mineral transitions. (f) Temperature-dependent susceptibility showing constant susceptibility during heating (red) and cooling (blue), suggesting negligible amounts of ferromagnetic minerals.
4.2. Magnetic Fabrics of the Lot Rocksalts
The average F-test of the measured samples is 7.6 ± 5.2 (Table 1 and Figure 3a) but in spite of this and the weak magnetic response of the samples, the reproducibility tests indicate that the RT-AMS result are reliable: (1) The test of 10 repetitions of a single sample indicates 95% confidence ellipses of 34° ± 9°, 30° ± 6°, 16° ± 4° (K1, K2 and K3 axes, respectively), and standard deviations for P and T parameters of 0.001 and 0.21, respectively. (2) The four repetitive measurements of samples of the entire site show standard deviations of the AMS axes of 10°, 13°, 6° (K1, K2 and K3, respectively), and standard deviations of P and T parameters of 0.001 and 0.07, respectively. (3) The rocksalt block test indicates that the AMS axes have scattered orientations in the specimen’s coordinate system, indicating no drilling artifacts. These tests show conclusively that the AMS results represent the physical properties of the rocksalts rather than an apparent instrumental artifact.

Table 1.
RT-AMS data kmRT (× 10−6 SI) is mean susceptibility at room temperature; P is degree of anisotropy; T is shape ellipsoid; L is magnetic lineation; F is magnetic foliation (e.g., [59]). F-test is a statistical test for anisotropy [54].
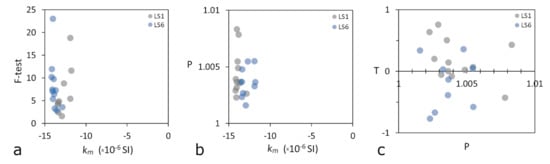
Figure 3.
RT-AMS anisotropy parameters of Lot rocksalt samples from sites LS1 and LS6. (a) F-test versus mean magnetic susceptibility (km). (b) Degree of anisotropy (P) versus mean magnetic susceptibility (km). (c) Shape of anisotropy (T) versus degree of anisotropy (P).
The RT-AMS results indicate anisotropic magnetic fabrics at both sampling sites (Figure 4). LS1 samples show grouped K1 axes in NNW direction parallel to the bedding strike while LS6 samples show grouped K3 axes in the vertical direction and a magnetic foliation of K1 and K2 axes oblique to bedding (Figure 4). In both sites, the p values (1.004 ± 0.0015 on average) and the T values (−0.01 ± 0.37 on average) have no correlation to km (Figure 3b,c). In the LS1 site, we recognize a magnetic lineation (clustered K1 axes and K2–K3 foliation) parallel to bedding strike. In a previous work, we recognized this magnetic fabric in intra-salt clasts of the Sedom salt wall [29] and interpreted it as an indication for a N–S folding at the subsurface. In the LS6 site, we recognize a horizontal foliation oblique to bedding, and its relation to the rocksalt deformation is not so obvious. To better understand the deformation recorded by the AMS and to correlate it with the kinematics of the salt wall, the fabric needs further study.
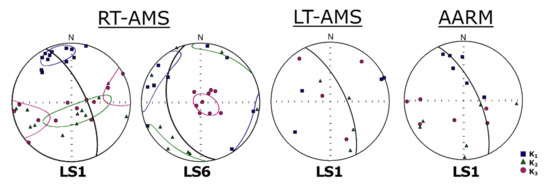
Figure 4.
RT-AMS, LT-AMS and AARM fabrics of the rocksalt samples from the Lot Salt Member (sites LS1 and LS6). Squares represent the maximum susceptibility (K1) or maximum remanence; triangles are intermediate susceptibility (K2) or intermediate remanence; circles are minimum susceptibility (K3) or minimum remanence. Lower hemisphere equal-area projection of principal axes and their 95% confidence ellipses. Black great circle represents the bedding attitude.
The LT-AMS and AARM fabrics indicate scattered orientations of principal axes (Figure 4), in association with very low F-test values of <1.5 and <2.6, respectively. As kmRT/kmLT ≈ 1 (see indicated values above), it can be resolved that the AMS of the rocksalts is controlled by the diamagnetic phase alone (see case IV.4 in [24]).
4.3. Microstructures and Geochemistry
Photomicrographs viewed under cross-polarized light (XPL) with the aid of a gypsum plate show deformed halite crystals with a variety of features, including dismantlement texture (Figure 5a,c), subgrain division (Figure 5d) and growth-bends on both sides of the dismantled halite grain (Figure 5c). In addition, µm-scale needle-like crystals of anhydrite are observed. In many cases, these crystals appear along the edges of the halite crystals and mimic their original shapes. Most importantly, there are clusters (bands) of needle-like anhydrite with a strong preferred alignment (Figure 5b).
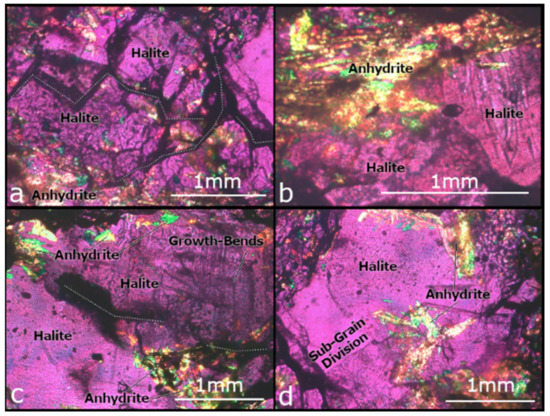
Figure 5.
Photomicrographs of Lot rocksalts viewed under cross-polarized light (XPL) with the aid of a gypsum plate that helps to detect the crystal’s boundaries. Halite crystals form the matrix and a secondary phase is composed of anhydrite crystals. The mm-scale halite crystals show a variety of phenomena, including: dismantlement texture (a,c) subgrain division (d) cracking (b,c) and growth bends (c). The µm-scale needle-like anhydrite crystals frequently appear along the edges of the halite crystals and mimic their original shapes. Clusters of anhydrite minerals typically show preferred alignment (b).
The SEM images clearly show clusters of the µm-scale needle-like crystals (Figure 6). The needles form clusters with a very strong preferred alignment that are parallel to the K1 direction (Figure 7). The chemistry of the needles includes elemental composition of S, Mg, Ca and K in addition to Na and Cl. This composition fits well with anhydrite (CaSO4), although gypsum (CaSO4·2H2O), basanite gypsum (2CaSO4·H2O) and carnallite (KCl·MgCl2·6(H2O)) could fit as well but the needle-like appearance of the latter is less common. The crystals that form the matrix of the samples contain solely Na and Cl, typical of halite.
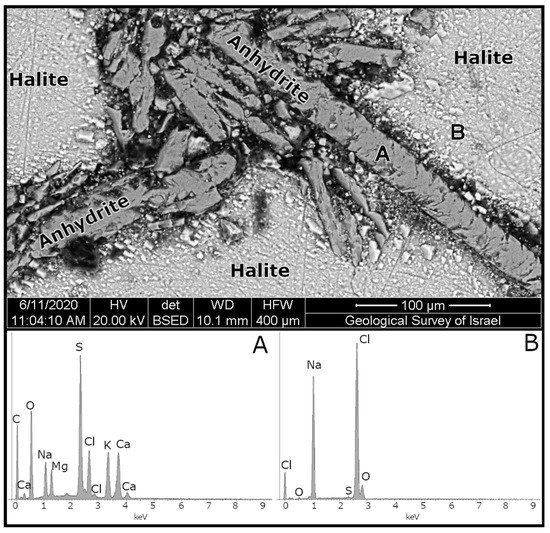
Figure 6.
SEM image and associated elemental spectral analysis of Lot rocksalt sample. The needle-like crystals (point A) indicate elemental composition of Ca and S that is associated with anhydrite (CaSO4). The bright matrix (point B) indicates almost exclusively Na and Cl peaks, suggesting halite (NaCl).
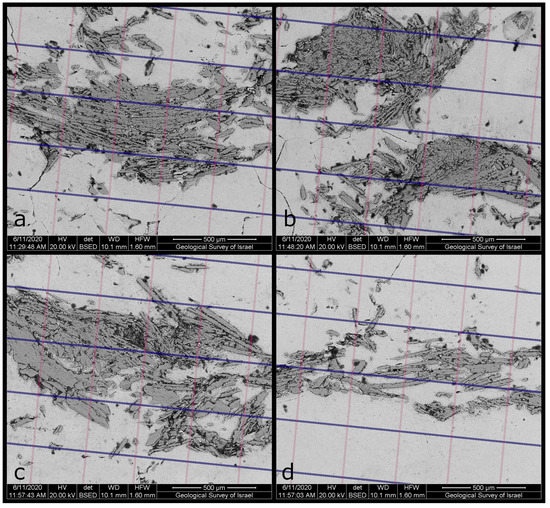
Figure 7.
(a–d) SEM images of Lot rocksalt sample showing clusters of the needle-like crystals of anhydrite in gray within halite matrix in white. The projection of the AMS axes is displayed on top of the image (K1 direction in blue and K3 direction in pink). The anhydrite clusters show preferred alignment parallel to the direction of the K1 axis.
The gamma irradiated thin sections show a range of microstructural features characteristic of domal salt which has undergone large strain deformation. The microstructures are illustrated in Figure 8 and contain the following elements: (1) Grain size of halite is between 1 and 20 mm. The large grains can be surrounded by smaller ones, or the rocksalt can contain layers with different grain sizes. (2) All samples contain grains with subgrains formed by dislocation creep processes. (3) Recrystallization by fluid-assisted grain boundary migration shown by grains replacing subgrain-rich grains (with a high stored energy) is present in all samples, albeit to a different degree. The new grains can themselves have developed subgrains or they can be subgrain-free, indicating that they did not deform after growth. (4) The new grains tend to be smaller than the old ones. (5) In dilation, sites such as strain shadows are common, indicating solution-precipitation processes. (6) Anhydrite can be present as single grain inclusions in halite, in thin bands outlining grain boundaries or inside halite grains and in cm-scale layers of massive anhydrite.
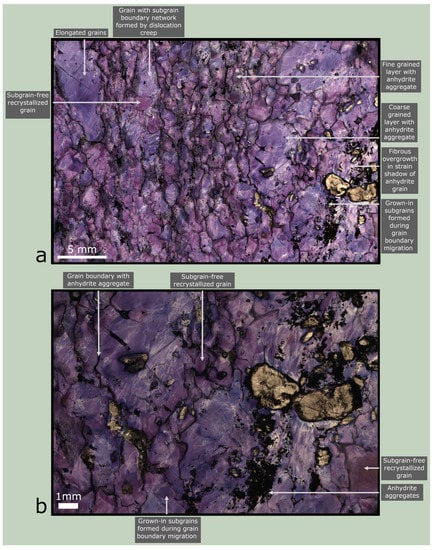
Figure 8.
(a,b) Transmitted light image of a gamma irradiated thin section of Lot rocksalt with blue decoration of halite microstructures and traced halite grain boundaries. Characteristic microstructural features are marked, indicating the large strain deformation of the rocksalt.
The chemical analysis of the bulk sample suggests that the main elements in the rock are Na (36% weight), S (2.4% weight) and Ca (1.2% weight) (Cl content was not measured). Fe and Ti content is less than 0.02% weight. XRD results indicate halite as the major mineral phase in the rock (>50%) and anhydrite as minor (5–20%). Gypsum, carnallite, sylvite and phyllosilicates were not detected.
5. Discussion
5.1. The Magnetic Mineralogy of the Rocksalts
The various rock magnetic measurements suggest that the AMS of the rocksalts is dominated by diamagnetic minerals. The low-temperature (kmLT) susceptibility values of the rocksalts indicate the absence of paramagnetic minerals such as clay or other phyllosilicates. Ferromagnetic minerals are barely detectable, yet AF demagnetization curves indicate the presence of a low-coercivity ferromagnetic component. Likewise, the chemical analysis indicates less than 0.02% (in weight) of Fe and Ti. Thus, the rocksalts of the Lot Salt Member are predominantly composed of diamagnetic evaporitic minerals and probably contain negligible, almost undetected, amounts of accessory minerals such as phyllosilicates or Fe oxides. Considering the textural and chemical analyses performed in the current study, as well as the reported mineralogy of previous studies (e.g., [60]), we infer that the rocksalts are composed of mm-scale halite crystals and µm-scale needle-like anhydrite crystals.
5.2. Reliability of the AMS Results
The present analyses suggest the RT-AMS results are reliable and reproducible, reflecting truly physical and textural properties of the rocks. Hence, the RT-AMS results indicate an intrinsic anisotropy within the rocksalts. Heinrich et al. [32] measured magnetic anisotropy of rocksalts from the German Zechstein Basin. From their measurements and statistical tests, they suggested that only samples with mean susceptibility values of km > −5 × 10⁻⁶ SI could be considered as reliable for AMS measurements. This threshold value is based on the view that the rocksalts consist of a halite matrix with impurities of paramagnetic or ferromagnetic minerals, in which the latter contribute to the AMS of the whole rock. In this scenario, the content of the impurities should be significant enough to change the km of the pure halite-bearing rocks to less negative values than −5 × 10⁻⁶ SI. However, we show that rocksalt samples with susceptibility values of −13 × 10−6 SI produce reliable AMS results. The apparent discrepancy between these studies might be related to the measurement practices and/or to the mineralogical content of the rocksalts. In the current study, the AMS was measured using the latest model of susceptibility bridge (KLY-5, Agico Inc.) by applying the “slowly spinning specimen” method (see [51]). The measurements of Heinrich et al. [32] were performed using an older susceptibility bridge (KLY-3, Agico Inc.) and by applying the “manual measurement” method. As the slowly spinning specimen method is considered more accurate than the manual method, adopting the measuring procedure proposed by Biedermann et al. [61] increases the accuracy of the manual measurement method. Besides the different measurement practices, and probably more significantly, the Lot rocksalt samples have specific mineralogical content and intrinsic anisotropy that allow significant AMS results of rocksalts with km < −5 × 10⁻⁶ SI as discussed below.
5.3. Origin of the AMS
The AMS indicates an intrinsic anisotropy in the rocksalt samples, which is carried by the diamagnetic phase. The microtextural analyses show preferred alignment of needle-like anhydrite crystals (Figure 5 and Figure 7). The effect of shape preferred orientation (SPO) of halite grains is very weak due to its weak diamagnetic response (−14.5 × 10⁻⁶ SI; [33]) and, hence, it cannot contribute to the anisotropy of the rocksalts. A simple calculation of the SPO of halite grains in the presence of a magnetic field of 450 A/M yields p values <1.0002 even for very eccentric grains [20]. In addition, halite belongs to the cubic crystal system and thus is not expected to have crystallographic anisotropy (following Ncumann’s principle, e.g., [26]). Hence, it is unrealistic that the AMS of the rocksalt samples is carried by the halite matrix. On the other hand, preferred alignment of the needle-like anhydrite crystals could be a reasonable source for the anisotropy. Although anhydrite has a weak diamagnetic response up to −13.4 × 10⁻⁶ SI [62,63], which is quite similar to the magnetic susceptibility of halite, this mineral belongs to the orthorhombic crystal system and is thus expected to have AMS axes parallel to its crystallographic axes [7]. Noteworthy, the presence of anhydrite could hardly change the bulk susceptibility of the rocksalts. The optical and SEM images of the samples indicate that the anhydrite crystals have a strong preferred alignment typically parallel to the K1 direction (Figure 5 and Figure 7). We therefore suggest that the magnetic fabrics of the studied rocksalts have two diamagnetic components, but the AMS exclusively reflects the preferred alignment of the anhydrite crystals. Accordingly, in future studies, the AMS of synthetic anhydrite mush should be tested, to better correlate it to the deformation of rocksalts.
5.4. Microstructure of the Rocksalts
Microstructural investigations of the Lot rocksalt show a rich variation in microstructural elements and suggest significant heterogeneities in the Sedom salt wall. Our results give a first impression of the deformation mechanisms in the emergent stem of the salt wall, formed after a long history of deformation. The final stage of this deformation was at a very low effective stress, but interestingly was not accompanied by diffuse dilatancy. The deformation recorded in the microstructures points to a significant, perhaps dominant, contribution by dislocation creep, although both dislocation creep and pressure solution were active deformation mechanisms. We infer several stages of recrystallization. The small strain-free halite grains may be the first signs of the incipient recrystallization of emergent salt into the much weaker, fine-grained domal salt, which flows as salt glaciers [64]. Microstructures are comparable to those in surface-piercing salt diapirs in Oman [65].
Although at the resolution of the thin sections, we cannot resolve the preferred orientation of individual anhydrite needles (Figure 7), we can resolve thin anhydrite bands with a preferred orientation. We infer that during dislocation creep, the thin anhydrite bands deform along with the surrounding halite. A preliminary look at the thin sections suggests that the migrating grain boundaries do not interact strongly with the anhydrite bands. This raises an interesting possibility that although the SPO of halite grains has been shown to not be indicative of finite strain because of resetting by grain boundary migration, the preferred orientation of the anhydrite crystals may be.
5.5. Implications of the AMS
SPO is a common source of intrinsic anisotropy within rocksalts. It was previously shown that halite grains develop strong SPO during deformation (e.g., [55,66,67,68]) with the long axis of the grain shape fabric subparallel to the principal stretching axis [69]. Moreover, studies show that increasing proportions of anhydrite within the halite matrix lead to an increase in the internal anisotropy of rocksalts [70]. Hence, the AMS fabrics may provide a kinematic indicator for internal deformation in diamagnetic rocksalts, with K1 axes parallel to the direction of maximum extension, which is parallel to the direction of the anhydrite preferred alignment. If the rock mass experienced flow, then the preferred alignment of the anhydrite crystals is expected to align parallel to the SPO long axes of the halite grains. In addition, the AMS fabrics are characterized by K1 axes subparallel to bedding strike.
6. Concluding Remarks
This pioneering work shows that the AMS of pure diamagnetic rocksalt samples is indicative of an intrinsic anisotropy of rocksalts from the Sedom salt wall. The magnetic susceptibility of the rocksalt samples apparently indicates that they composed solely of halite crystals, but it turns out that the samples are dominated by two diamagnetic components, halite and anhydrite. The AMS reflects the preferred alignment of needle-like anhydrite crystals with their long axes parallel to K1 axes. The anhydrite preferred alignment may reflect the extension or flow direction. This suggests that the AMS of the rocksalts provides a textural proxy that reflects deformation, which is associated with diapiric processes. Although strain measurement in pure rocksalt is difficult because recrystallization changes the grain shape, the anhydrite preferred orientation is a useful tool to measure the finite strain in slightly impure rocksalt. Deformation mechanisms of the samples studied indicate that both dislocation creep and pressure solution were active deformation mechanisms. There is little or no dilatancy of the salt, which has undergone large ductile strains, the final part of which at very low effective stress. The present study shows the power of integrating AMS and gamma irradiation for studying the kinematics of almost “pure” rocksalts, deformed during processes of salt diapirism. In future work, additional outcrops around the Sedom salt wall should be sampled in order to better understand the diapir kinematics and microphysics and their association with the internal fabrics and rheology of the rocksalts.
Author Contributions
Conceptualization, R.I., R.W. and T.L.; methodology, R.I., R.W., T.L., J.B. and J.L.U.; formal analysis, R.I.; resources, R.W. and T.L.; writing—original draft preparation, R.I.; writing—review and editing, R.W., T.L., J.B. and J.L.U.; funding acquisition, R.W. All authors have read and agreed to the published version of the manuscript.
Funding
This study was supported by grants from the Israel Science Foundation (ISF Grant 868/17) and the Israeli Government (under the Geological Survey of Israel, Dead Sea, project 40706). We thank the Institute for Rock Magnetism (IRM) for hosting and supporting RI during the course of this study. The IRM is funded by the NSF Instruments and Facilities program and by the University of Minnesota.
Data Availability Statement
The data used in this study is available at https://figshare.com/articles/dataset/Magnetic_Fabrics_and_Petrography_of_Rocksalts_Reveal_Preferred_Orientation_of_Anhydrites_Within_a_Halite_Matrix/19095536 (accessed on 1 April 2018).
Acknowledgments
We thank Daniel Zvi and Bat Sheva Cohen for the field assistance, Anat Cohen-Weinberger and Dorit Korngreen for assistance in interpreting the petrographic thin sections and Michael Petronis and two anonymous reviewers for constructive comments.
Conflicts of Interest
The authors declare no conflict of interest.
References
- Jackson, M.P.A.; Hudec, M.R. Salt Tectonics: Principles and Practice; Cambridge University Press: Cambridge, UK, 2017. [Google Scholar]
- Urai, J.L.; Schléder, Z.; Spiers, C.J.; Kukla, P.A. Flow and Transport Properties of Salt Rocks. In Dynamics of Complex Intracontinental Basins: The Central European Basin System; Springer Science & Business Media: Berlin/Heidelberg, Germany, 2008; pp. 277–290. [Google Scholar]
- Desbois, G.; Závada, P.; Schléder, Z.; Urai, J.L. Deformation and recrystallization mechanisms in actively extruding salt fountain: Microstructural evidence for a switch in deformation mechanisms with increased availability of meteoric water and decreased grain size (Qum Kuh, central Iran). J. Struct. Geol. 2010, 32, 580–594. [Google Scholar] [CrossRef]
- Archer, S.G.; Alsop, G.I.; Hartley, A.J.; Grant, N.T.; Hodgkinson, R. Salt tectonics, sediments and prospectivity: An introduction. Geol. Soc. Lond. Spec. Publ. 2012, 363, 1–6. [Google Scholar] [CrossRef]
- Warren, J.K. Salt usually seals, but sometimes leaks: Implications for mine and cavern stabilities in the short and long term. Earth-Sci. Rev. 2017, 165, 302–341. [Google Scholar] [CrossRef]
- Warren, J.K. Evaporites: A Geological Compendium, 2nd ed.; Springer: Berlin, Germany, 2016. [Google Scholar]
- Borradaile, G.J.; Jackson, M. Structural geology, petrofabrics and magnetic fabrics (AMS, AARM, AIRM). J. Struct. Geol. 2010, 32, 1519–1551. [Google Scholar] [CrossRef]
- Borradaile, G.J. Magnetic-susceptibility, petrofabrics and strain. Tectonophysics 1988, 156, 1–20. [Google Scholar] [CrossRef]
- Almqvist, B.S.G.; Hirt, A.M.; Herwegh, M.; Leiss, B. Magnetic anisotropy reveals Neogene tectonic overprint in highly strained carbonate mylonites from the Morcles nappe, Switzerland. J. Struct. Geol. 2011, 33, 1010–1022. [Google Scholar] [CrossRef]
- Almqvist, B.S.G.; Hirt, A.M.; Schmidt, V.; Dietrich, D. Magnetic fabrics of the Morcles Nappe complex. Tectonophysics 2009, 466, 89–100. [Google Scholar] [CrossRef]
- Renjith, A.R.; Mamtani, M.A.; Urai, J.L. Fabric analysis of quartzites with negative magnetic susceptibility—Does AMS provide information of SPO or CPO of quartz? J. Struct. Geol. 2016, 82, 48–59. [Google Scholar] [CrossRef]
- Borradaile, G.J.; Almqvist, B.S.G.; Geneviciene, I. Anisotropy of magnetic susceptibility (AMS) and diamagnetic fabrics in the Durness Limestone, NW Scotland. J. Struct. Geol. 2012, 34, 54–60. [Google Scholar] [CrossRef]
- Braun, D.; Weinberger, R.; Eyal, Y.; Feinstein, S.; Harlavan, Y.; Levi, T. Distinctive diamagnetic fabrics in dolostones evolved at fault cores, the Dead Sea Transform. J. Struct. Geol. 2015, 77, 11–26. [Google Scholar] [CrossRef]
- de Wall, H.; Bestmann, M.; Ullemeyer, K. Anisotropy of diamagnetic susceptibility in Thassos marble: A comparison between measured and modeled data. J. Struct. Geol. 2000, 22, 1761–1771. [Google Scholar] [CrossRef]
- Evans, M.A.; Lewchuk, M.T.; Elmore, R.D. Strain partitioning of deformation mechanisms in limestones: Examining the relationship of strain and anisotropy of magnetic susceptibility (AMS). J. Struct. Geol. 2003, 25, 1525–1549. [Google Scholar] [CrossRef]
- Issachar, R.; Levi, T.; Marco, S.; Weinberger, R. Strain Field Associated With a Component of Divergent Motion Along the Southern Dead Sea Fault: Insights From Magnetic Fabrics. Tectonics 2019, 38, 335–353. [Google Scholar] [CrossRef] [Green Version]
- Issachar, R.; Levi, T.; Marco, S.; Weinberger, R. Anisotropy of magnetic susceptibility in diamagnetic limestones reveals deflection of the strain field near the Dead Sea Fault, northern Israel. Tectonophysics 2015, 656, 175–189. [Google Scholar] [CrossRef]
- Levi, T.; Weinberger, R. Magnetic fabrics of diamagnetic rocks and the strain field associated with the Dead Sea Fault, northern Israel. J. Struct. Geol. 2011, 33, 566–578. [Google Scholar] [CrossRef]
- Schmidt, V.; Gunther, D.; Hirt, A.M. Magnetic anisotropy of calcite at room-temperature. Tectonophysics 2006, 418, 63–73. [Google Scholar] [CrossRef]
- Hrouda, F. Problems in interpreting AMS parameters in diamagnetic rocks. Geol. Soc. Lond. Spec. Publ. 2004, 238, 49–59. [Google Scholar] [CrossRef]
- Rochette, P.; Jackson, M.; Aubourg, C. Rock magnetism and the interpretation of anisotropy of magnetic susceptibility. Rev. Geophys. 1992, 30, 209. [Google Scholar] [CrossRef]
- Owens, W.H. Mathematical model studies on factors affecting the magnetic anisotropy of deformed rocks. Tectonophysics 1974, 24, 115–131. [Google Scholar] [CrossRef]
- Hrouda, F.; Jezek, J. Theoretical models for the relationship between magnetic anisotropy and strain: Effect of triaxial magnetic grains. Tectonophysics 1999, 301, 183–190. [Google Scholar] [CrossRef]
- Elhanati, D.; Issachar, R.; Levi, T.; Weinberger, R. A Practical Approach for Identification of Magnetic Fabric Carriers in Rocks. J. Geophys. Res. Solid Earth 2021, 126. [Google Scholar] [CrossRef]
- Biedermann, A.R. Magnetic anisotropy in single crystals: A review. Geosciences 2018, 8, 302. [Google Scholar] [CrossRef] [Green Version]
- Nye, J.F. Physical Properties of Crystals; Oxford University Press: London, UK, 1957. [Google Scholar]
- Hrouda, F. Magnetic-anisotropy of rocks and its application in geology and geophysics. Geophys. Surv. 1982, 5, 37–82. [Google Scholar] [CrossRef]
- Soto, R.; Beamud, E.; Oliva-Urcia, B.; Roca, E. Applicability of magnetic fabrics in rocks associated with the emplacement of salt structures (the Bicorb–Quesa and Navarrés salt walls, Prebetics, SE Spain). Tectonophysics 2014, 629, 319–334. [Google Scholar] [CrossRef]
- Issachar, R.; Weinberger, R.; Alsop, G.I.; Levi, T. Deformation of Intrasalt Beds Recorded by Magnetic Fabrics. J. Geophys. Res. Solid Earth 2019, 124, 12465–12483. [Google Scholar] [CrossRef]
- Santolaria, P.; Casas, A.M.; Soto, R. Anisotropy of magnetic susceptibility as a proxy to assess internal deformation in diapirs: Case study of the Naval salt wall (Southern Pyrenees). Geophys. J. Int. 2015, 202, 1207–1222. [Google Scholar] [CrossRef]
- Šmid, J.; Schulmann, K.; Hrouda, F. Preliminary data on the AMS fabric in salt domes from the SW part of Zagros Mts., Iran. GeoLines 2001, 13, 114–115. [Google Scholar]
- Heinrich, F.C.; Schmidt, V.; Schramm, M.; Mertineit, M. Anisotropy of magnetic susceptibility in salt rocks from the German Zechstein Basin, Sondershausen mine. Geophys. J. Int. 2019, 219, 690–712. [Google Scholar] [CrossRef]
- Heinrich, F.C.; Schmidt, V.; Schramm, M.; Mertineit, M. Magnetic and mineralogical properties of salt rocks from the Zechstein of the Northern German Basin. Geophys. J. Int. 2017, 208, 1811–1831. [Google Scholar] [CrossRef]
- Garfunkel, Z. Internal structure of the Dead Sea leaky transform (rift) in relation to plate kinematics. Tectonophysics 1981, 80, 81–108. [Google Scholar] [CrossRef]
- Garfunkel, Z. Lateral motion and deformation along the Dead Sea Transform. In Dead Sea Transform Fault System: Reviews; Springer: Dordrecht, The Netherlands, 2014; Volume 6, pp. 109–145. ISBN 978-94-017-8871-7. [Google Scholar]
- Kashai, E.L.; Crocker, P.F. Structural geometry and evolution of the Dead Sea-Jordan rift system as deduced from new subsurface data. Tectonophysics 1987, 141, 33–60. [Google Scholar] [CrossRef]
- Matmon, A.; Fink, D.; Davis, M.; Niedermann, S.; Rood, D.; Frumkin, A. Unraveling rift margin evolution and escarpment development ages along the Dead Sea fault using cosmogenic burial ages. Quat. Res. 2014, 82, 281–295. [Google Scholar] [CrossRef] [Green Version]
- Zak, I. The Geology of Mount Sedom. Ph.D. Thesis, Hebrew University, Jerusalem, Israel, 1967. [Google Scholar]
- Weinberger, R.; Agnon, A.; Ron, H. Paleomagnetic reconstruction of a diapir emplcement: A case study from Sedom diapir, the Dead Sea Rift. J. Geophys Res. 1997, 102, 5173–5192. [Google Scholar] [CrossRef]
- Alsop, G.I.; Weinberger, R.; Levi, T.; Marco, S. Deformation within an exposed salt wall: Recumbent folding and extrusion of evaporites in the Dead Sea Basin. J. Struct. Geol. 2015, 70, 95–118. [Google Scholar] [CrossRef]
- Weinberger, R.; Levi, T.; Alsop, G.I.; Marco, S. Kinematics of Mass Transport Deposits revealed by magnetic fabrics. Geophys. Res. Lett. 2017, 44, 7743–7749. [Google Scholar] [CrossRef] [Green Version]
- Weinberger, R.; Lyakhovsky, V.; Baer, G.; Begin, Z.B. Mechanical modeling and InSAR measurements of Mount Sedom uplift, Dead Sea basin: Implications for effective viscosity of rock salt. Geochem. Geophys. Geosyst. 2006, 7. [Google Scholar] [CrossRef] [Green Version]
- Weinberger, R.; Begin, Z.B.; Waldmann, N.; Gardosh, M.; Baer, G.; Frumkin, A.; Wdowinski, S. Quaternary rise of the Sedom diapir, Dead Sea basin. In Special Paper 401: New Frontiers in Dead Sea Paleoenvironmental Research; Geological Society of America: Boulder, CO, USA, 2006; pp. 33–51. [Google Scholar]
- Weinberger, R.; Bar-Matthews, M.; Levi, T.; Begin, Z.B. Late-Pleistocene rise of the Sedom diapir on the backdrop of water-level fluctuations of Lake Lisan, Dead Sea basin. Quat. Int. 2007, 175, 53–61. [Google Scholar] [CrossRef]
- Zucker, E.; Frumkin, A.; Agnon, A.; Weinberger, R. Internal deformation and uplift-rate of salt walls detected by a displaced dissolution surface, Dead Sea basin. J. Struct. Geol. 2019, 127, 103870. [Google Scholar] [CrossRef]
- Alsop, G.I.; Weinberger, R.; Levi, T.; Marco, S. Cycles of passive versus active diapirism recorded along an exposed salt wall. J. Struct. Geol. 2016, 84, 47–67. [Google Scholar] [CrossRef] [Green Version]
- Schléder, Z.; János, A.E.; Urai, L.; Sofie, A.E.; Ae, N.; Hilgers, C.; Schléder, Z.; Urai, J.L.; Nollet, Á.S.; Hilgers, Á.C.; et al. Solution-precipitation creep and fluid flow in halite: A case study of Zechstein (Z1) rocksalt from Neuhof salt mine (Germany). Int. J. Earth Sci. 2008, 97, 1045–1056. [Google Scholar] [CrossRef]
- Sneh, A.; Weinberger, R. Major Structures of Israel and Environs, Scale 1: 500,000; Geological Survey of Israel: Jerusalem, Israel, 2014.
- Agnon, A.; Weinberger, R.; Zak, I.; Sneh, A. Geological Map of Israel, Sheet 20-I Sedom, Scale 1: 50,000; Geological Survey of Israel: Jerusalem, Israel, 2006.
- Issachar, R.; Levi, T.; Lyakhovsky, V.; Marco, S.; Weinberger, R. Improving the method of low-temperature anisotropy of magnetic susceptibility (LT-AMS) measurements in air. Geochem. Geophys. Geosyst. 2016, 17, 2940–2950. [Google Scholar] [CrossRef]
- Jelinek, V. Measuring anisotropy of magnetic susceptibility on a slowly spinning specimen-basic theory. In AGICO Print No 10; Agico, Inc.: Brno, Czech Republic, 1995. [Google Scholar]
- Jackson, M.; Tauxe, L. Anisotropy of magnetic susceptibility and remanence: Developments in the characterization of tectonic, sedimentary and igneous fabric. Rev. Geophys. 1991, 29, 371–376. [Google Scholar] [CrossRef]
- Jelinek, V. Characterization of the magnetic fabric of rocks. Tectonophysics 1981, 79, T63–T67. [Google Scholar] [CrossRef]
- Jelinek, V. The Statistical Theory of Measuring Anisotropy of Magnetic Susceptibility of Rocks and Its Application; Geofyzika: Brno, Czech Republic, 1977; pp. 1–88. [Google Scholar]
- Urai, J.L.; Spiers, C.J.; Peach, C.J.; Franssen, R.C.M.W.; Liezenberg, J.L. Deformation mechanisms operating in naturally deformed halite rocks as deduced from microstructural investigations. Geol. Mijnb. 1987, 66, 165–176. [Google Scholar]
- Schléder, Z.; Urai, J.L. Microstructural evolution of deformation-modified primary halite from the Middle Triassic Röt Formation at Hengelo, The Netherlands. Int. J. Earth Sci. 2005, 94, 941–955. [Google Scholar] [CrossRef]
- Schléder, Z.; Urai, J.L. Deformation and recrystallization mechanisms in mylonitic shear zones in naturally deformed extrusive Eocene–Oligocene rocksalt from Eyvanekey plateau and Garmsar hills (central Iran). J. Struct. Geol. 2007, 29, 241–255. [Google Scholar] [CrossRef]
- Urai, J.L.; Spiers, C.J.; Zwart, H.J.; Lister, G.S. Weakening of rock salt by water during long-term creep. Nature 1986, 324, 554–557. [Google Scholar] [CrossRef]
- Tarling, D.H.; Hrouda, F.H. The Magnetic Anisotropy of Rocks; Chapman and Hall: London, UK, 1993; ISBN 0412498804. [Google Scholar]
- Zak, I.; Freund, R. Strain measurements in eastren marginal shear zone of Mount Sedom salt diapir. AAPG Bull. 1980, 64, 568–581. [Google Scholar] [CrossRef]
- Biedermann, A.R.; Lowrie, W.; Hirt, A.M. A method for improving the measurement of low-field magnetic susceptibility anisotropy in weak samples. J. Appl. Geophys. 2013, 88, 122–130. [Google Scholar] [CrossRef]
- Ivakhnenko, O.P.; Abirov, R.; Logvinenko, A. New Method for Characterisation of Petroleum Reservoir Fluidmineral Deposits Using Magnetic Analysis. Energy Procedia 2015, 76, 454–462. [Google Scholar] [CrossRef] [Green Version]
- Eugene, C.R.; Richard, A.R.; Kenneth, G.B. Physical Properties of Salt, Anhydrite and Gypsum—Preliminary Report; US Geological Survey: Denver, CO, USA, 1958.
- Talbot, C.J. Extrusions of Hormuz salt in Iran. Geol. Soc. Spec. Publ. 1998, 143, 315–334. [Google Scholar] [CrossRef]
- Schoenherr, J.; Schléder, Z.; Urai, J.L.; Littke, R.; Kukla, P.A. Deformation mechanisms of deeply buried and surface-piercing Late Pre-Cambrian to Early Cambrian Ara Salt from interior Oman. Int. J. Earth Sci. 2010, 99, 1007–1025. [Google Scholar] [CrossRef]
- Zulauf, G.; Zulauf, J.; Bornemann, O.; Kihm, N.; Peinl, M.; Zanella, F. Experimental deformation of a single-layer anhydrite in halite matrix under bulk constriction. Part 1: Geometric and kinematic aspects. J. Struct. Geol. 2009, 31, 460–474. [Google Scholar] [CrossRef]
- Zulauf, G.; Zulauf, J.; Bornemann, O.; Brenker, F.E.; Höfer, H.E.; Peinl, M.; Woodland, A.B. Experimental deformation of a single-layer anhydrite in halite matrix under bulk constriction. Part 2: Deformation mechanisms and the role of fluids. J. Struct. Geol. 2010, 32, 264–277. [Google Scholar] [CrossRef]
- Thiemeyer, N.; Zulauf, G.; Mertineit, M.; Linckens, J.; Pusch, M.; Hammer, J. Microfabrics and 3D grain shape of Gorleben rock salt: Constraints on deformation mechanisms and paleodifferential stress. Tectonophysics 2016, 676, 1–19. [Google Scholar] [CrossRef]
- Linckens, J.; Zulauf, G.; Mertineit, M. The influence of a grain-shape fabric on the mechanical behaviour of rock salt: Results from deformation experiments. Tectonophysics 2019, 751, 73–82. [Google Scholar] [CrossRef]
- Vargas-Meleza, L.; Healy, D.; Alsop, G.I.; Timms, N.E. Exploring the relative contribution of mineralogy and CPO to the seismic velocity anisotropy of evaporites. J. Struct. Geol. 2015, 70, 39–55. [Google Scholar] [CrossRef] [Green Version]
Publisher’s Note: MDPI stays neutral with regard to jurisdictional claims in published maps and institutional affiliations. |
© 2022 by the authors. Licensee MDPI, Basel, Switzerland. This article is an open access article distributed under the terms and conditions of the Creative Commons Attribution (CC BY) license (https://creativecommons.org/licenses/by/4.0/).