Article

Rod Mill Product Control and Its Relation to Energy Consumption: A Case Study

by
Hernan Anticoi
1,2,*,
Eduard Guasch
1,
Rubén Pérez-Álvarez
2,
Julio Manuel de Luis-Ruiz
2,
Josep Oliva
1 and
Carlos Hoffman Sampaio
1
1
Mining, Mechanical, Industrial and ITC Department, Mining School of Mines, Polytechnic University of Catalonia, 08242 Manresa, Spain
2
Grupo de Investigación de Ingeniería Cartográfica y Explotación de Minas, Escuela Politécnica de Ingeniería de Minas y Energía, Universidad de Cantabria, Boulevard Ronda Rufino Peón, 254, Tanos, 39300 Torrelavega, Spain
*
Author to whom correspondence should be addressed.
Minerals 2022, 12(2), 183; https://doi.org/10.3390/min12020183
Submission received: 10 December 2021 / Revised: 23 January 2022 / Accepted: 28 January 2022 / Published: 30 January 2022
(This article belongs to the Special Issue Experimental and Numerical Studies of Mineral Comminution)

Abstract

:
Energy consumption and pollution are current strategic issues that need to be addressed in the mining industry. Both have an economic and environmental impact on production, so their optimization, control, and mitigation are, at the very least, mandatory. Although rod milling has fallen into disuse in recent decades, some companies still use it in their processing plants. This is due to the ability of rod milling to reduce particle size while avoiding overgrinding. In this study, a material that is particularly difficult to characterize was used to study how to control rod-milling particle size distribution product: potash ore, which is deliquescent and soluble under certain conditions. A laboratory-scale tumbling rod mill was designed for this study, and six operative parameters were tested and analyzed in order to detect the main influences on the mill product, attending to material requirements for further processes such as recirculation load or froth flotation for beneficiation. Although the rotational speed of the mill is the parameter that shows the greatest reduction in energy consumption, reaching almost 40% improvement in specific energy applied to the particles, it is not possible to control particle size reduction ratio. However, when a low percentage of grinding media is used, it reduces around 25% of the energy used and, in turn, reduces the amount of overgrinding (40% reduction in the F300 control parameter, for example), which is a strategic objective of this study. In addition, by controlling other process parameters, such as slurry density or lifter geometry, energy consumption and its subsequent saving and pollution can be controlled, depending on process plant requirements.

1. Introduction

Commonly used in conventional processing plant flowsheets, tumbling mills are predominant in mineral processing operations. They are responsible for achieving the key objective in this field, which is to separate ore from gangue. In terms of breakage mechanisms, while abrasion and impact prevail in ball mills, rod mills are used for their type of preferential grinding over larger particles [1]. In general, in the milling stage, in order to avoid the generation of finer particles, the most desirable effect should be impact and compression, rather abrasion and shear, as occurs in ball mills [2]. In this respect, rod mills generate relatively fewer of these finer particles compared to ball milling under exactly the same operating conditions, i.e., to obtain the same particle size distribution product, the operating conditions should be varied [3]. However, such mills have throughput and scalability problems [1].
In addition, it has been found that there is a distinct particle size on both the upper and the lower boundary, where in a downstream beneficiation process, such as froth flotation rate recovery, finer particles might behave differently than larger particles [4,5,6,7].
The third pillar addressed in this work is related to energy consumption. Comminution consumes nearly 50% of a mine site’s overall energy costs [8]. In grinding operations, most of the energy applied to particle size reduction is dissipated as heat in the rock, inelastic strain, the motion of any load, mechanical transmission, and other losses [9,10]. Thus, it is absolutely necessary to control the operating parameters of the grinding process to optimize the size reduction in order to achieve minimum energy consumption. It has been proven that by varying the grinding media (balls or rods), the same particle size results can be obtained with optimum net energy applied [11]. Some current mathematical approaches could be an interesting tool in this regard [12]. The population balance model (PBM) gathers all the operative data plus some ore characteristics, and uses them to predict the tumbling mill product in terms of particle size and mass balance [13,14].
Therefore, this study aims to identify which parameters can be used to control rod milling operations in order to obtain a material with a certain size characteristic at a lower energy consumption. The material under study is comminuted in rod mills, but for further processing, a relatively larger particle size distribution is sufficient to liberate the ore. Reaching 50% of the product with a size above 650 μm is sufficient for efficient flotation concentration. On the other hand, this flotation rate decreases with a particle population of less than 300 μm. Finally, as a secondary target, the recirculation rate occurs with a particle population of more than 1050 μm. Thus, for this case, it is understood that an optimal process occurs under these considerations, within these size ranges, in addition to reducing energy consumption.
The literature gives us some clues in this regard: one of the first conditions controlling the rod mill product is precisely the feed size distribution, and it has been demonstrated that a rod mill achieves the same level of fine particles at a lower energy consumption level [15]. We also have throughput, which directly affects the residence time [16] and impact on the material reduction rate [2]. There are several variations that affect throughput: adding and/or decreasing the solids load or adding and/or decreasing the fluid volume. All these actions also influence the solid/liquid ratio of the slurry or the so-called slurry density. These changes also affect the breakage kinetic comportment [17]. In terms of behavior within the process itself, if the percentage of solids in the slurry is low, it causes the formation of a pool in the mill, increasing metal-to-metal contact, and involves intense wear of the grinding media. In addition, a large volume of the mill filled with water reduces the comminution efficiency. On the other hand, at a very high density and viscosity, the suspension acts as a buffer and creates resistance from the movements of the grinding medium [18].
In rod milling, the grinding media tends to produce a smaller amount of finer material, a factor related to the contact point number between the ground material and the media itself. This is because the feed propagates through the rods, producing cone-shaped arrays; thus, grinding takes place by priority on the larger particles [3]. The media charge volume is rod diameter dependent [2] and also affects mill power draft [1].
The rotation speed of the drum (expressed as a percentage of a certain critical speed, Vc) also affects breakage kinetics. This percentage of the critical rotational speed on tumbling mills normally varies from 65% to 72% [1]. It has been observed that the product becomes finer as the rotational speed of the mill is increased, but only to a certain point. After exceeding 75% of the critical speed, the product remains constant [19]. Above 80% of the critical rotation speed, the performance drops, and the reduction ratio decreases [20], with subsequent and unnecessary energy waste.
In terms of mill design, several relations are included between some geometrical features of the mill, such as aspect ratio and dimensions [1,21,22]. However, the implementation of the mill design could have a serious impact on the investment cost and was discarded for this case.
As for the effect of the lifter bars, they were developed to optimize the use of energy, loading efficiency and reduction of mill liner wear. As the height and angle of the lifter bars increase, the mill’s rotational speed can be reduced, promoting a waterfall effect in the grinding media, reducing energy consumption [23,24,25,26,27].
The importance of using mathematical models for the simulation of rod milling results lies in the ease with which it is possible to observe trends in the behavior of a material under this device without the need for actual in-plant testing [28]. These models are widely used not only in the mining industry but also in other fields, such as food processing and pharmaceuticals [29]. Potentially, it allows us to vary certain aspects that are difficult to reproduce in the experimental phase, and for this reason its use is justified.
Some efforts have been made to identify the parameters that have the greatest impact on the grinding of certain minerals, by comparing different equipment, with different characteristics, while looking for an optimum result, i.e., the highest degree of size reduction [30,31]. Some of these attempts have related it to energy consumption [32,33], but not simultaneously (taking into account all the grinding parameters), and above all when the optimum is not necessarily the highest reduction ratio, but rather an average particle size, avoiding overgrinding, which is the case in this study.

2. Materials and Methods

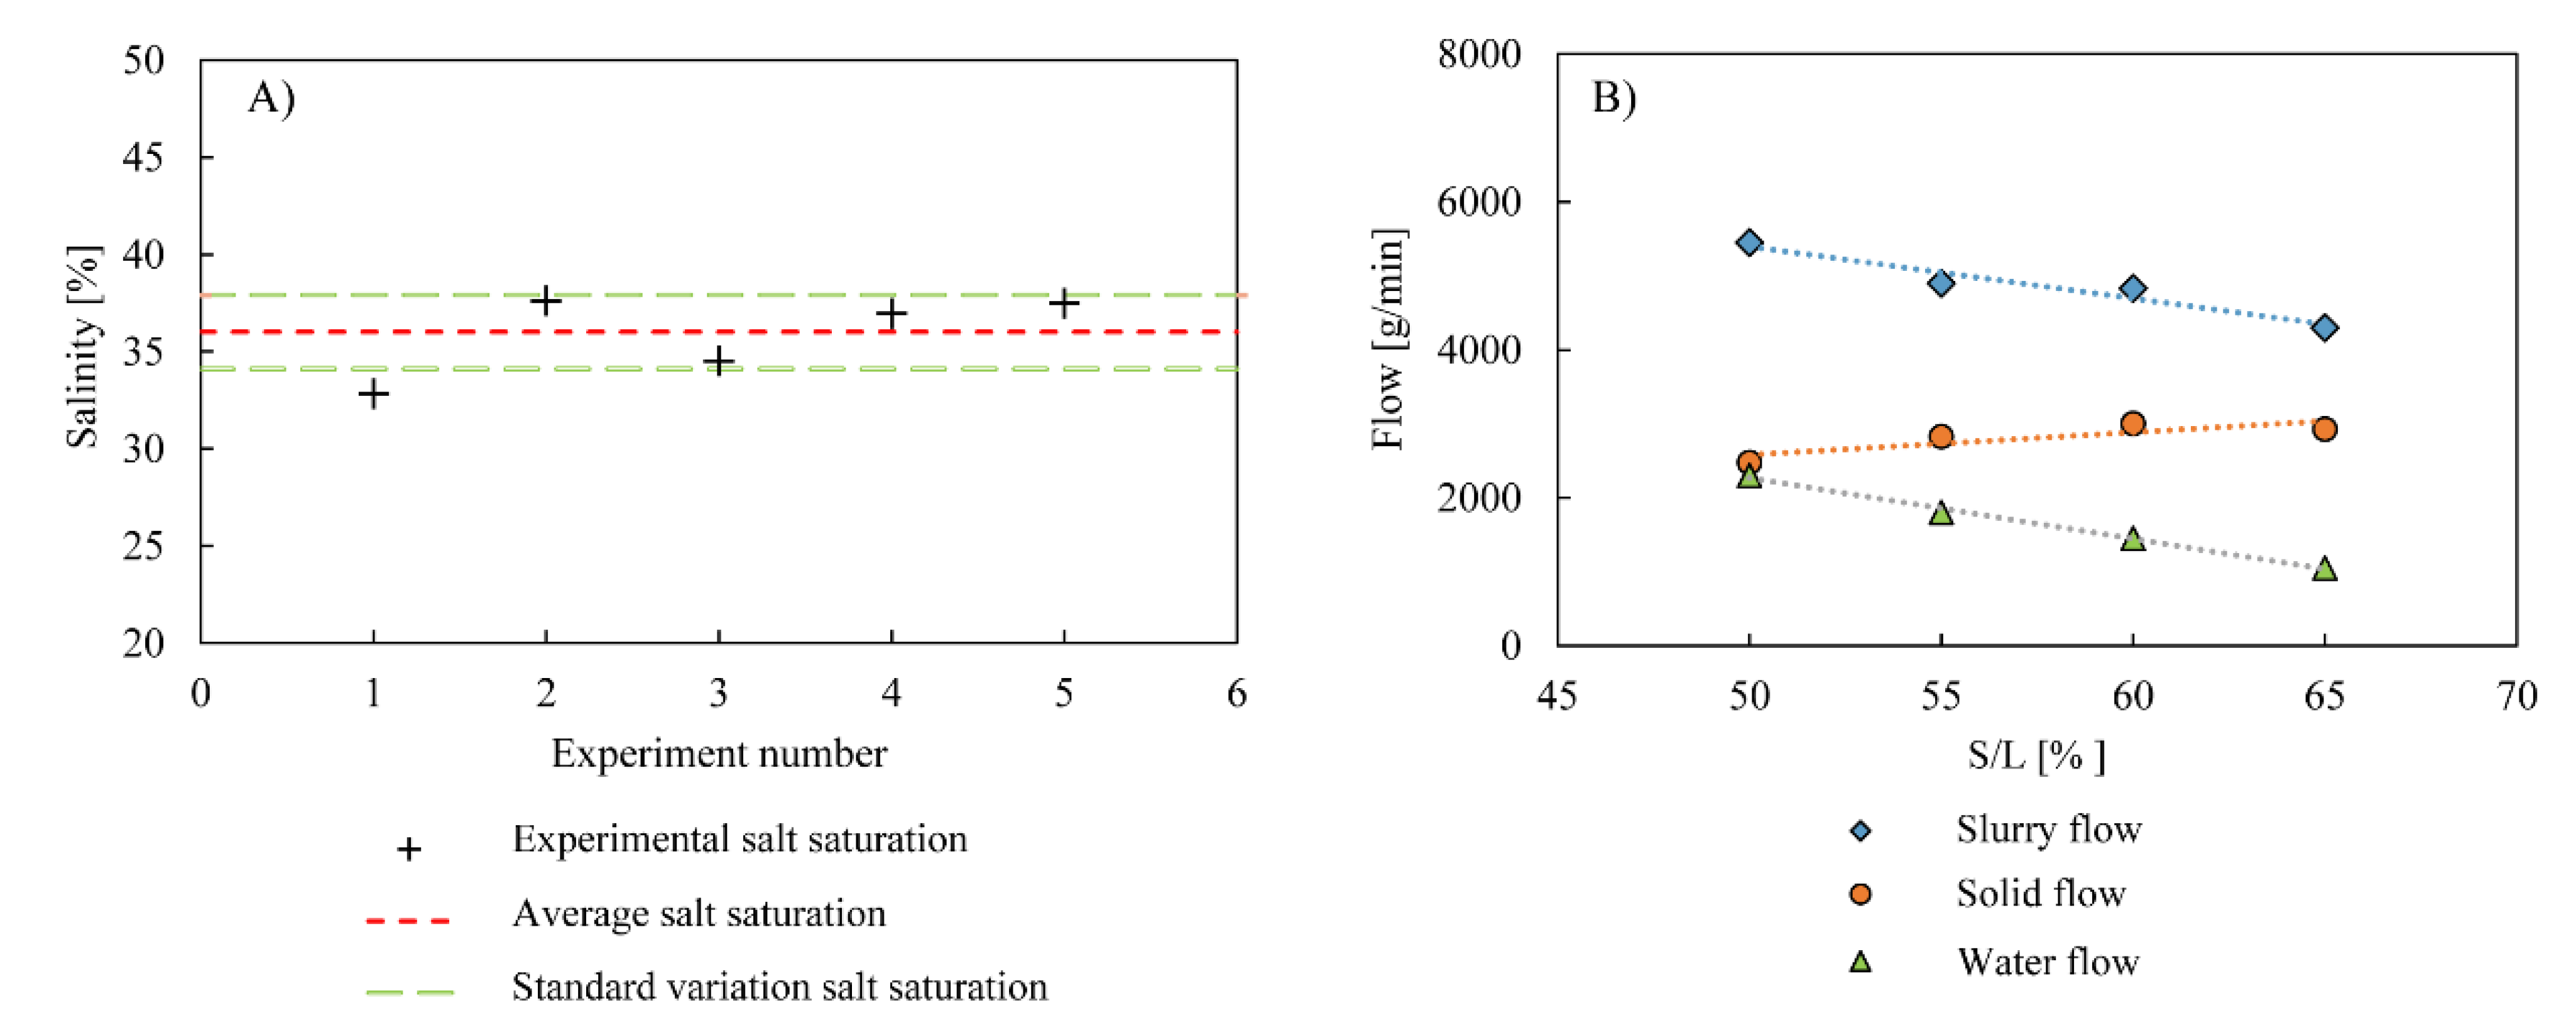
2.1. Materials and Particle Size Distribution Determination

The material in the study was obtained from a Spanish potash mine. It mainly comprises sylvite, halite, and in minor traces, carnallite and clays. All of them are chloride salts (excepting clays) and are deliquescent and soluble under certain conditions [29,34]. Added to this is the fact that the material’s properties change when it dries, undergoing instant crystallization and agglomeration. These characteristics represent several challenges to determining particle size distribution (PSD): when drying the material, it should be necessary to disaggregate it, but this process may induce comminution, and the results could be ambiguous. Before this happens, sieving should be performed under wet conditions using brine instead of water, and mass balances should be taken by drying the samples but considering salt precipitation due to brine evaporation. In addition to the described issues, it has been considered that brine saturation may vary with temperature, when composed of KCl or NaCl. For this reason, PSD has been achieved under controlled atmospheric conditions.
The mesh sizes used for PSD correspond to ASTM standard sieves [35], where the top-size detected was about 22.5 mm, and the minimum size was set to 160 μm. For the selection of the mesh size, several key points were considered which are necessary to control the grinding and the evaluation of the results. Firstly, the amount of material below 300 μm represents a problem for subsequent concentration process, so this mesh size was selected. In the processing plant, the screening cut-off point is 1050 μm. Close to this value is the 1180 μm mesh, which was also selected for PSD.
Full PSD could lead to a general comparison between different process stages. However, other key parameters are normally used to indicate trends and performance of a processing plant. There are three main size constants extracted from the PSD commonly used for this purpose: D10, D50, and D80, representing the sizes that are under 10%, 50%, and 80%, respectively, of the particle population (Table 1).
The parameters D10, D50, and D80 were obtained by linear regression at the target percentage limits, using Excel solver calculation. The F300 is the simple sum of all differential masses below 300 μm mesh size. The same applies to parameter C1050, but using the population of particles above 1050 μm mesh size (Figure 1).

2.2. Experimental Design

All lab-work tests were conducted in the Polytechnic University of Catalonia mineral processing laboratory, using a rod mill that was designed and manufactured exclusively for this study (Figure 2). The mill had a tumbling 1.3 L/D aspect ratio (Table 2). The geometry of two interchangeable lifters was included in the design of the mill liner: 35 mm and 23 mm in height (Figure 2B,C). The critical rotational speed (Vc) was calculated according to [2] and the energy consumption was the product of intensity (I) measured during all the experiments, and related to engine power, material flow, and residence time.
As the objective of this study was to reduce product overgrinding in rod milling, different experiments were designed to evaluate the effect of varying the operative conditions governing milling performance. Based on the described literature, the selected parameters were rod media charge, rod dimensions, rotation speed, slurry density, feed flow rate, and lifter design.
According to this, first, four experimental sessions were developed to mathematically model calibration and check the viability of the experiment. Each session tries to keep some operating conditions constant (%Vc and media charge) but varies a third one, that is, slurry density. Therefore, 16 tests were performed overall (Table 3). After these four sessions, 16 more experiments were performed to evaluate the effect of the six operative parameters mentioned before. The applied strategy was to keep all conditions constant, except that one which had to be evaluated (Table 4). The parameters of the numerical model were obtained independently with the modeling test series. Thus, with these values, the model was run, adding the operating conditions of the control tests. The study was conducted by comparing the experimental results, the energy consumed, and the simulated values of the control tests (Figure 3).

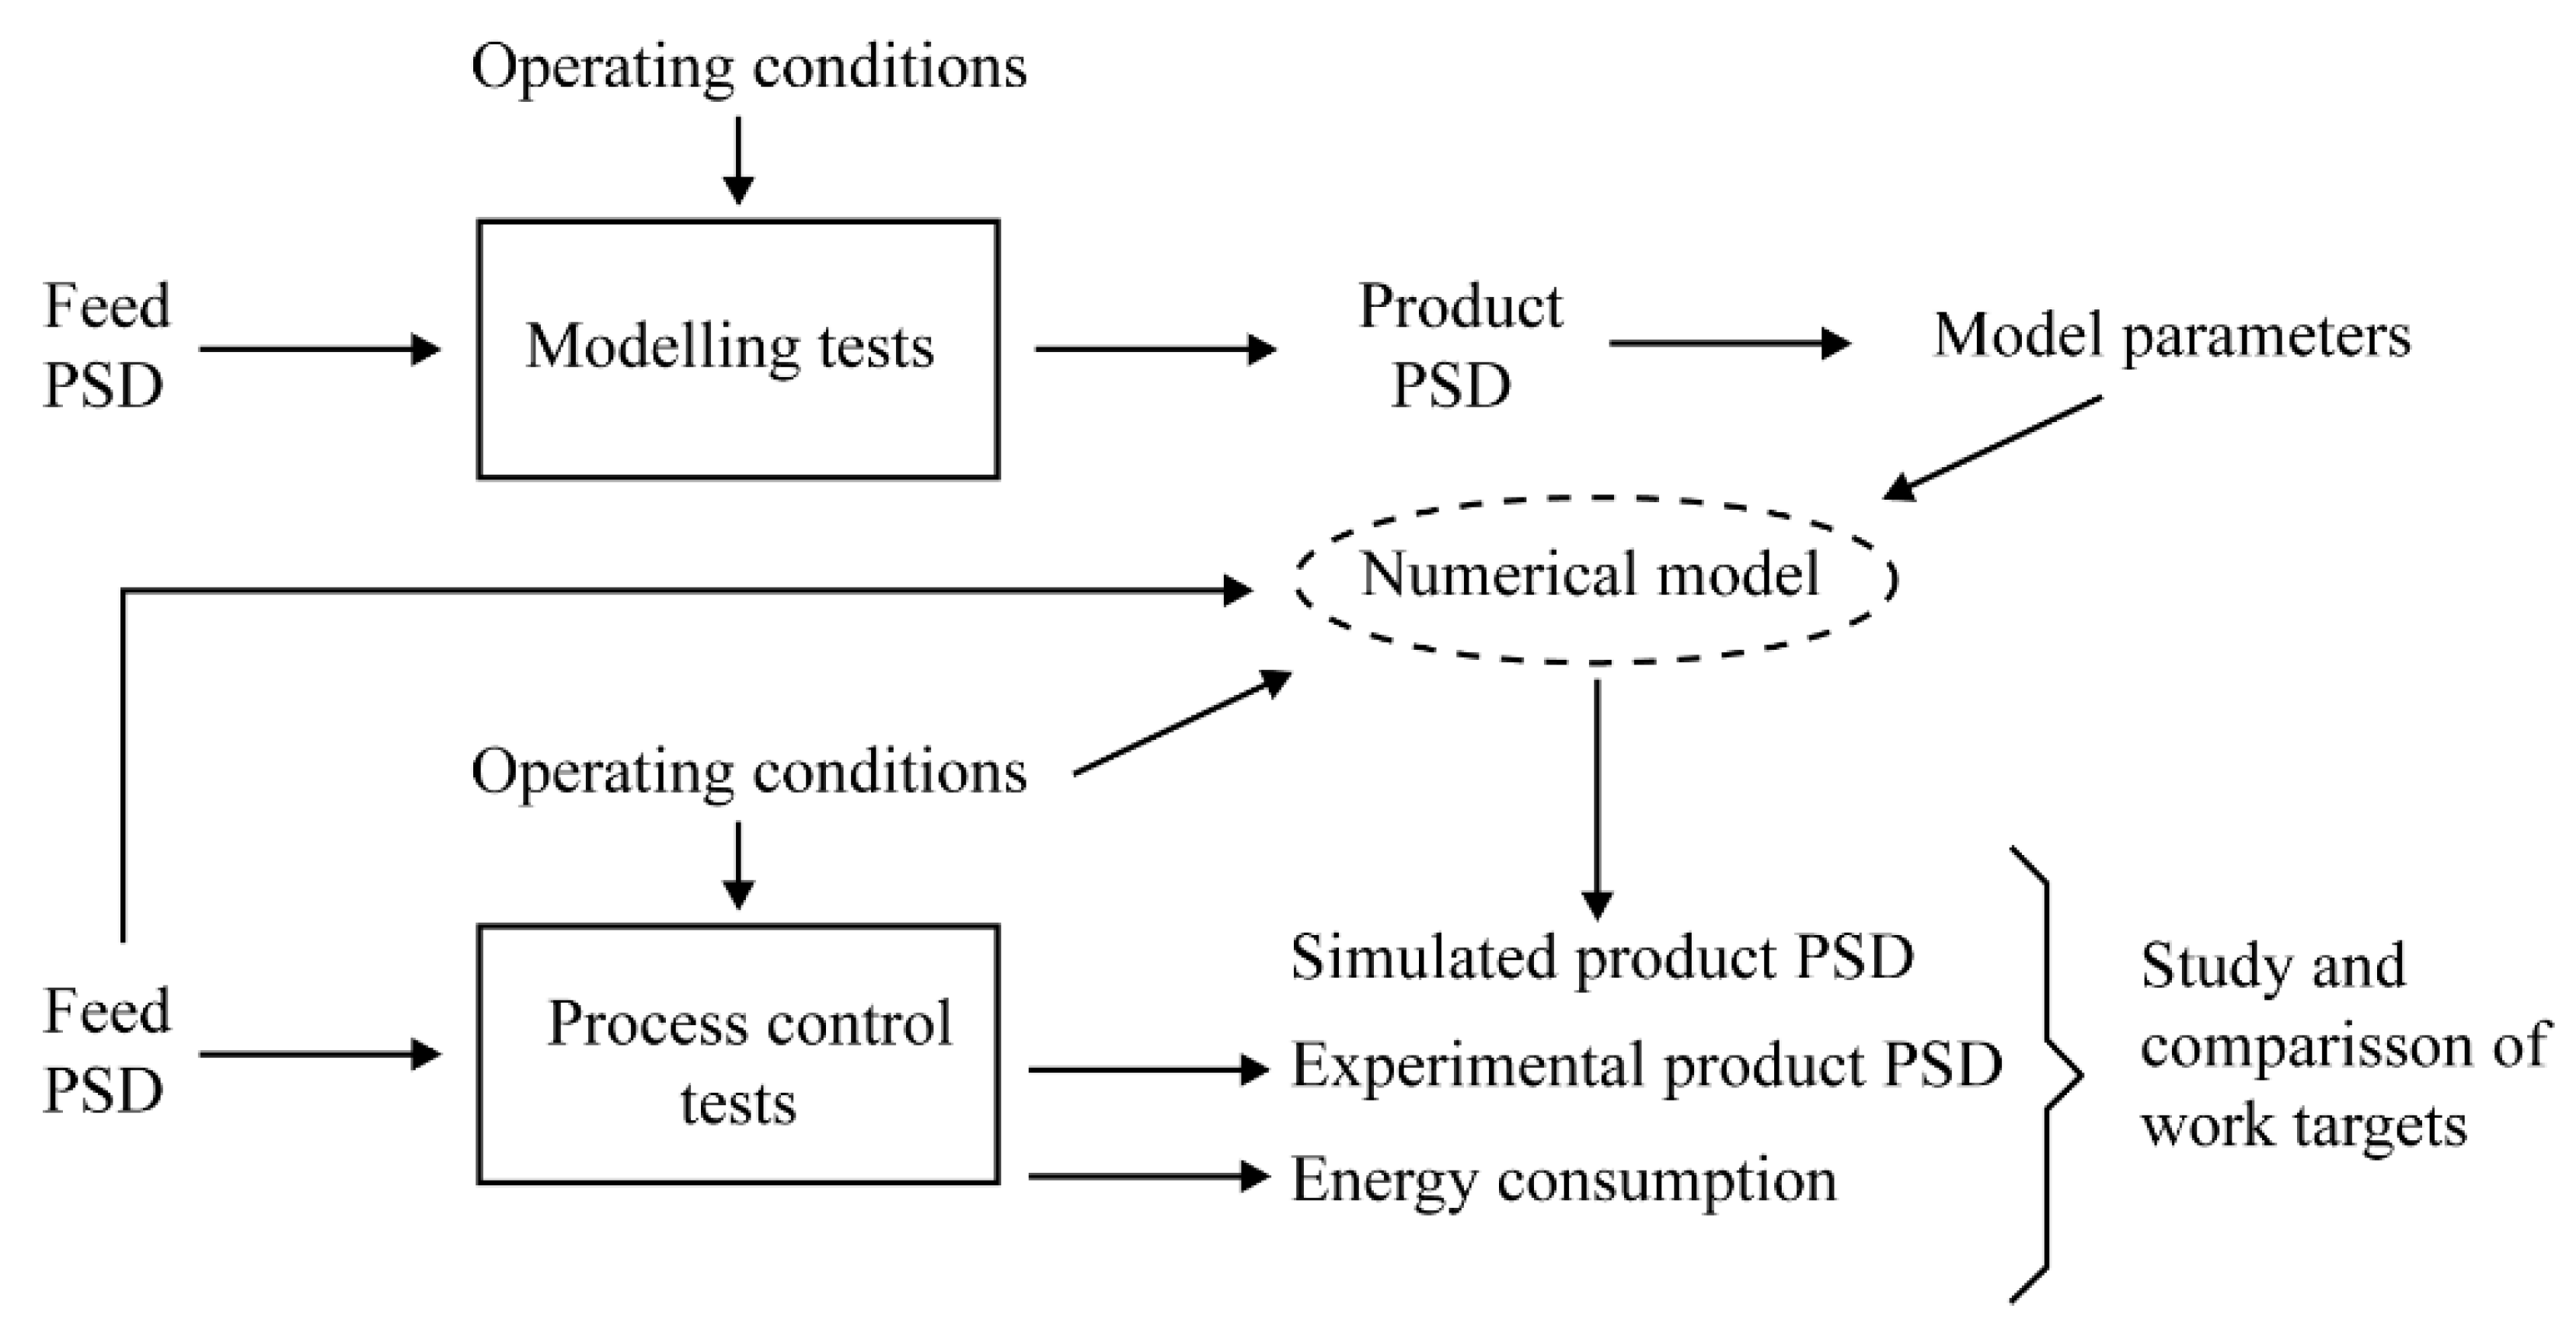
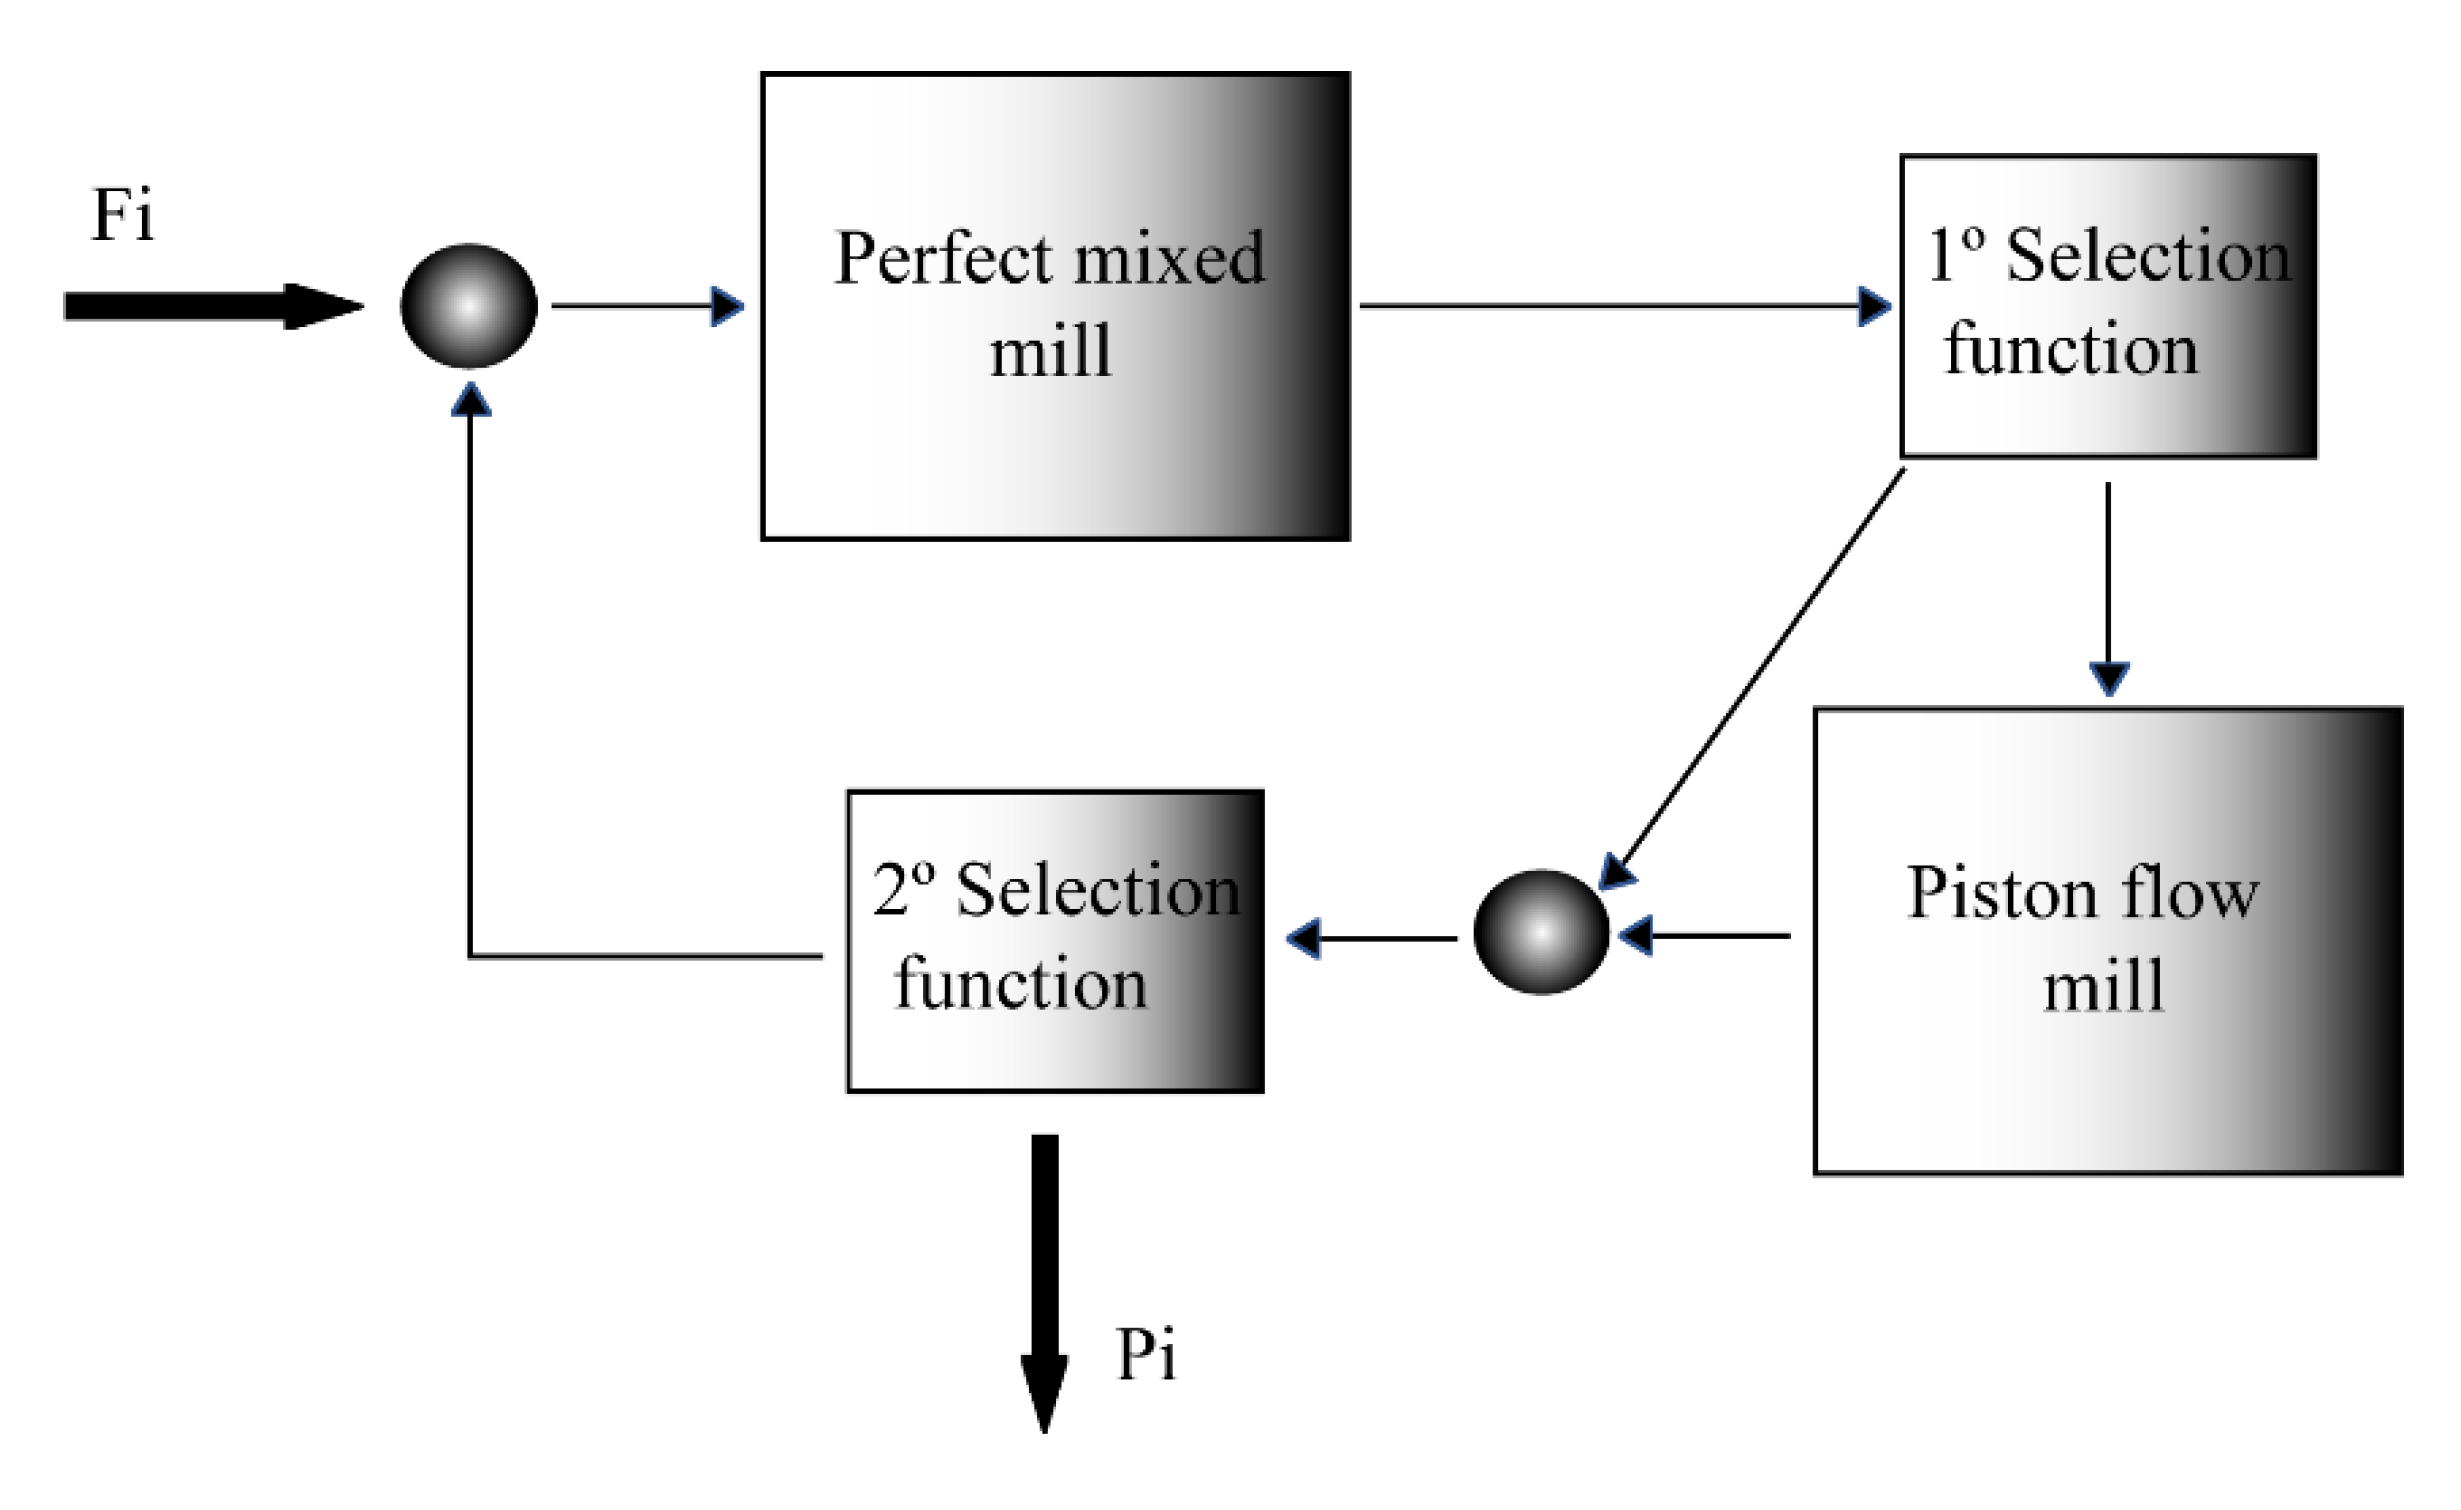
2.3. Mathematical Modeling for Optimization

A mathematical approach is presented to use modeling as a tool to predict particle size distribution when a material is processed in a tumbling mill, and its consequent prediction. In this regard, the widely used population balance model (PBM) is applied, considering the evolution of the comminution inside the drum, which is described by piston flow phenomena, combined with the perfect mixed mill theory [19]. This model also takes into account the water drag effect on the finer particles’ product (Figure 4).
The complex formulation of this approach is very well described in [19]. It is based on two main equations: (1) the kinetic function for the specific rate of breakage of the model as a first-order law, which has been simplified in the form of Equation (1) [36], and (2) the breakage distribution function (Equation (2)), which is modelled by the standard form presented by [37].
k ( d p ) = S 1 d p i α
B ( d p i , D p ) = k ( d p i D p ) n 1 + ( 1 k ) ( d p i D p ) n 2
Two mathematical expressions discriminate between those particles that enter into the piston flow and those that are not affected (Equation (3)) and the recirculation rate by water dragging (Equation (4)):
S a ( d p ) = { S i = ω 1 e β 1 d p i S < 1 S = 1 S 1
S b ( d p ) = { S i = ω 2 e β 2 d p i S < 1 S = 1 S 1
where dpi represents each element of the progeny particle diameter vector; thus, all these equations are dependent on material size. Dp is the parent particle for each breakage interval. Constant S1 is the breakage rate per minute. The parameters α, k, n1, n2 correspond to the breakage distribution functions, and they are related to material properties such as mineralogy, texture, or in some cases, fracture mechanisms [38,39]. ω1, β1, ω2, and β2 are process model parameters.
The perfect mixed mill uses the breakage function and the kinetic function as a discrete solution in Equation (5) [40]:
p i P = p i F + j = 1 i 1 b i j k j τ p j P 1 + k i τ
where p i P is the product of the mill in differential mass, p i F is the feed in differential mass, b i j is the breakage function, k j is the specific rate of breakage, τ is the residence time, and p j P is the product inside the mill that will generate smaller particles until leaving the drum.
The piston flow mill uses Reid’s solution [41] by means of Equations (6) and (7):
p i P = j = 1 i A i l e x p ( k j 4   W ρ   J π   D 2 L )
A i j = { 0 i < j l = j i 1 b i l k l k i k j A l j i > j p i F l = 1 i 1 A i l i = j
where ρ is the density of the mineral, J is the fraction of the mill filled by mineral, and D is the diameter of the mill, W is the mass flow through the mill, and L is the mill length.
The calibration experiments are useful to establish the model parameters by means of back-calculation techniques, in this case using MATLAB® script (R2017a). After that, the model was run to obtain simulations of the different experiments, varying the studied parameters for optimization. They were compared with the experimental values to evaluate the model robustness, by means of RMSE (root-mean-square error) [42].

3. Results

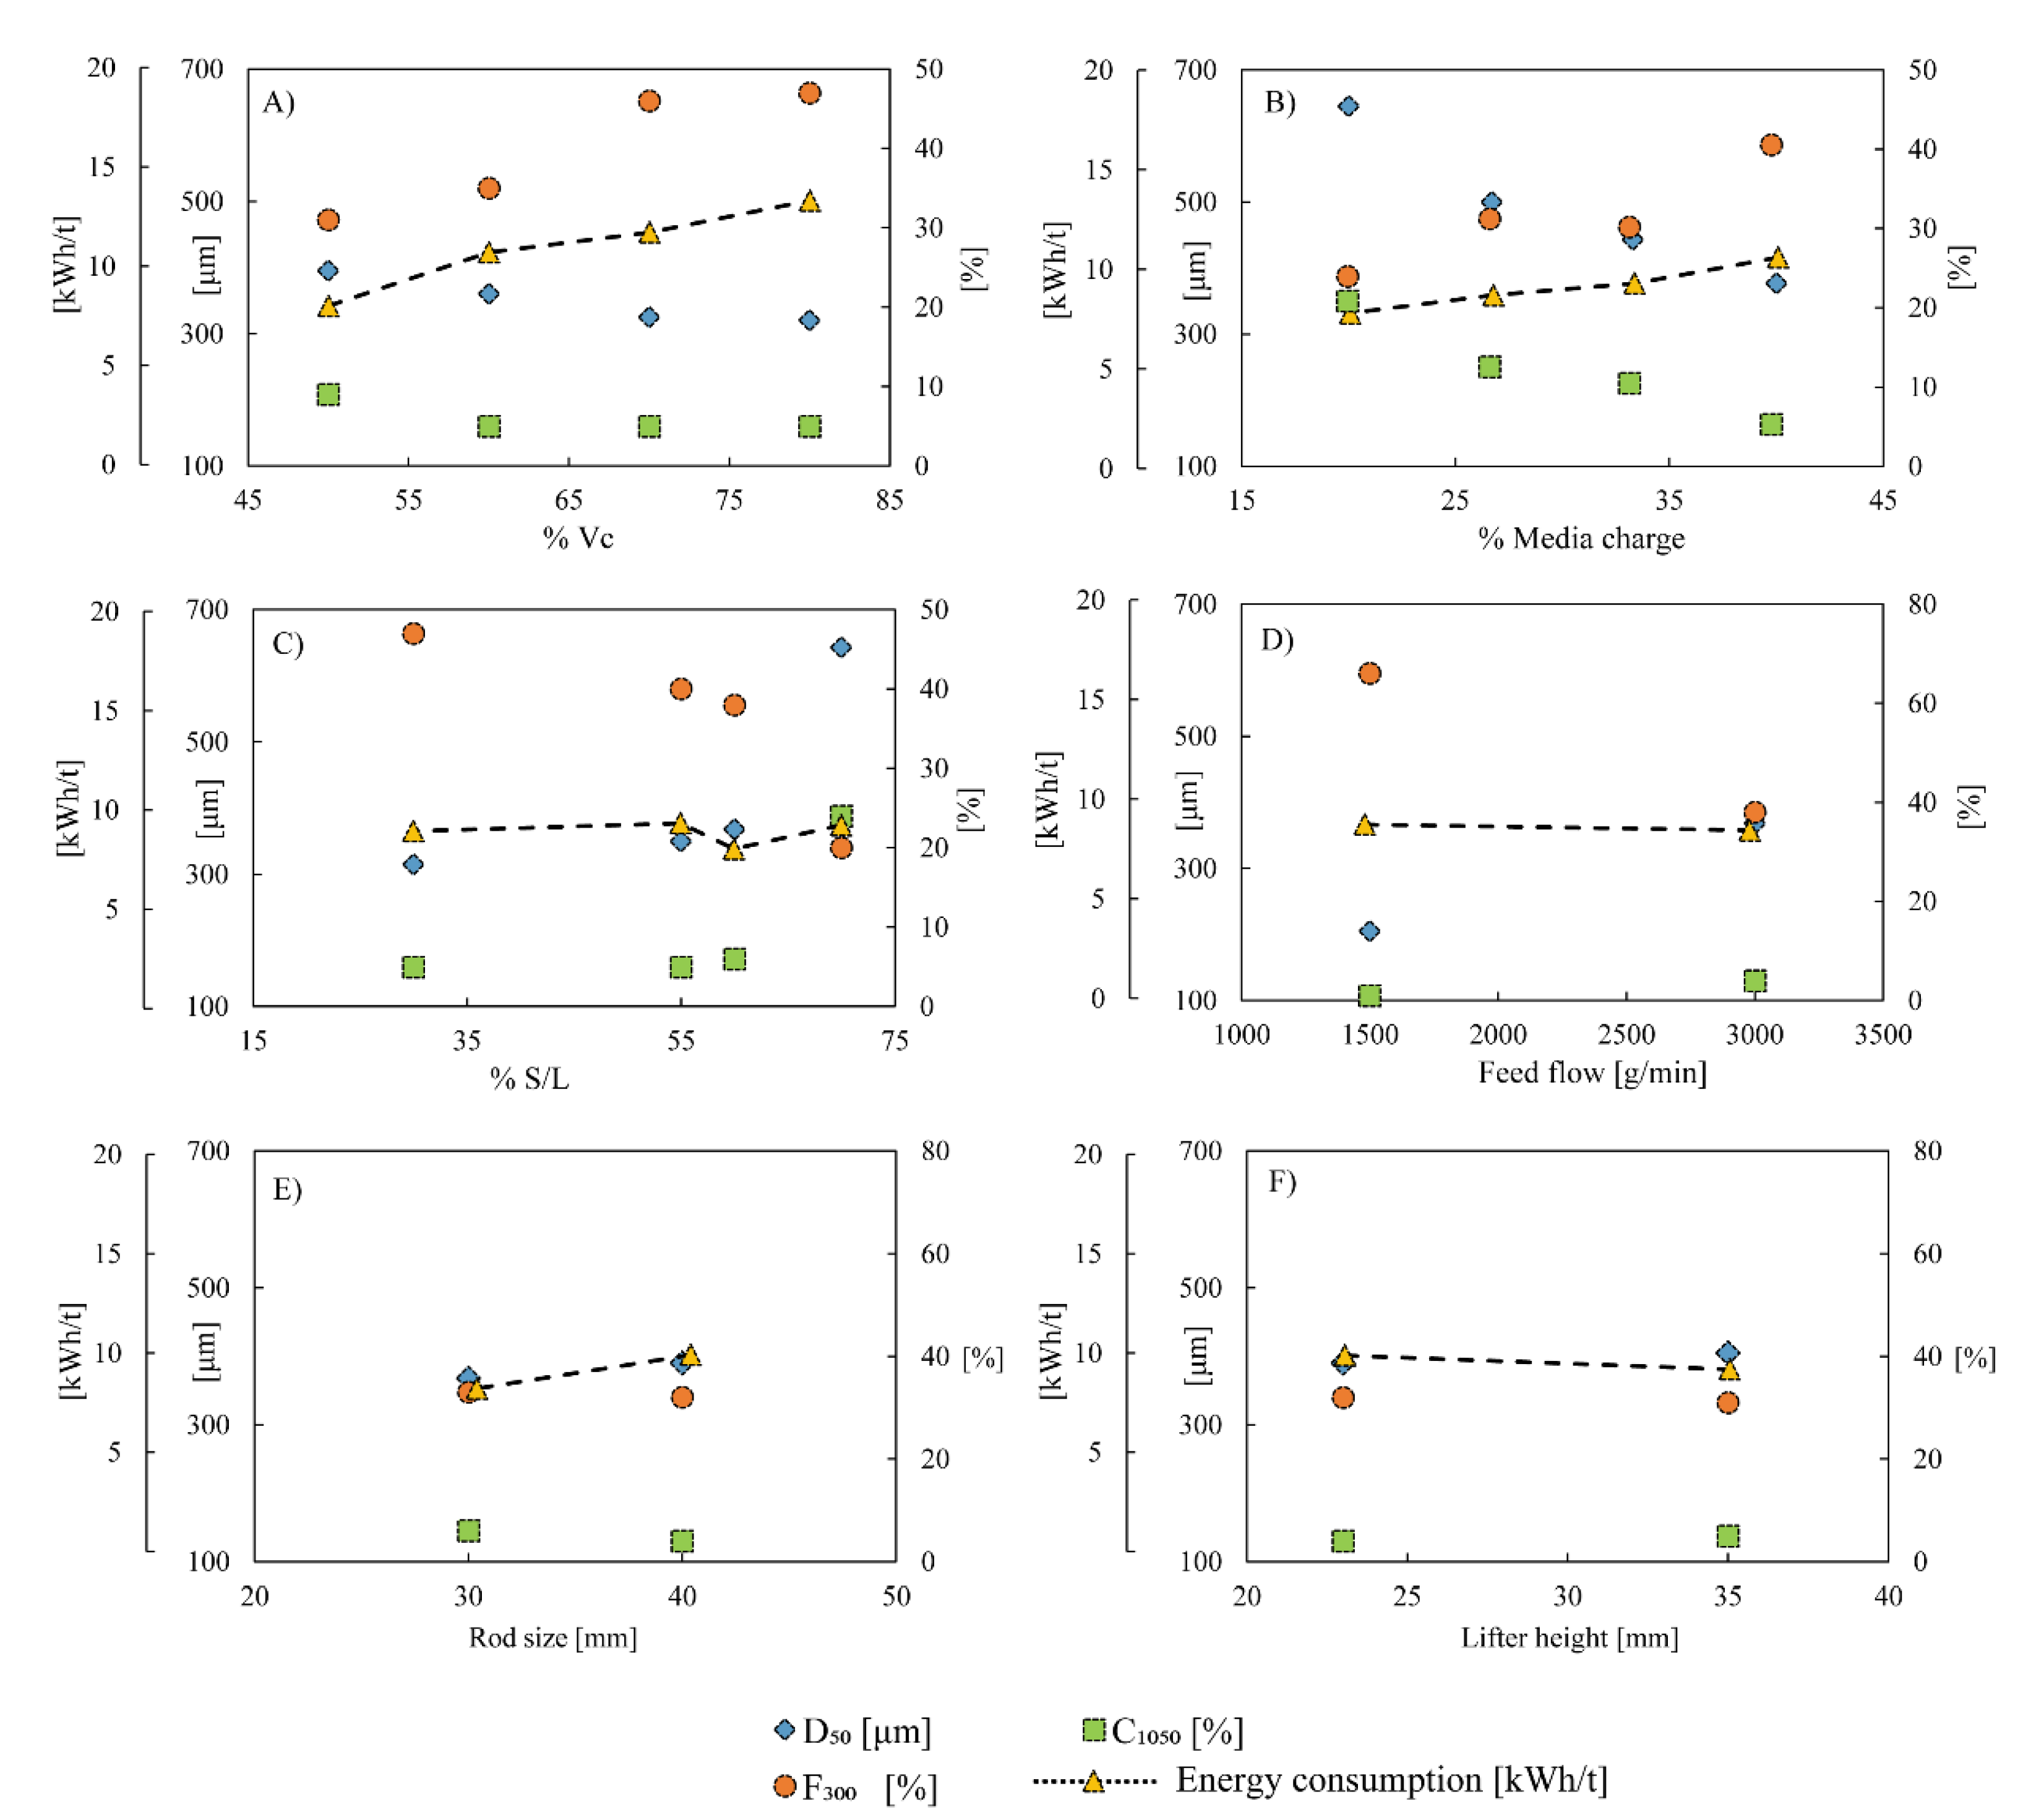
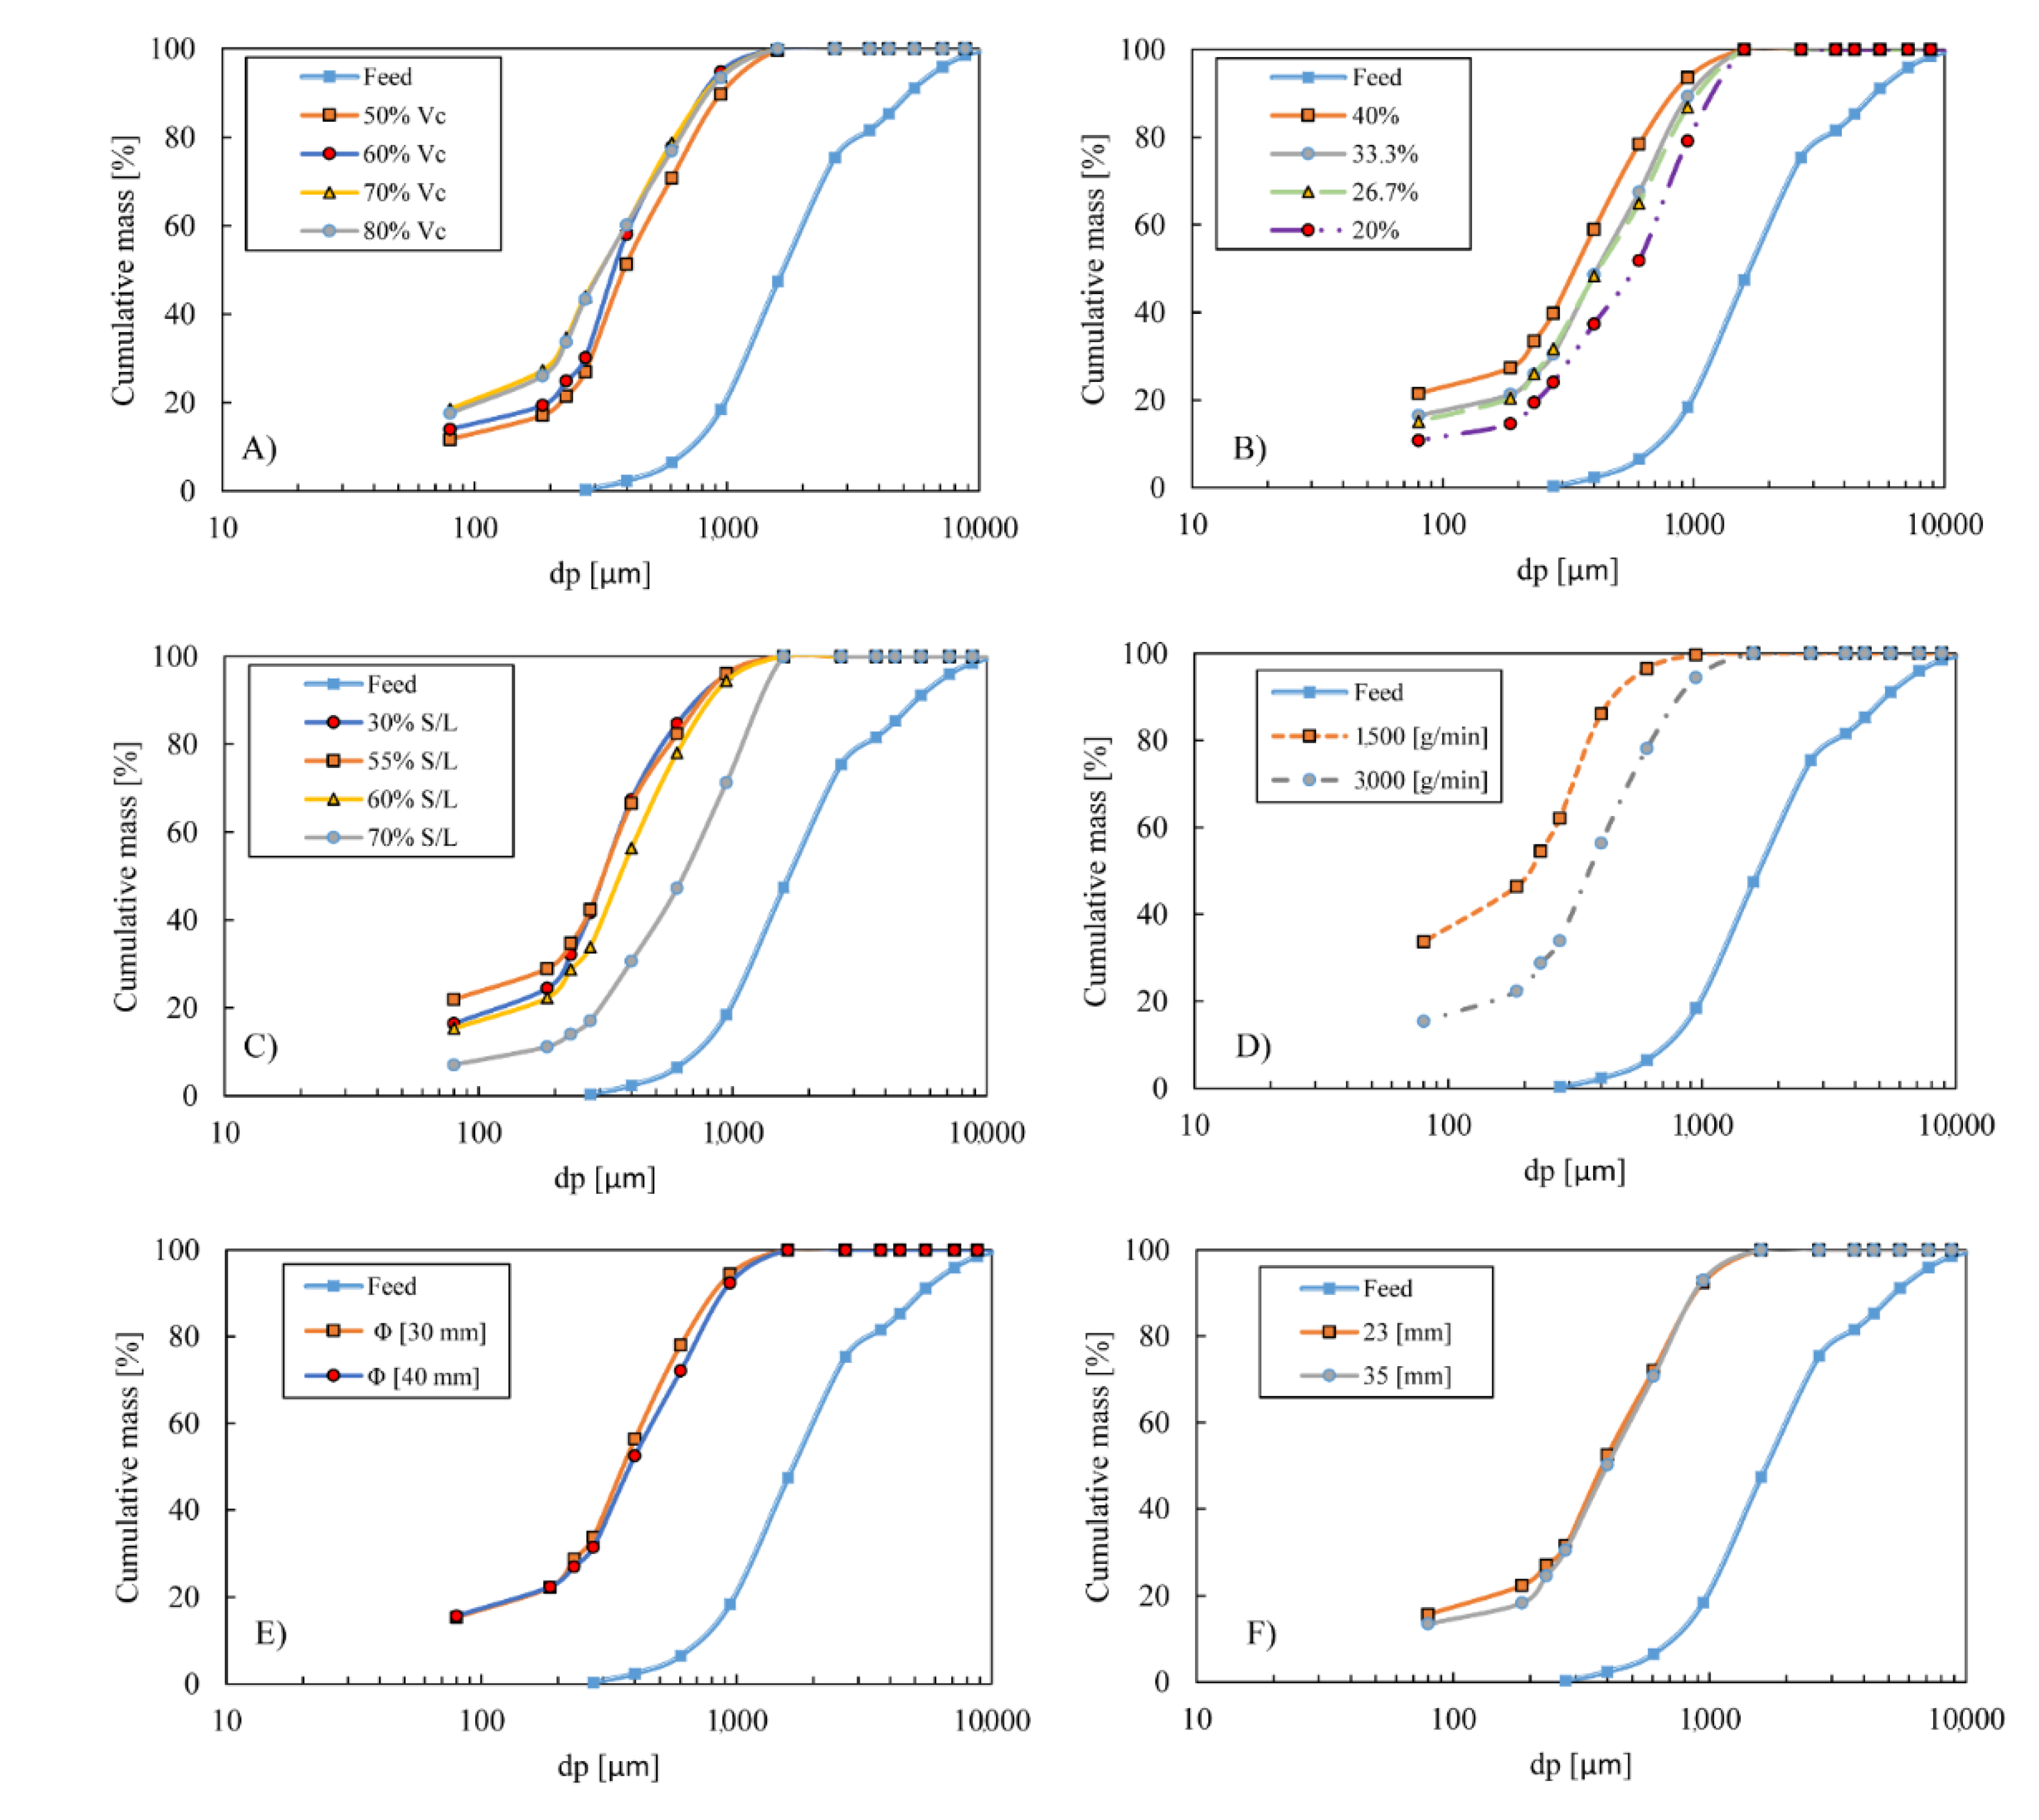
3.1. Particle Size Distribution and Energy Consumption Determination

Brine presents salt saturation values from 33% to 37%, with a 1.6% standard deviation (Figure 5A). The average 36% value was used for PSD determination using brine. As has been explained, the first four experimental sessions were performed to calibrate the model and to evaluate the correct operation of the rod mill with potash ore. Each batch of experiments was carried out under the same operating conditions, except slurry density, which was varied from 50% to 65%. The measured flows were similar to the expected ones, showing a decrease in slurry flow and the water flow and an increase in the solid/water rate. The solid mass flow was strategically kept constant to check the consistency of the experiment, demonstrated by the parallelism of the curves when the flows were changed (Figure 5B).
The PSD results of all tests related to the product control study (from Table 4) are shown in Figure 6. In line with the purposes of this study, the percentage of the critical rotational speed between 50% and 60% generates less fine particle generation. In the range of 70–80% of this operating condition, a coarser generation is equally reached (Figure 6A). A large variability is observed when the media charge is varied (Figure 6B). This behavior could be related to the impact energy on the particles [2], and is precisely the main factor that affects milling performance, showing less coarse particle generation when the media charge is about 20%. These differences were not observed with small variations in rod media charge (Figure 6B, curves with 33.3% and 26.7%), and could only be affected after a long residence time [31]. On the other hand, when the solid/liquid ratio of slurry density is increased to 70%, there is a large gap between the remaining ratios, producing fewer coarse particles (Figure 6C). This behavior is also observed, in accordance with [43,44], when the solid/liquid ratio of slurry density is maintained but solid mass flow is increased, with notable differences between these two product curves [2] (Figure 6D). When some design features of the mill are changed, such as rod diameter (Figure 6E) and lifter height (Figure 6F), there are no noticeable differences between their PSD product curves. Probably, the sizes of the lifters are not sufficient to make noticeable differences between the movement caused by this factor [23].
On this basis, the characterization parameters for this study are presented in Table 5 and shown graphically in Figure 7, compared to the energy consumption for each variation run in the experiments. In the first five experiments, media charge (40%), solid/water rate (60%), solid flow rate (3000 gr/min), rod dimensions (30 mm), and lifter height (23 mm) were kept constant while varying the mill rotational speed. The energy consumption is quite evident when the Vc percentage is increased, and generates a high F300 percentage, reaching undesirable values above 30% in all cases, being critical when the Vc is above 70%, with about 45% of the particle population below 300 μm arising. On the other hand, when the energy consumption is lower, the C1050 parameters become poor, resulting in an insufficient amount of ore being liberated, which is detrimental in terms of material recirculated to the mill (Figure 7A).
The same behavior is observed when the media charge is changed. A lower percentage in this respect results in lower energy consumption and a lower F300 parameter, but the C1050 is still high (Figure 7B). All these observations agree with [45], which presents an energy model based on the grinding media charge and rotational speed of a mill, also affecting mill power draft [1].
As partially explained in [46], a particular case occurs when the solid/water rate of slurry density is varied (Figure 7C). No major variation in energy consumption is observed. However, the differences between F300 and C1050 are striking. The objectives are to reduce both values, which is not achieved simultaneously when this variation is applied: The F300 reaches the 20% target, but the C1050 is 15% above the expected value, while in all the other cases, the opposite is the case.
Two broad ranges of feed flow were selected to demonstrate changes in the key parameters studied (Figure 7D). Energy consumption varied slightly from 8.8 to 9.1 kWh/t, but the main impact of this assessment lies in the C1050 parameter, reaching about 1%, at the cost of excess grinding, demonstrated by lower D50 and F300 values.
Although [2] suggests that there should be an increase in energy consumption when rod sizes are varied, in this work, and according to [11], no significant variation in energy consumption or parameters studied was observed when rod sizes and lifter height were modified (Figure 7E,F). Perhaps a suitable recommendation in this respect would be to use a combination of a higher lifter and smaller rod diameter: it could mean obtaining a similar particle size product with reduced energy consumption, as described in [24,26].

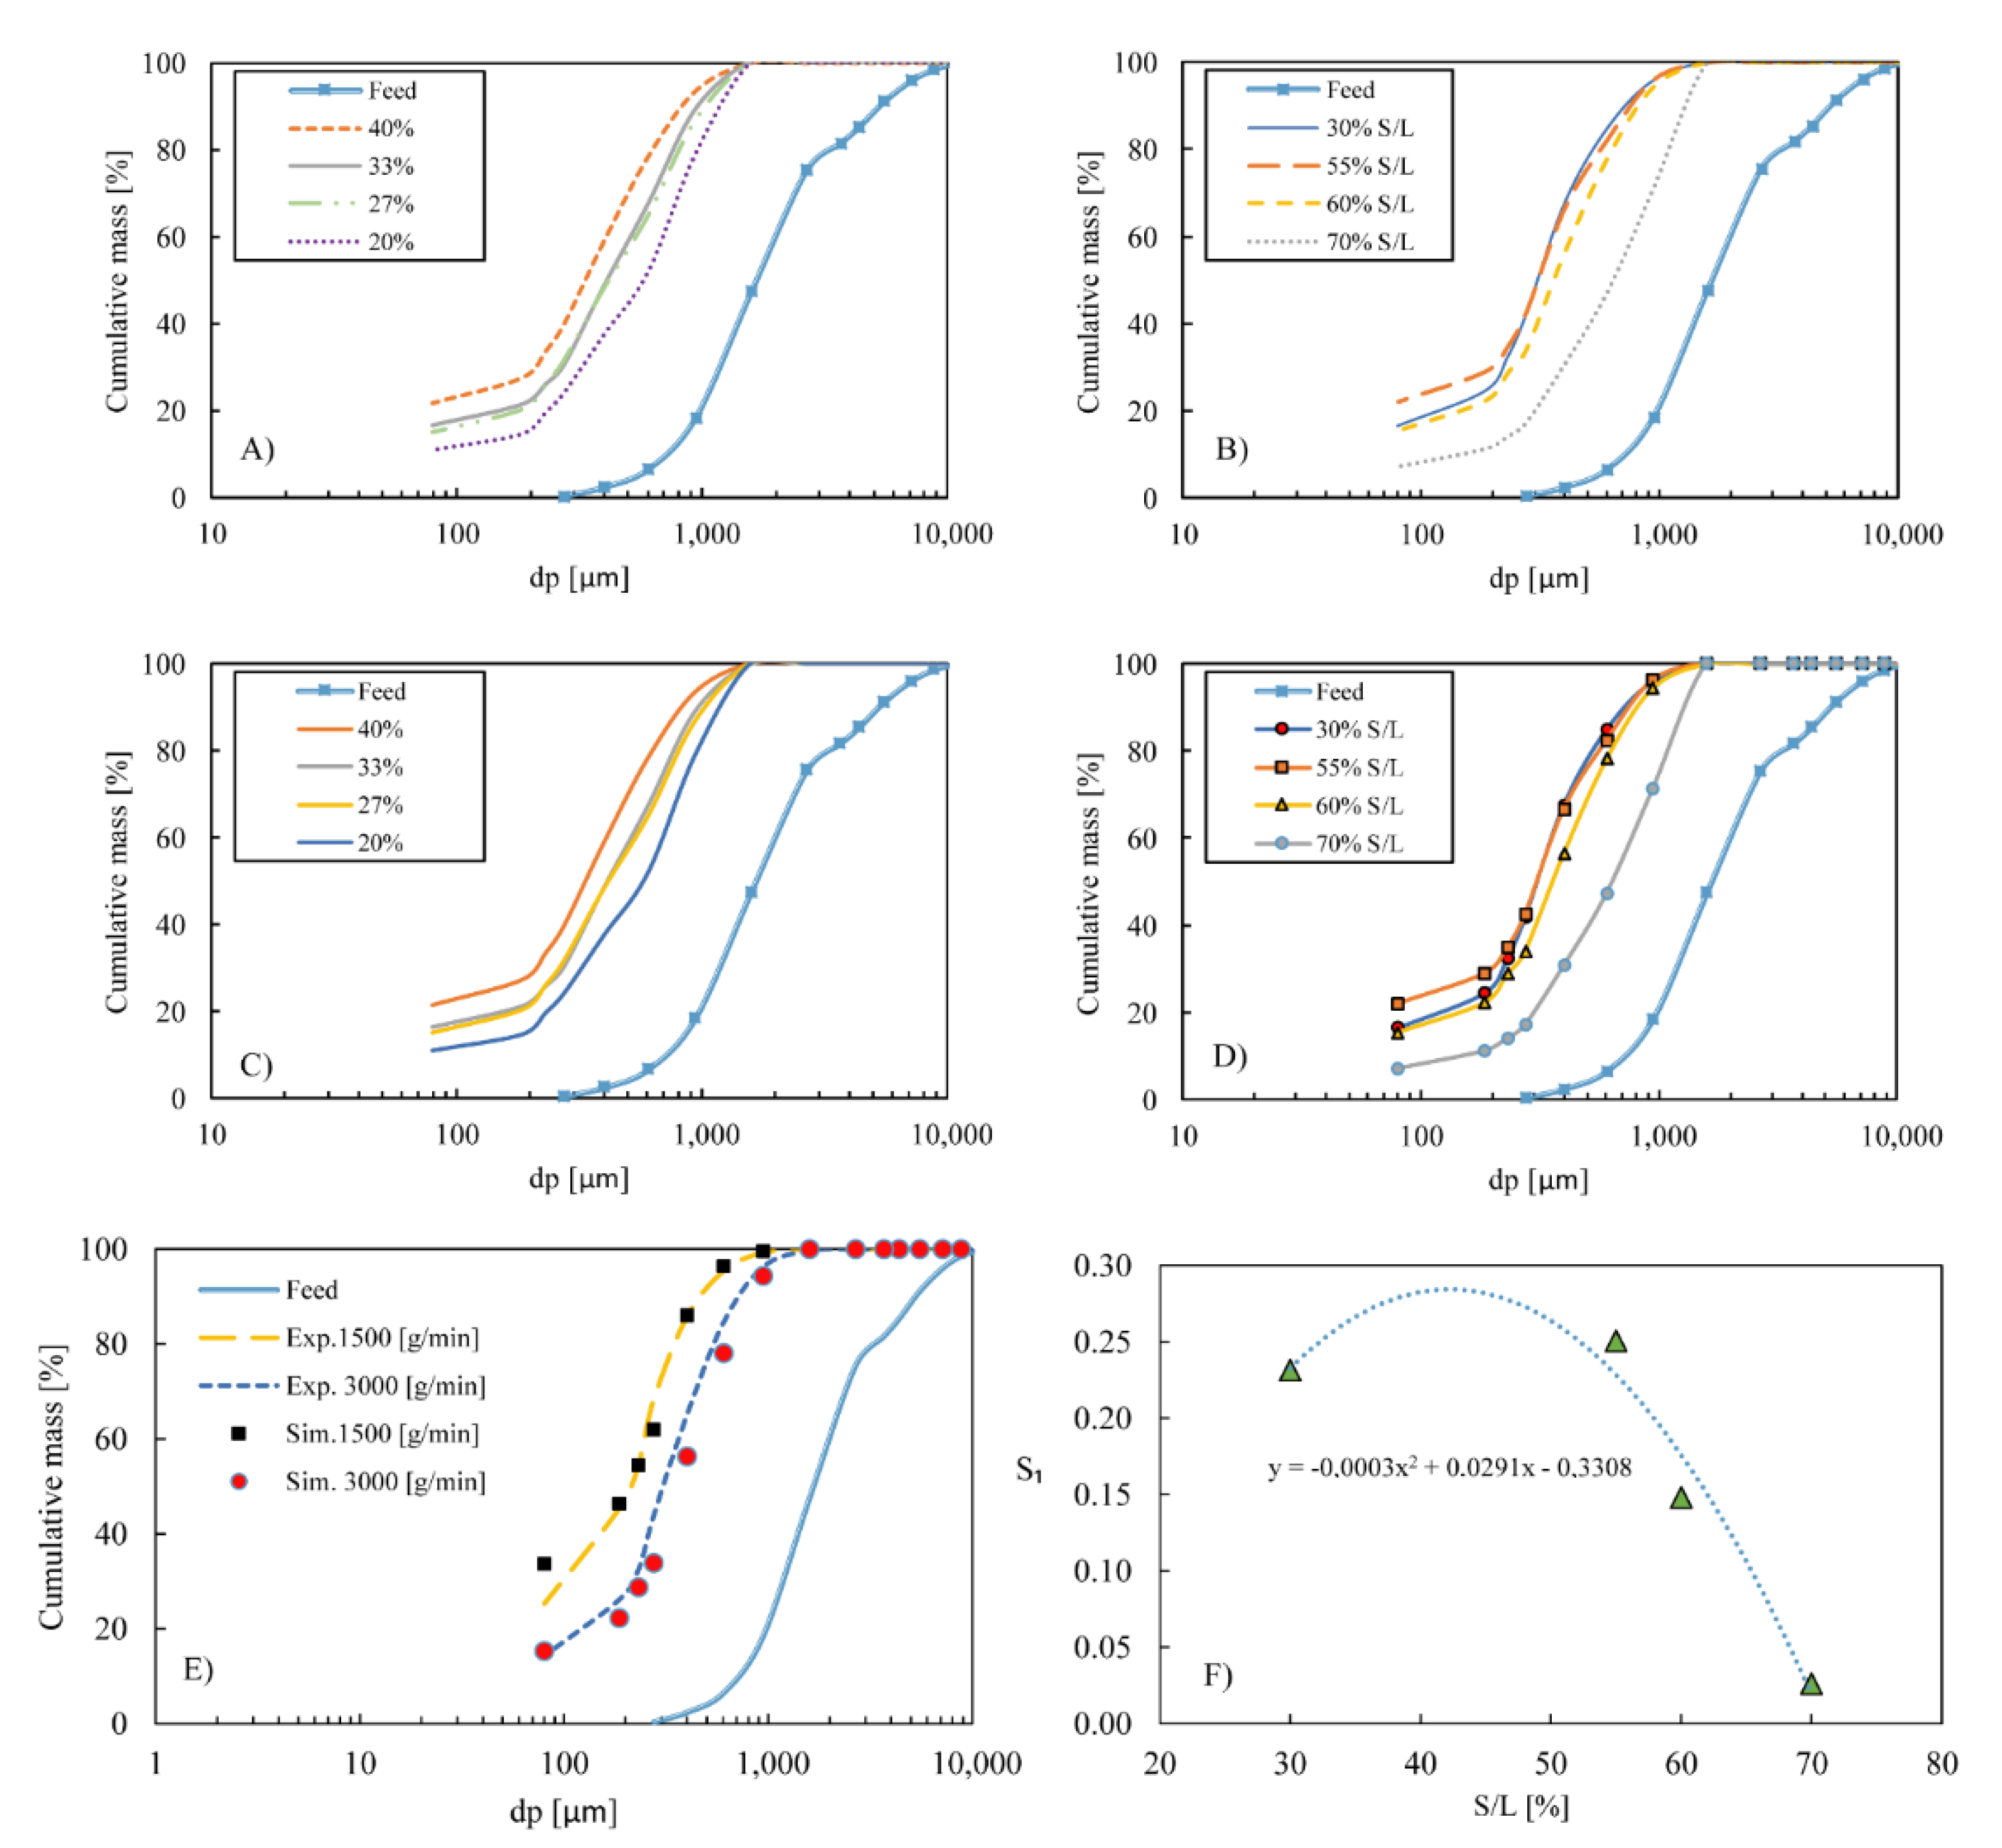
3.2. Numerical Simulation

The model simulates the PSD of the product when processed in a rod tumbling mill. To do this, it is necessary to find the model’s parameters. The first experimental sessions were designed to obtain these parameters, using MATLAB script back-calculation techniques (Table 6). The K parameter of the breakage function (Equation (2)) should range between 0 and 1, which is consistent with the results obtained in this study. Reference [39] has determined some relationships of the parameter k with mineral composition and the tendency of the material to generate finer or coarser particles. A 0.5 k value indicates that the material itself tends to be neutral in this respect, and the generation of fines will be due more to an operational component than reasons of mineralogical composition. n1 normally ranges between 0 and 1.5, but it must necessarily be below the value n2, which is achieved in this case, reaching average values of 1 and 1.5, respectively. The resulting specific kinetic values vary depending on milling dynamics, and are presented in Figure 8F. The constants ω1, β1, ω2, and β2 are useful for calculating the probability that the particles are under the milling mechanical action, or to be classified by the drag effect of water.
With the back-calculated parameters, predictive simulations were run. The best view of the robustness of the model can be seen in Figure 8E. When the tumbling mill is operated at different solid feed rates, two differentiated curves are plotted against the same simulated tests. The dotted lines almost overlap the points, showing great compatibility. However, the key point is to verify the performance of the model when varying a wide range of inputs. This is the case for the same experiments that change the percentage of rod media charge. For better representation, the experimental values are presented in Figure 8A and the simulated values under the same graph (Figure 8C). Three zones are observed in these tests: the first, when the media charge is 40% of the mill; the second, with two undifferentiated curves when the tests were carried out with 33% and 27% of the rod media charge; the third, a test with 20% of the grinding media charge. The mathematical approach makes a good simulation of this phenomenon. The displacement observed in curve of the product PSD (only predicted) is remarkable, especially with those 20% and 40% grinding media variation.
The same simulation patterns occur when solid/liquid ratio tests are plotted and compared to experimental values (Figure 8B,D). The kinetic constant S1 represents the dynamics under a specific condition. It can be seen how it is inversely proportional to the slurry solid/liquid ratio (Figure 8F), as it affects the simulation of product particles, shown by the displacement of the product curves in Figure 8B. The breakage kinetics were clearly affected by slurry density [17].
From Figure 6 and Table 6 data, the control parameters can be extracted and analyzed. For a comparison of the model simulation with the experimental data, see Table 7. Good model performance is observed, as there is less than 5% RMSE in the determination of the F300 overgrinding and less than 2% in the parameters of the coarsest generation C1050, and the differences in the D50 values reach 26.6 μm RMSE (Table 7).

4. Discussion

To assess which operating conditions could meet the objective of reducing energy consumption, a graph showing the relative reduction ratio for all cases studied is presented in Figure 9A. As shown in this figure, the rotational speed of the mill has a major influence, with nearly 40% of energy saving when this operating condition is varied, from 13.3 kWh/t to 8 kWh/t, while the rotational speed is reduced from 80% to 50% of the Vc (Table 5). The same pattern is observed when the media charge is varied, from 10.6 kWh/t to 7.8 kWh/t, which is a 25% reduction in energy, followed with less intensity by rod size, slurry density (solid/liquid ratio), lifter height, and feed flow (all of them with less than 15% energy reduction).
On the other hand, slurry density is the best operating condition for controlling particle size distribution, observed in the finer generation control by means of the 60% reduction for the F300 parameter (Figure 9B), from 47% to 20% (Table 5), but with a relatively low 10% energy reduction ratio (Figure 9A). After that, at the same level, feed flow, media charge, and critical rotation speed have an important impact on this issue, with reduction in F300 parameters, from 35% to 45%.
However, the target values are not simultaneously accomplished in any of them. To evaluate which variations are the most effective in rod milling, the lowest energy consumption of each experiment has been illustrated in Figure 9C. By prioritizing the level of overgrinding above the other parameters, the experiment with the lowest percentage of media charge (20% of rod media) coincides with the lowest energy consumption (7.8 kWh/t) and achieves the goal of having just over 24% of F300, the parameter related to finer particle generation. What is also noteworthy is the D50 value (with 20% media charge) being close to 650 μm, far exceeding the 600 μm limit that is considered a well-controlled milling product for this particular material. The fact that in this experiment, the C1050 value was above the target of this study, recommended to be less than 5%, with recirculation to the mill at around 20% of the mass, is not considered a negative option, as recirculation is a common action in ore processing. Considering that the ground material cannot be reprocessed, while coarser particles and overgrinding can be controlled in subsequent recirculation, this case does not represent a crucial problem in this process control study, as the main objective, which is to reduce energy consumption costs, is achieved.
Another interesting situation occurred in the experiment using 70% of the solid/water ratio (Table 5). It shows an improvement of the target in almost all cases, reaching 643 μm at the D50 value, and 20% at F300, the only failure being at 24% in the C1050 parameter. The energy consumption result is not the lowest in this study.
From an economic point of view, the reduction in energy consumption translates directly into savings for the processing plant. For example, if we start from an initial configuration of 40% grinding load, reducing the energy consumption found in this study could translate to a 26.8% decrease in the electricity bill of a single mill, which would be an unprecedented milestone in the field of mineral processing (Table 8).
With all these bases, the main recommendations to control rod milling may be varied depending on a company’s priorities: If energy consumption needs to be reduced to a minimum, the mill speed should be reduced; do not overgrind, and increase the pulp density. If you need to reduce the amount of particles below 300 microns and reduce energy consumption, but not necessarily to a minimum, reduce the percentage of grinding media. However, any planned variations could lead to at least 10% of the energy consumed, which could mean remarkable savings for the processing plant.
For a hypothetical situation where a maximum grinding ratio is needed, i.e., to obtain as many fines as possible, the flow rate should be reduced, or the pulp density should be decreased.

5. Conclusions

It is important to mention the uniqueness of this study, which has tried to control the size reduction of the material, not in terms of obtaining the highest degree of comminution, but to avoid excess fines, and at the same time to observe what action can affect the reduction of energy consumption. In this respect, there are many ways to control the generation of particle size distribution in rod milling, all depending on company requirements or ore processing needs. The conclusions drawn from this work can be summarized as follows
-
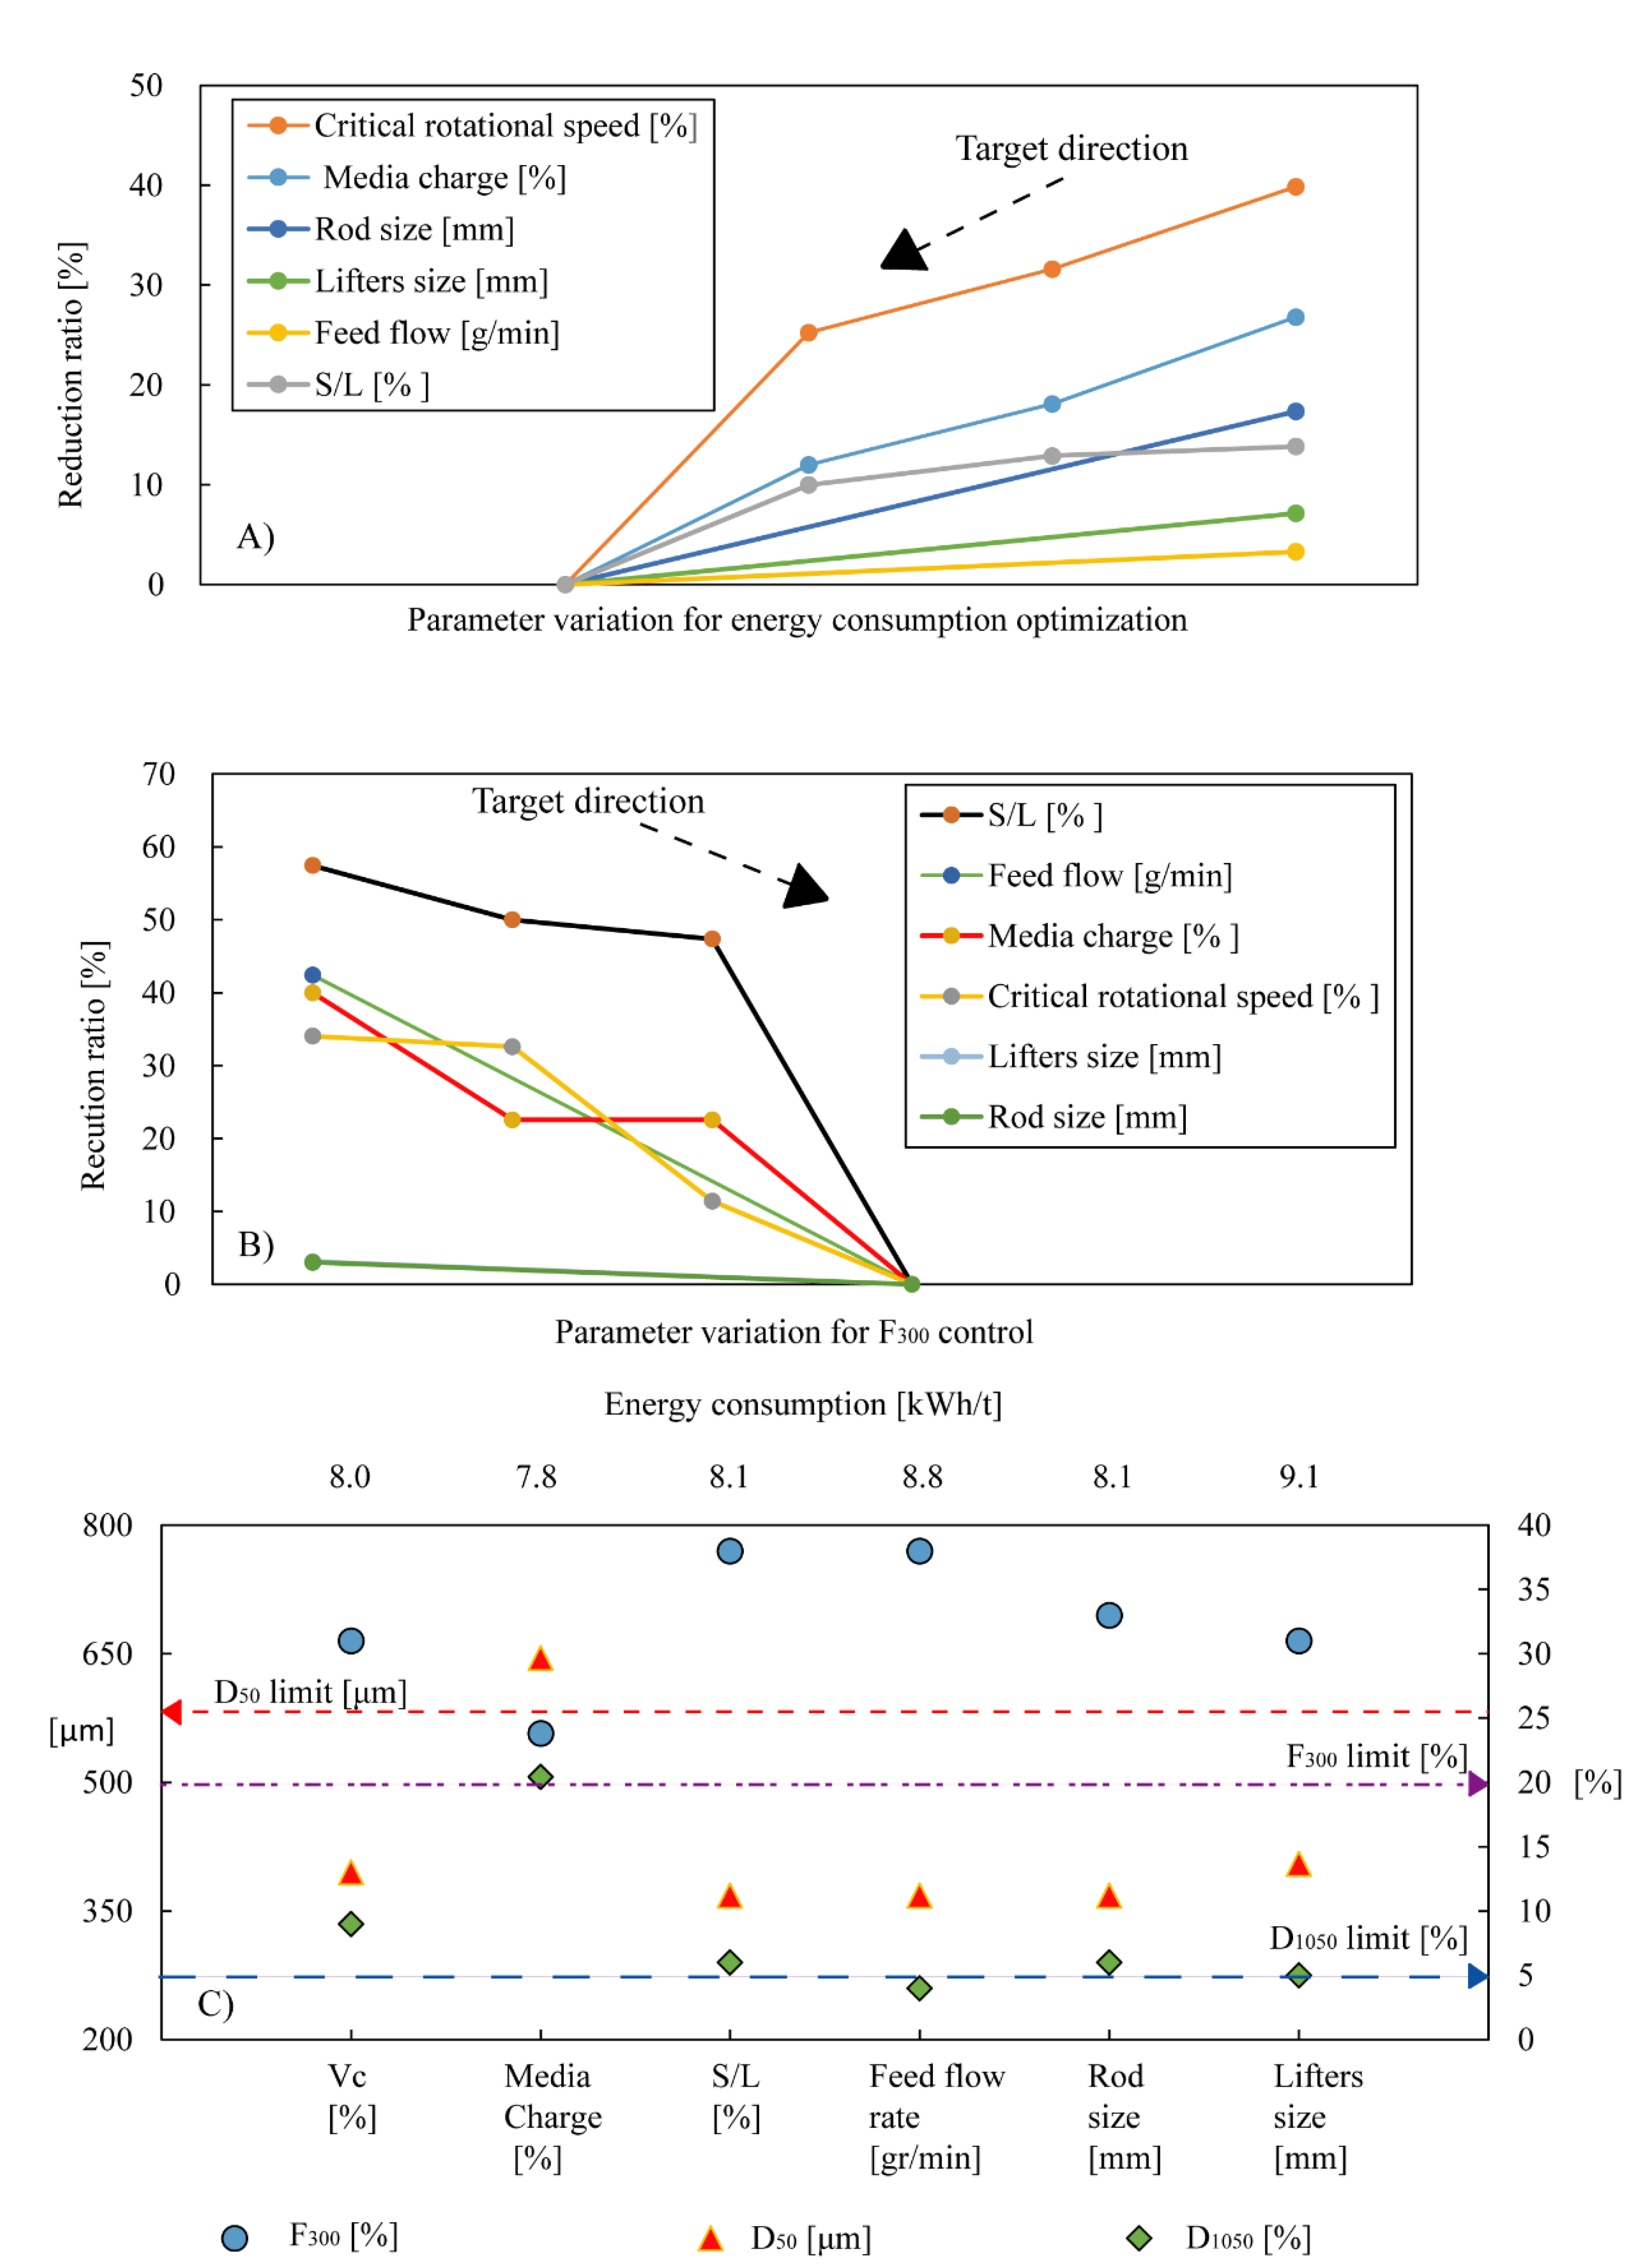
It was shown that by varying the percentage of critical mill speed or grinding media charge, the impact on reducing energy consumption becomes noticeable.
-
This work will take on more significance when it is necessary to reach mineral liberation while preventing overgrinding phenomena. In this sense, varying the solid/water ratio may well control excessive fine particle generation. Without being the best action to reduce energy consumption, some improvement in this respect can be observed.
-
It was also demonstrated how it is possible to control the particle size of the product by varying the feed rate, and lifter and rod geometry, while keeping energy utilization constant. By applying one or a combination of these criteria, it is possible to achieve both objectives, to control grinding without excessive energy consumption.
-
In the overall process, considering comminution as the most expensive module, an improvement in energy consumption efficiency could lead to subsequent savings for companies. A 20% reduction in media charge could lead to a 12% reduction in energy bill, which would be a remarkable milestone. Modeling and prediction approaches can also be used to manage production and energy issues, as simulation could express the product size, considering the parameters that affect the milling process.
However, as this is a particular material, it is not possible to generalize or extrapolate to all types of rod milling. However, patterns can be observed that have been demonstrated in previous studies; therefore, this work represents a guide to the different possibilities for controlling grinding in this type of machinery.

Author Contributions

Conceptualization, H.A. and J.M.d.L.-R.; methodology, C.H.S. and H.A.; formal analysis, R.P.-Á.; investigation, J.O. and H.A.; resources, J.O.; data curation, E.G. and R.P.-Á.; writing—original draft preparation, H.A. and E.G.; writing—review and editing, C.H.S. and H.A.; supervision, J.O. and J.M.d.L.-R. All authors have read and agreed to the published version of the manuscript.

Funding

This research received no external funding.

Data Availability Statement

Not applicable.

Conflicts of Interest

The authors declare no conflict of interest.

References

  1. Gupta, A.; Yan, D. Mineral Processing Design and Operation; Elsevier: Amsterdam, The Netherlands, 2006. [Google Scholar]
  2. Zeng, Y.; Forssberg, E. Effects of mill feed on product fineness and energy consumption in coarse grinding. Miner. Eng. 1992, 4, 599–609. [Google Scholar] [CrossRef]
  3. Shoji, K.; Austin, L.G. A model for batch rod milling. Powder Technol. 1974, 10, 29–35. [Google Scholar] [CrossRef]
  4. Gaudin, A.M.; Schuhmann, R.; Schlechten, A.W. Flotation Kinetics. II. The Effect of Size on the Behavior of Galena Particles. J. Phys. Chem. 1942, 46, 902–910. [Google Scholar] [CrossRef]
  5. Crawford, R.; Ralston, J. The influence of particle size and contact angle in mineral flotation. Int. J. Miner. Process. 1987, 23, 1–24. [Google Scholar] [CrossRef]
  6. Derjaguin, B.V.; Dukhin, S. Theory of flotation of small and medium-size particles. Prog. Surf. Sci. 1993, 43, 241–266. [Google Scholar] [CrossRef]
  7. Bruckard, W.J.; Sparrow, G.J.; Woodcock, J.T. A review of the effects of the grinding environment on the flotation of copper sulphides. Int. J. Miner. Process. 2011, 100, 1–13. [Google Scholar] [CrossRef]
  8. Jeswiet, J.; Szekeres, A. Energy consumption in mining comminution. Procedia CIRP 2016, 48, 140–145. [Google Scholar] [CrossRef] [Green Version]
  9. Musa, F.; Morrison, R. A more sustainable approach to assessing comminution efficiency. Miner. Eng. 2009, 22, 593–601. [Google Scholar] [CrossRef]
  10. Heyes, G.W.; Kelsall, D.F.; Stewart, P.S.B. Continuous grinding in a small wet rod mil; Part I, comparison with a small ball mil. Powder Technol. 1972, 7, 235–319. [Google Scholar] [CrossRef]
  11. Li, Z.; Fu, Y.; Yang, C.; Yu, W.; Liu, L.; Qu, J.; Zhao, W. Mineral liberation analysis on coal component separated using typical comminution methods. Miner. Eng. 2018, 126, 74–81. [Google Scholar] [CrossRef]
  12. Devaswithin, A.; Pitchumani, B.; De Silva, S.R. Modified back-calculation method to predict particle size distribution for batch grinding in a ball mill. Ind. Eng. Chem. Res. 1988, 27, 723–726. [Google Scholar] [CrossRef]
  13. Austin, L.G.; Luckie, P.T. Methods of Determination of Breakage Distribution Parameters. Powder Technol. 1972, 5, 215–222. [Google Scholar] [CrossRef]
  14. Austin, L.G.; Shoji, K.; Bhatia, V.; Jindal, V.; Savage, K. Some Results on the Description of Size Reduction as a Rate Process in Various Mills. Ind. Eng. Chem. Process Des. Dev. 1976, 15, 187–196. [Google Scholar] [CrossRef]
  15. Lee, H.; Klima, M.S.; Saylor, P. Evaluation of a laboratory rod mill when grinding bituminous coal. Fuel 2012, 92, 116–121. [Google Scholar] [CrossRef]
  16. Hoşten, Ç.; Özbay, C. Technical note: A comparison of particle bed breakage and rod mill grinding with regard to mineral liberation and particle shape effects. Miner. Eng. 1998, 11, 871–874. [Google Scholar] [CrossRef]
  17. Wills, B.A. Mineral Processing Technology; Butterworth-Heineman: Oxford, UK, 1997. [Google Scholar]
  18. Soleymani, M.M.; Fooladi Mahani, M.; Rezaeizadeh, M. Experimental study the impact forces of tumbling mills. J. Process Mech. Eng. 2015, 231, 283–293. [Google Scholar] [CrossRef]
  19. Guasch, E.; Anticoi, H.; Hamid, S.A.; Oliva, J.; Alfonso, P.; Escobet, T.; Sanmiquel, L.; Bascompta, M. New approach to ball mill modelling as a piston flow process. Miner. Eng. 2018, 116, 82–87. [Google Scholar] [CrossRef]
  20. Usman, H.; Taylor, P.; Spiller, D.E. The Effects of Lifter Configurations and Mill Speeds on the Mill Power Draw and Performance. AIP Conf. Proc. 2017, 1805, 050001. [Google Scholar]
  21. Gupta, V.K.; Zouit, H.; Hodouin, D. The effect of ball and mill diameters on grinding rate parameters in dry grinding operation. Powder Technol. 1985, 42, 199–208. [Google Scholar] [CrossRef]
  22. Hasegawa, M.; Honma, T.; Kanda, Y. Effect of mil diameter on the rate of initial grinding in vibration balls mills. Powder Technol. 1990, 60, 259–264. [Google Scholar] [CrossRef]
  23. Powell, M.S. The effect of liner design on the motion of the outer grinding elements in a rotary mill. Int. J. Miner. Process. 1991, 31, 163–193. [Google Scholar] [CrossRef]
  24. Takalamide, M. Evaluating the Influence of Lifter Face Angle on the Trajectory of Particles in a Tumbling Mill Using PEPT. Master’s Thesis, University of Cape Town, Cape Town, South Africa, 2014. [Google Scholar]
  25. Yin, Z.; Peng, Y.; Zhu, Z.; Yu, Z.; Li, T. Impact Load behavior between Different Charge and Lifter in a Laboratory-Scale Mill. Materials 2017, 10, 882. [Google Scholar] [CrossRef] [PubMed]
  26. Yin, Z.; Peng, Y.; Li, T.; Wu, G. DEM Investigation of Mill Speed and Lifter Face Angle on Charge Behavior in Ball Mills. In Proceedings of the 5th International Conference on Advanced Composite Materials and Manufacturing Engineering, Jinan, China, 16–17 June 2018. [Google Scholar]
  27. Li, Z.; Wang, Y.; Li, K.; Lin, W.; Tong, X. Study on the performance of a ball mill with liner structure based on DEM. J. Eng. Technol. Sci. 2018, 50, 157–178. [Google Scholar] [CrossRef]
  28. Broussaud, A.; Albera, F. Selection of a model for the simulation of a pilot plant rod mill. Autom. Min. Miner. Met. Process. 1986, 20, 193–198. [Google Scholar] [CrossRef]
  29. Annapragada, A.; Adjei, A. Numerical simulation of milling processes as an aid to process design. Int. J. Pharm. 1996, 136, 1–11. [Google Scholar] [CrossRef]
  30. Foszcz, D.; Krawczykowski, D.; Gawenda, T.; Kasinska-Pilut, E.; Pawlos, W. Analysis of process of grinding efficiency in ball and rod mills with various feed parameters. IOP Conf. Ser. Mater. Sci. Eng. 2018, 427, 012031. [Google Scholar] [CrossRef]
  31. Pratseya, A.; Mawadati, A.; Putri, A.; Petrus, H. Study on Sumbawa gold ore liberation using rod mill: Effect of rod-number and rotational speed on particle size distribution. IOP Conf. Ser. Mater. Sci. Eng. 2018, 52, 012024. [Google Scholar]
  32. Góralczyk, M.; Krot, P.; Zimroz, R.; Ogonowski, S. Increasing energy efficiency and productivity of the comminution process in tumbling mills by indirect measurments of internal dynamics-An overview. Energies 2020, 13, 6735. [Google Scholar] [CrossRef]
  33. Mayer-Laigle, C.; Rajaonarivony, R.K.; Blanc, N.; Rouau, X. Comminution of dry lignocellulosic biomass: Part II. Technologies, improvement of milling performances and security issues. Bioengineering 2018, 5, 50. [Google Scholar] [CrossRef] [Green Version]
  34. Lau, L.; Fan, J. Laundry performance of fabric garments. Eng. Appar. Fabr. Garments 2009, 1, 339–360. [Google Scholar]
  35. ASTM International. Standard Specification for Woven Wire Test Sieve Cloth and Test Sieves; ASTM: West Conshohocken, PA, USA, 2020; pp. E11–E20. [Google Scholar]
  36. Austin, L.G.; Menacho, J.M.; Pearcy, F. A general model for semi-autogeneous and autogenous milling. APCON. In Proceedings of the Twentieth International Symposium on the Application of Computers and Mathematics in the Mineral Industries, Metallurgy, SAIMM, Johannesburg, South Africa, 19–23 October 1987; Volume 2, pp. 107–126. [Google Scholar]
  37. Whiten, W.J.; Walter, G.W.; White, M.E. A breakage function suitable for crusher models. In Proceedings of the 4th Tewkesbury Symposium, Melbourne, Australia, 12–14 February 1979; pp. 19.1–19.3. [Google Scholar]
  38. Kelly, E.G.; Spottiswood, D.J. The breakage function; what is it really? Miner. Eng. 1990, 3, 405–414. [Google Scholar] [CrossRef]
  39. Anticoi, H.; Guasch EHamid, S.; Oliva JAlfonso, P.; Garcia-Valles, M.; Escobet, T.; Sanmiquel, L.; Bascompta, M.; De Felipe, J.J.; Parcerisa, D.; Peña, E. Breakage function for HPGR: Mineral and mechanical characterization of tantalum and tungsten ores. Minerals 2018, 8, 170. [Google Scholar] [CrossRef] [Green Version]
  40. King, R.P. Modeling and Simulation of Mineral Processing Systems; Elsevier: Amsterdam, The Netherlands, 2001; ISBN 978-0-08-051184-9. [Google Scholar]
  41. Reid, K.J. A solution to the batch grinding equation. Chem. Eng. Sci. 1965, 20, 953–963. [Google Scholar] [CrossRef]
  42. Roy, K.; Das, R.N.; Ambure, P.; Aher, R. Be aware of error measures. Further studies on validation of predictive QSAR models. Chem. Intell. Lab. Syst. 2016, 152, 18–33. [Google Scholar] [CrossRef]
  43. Rogovin, Z.; Casali, A.; Herbst, A. Tracer study of mass transport and grinding in a rod mill. Int. J. Miner. Process. 1988, 22, 149–167. [Google Scholar] [CrossRef]
  44. Ghassa, S.; Gharabaghi, M.; Azadmehr, A.R.; Nasrabadi, M. Effects of Flow rate, slurry solid content, and feed size distribution on rod mill efficiency. Part. Sci. Technol. 2016, 34, 533–539. [Google Scholar] [CrossRef]
  45. Minin, I.; Dedyalkov, P.; Savov, S. Research of the charge load influence over the tumbling mill characteristics through general utility function. J. Chem. Metall. 2021, 56, 819–826. [Google Scholar]
  46. Bazin, C.; Obiang, P. Should the slurry density in a grinding mill be adjusted as a function of grinding media size. Miner. Eng. 2007, 20, 810–815. [Google Scholar] [CrossRef]
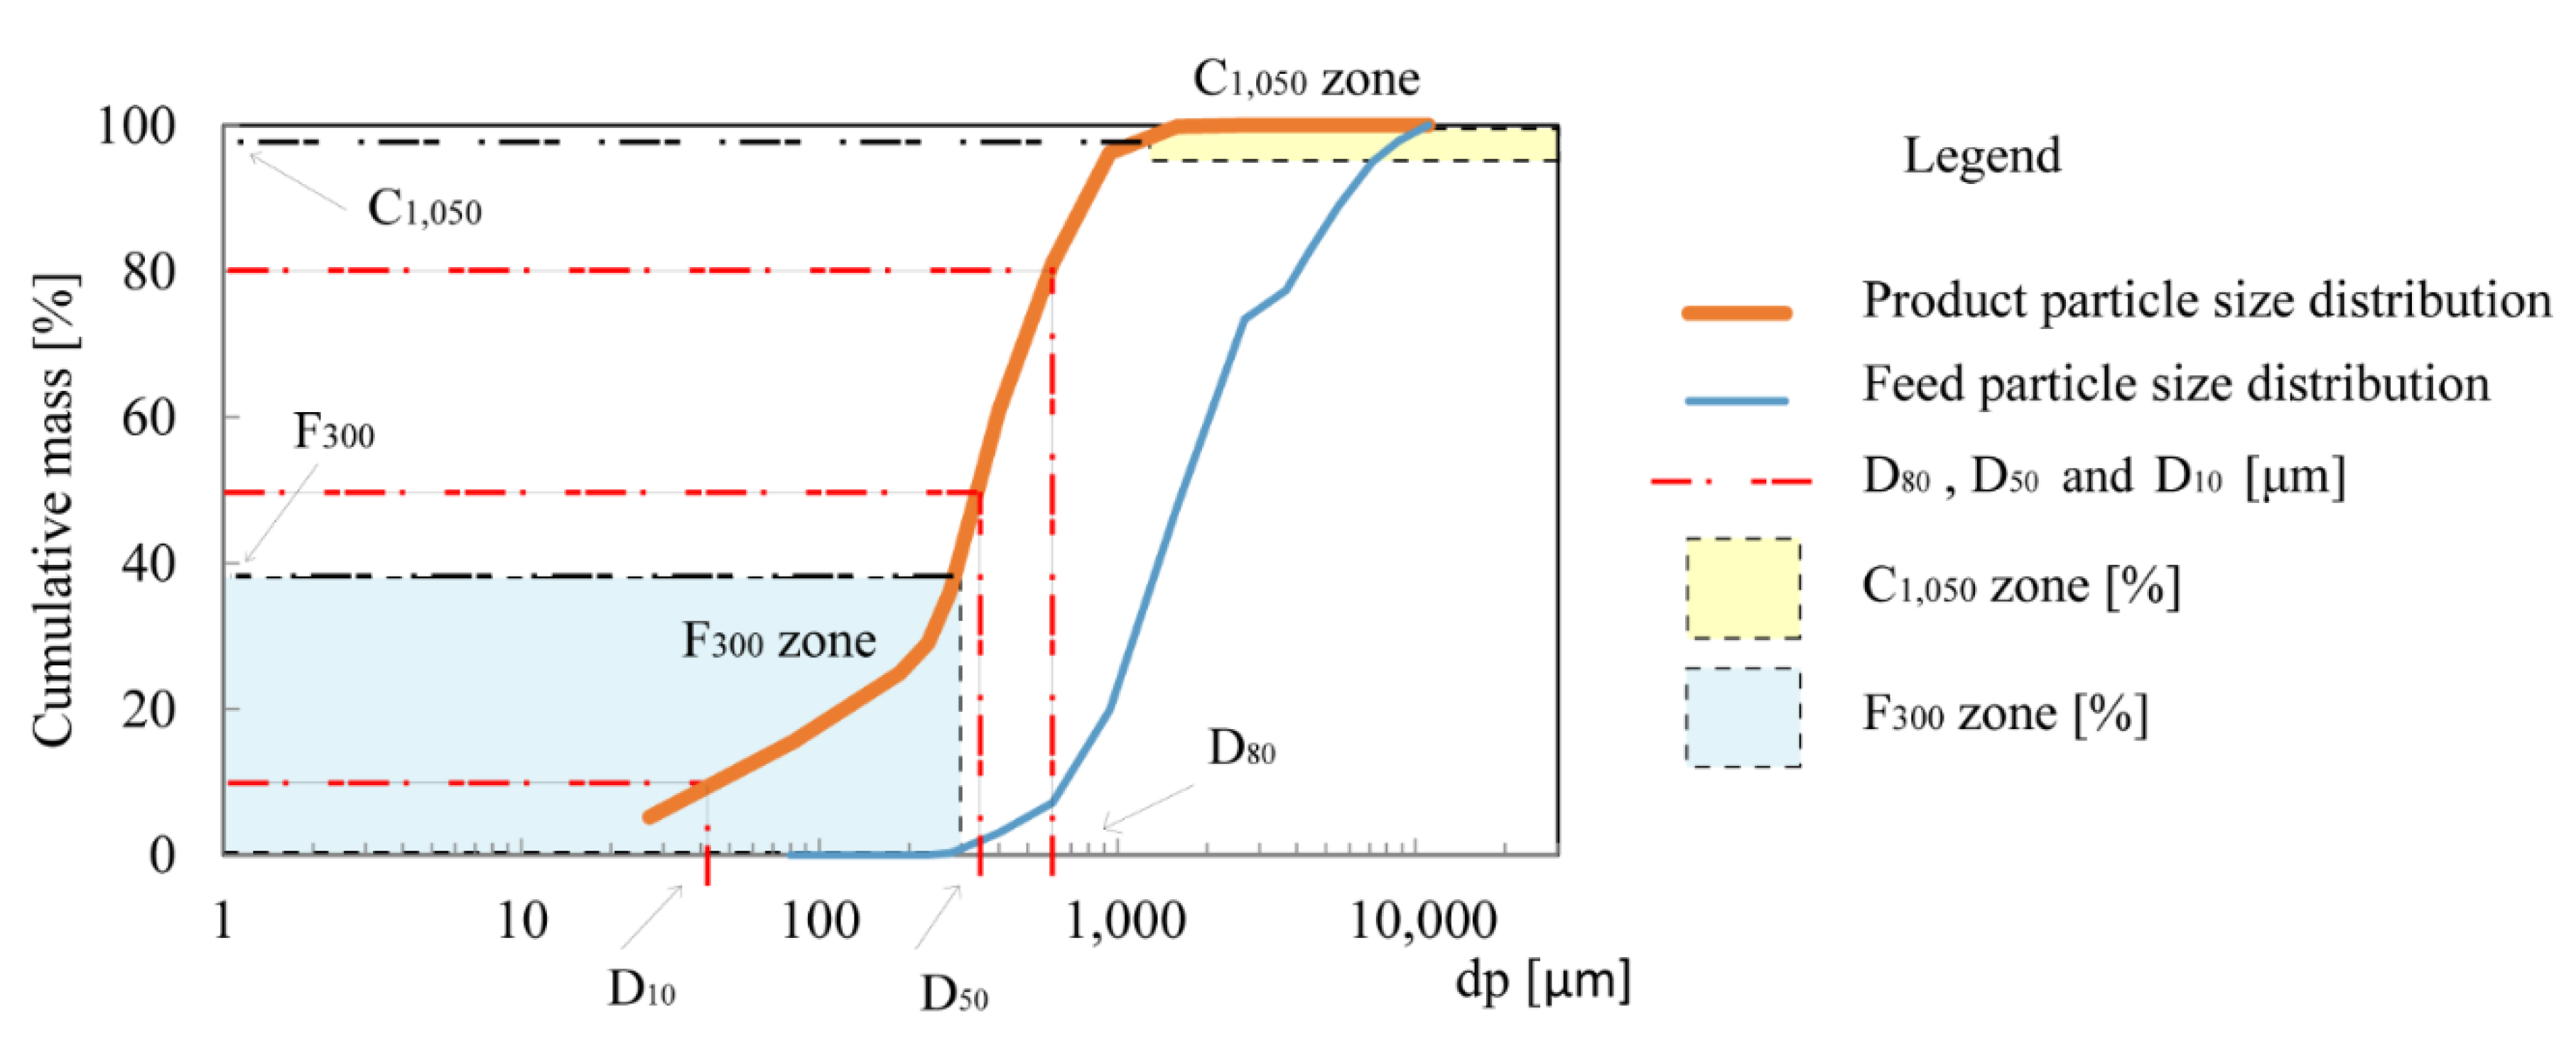
Figure 1. Main parameters used in this work with the aim of analyzing rod milling.
Minerals 12 00183 g001
Figure 2. Laboratory tumbling rod mill design. (A) Profile view, (B) 35 mm lifter height configuration, (C) 23 mm lifter height configuration.
Minerals 12 00183 g002
Figure 3. Scheme of methods used to evaluate main operating conditions that govern rod milling with potash ore.
Minerals 12 00183 g003
Figure 4. Scheme of the population balance model approach, with a perfect mixed mill combined with the piston flow process.
Minerals 12 00183 g004
Figure 5. Results of calibration experiment, showing (A) Salt saturation ratio, (B) Flows control.
Minerals 12 00183 g005
Figure 6. Results of the particle size distribution feed and product of all tests, divided by category, where (A) represents V, changing the critical rotation speed, (B) represents M, where the media charge was changed, (C) represents the curves of S, varying the solid/liquid ratio, (D) represents changes in the solid feed flow, (E) represents two tests where the rod diameters were changed, and (F) represents the lifter heights that were varied.
Minerals 12 00183 g006
Figure 7. Experimental results, where energy consumption and D50 parameter are on the left axis, while F300 and C1050 parameters are on the right axis, when (A) critical rotational speed is varied, (B) media charge is varied, (C) solid/water ratio is varied, (D) feed flow rate is varied, (E) rod size is varied, and (F) lifter geometry is varied.
Minerals 12 00183 g007
Figure 8. Partial results of the numerical simulation compared with experimental particle size distribution, where (A) experimental values of the tests varying the grinding media charge, (B) experimental values of the tests varying the slurry solid/liquid ratio, (C) simulated values of the tests varying the grinding media charge, (D) simulated values of the tests varying the slurry solid/liquid ratio, (E) simulated and experimental values of the tests when the solid flow is varied, and (F) behavior of the kinetic function S.
Minerals 12 00183 g008
Figure 9. (A) Evaluation of the energy consumption reduction ratio when an operating condition is varied, (B) evaluation of the reduction ratio of the parameter F300 when an operating condition is varied, (C) best energy performance of each item studied, compared with the control parameters using rod milling. The selected experiments are Vc (50%), media charge (20%), S/L (60%), feed flow rate (3000 g/min), rod size (30 mm), and lifter height (35 mm).
Minerals 12 00183 g009
Table 1. Particle size control parameters denomination.
Parameter Meaning
D1010% of the particles are under this size
D5050% of the particles are under this size
D8080% of the particles are under this size
F300Percentage of particles less than 300 μm
C1050Percentage of particles larger than 1050 μm
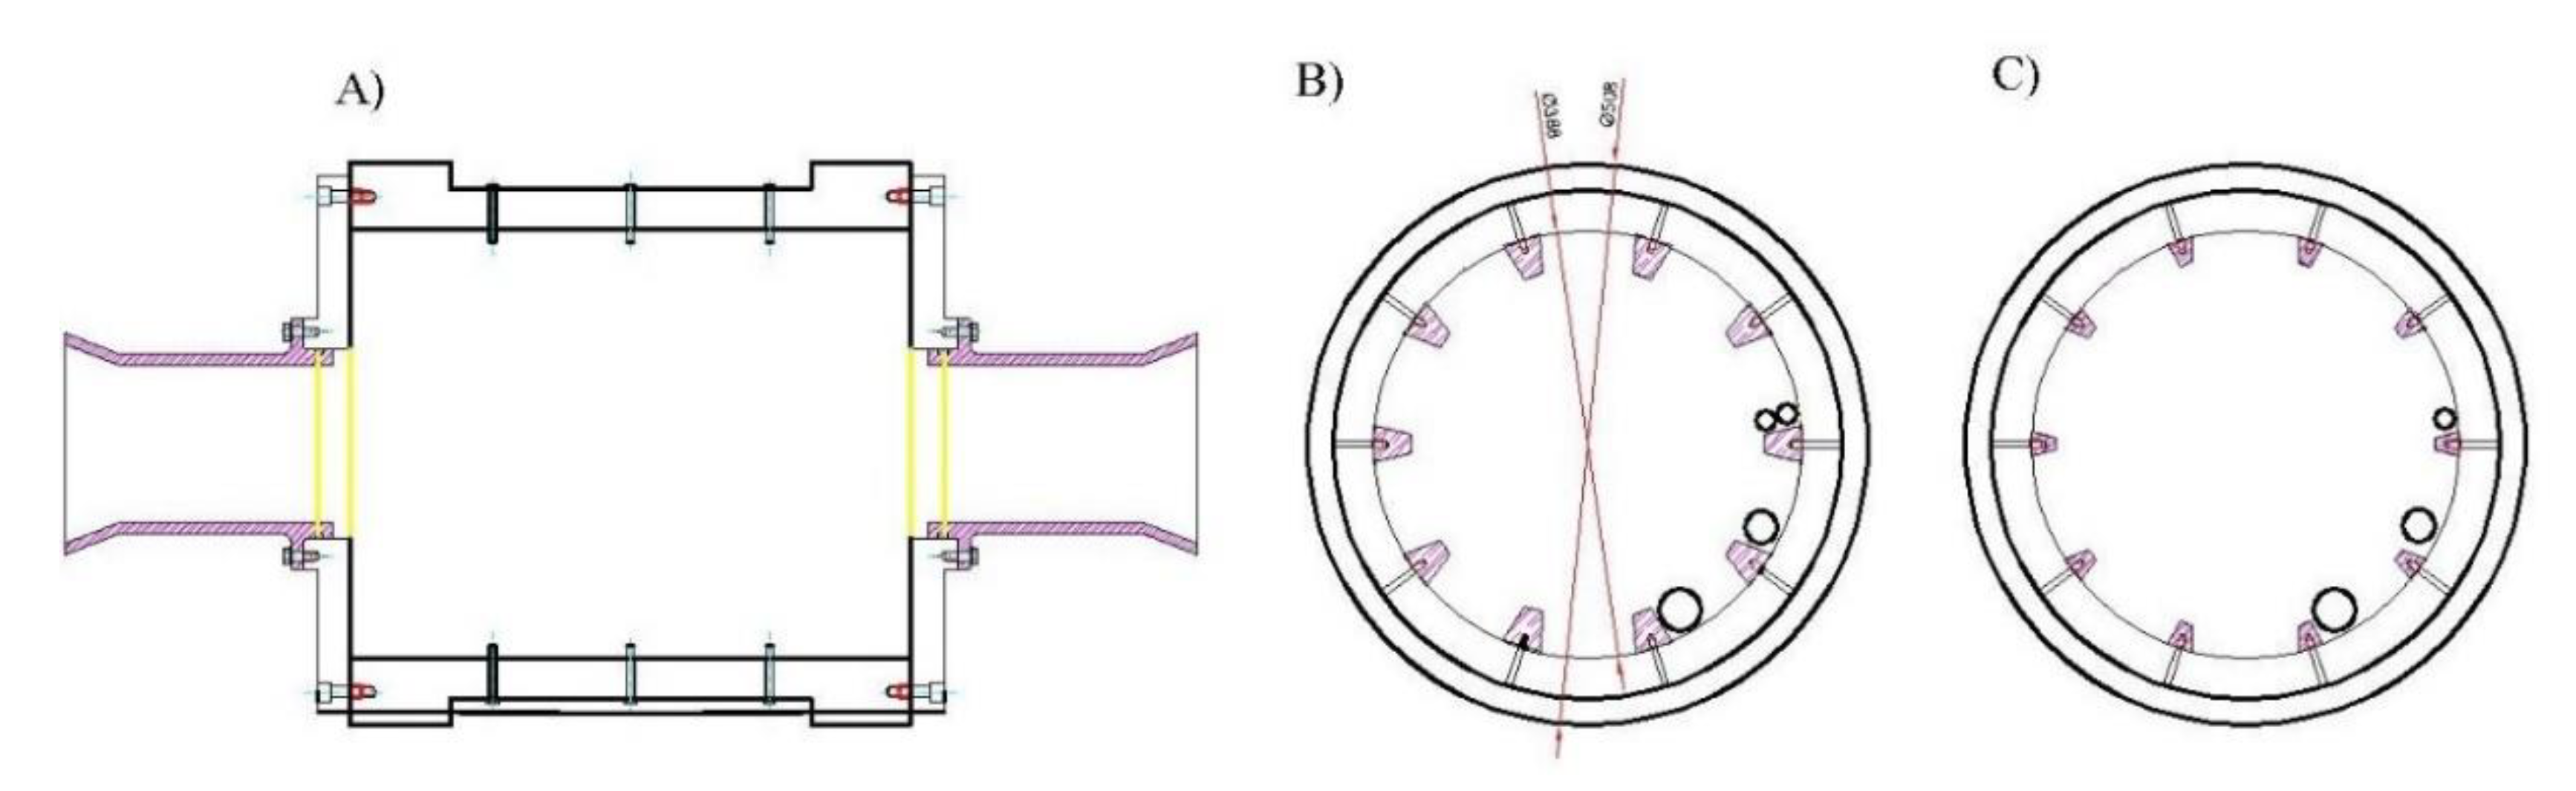
Table 2. Main features of the laboratory tumbling rod mill.
Feature ValueUnits
Internal diameter388mm
Internal length 506mm
Rod media charge 40, 33, 27, and 20%
Rod diameter30 and 40mm
Critical speed (Vc)71.2rpm
Engine power4kW
Table 3. Experimental design of the rod mill experiments for modeling purposes. Vc is the critical rotational speed of the mill, the solid feed is 3 kg/min, rod diameter 30 mm, and lifter height 23 mm.
TestsVcMedia ChargeS/L
(%)(%)(%)
A504050–55–60–65
B604050–55–60–65
C704050–55–60–65
D804035–55–60–65
Table 4. Experimental design of the rod mill experiments for product control study. Vc is the critical rotational speed of the mill. The tests are grouped into six categories, where V changes Vc, M changes media charge percentage, S changes solid/liquid ratio, F changes solid feed flow, R changes rod diameter, and L changes lifter height.
TestVcMedia Charge S/LSolid Feed Flow Rod Dimensions Lifter Dimensions
(%)(%)(%)(g/min)(mm)(mm)
V150406030003023
V260
V370
V480
M160406030003023
M233
M327
M420
S160403030003023
S255
S360
S470
F160406015003023
F23000
R60406030004023
L60406030004035
Table 5. Evaluated parameters of experiments with rod mill.
Evaluated ParameterEnergy Consumption (kWh/t)D50 (μm)F300 (%)C1050 (%)
Critical rotational speed [%]508.0395319
6010.7360355
7011.7325465
8013.3320475
Media charge [%]207.86452421
278.75003113
339.34433111
4010.6377406
Solid/water
rate S/L
[%]
309.0315475
559.4350405
608.1368386
709.36432024
Feed flow [g/min]15009.1205661
30008.8368384
Rod size
[mm]
308.1368336
409.8390324
Lifter size [mm]239.8390324
359.1405315
Table 6. Parameters of the mathematical approach to predict particle size distribution. All parameters are dimensionless.
ParameterValue
k0.500
n11.022
n21.500
S1-
α3.204
ω10.005
β12.970
ω20.005
β24.372
Table 7. Comparison between experimental key values and simulated parameters using particle size distribution prediction model.
Experimental Simulated
ParameterF300 (%)C1050 (%)D50 (μm)F300 (%)C1050 (%)D50 (μm)
Critical rotational speed 319395348.5410
355360395.0365
465325474.0320
475320464.0325
Media charge [%]406377414.0340
3011443319.0420
3113500309.0425
24216452117.0580
Solid/water
Rate S/L
[%]
20246432021.0640
386368415.0360
405350493.0340
475315483.0316
Feed flow [g/min]661205721.0210
384368404.5355
Rod size [mm]324390376.0380
336368404.5360
Lifter size [mm]324390394.5380
315405355.5400
RMSE4.11.926.6
Table 8. Energy reduction ratio when the media charge is reduced and the starting point is 40% media charge.
% Media ChargeEnergy (kWh/t)Energy Red. (%)
4010.60
339.312.1
278.718.1
207.826.8
Publisher’s Note: MDPI stays neutral with regard to jurisdictional claims in published maps and institutional affiliations.

