1. Introduction
Globalisation and social development imply increased consumption and demand for mineral resources [
1], which are finite. In the face of scarcity, the most sustainable alternative is to recycle; however, given the growing demand for raw materials, the only alternative that ensures their availability is the identification of new reserves, and that requires mineral prospecting.
The mining cycle can be classified into four main phases: exploration, exploitation, processing and environmental reclamation [
2]. The exploration, or prospecting, stage can be defined as the set of activities to identify anomalies produced by mineral deposits, which in turn allows the delimitation of areas of interest where potentially exploitable deposits could be discovered. Traditionally, prospecting is classified into two different typologies: indirect and direct. The former is based on the study of properties inferred through geochemical and geophysical methods. The direct method, on the other hand, is based on the use of test pits and boreholes. Indirect prospecting entails the application of geophysical methods based on specialised sensor measurements of physical anomalies associated with materials that generates a sufficiently strong identifying signal [
3]. These activities involve the generation of physical models of the terrain and its behaviour according to various stimuli, but allowing for the identification of surface anomalies associated with possible mineral deposits. Some conventional methods that make up this branch are magnetometry, electrical prospecting, seismic or gravimetry [
4]. Geophysics, therefore, plays a fundamental role in the location and exploration of mineral resources [
5] and can be divided into ground-based and airborne, the latter of which reduces the time required to scan large surface areas.
In recent years, the mining sector, like all other engineering activities, has been revolutionized by the development of unmanned aerial vehicles (UAVs) [
6]. The use of these drones has become widespread in the control and monitoring of open-pit and underground mining, and even abandoned mines [
7]. More recently, however, they have been implemented in the initial prospecting stages of the mining cycle. Installed with a wide range of sensors available on the market, drones can identify areas of interest for prospecting by direct methods. In this respect, the low cost of the sensors should also be highlighted, as well as the progress made in the processing software [
8].
Advances in remote sensing techniques to obtain information to develop models of the earth’s surface have engendered an evolution in prospecting, starting with the appearance of satellite images. UAVs have also changed the nature of geophysical prospecting. There are several examples of their application in mining exploration, such as drone magnetometry [
9,
10], and their on-board equipment includes multispectral cameras to identify of small reserves [
11,
12], multispectral sensors to detection rare elements [
13], and thermal cameras to detect caves [
14] or even other resources such as large bodies of water [
15,
16], and gamma ray sensors [
17]. The application of UAV laser fluorescence to remote sensing in caves can also be mentioned [
18,
19,
20]. The Geographic Information System (GIS) provides the analysis, visualisation and interpretation of geospatial information [
21]. These functions fit perfectly with UAV photogrammetric products, as UAVs are currently the major alternative to traditional methods of map production [
22,
23,
24]. The combination of both technologies is, therefore, a symbiosis [
25] although the GIS has potential application in other fields. One of them is mining, where it is used in environmental impact assessments [
26], underground mine monitoring [
27] and the development of multi-criteria analysis for site selection [
28], which can also be applied to resource exploration.
In the present research, the use of UAVs is proposed for the generation of maps, analysed by means of GIS tools, that identify different lithological outcrops. UAV platforms can be used to generate maps that can be analysed using GIS tools due to their capacity to integrate RGB sensors, multispectral or hyperspectral sensors, geophysical instruments [
29], and in particular low-cost thermal sensors, which could be capable of detecting thermal variations that may be associated with various outcropping lithologies [
29]. The objective of the research lies in establishing a new mining prospecting method based on the thermal modelling of outcrops and the use of GIS tools to allow a quasi-automatic analysis of thermal images that identify different thermal behaviour corresponding to lithological outcrops. More specifically, the research focuses on identifying contacts between outcrops of limestone and dolostone that have varying iron content because they allow glimpses of different thermal behaviour when exposed to solar radiation.
2. Materials and Methods
The identification of different lithologies, based on thermal behaviour, is proposed through the treatment and interpretation with the GIS of thermal orthomosaics generated from photogrammetric blocks obtained from low-cost thermal sensors integrated in UAV platforms.
2.1. Preliminary Analysis of the Thermal Behaviour of the Rocks to Be Prospected
For the proposed method to produce positive results, it is necessary to assess that there is a real difference in thermal behaviour between the lithologies to be studied, which can be verified through an analysis of their corresponding specific heat capacities. There are some works aimed at analysing and monitoring the surface temperature of rocks [
30,
31,
32] and soils [
33], for reasons unrelated to the prospecting of mineral resources. A simple methodology is proposed in this research, but before implementing the necessary resources, it is appropriate to carry out a series of laboratory tests to verify the aforementioned thermal difference. To this end, it is proposed to develop a series of experiments to simulate real meteorological conditions, to take the information with a thermal sensor and model the behaviour.
In this way, in a controlled environment, it is proposed to carry out three tests in which rock samples to be analysed are subjected to the same thermal process to see how each behave. The first one simulates real conditions in which data capture subsequently take place, and the difference in behaviour is verified. For this purpose, it is proposed to leave the samples exposed to natural incident radiation. Despite the dependence on many factors (e.g., latitude, longitude, time, and weather [
34]), the test must be developed in conditions similar to those in which a UAV flight will take place. In addition, behaviour must be monitored by recording the sample temperatures about every 30 min, which will provide enough data to model the behaviour. Two further tests are then conducted. In the first, behaviour at temperatures below 0 °C is analysed by cooling the rock samples in a cold chamber. In the second, behaviour is studied when the samples are at high temperatures after being heated in an oven. In both cases, the samples are placed outside to see how they will evolve when returned to normal weather conditions. Later, the data resulting from the tests are analysed to establish the real behaviour of the lithologies to be prospected. The information obtained is a succession of temporally spaced temperatures. Because of this, a model is proposed to study and identify the real thermal behaviour of the lithologies by means of tables and graphs. For this purpose, the data are represented graphically in a Cartesian system, in which the abscissa refers to the instant of observation, and the ordinate refers to the resulting temperature. The analysis of the graphs give a logical determination of the change in the temperatures for each type of rock. This permits the identification of both the behaviour of the lithologies and the instant in which the greatest temperature difference between them occurs, which obviously corresponds to the optimum moment for capturing the thermographic images.
2.2. Thermal Imaging with UAVs
Once the differences in the thermal behaviour of the lithologies have been verified in the laboratory, thermal images appropriate to the object of the investigation must be captured. In the first instance, it is necessary to choose the ideal sensor, which for this research must to be mounted on a UAV. For this reason, its dimensions and weight have to allow it to be supported. Furthermore, according to the initial premises of this study, it has to be low-cost. There is a wide variety of equipment available on the market, and the export formats of the images generated must be evaluated according to the particular use or application to be carried out to satisfy the requirements of qualitative and quantitative information.
Photogrammetric works are usually developed on the basis of programmed flights [
35] in which the flight height is defined. This determines the ground sample distance (GSD), a parameter usually established as a standard for the accuracy or detail level of a photogrammetric flight. The most widespread software tools, such as Pix4DCapture, DJI Pilot or Mission Planner [
36], do not implement adaptive flight heights to maintain a constant distance to the ground surface. This implies the need to use specific software linked to the UAV. The proposal recommends a flight height that guarantees a GSD thermal sensor value of about 5 cm/px. Conventionally, current photogrammetric flights with UAVs using RGB sensors reach accuracies on the order of 1 or 2 cm. In the case of thermal sensors, the intrinsic characteristics of the latter lead to a worse resolution, so it is normal to obtain results with lower accuracies, which are associated with higher GSD values. For example, flying with a dual sensor such as the Zenmuse XT with an infrared resolution of 600 × 512 px at a focal length of 19 mm and flight altitude of 50 m, as proposed in this work, a GSD of 5 cm/px is obtained. However, the RGB sensor of the device reaches values of 1.3 cm/px for the same flight height.
In addition, the frontlap and sidelap values must take into account the type of sensor to be used as well as the target [
37]. Traditionally, the values used in aerial photogrammetry were 60 and 20% respectively [
38]. However, with the advent of UAVs, recommendations increased these values to 80 and 60% [
39], and can be extended to avoid hidden areas. Given the lower radiometric resolution and image sharpness of infrared sensors [
40], other authors propose using values reaching 95% [
41].
The flight speed is the fundamental parameter for determining total flight time, the interval between the shots and the shutter speed. As this is a flight where the main focus is on the thermal component, it is advisable to reduce speed from the traditional rate to 3–4 m/s [
42]. It is recommended that the flight be supported with ground control points (GCPs), which allow the generated products to be scaled and oriented with respect to an established reference system. The layout of the GCPs is one of the most influential parameters for the accuracy of the result [
43,
44,
45]. It is recommended that this setting be regular along the perimeter and interior area to be represented.
In addition to the flight, the date and time of the flight should be planned to avoid unfavourable weather and obtain the greatest thermal difference between lithologies based on previous test results. The activities should be carried out in a single day, and in the shortest possible time so that the thermal conditions do not change, thus avoiding possible effects on the processing of the images.
2.3. Processing of Thermal Images
The set of images from the flight have to be processed according to the principles of photogrammetry; that is, what might be called “modern photogrammetry”, which uses software based on Structure-from-Motion (SfM) algorithms, and automatic image correlation to generate products that allow the results to be interpreted. Regarding the generation of thermal models, some authors have tried to classify the methodologies into categories [
46,
47,
48]. However, when starting from thermal images, the methods can be divided into only three main categories: thermal 2D-image modeling [
49], thermal image mapping in existing 3D models [
50,
51] and a combination of RGB and thermal images [
52,
53,
54].
The method proposed in this research focuses on the development of the second category, based on the generation of a point cloud from the RGB images on which to project the radiometric information from the infrared images. The fundamental part of the research involves the appropriate photogrammetric processing of the thermal images, which allows the creation of an orthomosaic and three-dimensional model having sufficient quality and precision to carry out prospecting and identification of areas of geological-mining interest.
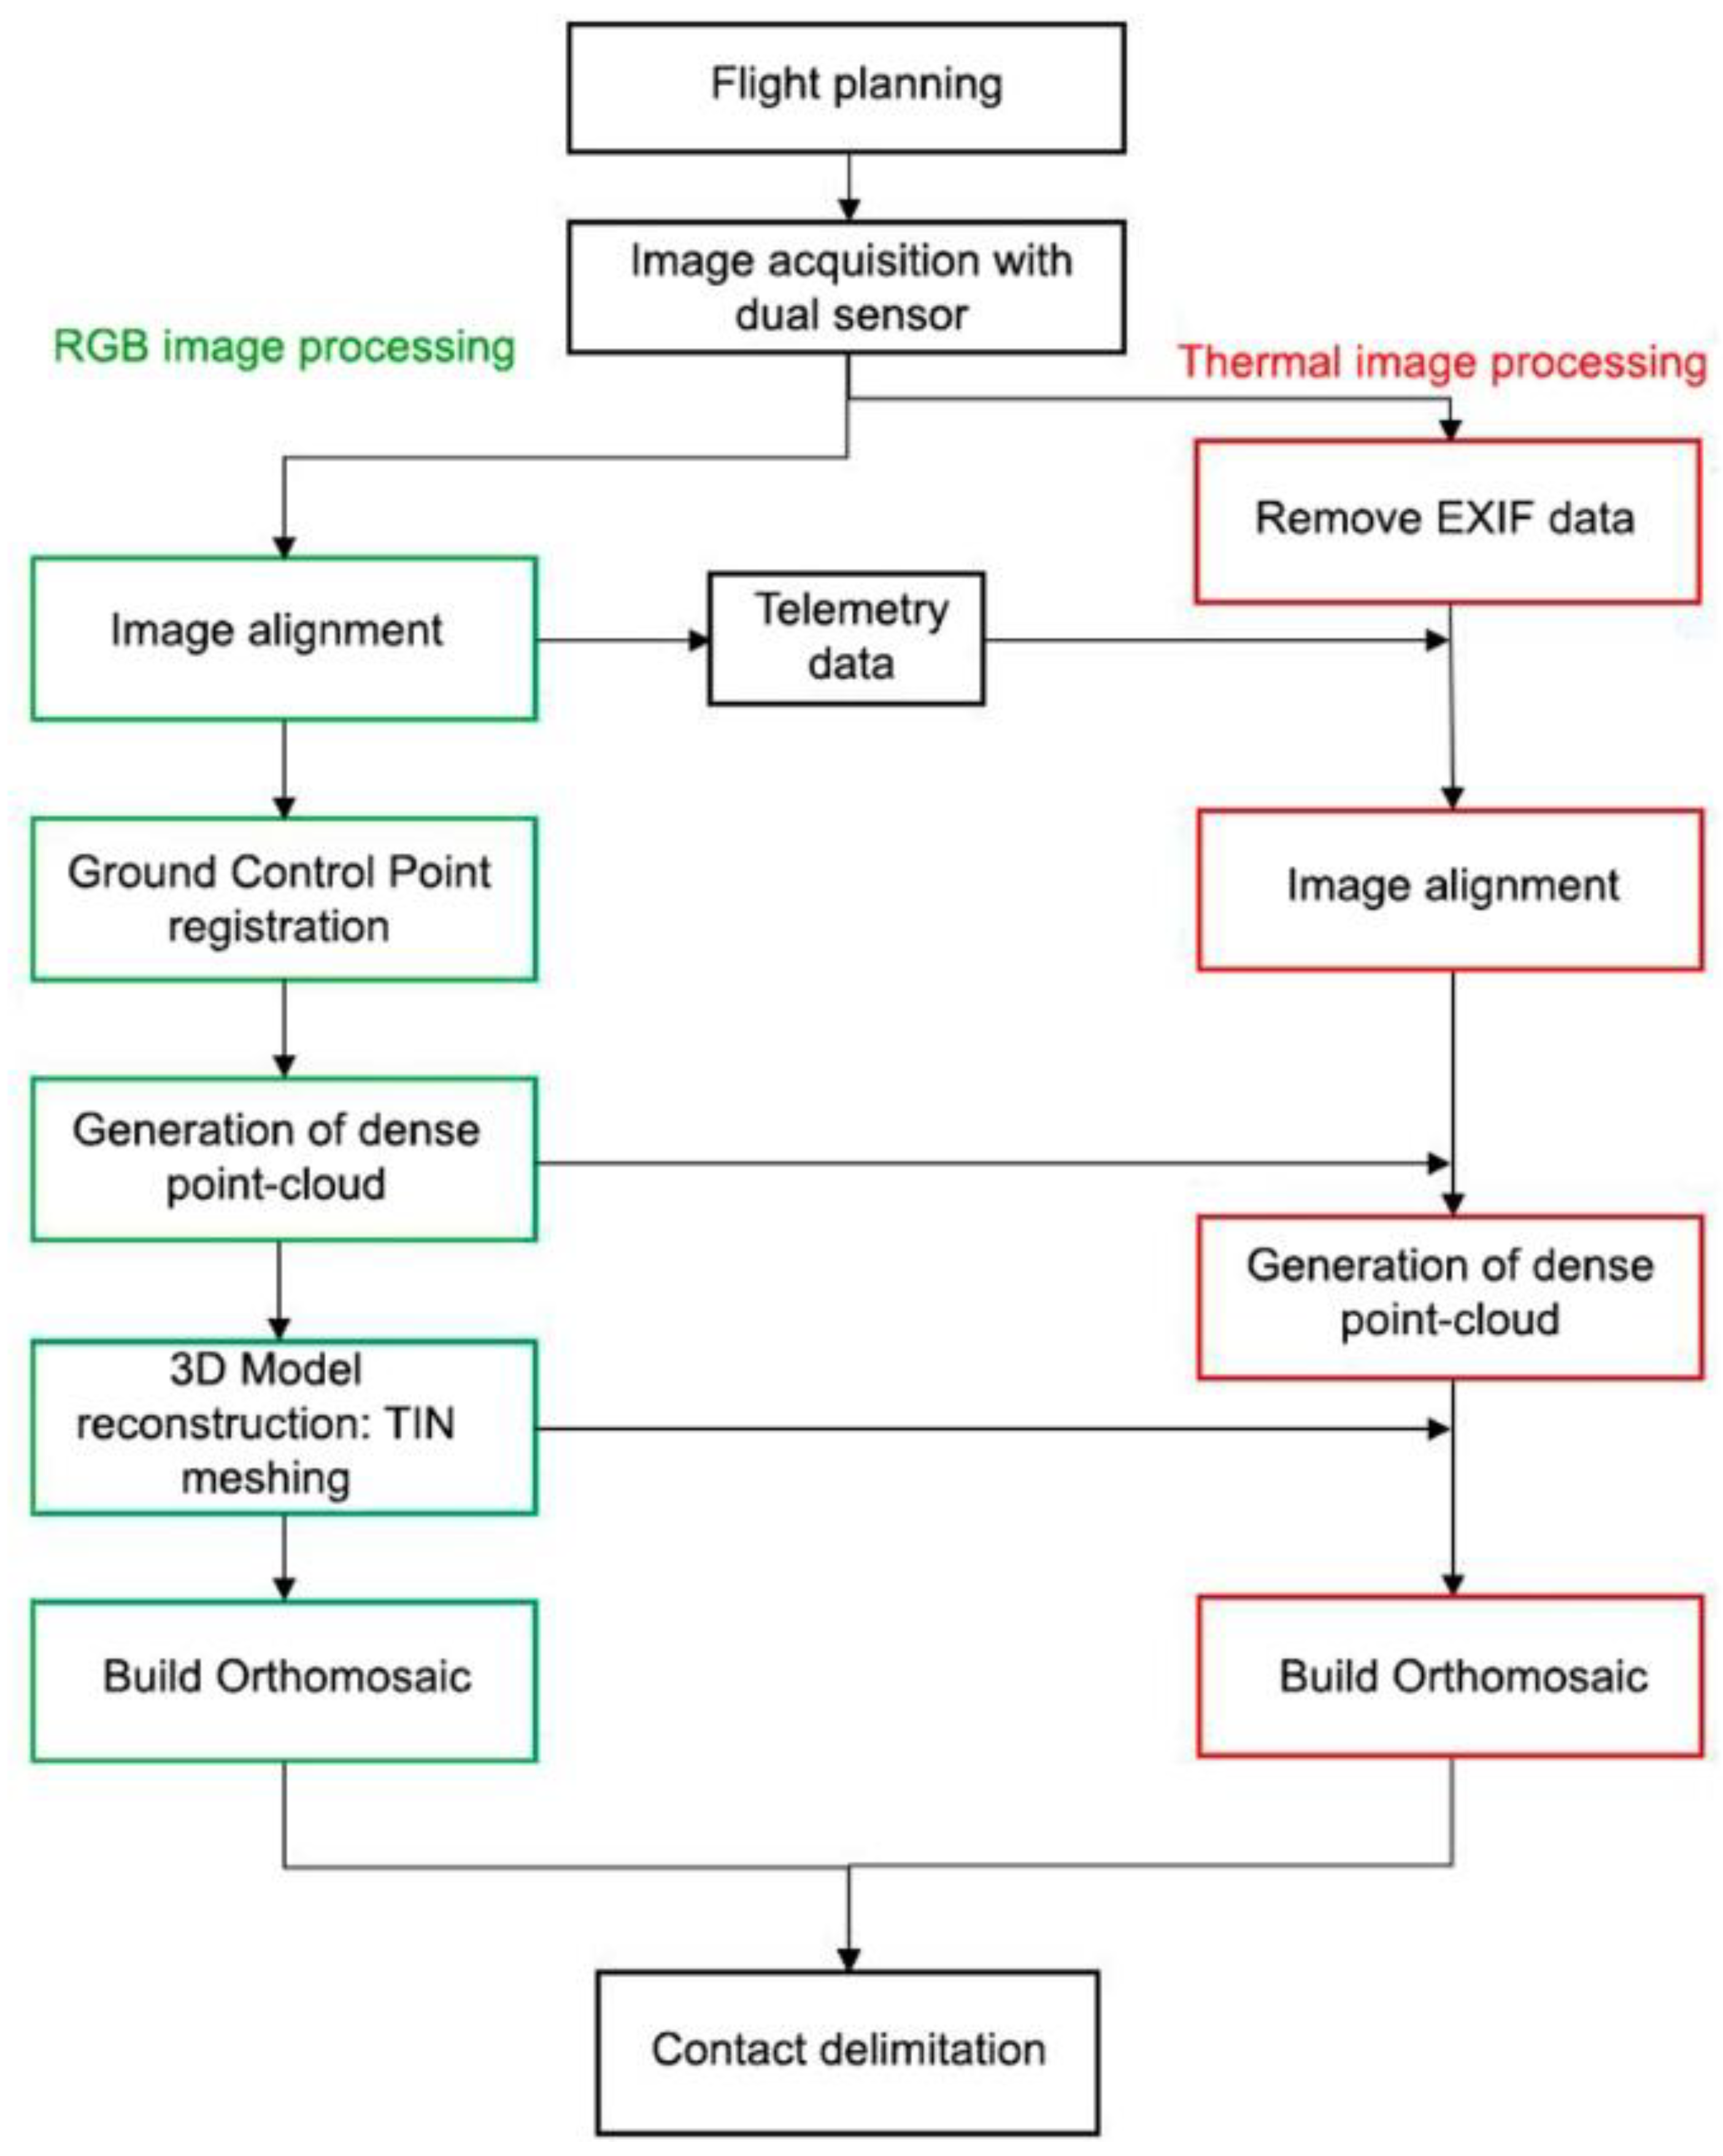
Currently, when working with photogrammetric blocks from drones, a multitude of software on the market can process these images and obtain good results, such as Metashape, Pix4D, PhotoModeler, Visual SfM, OpenDron Map or DronDeploy. However, the first two stand out because they are the most widely used commercial software alternatives due to the quality of their results. Despite possible differences between them, they are all based on SfM algorithms, which allow them to obtain information and represent points from two-dimensional images. Complementarily, these programs implement algorithms, such as Multiview-Stere (MVS) to densify point clouds, or Scale Invariant Figure Transform (SIFT) to identify homologous points automatically, thereby producing high-quality results and minimizing the need for user interaction. The proposed processing method integrates the geometric veracity of the models using the higher-resolution and sharper RGB images, with the radiometric information captured by the thermographic sensor. A workflow is recommended that orients the RGB images to their thermal counterparts for a subsequent projection of infrared information on the three-dimensional model obtained with the RGB images (
Figure 1).
Once the photogrammetric process has been completed, the orthomosaic is processed with GIS tools to determine the temperature in each pixel that comprises it. This is possible because the information stored by thermal sensors is generally radiometric, allowing the conversion to temperature through reclassification functions.
To obtain a more realistic result, it is proposed to adjust the transformation based on the temperature measurement by a more accurate complementary method in several georeferenced points of the outcrop in the model, which was taken at the same instant that the flight was developed. In this way, a comparison can be made between the measurement on the transformed orthomosaic and the temperatures observed in the field, making it possible to establish the deviation between the real surface temperature and that obtained in the model. An analysis of the deviation between the temperature of the initial transformation of the first iteration and the temperatures measured at the points on the ground will allow a thermal adjustment value to be established. It will be applied in a second iteration of the reclassification, thus obtaining a result that is more in line with reality.
2.4. Thermal Image Analysis and Interpretation with GIS for Lithology Identification
The expected result is an orthoimage that represents the surface temperature of the study area in each pixel so that the different lithologies can be identified. There are several possible ways to interpret the image. One, which is very quick and easy, involves photo-interpretation, by which elements in the image are identified by visual analysis and inspection. However, this technique is subjective because it depends on the perception of the person performing the analysis, as well the influence of the subject’s experience and knowledge.
In this research, a quasi-automatic method using the GIS is proposed to segment the thermal image, thus reflecting by itself the contact zones or identified areas associated with the different lithologies. To do this, a thermal limit has to be determined or established; that is to say, a temperature that allows the different lithologies in the study area to be distinguished. In this way, the points with higher temperature belong to one type of lithology, and the lower ones to the other, as long as there are only two types of rocks in the outcrop. If there were several lithologies, different thermal limits had to be established. Because the two lithologies are in contact, there is no clearly defined thermal boundary, as may be the case with chromatic differences; instead, there is a temperature transition zone between the rocks.
It is proposed to establish the limit temperature from the real temperatures of the lithologies taken in the field using a method other than the airborne thermographic camera mounted on a UAV during a photogrammetric flight, and the rock’s thermal behaviour test results. The proposed limit temperature is determined as the sum or difference between the average temperature of the target lithology, based on field measurements, and half of the average temperature difference between both lithologies measured on the basis of laboratory tests:
where
TLimit is the temperature limit;
TRockTar is the mean field temperature of the lithology of interest; and Δ
TAverage is the mean temperature difference between lithologies as determined in the laboratory.
When applying the above expression, the positive or negative sign depends on the mean temperatures observed in the lithologies, so that the value is positive when the temperature of the rock of interest is lower, and negative when it is higher than that of the rock without interest. In this way, a new map will be obtained through a reclassification operation that reassigns a new value to temperature pixels that are lower than or equal to the limit. This value will be different from the one assigned to pixels of a higher temperature. The new map will be a raster representation of the spatial distribution of two values on which photo-interpretation work will have to be carried out. It will represent the contacts by lines on the reclassification in such a way that the areas associated with each of the lithologies present will be delimited.
2.5. Method Validation
To validate or contrast the results of the proposal with the conventional, less economical methodologies, it is proposed to compare the results with those obtained by two other procedures: detailed geological mapping and photo interpretation. It is recommended that the GIS software be used to allow the integration and comparison of the contacts and areas of interest resulting from the application of the various techniques proposed so that the goodness of the new method compared to conventional alternatives can be verified. From the results extracted from the GIS, comparisons can be made of the contacts between lithologies and the areas they defined.
In this sense, it is proposed to carry out detailed geological mapping based on data collection during a visit to the area under study. By means of visual inspection and topographic instruments, the coordinates (according to the established reference system) of the points that delimit the lithological contacts and other geological structures have to be determined. The data set is processed with the appropriate software to join the points and generate the delimitation lines of the contacts and other structures in the study area. This procedure is undoubtedly the most rigorous, but also the most expensive. In this investigation, validation to the whole study area was applied. In a real case, it could obviously be reduced to representative areas. Second, it is proposed to determine the contact by identifying the chromatic change associated with the different lithologies on the basis of the orthomosaic generated by photogrammetric techniques with the RGB image block of the dual sensor used (photo interpretation). This validation requires the subsequent comparison between the contacts determined on the RGB and thermal orthomosaics.
3. Results
To test the proposed method, an area was sought that had ideal conditions to allow a clear chromatic distinction between two well-differentiated surface lithologies. This area was in the municipality of Udías (Cantabria, Northern Spain), and is characterised by important limestone and dolostone outcrops in contact. Cantabria has a long mining tradition, based on the exploitation of complex Pb-Zn sulphide deposits, among which the Reocín Mine [
55], one of the world’s largest exponents of the Mississippi Valley typology, stands out. These deposits are related to the Reocín Formation metallotect. More specifically, they are associated with Gargasian age dolostones, lithologies that have iron and constitute the host rock of these mineralisations. Therefore, the identification of these dolostones and their surface distribution could allow the definition of areas of interest for the discovery of Pb-Zn sulphide deposits.
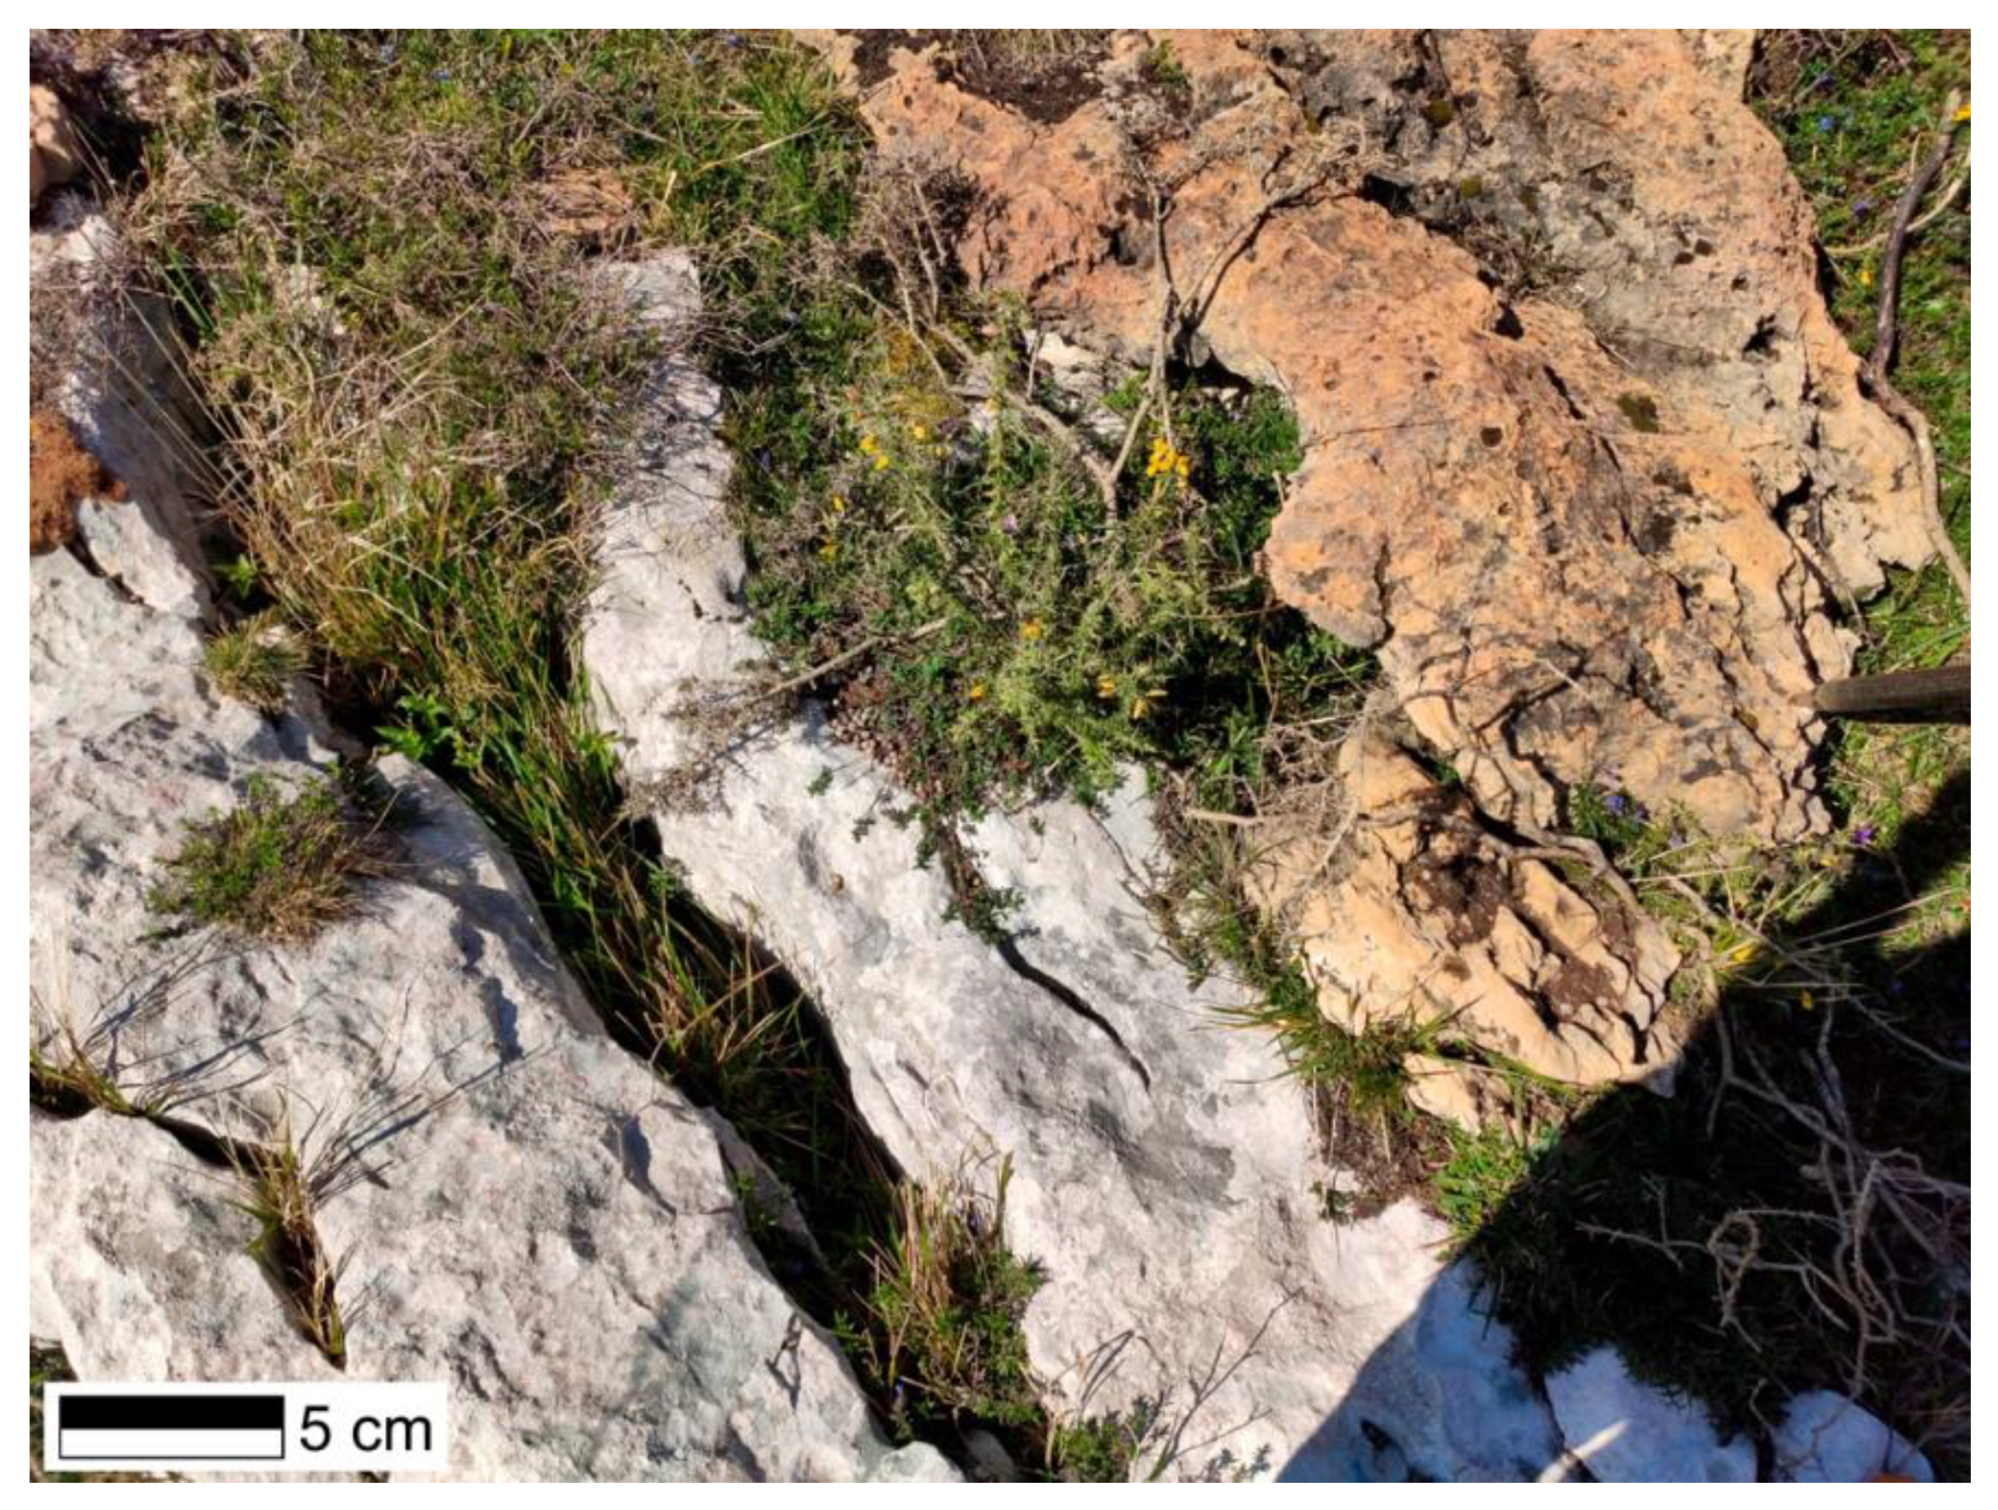
The identification of both lithologies can be made by photo-interpretation of images captured with traditional RGB optical sensors. The chromatic differences in the dolostone, are caused by iron, which give it a distinctive reddish colour, allowing the easy identification of potentially mineralised zones with roof and wall formations. In addition, the rocks should have different thermal behaviour because of their different characteristics. For example, there is an appreciable difference in the specific heat of limestone (0.515 ± 0.015 kJ/kg °C) and dolostone (0.553 ± 0.082 kJ/kg °C) [
56], which suggests that there is different thermal behaviour between the two lithologies.
3.1. Thermal Behaviour Tests
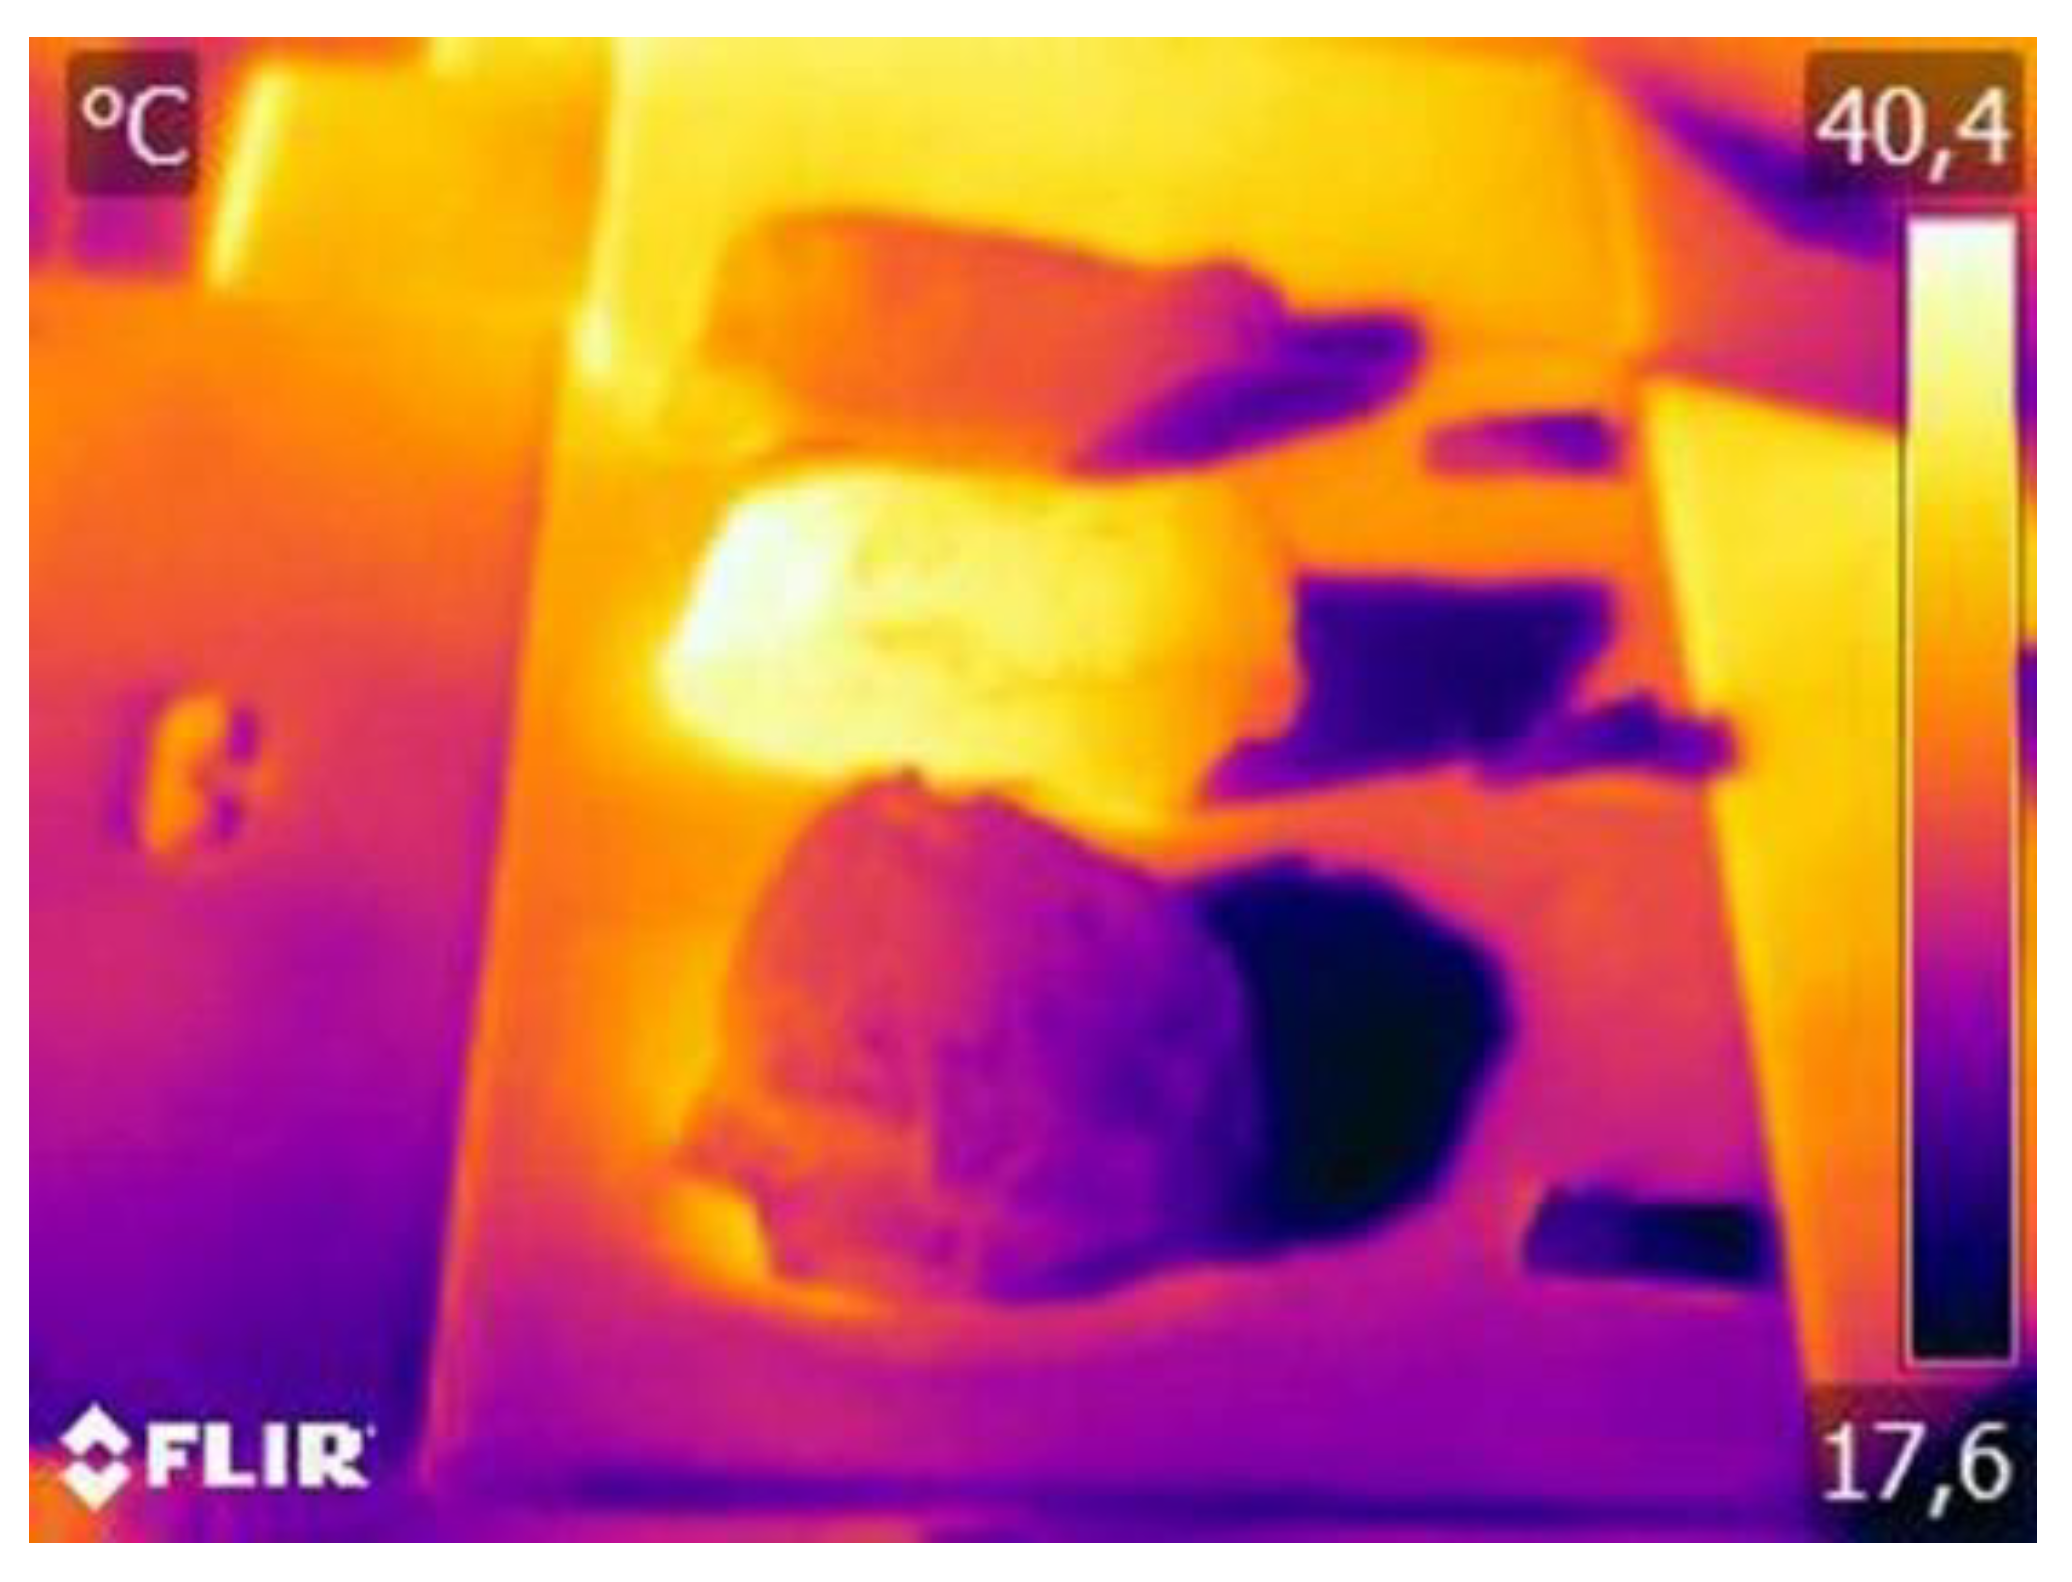
To program the flight, initial laboratory tests determined if there was a temperature difference between lithologies and, if so, at what time of day it was the greatest. To carry out these tests, six samples, three of each rock type, were taken and exposed to natural sunlight, and images were taken with a Flir E40 thermal camera.
Figure 2 shows one of the images.
The thermographic camera was properly calibrated and its technical specifications are as described in
Table 1.
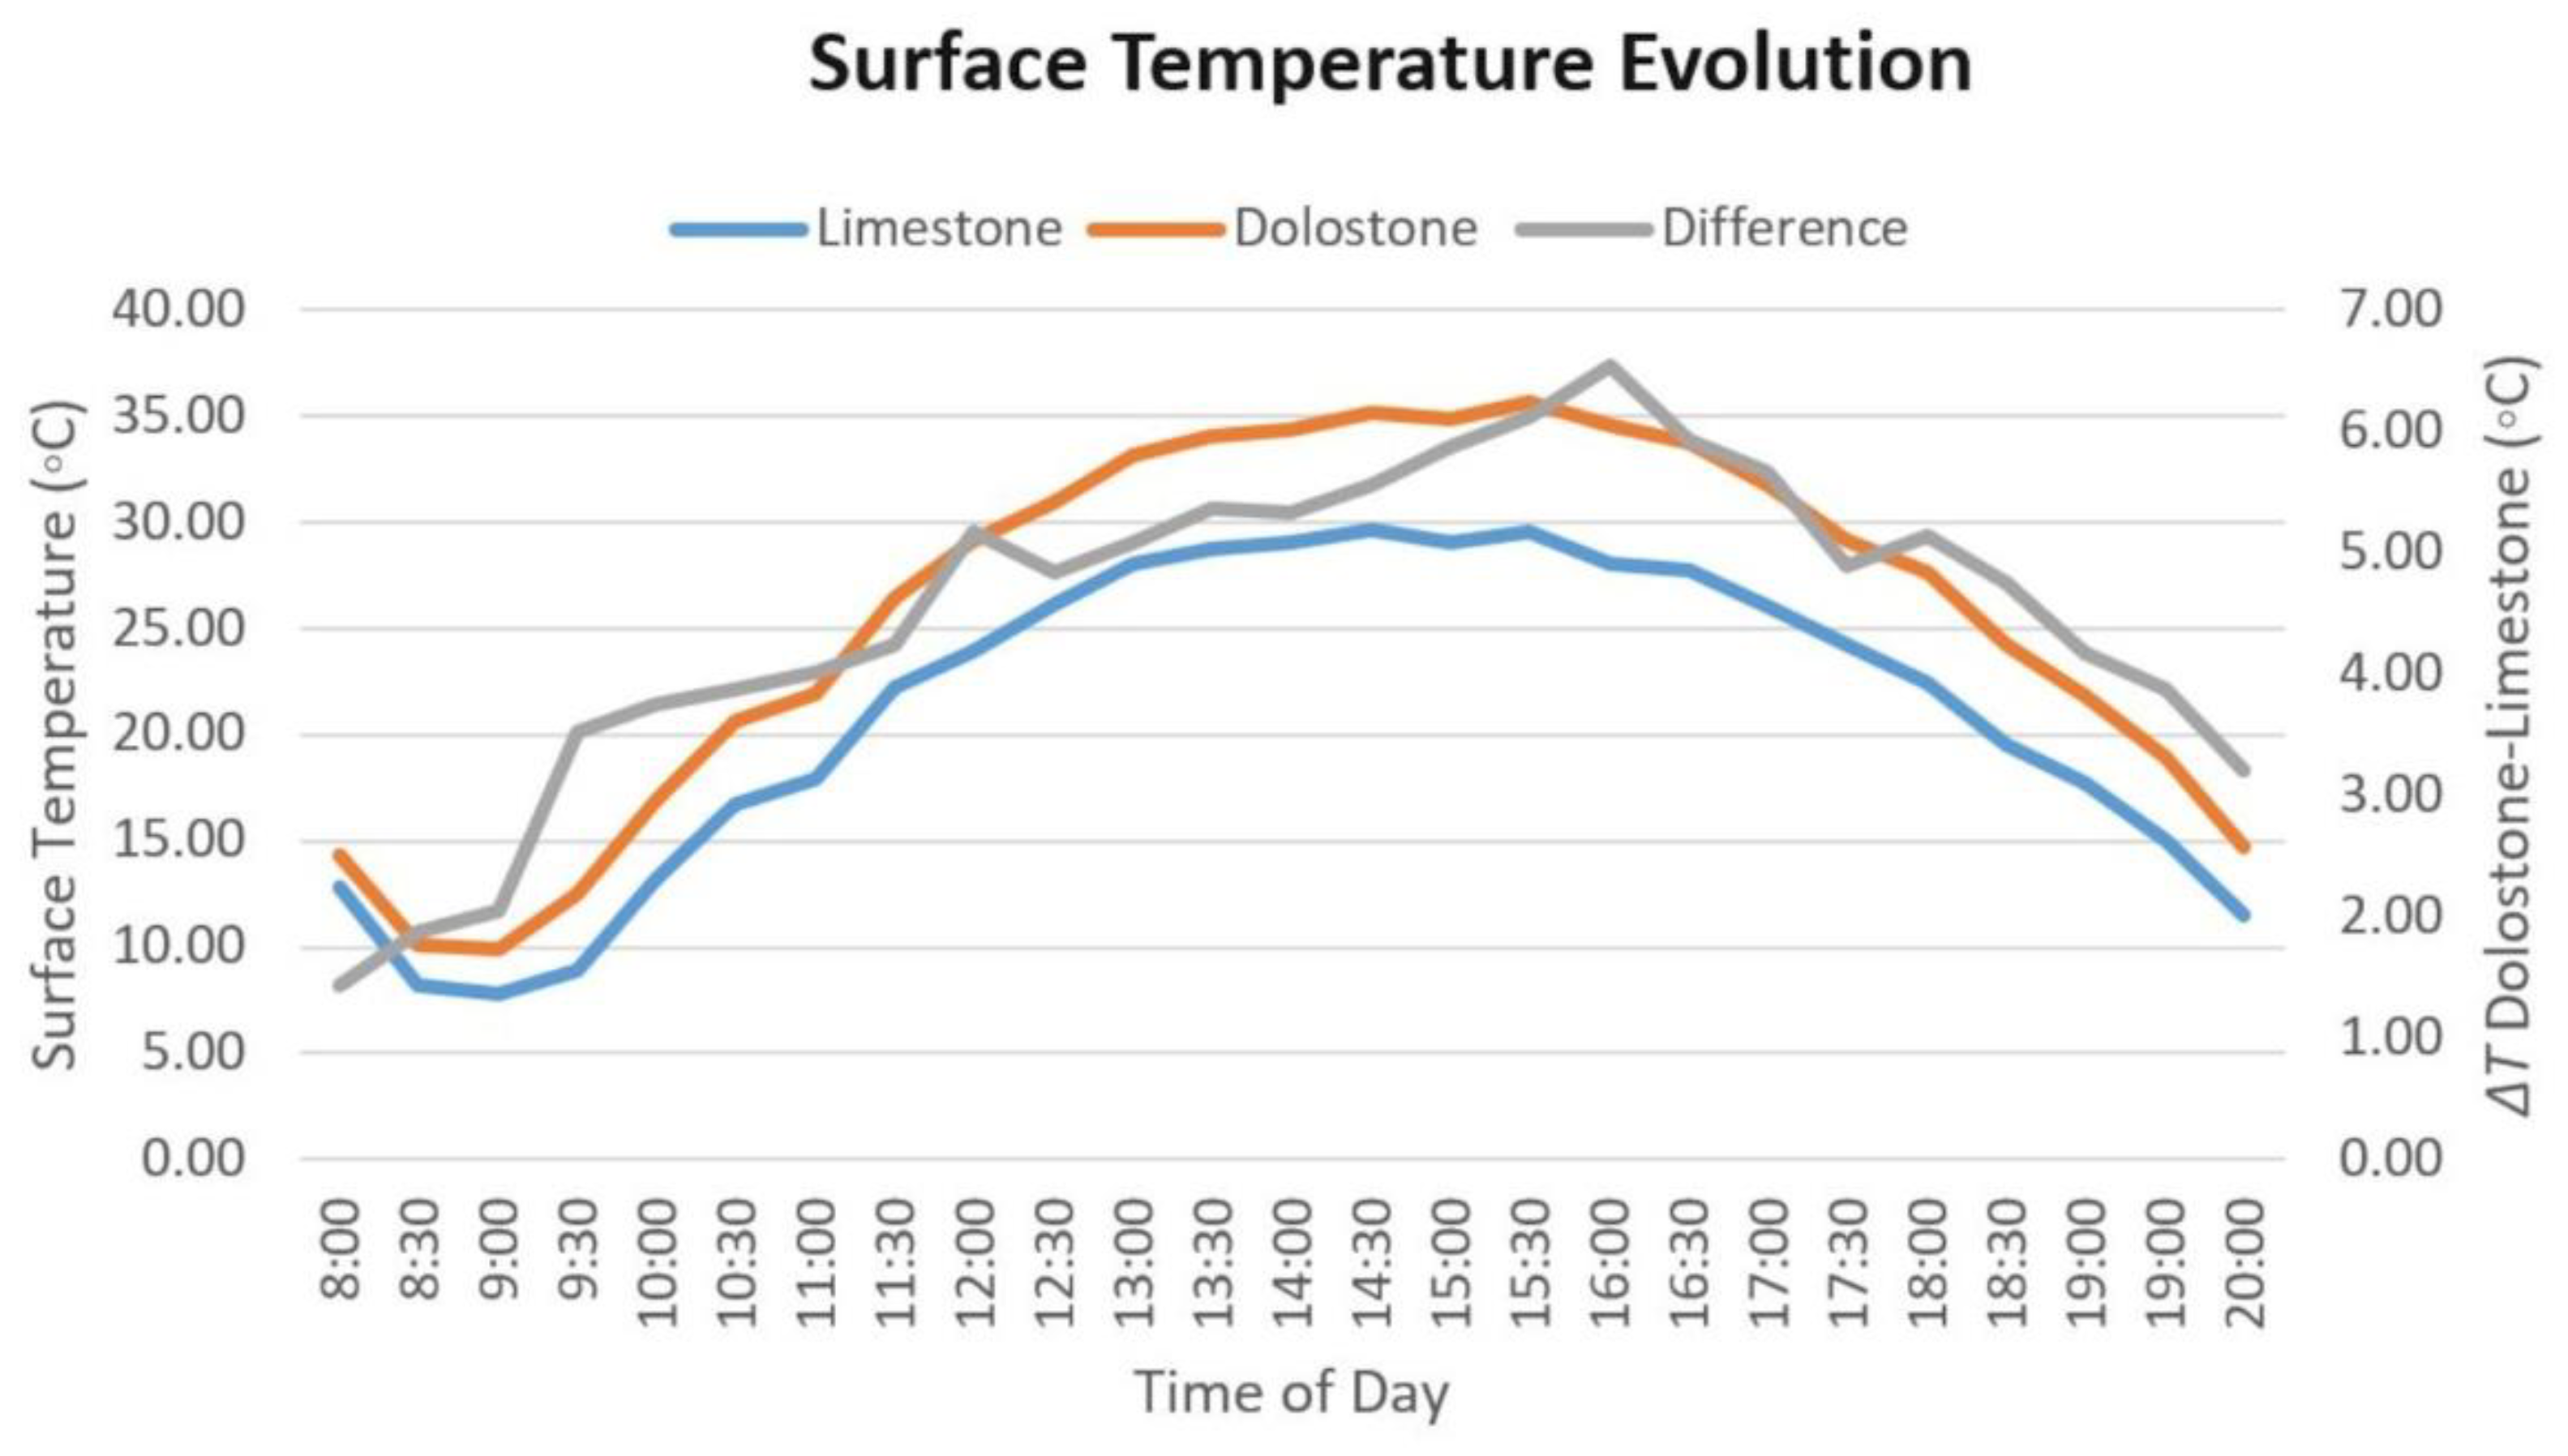
Determination of the temperature of each of the six samples was carried out using Flir Tools software to analyse the thermographic images. To do this, a coinciding area was delimited on the samples for the different shots, taking into consideration both the average temperature of the samples and the difference between the temperatures of the two lithologies at the time of acquisition. The results of the test can be seen in
Figure 3.
From the graph, the temperature difference between the lithologies was observed, as well as a clear relationship between the thermal differential and the time of solar exposure, reaching its highest value (6.53 °C) at the same time as the maximum temperature of the rocks is reached, at around 16:00 h.
To study the behaviour of the samples under extreme conditions, and to confirm the results, two complementary forced cooling and heating tests were carried out. Forced cooling consisted of cooling the six samples to −30 °C and then placing them in direct sunlight to analyse the thermal evolution. Although the temperature difference was not as high as in the first test, the dolostone temperature was higher than that of limestone. In forced heating, the samples were heated in an oven to 75 °C where they remained for three hours. They were then allowed to cool naturally until they reached room temperature. In this case, the results were more encouraging: the temperature difference between the limestone and dolostone samples was up to 7.2 °C.
All these tests ratified the fundamental condition that had to be fulfilled to apply the method developed in this research: there had be a difference in the thermal behaviour between the lithologies so that the infrared sensors could be used. In addition, these tests deduced the time of day when the maximum difference occurred, which was the optimum time for capturing information. In this way, the central hours of the day were established as the best time for the photogrammetric flight.
3.2. RGB Photogrammetry
The photogrammetric blocks of RGB and thermal images were captured by means of a programmed flight project, sized according to the specifications mentioned above as shown in the
Table 2.
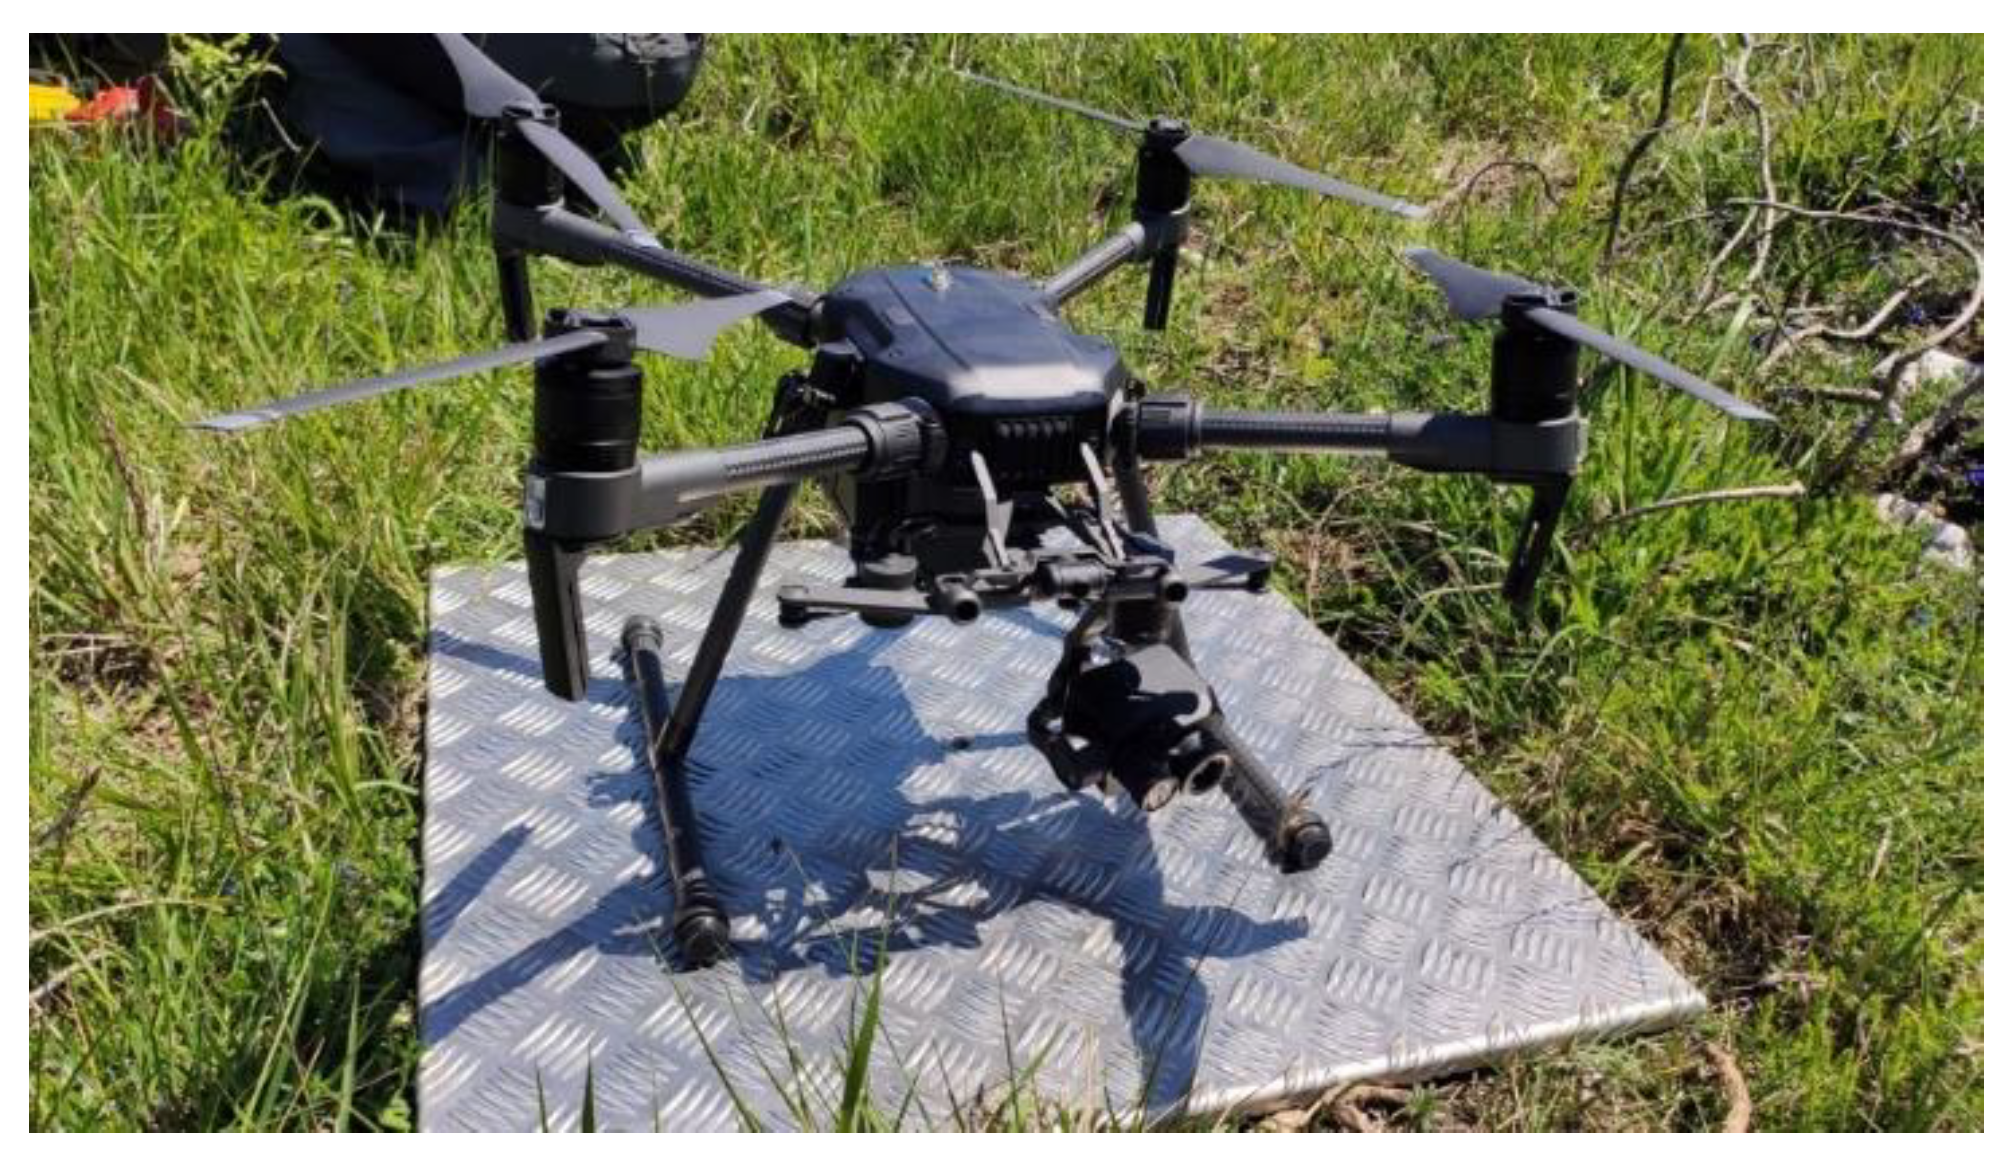
For flight programming, specific UgCS software was used, which allows the designing of flight projects on DTMs and establishing an adaptive flight height; that is, constant with respect to the surface. All this was developed incorporating the flight platform selected for the specific case, DJI Matrice 210 V2 (
Figure 4). Its dimensions are 883 mm × 886 mm × 398 mm when deployed and weighs 4.8 kg. It can carry up to 2 kg of payload as it has double-gimbal support for sensor installation. It offers an autonomy of up to 38 min, speeds of 82.8 km/h and a range of 8 km, thanks to its GNSS system of GPS + GLONASS.
The sensor incorporated in the platform is a DJI Zenmse XT2 radiometric sensor. It is a dual sensor that includes RGB and infrared sensors, and also has Flir’s own Multi-Spectral Dynamic Imaging (MSX) technology installed, for better interpretation of thermal images. It is a low-cost device with the characteristics described in
Table 3.
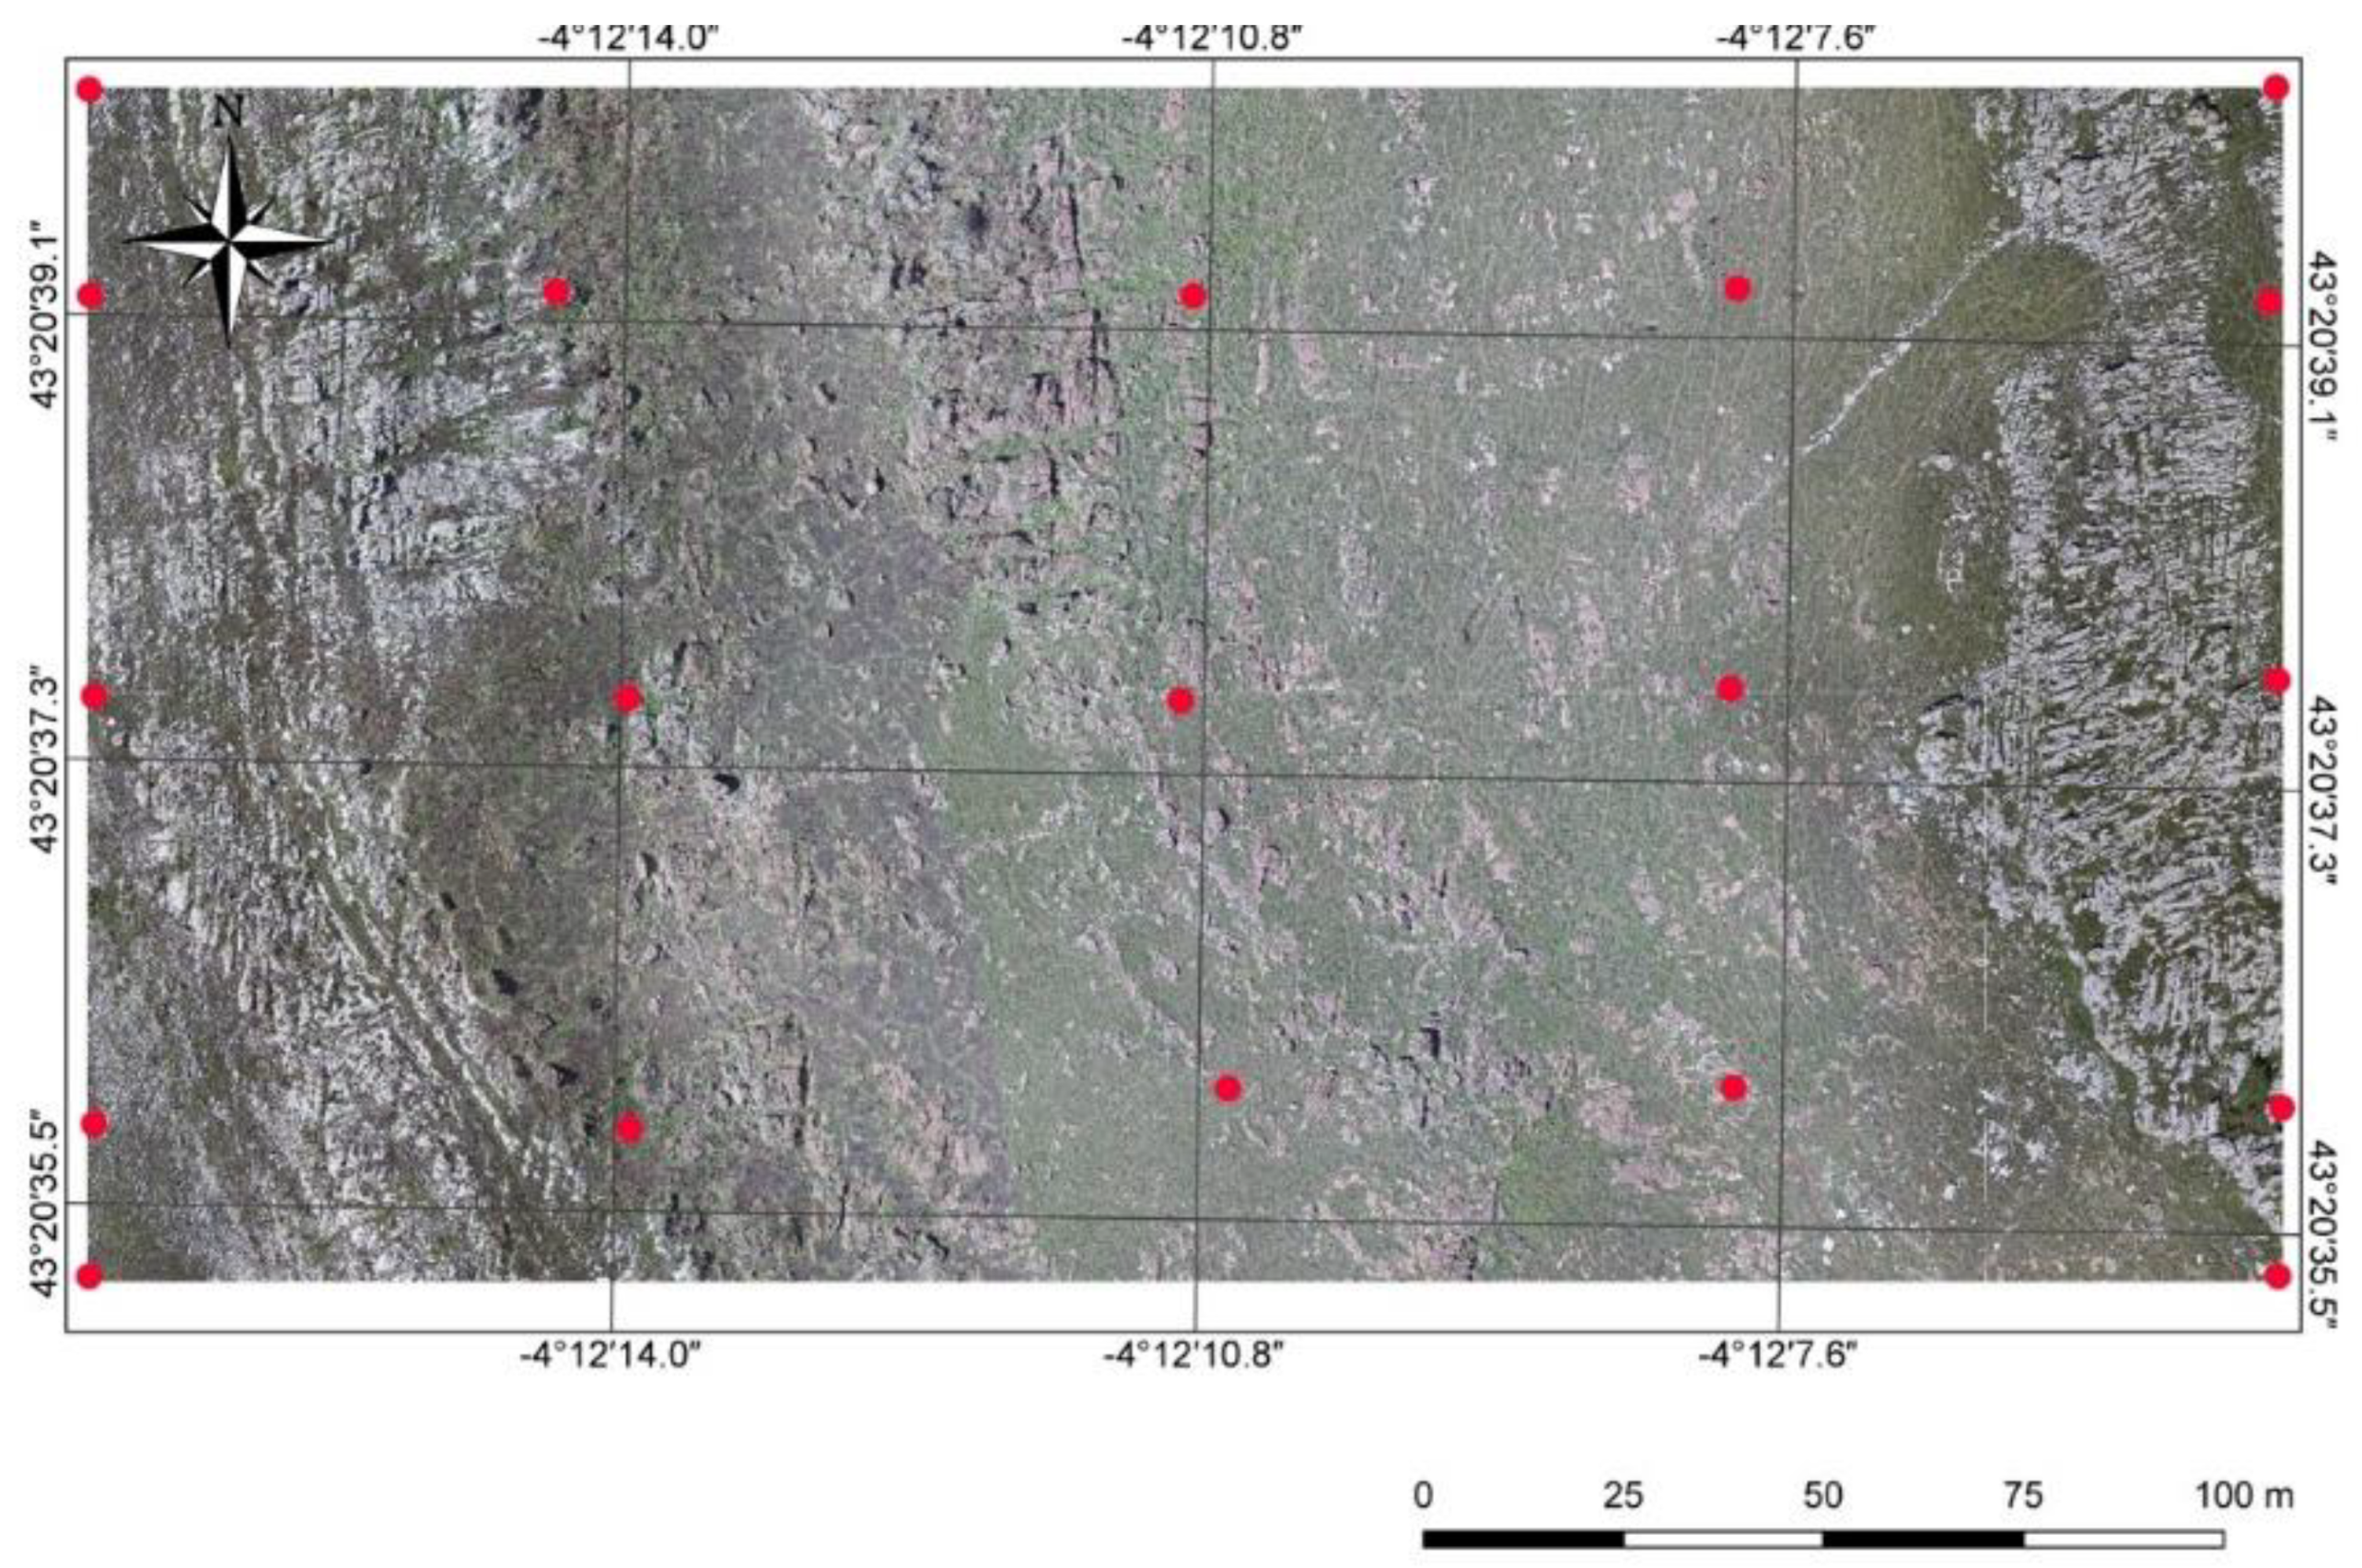
For a correct orientation and scaling of the model, the photogrammetric flight was supported by a total of 19 GCPs distributed uniformly throughout the study area (
Figure 5). The support points were 15 × 15 stainless steel photogrammetric targets, painted with a black and white grid, the coordinates of which were obtained using global positioning techniques (GPS) in the official reference system (ETRS89-UTM Zone 30), which in turn constituted the reference system for the entire research.
The flight took place on 20 May 2021, starting at 15:00 h, with favourable weather conditions and an average temperature throughout the flight of about 21 °C. These conditions were very similar to those during the laboratory test to determine the situation in which the greatest thermal variation between the two rocks was produced. The flight lasted 1 h 32 min and 2405 RGB jpeg images were obtained, as well as the same number of complementary thermal images.
The processing of the images from the photogrammetric flight was carried out using Agisoft Metashape, version 1.7.2. The workflow established in the methodological proposal was used, resulting in the generation of a point cloud with a total of 40,458,511 points, a TIN model with 9,692,656 faces and an orthomosaic with a resolution of 1.38 cm/px. The orthomosaic was generated simply to be able to validate the results obtained by means of photointerpretation techniques.
3.3. Thermographic Photogrammetry
The photogrammetric block of thermal images was taken simultaneously with the RGB one due to the dual features of the chosen sensor. The infrared sensor is characterised by the technical specifications shown in
Table 4.
During the flight, the camera was configured to a high gain mode, an emissivity of 0.9 and an ambient temperature of 22 °C, according to that established by the portable weather station taken to the field.
The set of images was processed applying the same software and hardware used for the RGB images, and a particular workflow induced by the programme’s own processing sequence was implemented. After projecting the thermographic information onto the RGB model, both were geometrically the same, except that the value of each colour of the RGB band was obtained for every point, while for the thermal model the value was correlated with the temperature determined for each point from the thermal images.
The thermal dataset consisted of 2405 raw images in Flir’s own TIFF format. The radiometric resolution of the sensor allows the storing of ranges with values up to 14 bits. The information was directly related to the temperature conversion for each pixel of the image captured by the sensor at the time of image storage. With this information, it was possible to obtain the temperature of each pixel of the orthomosaic from the ratio provided by the sensor manufacturer by applying a reclassification operation applying the tools incorporated in QGIS, an open source platform used throughout the research. The relationship or formula to be implemented for the sensor model used was
where
S is the value of the pixel in 14 bit digital video counts;
Res is 0.4 K per count for low resolution and 0.04 K per count for high resolution; and
Tscene is the temperature of the scene in K.
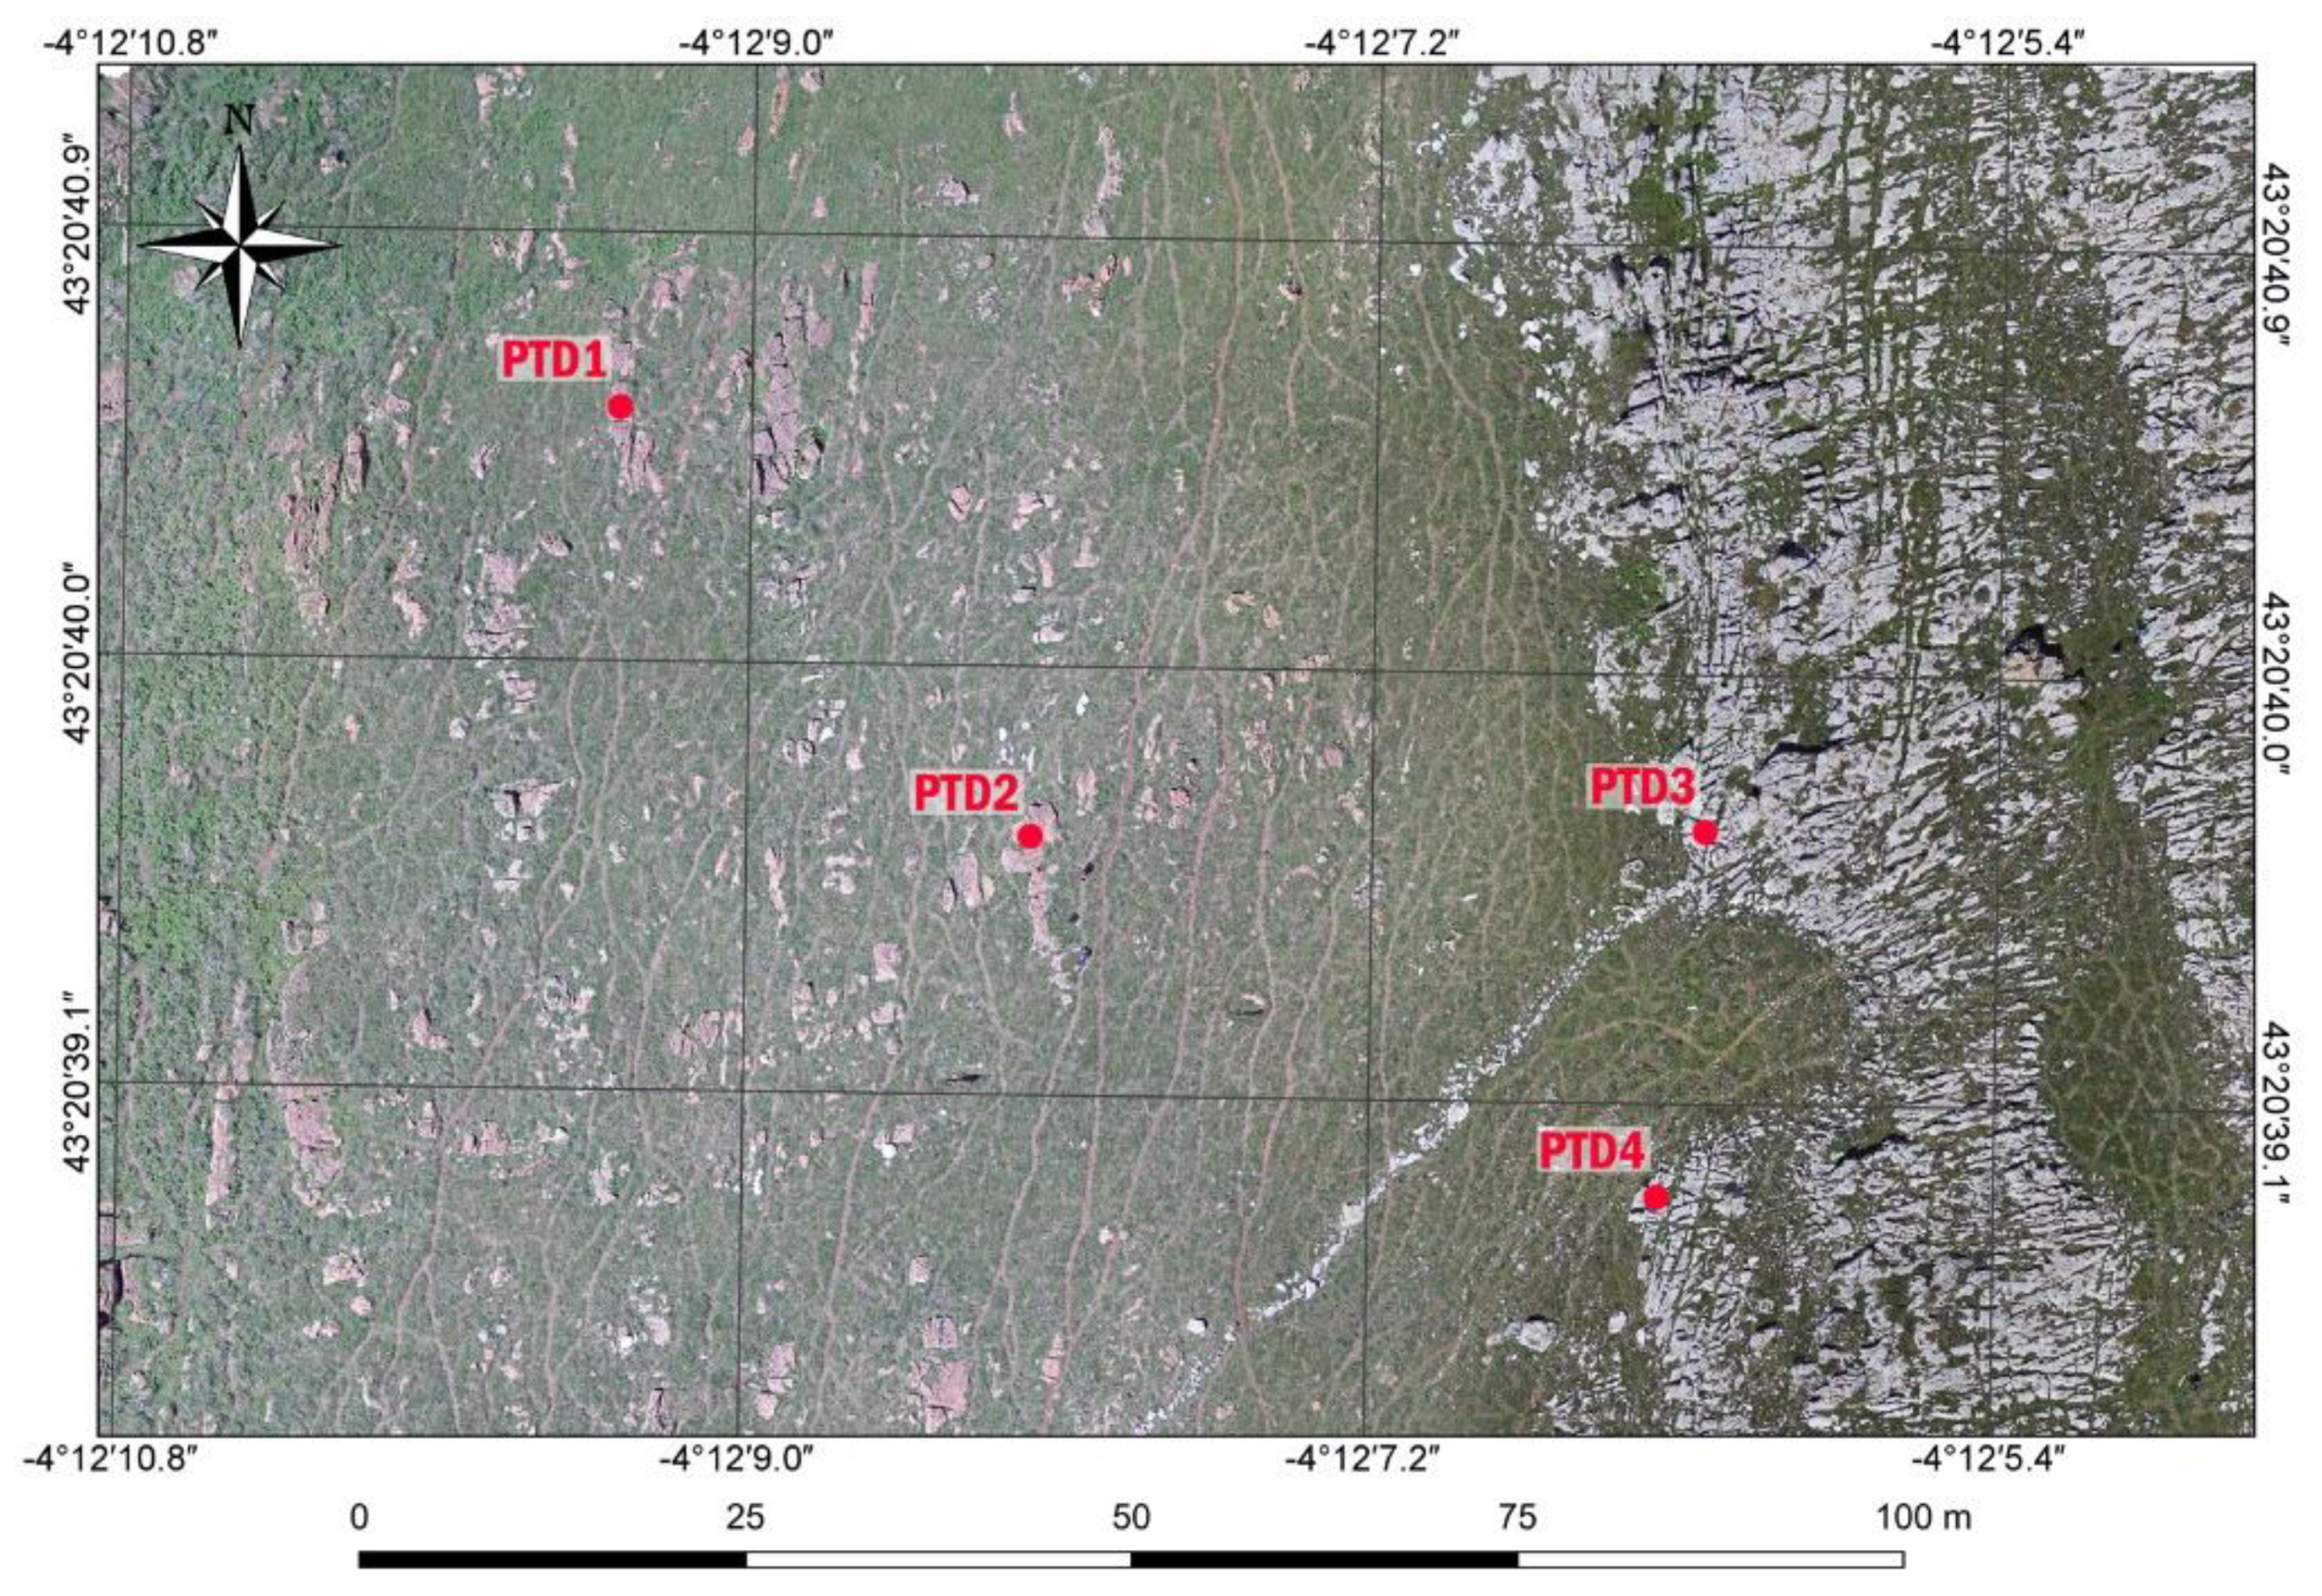
In addition, during the course of the flight, thermal images were taken with the Flir E40 thermographic camera at 4 geolocated check points in the study area: two in the limestone outcrop and two in the dolostone (
Figure 6). These images were obtained to verify the measurements made by the airborne sensor.
The results of the thermographic observations are shown in
Table 5.
Table 5 shows that the results of the temperature measurements in the camera and the orthomosaic were not the same since those recorded with the handheld camera were higher than those obtained with the airborne sensor. The average difference between the measurements at each point was 1.05 °C. Despite this, the thermal difference between the points in the two lithologies was notably higher for both sensors (4.2 °C for of the camera, and 3.8 °C for the airborne sensor), which allowed the identification of the contacts.
From these data, an adjustment of the thermal model was made, in what was previously defined as the second iteration. This adjustment was made by means of a new reclassification of the initial image in which the value of each pixel (temperature) was increased by the average difference obtained precisely between the two sensors. The resulting image introduced a new temperature value in each pixel closer to the real temperature of the rocks. Thus, the second iteration of the raster transformation implemented in the model was
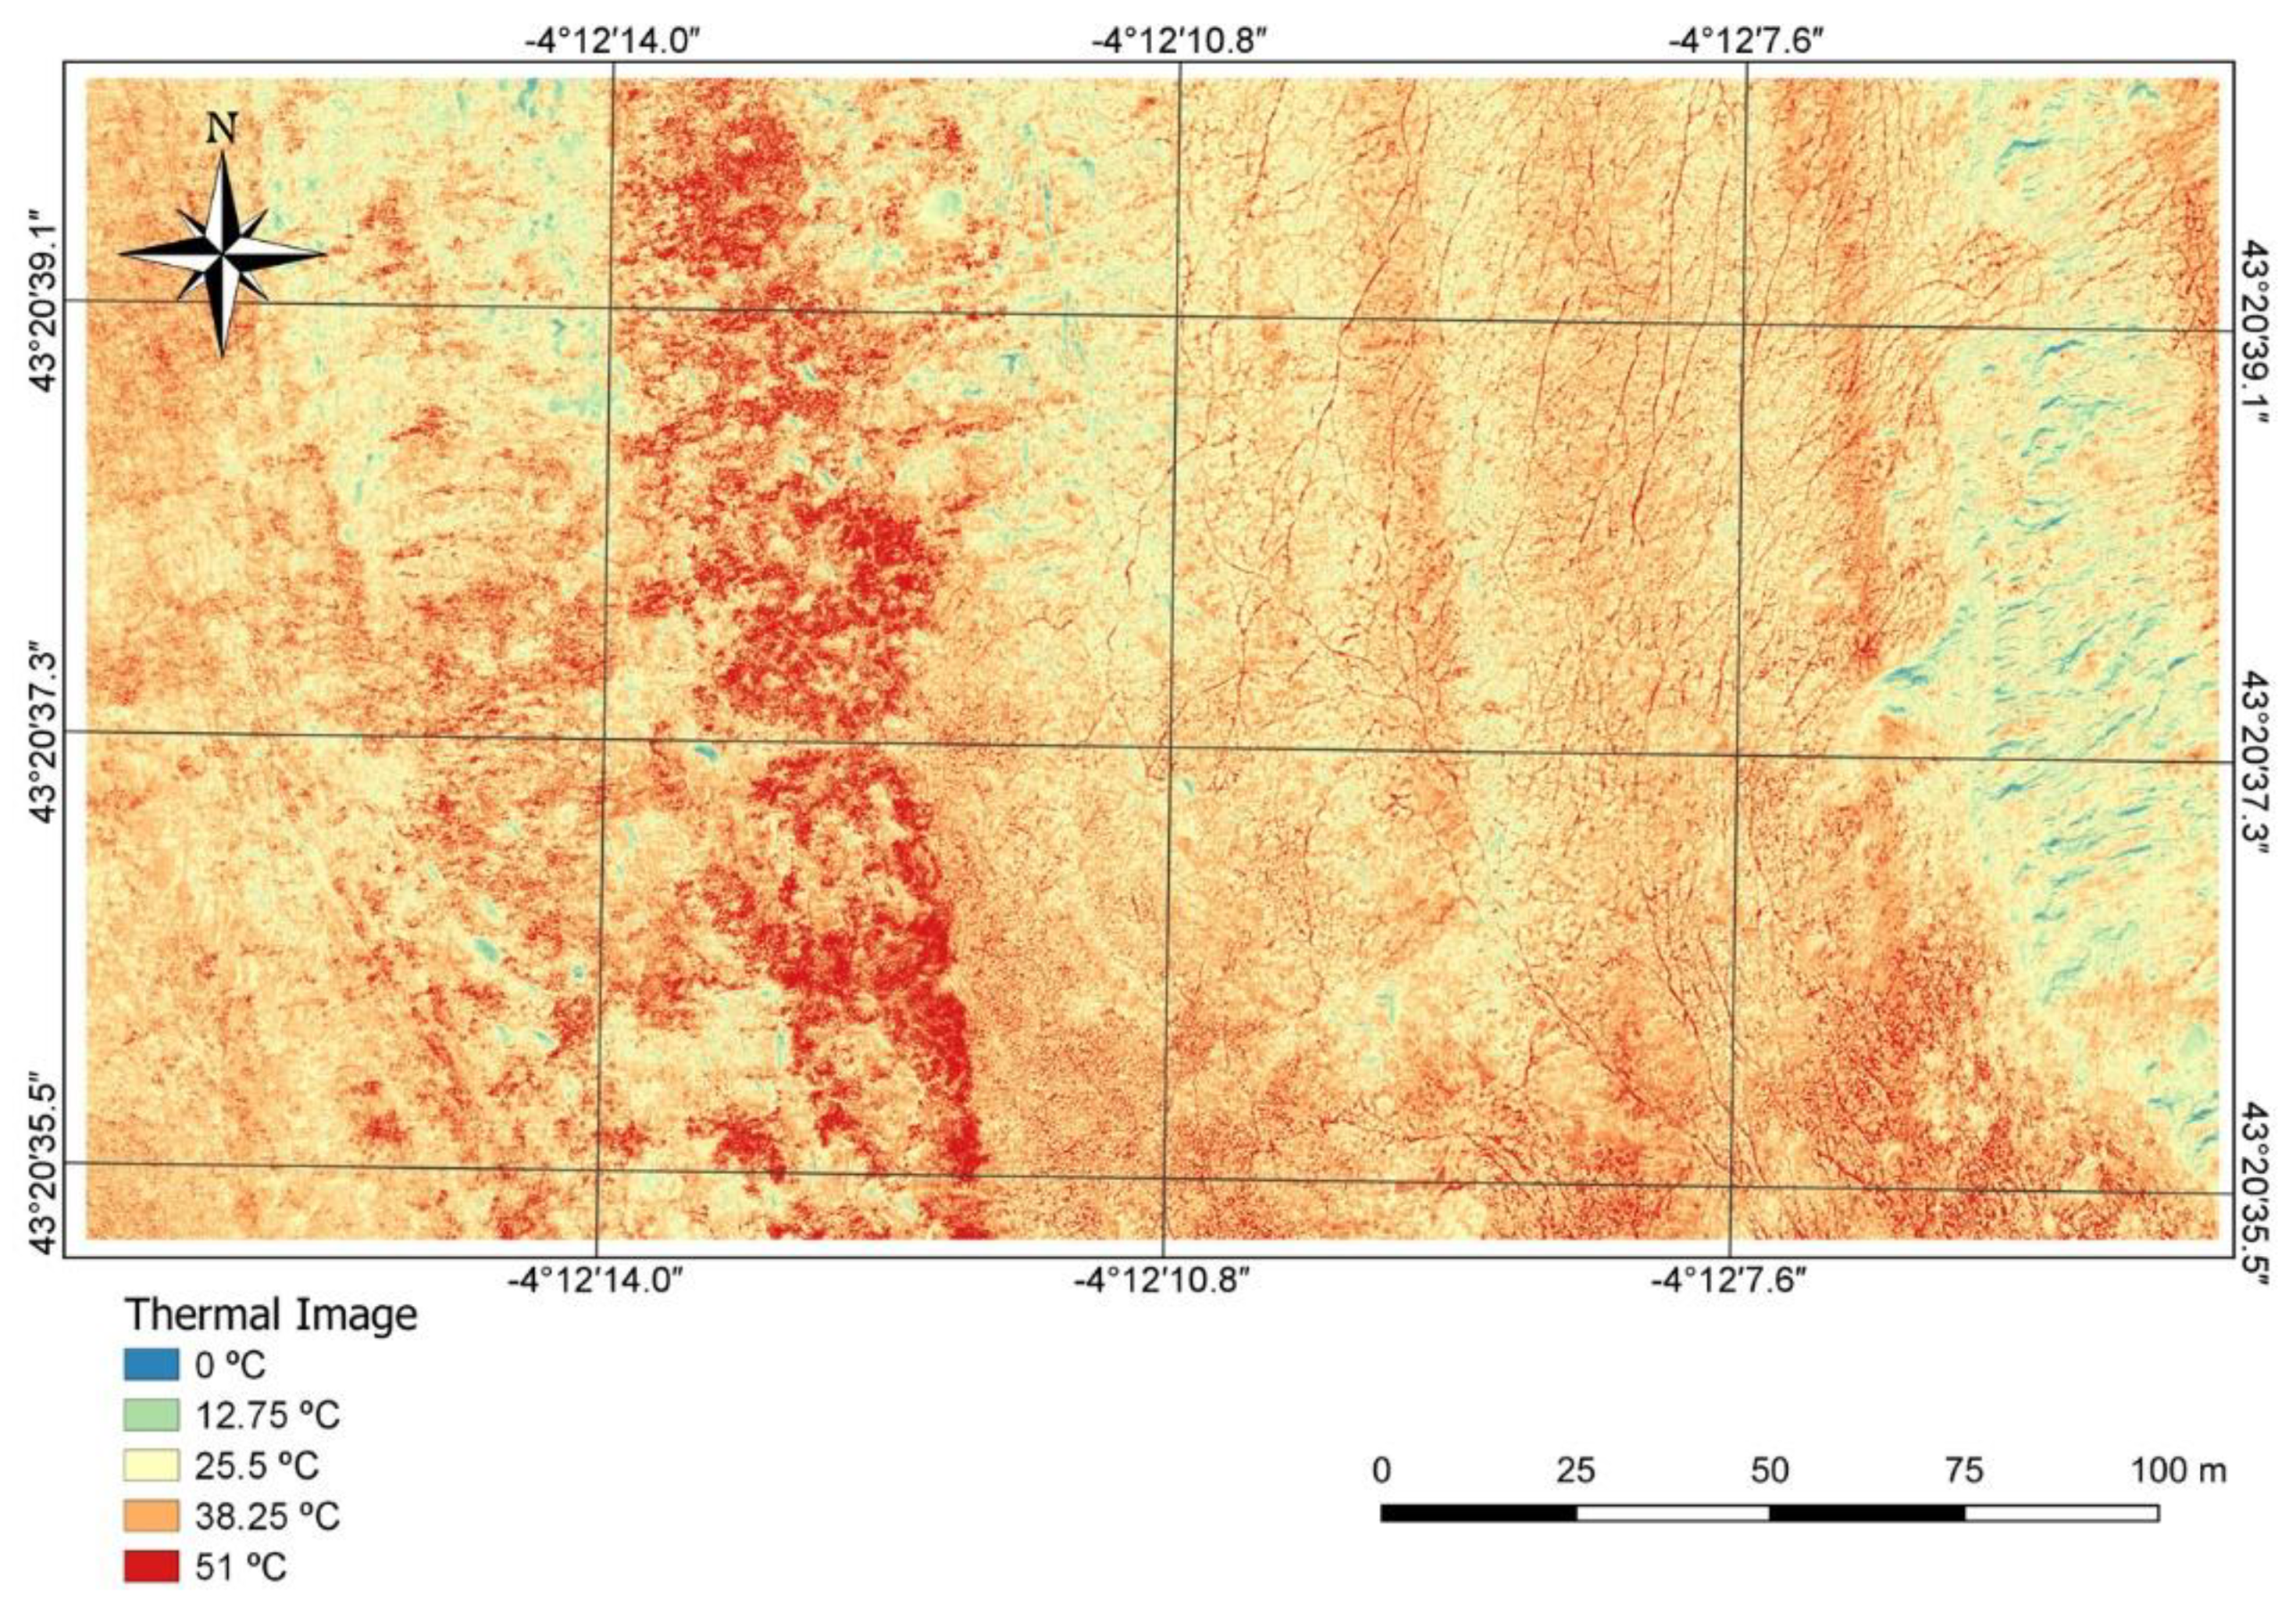
In this way, the final thermal map of the area under study was obtained (
Figure 7).
3.4. Thermographic Analysis
With the orthomosaic (map) in the QGIS platform, the thermographic analysis leading to the identification of the contacts of both lithologies on the surface could start. A preliminary analysis consisting of the interpretation of the colours assigned to each pixel (depending on the temperature) gave a first delimitation based on thermal (colour) variations. Since the contact was not as clear as in the RGB case, where the chromatism of the two lithologies made an unequivocal difference, this research proposed to automate the analysis to improve the results although not without supervision. As established in the methodological proposal, the automation carried out a segmentation of the image, which allowed the surface of both lithologies and their boundary to be identified.
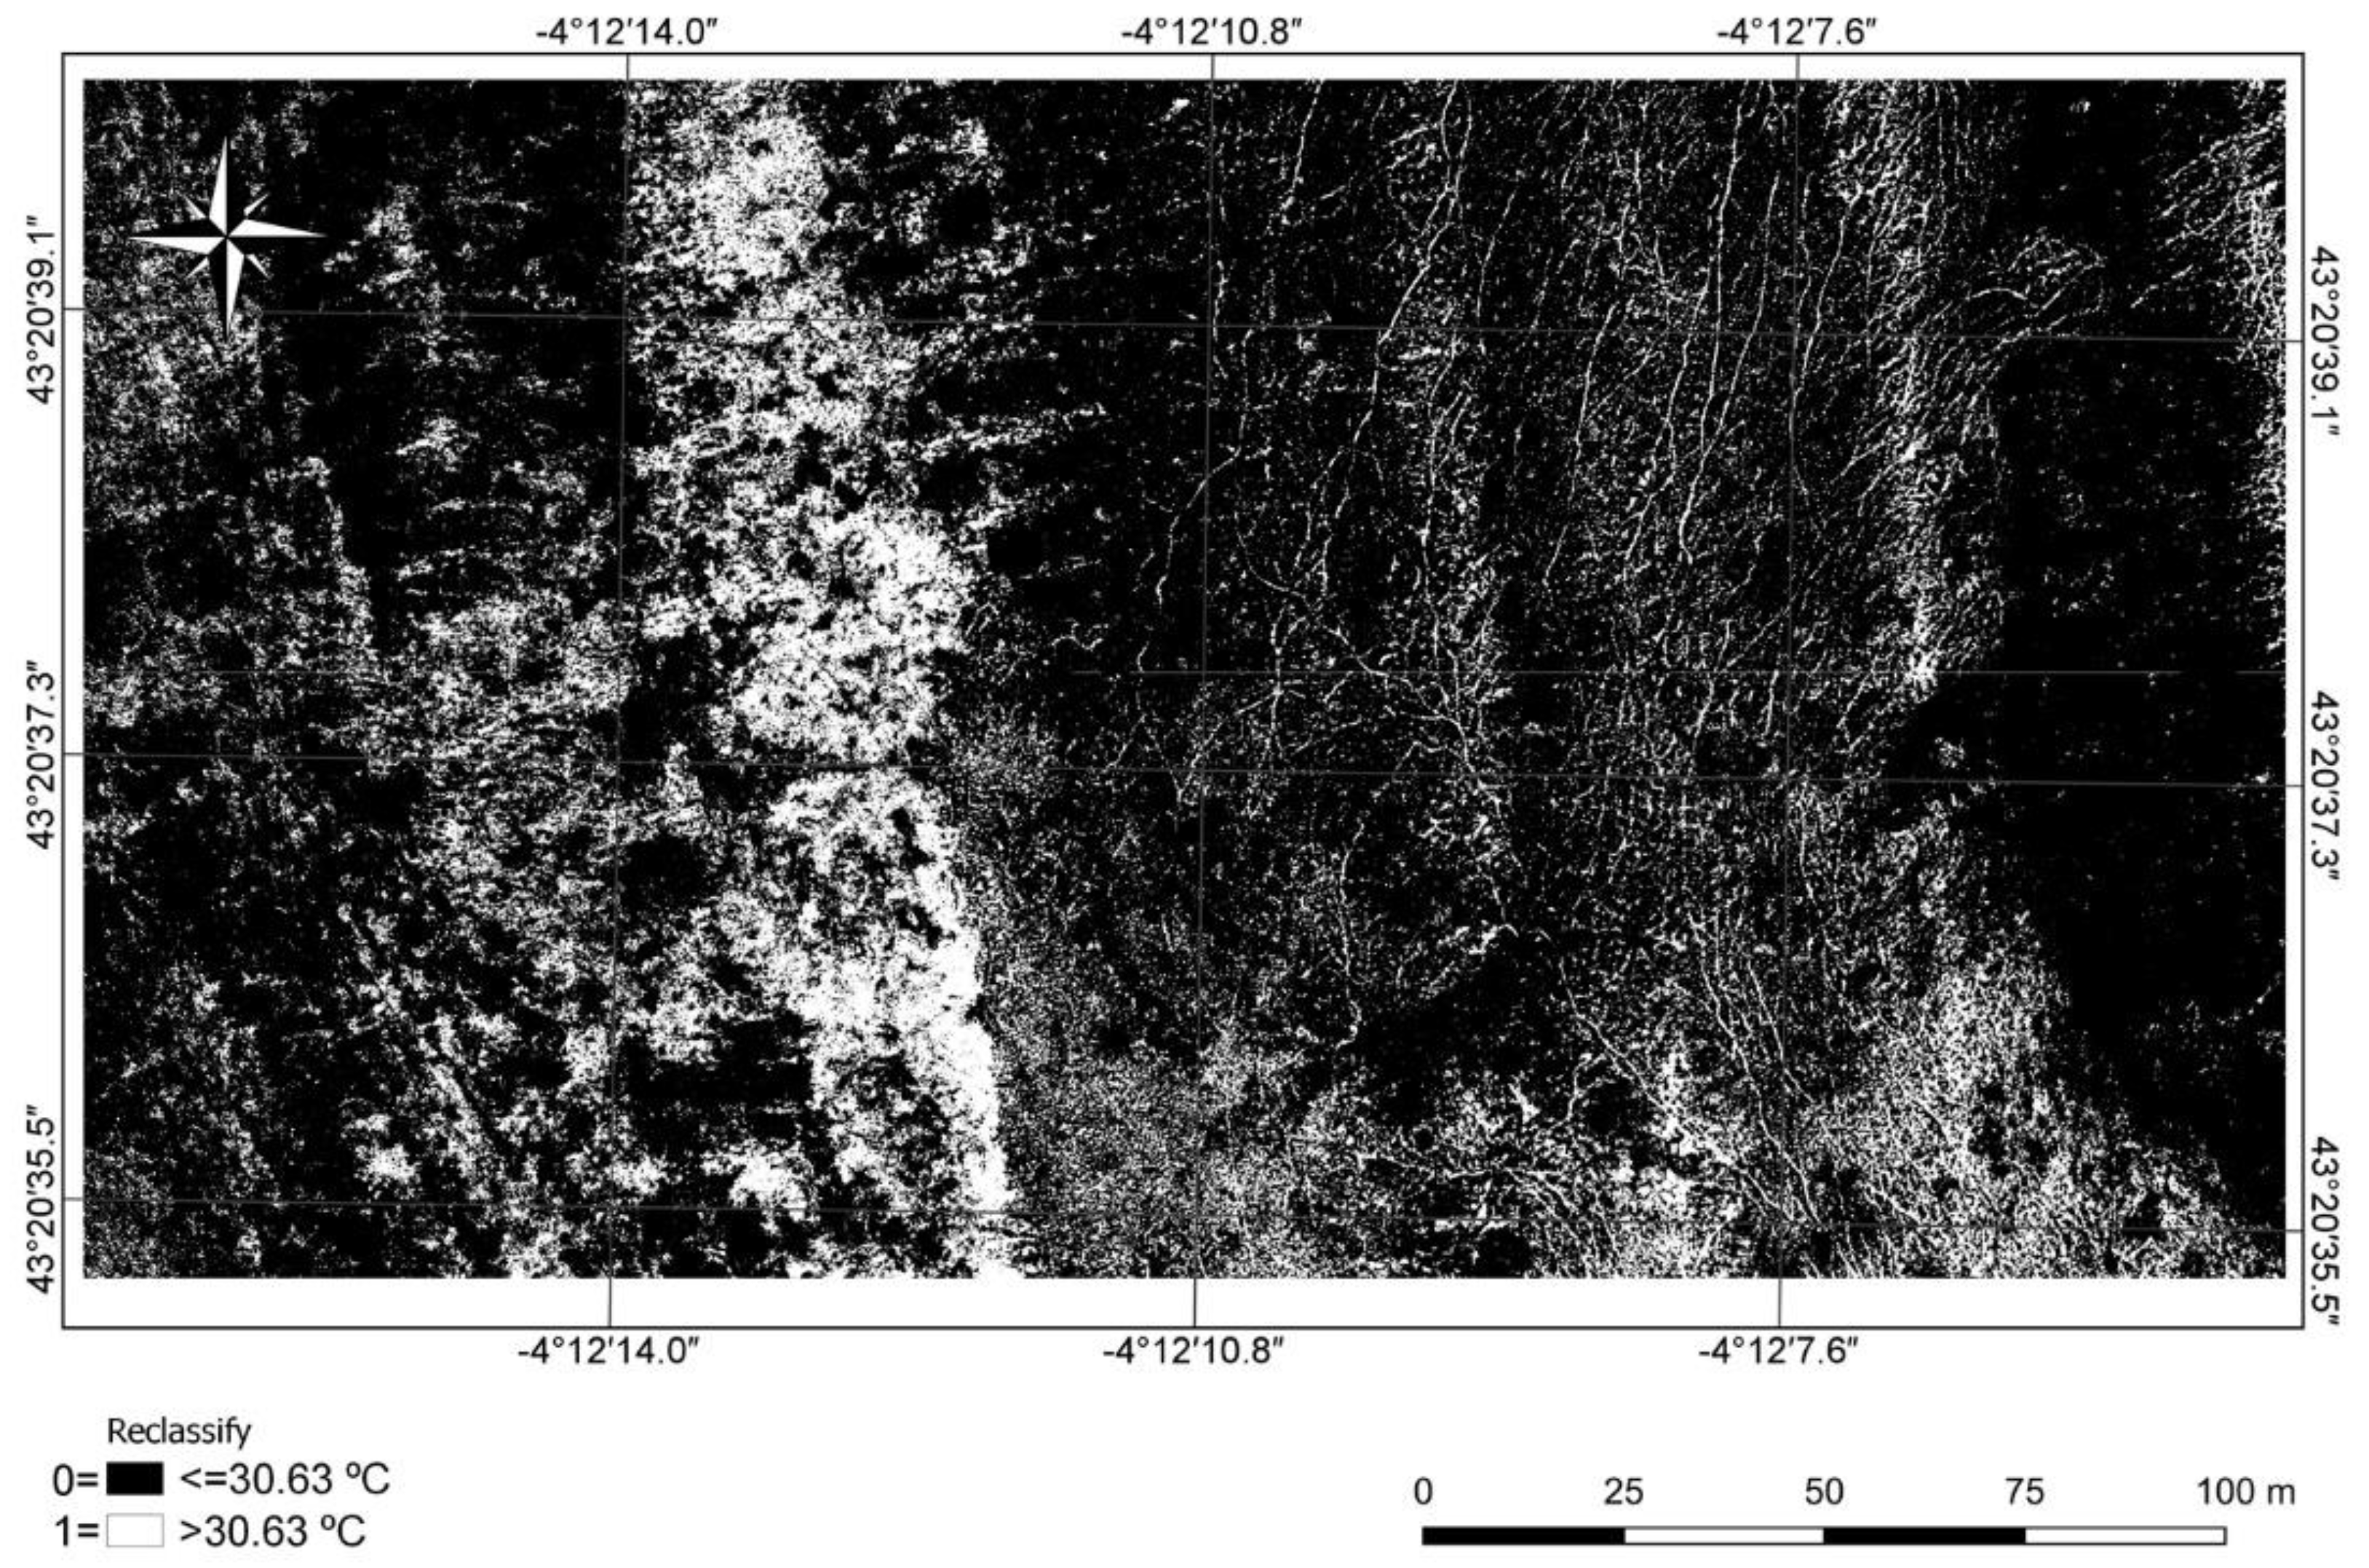
As described above, the hand-held camera measurements showed that the dolostone was at an average temperature of 33.48 °C during the flight; whereas the laboratory test with similar conditions established an average thermal difference of 5.7 °C. Continuing with the methodological proposal of the research, it was established that the limit temperature to allow a distinction between limestone and dolomite rocks was 30.63 °C.
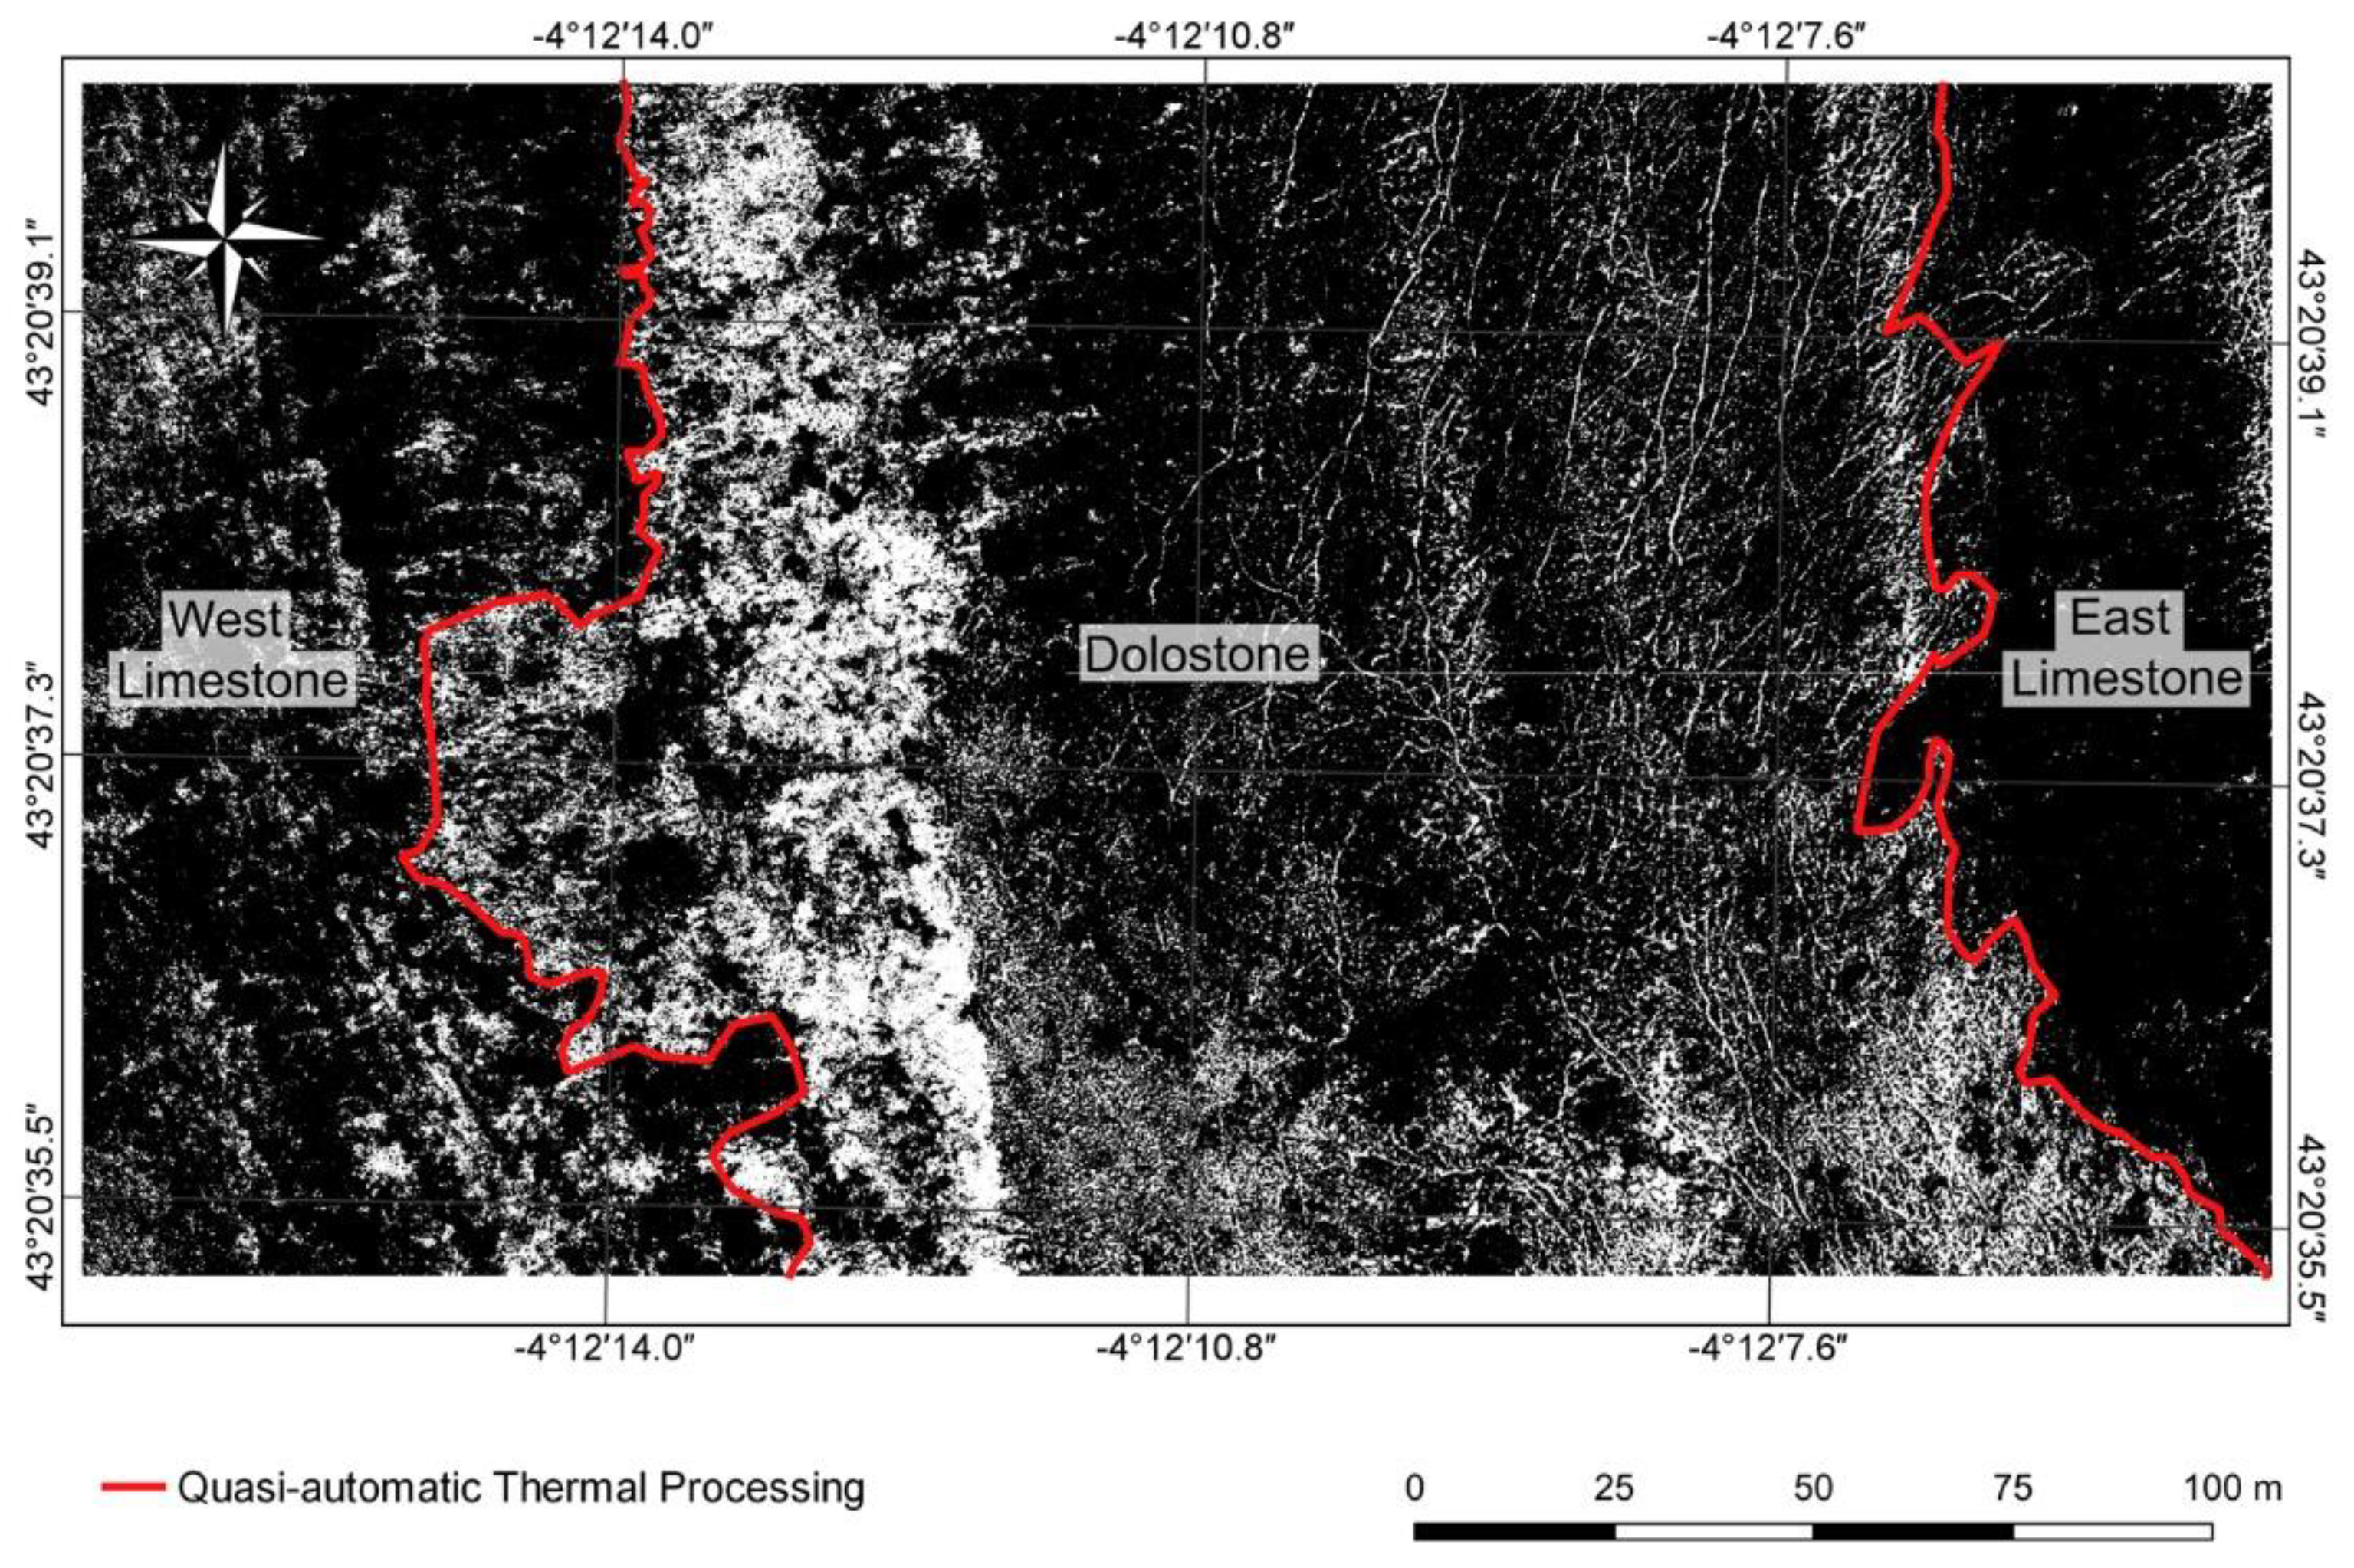
Using QGIS, a value of 0 was assigned to map pixels that had a value equal to or less than 30.63 °C, and 1 to those with a higher value. The result of the operation was a new map in which pixels with a value of 1 were represented in white and those with a value of 0 in black (
Figure 8).
On the new map, the main outcrop zones of both limestone and dolostone lithologies can be identified. The eastern part of the image, with a large black block, represents the limestone, while the large white spot in the centre corresponds to the dolostone outcrop. This duality of colour allows a simple and quick photo-interpretation of the map to delimit the lithologies and establish the contacts between them, as can be seen in
Figure 9.
3.5. Validation of Results
As established in the methodological proposal, the same validation analysis was carried out using two other techniques: detailed geological mapping and RGB map photointerpretation. All this was carried out in this specific case due to the chromatism of both lithologies, as can be seen in
Figure 10.
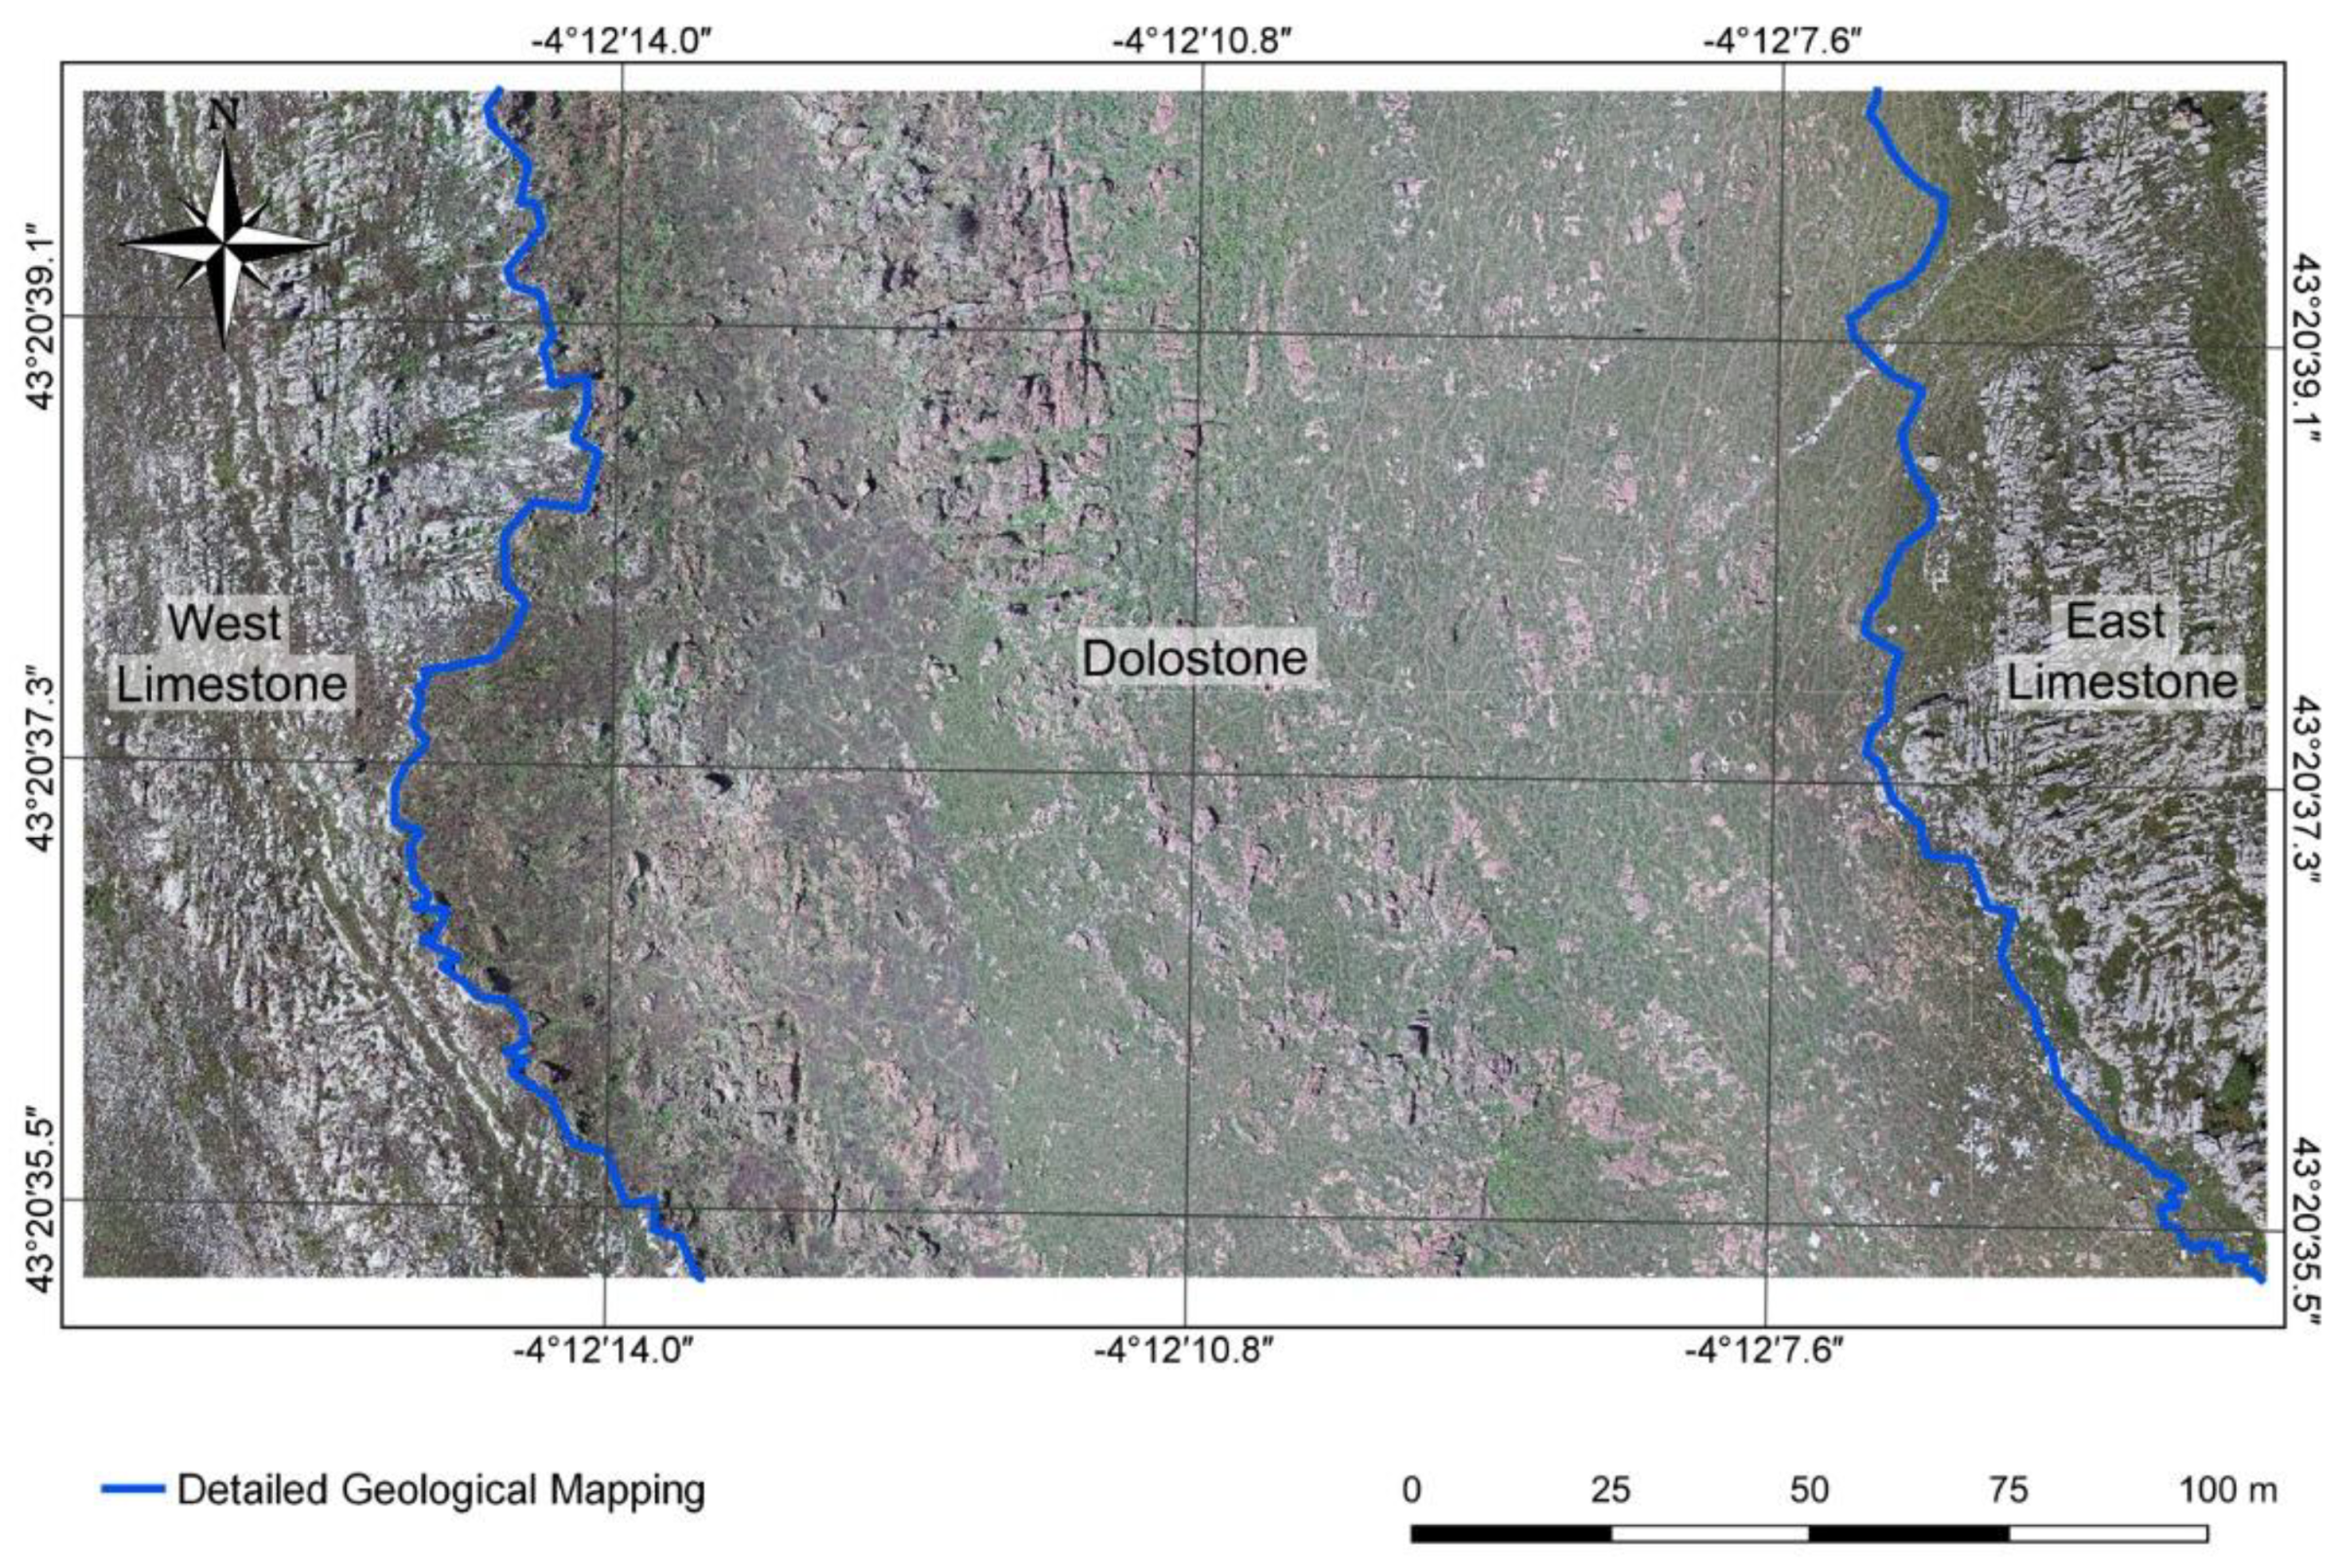
Detailed geological mapping was carried out by traversing the contact between the two lithologies, in which the coordinates of points spaced 2 to 3 m apart along the contact itself were obtained using global positioning techniques. A total of 257 points distributed along the upper and lower contacts of the outcrop in the area under analysis, were recorded. The points were taken using the GPS/RTK method in the reference system adopted for the whole investigation. The Leica Ski-pro software was used to process the GPS data. Subsequently, a set of points was imported into QGIS, creating a vector layer with the contacts, as shown in
Figure 11.
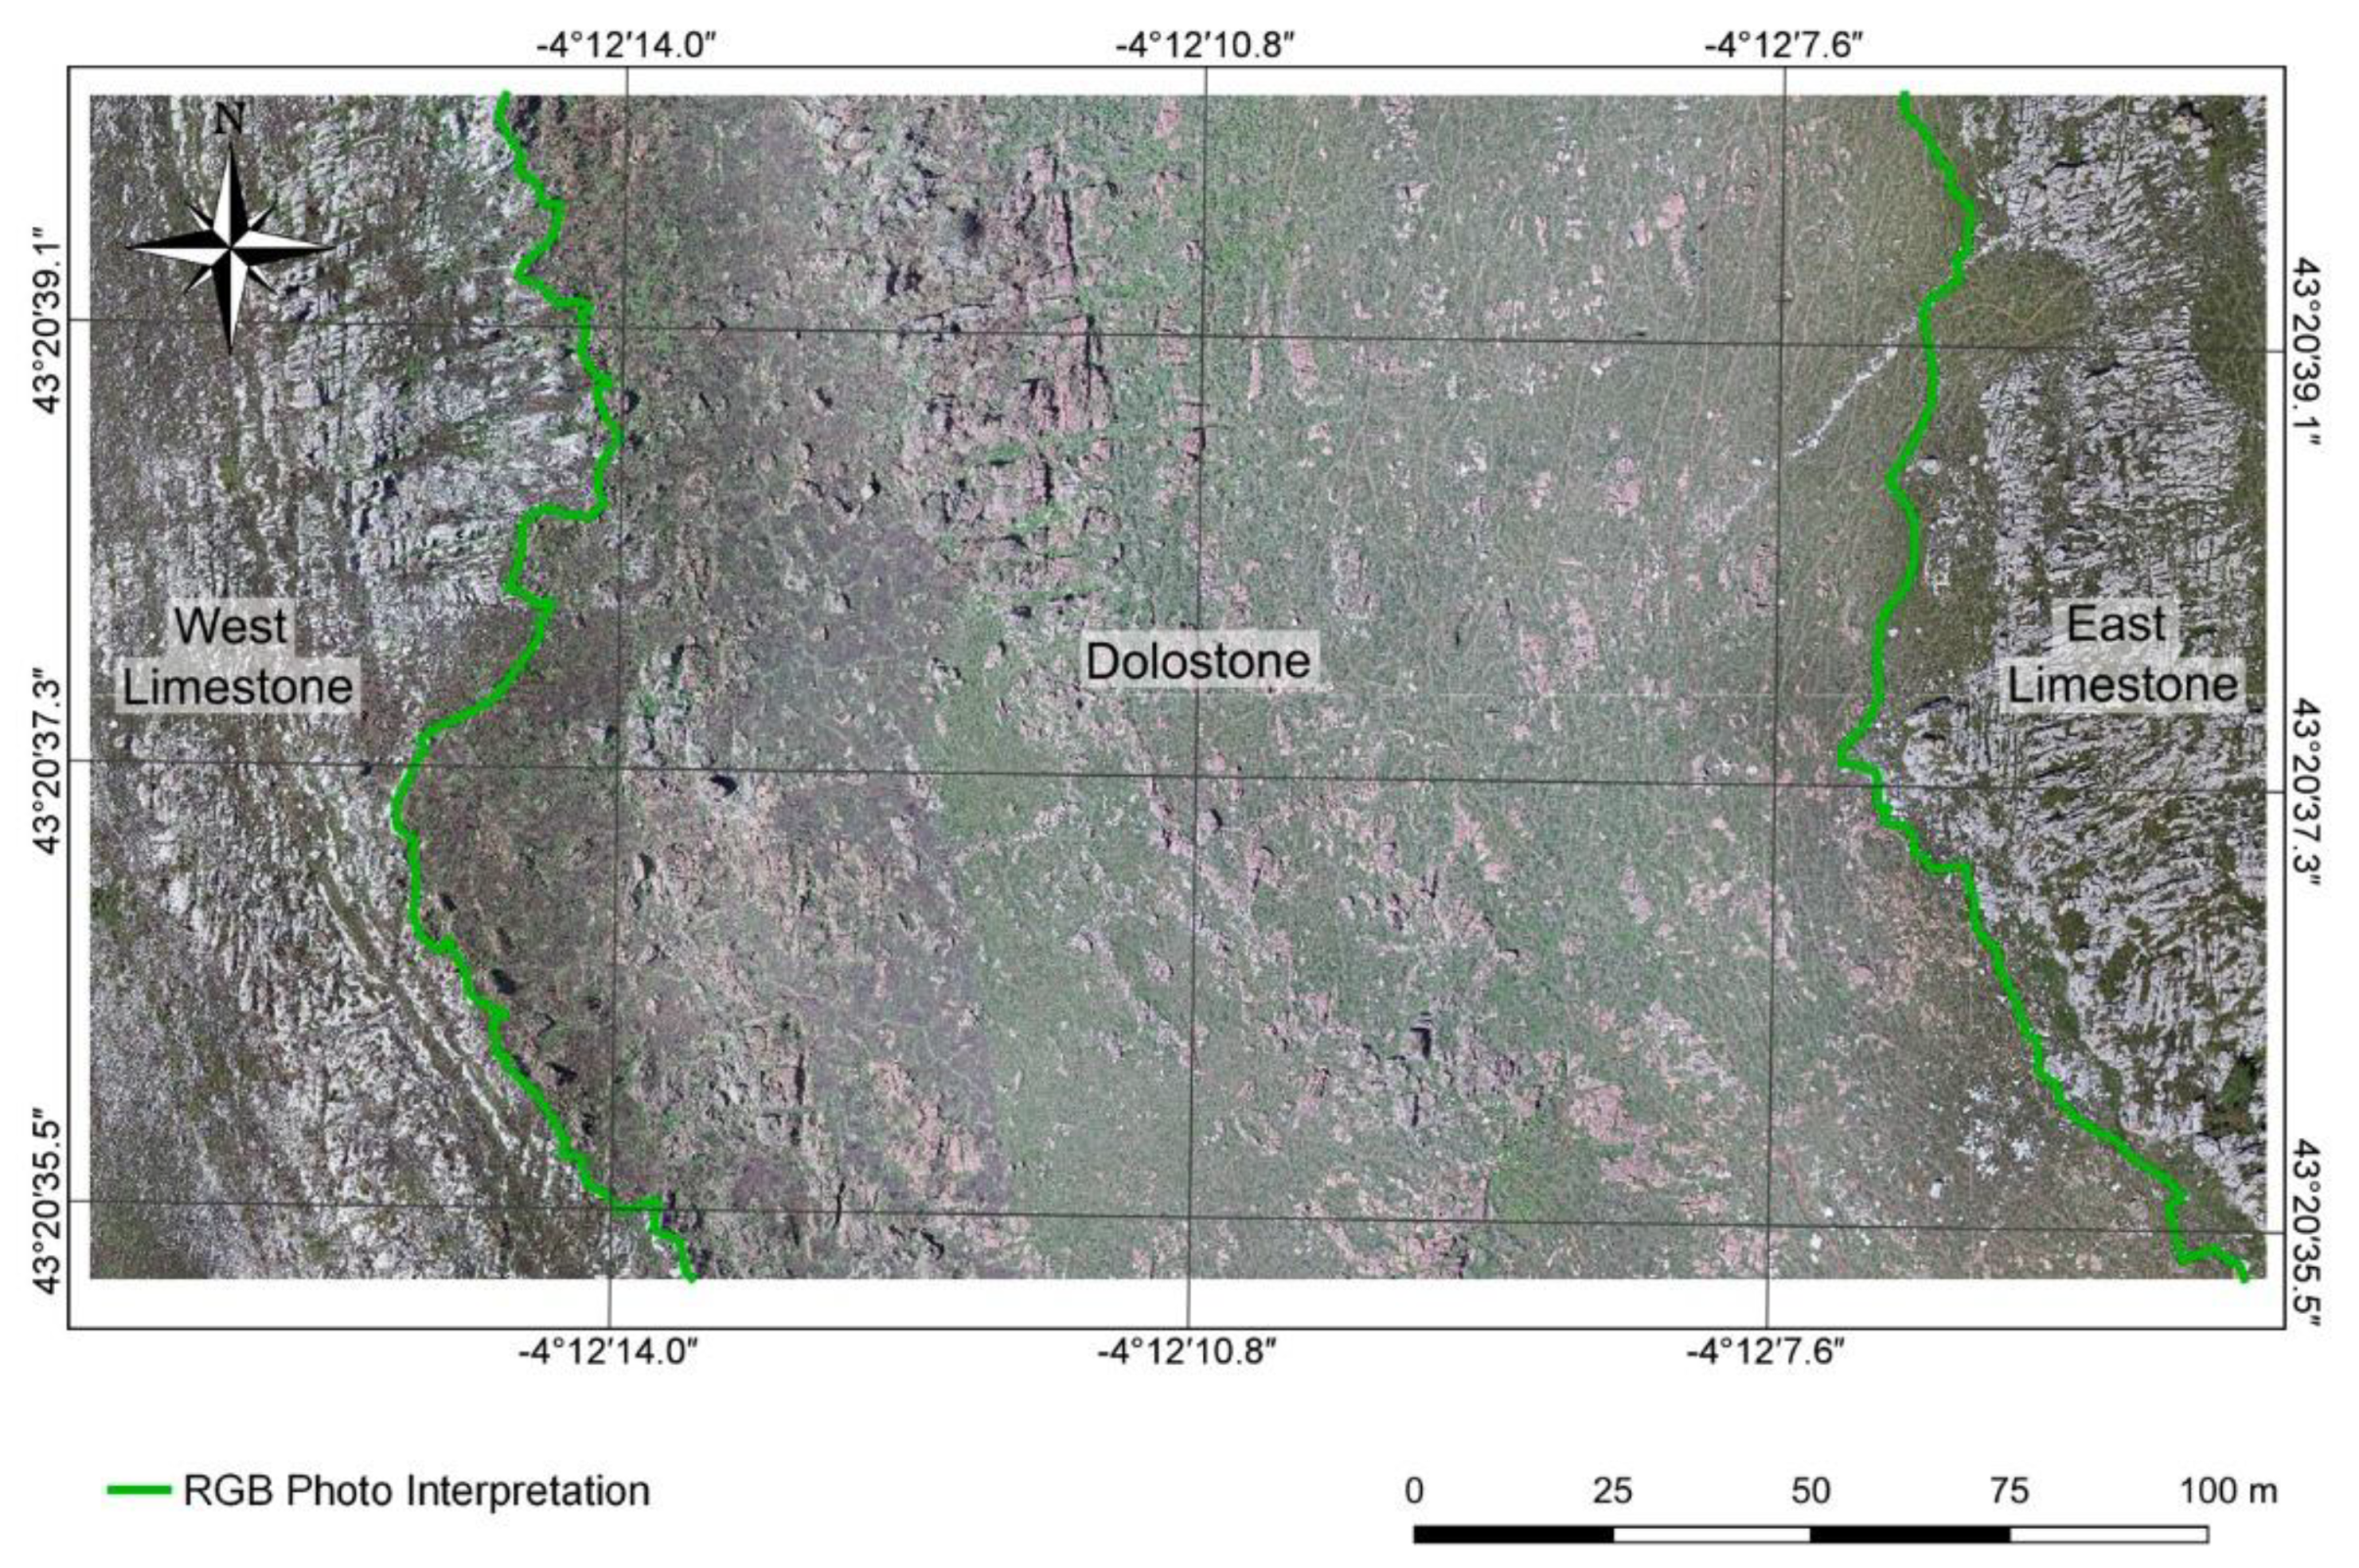
Simultaneously, photo-interpretation activities to identify the lithology contacts were carried out on the RGB map. For this purpose, it was imported into the QGIS map, and the upper and lower contacts were delimited, as shown in
Figure 12.
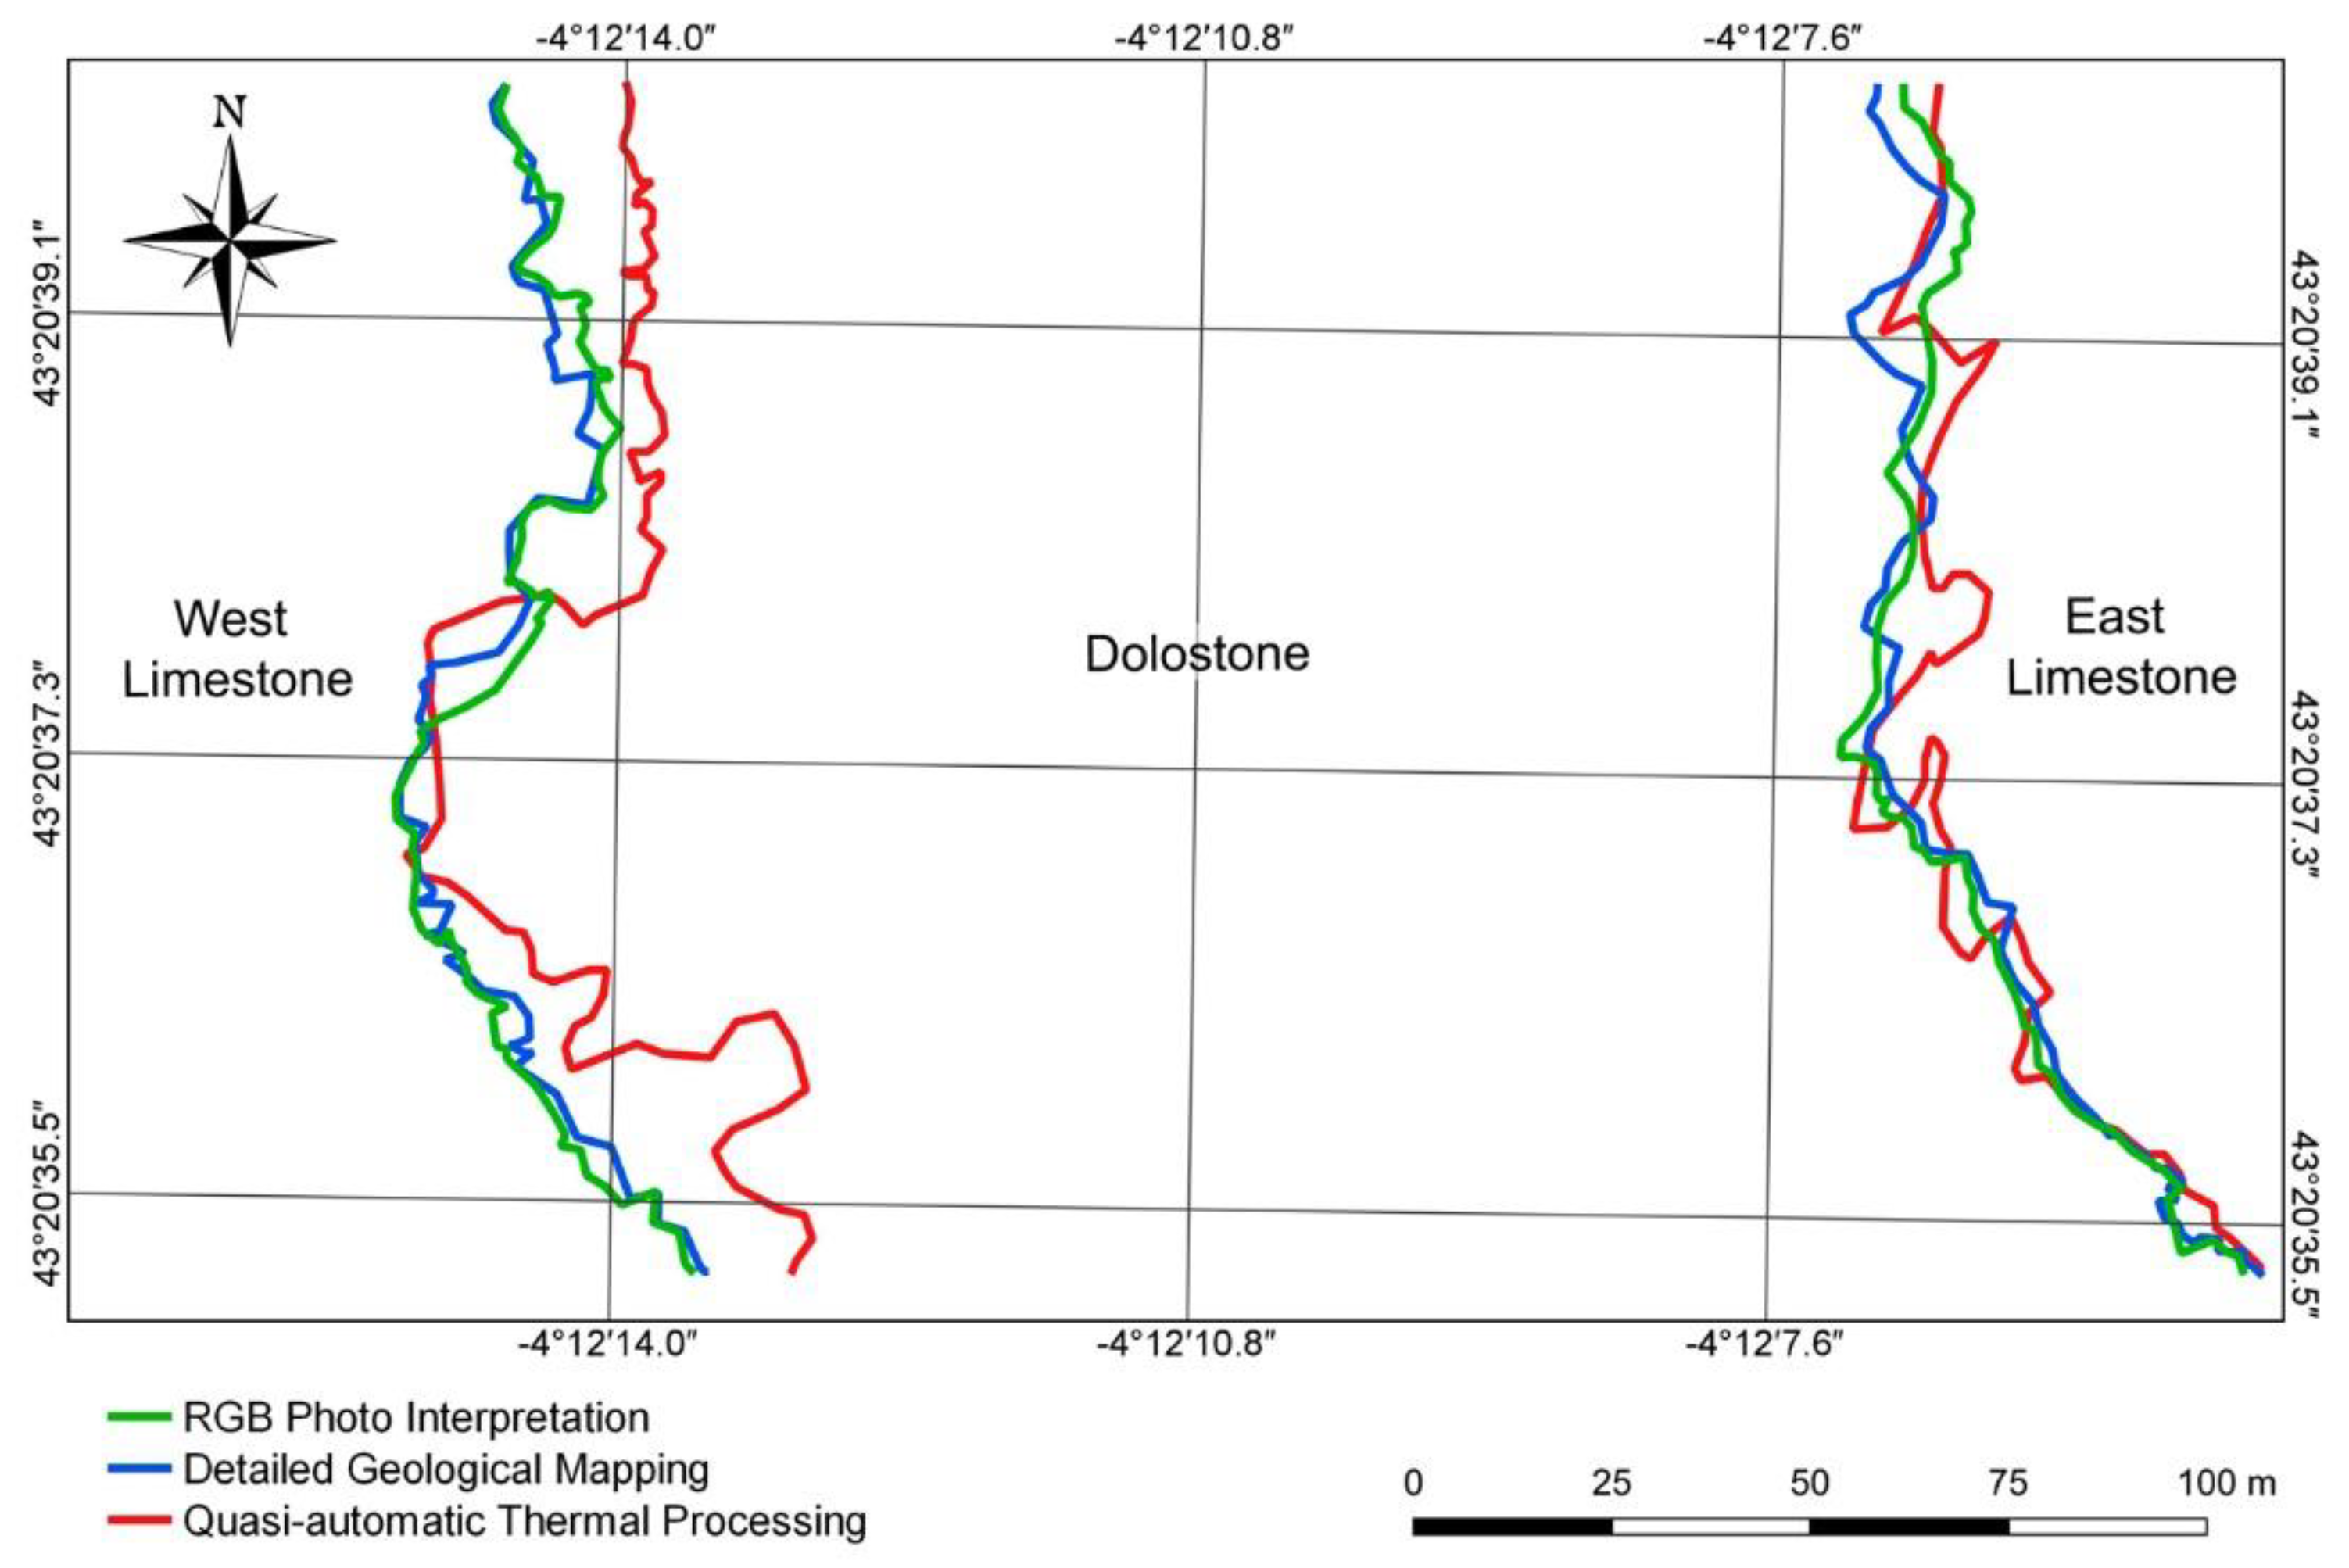
A set of vector layers in QGIS representing the contacts between the two lithologies was obtained from the different processes. Because various techniques were used to identify the change in lithologies, differences can be seen (
Figure 13).
In general, a certain similarity was observed between the upper and lower contacts delimited by the three methods. There was strong coincidence between the photointerpretation of the RGB image and the detail mapping. The lines generated from the thermal information also showed a similar delimitation but not exactly the same.
To evaluate the results, the dolostone area delimited by the contacts within the rectangle under study was compared because it is the lithology with the greatest mining interest for resource modelling. The corresponding areas were determined in the GIS based on the contact lines defined by each method. The area delimited by the detailed geological mapping was adopted as a reference for the comparison of results (
Table 6) because it was the most precise and proven method.
In general, there was a high similarity between the results of the RGB photointerpretation method and detailed geological mapping with a deviation in the susceptible surface of interest of about 0.99%. The result of the thermal imaging presented a lower similarity, with a deviation of 4.57%. In both cases, the deviations were negligible at the mineral prospecting stage for which this research is planned.
4. Discussion
Once the practical application of the proposed method had been carried out, and in view of the results obtained from a comparison of the delimitations of the area of possible mining interest by means of the new proposal and the two common methods, the following interpretations are proposed:
Before making the photogrammetric flight, it is essential to carry out the test with real samples of the different lithologies to be surveyed. Without these tests, the real thermal behaviour cannot be known, which means that it will not be possible to determine the limiting temperature between them or the most appropriate time of day to carry out the flight.
The design of the flight with a thermal sensor is much more demanding than one with an RGB sensor since the resolution of the second sensor is generally better than that of the first. In the case of low-cost dual sensors, this forces the flight parameters to be adapted to the lower resolution sensor.
Thermal image processing is also significantly different from RGB image processing. In this sense, the approach of traditionally processing RGB images and using the orientation parameters for thermal image processing greatly facilitates the processing of thermal image blocks. Moreover, it provides very satisfactory final results, where the orthomosaic/map/image identifies the starting thermal information for each pixel.
GIS tools allow several logical operations to be performed on the map. In the proposed case, the first one converts the thermal information recorded by the sensor into temperatures, and the second one corrects the deviation in the sensor mounted on the UAV caused by possible atmospheric corrections and height/resolution problems. Both operations are essential for optimal results since without them the interpretation of the thermal image would be inaccurate.
The use of GIS tools is of vital importance for the development of the proposed method as they allow the interpretation of the final thermal map. In addition, they facilitate an operation that is generally done visually, given that they reduce the range of colours that the operator has to interpret and also make it possible to significantly improve the time required to carry out the analysis.
The validation of results established deviations in the area estimated as a possible zone of mining interest on the order of 4.57% compared to the detailed geological mapping. This deviation is totally acceptable, especially when carried out very early in the prospecting stage to determine large areas of interest that will later be complemented with direct prospecting methods. The main limitations that emerged during the research were mainly in three areas. The first was the lack of versatility of low-cost sensors in format, thermal information and temperature conversion. The second relates to the presence of vegetation in the survey area, which contaminates the temperature measurement and generates areas of lower contrast, making subsequent analysis difficult. Finally, the determination of the thermal limit, which from an empirical point of view had been adequately resolved, was in reality not a strict limit as there was a thermal transition zone in the rocks.
5. Conclusions
Mineral prospecting is a fundamental stage in the search for new resources to satisfy a growing demand, and for this the emergence of UAV platforms and low-cost thermal sensors has brought great advantages. The new method proposed for the identification of different lithologies can be considered as an example of these potential contributions because it represents, in the first instance, a simple, economical and fast alternative for their delimitation.
The tools included in GIS environments allow the reclassification of thermographic maps obtained from UAVs and low-cost thermal sensors. These tools provide a new thermographic map that is much simpler to analyse, and allows quasi-automatic recognition to be carried out, as proposed in this research. From analysing the results, the deviations between the proposed method and more traditional ones were negligible at this early stage of mining prospecting, which satisfied the objective of this research.
The method proposed as a result of the research has great advantages over traditional prospecting techniques, such as its simplicity, lower costs and shorter time. Detailed geological mapping is the most precise technique, but it is also the most resource-consuming, and photointerpretation requires a chromatic difference between the lithologies to be prospected, which is not always the case.
In short, the use of airborne infrared sensors on UAV platforms in mining prospecting activities has great potential. It allows research work to be taken a step further, obtaining results quickly and economically. In addition, it can be applied in complex and inaccessible areas.


 ,
, 


