Article

Analysis and Optimization of Grinding Performance of Vertical Roller Mill Based on Experimental Method

1
School of Mechanical and Electronic Engineering, Wuhan University of Technology, Wuhan 430070, China
2
Hefei Zhongya Building Material Equipment Co., Ltd., Hefei 230601, China
3
Hefei Cement Research & Design Institute Co., Ltd., Hefei 230601, China
*
Author to whom correspondence should be addressed.
Minerals 2022, 12(2), 133; https://doi.org/10.3390/min12020133
Submission received: 4 January 2022 / Revised: 19 January 2022 / Accepted: 20 January 2022 / Published: 23 January 2022
(This article belongs to the Section Mineral Processing and Extractive Metallurgy)

Abstract

:
This work concentrates on the energy consumption and grinding energy efficiency of a laboratory vertical roller mill (VRM) under various operating parameters. For design of experiments (DOE), the response surface method (RSM) was employed with the VRM experiments to systematically investigate the influence of operating parameters on the energy consumption and grinding energy efficiency. The prediction models of energy consumption ( E c s ) and grinding energy efficiency (η) were established respectively with the operating parameters (loading pressure, rotation speed and moisture content). Analysis of variance (ANOVA) was performed to obtain useful knowledge in designing operating parameters. Moreover, the multi-objective optimization design (MOD) method was conducted to seek out the optimal parameters of the VRM, and a set of optimal parameters was gained based on the desirability approach by Design-Expert. It is proved that the optimized prediction results match the experimental results well, which indicates this research offers a reliable guidance for reducing energy consumption and improving grinding energy efficiency.

1. Introduction

Mineral crushing is highly energy consuming, accounting for about 35–50% of the total cost and 1.8% of the global electrical energy consumption [1,2]. Therefore, energy-efficient grinding technologies have become the main focus of the industry, especially in the cement industry with large-scale plants. Until now, various types of crushing equipment have been developed to meet the requirement of the industry, such as jaw crusher, cone crusher and vertical roller mill i.e., VRM [3,4,5]. Among these devices, VRM plays an important role in cement, accounting for more than 55% of China’s cement raw meal market [6], and its performance directly affects the cost of producing cement. VRM has the functions of grinding and powder selection, including a grinding unit and an air classifier, and can be divided into two categories, one air-swept and the other an overflow type without air involved [5].
A review of the literature shows that there are numerous studies on energy consumption comparing conventional grinding systems and VRM in cement plants. It is worth noting that the VRM could save 30% energy in cement grinding [7,8,9,10,11,12]. In a test performed in the Loesche test center in Germany, copper slag grinding saved 22.9% energy in an air-swept model and 34.4% energy in an overflow model [13,14]. Altun also found this situation in a chalcopyrite test, where the grinding energy consumption is reduced by 18% compared with the conventional ball milling process, and pointed out that overflow type is expected to be more efficient than the air-swept model [5]. Although the overflow model shows better energy-saving potential than the air-swept model, it has poor adaptability to different working conditions. Due to inappropriate arguments such as the moisture, hardness and particle size in cement raw meal, a series of serious problems regarding product quality, production efficiency and energy consumption could occur on the VRM [15,16]. Therefore, for a VRM, reasonable operating parameters are of great importance to the grinding performance. In other words, it is necessary to carry out the optimal design of related parameters.
Performance optimization has become one of the objectives of crushing equipment research. Until now, the single factor analysis method has been mainly used to investigate the influence of various factors on the grinding performance of a VRM [13,14,17,18]. However, practical problems often require a multi-objective optimization, and the optimization goals would always affect each other. As far as we know, there are few multi-objective optimization studies on energy consumption and grinding energy efficiency for a VRM. There are usually four kinds of VRMs in the cement production line, including raw meal mill, coal mill, Clinker Mill and cement mill, and the vertical mill occupies a large energy consumption unit. Therefore, it is necessary to optimize the multi-objective parameters of the VRM in order to improve the grinding performance and reduce energy consumption.
The present work focuses on the grinding performance of an overflow laboratory VRM. It concentrates on addressing the designing and optimizing issues for the energy consumption and grinding energy efficiency. An integration method with experiments in the VRM and the response surface method (RSM) was employed to explore the effects of operating parameters (loading pressure ( P ), rotation speed ( n ) and moisture content (ω)) on the grinding performance of the VRM. The energy consumption ( E c s ) and the grinding energy efficiency ( η ) were modelled as functions by the operating parameters. Parametric studies were carried out to research the main and reciprocal impacts of the operating parameters on the E c s and η . Moreover, multi-objective optimization design (MOD) of the grinding performance was executed by employing a desirability approach to obtain minimum E c s and maximum η .

2. Material and Methods

2.1. Material Properties

Limestone with the bond work index of 15.129 kWh/t and Moisture content of 4.9% was bought from an ore market. Experimental limestone was first crushed by a jaw crusher (Tianjin Zhongluda Instrument Technology Co., Ltd., Tianjin, China) to −10 mm, and its particle size distribution is given in Figure 1a. Associated minerals in raw limestone were investigated by the D/MAX-RB X-ray diffractometer made by RIGAKU (Tokyo, Japan), and the X-ray spectrum of limestone is shown in Figure 1b. As shown, the main mineral components are calcite, illite and quartz.

2.2. Experimental Setup

The device (Figure 2) used in this investigation in China was a specially designed laboratory-scale VRM with a production capacity of 0.2 t/h. Its structure is similar to the vertical spindle pulverizer (VSP) [17], including a complete loading force, motion and feeding control system, and the power consumed by grinding materials can be obtained through the electrical control system. The parameters of VRM are as follows: roller radius 340 mm, roller width 105 mm, roller inclination 13°, millstone radius 300 mm, millstone revolution rate 0–72 rpm, motor revolution rate 0–1000 rpm, maximum motor power 15 kW, loading pressure 0–10 MPa, feeding rate 0–200 kg/h. All raw limestone was dried before the grinding experiments. Products can be collected from the product export and sampled three times under the same working conditions, and the average of the three groups of experimental results is selected as the research data.

2.3. Grinding Performance Indexes

In the field of mineral processing, the specific energy E c s (kWh/kg) is often used to compare the grinding performance of different equipment or different loading methods [19,20,21,22]. Although the special energy E c s can evaluate the grinding performance of the equipment as a whole, it is not possible to compare the grinding energy efficiency of different particle sizes. Therefore, the grinding energy efficiency of VRM at different conditions is calculated from the experimental data by the following equation:
η = Q P d F d P
where η represents the grinding energy efficiency defined as the net production of specified particle size per unit of energy (for example, 1.0 kg/kWh for particle size in −0.63 + 0.315 mm), Q is the feeding rate of VRM (kg/h), P is the VRM power (kW), P d is the percentage of specified particle size in the product (%), F d is the percentage of specified particle size in feed (%).
In this work, indicators E c s and η (−0.63 + 0.315 mm) are used to characterize the grinding performance of VRM. The proportion of (−0.63 + 0.315 mm) particle size in the product increased from 7.55% to 20.2% compared with that before grinding, and the increase was lower than that of other particle sizes. In addition, due to space constrains, the grinding energy efficiency of other particle sizes (−0.315 + 0.16 mm, −0.16 + 0.08 mm and −0.08 mm) are no longer displayed.

3. Response Surface Models and Parametric Study

3.1. Design of Experimental (DOE)

Based on the Box–Behnken method, the experimental tests on three factors and three levels were carried out in the Design-Expert software (8.0.6, Stat-Ease, Minneapolis, USA). As reported by Boehm [23] and by Altun [24], there are several factors affecting the grinding effect, among which the loading pressure and feed rate are more important, while the motor rotation speed and the moisture content of raw materials are also important, but few reports could be found. Accordingly, in this research, rotation speed (n), loading pressure (P) and moisture content (ω) were taken as the controllable operating parameters, and energy ( E c s ) and grinding energy efficiency (η) (−0.63 + 0.315 mm) are the objectives to optimize. This experiment was carried out under the condition that the feeding rate was 100 kg/h and the initial particle size gradation was unchanged. Before preparing wet materials with different proportions of moisture, the raw materials need to be dried. The moisture content can be controlled by adding different proportions of water into the raw limestone and mixing evenly. Box-Behnken Design (BBD) has been investigated to receive design matrix of three factors at three levels as shown in Table 1. The experimental parameters and levels were selected in this research according to the review of previous research and present equipment capability. The Box–Behnken design experiment schemes and response values are presented in Table 2.

3.2. Response Surface Models

Response surface methodology (RSM) integrates mathematical and statistical techniques, including modeling, data analysis, data prediction and parameter optimization [25]. Compared with other technologies, RSM not only avoids a large number of experiments, but also can obtain the main influencing factors and interactive effects from the designed experiments as reported in [26,27]. Based on the simulated data, the response surface method (RSM) is used to establish the relationship between operation parameters and responses, and then to predict the response and optimize relevant parameters. Generally, the second-order polynomial Equation (2) employed in RSM can be shown as:
Y = β 0 + i = 1 k β i x i + i = 1 k β i i x i 2 + i = 1 k 1 j = 2 k β i j x i x j ,
where Y represents the predicted response value, β 0 is a constant value, β i means the linear coefficient, β i i denotes the squared coefficient, β i j is the cross coefficient, k is the number of parameters. For the second-order polynomial, these coefficients can be gained by using Design-Expert software (8.0.6, Stat-Ease, Minneapolis, MN, USA).

3.3. Analysis of Variance (ANOVA)

In this research, analysis of variance (ANOVA) was adopted to explore the operating parameters of the VRM for providing a clearer picture of the degree of their impacts on the grinding performance indexes.

3.3.1. Analysis of Variance of Energy Consumption ( E c s ) Responses

Table 3 gives the ANOVA results, the F-value is 77.75 of the E c s model and the P-value is far less than 0.05, and the value of adequate precision with 30.429 is much larger than 4, which reveals that the model is highly significant. The predicted R2 is 0.934, which is consistent with the adjusted R2 of 0.9774. The difference between predicted R-squared and the adjusted R-squared was less than 0.2. According to the analysis results in Table 3, order of parameter effect on energy consumption ( E c s ) can be obtained by comparing the F-values and p-values magnitudes as follows: P > P2 > n > ω > nω > ω2 > n2 > Pn > Pω.
In order to improve the accuracy of the prediction model, the insignificant components were removed from the E c s response. Therefore, the prediction model of energy consumption ( E c s ) can be given as:
E c s = 0.13683 0.039597 P + 1.25 × 10 5 n 2.875 × 10 3 ω + 1 × 10 5 n ω + 3.31944 × 10 3 P 2 ,
It is worth noting that the prediction model obtained in this study is not applicable to other equipment and materials because of the different working mechanism of equipment and the complexity of materials.

3.3.2. Analysis of Variance of Grinding Energy Efficiency (η) Responses

Table 4 shows the ANOVA results; the F-value is 21.82 of the η model and the P-value does not exceed 0.05, and the value of adequate precision of 18.79 is much larger than 4, which means that the model is significant. The predicted R2 is 0.854, which is consistent with the adjusted R2 of 0.9213. It can be seen that the difference between predicted R-squared and the adjusted R-squared is less than 0.2. According to the analysis results in Table 4, order of parameter effect on grinding energy efficiency (η) can be obtained by comparing the F-values and P-values magnitudes as follows: n > ω > P > P2 > ω2 > n2 > nω > Pn > Pω.
Here, all the components with the condition (p-value ≥ 0.05) in the η response were removed from the proposed equation for the response model of η . Hence, the prediction model of grinding energy efficiency (η) can be shown as:
η = 6.54325 1.748 P + 3.93375 × 10 3 n + 0.026375 ω + 0.122 P 2 5.825 × 10 6 n 2 0.06825 ω 2 ,

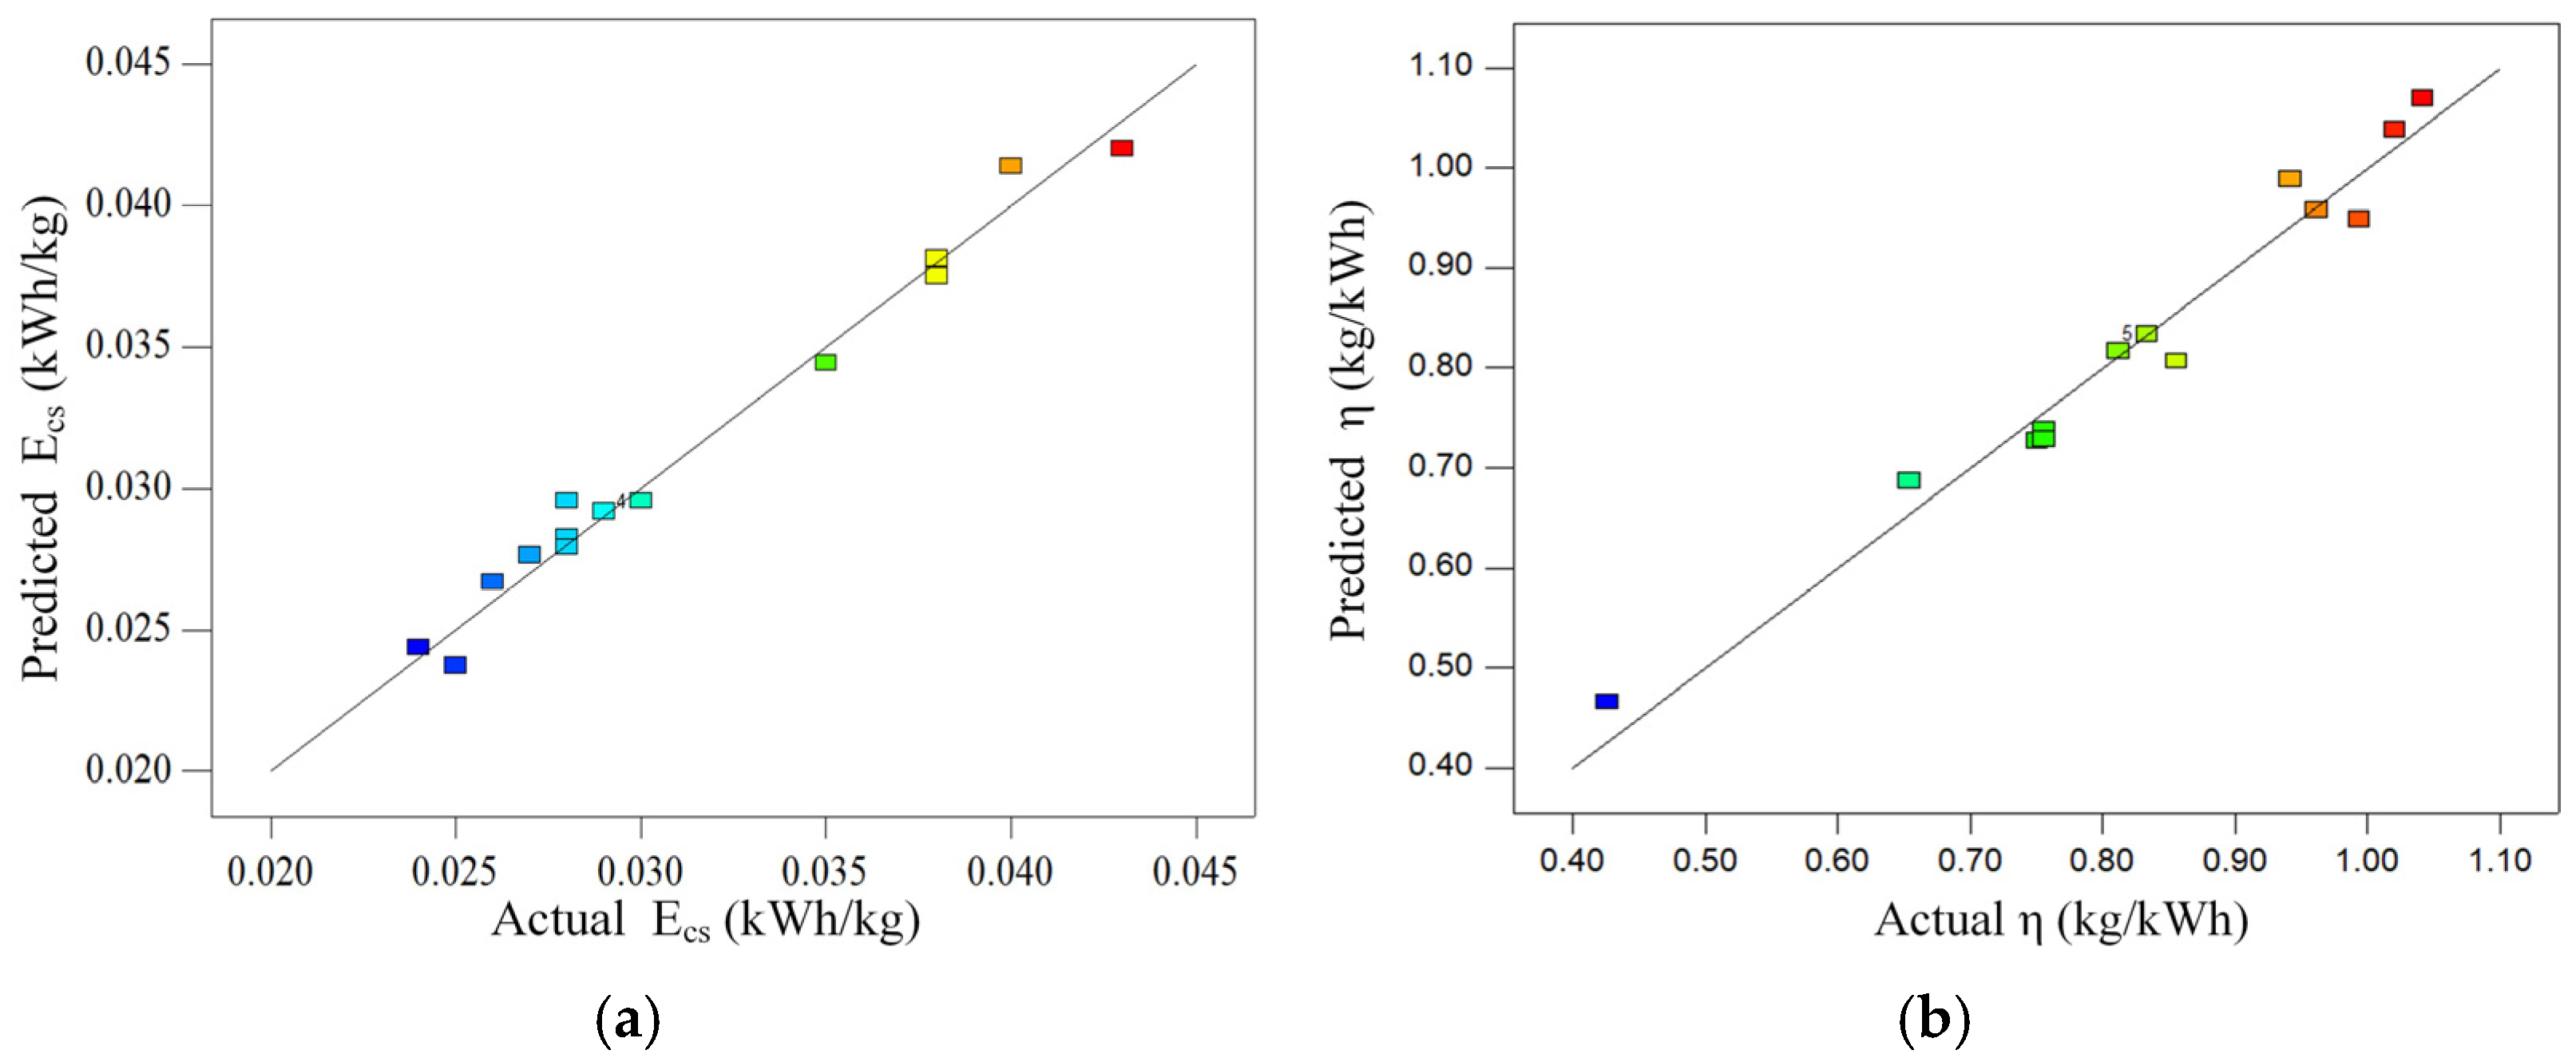
3.4. Validation of the RS Models

Figure 3 gives the relationship between the actual and predicted values of the energy consumption ( E c s ) and grinding energy efficiency ( η ). As shown in the figure, it is found that the predicted and actual values of E c s and η quadratic polynomial models are near a diagonal, indicating that the model has good prediction ability.

3.5. Parametric Study

3.5.1. Effect of Operating Parameters on E c s Response

The analysis of variance (ANOVA) in Table 3 implied that parameter P had a more significant impact on the E c s response than other parameters. Figure 4a shows the variation of E c s with rotation speed and loading pressure. As seen, the E c s increases when the loading pressure increases due to the increase of resistance of millstone movement with the increase of loading pressure. The same changes were also found in the work of Xie [18]. The maximum E c s could be obtained with the maximum rotation speed and maximum loading pressure. It can be found that the change of response surface shape along P is steeper than that along n, indicating that P has a more significant impact on E c s than n, which is consistent with the conclusion described in Section 3.3.1. Figure 4b gives the variation of E c s with rotation speed and moisture content. It can be seen that the interaction between these two factors is weak. A perturbation plot is given in Figure 4c, which presents the influence of all the parameters on the energy consumption at the center point in the design space. It is demonstrated from this figure that loading pressure is of great importance to the E c s , while the influence of rotation speed and moisture content is relatively small, and positively correlated with E c s . When the rotating speed increases, the power of equipment operation increases, and finally the energy consumption increases under constant feeding. With the increase of moisture content, the equipment operation resistance increases and the grinding capacity decreases, resulting in the increase of energy consumption.

3.5.2. Effect of Operating Parameters on η Response

The analysis of variance (ANOVA) in Table 4 revealed that η depended mainly on the parameter ω and the parameter n. Figure 5a shows the variation of η with and moisture content and rotation speed. As seen, the η increases as the rotation speed decreases, and the maximum η could be obtained with the minimum moisture content and minimum rotation speed. Xie [18] found the motor power consumption and product output are proportional to the motor rotation speed based on VRM experiments, but did not compare the degree of change. This work gives the grinding energy efficiency at the particle size of −0.63 + 0.315 mm. The results show that the change of response surface shape along n is steeper than that along ω, meaning that n has a more significant influence on η than ω; this conclusion is consistent with previous conclusions in Section 3.3.2. Figure 5b presents the variation of η with loading pressure and rotation speed. As seen, there is a strong interaction between the two factors. A perturbation plot is presented in Figure 5c, which shows the impact of all the parameters on the grinding energy efficiency at the center point in the design space. As seen, the rotation speed and moisture content have a negative effect on the η . According to the definition and unit of η , generally, it is inversely proportional to E c s . According to the change trend of   E c s , η is inversely proportional to rotating speed and moisture content.

4. Multi-Objective Optimization Design (MOD)

4.1. Description of the Optimization Problem

Although the influence of three operating parameters on grinding performance has been explored in the previous sections, how to design optimal operating parameters under multiple objectives is still unknown. Therefore, it is more meaningful to carry out the operating parameters optimization of the grinding performance within a multi-objective optimization framework. As an important rule for the design of crushing equipment, the first objective is to minimize the energy consumption of equipment operation, and another objective is to maximize the grinding energy efficiency.
So, the MOD problem of grinding performance under various parameters can be formulated as follow:
{ M i n m i z e   f 1 = E c s ( P ,   n ,   ω ) M a x m i z e   f 2 = η ( P ,   n ,   ω ) s . t .     6 P 8   MPa         350 n 450   rpm         0 ω 2 % ,

4.2. Desirability Function Approach

In this work, due to its simplicity and availability in the Design-Expert, the desirability function approach is employed to optimize multi-objective responses. Each response can be changed by the weights (weights could be ranged between 0.1 and 10) and importance (importance varies from the least important + to the most important +++++). The overall desirability function simultaneously considers the energy consumption and grinding energy efficiency.
The basic idea of solving multi-objective optimization problems is to combine multiple responses into a dimensionless measure of performance [28]. The first task of desirability function is to change each response variable Y i to a desirability d i value, where 0 d i 1 and a greater d i value means that response value Y i is more desirable, i.e., if d i = 0 this implies that the response is completely undesired, otherwise d i = 1 means a totally desired response.
If an objective function is to be maximized, the individual desirability function ( d i ) can be defined by
d i = { 0                     Y i L o w i   ( Y i L o w i H i g h i L o w i ) w t i   L o w i < Y i < H i g h i 1                     Y i H i g h i ,
If an objective function is to be minimized, the individual desirability function ( d i ) can be defined by
d i = { 1                     Y i L o w i   ( H i g h i Y i H i g h i L o w i ) w t i   L o w i < Y i < H i g h i 0                     Y i H i g h i ,
where Y i is the response value, L o w i represents the lower limit, H i g h i denotes the upper limit, w t i represents the weight factor.
The desirability objective function D is combined with these determined individual d i values, and it is a geometric mean of all the d i values.
D = ( i = 1 n d i r i ) 1 / n ,
where n denotes the number of responses, each response can be given an importance indicator ( r i ) relative to other responses. Importance ( r i ) varies from the least important values of 1(+), to the most important value of 5(+++++).

4.3. Design Optimization Results

In this article, the goal of multi-objective design is to achieve the minimum   E c s and the maximum η . Employing the desirability method, the MOD problem of grinding performance under various parameters can be formulated as
  { M a x m i z e       D = d E c s × d η s . t .                  6 P 8   MPa                                                   350 n 450   rpm                                   0 ω 2 % ,
where
d E c s = ( E c s H E c s ( P ,   n ,   ω ) E c s H E c s L ) w 1 ,
d η = ( η ( P ,   n ,   ω ) η L η H η L ) w 2 ,
in which E c s H ,   E c s L , and η H ,   η L denote the upper and lower limits on E c s and η , respectively. w 1 and w 2 mean the weight factors for E c s and η , respectively.
The values of loading pressure ( P ) , rotation speed n and moisture content (ω) were set to vary for seeking the optimal configuration of the grinding performance. The optimization function in the Design-Expert software package can maximize the expected function in multiple factors. The desirability objective function (D) vs n and P is given in Figure 6. As seen, with the decrease of rotation speed and loading pressure, the overall desirability increases.
Both objectives are given equal importance values and weight values, and the optimal solution results are shown in Table 5. It can be found that the optimal desirability is accounted by the parameters with P = 6 MPa, n = 350 rpm and ω = 2%. So, if the parameter has a minimum loading pressure and rotation speed, the multi-objective optimization design could be gained. The optimization results of DOE were verified by an experiment and Table 6 shows the comparison between the experimental results and the predicted results. As seen, the maximum error between experimental and predicted values is 9.2%, indicating the optimized results are valid.

5. Conclusions

For design of experiments (DOE), the response surface method (RSM) was employed with the laboratory VRM experiments to systematically investigate the influence of operating parameters such as loading pressure ( P ), rotation speed ( n ) and moisture content ( ω ) on the grinding performance of VRM. The energy consumption ( E c s ) and the grinding energy efficiency ( η ) were established respectively with operating parameters. Furthermore, based on the developed models of the ( E c s ) and ( η ) , the multi-objective optimization design (MOD) method was utilized to seek out the optimal parameters of the VRM. The following conclusions could be drawn:
The models of energy consumption and grinding energy efficiency by the RSM could well reveal the potential association between the models and the corresponding operating parameters.
Comparing with rotation speed ( n ), the loading pressure ( P ) has a more significant impact on the energy consumption ( E c s ) and the moisture content ( ω ) has the lowest influence.
The optimal parameters for energy consumption ( E c s ) and grinding energy efficiency ( η ) are as follows: loading pressure 6 MPa, rotation speed 350 rpm and moisture content 2%.
The predicted values of the optimization design model match the experimental results well under same conditions. The RSM turns out to be a valid method to perform multi-objective optimization.

Author Contributions

Conceptualization, C.L. and Z.C.; methodology, C.L. and W.Z.; software, C.L. and Q.X.; investigation, C.L.; writing—original draft preparation, C.L. and W.Y., Z.Y.; writing—review and editing, C.L., Y.M. and Q.X.; supervision, Z.C. and Y.D.; All authors have read and agreed to the published version of the manuscript.

Funding

This work was funded by the Wuhan University of Technology Cooperation Project (Grant No.20192h0067) and the Fundamental Research Funds for the Central Universities (Grant No.203104007).

Data Availability Statement

Data is contained within the article.

Acknowledgments

Thanks to Wuhan University of Technology Cooperation Project (No.WHUT-20192h0067) and the Fundamental Research Funds for the Central Universities (No.WHUT-203104007) for financial support of this work.

Conflicts of Interest

The authors declare no conflict of interest.

References

  1. Curry, J.A.; Ismay, M.J.L.; Jameson, G.J. Mine operating costs and the potential impacts of energy and crushing. Miner. Eng. 2014, 56, 70–80. [Google Scholar] [CrossRef]
  2. Napier-Munn, T. Is progress in energy-efficient comminution doomed? Miner. Eng. 2015, 73, 1–6. [Google Scholar] [CrossRef]
  3. Johansson, M.; Bengtsson, M.; Evertsson, M.; Hulthen, E. A fundamental model of an industrial-scale jaw crusher. Miner. Eng. 2017, 105, 69–78. [Google Scholar] [CrossRef]
  4. Liu, R.Y.; Shi, B.Q.; Li, G.G.; Yu, H. Influence of operating conditions and crushing chamber on energy consumption of cone crusher. Energies 2018, 11, 1102. [Google Scholar] [CrossRef] [Green Version]
  5. Altun, D.; Gerold, C.; Benzer, H.; Altun, O.; Aydogan, N. Copper ore grinding in a mobile vertical roller mill pilot plant. Int. J. Miner. Process. 2015, 136, 32–36. [Google Scholar] [CrossRef]
  6. Gao, C.M. History, present situation and development of vertical grinding of cement at home and abroad. Cem. Guide New Epoch. 2017, 3, 22–26. [Google Scholar]
  7. Schaefer, H.U. Loesche vertical roller mills for the comminution of ores and minerals. Miner. Eng. 2001, 14, 1155–1160. [Google Scholar] [CrossRef]
  8. Tamashige, T.; Obana, H.; Hamaguchi, M. Operational results of OK series roller mill. In Proceedings of the IEEE Cement Industry Technical Conference, Tarpon Springs, FL, USA, 22–24 May 1990. [Google Scholar] [CrossRef]
  9. Ito, M.; Sato, K.; Naoi, Y. Productivity increase of the vertical roller mill for cement grinding. In Proceedings of the IEEE Cement Industry Technical Conference, Hershey, PA, USA, 20–24 April 1997. [Google Scholar]
  10. Roy, G.R. Increasing cement grinding capacity with vertical roller mill technology. In Proceedings of the IEEE Cement Industry Technical Conference, Jacksonville, FL, USA, 5–9 May 2002. [Google Scholar]
  11. Simmons, M.; Gorby, L.; Terembula, J. Operational experience from the United States’ first vertical roller mill for cement grinding. In Proceedings of the IEEE Cement Industry Technical Conference, Kansas City, MO, USA, 15–20 May 2005. [Google Scholar]
  12. Jorgensen, S.W. Cement grinding-a comparison between vertical roller mill and ball mill. Cem. Int. 2005, 3, 54–63. [Google Scholar]
  13. Gerold, C.; Schmitz, C.; Stapelmann, M.; Dardemann, F. Recent installations and developments of loesche vertical roller mills in the ore industry. In Proceedings of the Comminution’12, Cape Town, South Africa, 14–15 November 2012; pp. 1–22. [Google Scholar]
  14. Gerold, C.; Schmitz, C.; Stapelmann, M.; Dardemann, F. Recent installations and developments of loesche vertical roller mills in the ore industry. In Proceedings of the XXVI International Mineral Processing Congress (IMPC), New Delhi, India, 24–28 September 2012; pp. 18–29. [Google Scholar]
  15. Brundiek, H.; Poesch, F. A roller mill for cement and blast furnace slag in theory and practice. In Proceedings of the IEEE Cement Industry Technical Conference, San Juan, PR, USA, 4–9 June 1995. [Google Scholar]
  16. Lian, D.; Xiaoli, L.; Kang, W.; Yang, L. Research on slag grinding process control. In Proceedings of the 34th Chinese Control Conference (CCC), Hangzhou, China, 28–30 July 2015. [Google Scholar]
  17. He, Y.Q.; Xie, W.N.; Zhao, Y.M.; Li, H.; Wang, S. Triboelectrostatic separation of pulverized fuel of coal power plant based on mineralogical analyses. Int. J. Miner. Process. 2017, 166, 7–12. [Google Scholar] [CrossRef]
  18. Xie, W.N.; He, Y.Q.; Zhang, Y.H.; Huang, Y.; Li, H.; Wei, H.; Wang, H.F. Simulation study of the energy-size reduction of MPS vertical spindle pulverizer. Fuel 2015, 139, 180–189. [Google Scholar] [CrossRef]
  19. Xie, W.N.; He, Y.Q.; Shi, F.N.; Huang, Y.; Zuo, W.; Wang, S.; Li, B.; Wei, H.; Zhou, N. Comparison of energy efficiency between E and MPS type vertical spindle pulverizer based on the experimental and industrial sampling tests. Energy 2017, 130, 174–181. [Google Scholar] [CrossRef] [Green Version]
  20. Shi, F.N.; Xie, W.G. A specific energy-based size reduction model for batch grinding ball mill. Miner. Eng. 2015, 70, 130–140. [Google Scholar] [CrossRef]
  21. Nadolski, S.; Klein, B.; Kumar, A.; Davaanyam, Z. An energy benchmarking model for mineral comminution. Miner. Eng. 2014, 65, 178–186. [Google Scholar] [CrossRef]
  22. Touil, D.; Belaadi, S.; Frances, C. The specific selection function effect on clinker grinding efficiency in a dry batch ball mill. Int. J. Miner. Process. 2008, 87, 141–145. [Google Scholar] [CrossRef] [Green Version]
  23. Boeham, A.; Meissner, P.; Plochberger, T. An energy based comparison of vertical roller mills and tumbling mills. Int. J. Miner. Process. 2015, 136, 37–41. [Google Scholar] [CrossRef]
  24. Altun, D.; Benzer, H.; Aydogan, N.; Gerold, C. Operational parameters affecting the vertical roller mill performance. Miner. Eng. 2016, 103, 67–71. [Google Scholar] [CrossRef]
  25. Montgomery, D.C. Design and Analysis of Experiments, 8th ed.; John Wiley & Sons: Hoboken, NJ, USA, 2013; pp. 478–479. [Google Scholar]
  26. Chen, Z.R.; Wang, G.Q.; Xue, D.M.; Bi, Q. Simulation and optimization of gyratory crusher performance based on the discrete element method. Powder Technol. 2020, 376, 93–103. [Google Scholar] [CrossRef]
  27. Chen, Z.R.; Wang, G.Q.; Xue, D.M.; Cui, D. Simulation and optimization of crushing chamber of gyratory crusher based on the DEM and GA. Powder Technol. 2021, 384, 36–50. [Google Scholar] [CrossRef]
  28. Pasandideh, S.H.R.; Niaki, S.T.A. Multi-response simulation optimization using genetic algorithm within desirability function framework. Appl. Math. Comput. 2006, 175, 366–382. [Google Scholar] [CrossRef]
Figure 1. (a) Particle size distribution of limestone after crushing; (b) X-ray spectrum of raw limestone analyzed by XRD.
Minerals 12 00133 g001
Figure 2. (a) Structure of the laboratory-scale VRM used in experiments. (b) Two-dimensional diagram of VRM.
Minerals 12 00133 g002
Figure 3. (a) Scatter diagram of E c s ; (b) scatter diagram of η .
Minerals 12 00133 g003
Figure 4. (a) Variation of E c s with n & P; (b) variation of E c s with n & ω; (c) perturbation plot of E c s .
Minerals 12 00133 g004
Figure 5. (a) Variation of η with ω and n; (b) variation of η with P and n; (c) perturbation plot of η .
Minerals 12 00133 g005
Figure 6. Surface of desirability objective function (D) vs. design variables.
Minerals 12 00133 g006
Table 1. Operating parameters and experiment design levels.
ParametersCode−101
Loading pressure (MPa)P678
Rotation speed (rpm)n350450550
Moisture content (%)ω012
Table 2. Design experiment schemes and response values.
No.P (MPa)n (rpm)ω (%) E c s (kWh/kg) η (kg/kWh)
17.00450.001.000.030.834
26.00550.001.000.0280.856
38.00450.002.000.040.756
48.00450.000.000.0380.962
57.00350.002.000.0280.756
68.00550.001.000.0430.751
76.00450.000.000.0241.021
87.00450.001.000.030.834
96.00350.001.000.0251.042
107.00550.002.000.0350.426
117.00450.001.000.030.834
126.00450.002.000.0270.812
137.00450.001.000.030.834
147.00550.000.000.0290.654
157.00350.000.000.0260.994
167.00450.001.000.0280.834
178.00350.001.000.0380.942
Table 3. Analysis of variance for E c s .
SourceSum of SquaresDfMean SquareF-Value p-Value
Model4.948 × 10−495.498 × 10−577.75<0.0001
P3.781 × 10−413.781 × 10−4534.72<0.0001
n4.050 × 10−514.050 × 10−557.270.0001
ω2.113 × 10−512.113 × 10−529.870.0009
Pn1.000 × 10−611.000 × 10−61.410.2731
Pω2.500 × 10−712.500 × 10−70.350.5708
nω4.000 × 10−614.000 × 10−65.660.0490
P24.655 × 10−514.655 × 10−565.83<0.0001
n21.392 × 10−611.392 × 10−61.970.2034
ω21.918 × 10−611.918 × 10−62.710.1435
Residual4.950 × 10−677.071 × 10⁻⁷
Lack of Fit1.750 × 10−635.833 × 10−70.730.5860
Pure Error3.200 × 10−648.000 × 10⁻⁷
Cor Total4.998 × 10−416
R2Adjusted R2Predicted R2Adequate precision
0.99010.97740.93430.429
Table 4. Analysis of variance for η .
SourceSum of SquaresDfMean SquareF-Value p-Value
Model0.3490.03821.820.0003
P0.01310.0137.420.0296
n0.1410.1479.48<0.0001
ω0.09710.09756.270.0001
Pn6.250 × 10−616.250 × 10−63.625 × 10−30.9537
Pω2.250 × 10−612.250 × 10−61.305 × 10−30.9722
nω2.500 × 10−512.500 × 10−50.0150.9075
P20.06310.06336.350.0005
n20.01410.0148.290.0237
ω20.02010.02011.380.0119
Residual0.01271.724 × 10−3
Lack of Fit0.01234.023 × 10−3
Pure Error0.00040.000
Cor Total0.3516
R2Adjusted R2Predicted R2Adequate precision
0.96560.92130.85418.79
Table 5. Optimal solution as obtained by Design-Expert. “/” means no value.
Parameter P (MPa) n (rpm) ω (%) E c s   ( kWh / kg ) η   ( kg / kWh ) Desirability
Example745010.030.834/
Optimzed635020.023141.113430.449
Table 6. Comparison between the experimental results and the predicted results.
Parameter E c s (kWh/kg) η (kg/kWh)
Predicted0.023141.11343
Experimental0.021351.02981
Error7.7%9.2%
Publisher’s Note: MDPI stays neutral with regard to jurisdictional claims in published maps and institutional affiliations.

