Article

Proposition of a Thermogravimetric Method to Measure the Ferrous Iron Content in Metallurgical-Grade Chromite

IME Process Metallurgy and Metal Recycling, Institute of RWTH Aachen University, 52056 Aachen, Germany
*
Author to whom correspondence should be addressed.
Minerals 2022, 12(2), 109; https://doi.org/10.3390/min12020109
Submission received: 20 December 2021 / Revised: 15 January 2022 / Accepted: 17 January 2022 / Published: 19 January 2022
(This article belongs to the Special Issue Ferroalloy Minerals Processing and Technology)

Abstract

:
The oxidation state of iron in minerals is an important part of analysis. Especially for minerals used as a raw material for metallurgical processes, the oxidation state has a significant impact on the process. One crucial impact is the varying carbon requirement in smelting furnaces, which can be significantly different if the oxidation state is not assessed correctly. Compared to methods usually used to determine the oxidation state, a relatively simple and fast thermogravimetric method is proposed in this article. As a sample, a detailed analyzed chromite sample from Turkey is used. Bulk chemical analysis, Raman spectroscopy, X-ray diffraction, and QEMSCAN® are used to determine the preconditions of the sample. Mössbauer spectroscopy is used as a reference method to determine the oxidation state of iron in the sample. Uncertified wet chemical methods are investigated as well in this paper and the results are compared with the reference measurement. Using a thermochemical simulation tool, parameters for the thermogravimetric method are investigated and the limitation of this method is examined. The mean ferrous ratio in the sample determined by the proposed method is 75.205%, which is only slightly lower than the ferrous ratio of 76% determined by Mössbauer spectroscopy.

1. Introduction

The determination of the ferric or ferrous ratio in chromite ore or minerals in general is typically a difficult property to measure [1]. However, in metallurgical processes employing the reduction of metal oxides, knowledge about the oxidation state is important, as the oxidation state can influence the process significantly. This article investigates options to easily measure the oxidation state of iron in chromite. Chromite is commonly used as a raw material for the production of ferrochrome, which is usually carried out in a smelting reduction process using a submerged arc furnace or electric arc furnace. While the energy balance of the smelting furnace for the production of ferrochrome is more affected by the mineralogy of the sample compared to the Fe2+/Fe3+-ratio, the Fe2+/Fe3+-ratio strongly impacts the carbon requirements for the production of ferrochrome. Using a determined Fe2+/Fe3+-ratio compared to the assumption that all iron in the ore is in the divalent state can increase the carbon consumption by 15% [1]. On the other hand, assuming a lower oxidation state than the actual oxidation state for the calculation of the carbon consumption can result in a carbon shortage.
In the case of submerged arc furnaces, the phenomena occurring when too much coke is supplied is called overcoking, while a smaller coke charge than required is called undercoking, and both conditions have a negative impact on the process. For ferromanganese production in submerged arc furnaces, overcoking leads to a larger coke bed, a lower temperature for a fixed load and a higher CO2 content in the off-gas [2]. Undercoking can lead to a higher content of valuable metal oxides in the slag and even solid metal oxides, which increase the viscosity of slag, a significantly increased electrical resistance during tapping [3], operational problems, lower metal yields and reduced tonnages [4].
During ferrosilicon chrome production, overcoking results in the formation of silicon carbide (SiC) and undercooking results in residual layers of quartz (SiO2) and alumina (Al2O3). The result of both conditions causes a bad tapping performance [5].
Furthermore, knowledge about the oxidation state is relevant for direct reduction processes, since the usage of preoxidized ore has a positive effect on reduction kinetics and metallization rates for the treatment of titanomagnetite [6], ilmenite [7], or chromite [8,9,10,11,12], the proposed method can be a valuable tool to measure if the preoxidation was sufficient or if residual ferrous iron remains in the ore.
Current options used to determine the iron oxidation state include Mössbauer spectroscopy [13,14,15], electron microprobe measurements (EPMA) [16,17,18], X-ray photoelectron spectroscopy (XPS) [19], micro-X-ray absorption near-edge structure spectroscopy (XANES) [20,21], or wet chemical methods [1,22]. Especially the spectroscopy methods and EPMA are quite labor-intensive and time-consuming. While EPMA measurements to determine the ferric iron content in chromites have the drawback that the accuracy might be too low [23], XPS is limited to the analysis of the first atomic layers of the sample [24]. XANES and XPS have the advantage that besides iron it is possible to determine the oxidation state of other transition metals like chromium as well. This can be relevant for residues in which hazardous Cr(VI) is present, like dust from ferrochrome production [25] or chromite ore processing residues (COPR) [26]. Disadvantages of wet chemical methods are that they are relatively labor-intensive and arduous [24], furthermore refractory iron-containing minerals like chromite, ilmenite or magnetite are either dissolved slowly by wet chemical procedures or not at all [22]. Another inaccuracy can occur, if sulfur is present in the sample, as sulfur can reduce ferric iron [22].
To overcome those challenges, a thermogravimetric method is investigated to determine the ferrous iron content in a metallurgical-grade chromite concentrate. As a reference method, Mössbauer spectroscopy was applied to determine the ferric and ferrous ratio in the ore sample, combined with chemical analysis to calculate the ferrous iron content. Mössbauer was chosen since it proved to be a reliable method for the analysis of Cr-spinels [27]. In the first segment of the thermogravimetric method, the ore is calcined under an argon atmosphere to remove volatile components, assuming that the oxidation state of metal oxides in the ore will not be changed. In the second segment, the ore will be oxidized. The resulting mass gain during the second segment is used to calculate the ferrous iron content in the original sample, assuming that the mass change is only due to the oxidation of ferrous iron and other elements remain in the original oxidation state. Previously, a similar method was successfully employed for synthetic, iron-containing samples and igneous rocks [24].

2. Materials and Methods

In this chapter the origin of the raw material and the used analytical equipment is briefly described.

2.1. Origin of the Raw Material

The sample investigated in this article is a commercial metallurgical-grade chromite concentrate from Turkey. Turkish chromite deposits are classified as podiform deposits [28,29,30]. The concentrate was produced by applying the method of gravity separation using a concentrator table.

2.2. Analytical Methods

To identify minerals present in the ore sample, the “MA-RBE-V02” Raman microscope made by “Stonemaster UG, Linkenheim-Hochstetten, Germany” was used. The Raman microscope was equipped with Nd-YAG laser (wavelength = 532 nm). The microscope had a magnification of 50. The numerical aperture was 0.55.
The chemical composition of the ore sample was analyzed using a wavelength dispersive X-ray fluorescence spectrometer (XRF) “Axiosmax” made by “Malvern Panalytical B.V.”, Almelo, Netherlands”. The samples were ground and sieved to a grain size below 63 µm. The samples were analyzed as fused-cast beads with the wide range oxide (WROXI) calibration and as pressed powder tablets with the “Omnian” and “Pro-Trace” calibration, all from “Malvern Panalytical”. Furthermore, two contract laboratories analyzed the sample via XRF, and one laboratory analyzed trace elements with an inductively coupled plasma optical emission spectrometer (ICP-OES).
A “Spectro ARCOS” ICP-OES made by “SPECTRO Analytical Instruments GmbH, Kleve, Germany” was used to analyze the iron concentration in the leach solution.
Carbon and sulfur analysis were carried out with an “ELTRA CS 2000” system made by “ELTRA GmbH, Haan, Germany” based on a combustion method. Carbon and sulfur measurements were carried out three times per sample. Furthermore, two contract laboratories analyzed the sample with a combustion method as well.
In addition to the carbon analysis by the total combustion method, the amount of carbonates was determined using the carbonate analysis method after Scheibler according to DIN EN ISO 10693 [31]. For the measurement, a ground ore sample is dissolved in hydrochloric acid and the volume of evolved CO2 is measured [31].
A “STA 449 F3 Jupiter®” made by “Netzsch–Gerätebau GmbH”, Selb, Germany was used for thermogravimetric trials. Al2O3-crucibles with a volume of 0.3 mL and 8 mm diameter were used for the trials. Per trial, the sample mass was between 99.63 mg and 101.93 mg. The samples were ground and sieved to a grain size below 63 µm. MgO used as an additive in thermogravimetric trials had a purity of 99.95% and a mesh size below 325.
X-ray diffraction (XRD) was carried out using the “STADI MP” powder diffractometer made by “STOE&Cie GmbH”, Darmstadt, Germany. The diffractometer was equipped with a molybdenum anode (55 kV, 40 mA) and a Germanium monochromator filtered the Kα1-radiation (wavelength: 0.70930 Å). The measuring time was 2 h per sample.
The particle size of the ore was analyzed by dynamic image analysis using the “QICPIC” made by “Sympatec GmbH”, Clausthal–Zellerfeld, Germany. The particle size distribution is supplied in the Supplementary Material.
To obtain a quantitative mineralogical composition of the sample, the “quantitative evaluation of minerals by scanning electron microscopy (QEMSCAN®) was used. As equipment, a “Quanta 650F” scanning electron microscope (SEM) made by “FEI”, Hillsboro, USA (FEI) equipped with a “dual Bruker XFlash 5030” energy dispersive X-ray-detector (EDS) was used.
For the Mössbauer analysis, a sample with a particle size below 63 µm was filled into a copper ring with an inner diameter of 10 mm. The copper ring was sealed with a high-purity Al-foil on one side. The sample was fixated with epoxy resin. The transmission 57Fe Mössbauer spectrum was obtained using a conventional Mössbauer apparatus made by “Halder Elektronik GmbH”, Seehausen, Germany. The measurement was carried out at room temperature. A 57Co/Rh radioactive single line source was used for the experiment. The apparatus was operated in a horizontal arrangement. The drive unit to modulate the radiation energy via the Doppler effect was run at a constant acceleration mode with a symmetric triangular velocity shape, equipped with a 1024 channel multichannel analyzer. 57Fe Mössbauer parameters and velocity scale are calibrated to α-iron. The folded spectrum was analyzed using a Voigt-based quadrupole splitting distribution approach [32,33], which is necessary to model the distribution of quadrupole splitting due to slightly different local distortion environments around the Fe-probe in Cr-rich spinels.
To simulate the mass gain of the ore during thermogravimetric trials and the ferric and ferrous ratio dependent of the temperature, the commercial thermochemical software FactSageTM 8.0 (Centre for Research in Computational Thermochemistry, Montreal, Canada and GTT-Technologies, Herzogenrath, Germany) is used [34]. The databases FactPS and FToxid are used for the simulation.
Leaching trials using a non-standardized Fe3+-determination method [1] were carried out in a 2000 mL beaker with a magnetic stirrer and 400 rpm. All trials were carried out at room temperature. Ground ore (63 µm) and as received ore were used, the particle size distribution of the as received ore is given in the Supplementary Material. The leach solution was filtered afterwards and analyzed by ICP-OES.

3. Results

In this chapter, the results of the chemical analysis and mineralogical analysis are presented. Results of different methods to measure the ferric and ferrous iron content in the chromite sample are shown. Thermogravimetric trials are carried out to measure the ferrous iron content in the sample, while a thermochemical simulation is carried out to determine reasonable parameters for the thermogravimetric simulation and to determine the accuracy of the thermogravimetric ferrous iron determination method.

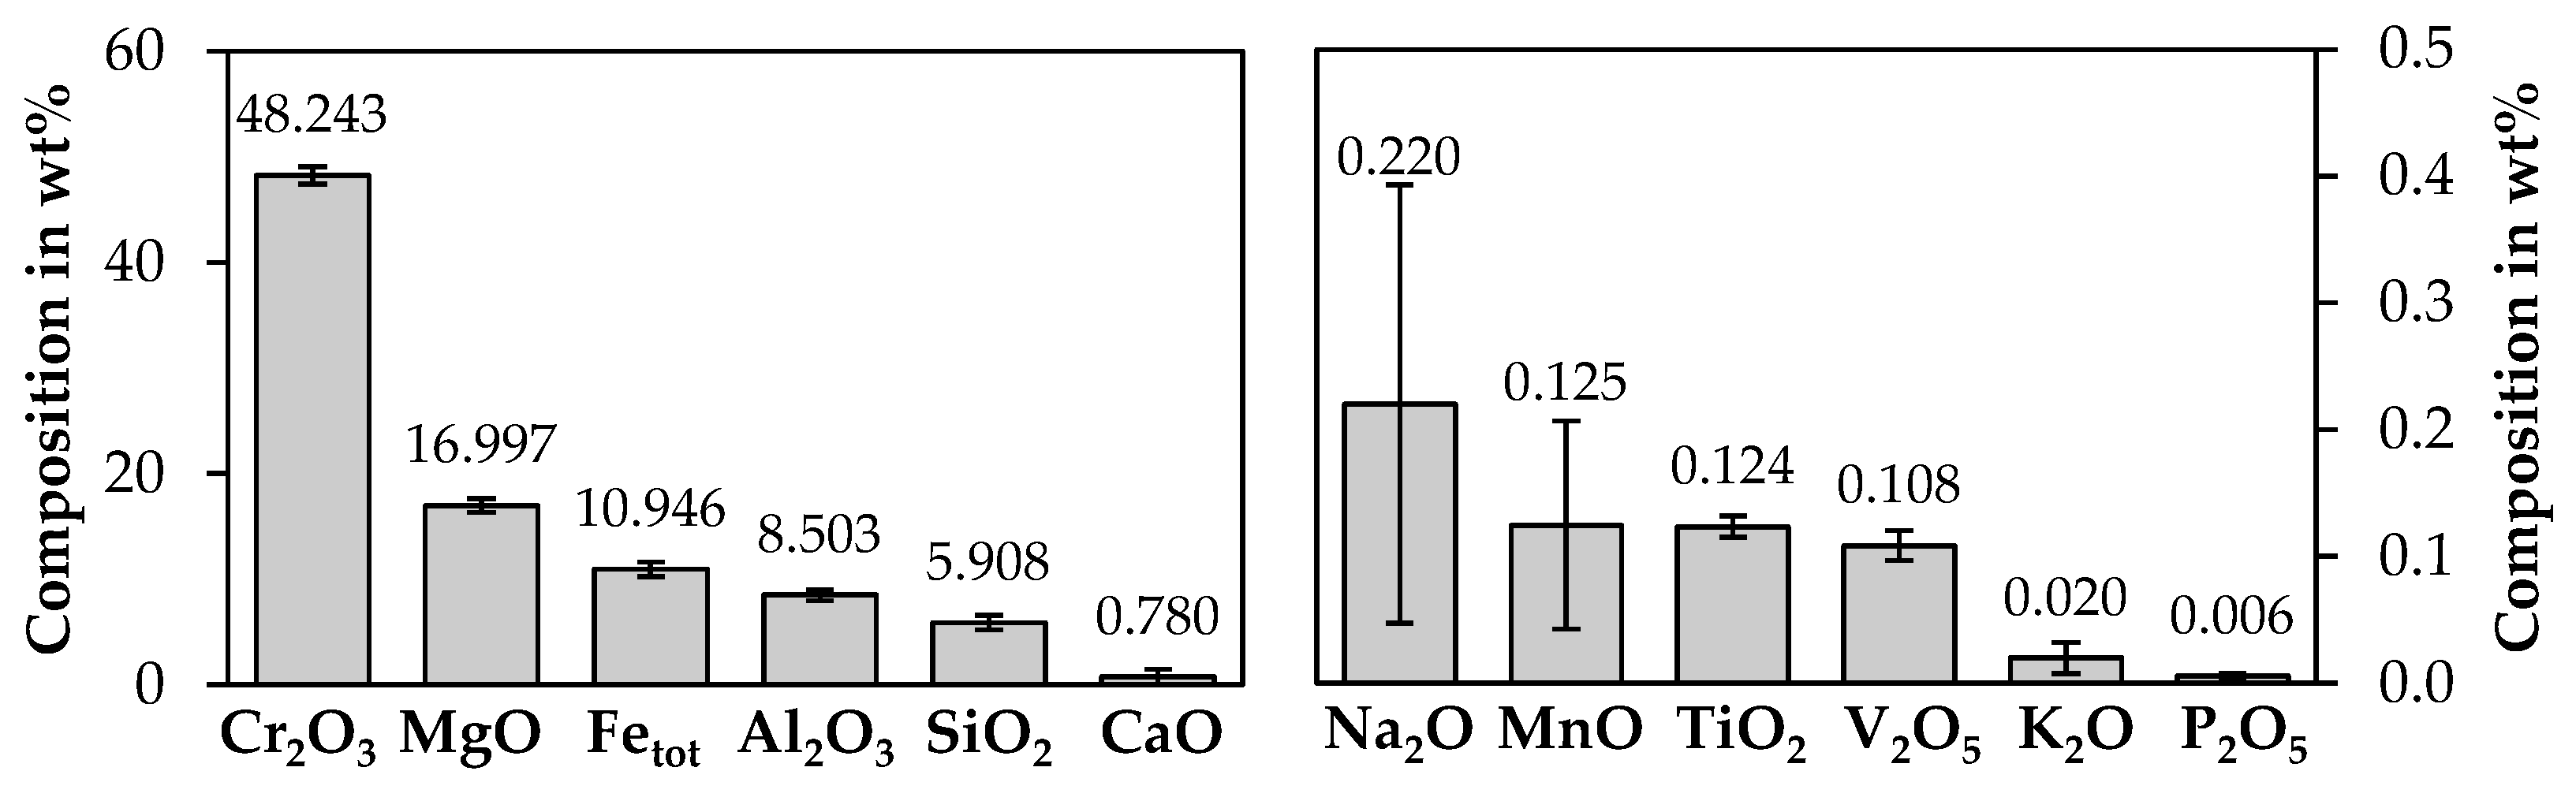
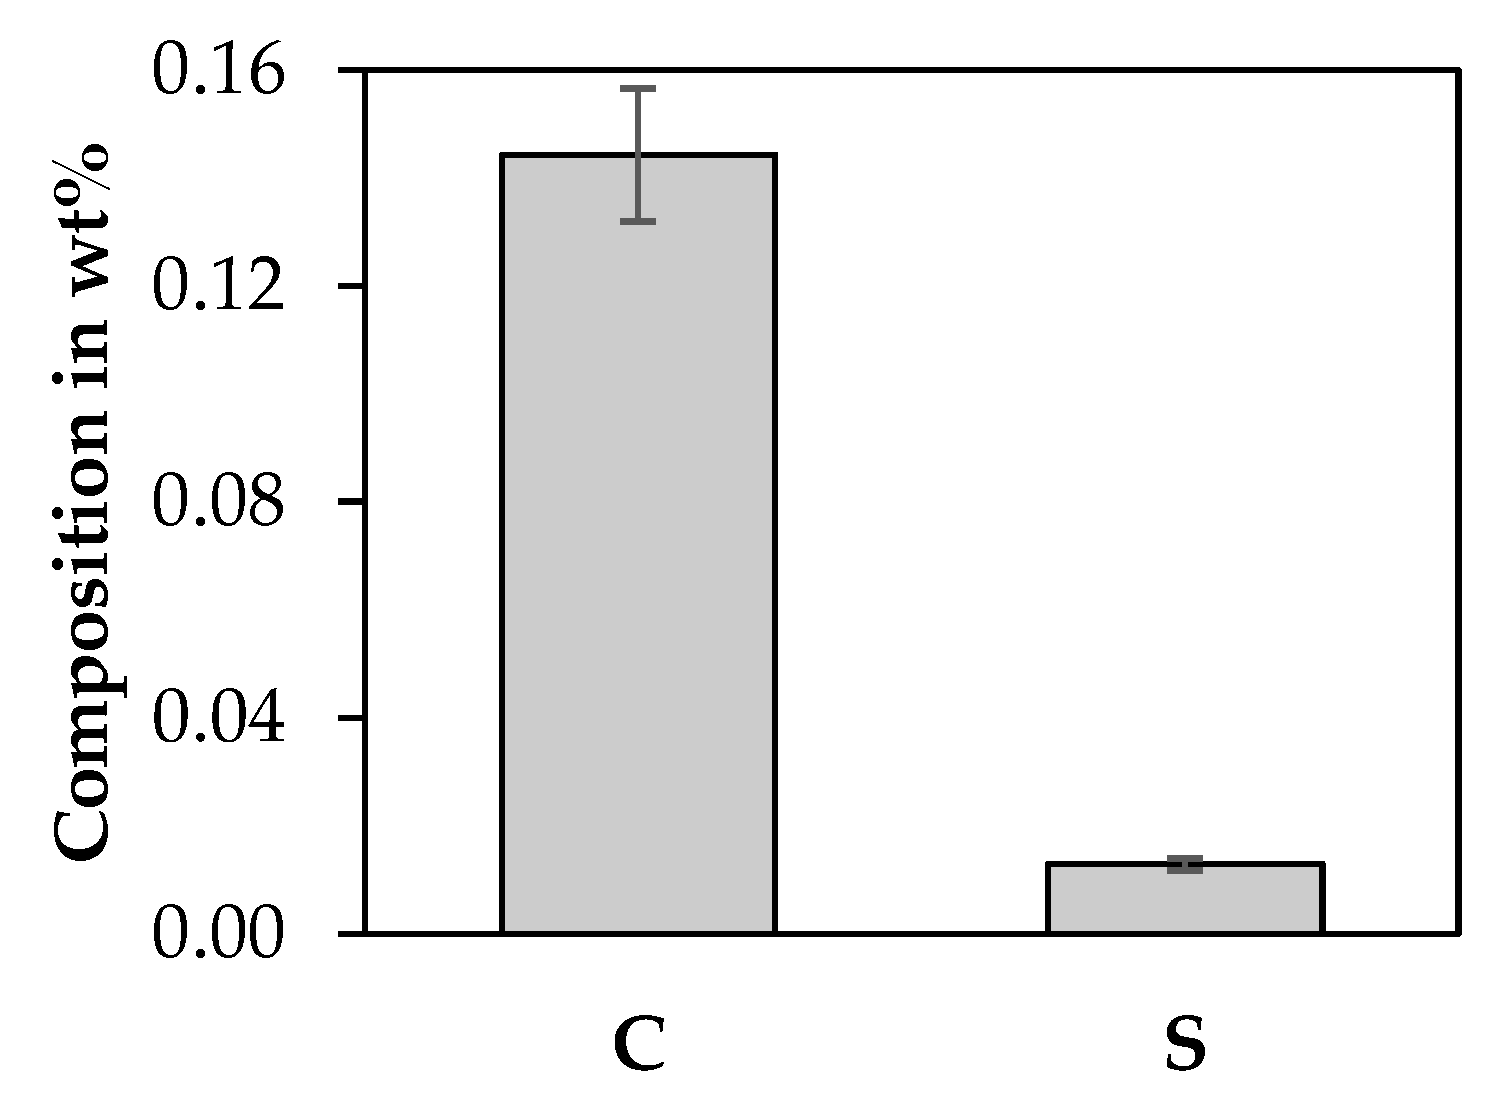
3.1. Bulk Chemical Analysis of Chromite Concentrate

Figure 1 shows the mean chemical composition and the standard deviation of major elements analyzed in the ore based on four measurements. The measurements were carried out with two different XRF methods in the laboratory of IME, and two contract laboratories analyzed the sample. Iron is not expressed as an oxidic compound yet, since iron can occur as ferrous and ferric iron in chromite. The content of trace elements determined by the ICP-OES scan and the XRF “ProTrace” calibration is not relevant for this investigation and is only listed in the Supplementary Material. The loss on ignition and the standard deviation based on an internal measurement and two external measurements is 2.16 ± 0.07 wt%.
Based on the Cr2O3-content, the ore can be classified as a medium-grade commercial ore [35]. The chromium to iron ratio is 3.02, and therefore higher than 2.8 and 3.0, which is considered suitable for metallurgical usage [36,37].
Figure 2 shows the mean carbon and sulfur content and standard deviation based on three measurements. Total combustion methods were carried out at IME and by two external laboratories.
The carbonate analysis after Scheibler determined a carbonate content of 0.81 wt% expressed as CaCO3, equivalent to 0.097 wt% carbon in carbonates. Therefore, the amount of carbon in carbonates is slightly lower than the total carbon content determined by the total combustion method.

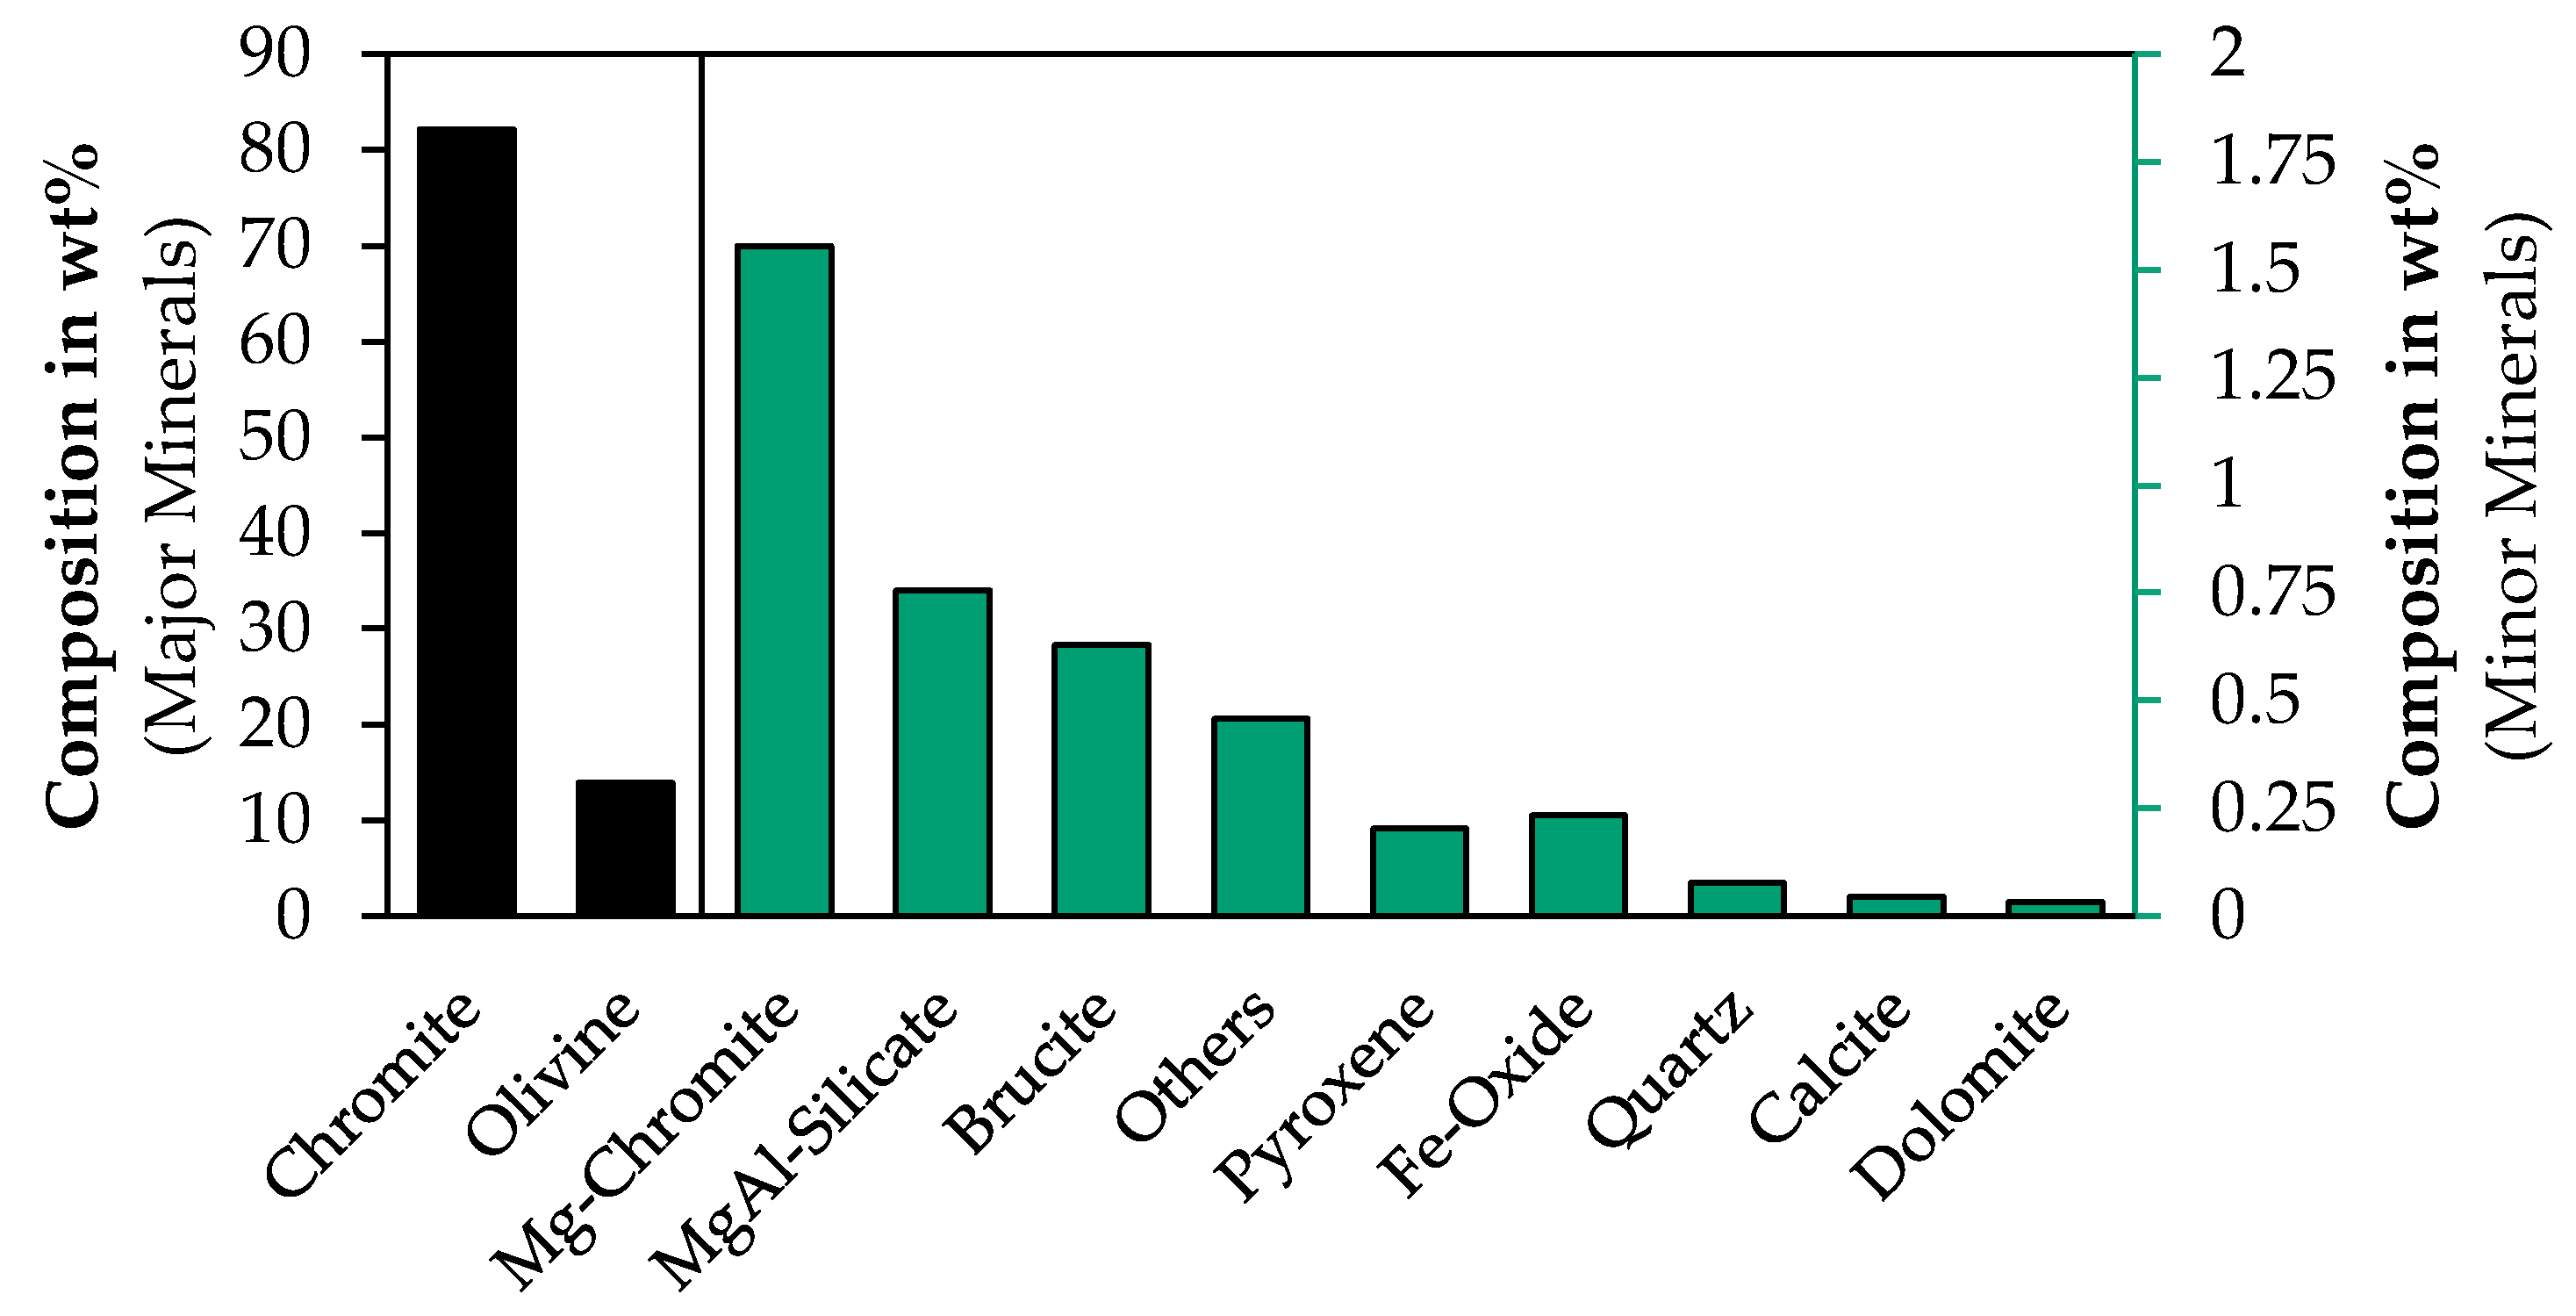
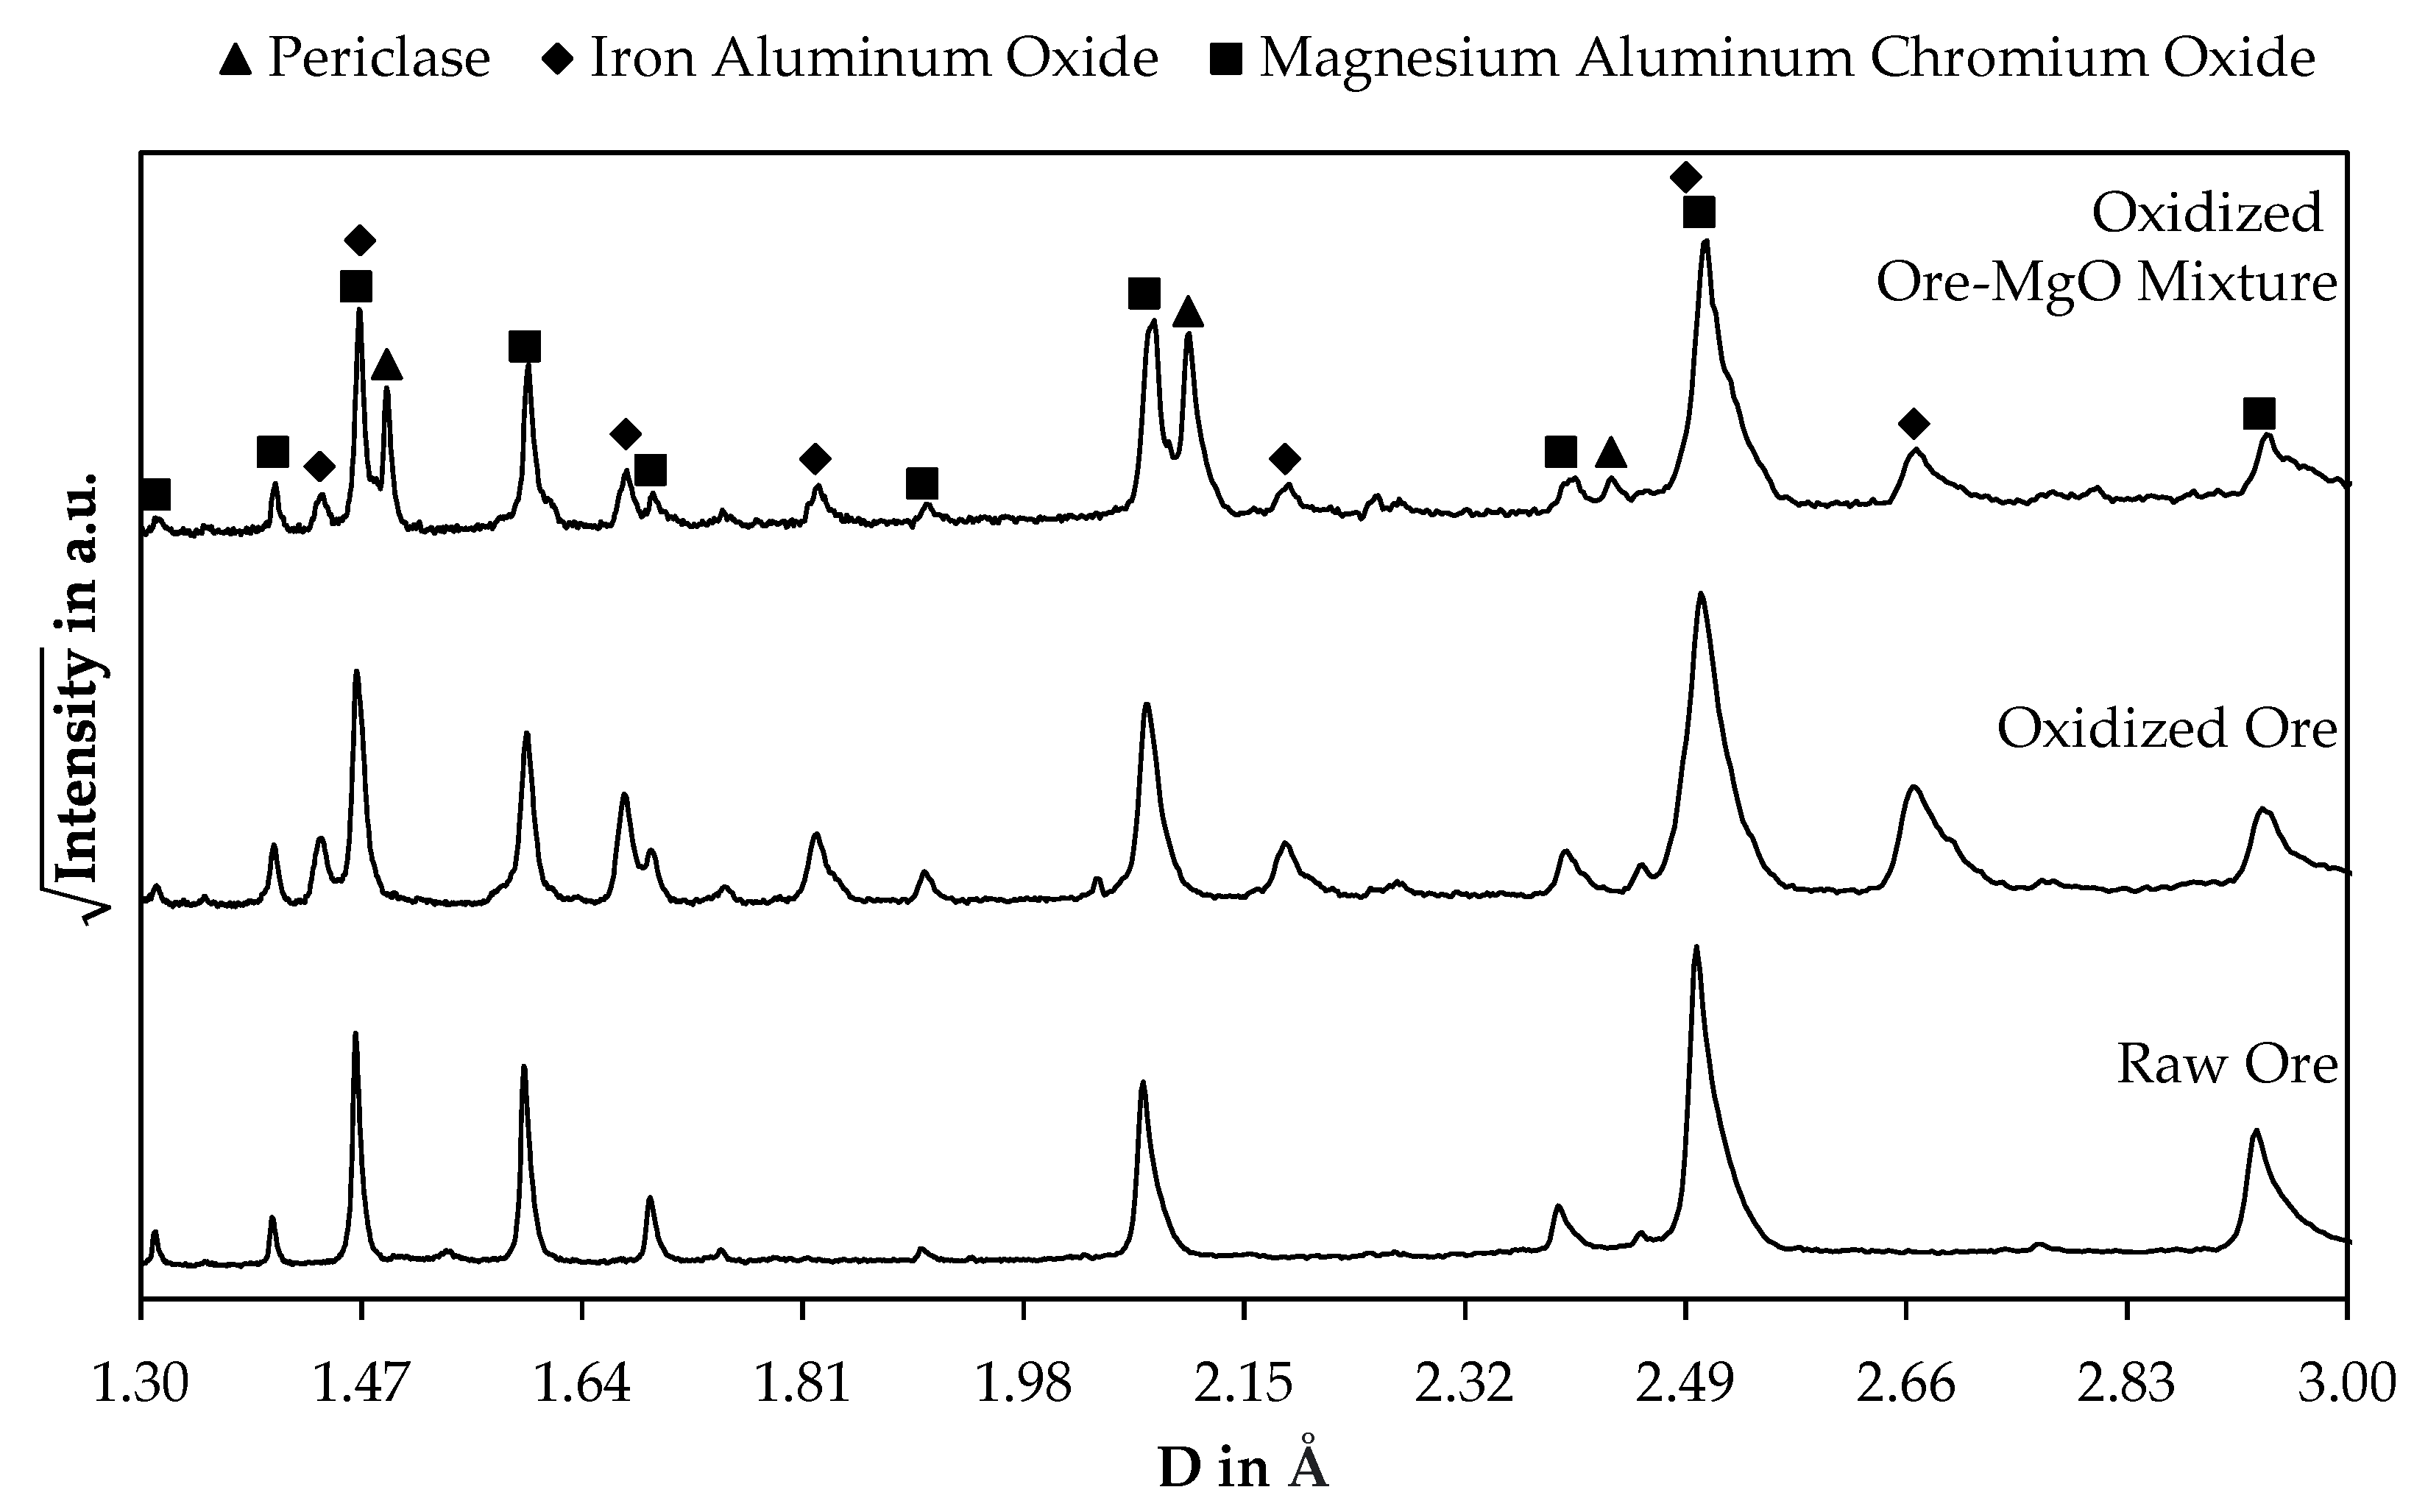
3.2. Mineralogical Investigation of the Chromite Concentrate

To investigate the mineralogy of the chromite sample, X-ray diffraction, Raman microscopy, and QEMSCAN® is used.

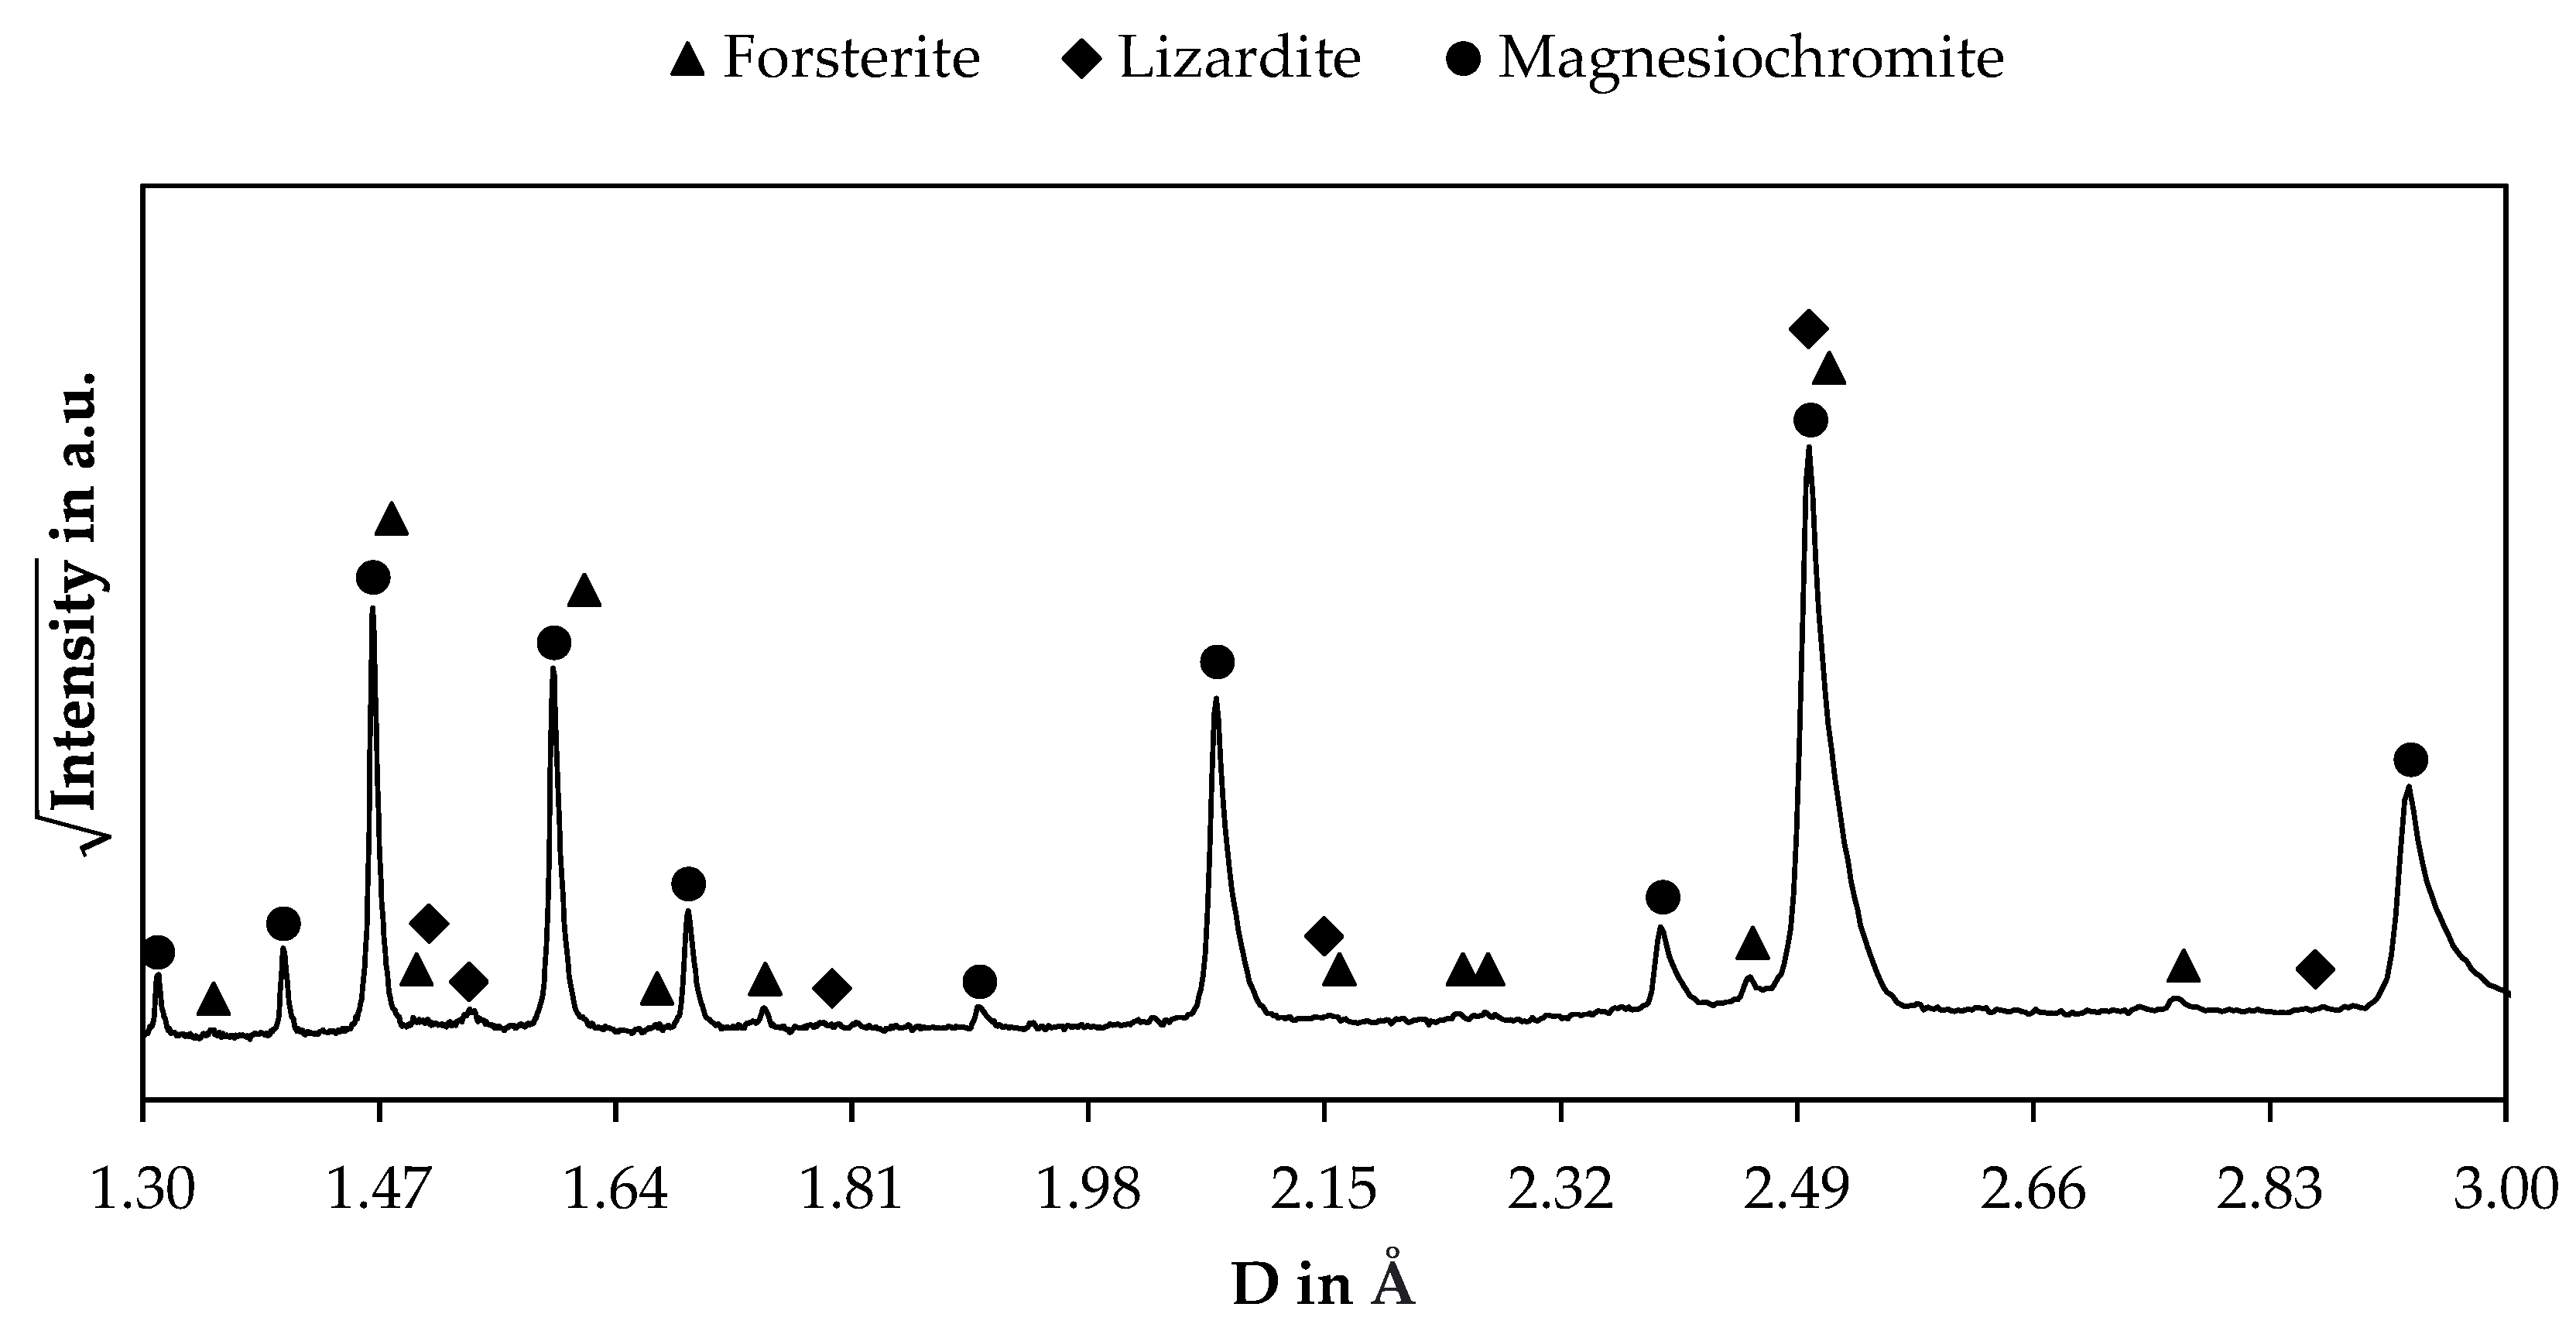
3.2.1. X-ray Diffraction

Figure 3 shows the XRD pattern of the chromite concentrate.
Dominant peaks are explainable by a magnesiochromite spinel. The PDF-card 04-024-3779 is used in this case with the chemical formula Mg0.56Ti0.01Cr1.33Fe0.51Al0.59O4. Minor peaks are explainable by forsterite and lizardite, however due to the low intensity of those peaks, the content of those minerals is relatively low compared to that of magnesiochromite. For forsterite the PDF-card 00-004-0768 with the chemical formula Mg2SiO4 is used and for lizardite the PDF-card 04-012-9602 with the chemical formula Mg2.7Fe0.18Al0.3Si1.81O5(OH)4 is used.

3.2.2. Raman Microscopy
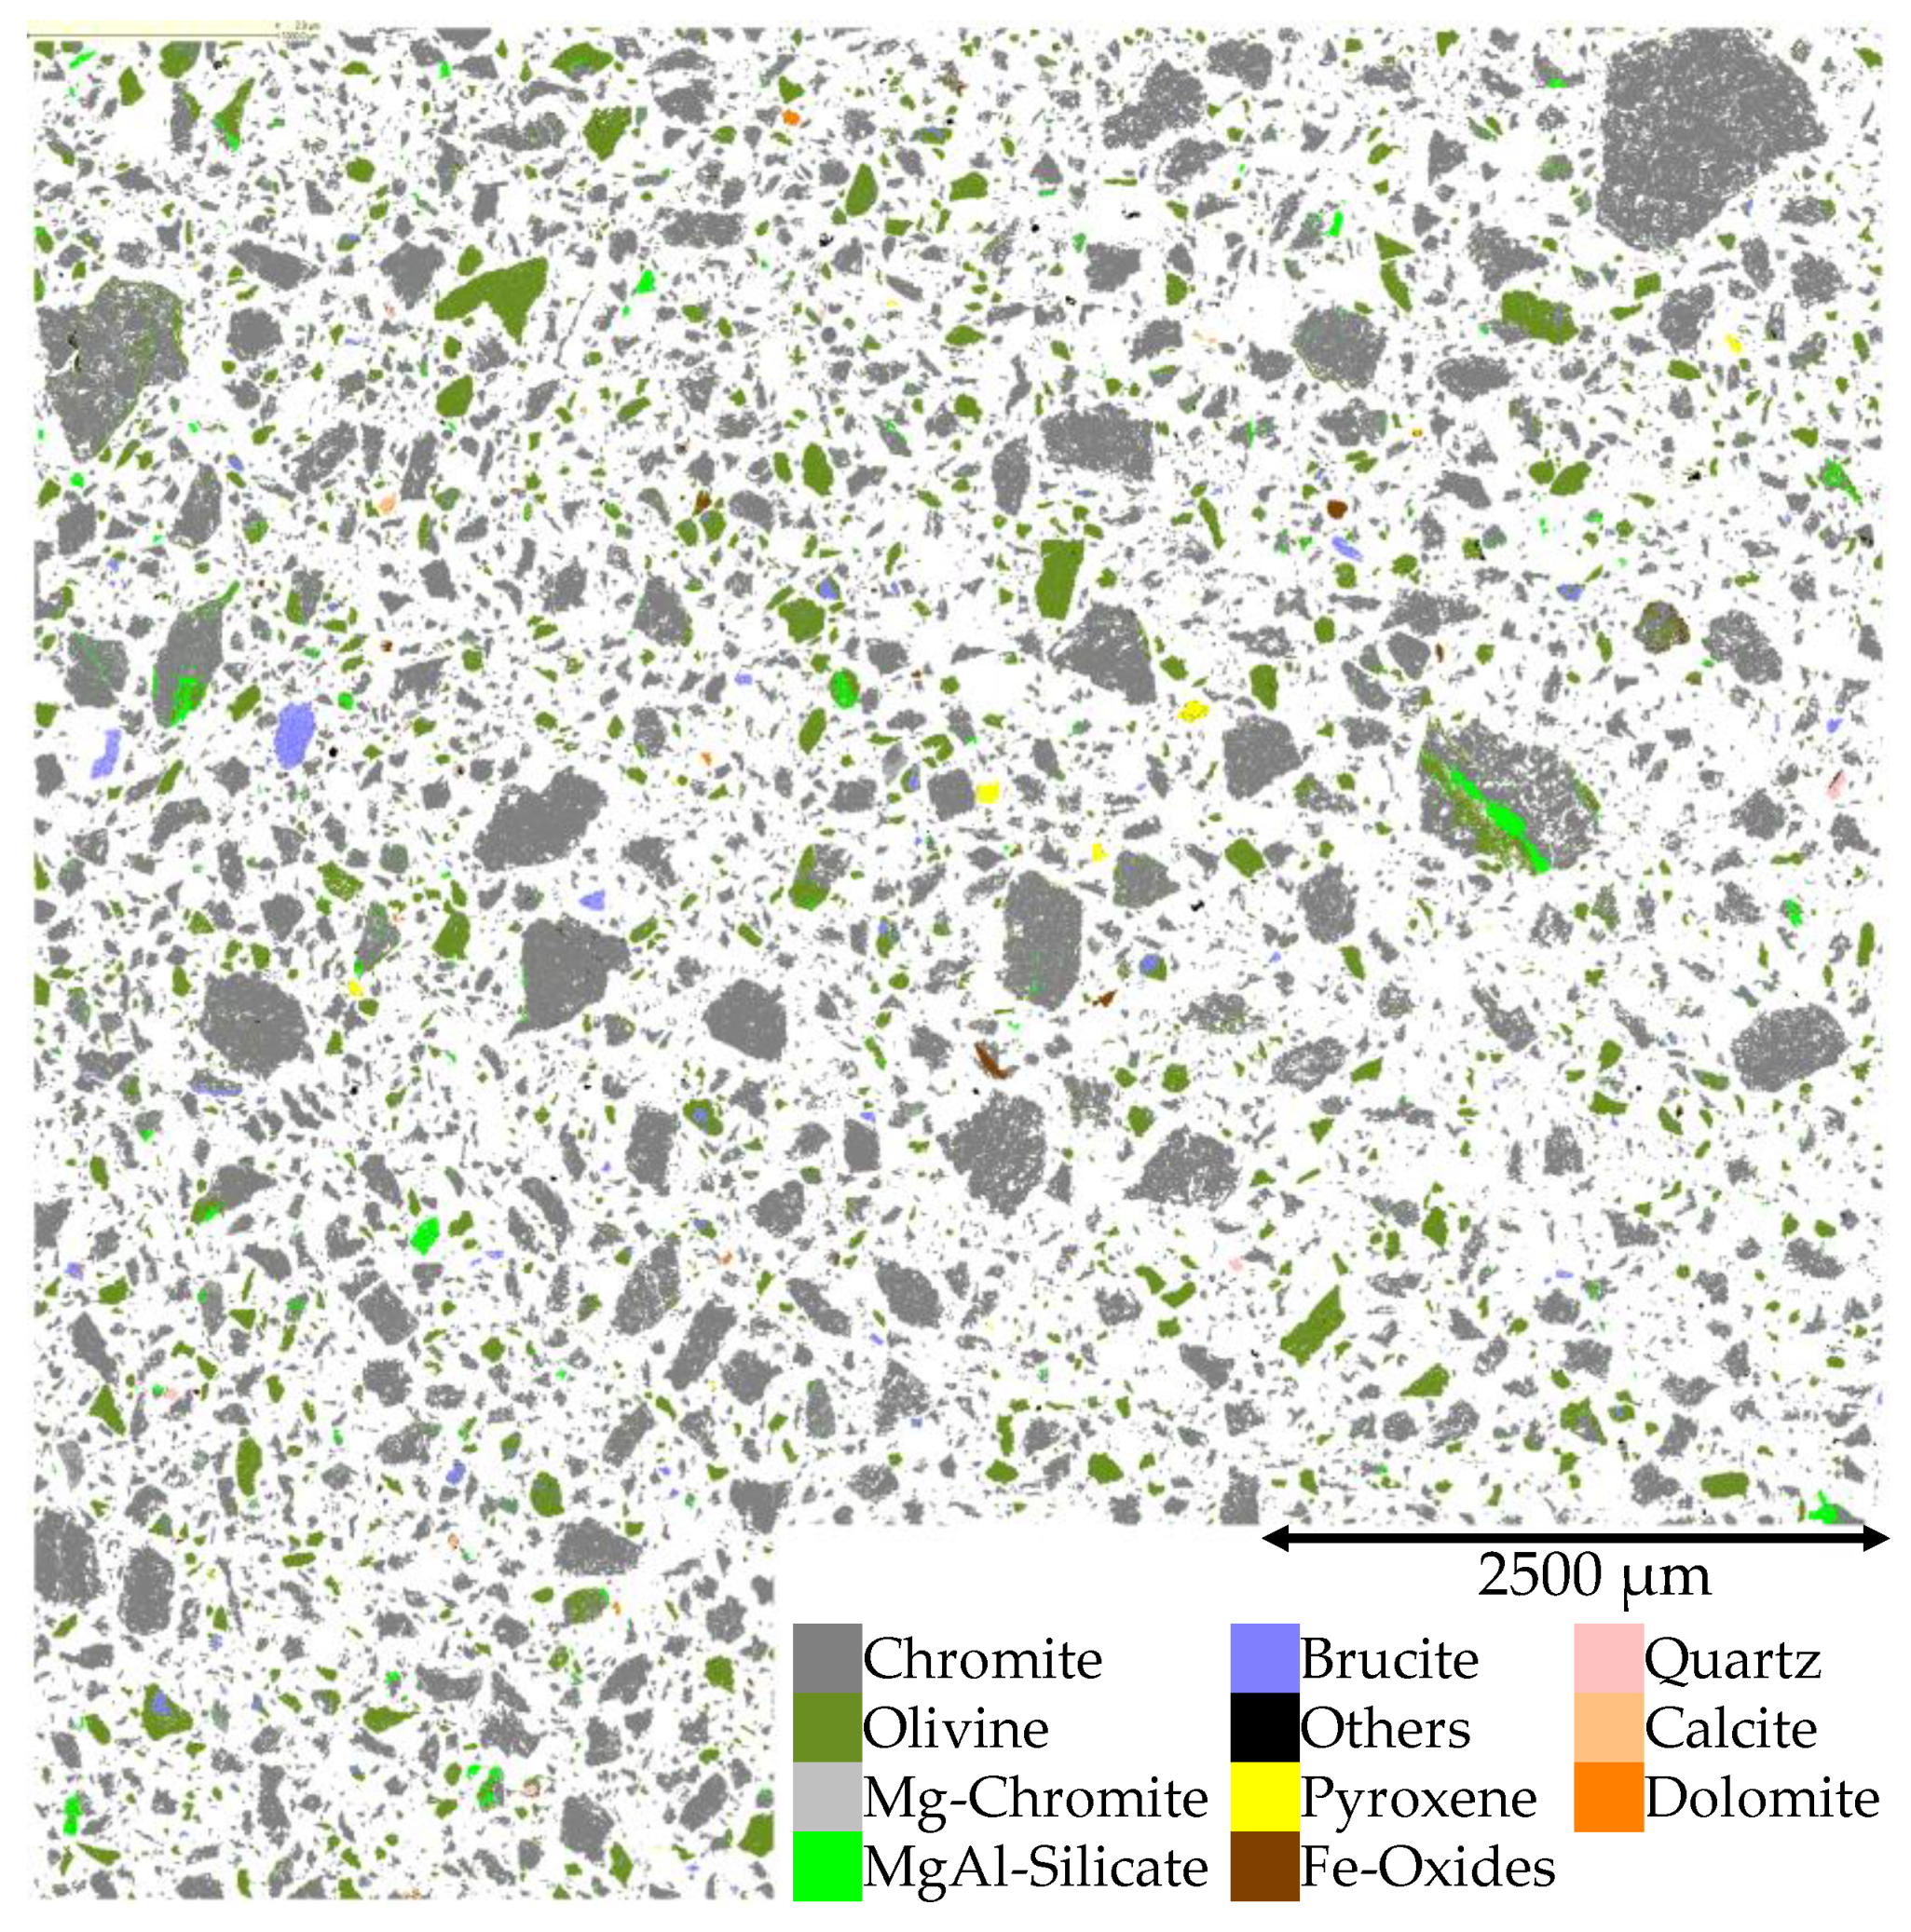
Table 1 shows the minerals present in the sample identified with a Raman microscope. The Raman spectra of each mineral are given in the Supplementary Material. The chemical formula shown in Table 1 is based on “The New IMA List of Minerals” [38].

3.2.3. QEMSCAN®

For a quantitative analysis of the mineralogical composition, the QEMSCAN® method was used. Figure 4 shows the false-color image of the investigated sample.
Figure 5 shows the mineralogical composition of the sample in weight percent. The determined composition in volume percent and the density data [39] used for the conversion into weight percent are given in the Supplementary Materials.
The major component in the ore is chromite, followed by olivine. Chromite was identified with Raman spectroscopy and XRD as well. Forsterite and fayalite were identified with Raman spectroscopy, both are the endmembers of the olivine solid solution. Forsterite was also identified by XRD. Magnesiochromite, brucite and quartz were all identified by Raman spectroscopy and QEMSCAN®. Dolomite and iron oxides were identified by QEMSCAN®, but not by Raman spectroscopy. In the QEMSCAN® results, CaCO3 is only expressed as calcite, however Raman spectroscopy confirmed the presence of calcite and aragonite. Furthermore, the content of carbonates present in the sample according to QEMSCAN® is lower than the determined carbonate content with the Scheibler method. Either the QEMSCAN® measurement is underestimating the value of carbonates in the sample, or the Scheibler method yielded higher values for the carbonate content, which could be possible if other gases like H2S evolved during the carbonate determination [31]. Pyroxenes were identified by QEMSCAN®, while Raman spectroscopy confirmed the presence of enstatite and diopside, which are part of the pyroxene group.

3.3. Analysis of the Ferric/Ferrous Ratio

The ratio of ferric to ferrous iron is determined using the Mössbauer spectroscopy method, furthermore, two wet chemical methods are used and presented in this chapter.

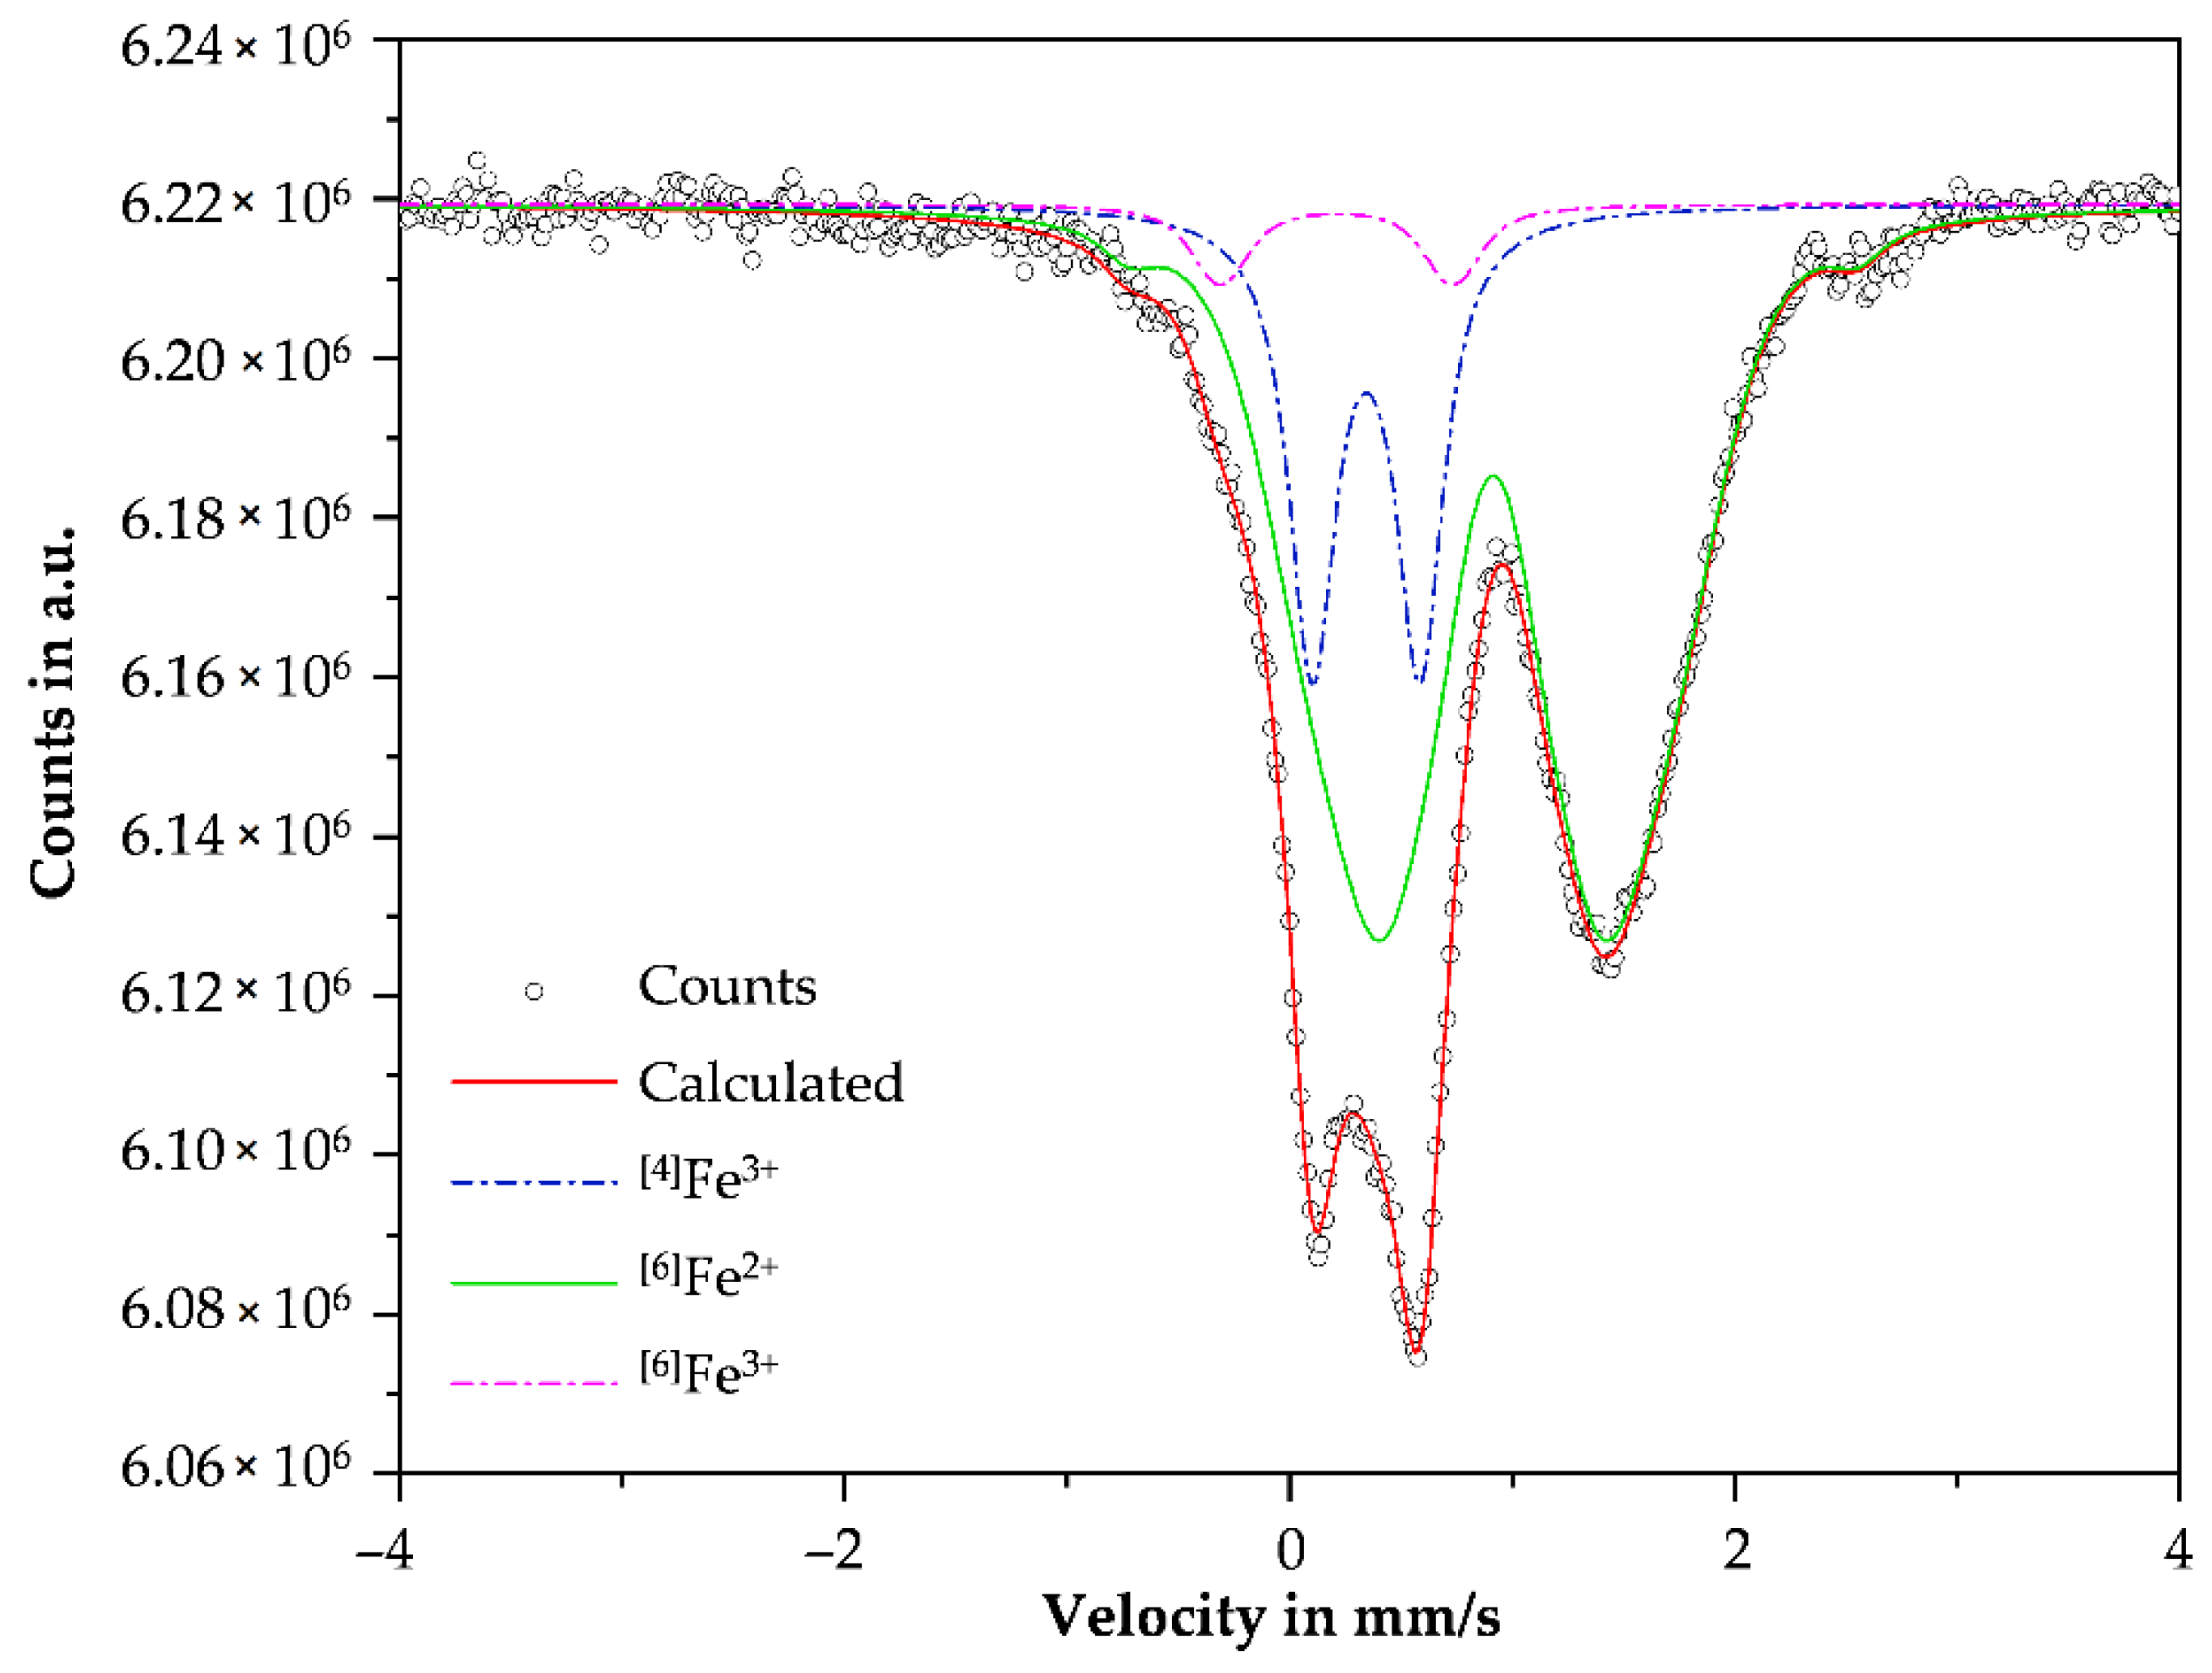
3.3.1. Mössbauer Spectroscopy

To investigate the ratio of ferric and ferrous iron in the sample, Mössbauer spectroscopy is carried out. Figure 6 shows the 57Fe-Mössbauer spectrum of the sample.
The Mössbauer spectrum of the investigated sample shows a broad resonance absorption contribution, containing three principal lines, which can be assigned to three principal doublet sites, based on quadrupole splitting values and the isomer shift. The dominating site belongs to ferrous iron, while the other two sites belong to ferric iron. Typically for spinels is the broad contribution of Fe2+ consisting of three subcomponents. This is explainable by the quadrupole splitting distribution due to different nearest-neighbor contributions next to the Fe2+-probe nuclei as observed previously in literature [40,41,42,43,44,45]. At 0.91 mm/s a characteristic isomer shift for the Fe2+-tetrahedral coordination is visible [46]. The isomer shift at 0.35 mm/s is assigned to Fe3+ in octahedral coordination. Residual components low in intensity have a typical isomer shift and quadrupole splitting values for Fe3+ in tetrahedral coordination.
Table 2 shows the extracted 57Fe-Mössbauer parameters of Figure 6 and the normalized, integrated area of the respective doublet sites.
In total, 76% of the iron is in the ferrous state and 24% in the ferric state.

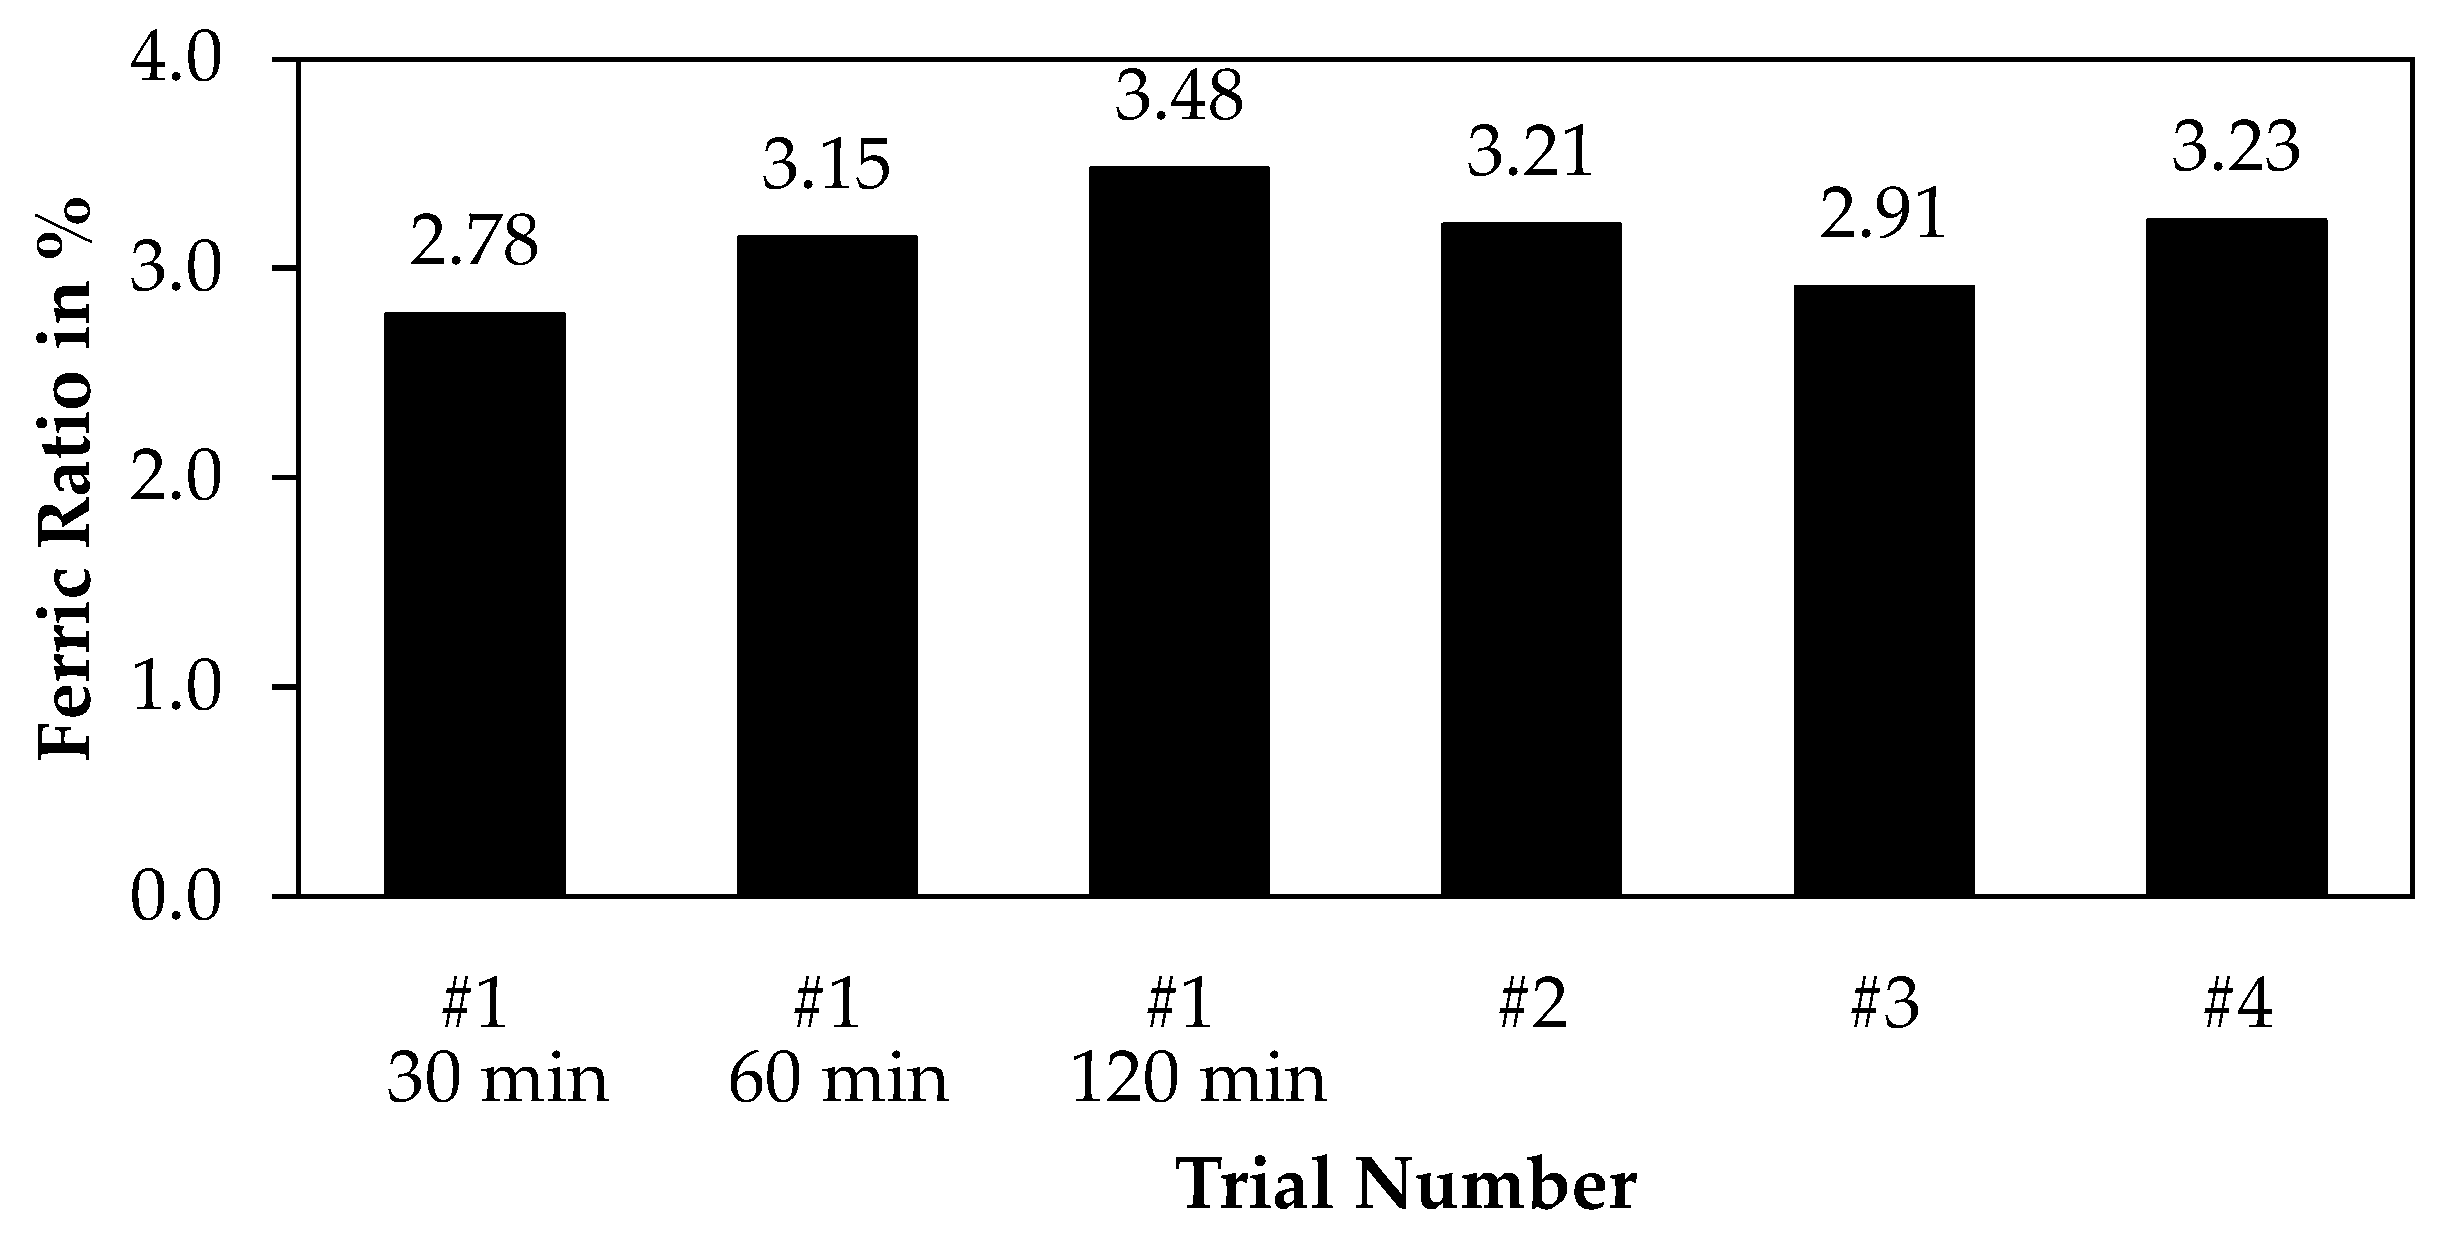
3.3.2. Wet Chemical Methods

Sweeten et al. [1] proposed a wet chemical method where hydrochloric acid is used to selectively dissolve ferric iron from chromite, while assuming that ferrous iron in the chromite will not dissolve. The leach solution is afterwards analyzed by ICP-OES to determine the concentration of ferric iron [1]. However, for Zimbabwean ore samples investigated, the wet chemical method determined lower Fe3+-contents compared to the amount of hematite and goethite predicted by XRD. The proposed method might yield lower Fe3+-contents compared to the actual amount of Fe3+ present in the sample. Table 3 shows the parameters investigated for the nonstandardized Fe3+ determination. In addition, during trial one, samples of the solution were taken after 30 min and 60 min.
Based on the analyzed leach solution and the total amount of iron given in Figure 1, the ferric ratio is calculated and shown in Figure 7.
Trial one after 60 min and trial 2 and 4 resulted in similar values, therefore, the influence of the solid-liquid ratio and the molar concentration seems to be rather small. The raw sample resulted only in a ferric ratio of 2.91%. Comparing the samples taken during trial 1, increasing the leaching time by 30 min still results in a steady uptake of iron, increasing the ferric ratio by 0.37% and 0.33%, and therefore the relative increase is larger than 10%, which is an unacceptably high value. As the determined values for the ferric ratio were significantly apart of the value determined by Mössbauer spectroscopy, the trials were not continued with other parameters. A higher leaching time or higher temperature might be necessary, to dissolve the ferric iron completely. However, to avoid the oxidation of Fe2+, high temperatures were not used in this study, as this might lead to the oxidation of ferrous iron [47].
Especially since the leaching of minerals containing ferrous iron by hydrochloric is reported in the literature [48,49,50], the selective leaching of the ferric iron by hydrochloric acid might not be possible, depending on the valence state iron has in the gangue minerals.
Another wet chemical method used was the procedure described in ISO 9035 [51] applicable to iron ores. The acid-soluble Fe2+ content was analyzed by a certified laboratory after this procedure. For this test, a pulverized ore sample is transferred into a flask and acid-soluble Fe2+ is leached in hydrochloric acid with sodium carbonate or sodium hydrogen carbonate. A Göckel safety trap is used to prevent oxidation of the sample by air. For decomposition, the sample is heated to 90 °C for a leaching time between 30–60 min. The Fe2+-content is then determined by titration [51]. The analysis determined an acid-soluble iron content of 1.03 wt%, which is equivalent to a ferrous ratio of 9.41%. This is also significantly below the ferrous ratio determined by Mössbauer spectroscopy.
Both wet chemical methods determined significantly different values compared to the Mössbauer spectroscopy results. Especially since hydrochloric acid is used for both methods, but different valence states should be selectively leached, it is doubtful whether those methods are applicable to chromite ores.

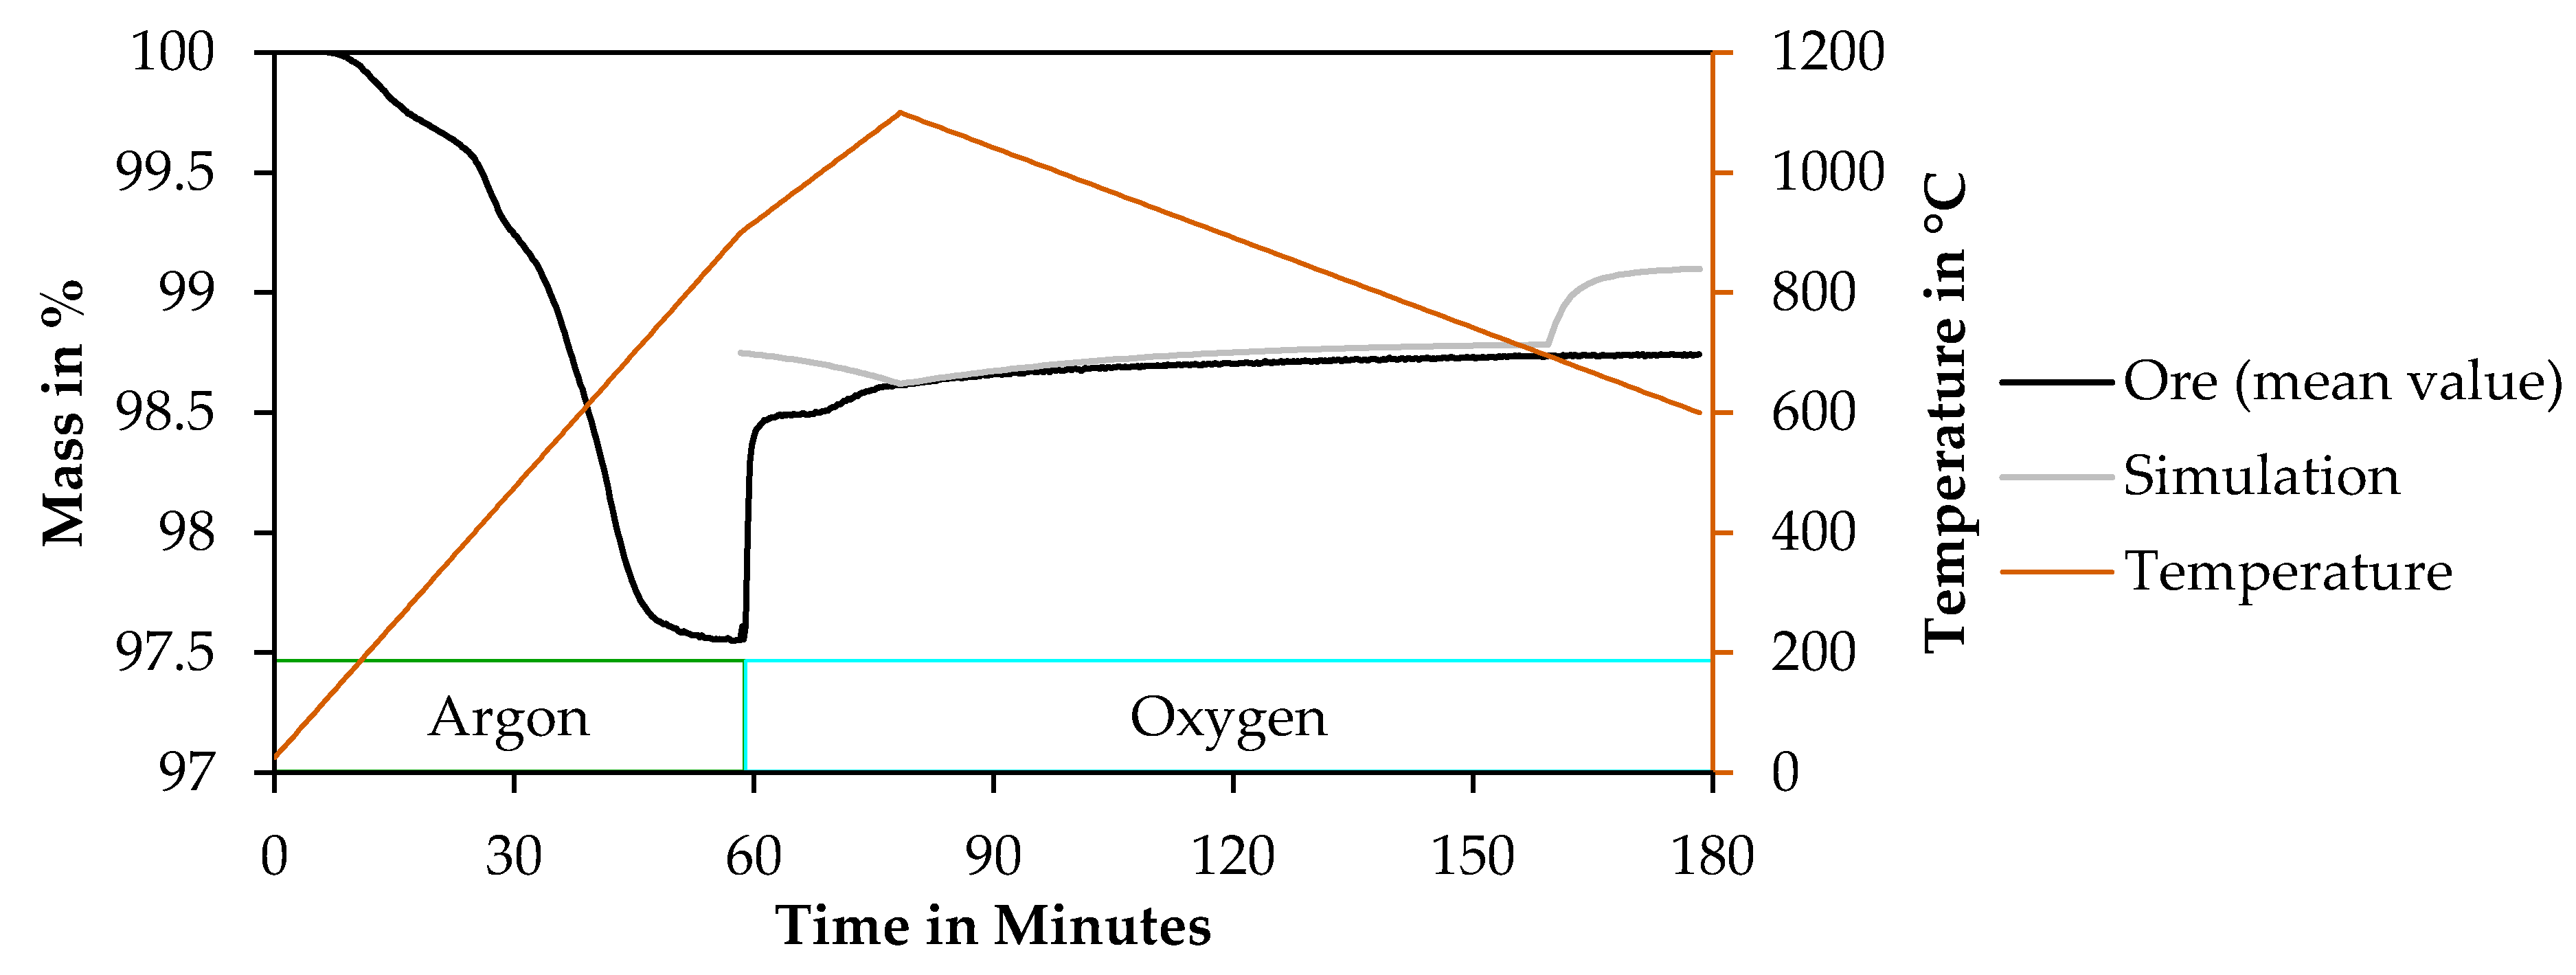
3.4. Thermogravimetry of Chromite Concentrate to Measure the Content of Ferrous Iron

To investigate the mass change of the ore sample under inert and oxidizing conditions, thermogravimetric trials were conducted. Those trials aim to determine the amount of ferrous iron in the sample, based on the mass increase occurring under oxidizing conditions.

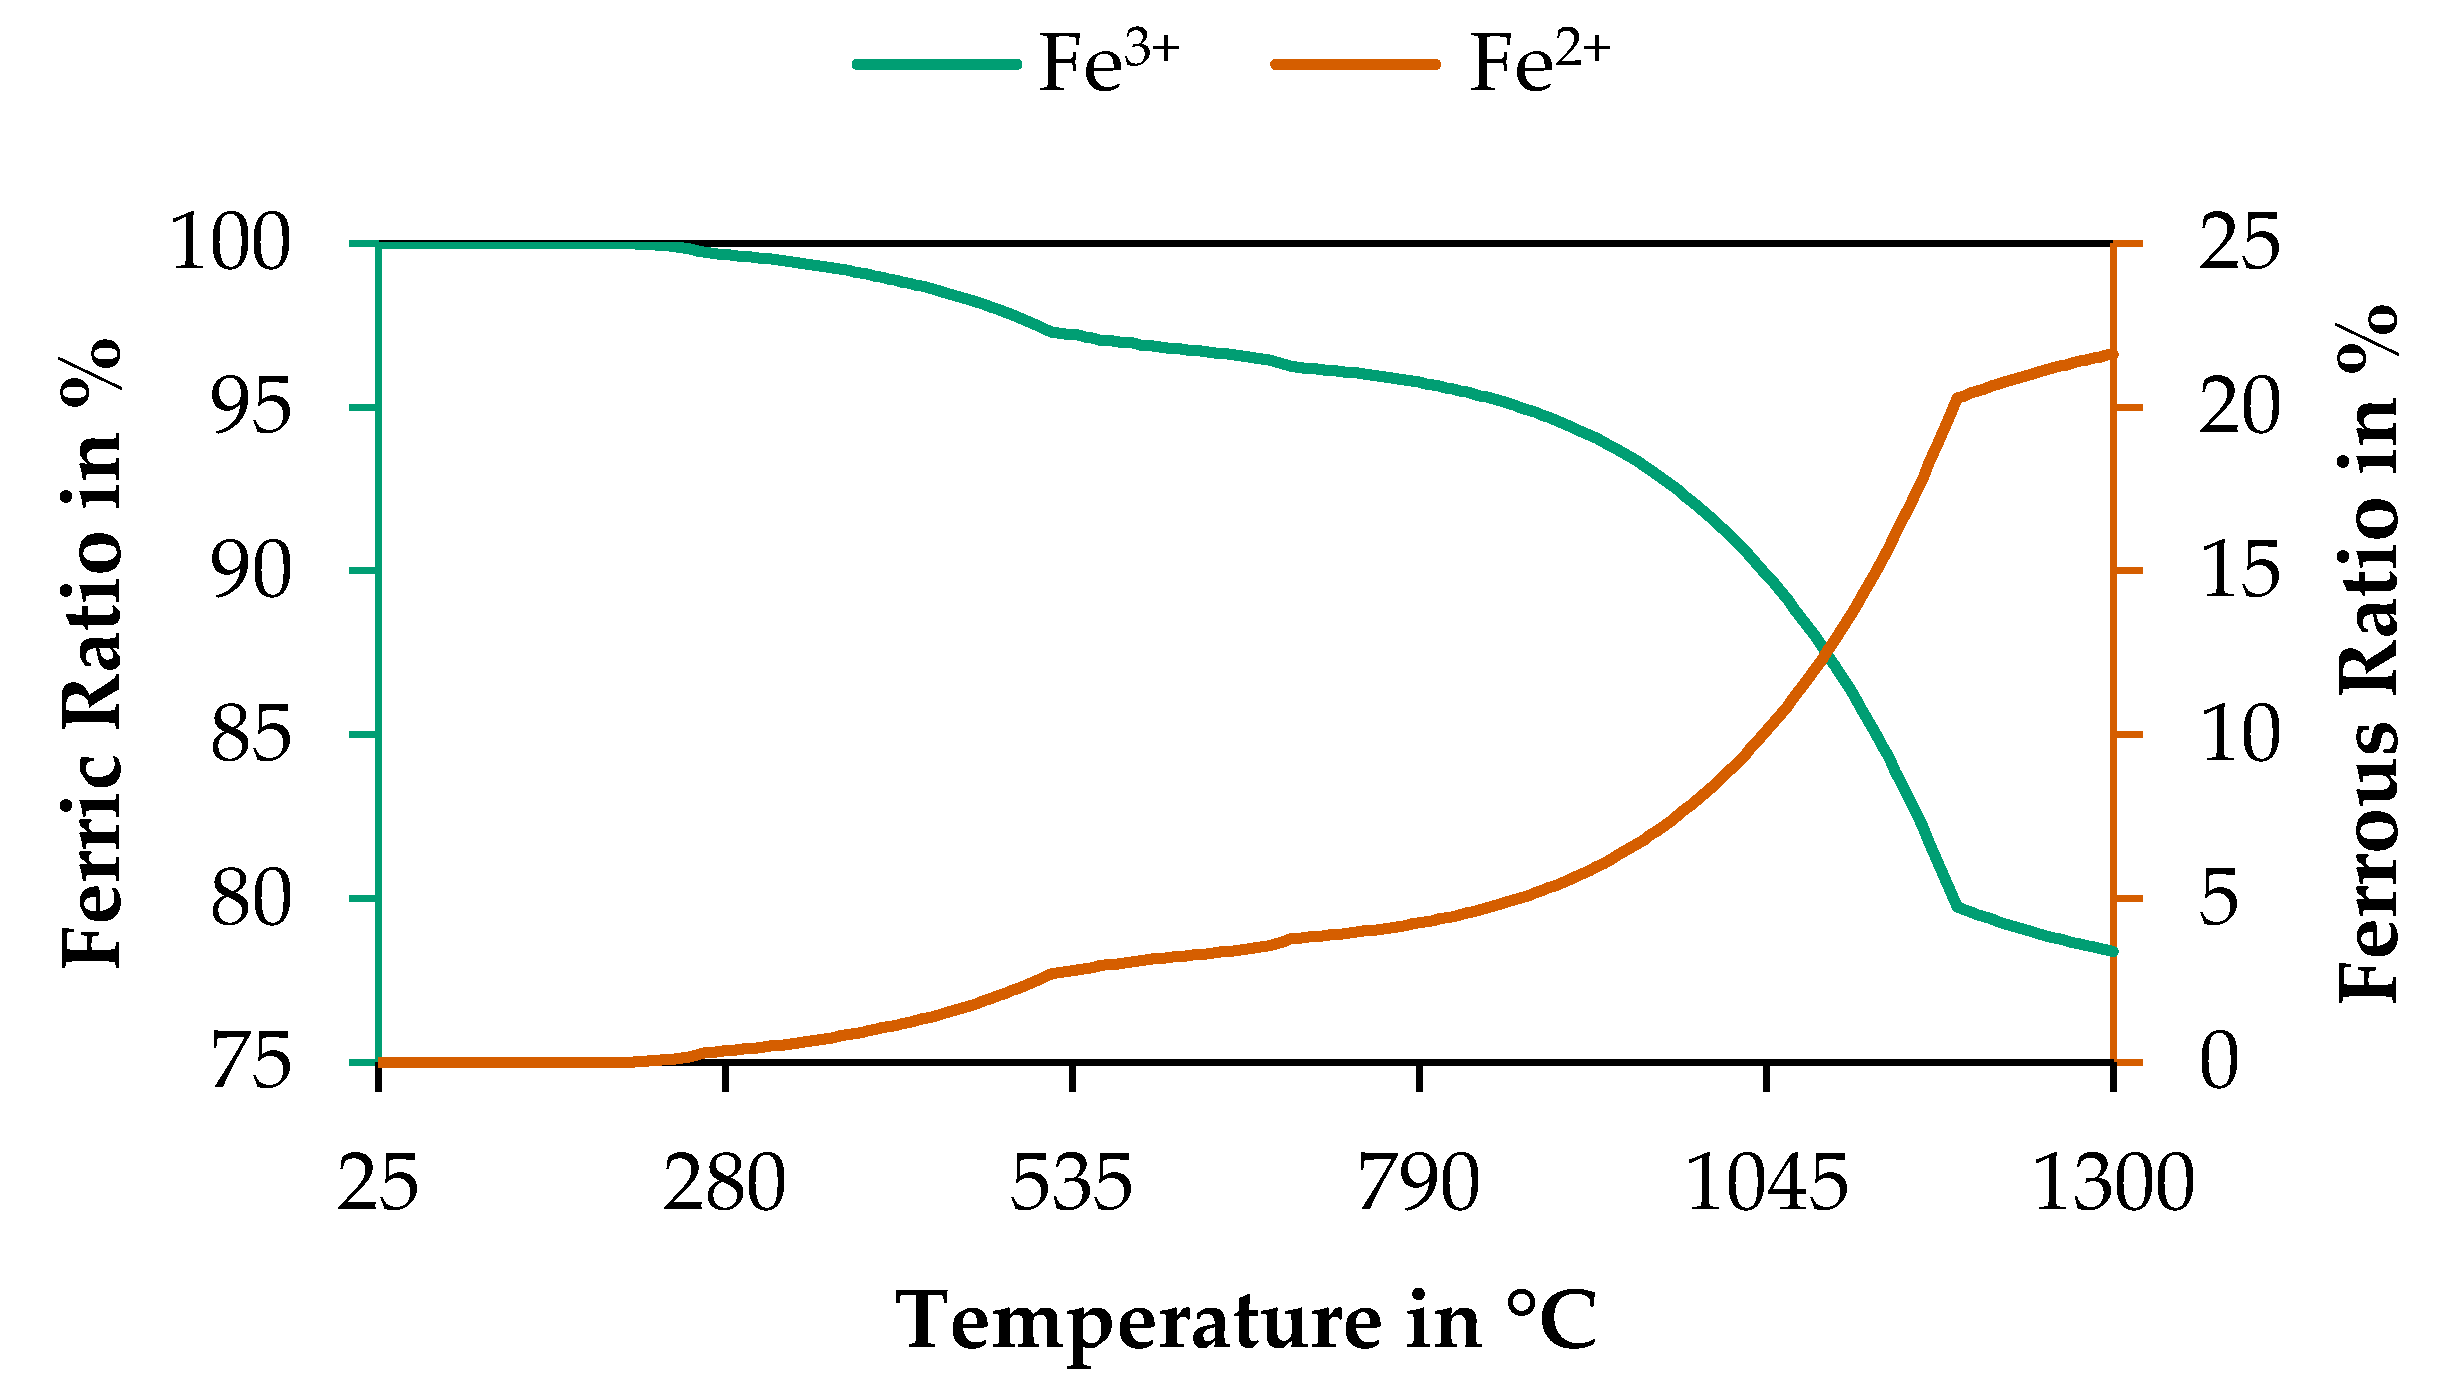
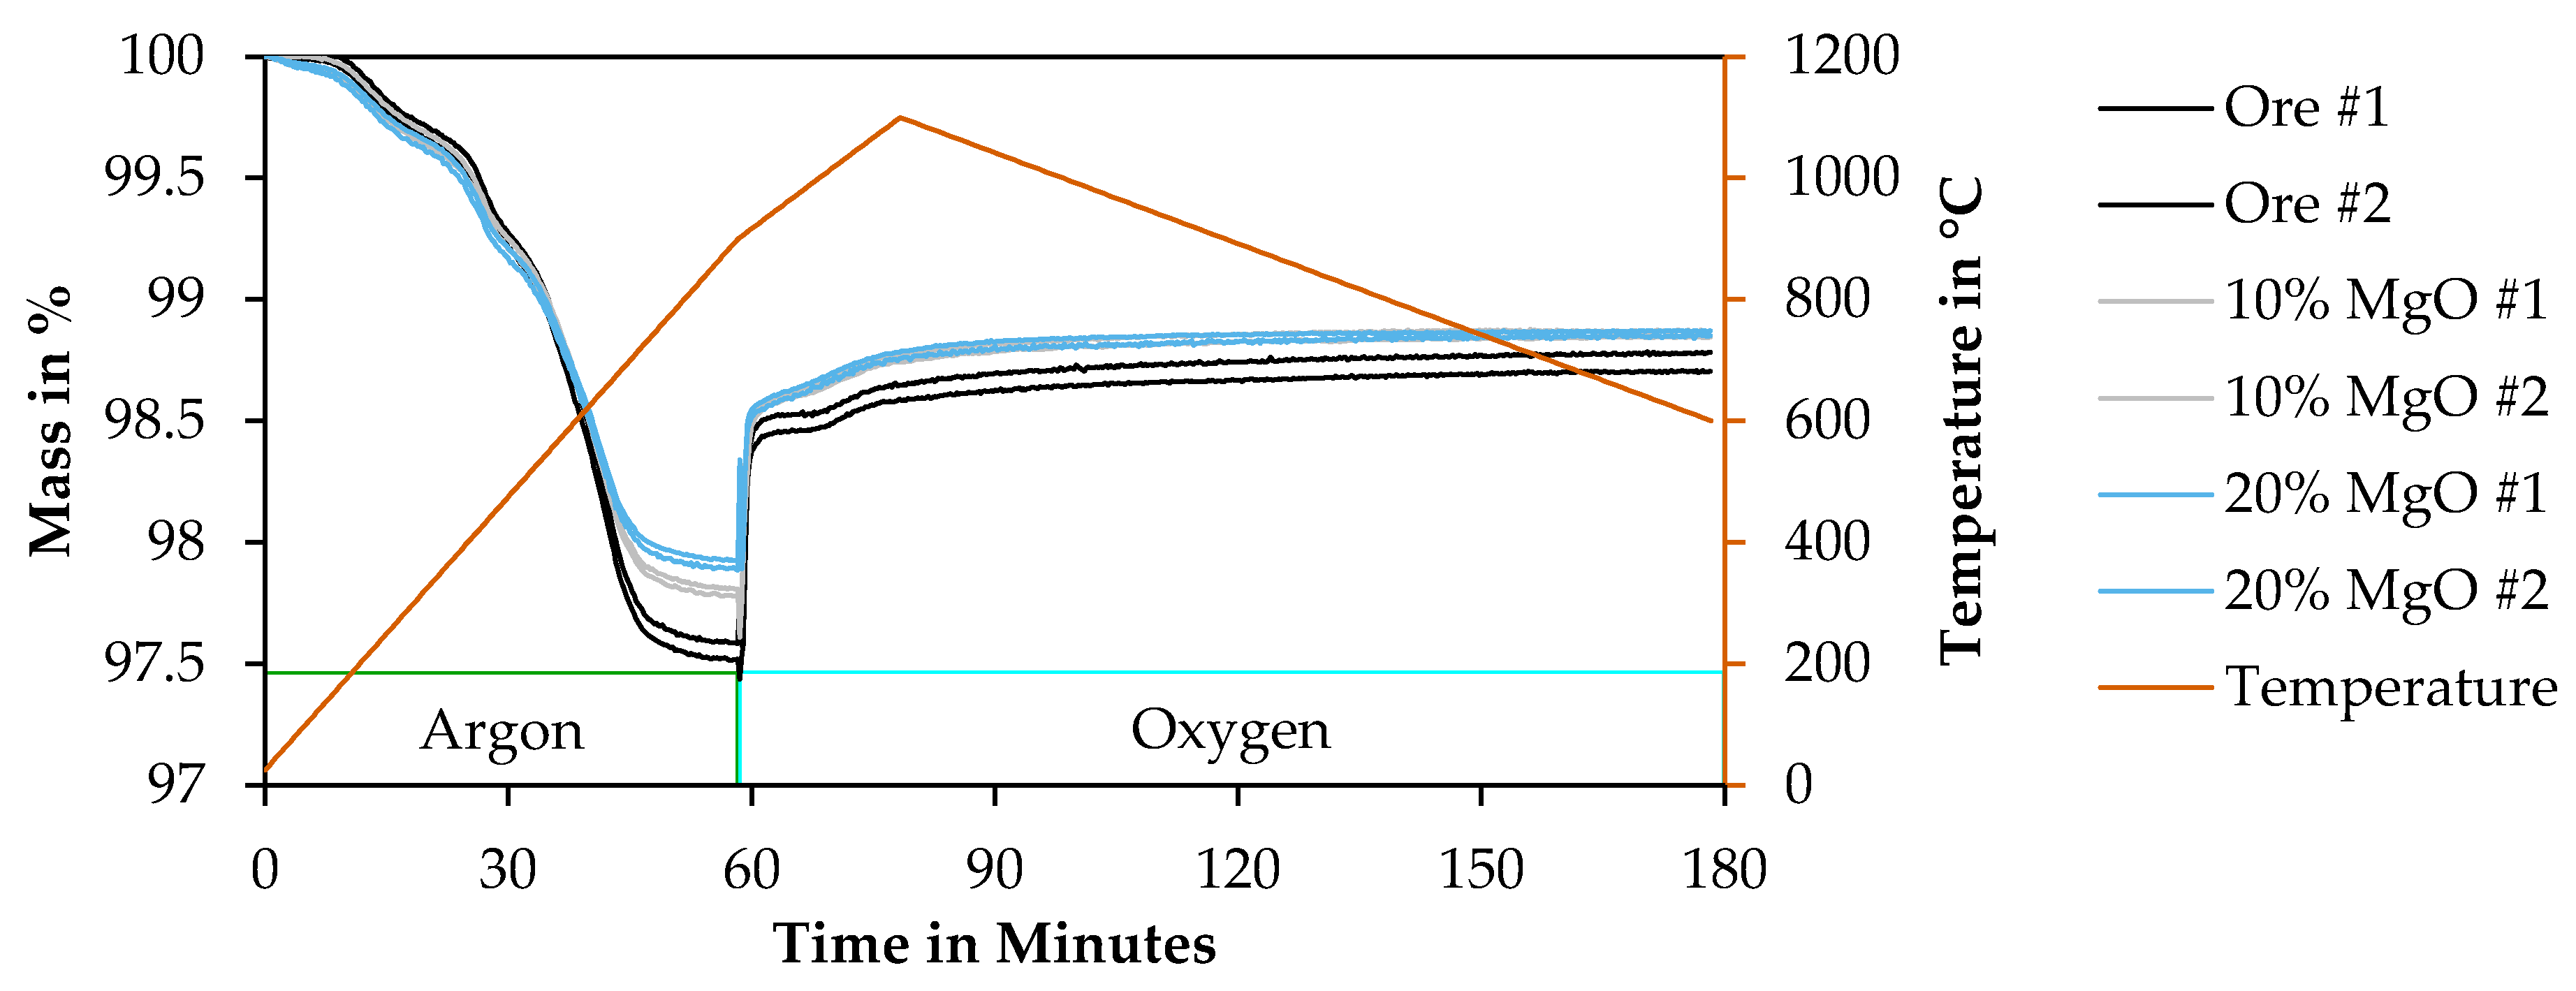
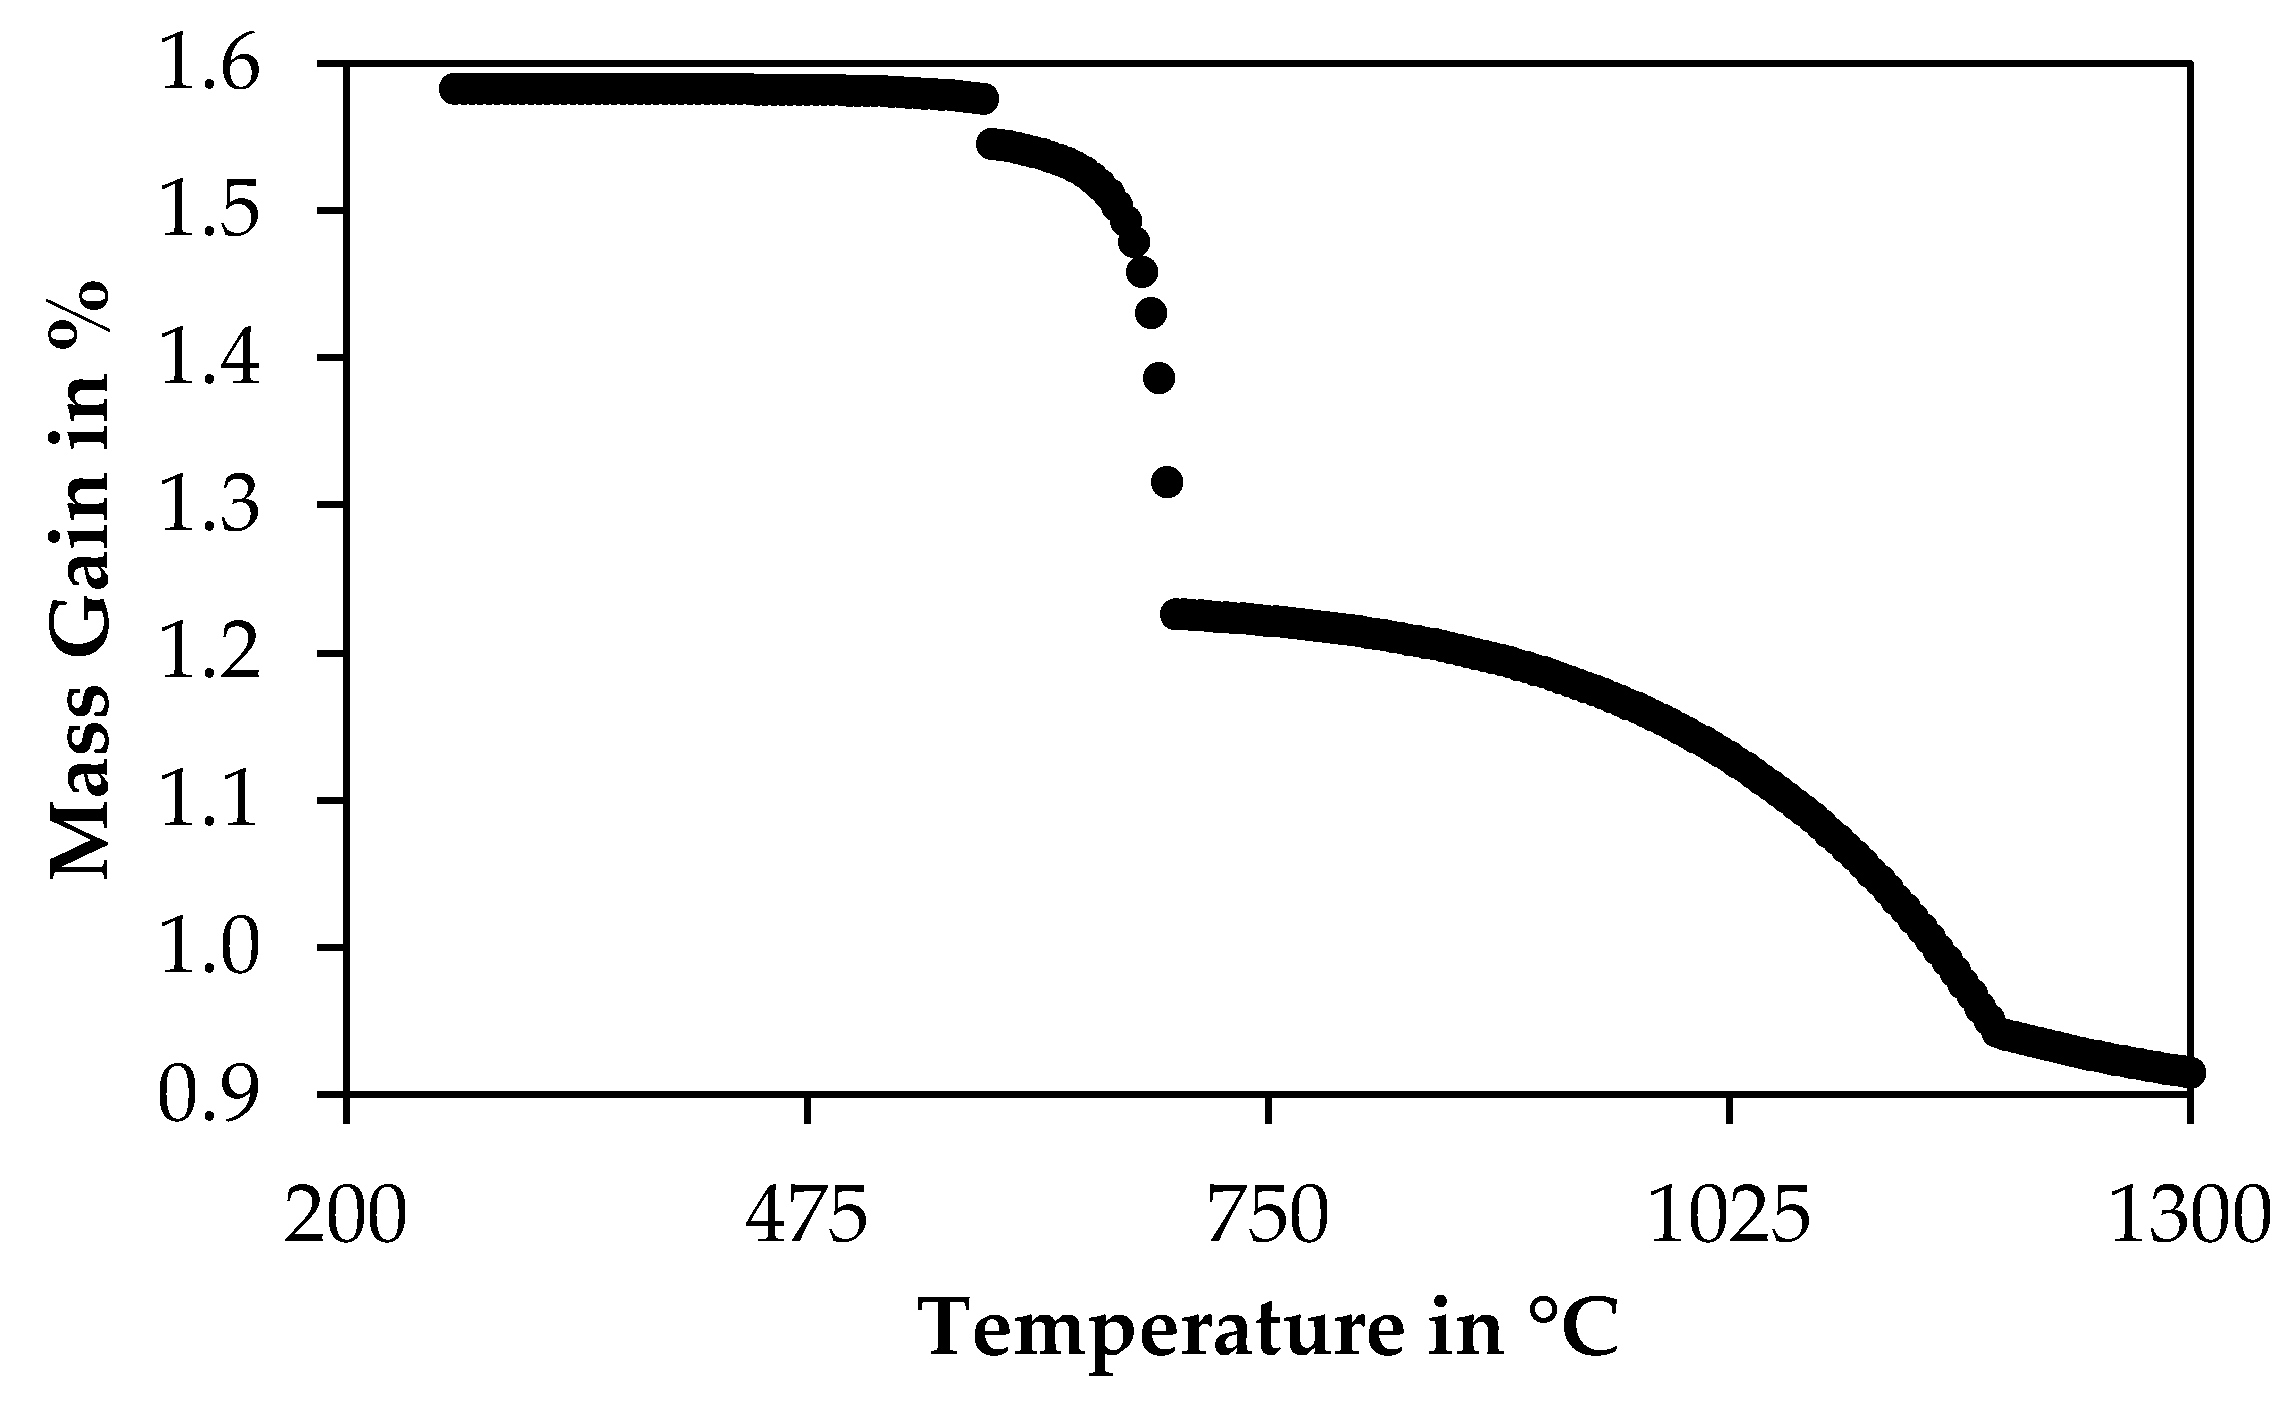
3.4.1. Determination of a Suitable Thermogravimetrical Program

To remove volatile compounds from the ore that would interfere with the measurement of ferrous iron, the ore is heated up to 900 °C. Argon atmosphere was used to avoid oxidation of iron in this step. After the mass is only decreasing slightly, the atmosphere is changed to an oxygen atmosphere to oxidize iron. The sample is heated up to 1100 °C, to rapidly oxidize a major share of the iron. Afterwards, the sample is slowly cooled in an oxygen atmosphere to 600 °C. This is performed because a thermochemical simulation of the ore sample in equilibrium with an oxygen atmosphere predicts that, at lower temperatures, more iron is oxidized to ferric iron. Figure 8 shows the ferric and ferrous ratio of the sample according to the thermochemical simulation.
Especially at higher temperatures, even in an oxygen atmosphere the iron is only partially oxidized, and a major share remains in the divalent state; therefore, oxidizing the sample at lower temperatures may be necessary to increase the accuracy of the measurement.
The proposed and used temperature profile and atmosphere are shown in Table 4.

3.4.2. Results of Thermogravimetry Measurements

In addition to the raw ore samples, mixtures of ore with 10 wt% MgO and 20 wt% MgO were investigated by thermogravimetric trials. This was done, based on the assumption, that ferrous iron in the chromite solid solution ((Fe2+,Mg)(Fe3+,Cr,Al)2O4) might be bound with chromium and aluminum. MgO was therefore added to liberate ferrous iron from the solid solution, which might be easier to oxidize afterwards. Figure 9 shows the thermogravimetric plot of the raw ore and the mixtures with MgO. Two samples were measured per mixture.
The mass of the ore in the first segment is decreasing rather fast in the beginning, while at temperatures above 750 °C a plateau is reached, where the mass is relatively constant. When the atmosphere is switched to oxygen, the measurement and baseline measurement are fluctuating for 30 seconds. Afterwards, the sample mass increases rapidly, followed by a more slowly mass increase afterwards. Table 5 shows the mass of the samples and the mass gain relevant for the determination of the ferrous iron content. The mass after calcination is determined by the mean value measured under argon atmosphere between 778 °C and 856 °C. The mass after oxidation is determined by the mean values measured under an oxygen atmosphere between 702 °C and 604 °C in the cooling segment. Furthermore, the standard deviation in those segments is given as well. The mass gain due to oxidation is defined as the mass after the oxidation reduced by the mass after calcination.
Based on the assumptions, that the mass gain is only due to the oxidation of ferrous iron to ferric iron and that iron was oxidized completely, the initial FeO-content in the sample can be calculated with Equation (1):
wt % FeO = Δ m ·   M FeO 1 2 · M O
while Δm is the mass gain after oxidation and MFeO and MO are the molar mass of FeO and O. Table 6 shows the measured FeO-content based on the thermogravimetric analyses and the according Fe2+-content. Using the total iron content presented in Figure 1 and the diluted iron content in the mixtures with MgO, the ferrous ratio can be calculated in the samples.
The determined ferrous ratios in the samples are between 74.717% and 75.896% and therefore slightly below the determined ferrous ratio of 76% by Mössbauer spectroscopy. Lower values than expected were also confirmed by Zorzi et al. [24] investigating synthetic ilmenite and magnetite. The trials by Zorzi et al. [24] were carried out at 1000 °C, which could be too high considering, that the thermochemical simulation presented in Figure 8 predicts residual ferrous iron at high temperatures.
The mean ferrous iron ratio in the six samples was 75.205% with a standard deviation of 0.401%. As can be seen, the addition of MgO did not yield a higher amount of ferrous iron, therefore it seems to be unnecessary to add MgO to the ore. However, in ores rich in aluminum with a lower magnesium content, it might be necessary to add MgO to liberate iron from the spinel structure.

3.5. X-ray Diffraction of Oxidized Chromite Concentrate

Figure 10 shows the XRD pattern of the raw chromite sample as already shown in Figure 3 and in addition the ore sample after the thermogravimetric trial and the ore-MgO mixture containing 20% MgO after the thermogravimetric trial. Before XRD, the sample of the first and second thermogravimetric trial were mixed.
According to XRD, the most dominant peak still belongs to a spinel phase, “magnesium aluminum chromium oxide” with the PDF-card number 0-024-3065 was used in this case, however, the peak positions of this reference card are similar to the magnesiochromite used in Figure 3; therefore, by XRD it is not possible to show that the iron in the spinel is oxidized.
As a new mineral, “iron aluminum oxide” with the PDF-card number 04-002-4945 and the chemical formula Fe1.53Al0.47O3 is identified. As this phase contains iron in the trivalent state, it can be stated that divalent iron was oxidized in the thermogravimetric experiment to form this new mineral. As a second potential candidate with similar peaks, “chromium iron oxide” with the chemical formula Cr1.3Fe0.7O3 and the PDF-card number 00-035-1112 was considered, however, the measured peaks were corelated more closely with the “iron aluminum oxide” phase. According to the thermochemical simulation, the ore oxidized at 600 °C should contain a corundum phase with the chemical formula Fe1.500Cr0.401Al0.099Mn0.001O3, which has a similar iron content as the “iron aluminum oxide” used as a reference.
As a third phase, periclase with the PDF-card number 04-010-4039 and chemical formula MgO was identified in the oxidized ore-MgO mixture. This shows that the added MgO at least did not react completely with the chromite concentrate.
Not shown in Figure 10 are the reference peaks of forsterite shown in Figure 3, which is still present in the samples after the thermogravimetric trial. Lizardite was not present in the samples and was probably calcinated during the thermogravimetric trial.

4. Discussion

To compare the results of the thermogravimetric analysis with the thermochemical simulation, the mean thermogravimetric analysis of the raw ore sample and the simulated mass of ore in equilibrium with an oxygen atmosphere is plotted. As a boundary condition, the input mass of ore is based on the chemical composition presented in Figure 1, assuming that 76% of iron is FeO and 24% is Fe2O3 as determined by the Mössbauer spectroscopy presented in Figure 6. The chemical composition is then normalized to the mean mass of ore after the calcination operation presented in Table 5. Figure 11 shows the measured weight of the ore sample during the thermogravimetric trial and the mass of sample according to the simulation at the corresponding temperature of the thermogravimetric trial.
The thermochemical simulation predicts slightly higher values compared to the measured values. Basic reasons could be inaccuracies in the chemical composition, Mössbauer spectroscopy measurement, or the databases used for the simulation. Methodical errors can be due to kinetic reasons. As the thermochemical simulation is always assuming that an equilibrium is reached, this does not have to be the case for the measurements. Especially at low temperatures occurring between 60 min and 78 min, and after 150 min, the mass should be significantly higher. At the beginning of the segment in equilibrium with oxygen, the measured mass is probably lower due to an incomplete ferrous oxidation, while at the end of the trial chromates form according to the thermochemical simulation, which increases the amount of the simulated mass significantly.
To investigate the mass gain according to the simulation further, Figure 12 shows the mass gain of the chromite sample according to the thermochemical simulation carried out with FactSageTM in equilibrium with an oxygen atmosphere.
The simulated mass gain for decreasing temperatures is attributed by the oxidation of different minerals and changes in the mineralogical composition. The mass gain between 1300 °C and 1185 °C is due to the uptake of oxygen by a spinel phase. Between 1180 °C and 695 °C, the main spinel phase is depleted in divalent iron and a Fe2O3-phase occurs instead. Equation (2) shows the oxidation of a spinel phase at 695 °C not in equilibrium with a gas phase to a spinel and trivalent oxide phase in equilibrium with oxygen at 695 °C. The stoichiometric factors and indices are based on the simulation using 100 g of ore. Due to simplicity reasons, the Equation is not balanced for Fe, Mg, Mn, Cr and Al. Below 690 °C, CaCrO4 (Equation (3)) is formed, which is undesirable as this mass gain would interfere with the calculation of the Fe2+-content by the determined mass gain by thermogravimetry. Below 260 °C, in addition to CaCrO4, MgCrO4 (Equation (4)) is formed.
0.422(Fe0.316,Mg0.684)(Fe0.123,Mn0.003,Cr1.502Al0.372)O4 +0.0515O2 
0.402(Fe0.001,Mg0.999)(Fe0.288,Mn0.004,Cr1.497Al0.211)O4 +
0.061(Fe1.310Mn0.001,Cr0.540,Al0.149)O3
2Cr2O3 + 4CaO + 3O2  4CaCrO4
2Cr2O3 + 4MgO + 3O2  4MgCrO4
Decreasing the temperature to 695 °C, the lowest temperature where no chromate formation occurred, results in a ferric ratio of 96.231%. As a complete oxidation of iron is a prerequisite for the determination of the ferrous iron ratio, the proposed method cannot deliver an exact value, since it is thermochemically impossible to oxidize the iron completely, without reaching temperatures where the formation of chromates is thermochemically possible. Therefore, the proposed method will underestimate the ferrous iron content slightly, which was also observable in this investigation compared to the Mössbauer measurement. However, the time expenditure for the thermogravimetrical is lower compared spectroscopy measurements or microprobe analysis. Also, it is possible to determine the ferrous iron content directly by thermogravimetry, while using Mössbauer spectroscopy is only able to determine the ferric to ferrous iron ratio.

5. Conclusions

In this paper, a thermogravimetric method to measure the ferrous content in a metallurgical-grade chromite concentrate is proposed. Mössbauer spectroscopy is employed as a reference method to determine the ferric and ferrous ratio in the sample. The ferrous and ferric ratio was also calculated using the ferrous content measured with the thermogravimetric method and the total iron content determined by XRF. The mean ferrous ratio in the chromite sample as determined by the proposed method is 75.205%, which is only slightly below the value of 76% determined using Mössbauer spectroscopy. This is explainable with the thermochemical simulation carried out to investigate the oxidation behavior of the sample, because at temperatures used for thermogravimetry iron will not be oxidized completely. In equilibrium with oxygen at 1100 °C only 86.81% of iron is in the trivalent state, at 600 °C already 98.82% is in the trivalent state.
Wet chemical methods were also investigated to determine the ferric or ferrous content but did not yield reliable results due to the refractory nature of chromite.
The investigated thermogravimetric method could be an easily applicable method to investigate the oxidation state of iron in ores, which is still a difficult to measure property, even though it is necessary for a sufficient control of metallurgical processes.
As only one chromite sample was investigated in this article, this method should be further applied and proven by reference methods investigating other chromite deposits, furthermore this method might be transferable to other iron-containing minerals or slags relevant for the metallurgical industry.

Supplementary Materials

The following are available online at https://www.mdpi.com/article/10.3390/min12020109/s1, Figure S1: Raman Spectrum: Aragonite, Figure S2: Raman Spectrum: Brucite, Figure S3: Raman Spectrum: Calcite; Figure S4: Raman Spectrum: Diopside; Figure S5: Raman Spectrum: Dozyite; Figure S6: Raman Spectrum: Enstatite; Figure S7: Raman Spectrum: Fayalite; Figure S8: Raman Spectrum: Forsterite; Figure S9: Raman Spectrum: Lizardite; Figure S10: Raman Spectrum: Magnesiochromite; Figure S11: Raman Spectrum: Magnesite; Figure S12: Raman Spectrum: Quartz; Table S1: QEMSCAN® analysis in vol%, wt% and used density for conversion; Table S2: Concentration of trace elements in the chromite sample according to an ICP-Scan and XRF; Figure S13: Particle size as determined by dynamic imaging analysis.

Author Contributions

Conceptualization, M.S.; methodology, M.S.; software, M.S.; validation, M.S.; formal analysis, M.S.; investigation, M.S.; resources, M.S. and B.F.; data curation, M.S.; writing—original draft preparation, M.S.; writing—review and editing, M.S. and B.F.; visualization, M.S.; supervision, B.F.; project administration, M.S.; funding acquisition, B.F. All authors have read and agreed to the published version of the manuscript.

Funding

This research received no external funding.

Data Availability Statement

The data presented in this study are available on request from the corresponding author.

Acknowledgments

Günther Redhammer is acknowledged for carrying out the Mössbauer measurement.

Conflicts of Interest

The authors declare no conflict of interest.

References

  1. Sweeten, N.J.; Verryn, S.M.C.; Oberholzer, J.; Zietsman, J.H. Chrome ore mineralogy and the furnace mass and energy balance. J. S. Afr. Inst. Min. Metall. 2018, 118, 637–643. [Google Scholar] [CrossRef]
  2. Tangstad, M.; Brynjulfsen, T.; Ringdalen, E. Reduction of Agglomerated Manganese Ores in a 150 kW Pilot Scale Furnace. In Celebrating the Megascale: Proceedings of the Extraction and Processing Division Symposium on Pyrometallurgy in Honor of David G.C. Robertson; Mackey, P.J., Grimsey, E.J., Jones, R.T., Brooks, G.A., Eds.; Springer International Publishing: Cham, Switzerland, 2016; pp. 149–156. ISBN 978-3-319-48591-1. [Google Scholar]
  3. Tangstad, M.; Ringdalen, E.; Manilla, E.; Davila, D. Pilot Scale Production of Manganese Ferroalloys Using Heat-Treated Mn-Nodules. JOM 2017, 69, 358–364. [Google Scholar] [CrossRef] [Green Version]
  4. Olsen, S.E.; Tangstad, M.; Lindstad, T. Production of Manganese Ferroalloys; Tapir Akademisk Forlag: Trondheim, Norway, 2007; ISBN 9788251921916. [Google Scholar]
  5. Reid, H.R. Notes on the Operation of a Two-Stage Ferrochrome Silicide Process. J. S. Afr. Inst. Min. Metall. 1967, 68, 132–141. [Google Scholar]
  6. Zhang, A.; Monaghan, B.J.; Longbottom, R.J.; Nusheh, M.; Bumby, C.W. Reduction Kinetics of Oxidized New Zealand Ironsand Pellets in H2 at Temperatures up to 1443 K. Metall. Mater. Trans. B 2020, 51, 492–504. [Google Scholar] [CrossRef]
  7. Guo, S.; Li, W.; Peng, J.; Niu, H.; Huang, M.; Zhang, L.; Zhang, S.; Huang, M. Microwave-absorbing characteristics of mixtures of different carbonaceous reducing agents and oxidized ilmenite. Int. J. Miner. Process. 2009, 93, 289–293. [Google Scholar] [CrossRef]
  8. Pan, J.; Yang, C.; Zhu, D. Solid State Reduction of Preoxidized Chromite-iron Ore Pellets by Coal. ISIJ Int. 2015, 55, 727–735. [Google Scholar] [CrossRef] [Green Version]
  9. Zhao, B.; Hayes, P.C. Effects of oxidation on the microstructure and reduction of chromite pellets. In Proceedings of the Twelfth International Ferroalloys Congress, INFACON XII, Helsinki, Finland, 6–9 June 2010; pp. 263–274. [Google Scholar]
  10. Du Preez, S.P.; Beukes, J.P.; Paktunc, D.; van Zyl, P.G.; Jordaan, A. Recycling pre-oxidized chromite fines in the oxidative sintered pellet production process. J. S. Afr. Inst. Min. Metall. 2019, 119, 207–215. [Google Scholar] [CrossRef] [Green Version]
  11. Ye, M.F.; Wu, G.L. Preparation of Oxidized Pellets with Chrome Ore. In 9th International Symposium on High-Temperature Metallurgical Processing; Hwang, J.-Y., Jiang, T., Kennedy, M.W., Gregurek, D., Wang, S., Zhao, B., Yücel, O., Keskinkilic, E., Downey, J.P., Peng, Z., Eds.; Springer: Cham, Switzerland, 2018; pp. 775–784. ISBN 978-3-319-72137-8. [Google Scholar]
  12. Erwee, M.; Swanepoel, S.; Reynolds, Q. The Importance of Controlling the Chemistry of Pre-Oxidized Chromite Pellets for Submerged Arc Furnace FeCr Smelting: A Study on Furnace Si Control. In Proceedings of the Sixteenth International Ferroalloys Congress, INFACON XVI, Trondheim, Norway, 27–29 September 2021. [Google Scholar]
  13. Bidyananda, M.; Mitra, S. Room temperature 57Fe Mössbauer characteristics of chromites from the Nuggihalli schist belt, Dharwar craton, southern India. Curr. Sci. 2004, 86, 1293–1297. [Google Scholar]
  14. Lenaz, D.; Andreozzi, G.; Bidyananda, M.; Princivalle, F. Oxidation degree of chromite from Indian ophiolites: A crystal chemical and 57Fe Mössbauer study. Period. Mineral. 2014, 83, 241–255. [Google Scholar] [CrossRef]
  15. Schofield, P.F.; Smith, A.D.; Scholl, A.; Doran, A.; Covey-Crump, S.J.; Young, A.T.; Ohldag, H. Chemical and oxidation-state imaging of mineralogical intergrowths: The application of X-ray photo-emission electron microscopy (XPEEM). Coord. Chem. Rev. 2014, 277–278, 31–43. [Google Scholar] [CrossRef]
  16. Evans, D.M. Chromite compositions in nickel sulphide mineralized intrusions of the Kabanga-Musongati-Kapalagulu Alignment, East Africa: Petrologic and exploration significance. Ore Geol. Rev. 2017, 90, 307–321. [Google Scholar] [CrossRef]
  17. Danilenko, I.A.; Zamyatin, D.A.; Votyakov, S.L.; Chashchukhin, I.S. Local analysis of oxidation state of iron in oxide minerals using electron microprobe. In Physics, Technologies and Innovation (PTI-2019): Proceedings of the VI International Young Researchers’ Conference, Ekaterinburg, Russia, 20–23 May 2019; AIP Publishing: College Park, MD, USA, 2019; pp. 020017-1–020017-8. [Google Scholar]
  18. Uysal, I.; Akmaz, R.M.; Saka, S.; Kapsiotis, A. Coexistence of compositionally heterogeneous chromitites in the Antalya–Isparta ophiolitic suite, SW Turkey: A record of sequential magmatic processes in the sub-arc lithospheric mantle. Lithos 2016, 248–251, 160–174. [Google Scholar] [CrossRef]
  19. Fanlo, I.; Gervilla, F.; Mateo, E.; Irusta, S. X-ray photoelectron spectroscopy characterization of natural chromite from Mercedita Mine (Eastern Cuba): Quantification of the Fe3+/Fe2+ ratio. Eur. J. Mineral. 2008, 20, 125–129. [Google Scholar] [CrossRef]
  20. Monkawa, A.; Mikouchi, T.; Koizumi, E.; Sugiyama, K.; Miyamoto, M. Determination of the Fe oxidation state of the Chassigny kaersutite: A microXANES spectroscopic study. Meteorit. Planet. Sci. 2006, 41, 1321–1329. [Google Scholar] [CrossRef]
  21. Wilke, M.; Farges, F.; Petit, P.E.; Brown, G.E.; Martin, F. Oxidation state and coordination of Fe in minerals: An Fe K- XANES spectroscopic study. Am. Mineral. 2001, 86, 714–730. [Google Scholar] [CrossRef]
  22. Saikkonen, R.J.; Rautiainen, I.A. Determination of ferrous iron in rock and mineral samples by three volumetric methods. Bull. Geol. Soc. Finl. 1993, 65, 59–64. [Google Scholar] [CrossRef]
  23. Langa, M.M.; Jugo, P.J.; Leybourne, M.I.; Grobler, D.F.; Adetunji, J.; Skogby, H. Chromite chemistry of a massive chromitite seam in the northern limb of the Bushveld Igneous Complex, South Africa: Correlation with the UG-2 in the eastern and western limbs and evidence of variable assimilation of footwall rocks. Miner. Depos. 2021, 56, 31–44. [Google Scholar] [CrossRef] [PubMed] [Green Version]
  24. Zorzi, J.E.; Perottoni, C.A.; Cruz, R.C.D. Determination of ferrous and ferric iron from total iron content and thermogravimetric analysis. J. Therm. Anal. Calorim. 2019, 136, 1879–1886. [Google Scholar] [CrossRef]
  25. Berryman, E.J.; Paktunc, D.; Kingston, D.; Beukes, J.P. Composition and Cr- and Fe-speciation of dust generated during ferrochrome production in a DC arc furnace. Clean. Eng. Technol. 2021, 6, 100386. [Google Scholar] [CrossRef]
  26. Du, Y.; Chrysochoou, M. Microstructural analyses of Cr(VI) speciation in chromite ore processing residue from the soda ash process. J. Hazard. Mater. 2020, 393, 122385. [Google Scholar] [CrossRef] [PubMed]
  27. Quintiliani, M.; Andreozzi, G.; Graziani, G. Fe2+ and Fe3+ quantification by different approaches and fO2 estimation for Albanian Cr-spinels. Am. Mineral. 2006, 91, 907–916. [Google Scholar] [CrossRef]
  28. Uysal, I.; Zaccarini, F.; Sadiklar, M.B.; Tarkian, M.; Thalhammer, O.A.R.; Garuti, G. The podiform chromitites in the Dagküplü and Kavak mines, Eskisehir ophiolite (NW-Turkey): Genetic implications of mineralogical and geochemical data. Geol. Acta 2009, 7, 351–362. [Google Scholar] [CrossRef]
  29. Uysal, I.; Zaccarini, F.; Sadiklar, M.B.; Garuti, G.; Meisel, T.; Tarkian, M.; Bernhardt, H.J. Cr-PGE Mineralizations in Turkey: Evaluation For their Future Potential. In Proceedings of the 27 Meeting of the Spanish Mineralogical Society, Jaen, Spain, 11–14 September 2007; p. 112. [Google Scholar]
  30. Thayer, T.P. Principal features and origin of podiform chromite deposits, and some observations on the Guelman-Soridag District, Turkey. Econ. Geol. 1964, 59, 1497–1524. [Google Scholar] [CrossRef]
  31. Deutsches Institut für Normung. Bodenbeschaffenheit—Bestimmung des Carbonatgehaltes—Volumetrisches Verfahren; DIN EN ISO 10693:2014; Deutsches Institut für Normung: Berlin, Germany, 2014. [Google Scholar]
  32. Lagarec, K.; Rancourt, D.G. Extended Voigt-based analytic lineshape method for determining N-dimensional correlated hyperfine parameter distributions in Mössbauer spectroscopy. Nucl. Instrum. Methods Phys. Res. B 1997, 129, 266–280. [Google Scholar] [CrossRef]
  33. Rancourt, D.G.; Ping, J.Y. Voigt-based methods for arbitrary-shape static hyperfine parameter distributions in Mössbauer spectroscopy. Nucl. Instrum. Methods Phys. Res. B 1991, 58, 85–97. [Google Scholar] [CrossRef]
  34. Bale, C.W.; Bélisle, E.; Chartrand, P.; Decterov, S.A.; Eriksson, G.; Gheribi, A.E.; Hack, K.; Jung, I.-H.; Kang, Y.-B.; Melançon, J.; et al. FactSage thermochemical software and databases, 2010–2016. Calphad 2016, 54, 35–53. [Google Scholar] [CrossRef] [Green Version]
  35. Gasik, M. (Ed.) Handbook of Ferroalloys; Elsevier/Butterworth-Heinemann: Amsterdam, The Netherlands, 2013; ISBN 9780080977539. [Google Scholar]
  36. Gu, F.; Wills, B.A. Chromite- mineralogy and processing. Miner. Eng. 1988, 1, 235–240. [Google Scholar] [CrossRef]
  37. Tripathy, S.K.; Singh, V.; Ramamurthy, Y. Improvement in Cr:Fe Ratio of Indian Chromite Ore for Ferro Chrome Production. Int. J. Min. Eng. Miner. Process. 2012, 1, 101–106. [Google Scholar] [CrossRef]
  38. International Mineralogical Association. The New IMA List of Minerals—A Work in Progress; International Mineralogical Association: Montpellier, France, 2020. [Google Scholar]
  39. Webmineral. Mineralogy Database. Available online: Webmineral.com (accessed on 14 July 2021).
  40. Carbonin, S.; Menegazzo, G.; Lenaz, D.; Princivalle, F. Crystal chemistry of two detrital Cr-spinels with unusually low values of oxygen positional parameter: Oxidation mechanism and possible origin. N. Jahrb. Miner. Mh. 1999, 8, 359–371. [Google Scholar]
  41. Carbonin, S.; Russo, U.; Giusta, A.D. Cation distribution in some natural spinels from X-ray diffraction and Mössbauer spectroscopy. Mineral. Mag. 1996, 60, 355–368. [Google Scholar] [CrossRef]
  42. Jastrzębska, I.; Szczerba, J.; Błachowski, A.; Stoch, P. Structure and microstructure evolution of hercynite spinel (Fe2+Al2O4) after annealing treatment. Eur. J. Mineral. 2017, 29, 62–71. [Google Scholar] [CrossRef]
  43. Jastrzębska, I.; Szczerba, J.; Stoch, P.; Błachowski, A.; Ruebenbauer, K.; Prorok, R.; Śnieżek, E. Crystal structure and Mössbauer study of FeAl2O4. Nukleonika 2015, 60, 47–49. [Google Scholar] [CrossRef] [Green Version]
  44. Larsson, L.; O’Neill, H.S.C.; Annersten, H. Crystal chemistry of synthetic hercynite (FeAl2O4) from XRD structural refinements and Mössbauer spectroscopy. Eur. J. Mineral. 1994, 6, 39–52. [Google Scholar] [CrossRef]
  45. Jastrzębska, I.; Bodnar, W.; Witte, K.; Burkel, E.; Stoch, P.; Szczerba, J. Structural properties of Mn-substituted hercynite. Nukleonika 2017, 62, 95–100. [Google Scholar] [CrossRef] [Green Version]
  46. Long, G.J.; Grandjean, F. Mössbauer Spectroscopy Applied to Inorganic Chemistry; Springer: Boston, MA, USA, 1989; ISBN 978-1-4899-2291-5. [Google Scholar]
  47. Porsch, K.; Kappler, A. FeII oxidation by molecular O2 during HCl extraction. Environ. Chem. 2011, 8, 190–197. [Google Scholar] [CrossRef] [Green Version]
  48. Baba, A.A.; Monsuru, J.A.; Olaoluwa, D.T.; Balogun, A.F.; Abdulganiyu, Y. Enrichment of a nigerian fayalite ore by a hydrochloric acid solution. J. Chem. Technol. Metall. 2017, 52, 572–578. [Google Scholar]
  49. Mahmoud, M.H.H.; Afifi, A.A.I.; Ibrahim, I.A. Reductive leaching of ilmenite ore in hydrochloric acid for preparation of synthetic rutile. Hydrometallurgy 2004, 73, 99–109. [Google Scholar] [CrossRef]
  50. Olanipekun, E. A kinetic study of the leaching of a Nigerian ilmenite ore by hydrochloric acid. Hydrometallurgy 1999, 53, 1–10. [Google Scholar] [CrossRef]
  51. International Organization for Standardization. Iron Ores—Determination of Acid-Soluble Iron(II) Content—Titrimetric Method; ISO 9035:1989(E); International Organization for Standardization: Geneva, Switzerland, 1989. [Google Scholar]
Figure 1. Bulk chemical analysis of chromite concentrate.
Minerals 12 00109 g001
Figure 2. Carbon and sulfur content of chromite concentrate.
Minerals 12 00109 g002
Figure 3. X-ray Diffraction (XRD) pattern of chromite sample.
Minerals 12 00109 g003
Figure 4. QEMSCAN® false-color image of chromite sample.
Minerals 12 00109 g004
Figure 5. Mineralogical composition as determined by QEMSCAN®.
Minerals 12 00109 g005
Figure 6. 57Fe-Mössbauer spectrum of chromite sample.
Minerals 12 00109 g006
Figure 7. Ferric ratio according to nonstandardized Fe3+-leaching trials.
Minerals 12 00109 g007
Figure 8. Ferric and ferrous ratio according to thermochemical simulation.
Minerals 12 00109 g008
Figure 9. Thermogravimetric analysis of chromite and chromite-MgO mixtures.
Minerals 12 00109 g009
Figure 10. XRD pattern of raw chromite, oxidized chromite, and oxidized ore-MgO mixture.
Minerals 12 00109 g010
Figure 11. Comparison of thermogravimetric analysis and thermochemical simulation.
Minerals 12 00109 g011
Figure 12. Mass gain in dependence of temperature according to thermochemical simulation.
Minerals 12 00109 g012
Table 1. Minerals identified by Raman microscopy.
MineralFormula [38]
AragoniteCaCO3
BruciteMg(OH)2
CalciteCaCO3
DiopsideCaMgSi2O6
DozyiteMg7Al2(Al2Si4)O15(OH)12
EnstatiteMg2Si2O6
FayaliteFe2SiO4
ForsteriteMg2SiO4
LizarditeMg3Si2O5(OH)4
MagnesiochromiteMgCr2O4
MagnesiteMg(CO3)
QuartzSiO2
Table 2. 57Fe Mössbauer parameters of chromite sample.
SiteIsomer Shift
in mm/s
Quadrupole Splitting
in mm/s
Gaussian Line Width
in mm/S
Area in %
Fe2+ tetr.0.9130.411
0.879
1.419
0.15
0.24
0.45
76
Fe3+ oct.0.3470.4920.0720
Fe3+ tetr.0.2111.0440.124
Table 3. Parameters of nonstandardized Fe3+-leaching trials.
TrialMass of Ore in gOre Size in µmVolume HCl in mLMolar Concentration in Mol/LLeaching Time in Minutes
1100<635002120
2100<631000260
3100x50 = 192.20500260
4100<63500460
Table 4. Temperature program and atmosphere of STA investigation.
SegmentTemperature in °CHeating Rate in K/minAtmosphere
1Room Temperature–90015Argon
2900–110010Oxygen
31100–600−5Oxygen
Table 5. Mass of chromite and chromite-MgO-mixtures after calcination and after oxidation.
SampleOre #1Ore #210% MgO #110% MgO #220% MgO #120% MgO #2
Ore/wt%10010090908080
MgO/wt%0010102020
Mass after calcination/%97.5924
±0.0058
97.5228
±0.0052
97.8145
±0.0049
97.7840
±0.0050
97.8965
±0.0057
97.9304
±0.0047
Mass after oxidation/%98.7762
±0.0034
98.7019
±0.0026
98.8689
±0.0024
98.8438
±0.0018
98.8485
±0.0037
98.8690
±0.0016
Mass gain due to oxidation/%1.18391.17911.05441.05980.95200.9385
Table 6. Fe2+-content determined by thermogravimetric analysis.
SampleOre #1Ore #210% MgO #110% MgO #220% MgO #120% MgO #2
FeO-content in wt%10.63210.5899.4709.5188.5508.429
Fe2+-content in wt%8.2658.2317.3617.3986.6466.552
Fetot-content in wt%10.94610.9469.8519.8518.7578.757
Fe2+-ratio in %75.50375.19674.71775.09975.89674.820
Publisher’s Note: MDPI stays neutral with regard to jurisdictional claims in published maps and institutional affiliations.

