Abstract
Understanding accumulated damage effects is essential when undertaking deep underground rock engineering, as complex in situ environments and intense engineering disturbances realistically affect the physical and mechanical properties of rocks. Accumulated damage mainly causes the extension of micro-cracks and the sprouting of specific defects in the rocks, altering the microstructural parameters. In this investigation, loading and unloading tests were used to simulate the damage states of the deep underground coal measures sandstone. The accumulated damage factor was formed by combining the P-wave and energy damage variables. The effect of accumulated damage on the bearing capacity and deformation behavior of sandstone was particularly pronounced after experiencing impact loading. The experimental results demonstrate that the accumulated damage factor can depict the initial damage state of sandstone as well as the subsequent dynamic and progressive damage. There is a mutually governing effect between accumulated damage and strain rate. In contrast, accumulated damage significantly extends the range of strain rates, which is fed back into the dynamic uniaxial compressive strength of the sandstone. There is a negative correlation between dynamic fracture energy and accumulated damage, which strongly agrees with the sandstone’s deformation mechanism. The combination of accumulated damage and impact loads can be used to assess the long-term safety of deep underground rock engineering.
1. Introduction
Deep underground rock engineering is closely related to projects such as highly radioactive nuclear waste disposal, deep mineral resources exploration, and geothermal development [] (Figure 1). Studies have shown that rocks around or far from deep underground caves may experience deep fracturing [], increasing the risk of major hazardous events. It is generally accepted that the in situ mechanical behavior of deep rocks is closely related to their deep in situ environment []. As the in situ strength of the rocks is significantly lower than the laboratory strength, damage to the deep surrounding rock begins when the tangential stress at the excavation boundary of the deep cave exceeds 0.3–0.5 times the uniaxial compressive strength of rocks []. The physical excavation process weakens the surrounding rock, resulting in a reduction in the physical, mechanical and hydraulic properties of rocks [,]. It is due to the generation, expansion, and movement of discontinuous cracks in the rock mass as a result of engineering disturbances, forming large areas of accumulated damage [,,]. The accumulated damage dramatically impacts the engineering rock, significantly affecting the design, construction, and use of deep rock engineering []. In addition, deep rock engineering is often subjected to dynamic disturbances such as earthquakes, rock bursts, and explosions, which make the rocks undergo dynamic loading under a wide range of strain rates [,,]. Therefore, investigating the deformation and failure characteristics of rocks under the coupled action of accumulated damage and dynamic loading is crucial for deep rock engineering.
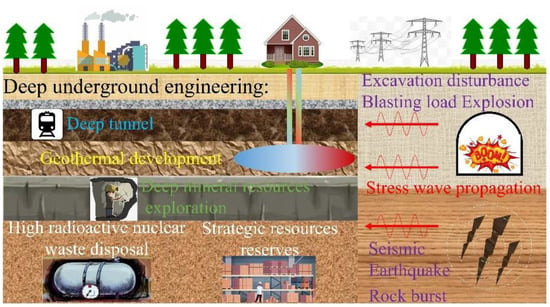
Figure 1.
Overview of deep underground engineering.
Dynamic tests on a variety of rock materials have demonstrated the close link between the loading rate and the mechanical properties as well as the fracture behavior []. Numerous tests have concentrated on testing the dynamic characteristics of intact rocks and the results have shown that impact loading will significantly enhance the strength of rocks, which is expressed as the strain rate effect [,]. Fundamentally, the dependence of rock strength on strain rate is determined by internal damage and microcrack extension. The rocks involved in deep underground engineering are exposed to a complex geomechanical environment, which causes them to experience different types and degrees of damage. Therefore, it seems more interesting to explore the dynamic nature of rocks with damage. Accordingly, many scholars have studied the physical and mechanical properties of damaged rocks or rock mass. Work by Baud et al. [] and Regnet et al. [] had shown that the initial damage level, which is closely related to the porosity, pore size, and pore distribution of rocks, is a micro-structural parameter that strongly influences the mechanical properties of rocks. Peng et al. [] considered the quasi-static and dynamic mechanical properties of granite at different burial depths. He found that the initial damage variables of the rock specimens increased rapidly and then decreased gradually with increasing burial depth, which resulted in a non-linear pattern of variation in the mechanical properties. In order to examine in detail the threats posed to rocks by in situ and engineering damage, a great deal of research has focused on the effects caused by specific defects on the mechanics and fracture behavior of rocks. Li et al. [] carried out dynamic impact tests on flawed marble. They investigated the effects of flaw inclination angle and ligament angle on the fracture behavior and energy evolution of the marble specimens. Dai et al. [] and Wu et al. [] recorded the transient fracture process of rock-like materials with flaws with high-speed cameras, respectively. They revealed the dynamic fracture modes of defective rocks by the digital image correlation (DIC) technique. The damaged area of flawed rocks is mainly concentrated near specific defects, and these specific defects mainly determine the failure characteristics. In geological formation and cavern excavation, the original grain-scale damage in the rocks may occur in situ []. Unlike the previous damage types, this in situ accumulated damage will greatly weaken the whole rocks. Zhang et al. [] prefabricated the initial damage of sandstone through loading and unloading tests to simulate the damage caused by underground space construction on rocks. It was found that the initial damage had a great influence on the creep failure stress and instantaneous deformation of sandstone. Qiu et al. [] carried out unloading tests under different initial damage levels. They noted that the initial damage degree strongly controlled the deformation and failure of unloading deep marble. The initial damage attenuated the dilatancy effect of the rock mass but increased the irreversible deformation. Yu et al. [] considered the disturbance of dynamic load on surrounding rock in underground engineering and explored the quasi-static tensile behavior of marble after multiple impacts. Multiple impact actions caused a progressive increase in the damage degree of marble, resulting in a significant reduction in tensile strength. Li et al. [] produced initial microcrack damage by repeated impact tests and later performed SHPB tests. They evaluated the microcrack density in sandstone specimens and discussed the effect on the energy absorption capacity of sandstone and the fractal dimension of failed specimens. Rae et al. [] pointed out that the weakest available flaw in a rock specimen would rapidly develop and dominate the failure at low loading rates, whereas the same thing would not happen at high loading rates. They restricted their investigations to rocks with similar mineralogy, and studied the role of porosity on fracture and dynamic characteristics in lithologies. The rocks used in the laboratory tests have different damage degrees from the in situ rocks, and this variability is due to the rock coring technique. Therefore, it seems slightly inaccurate to refer to the damage caused by subsequent loads as the initial damage. Hence, this is described uniformly as accumulated damage in this paper. Since accumulated damage is difficult to be characterized by some intuitive parameters, there is still little research on deep rocks under accumulated damage, especially under impact loads.
The method of characterizing damage variables has been of interest to many scholars. Early studies demonstrated that seismic velocity could measure the rocks’ damage characteristics in the laboratory and in geotechnical practice []. Subsequent studies have also supported the existence of a strong correlation between P-wave velocity and physical and mechanical parameters such as rock density, porosity, Poisson’s ratio, compressive strength, tensile strength, and Young’s modulus [,,,,]. Seismic velocity is consequently an appropriate indicator of rock damage variables, and it is also one of the methods recognized by researchers [,,]. However, to measure the superimposed effect of accumulated damage on the dynamic damage of rocks, it seems inadequate to characterize the accumulated damage variable only by P-wave velocity. It is well known that the deformation and destruction of rocks is an irreversible process of energy dissipation. The release of the elastic energy stored in rocks causes rock damage []. Many studies have investigated the energetic evolutionary characteristics of rocks and assessed the deformation and failure behavior of rocks [,,]. Xie et al. [] proposed a rock damage criterion based on an energy dissipation mechanism. At present, few studies consider both seismic wave velocity and energy dissipation mechanisms.
To this end, the accumulated damage on the sandstone was simulated in this paper by loading and unloading tests, while combining P-wave velocity and energy dissipation to establish a distinctive accumulated damage factor. The effects of accumulated damage and impact load on the sandstone strength were investigated. The effects of accumulated damage and impact load on the deformation and failure characteristics of sandstone were discussed on the basis of high-speed images and microscopic images. The kinetic energy of the rock fragments was measured using high-speed images, and the dynamic fracture energy of the sandstone was finally analyzed. The results show that the strength of sandstone is highly consistent with deformation, failure, and fracture characteristics.
2. Test Material and Scheme
2.1. Specimen Processing
The coal measures sandstone is a medium-grained clastic rock with mineral sizes between 0.25 mm and 1 mm, taken from a coal mine in Xuzhou, China, at a maximum depth of over 800 m. According to the XRD results, the main composition of the sandstone is quartz, with a slight quantity of albite, berlinite, clinochlore, kaolinite, and nacrite. Optical microscope observations showed a homogeneous distribution of mineral grains in this sort of sandstone, so that the error caused by rock anisotropy and heterogeneity can be eliminated to the greatest extent. The uniform spread of tiny porosities on the sandstone surface also predicts that it may be relatively sensitive to the accumulated damage effect. The sandstone specimens were manufactured in strict accordance with the International Society for Rock Mechanics (ISRM) recommended methods [,]. The cylindrical specimens were all 50 mm in diameter, with the 100 mm length used for quasi-static tests and the 50 mm length used in the SHPB tests (Figure 2).
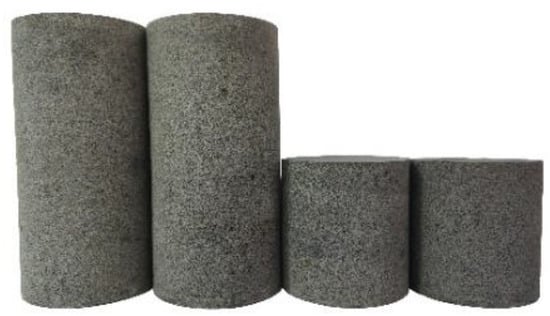
Figure 2.
Coal measures sandstone specimens.
2.2. Dynamic Test Techniques
The Split Hopkinson pressure bar (SHPB) equipment at the China University of Mining and Technology was employed to perform dynamic uniaxial compression tests on the sandstone (Figure 3). The equipment was manufactured and installed by Luoyang Liwei Technology Co., Ltd. from Luoyang, China. The dynamic response of the sandstone (, , ) can be calculated by the following equations [,]:
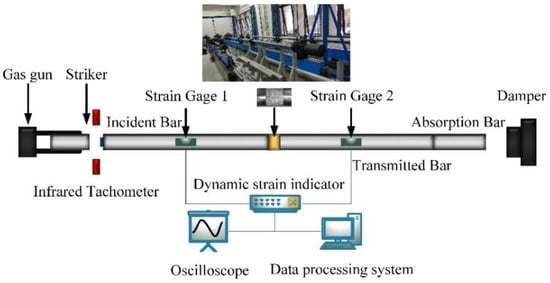
Figure 3.
Schematic diagram of SHPB device.
In this set of equations, , and represent the incident pulse signal, reflected pulse signal, and transmitted pulse signal, respectively, A, E, and C correspond to the cross-sectional area, Young’s modulus, and P-wave velocity of the elastic bars in turn, and and stand for the cross-sectional area and length of the sandstone specimen.
Particular attention should be paid to the fact that the constant strain rate (CSR) during dynamic loading and the stress equilibrium (SE) at both ends of the sandstone specimen are the basic prerequisites to ensure the validity of the SHPB tests []. On the one hand, as a brittle material, the failure strain of rocks tends to be comparatively small. In order to avoid significant non-uniform strains in sandstone during deformation, CSR conditions need to be satisfied during loading. CSR is also a key index for determining the specific strain rate of a given sandstone specimen. On the other hand, the large diameter of the rock specimen results in a long rise time of the incident pulse, causing significant stress gradients and strain gradients at both ends of the specimen. Thus, it is necessary to ensure that the stresses at both ends of the specimen reach the SE condition before the sandstone specimen begins to be destroyed []. The pulse shaping technique is one of the most important means of achieving the two basic prerequisites mentioned earlier. In particular, the technique helps reduce the dispersion effect of the pulse. In this study, a thin brass disc and a slightly smaller rubber sheet were combined to form a suitable pulse shaper and placed in the center of the front face of the incident bar (Figure 3). For a typical compression test in Figure 4, the sum of the incident pulse and reflected pulse is in high agreement with the transmitted pulse, proving that the forces at both ends of the sandstone specimen are approximately equivalent. In addition, a stress equilibrium factor was introduced to further assess the SE condition [,,].
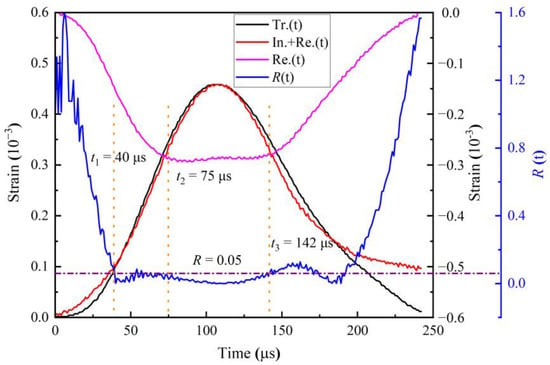
Figure 4.
Dynamic stress equilibrium and the stress equilibrium factor .
At the beginning of the dynamic loading, R is greater than 5%, indicating that the stresses at the ends of the specimen are asymmetrical during this period. When the loading time exceeds 40 μs, R starts to be less than 5% and continues until 142 μs. Dynamic loading maintained the SE condition during this period and covered the entire failure process of the sandstone specimen. Simultaneously, the reflected pulse signal transitions to a platform wave at 75 μs, which demonstrates that the sandstone specimen was loaded at a constant strain rate before damage occurred and maintained until the specimen was severely destroyed. The strain rate represented by the platform reflected pulse is used as an important parameter to measure the dynamic response of the sandstone. In this study, the SE condition and CSR condition have been validated in all dynamic tests.
2.3. Definition of Accumulated Damage
Deep underground rock engineering usually causes redistribution and concentration of in situ stresses, resulting in damage to the rocks or rock mass, also known as an excavation damaged zone (EDZ) []. Once the EDZ is subjected to impact loads such as earthquakes and blasting, the geomechanics and damage patterns exhibited in the EDZ will be different from the previous state. Field practice has also revealed that excavation-induced damage to the surrounding rock significantly affects the safety of deep rock engineering []. This excavation damage effect demonstrates the impact that the duration of the loading has on the surrounding rock. On the basis of this long-term damage effect, the surrounding rock will be more sensitive to impact loads. Therefore, this study first applied accumulated damage to coal measures sandstone specimens. It then revealed the influence of accumulated damage on the dynamic response of sandstone.
Early studies have shown that the stress-strain response of rocks is mainly determined by cracks when the stress is higher than that of crack initiation [,,]. The volumetric strain method is one of the methods to determine the initiation and propagation of compressive cracks in rocks [,]. They pointed out that as the volumetric strain gradually deviated from the initial linear portion, dilatancy began to occur in the rock specimen, representing the crack initiation. Unstable cracks developed rapidly when the volumetric strain reached the maximum (Figure 5). Uniaxial loading and unloading tests were used to impart accumulated damage to the sandstone specimens in order to maximize the accumulated damage effect. The stress at the rotation point of volumetric strain was taken as the minimum unloading stress. Furthermore, to ensure the integrity of the specimen appearance and structure and meet the requirements of impact tests, 0.95 times of uniaxial compressive strength (UCS) is set as the maximum unloading stress.
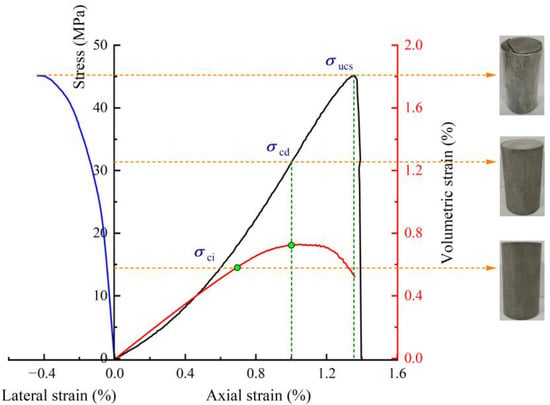
Figure 5.
A typical stress-strain curve in a quasi-static test and corresponding strain evolutions (black line: the complete stress-strain curve; red line: the volumetric strain curve; blue line: the lateral strain curve).
In a series of typical quasi-static uniaxial compression tests, the sandstone used in this study had an average UCS of 45.16 MPa, Young’s modulus of 4.19 GPa, and an average Poisson’s ratio of 0.31. The stress level corresponding to the maximum volumetric strain is very close to 0.70 UCS (Figure 5). Therefore, the unloading stresses were set to 0.70 UCS, 0.75 UCS, 0.80 UCS, 0.85 UCS, 0.90 UCS, and 0.95 UCS, respectively (Figure 6).
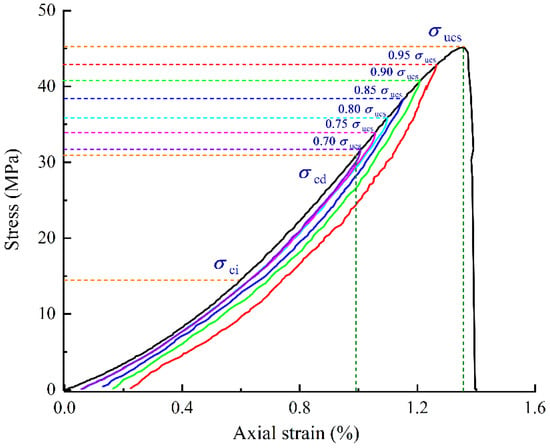
Figure 6.
Complete uniaxial loading and unloading compression curves of sandstone (black line: the complete stress-strain curve; the unloading stress-strain curve when unloading stress is (1) 0.95 UCS in red line; (2) 0.90 UCS in green line; (3) 0.85 UCS in blue line; (4) 0.80 UCS in cyan line; (5) 0.75 UCS in peach line; (6) 0.70 UCS in purple line).
Obviously, the accumulated damage mainly affects the internal structure of sandstone, bringing about a dramatic expansion of cracks and the sprouting of flaws that alter the original porosity. As mentioned in the introduction, P-wave velocity is closely related to crack development and porosity within rocks, so it is reasonable to use the loss rate of P-wave velocity to describe the degradation caused by accumulated damage to sandstone specimens []. A P-wave damage variable was introduced to characterize the initial damage arising from crack extension and pore variation in the sandstone [,]:
where represents the average P-wave velocity for sandstone specimens with accumulated damage and represents the average P-wave velocity for intact sandstone specimens, which is 3890 m/s.
However, demonstrates a static damage state which seems unable to capture the dynamic and progressive damage caused by the initial damage state to impact loads further. As we all know, the deformation and failure of rocks is a dynamic equilibrium process, which is a figurative realization of energy transformation. Variations in the energy storage pattern of sandstone brought by accumulated damage cause dynamic deformation and failure of rocks [,]. The energy damage is adequate to reflect the further effects of accumulated damage on the sandstone. Based on uniaxial compression loading and unloading curves, an energy damage variable was brought in to characterize such a progressive damage effect []:
where is the total input energy density, which is the total energy stored in the sandstone after the external force has done its work on the sandstone, and it is the closed area under the loading curve. is the released elastic strain energy density, which is the closed region under the unloading curve. is the dissipated strain energy density, which takes the difference between the total input energy density and the elastic strain energy density.
P-wave velocity damage and energy damage jointly lead to the accumulated damage effect, and there is a coupling relationship between them. Thus, the final accumulated damage factor is as follows:
Table 1, Figure 7 and Figure 8, display the relationship between P-wave velocity, energy density, and damage variables for sandstone specimens under different accumulated damage conditions. It can be seen that with the increase of unloading stress, the total input energy density increases approximately linearly, while the elastic strain energy density shows a gradual and slow growth trend (Figure 7). At higher unloading stresses (0.90 UCS and 0.95 UCS), the elastic strain energy density is almost identical, suggesting a limit to the elastic energy stored in sandstone. The dissipated strain energy density is far less than the other two energy densities, showing a nonlinear growth. Similar results have also been reported in previous studies []. At the same time, the relationship between the energy damage variable and the unloading stress can be fitted with a quadratic function, which proves a strong correlation between them. In parallel, the average P-wave velocity of the sandstone specimens tends to decrease almost linearly as the unloading stress increases (Figure 8). This phenomenon observed in this study is also common in other studies, such as rocks after freeze-thaw cycles []. The accumulated damage factor that can characterize the initial damage state and dynamic and progressive damage of the sandstone is obtained by combining the P-wave velocity damage variable with the energy damage variable . A quadratic function is fitted to plot the accumulated damage factor against the unloading stress, with a slightly weaker growth trend than that of the energy damage variable. In the present study, six kinds of sandstone specimens with different levels of accumulated damage were obtained according to different unloading stresses, with accumulated damage factors of 0.1080, 0.1566, 0.2288, 0.3067, 0.3874, and 0.5002, respectively. These specimens were then used in SHPB tests.

Table 1.
Average values of different parameters obtained at complete pore water pressure dissipation.
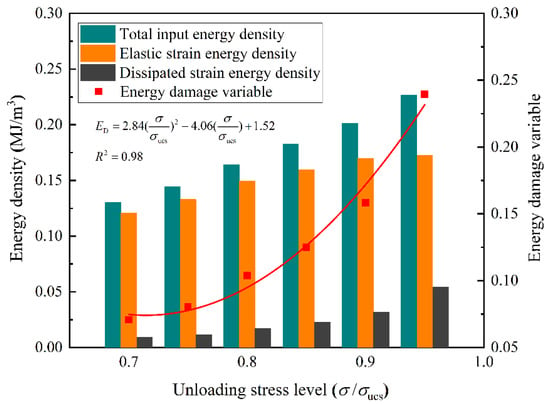
Figure 7.
Variation in the energy densities and energy damage variable.
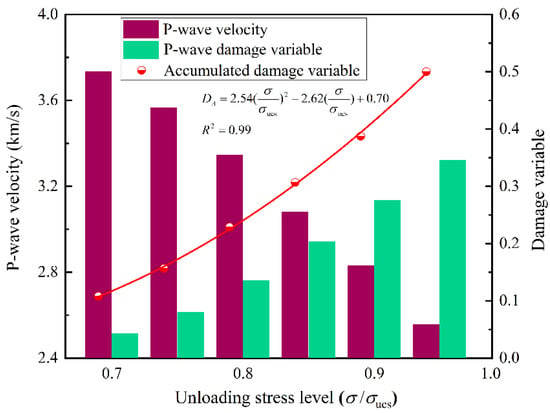
Figure 8.
Variation in the P-wave velocity and damage variables.
3. Dynamic Test Results
3.1. Effect of Accumulated Damage on Stress-Strain Curves
Dynamic uniaxial compression tests were performed on sandstone specimens with different accumulated damage conditions, and dynamic stress-strain curves at different strain rates were obtained (Figure 9). Overall, for each accumulated damage condition, an increase in strain rate has a dramatically enhanced effect on dynamic uniaxial compressive strength (DUCS). This rate effect has been verified in dynamic impact tests for most rocks [,,,]. As the increases, there is a significant decrease in the DUCS. The possible reason for such a change is that the minimum unloading stress exceeds the crack extension stress. Even if the loading stress is gradually reduced to 0, the evolution of cracks caused by the loading is already irrecoverable. The microstructure of the sandstone has been altered and its porosity has grown as a result of the increase in fractures and the formation of new faults. This phenomenon is superimposed on the energy dissipation of sandstone to form an accumulated damage effect, which makes DUCS decay more intense when is large.
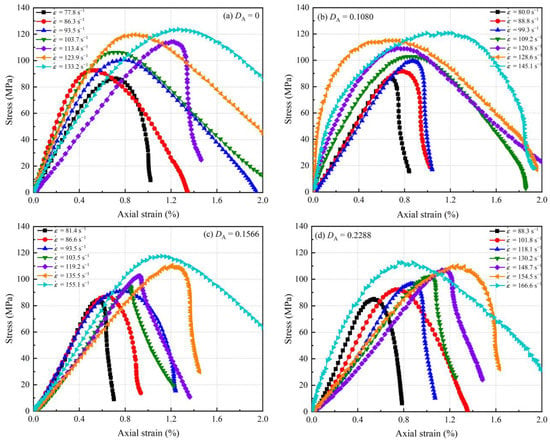
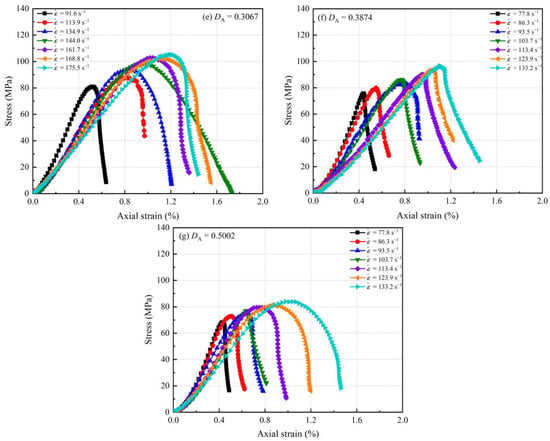
Figure 9.
Dynamic stress-strain curves of sandstone: (a) ; (b) ; (c) ; (d) ; (e) ; (f) ; (g) .
In contrast to the quasi-static tests on sandstone (Figure 5), the dynamic tests on sandstone (Figure 9a) directly enter the approximate elastic deformation stage and skip the compaction stage. The general pattern in Figure 10 shows the basic features of a dynamic stress-strain curve, consisting of three components: the elastic deformation stage, the yielding stage, and the failure stage. The low number of initial micro-cracks in the sandstone, and their lack of inter-connection, prevent them from closing in time when subjected to dynamic loading. In consequence, the overall structure of the sandstone specimen dominates the bearing capacity, so the specimen goes directly to the elastic deformation stage. In other words, the deformation rate of the sandstone specimen is lower than the propagation rate of the stress pulse. This phenomenon has been observed and supported in numerous previous works [,,]. In this study, specimens at lower accumulated damage factors and higher strain rates exhibit this property (Figure 9a–d). When the accumulated damage factor is relatively high and the strain rate is lower (Figure 9d–g), the sandstone specimens show comparable features to the quasi-static tests, as shown in general pattern two in Figure 10. The number of micro-cracks in sandstone is considerably increased and progressively penetrated after suffering accumulated damage, which becomes one of the key elements in determining the bearing capacity. As a result, the compaction stage comes to the fore when the accumulated damage is more serious. Thus, it can be seen that the accumulated damage effect has a particularly adverse effect on sandstone.
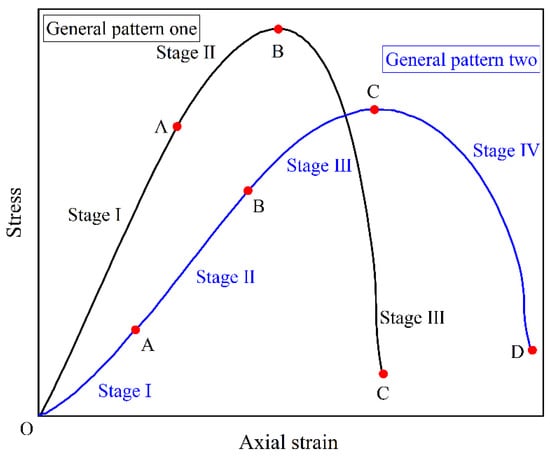
Figure 10.
Dynamic stress-strain curves of sandstone.
3.2. Effect of Accumulated Damage on Uniaxial Compressive Strength
The dynamic test results for the sandstone specimens are listed in Table 2. Through the analysis of the test results, the relationship between the DUCS and the strain rate of sandstone for different accumulated damage conditions can be fitted as []:
where b and f are the fitting parameters in units of and , respectively. The test data and fitting curves are compared in Figure 11. All the corresponding fitting functions are given in Table 3. The DUCS of sandstone under any accumulated damage conditions has a remarkable sensitivity to strain rate, increasing in varying amplitudes with increasing strain rate. Such a rate effect is common in rock-like materials.

Table 2.
Results of the dynamic uniaxial compression tests.
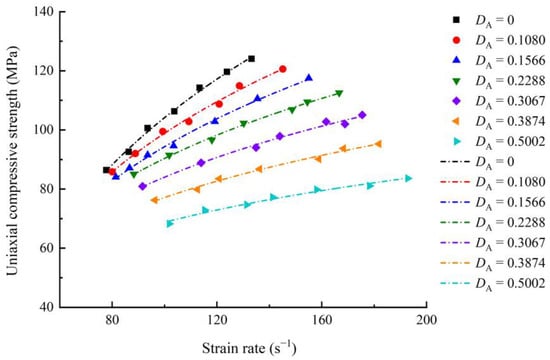
Figure 11.
Relationship between the uniaxial compressive strength and strain rate.

Table 3.
Fitting functions between the uniaxial compressive strength and strain rate.
In attempting to provide a more visual comparison of the hardening effect of impact loading on sandstone UCS, a dynamic increase factor (DIF) was calculated. DIF is defined as the ratio of the DUCS to quasi-static UCS []. The DIF of the sandstone strength is documented in Figure 12. The DIF of the complete sandstone rises from 1.91 to 2.75, whereas the DIF of the sandstone with the highest accumulated damage factor falls between 1.51 and 1.85. It can be concluded that the accumulated damage has had a dramatic effect on the sandstone, as evidenced by the progressively smaller increase in the DIF as the accumulated damage factor increases. A reasonable inference can be made that the increase in the DIF will be minimized as the accumulated damage increases to a specific limit. The phenomenon implies that the rate effect in the sandstone will disappear when the accumulated damage factor is sufficiently large. This supposition was obtained based on the microstructure and porosity of the specimens and was verified on limestone with a loose structure and high porosity []. Here, an effort was made to understand the evolution of the sandstone DIF with accumulated damage factors at similar strain rates. As the range of strain rates corresponding to each group of accumulated damage conditions varies considerably, the range of strain rates could only be narrowed down as a better choice, and this range was chosen to be between 100 s−1 and 135 s−1. When the strain rate is relatively lower (around 100 s−1), the DIF for the intact sandstone specimen is 2.35, while the DIF for the sandstone with the greatest accumulated damage is 1.51, with a reduction of 35.74%. At slightly higher strain rates (around 135 s−1), the DIF decreases from 2.75 to 1.65 with increasing accumulated damage, a reduction of 40.00%. It means that an increase in strain rate will enhance the deterioration effect of accumulated damage on the sandstone strength. When the specimen is subjected to a high strain rate, unconnected cracks and flaws cannot have time to develop fully, and the mineral grains immediately attempt to resist the applied impact load. The larger accumulated damage will greatly reduce the bonding force between the grains, leaving them unable to resist the impact load []. It thus reveals the strain rate correlation of this deterioration effect.
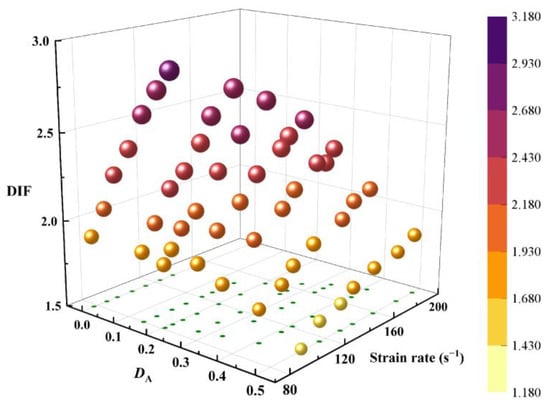
Figure 12.
Variation in the DIF with the strain rate and accumulated damage variable.
4. Dynamic Deformation and Failure Modes
In addition to the quantitative characterization of the material, the macroscopic and microscopic behavior and the establishment of fragments play a crucial role in the acquisition of the accumulated damage mechanism of the deep underground sandstone.
4.1. Macroscopic Deformation Process
A 40,000 fps high-speed camera was used to record the dynamic compression process of the sandstone specimens. Figure 13 exhibits the dynamic fragmentation evolution of the sandstone specimen with/without accumulated damage and the corresponding time points. During dynamic compression loading, cracks are always first formed close to the incident bar (right end face of the specimen). Over time, new cracks may appear on the specimen against the position close to the transmitted bar. Cracks always develop along the axial direction until the specimen is wholly destroyed. The principal distinction brought by accumulated damage to the specimens is the difference in the duration of pore compression and volumetric expansion. For the specimen with a of 0.5002 (Figure 13b), pore compression and volumetric expansion took place up to 125 µs, which can be attributed to more micro-cracks and a looser structure. The differences in the microstructure of intact sandstone allow for a more transient damage time throughout, reflecting a higher brittleness (Figure 13a). Comparing 150–175 µs in Figure 13b with 100–125 µs in Figure 13a, extensive crack initiation can be observed in the specimen with accumulated damage, implying a weaker bonding force between grains. Shear cracks appear more frequently in Figure 13b due to the reduction in the internal friction angle and the cohesion of the specimen caused by the accumulated damage.
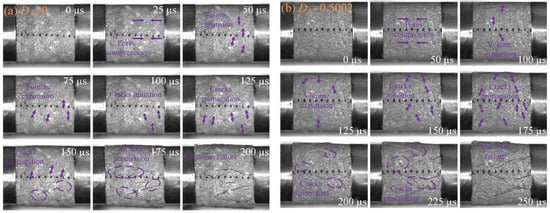
Figure 13.
Failure process of sandstone specimens: (a) ; (b) .
The mechanisms of deformation and failure in the deep sandstone can be revealed by the size distribution of the recovered fragments. Figure 14 corresponds to the fragment size curves for the intact sandstone and the larger accumulated damaged sandstone specimen. In Figure 14a, for strain rates less than 150 s−1, the particle size curves maintain a similar shape, with the crushed sandstone dominated by larger sized fragments (>10 mm), accounting for over 50%, and smaller sized fragments (<10 mm) increasing slowly with increasing strain rate. As strain rates exceed 150 s−1, smaller-sized fragments (<10 mm) already occupy the vast majority of the crushed sandstone, accounting for over 60%. This variation confirms the existence of a clear strain rate correlation in the failure modes of the sandstone. Figure 14b presents the different failure features caused by the more extensive accumulated damage. Recovered sandstone with predominantly larger-sized fragments (>10 mm) only occurs at strain rates of less than 80 s−1. With a particle size of 10 mm and a proportion of 50%, a critical strain rate can be identified to determine the severity of sandstone damage. The critical strain rate for the intact sandstone is around 150 s−1, while the critical strain rate for the maximum accumulated damage sandstone is 80 s−1, suggesting that the lower the critical strain rate, the more dramatic the fragmentation of the specimen. For a visual comparison, 83 s−1 and 124 s−1 were set as the lower and upper limits of the statistical strain rate. The smallest particle size for which the total mass distribution reaches 50% was set as the critical particle size. For the selected strain rate range, the critical size of intact sandstone is fixed as 50 mm, meaning that less than 50% of the recovered fragments have a particle size of less than 20 mm when the strain rate is less than 124 s−1. In contrast, the critical particle size shrinks from 5 mm to 2.5 mm when the strain rate increases from 83.1 s−1 to 123.9 s−1 for the sandstone with greater accumulated damage. The enormous difference in critical particle size intuitively reflects the reduction in stiffness of the deep sandstone specimens due to accumulated damage, which is exemplified on a macro scale by the progressive drop in the size of the recovered fragments.
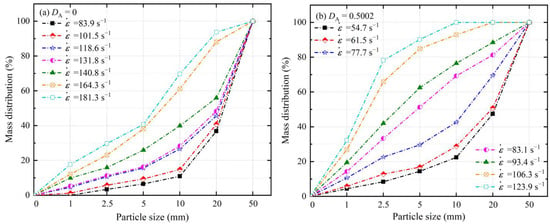
Figure 14.
The particle size distribution of specimens: (a) ; (b) .
4.2. Microscopic Failure Analysis
The high-speed images and particle size distributions of recovered sandstone fragments provide macro-scale evidence of the dramatic impact of accumulated damage on the sandstone. Scanning electron microscopy (SEM) can be used to investigate the damage caused by accumulated damage on the fine grains and internal microstructure of sandstone at different strain rates. Figure 15 presents the micro-morphology of the sandstone with different accumulated damage conditions before and after the application of the impact load at the same magnification. As shown in Figure 15a, a large number of primordial micro-voids and a few primordial micro-cracks are prevalent on the surface of sandstone in the primary state, and they are more evenly distributed within the sandstone. When the sandstone experiences a lower level of accumulated damage (Figure 15b), some primordial micro-voids close as a response to the loading, while others slowly expand into micro-cracks, accompanied by a large number of new micro-defects and micro-cracks caused by the accumulated damage loading. With the intensification of the accumulated damage (Figure 15c), numerous exposed tiny mineral particles appear on the sandstone surface, and the scale of micro-cracks will increase markedly, even up to 1–2 μm. Concurrently, a larger area of complex damage region will emerge, containing a multitude of micro-cracks, micro-defects, and complex rupture surfaces. Figure 15d–f shows the micro-morphology of the sandstone fragments after impact loading. As shown in Figure 15d, multiple intersecting micro-cracks occur on the surface of the crystal particles, and the angle between the micro-cracks is greater than 90°. There are no significant origins for the development of these cracks, and it can be assumed that they are transgranular fractures arising from the action of impact loads. Additionally, multiple intergranular fractures, larger-sized voids, and defects are notable features of the impact loading action. For the sandstone specimen with minor accumulated damage (Figure 15e), the impact load allows quantities of intact and separate mineral particles and debris to be stripped from the fracture surface. The presence of the main rupture belt is one of the most striking features of the destruction. The fractured surface gradually becomes rougher and is covered with uneven granular skeletons and small bevels. The sliding surface is gradually pierced and produced under external forces due to the quantity of micro-defects and micro-cracks within the sandstone, demonstrating that the accumulated damage lessens the brittleness and enhances the toughness of the sandstone. In Figure 15f, as the degree of accumulated damage rises, the micro-morphology of the sandstone after impact loading is vastly different from that before. The micro-crack network is more pronounced, and the size of the cracks is mostly above 4 μm. Large-scale defects occur on the sandstone surface, which is a feature not previously observed. The roughness of the sandstone surface increases substantially, and there are two reasons for this phenomenon. On the one hand, the larger accumulated damage leads to more micro-cracks and complex fracture surfaces in the sandstone even before subjected to impact loading. On the other hand, a higher strain rate causes more crack branches in the dynamic failure process of sandstone.
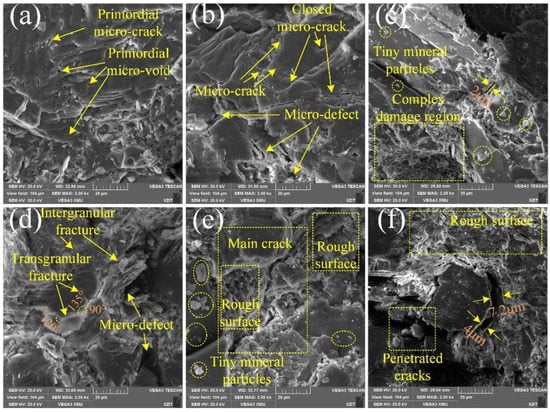
Figure 15.
The SEM images of sandstone: (a) primordial sandstone; (b) sandstone with ; (c) sandstone with ; (d) primordial sandstone after impact loading; (e) sandstone with after impact loading; and (f) sandstone with after impact loading.
5. Discussion
5.1. Dynamic Energy Consumption
The energy evolution and dissipation characteristics in the process of dynamic rock failure is one of the frontier topics in the study of rock instability mechanisms. The dynamic failure process of rocks is, in fact, a thermodynamic evolutionary event []. The energy transported by the stress pulse acts on the fractures and pores inside the rock specimen, causing new fracture surfaces to be generated in the specimen, which includes the expansion of primordial micro-voids and micro-cracks, as well as the formation of new micro-defects. After the specimen has been damaged, the energy carried by the stress pulse causes the fragments to move. A tiny part of the energy will also be converted into thermal and acoustic energy absorbed by the specimen. Eventually, the remaining energy continues to propagate with the stress pulse in the form of the reflected wave (reflected energy) and transmitted wave (transmitted energy) []. Thereby, the total incident energy can be expressed as Equation (7):
where is the fracture energy required in a rock specimen to form new fracture surfaces, is the kinetic energy of the fragments, and represent the thermal and acoustic energy associated with the rock specimen, and , and denote the incident, reflected and transmitted energy, respectively.
On the basis of wave propagation theory, the energy W carried by a stress pulse can be converted into Equation (8) [,]:
Accordingly, the incident, reflected, and transmitted energies in the SHPB tests can be stated as follows:
Since the thermal and acoustic energy absorbed by rocks can be ignored, the fracture energy can be simplified as follows:
The kinetic energy of fragments after a dynamic impact can be estimated using the high-speed photography technique [,]. The high-speed images of fragments from a typical dynamic test are displayed in Figure 16. The upper and lower borders of the specimen and fragments are marked by the red lines in Figure 16. It was observed that the rock specimen was transformed from an axial compression state to a transverse volumetric expansion state at 75 µs, and this time was set as the onset of movement at the upper and lower boundaries of the specimen. The lower boundary first moved to the bottom of the high-speed image at 225 µs, while the upper boundary moved to the top at 300 µs. Thereby, the moving velocities of the upper and lower boundaries can be evaluated as 25.78 m/s and 24.67 m/s, respectively. Here, it is assumed that all the fragments are moving at the same speed. Therefore, the average moving velocity of the upper and lower boundaries (25.23 m/s) can be taken as the velocity of the fragments. The kinetic energy of the rock specimen will be assessed by the average velocity of the fragments as follows:
where m is the overall mass of the rock specimen.

Figure 16.
The high-speed images of fragments in a typical test: (a) 75 µs; (b) 225 µs; and (c) 300 µs.
For comparison purposes, the exact impact gas pressure (0.6 MPa) was applied to specimens with different levels of accumulated damage, and the test results are listed in Table 4. Figure 17 contrasts the non-linear variation of fragment velocity and kinetic energy of the specimen. The average fragment velocity increases from 16.21 m/s to 31.09 m/s when increases from 0 to 0.5002, an increase of 88.31%. The kinetic energy of the specimen increases by 256.30 percent as a result of this. Figure 18 intuitively illustrates the energy distribution in different sandstone specimens. Since only a fixed impact gas pressure (0.6 MPa) is used, the incident energy remains almost constant over multiple tests, which is the total input energy in dynamic tests. The transmitted energy takes the absolute lead in terms of total input energy for both intact and low accumulated damage specimens, and it is far more than the reflected energy. This phenomenon demonstrates that, for specimens with modest accumulated damage, the input energy mostly permits the sandstone to gain greater strength rather than influencing the deformation properties. For the specimen with a large (0.5002), the magnitudes of the reflected and transmitted energies are pretty close to each other, while the kinetic energy of the fragments becomes the greatest component of the total incident energy. It implies that the input energy effects the bearing capacity and deformation characteristics of the sandstone in the same way for high accumulated damage specimens. In other words, the specimen with great accumulated damage obtains a lower strength, even at a higher strain rate. The rise in reflected energy and decrease in transmitted energy indicate a significant increase in the specimen’s interior fracture surface. Because it represents the energy required by crack expansion and fracture surface creation, fracture energy always takes up the least share of the input energy. Figure 19 depicts the fracture energy and energy efficiency in relation to the accumulated damage. Energy efficiency is defined as the ratio of fracture energy to incident energy []. As rises from 0 to 0.5002, the fracture energy drops from 19.84 J to 1.76 J, and the energy efficiency also has a similar downward trend. With almost the same input energy, the lower the energy efficiency, the less fracture energy is required to produce new crack networks. This is due to the fact that with given incident energy, greater accumulated damage leads to finer fragments, which is consistent with the results shown in Figure 14. The SEM image (Figure 15) also demonstrates that only a small amount of micro-cracks are visible in intact sandstone, and therefore, the specimen needs to absorb more energy to induce the development and penetration of new cracks to ensure that the specimen is completely destroyed. In turn, the accumulated damage allows the primordial micro-voids to gradually expand into micro-cracks while the length and density of the cracks keep increasing. Very slight fracture energy enables a large number of cracks to be joined together, while most of the input energy is converted into the kinetic energy of the fragments. In general, the dynamic dissipation pattern of energy is extremely closely related to the macroscopic deformation and microscopic damage characteristics of the sandstone.

Table 4.
Energy distribution of sandstone at an impact air pressure of 0.6 MPa.
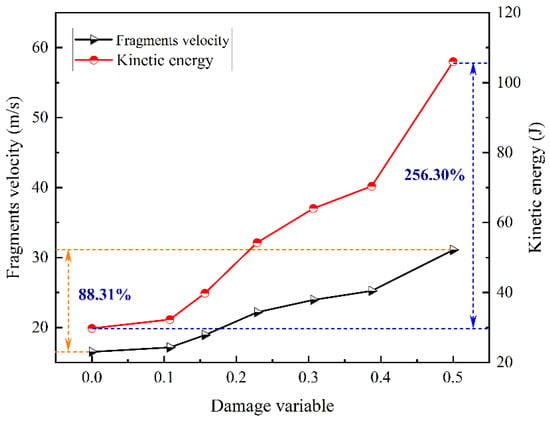
Figure 17.
Variation of fragments velocity and kinetic energy with accumulated damage variable.
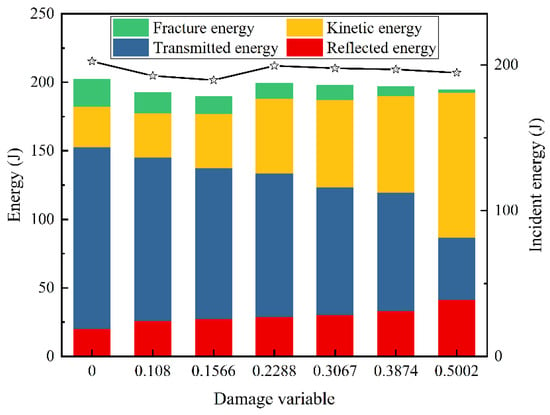
Figure 18.
Variation of energy distribution with accumulated damage variable.
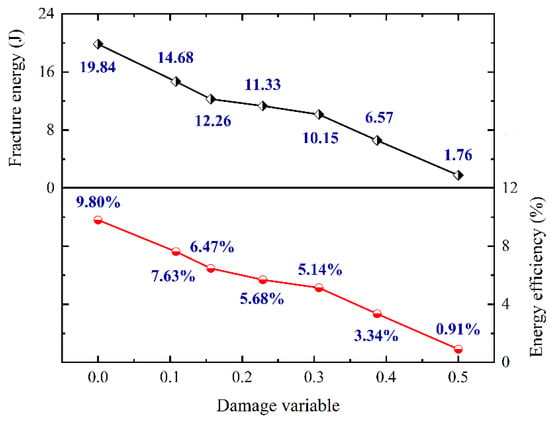
Figure 19.
Variation of fracture energy and energy efficiency with accumulated damage variable.
5.2. Unified Expression of Sandstone Strength and Failure Modes
Based on the experimental results of dynamic uniaxial compression on sandstone, the effect of accumulated damage on the DUCS, failure mode, and the energy dissipation pattern of sandstone was investigated. Due to the limitations of rock materials and test methods, the results and conclusions obtained in this paper are preliminary. In response to this study, the following two issues remain of concern.
5.2.1. Interaction of the Accumulated Damage Effect with the Strain Rate Effect
The relationship between dynamic strength and the strain rate of the sandstone for different accumulated damage conditions is given in Equation (6) and Table 3. Figure 20 describes the variation of parameters b and f with accumulated damage. It should be noted that the parameter b decreases with increasing , indicating that the rate effect is weakened when the accumulated damage goes higher. According to Millon et al. [], the behavior of two selected sedimentary rocks under impact loading is diametrically opposed, and the answer can be found in the microstructure of the specimens. Fewer micro-cracks result in a more homogeneous sandstone specimen when it is undamaged or has less accumulated damage. At normally high strain rates, the loading rate is faster than the crack growth velocity, and crack expansion is impeded. The bearing capacity is consequently controlled by the impact load (high strain rate); whereas with higher accumulated damage, the pore spaces appear to be better networked in the specimen, resulting in a looser micro-structure. The inter-grain contacts thus become weaker, which may lead to a higher crack growth velocity and a lower strength macroscopically []. Additionally, the absolute value of the parameter f shows a negative correlation with , which represents a steady downward shift in the fitting curves. In other words, the greater the , the lower the strength at similar strain rates, which is common-sense and expected before the tests. Another phenomenon is found to be a surprise, namely, that the range of strain rates under similar impact loads expands remarkably with increasing . Specifically, over a similar range of impact loads, the strain rate of intact sandstone increases from 77.79 s−1 to 133.24 s−1, while the strain rate of sandstone with maximum varies between 101.79 s−1 and 192.83 s−1. The strain rate range lifts from 55.45 s−1 to 91.04 s−1, with an increase of 64.18%. This phenomenon can likewise be explained by variations in sandstone porosity [,]. The strain rate is greatly influenced by porosity, so the strain rate will be higher and vary over a broader range for porous rocks. In summary, parameter b demonstrates the attenuation effect of accumulated damage on the strain rate effect, while parameter f verifies the softening effect of accumulated damage on the overall bearing capacity of the specimen.
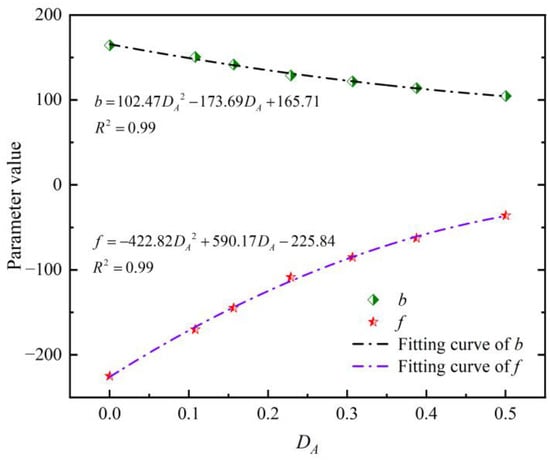
Figure 20.
Variation of parameter b and f with .
5.2.2. Comparison of Different Sorts of Accumulated Damage
Deep rocks, in contrast to laboratory rock studies, have significant non-linear variability and a high stress sensitivity [,]. The goal of accumulated damage effect research is to highlight the in situ characters of deep rocks. Therefore, how to distinguish accumulated damage from other forms of damage (such as freeze-thaw damage [] and thermal damage []) has become an urgent problem to be solved. Meanwhile, the distinction between different sorts of accumulated damage is also a subject of great debate. The damage state that develops only when rocks are loaded over a period of time is called accumulated damage, which means that accumulated damage emphasizes the time effect of the damage state. The purpose of accumulated damage studies is to assess the long-term stability of deep underground rocks. In this study, uniaxial loading and unloading tests were used to apply accumulated damage to sandstone specimens, with seismic velocity and strain energy density comprising the accumulated damage factor. However, it does not fully resolve the two doubts mentioned above. A more reasonable approach is proposed, which permits a quantitative description of micro-cracks in rocks caused by accumulated damage. The nuclear magnetic resonance (NMR) method [,] and 3-D X-ray computed tomography (CT) technology [,] have been introduced into the related research of rock materials, making it possible to visualize parameters such as fracture distribution, crack volume, pore size, and connectedness. The next attempt is to alter the type of accumulated damage using different stress paths and to reproduce the variability of the pore structure using NMR technology and CT scanning technology. New tools offer fresh perspectives on how to estimate the accumulated damage impacts of deep in situ rock environments. A further study is the comparison of laboratory test results with in situ rocks for the purpose of predicting in situ rock strength. The research of accumulated damage can eventually provide a guarantee for assessing the long-term safety of deep underground rock engineering.
6. Conclusions
This study reports the dynamic deformation behavior and failure modes of deep underground coal, and measures sandstone after sustaining accumulated damage. The mechanism of accumulated damage is revealed via pre-loading and dynamic impact testing, as well as longitudinal wave velocity measurements, high-speed photography, and SEM observation. The main conclusions are as follows:
- The intact sandstone reaches the elastic deformation stage directly in dynamic stress-strain curves, but the existence of accumulated damage causes a more prominent compaction stage. This phenomenon is confirmed in the high-speed images.
- The strengthening effect of strain rate on the dynamic strength of sandstone still persists, but it becomes weaker as the extent of accumulated damage increases. The DIF for dynamic strength shows that an increase in strain rate will enhance the deterioration effect of accumulated damage on the sandstone strength. In addition, across a similar range of impact loads, the range of actual sandstone strain rates extends as accumulated damage increases, but the strain rate value eventually diminishes.
- The macroscopic damage pattern of the sandstone is in good agreement with the microscopic morphology of fracture surfaces. The accumulated damage leads to a reduction in the internal friction angle and the cohesion of the specimen, causing more shear cracks. This is reflected macroscopically in the fact that the size of the recovered fragments gradually decreases as the accumulated damage increases. On a microscopic level, the intergranular fracture is mainly caused by accumulated damage, while the transgranular fracture mainly originates from the impact loading.
- The kinetic energy of the fragments plays a significant role in the dynamic energy evolution process. An increase in accumulated damage leads to more and smaller fragments with progressively higher kinetic energy. The results of fracture energy show a negative correlation between fracture energy and accumulated damage. The most probable explanation is the presence of extensive fracture networks within sandstone with severe accumulated damage, leading to greater destruction even with lower fracture energy.
Author Contributions
Methodology, Z.S. and H.P.; investigation, J.X.; resources, Z.S.; data curation, Z.S. and J.X.; writing—original draft preparation, Z.S., J.X. and H.P.; writing—review and editing, Z.S. and H.P.; visualization, Z.S. and J.X.; supervision, H.P. All authors have read and agreed to the published version of the manuscript.
Funding
This research is supported by the National Natural Science Foundation of China (No. 51974296, No. 52061135111).
Data Availability Statement
Data available on request due to privacy restrictions.
Conflicts of Interest
The authors declare no conflict of interest.
Abbreviation
| CSR | Constant strain rate |
| DIC | Digital image correlation |
| DIF | Dynamic increase factor |
| DUCS | Dynamic uniaxial compressive strength |
| EDZ | Excavation damaged zone |
| ISRM | International Society for Rock Mechanics |
| SE | Stress equilibrium |
| SEM | Scanning electron microscopy |
| SHPB | Split Hopkinson pressure bar |
| UCS | Uniaxial compressive strength |
| Cross-sectional area of the elastic bars | |
| Cross-sectional area of the sandstone specimen | |
| Fitting parameter | |
| P-wave velocity of the elastic bars | |
| Accumulated damage factor | |
| Energy damage variable | |
| P-wave damage variable | |
| Young’s modulus of the elastic bars | |
| Fitting parameter | |
| Length of the sandstone specimen | |
| Mass of the rock specimen | |
| Stress equilibrium factor | |
| Total input energy density | |
| Dissipated strain energy density | |
| Released elastic strain energy density | |
| Average velocity of the fragments | |
| Average P-wave velocity for intact sandstone specimens | |
| Average P-wave velocity for sandstone specimens with accumulated damage | |
| Stress pulse energy | |
| Fracture energy | |
| Incident energy | |
| Kinetic energy | |
| Reflected energy | |
| Acoustic energy | |
| Transmitted energy | |
| Thermal energy | |
| Dynamic strain of the sandstone | |
| Incident pulse signal | |
| Reflected pulse signal | |
| Transmitted pulse signal | |
| Dynamic strain rate of the sandstone | |
| Dynamic strain rate | |
| Dynamic stress of the sandstone | |
| Dynamic stress |
References
- Xia, K.W.; Wang, S.; Xu, Y.; Chen, R.; Wu, B.B. Advances in Experimental Studies for Deep Rock Dynamics. Chin. J. Rock Mech. Eng. 2021, 40, 448–475. [Google Scholar]
- Feng, X.T.; Pei, S.F.; Jiang, Q.; Zhou, Y.Y.; Li, S.J.; Yao, Z. Bin Deep Fracturing of the Hard Rock Surrounding a Large Underground Cavern Subjected to High Geostress: In Situ Observation and Mechanism Analysis. Rock Mech. Rock Eng. 2017, 50, 2155–2175. [Google Scholar] [CrossRef]
- Xie, H.P. Research Review of the State Key Research Development Program of China: Deep Rock Mechanics and Mining Theory. J. China Coal Soc. 2019, 44, 1283–1305. [Google Scholar]
- Cai, M.; Kaiser, P.K. In-Situ Rock Spalling Strength near Excavation Boundaries. Rock Mech. Rock Eng. 2014, 47, 659–675. [Google Scholar] [CrossRef]
- Malmgren, L.; Saiang, D.; Töyrä, J.; Bodare, A. The Excavation Disturbed Zone (EDZ) at Kiirunavaara Mine, Sweden—By Seismic Measurements. J. Appl. Geophys. 2007, 61, 1–15. [Google Scholar] [CrossRef]
- Perras, M.A.; Diederichs, M.S. Predicting Excavation Damage Zone Depths in Brittle Rocks. J. Rock Mech. Geotech. Eng. 2016, 8, 60–74. [Google Scholar] [CrossRef]
- Li, H.B.; Liu, M.C.; Xing, W.B.; Shao, S.; Zhou, J.W. Failure Mechanisms and Evolution Assessment of the Excavation Damaged Zones in a Large-Scale and Deeply Buried Underground Powerhouse. Rock Mech. Rock Eng. 2017, 50, 1883–1900. [Google Scholar] [CrossRef]
- Verma, H.K.; Samadhiya, N.K.; Singh, M.; Goel, R.K.; Singh, P.K. Blast Induced Rock Mass Damage around Tunnels. Tunn. Undergr. Space Technol. 2018, 71, 149–158. [Google Scholar] [CrossRef]
- Butcher, A.; Stork, A.L.; Verdon, J.P.; Kendall, J.; Plenkers, K.; Booth, F.; Boneham, M.; Koe, A. Evaluating Rock Mass Disturbance within Open-Pit Excavations Using Seismic Methods: A Case Study from the Hinkley Point C Nuclear Power Station. J. Rock Mech. Geotech. Eng. 2021, 13, 500–512. [Google Scholar] [CrossRef]
- Xia, K.W.; Yao, W. Dynamic Rock Tests Using Split Hopkinson (Kolsky) Bar System e-A Review. J. Rock Mech. Geotech. Eng. 2015, 7, 27–59. [Google Scholar] [CrossRef]
- Xie, H.P.; Zhu, J.B.; Zhou, T.; Zhao, J. Novel Three-dimensional Rock Dynamic Tests Using the True Triaxial Electromagnetic Hopkinson Bar System. Rock Mech. Rock Eng. 2021, 54, 2079–2086. [Google Scholar] [CrossRef]
- Xie, H.P.; Zhang, K.; Zhou, C.T.; Wang, J.X.; Peng, Q.; Guo, J.; Zhu, J.B. Dynamic Response of Rock Mass Subjected to Blasting Disturbance during Tunnel Shaft Excavation: A Field Study. Geomech. Geophys. Geo-Energy Geo-Resour. 2022, 8, 52. [Google Scholar] [CrossRef]
- Ostermeijer, G.A.; Aben, F.M.; Mitchell, T.M.; Rockwell, T.K.; Rempe, M.; Farrington, K. Evolution of Co-Seismic off-Fault Damage towards Pulverisation. Earth Planet. Sci. Lett. 2022, 579, 117353. [Google Scholar] [CrossRef]
- Du, H.B.; Dai, F.; Liu, Y.; Xu, Y.; Wei, M.D. Dynamic Response and Failure Mechanism of Hydrostatically Pressurized Rocks Subjected to High Loading Rate Impacting. Soil Dyn. Earthq. Eng. 2020, 129, 105927. [Google Scholar] [CrossRef]
- Zhu, Q.Q.; Li, X.B.; Li, D.Y.; Ma, C. De Experimental Investigations of Static Mechanical Properties and Failure Characteristics of Damaged Diorite after Dynamic Triaxial Compression. Int. J. Rock Mech. Min. Sci. 2022, 153, 105106. [Google Scholar] [CrossRef]
- Baud, P.; Wong, T.; Zhu, W. Effects of Porosity and Crack Density on the Compressive Strength of Rocks. Int. J. Rock Mech. Min. Sci. 2014, 67, 202–211. [Google Scholar] [CrossRef]
- Regnet, J.B.; David, C.; Fortin, J.; Robion, P.; Makhloufi, Y.; Collin, P.Y. Influence of Microporosity Distribution on the Mechanical Behavior of Oolithic Carbonate Rocks. Geomech. Energy Environ. 2015, 3, 11–23. [Google Scholar] [CrossRef]
- Peng, K.; Liu, Z.P.; Zou, Q.L.; Zhang, Z.Y.; Zhou, J.Q. Static and Dynamic Mechanical Properties of Granite from Various Burial Depths. Rock Mech. Rock Eng. 2019, 52, 3545–3566. [Google Scholar]
- Li, D.Y.; Han, Z.Y.; Sun, X.L.; Zhou, T.; Li, X.B. Dynamic Mechanical Properties and Fracturing Behavior of Marble Specimens Containing Single and Double Flaws in SHPB Tests. Rock Mech. Rock Eng. 2019, 52, 1623–1643. [Google Scholar] [CrossRef]
- Yan, Z.L.; Dai, F.; Liu, Y.; Du, H.B. Experimental Investigations of the Dynamic Mechanical Properties and Fracturing Behavior of Cracked Rocks under Dynamic Loading. Bull. Eng. Geol. Environ. 2020, 79, 5535–5552. [Google Scholar] [CrossRef]
- Dong, P.; Wu, B.B.; Xia, K.W.; Wang, Q.Z. Fracture Modes of Single-Flawed Rock-like Material Plates Subjected to Dynamic Compression. Int. J. Geomech. 2020, 20, 04020145. [Google Scholar] [CrossRef]
- Diederichs, M.S.; Kaiser, P.K.; Eberhardt, E. Damage Initiation and Propagation in Hard Rock during Tunnelling and the Influence of Near-Face Stress Rotation. Int. J. Rock Mech. Min. Sci. 2004, 41, 785–812. [Google Scholar] [CrossRef]
- Hou, R.B.; Zhang, K.; Tao, J.; Xue, X.R.; Chen, Y.L. A Nonlinear Creep Damage Coupled Model for Rock Considering the Effect of Initial Damage. Rock Mech. Rock Eng. 2019, 52, 1275–1285. [Google Scholar] [CrossRef]
- Qiu, S.L.; Feng, X.T.; Zhang, C.Q.; Yang, J.B. Experimental Research on Mechanical Properties of Deep Marble under Different Initial Damage Levels and Unloading Paths. Chin. J. Rock Mech. Eng. 2012, 31, 1686–1697. [Google Scholar]
- Zhang, T.; Yu, L.Y.; Su, H.J.; Zhang, Q.; Chai, S.B. Experimental and Numerical Investigations on the Tensile Mechanical Behavior of Marbles Containing Dynamic Damage. Int. J. Min. Sci. Technol. 2022, 32, 89–102. [Google Scholar] [CrossRef]
- Li, S.H.; Liu, K.; Griffiths, L.; Chen, C.F.; Yao, X.H. Influence of Initial Microcracks on the Dynamic Mechanical Characteristics of Sandstone. Geomech. Geophys. Geo-Energy Geo-Resour. 2022, 8, 181. [Google Scholar] [CrossRef]
- Rae, A.S.P.; Kenkmann, T.; Padmanabha, V.; Poelchau, M.H.; Schaefer, F.; Doerfler, M.A.; Mueller, L. Dynamic Compressive Strength and Fragmentation in Sedimentary and Metamorphic Rocks. Tectonophysics 2022, 824, 229221. [Google Scholar] [CrossRef]
- Kahraman, S. Estimating the Direct P-Wave Velocity Value of Intact Rock from Indirect Laboratory Measurements. Int. J. Rock Mech. Min. Sci. 2002, 39, 101–104. [Google Scholar] [CrossRef]
- Sharma, P.K.; Singh, T.N. A Correlation between P-Wave Velocity, Impact Strength Index, Slake Durability Index and Uniaxial Compressive Strength. Bull. Eng. Geol. Environ. 2008, 67, 17–22. [Google Scholar] [CrossRef]
- Moradian, Z.A.; Behnia, M. Predicting the Uniaxial Compressive Strength and Static Young’s Modulus of Intact Sedimentary Rocks Using the Ultrasonic Test. Int. J. Geomech. 2009, 9, 14–19. [Google Scholar] [CrossRef]
- Khandelwal, M. Correlating P-Wave Velocity with the Physico-Mechanical Properties of Different Rocks. Pure Appl. Geophys. 2013, 170, 507–514. [Google Scholar] [CrossRef]
- Ajalloeian, R.; Jamshidi, A.; Khorasani, R. Assessments of Ultrasonic Pulse Velocity and Dynamic Elastic Constants of Granitic Rocks Using Petrographic Characteristics. Geotech. Geol. Eng. 2020, 38, 2835–2844. [Google Scholar] [CrossRef]
- Arman, H.; Paramban, S. Dimensional Effects on Dynamic Properties and the Relationships between Ultrasonic Pulse Velocity and Physical Properties of Rock under Various Environmental Conditions. Geotech. Geol. Eng. 2021, 39, 3947–3957. [Google Scholar] [CrossRef]
- Wang, Z.L.; Li, Y.C.; Wang, J.G. A Method for Evaluating Dynamic Tensile Damage of Rock. Eng. Fract. Mech. 2008, 75, 2812–2825. [Google Scholar] [CrossRef]
- Meng, Q.B.; Zhang, M.W.; Han, L.J.; Pu, H.; Nie, T.Y. Effects of Acoustic Emission and Energy Evolution of Rock Specimens under the Uniaxial Cyclic Loading and Unloading Compression. Rock Mech. Rock Eng. 2016, 49, 3873–3886. [Google Scholar] [CrossRef]
- Gong, F.Q.; Yan, J.Y.; Li, X.B.; Luo, S. A Peak-Strength Strain Energy Storage Index for Rock Burst Proneness of Rock Materials. Int. J. Rock Mech. Min. Sci. 2019, 117, 76–89. [Google Scholar] [CrossRef]
- Wang, Y.; Tan, W.H.; Liu, D.Q.; Hou, Z.Q.; Li, C.H. On Anisotropic Fracture Evolution and Energy Mechanism during Marble Failure under Uniaxial Deformation. Rock Mech. Rock Eng. 2019, 52, 3567–3583. [Google Scholar] [CrossRef]
- Xie, H.P.; Li, L.Y.; Peng, R.D.; Ju, Y. Energy Analysis and Criteria for Structural Failure of Rocks. J. Rock Mech. Geotech. Eng. 2009, 1, 11–20. [Google Scholar] [CrossRef]
- Dai, F.; Huang, S.; Xia, K.W.; Tan, Z.Y. Some Fundamental Issues in Dynamic Compression and Tension Tests of Rocks Using Split Hopkinson Pressure Bar. Rock Mech. Rock Eng. 2010, 43, 657–666. [Google Scholar] [CrossRef]
- Zhou, Y.X.; Xia, K.W.; Li, X.B.; Li, H.B.; Ma, G.W.; Zhao, J.; Zhou, Z.L.; Dai, F. Suggested Methods for Determining the Dynamic Strength Parameters and Mode-I Fracture Toughness of Rock Materials. Int. J. Rock Mech. Min. Sci. 2012, 49, 105–112. [Google Scholar] [CrossRef]
- Zhang, Q.B.; Zhao, J. A Review of Dynamic Experimental Techniques and Mechanical Behaviour of Rock Materials. Rock Mech. Rock Eng. 2014, 47, 1411–1478. [Google Scholar] [CrossRef]
- Yao, W.; He, T.M.; Xia, K.W. Dynamic Mechanical Behaviors of Fangshan Marble. J. Rock Mech. Geotech. Eng. 2017, 9, 807–817. [Google Scholar] [CrossRef]
- Yao, W.; Xia, K.W.; Liu, Y.H.; Shi, Y.R.; Peterson, K. Dependences of Dynamic Compressive and Tensile Strengths of Four Alkali-Activated Mortars on the Loading Rate and Curing Time. Constr. Build. Mater. 2019, 202, 891–903. [Google Scholar] [CrossRef]
- Kim, H.-M.; Rutqvist, J.; Jeong, J.-H.; Choi, B.-H.; Ryu, D.-W.; Song, W.-K. Characterizing Excavation Damaged Zone and Stability of Pressurized Lined Rock Caverns for Underground Compressed Air Energy Storage. Rock Mech. Rock Eng. 2013, 46, 1113–1124. [Google Scholar] [CrossRef]
- Yan, P.; Lu, W.B.; Chen, M.; Hu, Y.G.; Zhou, C.B.; Wu, X.X. Contributions of In-Situ Stress Transient Redistribution to Blasting Excavation Damage Zone of Deep Tunnels. Rock Mech. Rock Eng. 2015, 48, 715–726. [Google Scholar] [CrossRef]
- Bobet, A.; Einstein, H.H. Fracture Coalescence in Rock-Type Materials under Uniaxial and Biaxial Compression. Int. J. Rock Mech. Min. Sci. 1998, 35, 863–888. [Google Scholar] [CrossRef]
- Bobet, A. The Initiation of Secondary Cracks in Compression. Eng. Fract. Mech. 2000, 66, 187–219. [Google Scholar] [CrossRef]
- Park, C.H.; Bobet, A. Crack Initiation, Propagation and Coalescence from Frictional Flaws in Uniaxial Compression. Eng. Fract. Mech. 2010, 77, 2727–2748. [Google Scholar] [CrossRef]
- Nicksiar, M.; Martin, C.D. Evaluation of Methods for Determining Crack Initiation in Compression Tests on Low-Porosity Rocks. Rock Mech. Rock Eng. 2012, 45, 607–617. [Google Scholar] [CrossRef]
- Xing, H.Z.; Zhang, Q.B.; Zhao, J. Stress Thresholds of Crack Development and Poisson’s Ratio of Rock Material at High Strain Rate. Rock Mech. Rock Eng. 2018, 51, 945–951. [Google Scholar] [CrossRef]
- Xu, J.C.; Pu, H.; Sha, Z.H. Mechanical Behavior and Decay Model of the Sandstone in Urumqi under Coupling of Freeze–Thaw and Dynamic Loading. Bull. Eng. Geol. Environ. 2021, 80, 2963–2978. [Google Scholar] [CrossRef]
- Meng, Q.B.; Zhang, M.W.; Zhang, Z.Z.; Han, L.J.; Pu, H. Research on Non-linear Characteristics of Rock Energy Evolution under Uniaxial Cyclic Loading and Unloading Conditions. Environ. Earth Sci. 2019, 78, 650. [Google Scholar] [CrossRef]
- Momeni, A.; Abdilor, Y.; Khanlari, G.R.; Heidari, M.; Sepahi, A.A. The Effect of Freeze–Thaw Cycles on Physical and Mechanical Properties of Granitoid Hard Rocks. Bull. Eng. Geol. Environ. 2016, 75, 1649–1656. [Google Scholar] [CrossRef]
- Chakraborty, T.; Mishra, S.; Loukus, J.; Halonen, B.; Bekkala, B. Characterization of Three Himalayan Rocks Using a Split Hopkinson Pressure Bar. Int. J. Rock Mech. Min. Sci. 2016, 85, 112–118. [Google Scholar] [CrossRef]
- Zou, C.J.; Wong, L.N.Y. Size and Geometry Effects on the Mechanical Properties of Carrara Marble under Dynamic Loadings. Rock Mech. Rock Eng. 2016, 49, 1695–1708. [Google Scholar] [CrossRef]
- You, W.; Dai, F.; Liu, Y.; Du, H.B.; Jiang, R.C. Investigation of the Influence of Intermediate Principal Stress on the Dynamic Responses of Rocks Subjected to True Triaxial Stress State. Int. J. Min. Sci. Technol. 2021, 31, 913–926. [Google Scholar] [CrossRef]
- Chen, X.; Shi, X.Z.; Zhou, J.; Li, E.M.; Qiu, P.Y.; Gou, Y.G. High Strain Rate Compressive Strength Behavior of Cemented Paste Backfill Using Split Hopkinson Pressure Bar. Int. J. Min. Sci. Technol. 2021, 31, 387–399. [Google Scholar] [CrossRef]
- Ke, B.; Zhou, K.P.; Xu, C.S.; Deng, H.W.; Li, J.L.; Bin, F. Dynamic Mechanical Property Deterioration Model of Sandstone Caused by Freeze–Thaw Weathering. Rock Mech. Rock Eng. 2018, 51, 2791–2804. [Google Scholar] [CrossRef]
- Wang, Z.L.; Shi, H.; Wang, J.G. Mechanical Behavior and Damage Constitutive Model of Granite under Coupling of Temperature and Dynamic Loading. Rock Mech. Rock Eng. 2018, 51, 3045–3059. [Google Scholar] [CrossRef]
- Si, X.F.; Gong, F.Q.; Li, X.B.; Wang, S.Y.; Luo, S. Dynamic Mohr–Coulomb and Hoek–Brown Strength Criteria of Sandstone at High Strain Rates. Int. J. Rock Mech. Min. Sci. 2019, 115, 48–59. [Google Scholar] [CrossRef]
- Millon, O.; Ruiz-Ripoll, M.L.; Hoerth, T. Analysis of the Behavior of Sedimentary Rocks under Impact Loading. Rock Mech. Rock Eng. 2016, 49, 4257–4272. [Google Scholar] [CrossRef]
- Mishra, S.; Khetwal, A.; Chakraborty, T. Dynamic Characterisation of Gneiss. Rock Mech. Rock Eng. 2019, 52, 61–81. [Google Scholar] [CrossRef]
- Wong, L.N.Y.; Li, Z.H.; Kang, H.M.; Teh, C.I. Dynamic Loading of Carrara Marble in a Heated State. Rock Mech. Rock Eng. 2017, 50, 1487–1505. [Google Scholar] [CrossRef]
- Xu, Y.; Yao, W.; Wang, S.; Xia, K.W. Investigation of the Heat-treatment Effect on Rock Fragmentation Characteristics Using the Dynamic Ball Compression Test. Rock Mech. Rock Eng. 2020, 53, 2095–2108. [Google Scholar] [CrossRef]
- Chen, W.W.; Song, B. Split Hopkinson (Kolsky) Bar: Design, Testing and Applications; Springer Science & Business Media: Berlin, Germany, 2010. [Google Scholar]
- Wang, J.Y.; Parab, N.; Chen, W. High-Speed Real-Time x-Ray Visualization of Impact Damage inside Geomaterials. In Handbook of Damage Mechanics; Springer: Berlin, Germany, 2021; pp. 1–30. [Google Scholar]
- Demirdag, S.; Tufekci, K.; Kayacan, R.; Yavuz, H.; Altindag, R. Dynamic Mechanical Behavior of Some Carbonate Rocks. Int. J. Rock Mech. Min. Sci. 2010, 47, 307–312. [Google Scholar] [CrossRef]
- Yavuz, H.; Tufekci, K.; Kayacan, R.; Cevizci, H. Predicting the Dynamic Compressive Strength of Carbonate Rocks from Quasi-Static Properties. Exp. Mech. 2013, 53, 367–376. [Google Scholar] [CrossRef]
- Ozguven, A.; Ozcelik, Y. Effects of High Temperature on Physico-Mechanical Properties OfTurkish Natural Building Stones. Eng. Geol. 2014, 183, 127–136. [Google Scholar] [CrossRef]
- Zhou, B.; Han, Q.; Yang, P.Q. Characterization of Nanoporous Systems in Gas Shales by Low Field NMR Cryoporometry. Energy Fuels 2016, 30, 9122–9131. [Google Scholar] [CrossRef]
- Liu, B.; Yao, S.P.; Hu, W.X.; Cao, J. Applying Octamethylcyclotetrasiloxane as a Probe Liquid for Characterizing the Pore Size Distribution of Oil-Bearing Tight Sandstones by Nuclear Magnetic Resonance Cryoporometry. Mar. Pet. Geol. 2017, 88, 814–825. [Google Scholar] [CrossRef]
- Kou, M.M.; Liu, X.R.; Tang, S.D.; Wang, Y.T. 3-D X-Ray Computed Tomography on Failure Characteristics of Rock-like Materials under Coupled Hydro-Mechanical Loading. Theor. Appl. Fract. Mech. 2019, 104, 102396. [Google Scholar] [CrossRef]
- Zhou, X.P.; Zhang, J.Z.; Yang, S.Q.; Berto, F. Compression-Induced Crack Initiation and Growth in Flawed Rocks: A Review. Fatigue Fract. Eng. Mater. Struct. 2021, 44, 1681–1707. [Google Scholar] [CrossRef]
Publisher’s Note: MDPI stays neutral with regard to jurisdictional claims in published maps and institutional affiliations. |
© 2022 by the authors. Licensee MDPI, Basel, Switzerland. This article is an open access article distributed under the terms and conditions of the Creative Commons Attribution (CC BY) license (https://creativecommons.org/licenses/by/4.0/).