1. Introduction
The estimation of media properties from seismic data is an inverse problem. Under the general framework of full waveform inversion (FWI) by [
1], seismic inversion can be cast as an optimization problem. The solution can be found by locating the minima of a misfit function using the gradient method. The computation of the gradient of the misfit function, or the Fréchet derivative, involves two numerical wavefield simulations and one imaging condition as in conventional Reverse Time Migration (RTM) [
2,
3,
4]. The original FWI development in [
5] for use in acoustic media was extended to elastic media in [
1,
6,
7], and then applied to field data in [
8].
The direct straight-forward implementation of the above-mentioned method for the inversion of seismic velocity can easily lead to cycle skipping problems [
9] if the time difference between the synthetic data computed from the current velocity model and the observed data is larger than one period. In order to avoid it, the presence of long period or low frequency components are critical. However, most of legacy data do not have enough low frequency components, and broadband acquisitions are expensive and may require specially designed sources and sensors to mitigate the impact of background noises.
For seismic imaging, the estimation of seismic velocity is the most important step. The spectrum of seismic velocity can be approximately divided into two zones: the low frequency zone (below 2 Hz) which contains the long wavelength of the velocity, and the high frequency zone which contains the rapid perturbations [
10]. This observation corresponds to two categories of approaches for velocity estimations. The long-wavelength components are estimated by methods which mostly use the kinematic information (tomography) while the high-frequency components are estimated from full waveform inversion (FWI) which utilizes both amplitude and phase information. For most seismic data, there is a frequency gap between these two zones. For broadband data, the velocity estimated from tomography may overlap with that from full waveform inversion.
For seismic depth imaging, long-wavelength components are of primary importance. On one hand, subsurface macro structures are the main objective of imaging. On the other hand, from a processing and inversion perspective, the inversion of the high frequency components of velocity can be carried out only after the low frequency components are sufficiently well resolved. The traveltime information in seismic data is the main carrier of low frequency components of velocity. Therefore, velocity inversion using traveltime, or other equivalent kinematic information, is still the backbone of depth domain model building and one of the most well-developed approaches [
11].
However, as numerous field data practices suggest, model building using ray-based traveltime information suffers from low resolution problems, particularly in the directions perpendicular to the central raypaths. In the space domain, the impact zone of the ray-based tomography for a given source-receiver pair is solely along the raypath. Obviously, this goes against the physics. Physically, although traveltime usually represents a single pick on the seismic data, it is intrinsically a finite-frequency phenomenon [
12,
13,
14]. The data from which the traveltime residual is picked are always band-limited, and the phases of real data are not always linear with frequencies. According to the wave theory, traveltime errors are integrated variables over finite areas (2D) or volumes (3D) in which the models have perturbations [
15,
16,
17].
In this case, Ref. [
18] proposed an inversion of velocity by backward projecting the traveltime error of the desired event. The traveltime errors are measured by finding the maxima of the cross-correlations between synthetic waveforms and observed data. These measured errors are sensitive to waveform changes. In contrast with ray-based tomography, the inversion kernels are formulated based on the full wave equation theory. The actual numerical computations can be carried out via finite-difference or dynamic ray tracing. Following this, many studies have been conducted on different perspectives of the band-limited traveltime inversion, for example, [
14,
15,
19,
20,
21]. All these studies and analyses concluded that finite-frequency traveltime inversion gives higher-resolution model updates than ray-based tomography. For the current best practice of full waveform inversion, to use legacy data, the FWI schemes need to rely heavily on the matching of traveltime information [
9].
The replacement of ray theory by full wave theory in the computation of inversion kernels solves only one of the issues, namely the representation of the wavefield. There is another dimension which is more important, that is the real physics of the subsurface media. The final objective of inversion is to find the model which can accurately interpret the data. In terms of seismic data imaging and model building, the velocity model must be built such that the traveltime difference between the observed data and the predicted data is less than one period for the targets of interests and their amplitude must also be well matched. The observations of the different wave modes present in the data, other than the primary wave, and the fact that waves propagate at different speeds in different directions at both the rock sample level and the macro level, lead to the introduction of elasticity and anisotropy into imaging and model building.
The introduction of elastic assumption into inversion is mainly for full waveform inversion to completely match the synthetic data with the observed data. Here, [
22] investigated the application of acoustic FWI (for velocity) on real data, and concluded a prominent performance of acoustic FWI if the amplitudes are ignored. This leaves the potential for FWI to fail to invert the subtle details of the velocity. For reservoir characterization, seismic amplitude contains the amplitude versus reflection angle information. Ignoring the impact of S-wave component may lead to the misinterpretation of the P-wave [
23].
Anisotropy is very common in the subsurface due to geological deformation, fine layering [
24], and mechanisms such as fracturing [
25]. Evidence of anisotropy due to fine layering is also supported by direct simulation of wave propagation [
26]. Although anisotropy in most areas is weak [
27], its cumulative effect on traveltime is significant for waves traveling over long distances [
28,
29]. In this case, [
22] shows that considering P-wave anisotropy in FWI is even more important than taking elastic effects into account. This is because elastic effects only impact the amplitude of the P-wave and the amplitude can be suppressed by normalization. However, anisotropy mainly impacts the traveltime. Therefore, seismic imaging and model building must take this into account [
30,
31,
32]. For most inversions of model parameters, the anisotropy is not revolved by the inversion itself, but is usually built from well logs, vertical profile seismic data, or computed from empirical relations. Anisotropy must be assumed when wave simulations are performed to correctly handle the kinematics of the wave propagations. Two of the most common types of anisotropy in real practice are transverse anisotropy and orthorhombic anisotropy. The former happens often in shale and the later in fractured carbonate rocks, both of which are important source rocks.
In this paper, we start by revisiting the definition and computation of traveltime sensitivity kernels for general anisotropic elastic media and give explicit analytical solutions for the kernels in homogeneous isotropic elastic media. From these analytical solutions, we identify the critical elements that determine the behaviors of the kernels. For Vertical Transversely isotropy (VTI) elastic media, the sensitivity kernels can be decomposed into the summation of the sensitivity kernels for the background isotropic media and perturbation terms due to the presence of anisotropy. Next, we give the procedures for fast computation of kernels using velocity-stress formulations of the wave equation. For the computations of the traveltime kernel for a particular parameter, it is critical to identify the desired events containing the information of that parameter. We propose a method based on dynamic ray tracing and adaptive subtraction to extract the events needed for traveltime kernel computation. Finally, we show examples of various sensitivity kernels for Ocean Bottom Node (OBN) and Vertical Seismic Profile (VSP) acquisitions in a deep-water environment from which we can see that different acquisition geometries benefit the inversions of different media properties.
In order to simulate the wave propagations in the real subsurface, all examples in this paper are 3D. In contrast with global seismology where shear and surface waves are generally used for inverting velocity structures of the earth, in exploration seismology, we mainly use P- and SV-waves. Therefore, in this paper, we will focus on the derivation of various sensitivity and inversion kernels for these waves only.
2. Formulation of Traveltime Sensitivity Kernels in General Elastic Media
In this section, we will briefly review the definitions and derivations of the traveltime sensitivity kernels in general elastic anisotropic media.
In general elastic anisotropic media, the wave propagation is controlled by the following motion equation [
33]
and the constitutive equation,
In Equations (1) and (2),
is the density,
is the particle displacement vector,
is the 4th order elastic constant tensor and is usually expressed in terms of seismic velocities and anisotropic parameters in modeling and imaging.
is the stress tensor and
is the strain tensor.
is the density function of a directional body force with unit of Newton per unit volume. For media with a predefined symmetry axis or planes such as vertical and tilted transversely isotropic (VTI/TTI) and orthorhombic media, the number of independent elements in
is usually less than that for most general media [
34,
35].
In the following sections, we will use Equations (1) and (2) for the derivations of sensitivity kernels. However, from the perspective of numerical simulation, the following set of equations formulated in terms of particle velocity and stress is the preferable choice.
and time-development version of Equation (2),
where
is the particle velocity vector. Theoretically, the set of Equations (3) and (4) is completely equivalent to the set of Equations (1) and (2). However, they have different numerical behaviors. Numerical algorithms based on Equations (3) and (4) usually have less numerical dispersion and higher accuracy due to the staggered grids in both time and space and higher order spatial finite-difference schemes. For the details of the algorithm, see [
36,
37].
The traveltime sensitivity kernels connect the traveltime perturbation for one particular wavepath with the model parameter perturbations along the wavepath. Each wavepath is related to a selected event for a given source-receiver pair. One event may correspond to multiple wavepaths. While raypaths computed by ray theory have zero widths, the wavepaths considered here are computed assuming finite frequency and therefore are of finite width. The sensitivity kernels can be derived by assuming that the maximum time mismatch happens at the zero-lag of the cross-correlation between the observed data and the simulated data generated using the current model. The derivation of the relation between the time mismatches and the model errors can be found in [
12,
18,
21].
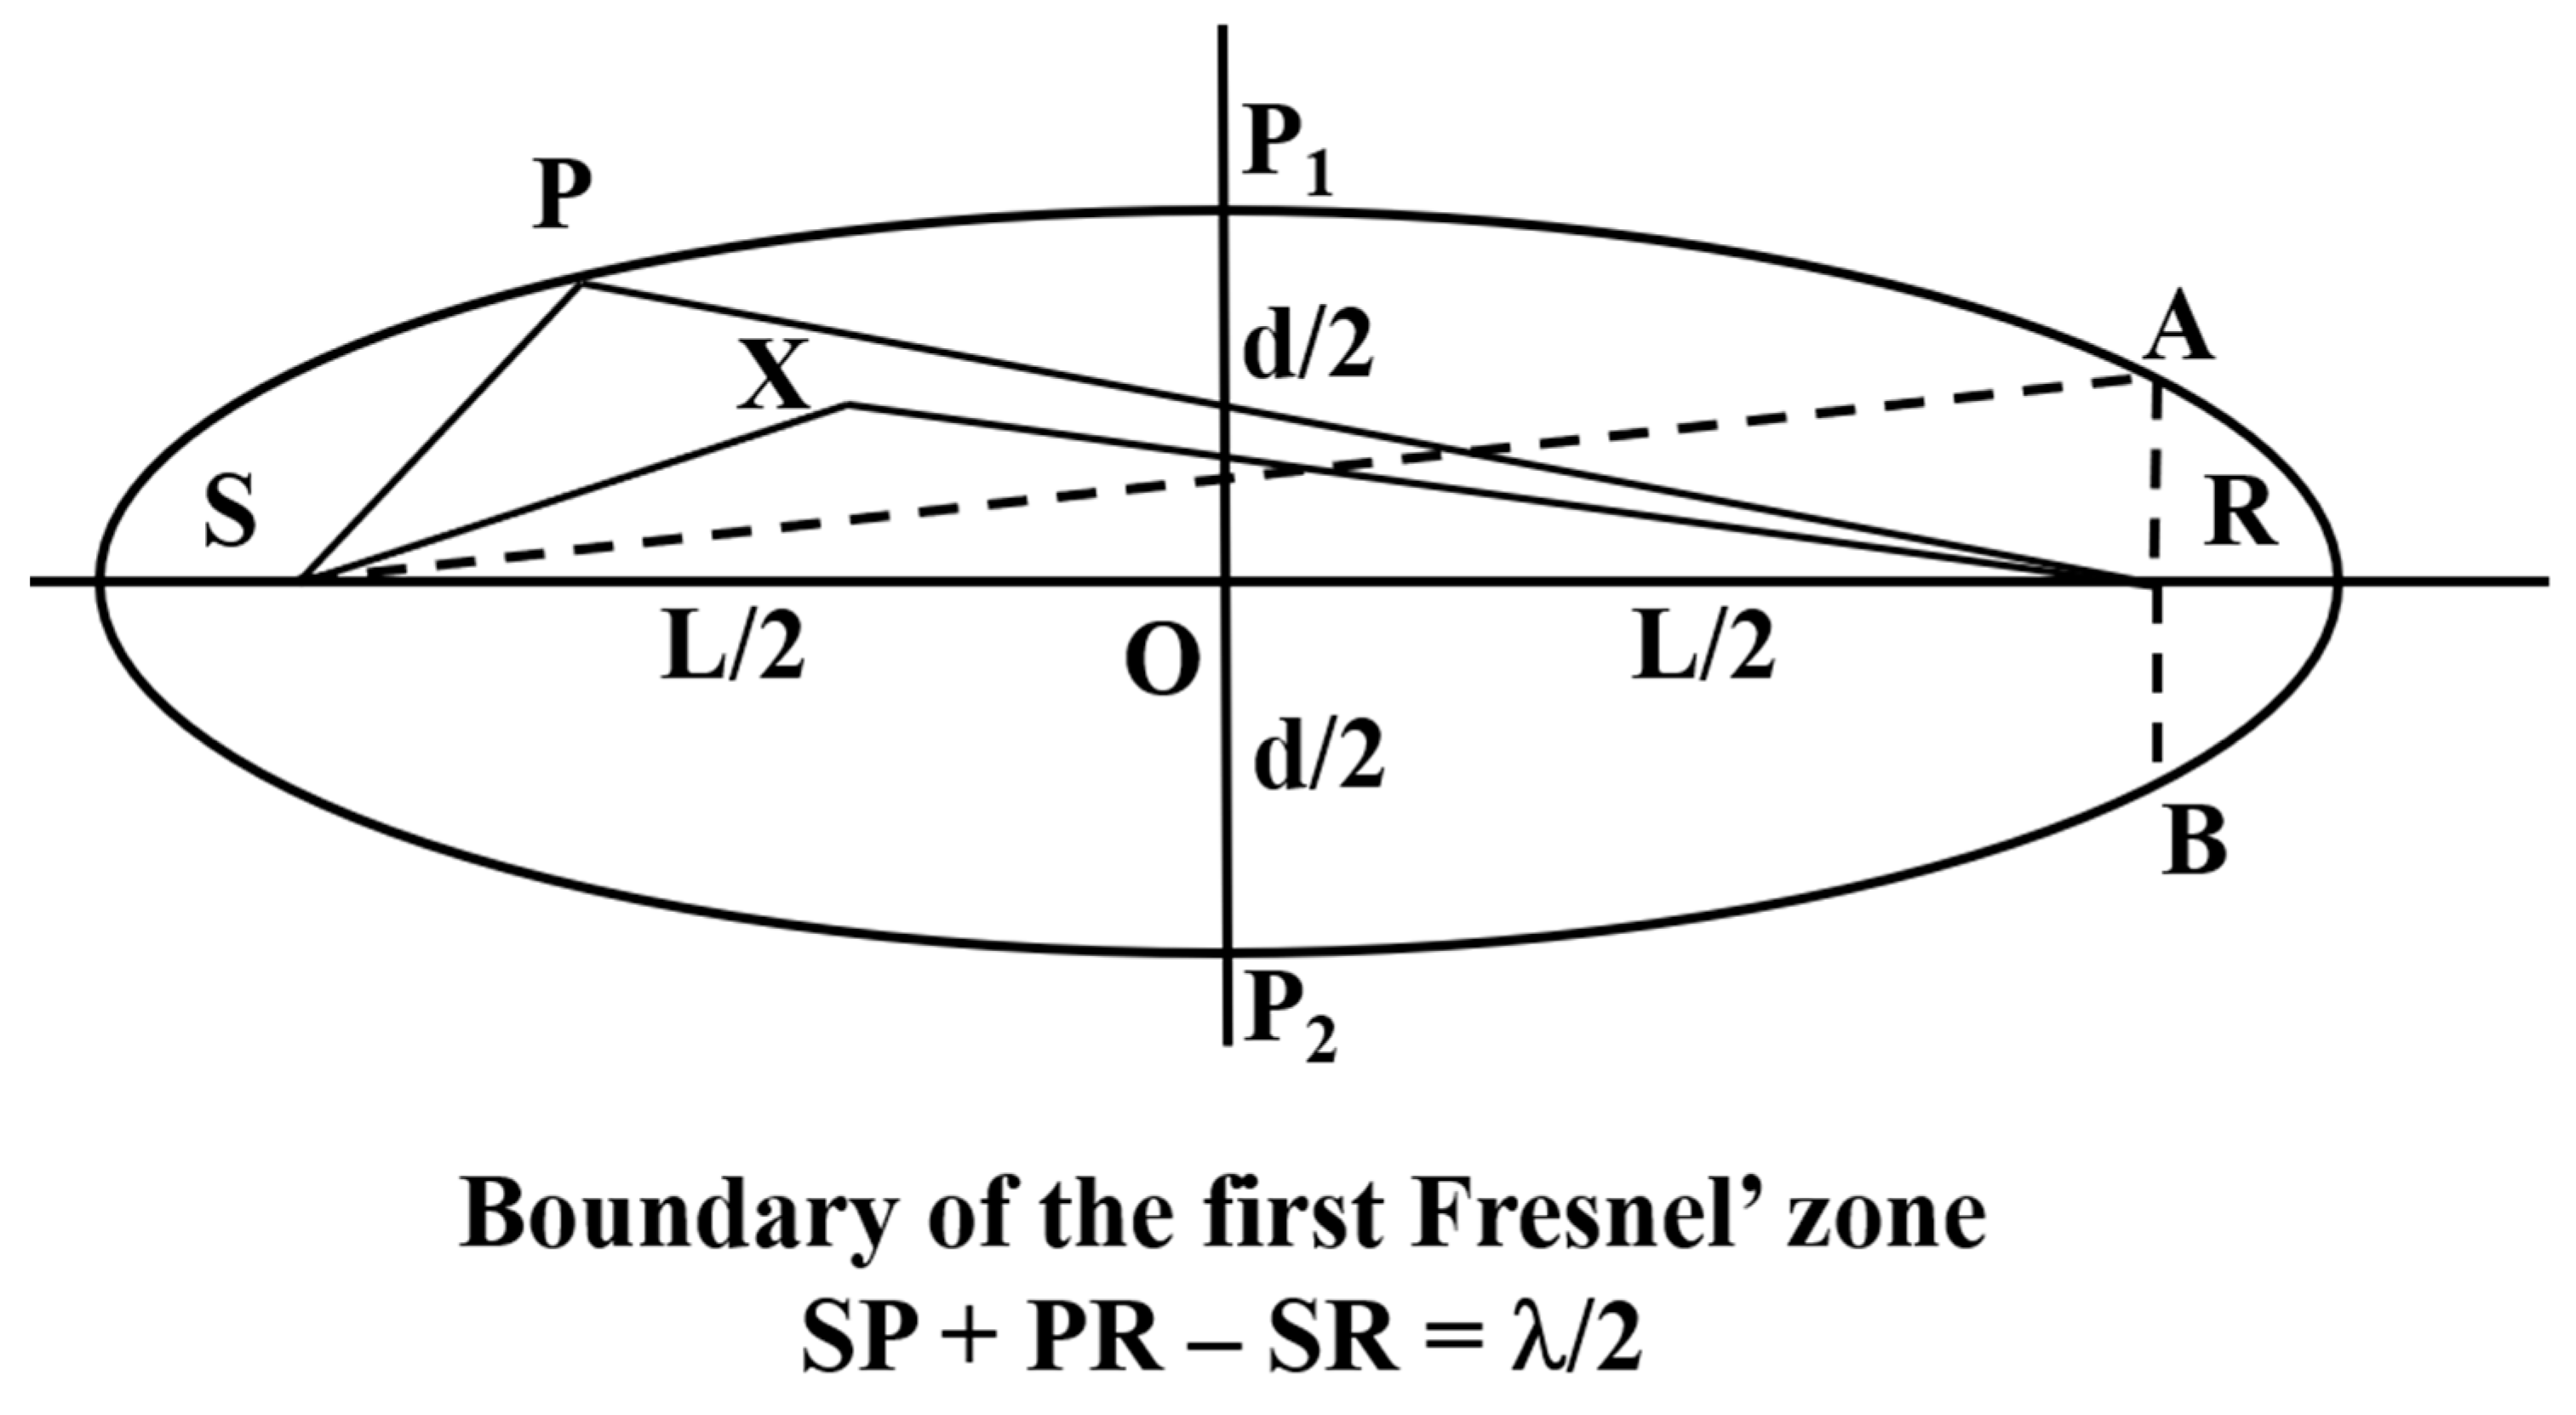
In ray-theory, one of the dominant methods in seismic imaging and model building, the traveltime between the source and receiver is only impacted by the media properties along the raypath itself. Although the ray amplitude loses its accuracy in very complicated models, its traveltime is quite reliable. In the real subsurface, seismic data have finite frequency content and this fact is reflected in both their amplitude and the traveltime. A critical observation regarding finite-frequency traveltime is that all the media properties inside the Fresnel zones (
Figure 1) around the central raypaths have impacts on the traveltime from the source to the receiver [
38,
39]. The media changes along the central raypath have zero impact on the traveltime. This is significantly different from that predicted from ray theory [
19,
38].
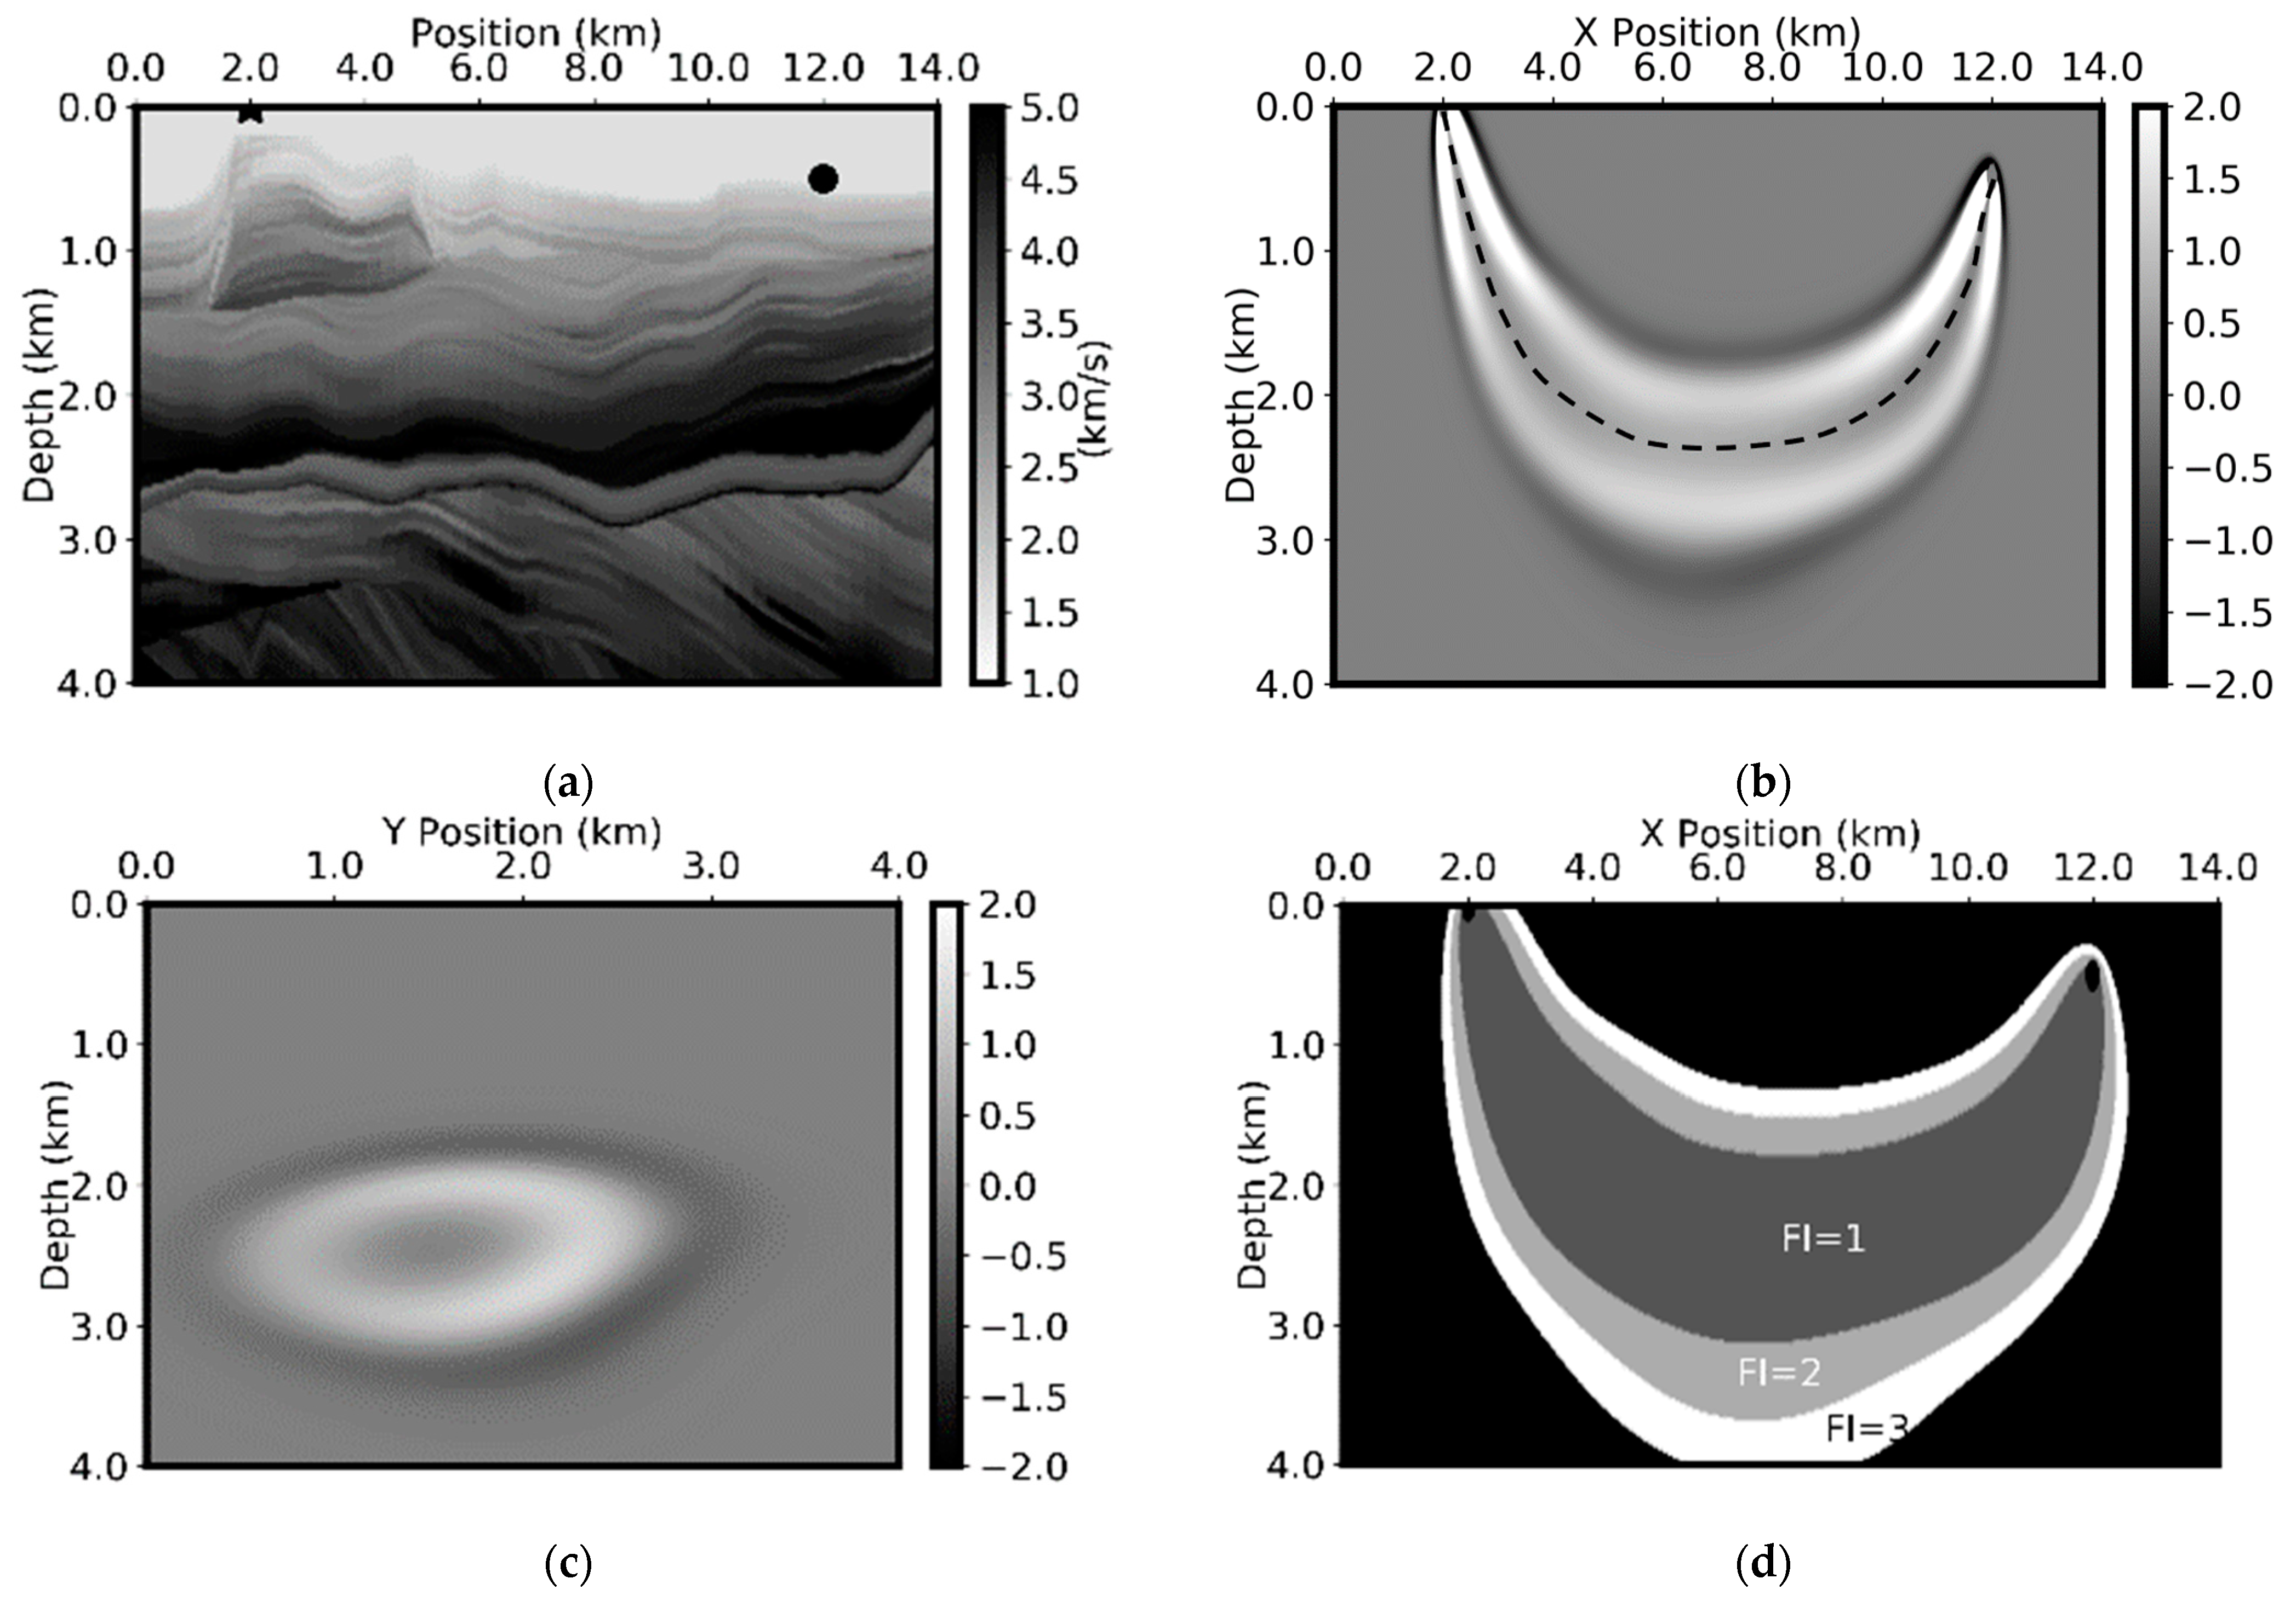
As an example,
Figure 2 shows the sensitivity kernel (b and c) and Fresnel zones (d) for the acoustic P-wave for OBN acquisition geometry in a deep-water environment. The P-wave velocity model is given in
Figure 2a and was smoothed before being used for ray tracing (for the computation of Fresnel zones).
The sensitivity kernel shown in
Figure 2b is for the first arrival from the source to the receiver for an Ocean Bottom Node/Cable (OBN/OBC) geometry. The P-wave sensitivity kernel and the Fresnel zones are computed for acoustic wave equation dynamic ray tracing [
31,
40]. Additionally shown in the
Figure 2b is the raypath between the source and the receiver. For this particular source-receiver pair, it happens that there is only one central raypath. The sensitivity kernel inside the first Fresnel zone is positive, negative inside the second Fresnel zone, and so on. This oscillating nature is precisely the reason why finite-frequency can invert higher resolution media properties than ray theory.
The finite-frequency kernel is a function of frequency, space, and acquisition geometry. Compared with ray-based tomography, in the finite-frequency inversion, the single traveltime information can be used for inverting all the model perturbations inside the first Fresnel zone which is much wider than the raypath itself.
Figure 2 only shows the kernels associated with P-waves. In practice, we have to process both P- and S-waves in seismic exploration. This requires the estimations of both P- and S-wave velocities before processing. In addition, seismic waves usually travel more than 10 km before being recorded at the receivers. Over such a long distance, the impact of anisotropy cannot be ignored. Therefore, we will start with the studies of the wave propagations in general anisotropic elastic media and move to more specific types of media such as transversely isotropic media, which have been found to have many practical applications in the seismic data processing.
For one particular event acquired at a receiver
, due to a source at
, the traveltime perturbation of this event is related to the perturbation of the media properties (
and elastic constants
) by the following expression [
12,
41,
42]:
where the overlines indicate the kernels are for one particular source-receiver pair and the superscript
T indicates the kernels derived for the traveltime perturbation formulation.
is the sensitivity kernel of the traveltime to the density and
is the sensitivity kernel of the traveltime to each of the elastic constants. When using Equation (5) for the computation of kernels, we also need to specify the events for which the traveltime perturbation
is defined. For one event of a selected source-receiver pair, we may have multiple wavepaths associated with that event. Each wavepath has its kernel. However, for the simplicity of notations, we omit the event-dependency of the variables in Equation (5).
The expressions of the sensitivity kernels
and
are given by:
In Equations (5)–(7), is the traveltime perturbation between source and receiver due to the perturbation of density and elastic constants . In terms of the terminologies of the inverse problem, Equation (5) tells the amount of the model updates needed to match the traveltime mismatch . is the component of the particle displacement of synthetic wavefield in the direction, is the component of the particle displacement of the backward wavefield. is the strain tensor component of the forward wavefield and is the strain tensor component of the backward wavefield (adjoint strain wavefield). No implicit summation is assumed for the indices , , , and in Equation (7), but the implicit summation is assumed in Equations (5) and (6).
In addition to sensitivity kernels, we also talk about the inversion kernels. Corresponding to
and
, their inversion kernels,
, and
, are defined by the following relation:
In contrast with the sensitivity kernels, which define the linear relation between the perturbations of data and a percentage of model perturbations, the inversion kernels define linear relations between the perturbations of data and the perturbations of the model parameters themselves. When a parameter is defined around zero, it is not possible to define its corresponding sensitivity kernel. However, we can still define its inversion kernel. As we will see next, anisotropy is such an example. We usually derive the inversion kernels first and then convert them to the sensitivity kernels.
Similar to reverse time migration (RTM), Equations (6) and (7) define an imaging procedure in which the final traveltime kernels, to density and elastic constants, are computed based on the zero-lag cross-correlation between two wavefields [
43]. The forward wavefield, or the band-limited Green’s function, is computed using the user-defined wavelet in the normal time extrapolation. The backward wavefield is the extrapolation of the events of the data at the receiver, but in reverse time order. However, inversions of different types of data need to have different forms of adjoint forces [
44]. For the finite-frequency inversion of traveltime, given the event for source-receiver pair
, the following formulas define the adjoint force vector at
to be used for the extrapolation of the backward wavefield:
where
one for each component in
,
, and
directions (no summation over
) and
is the normalization factor of the adjoint force amplitude (no summation over
), given by:
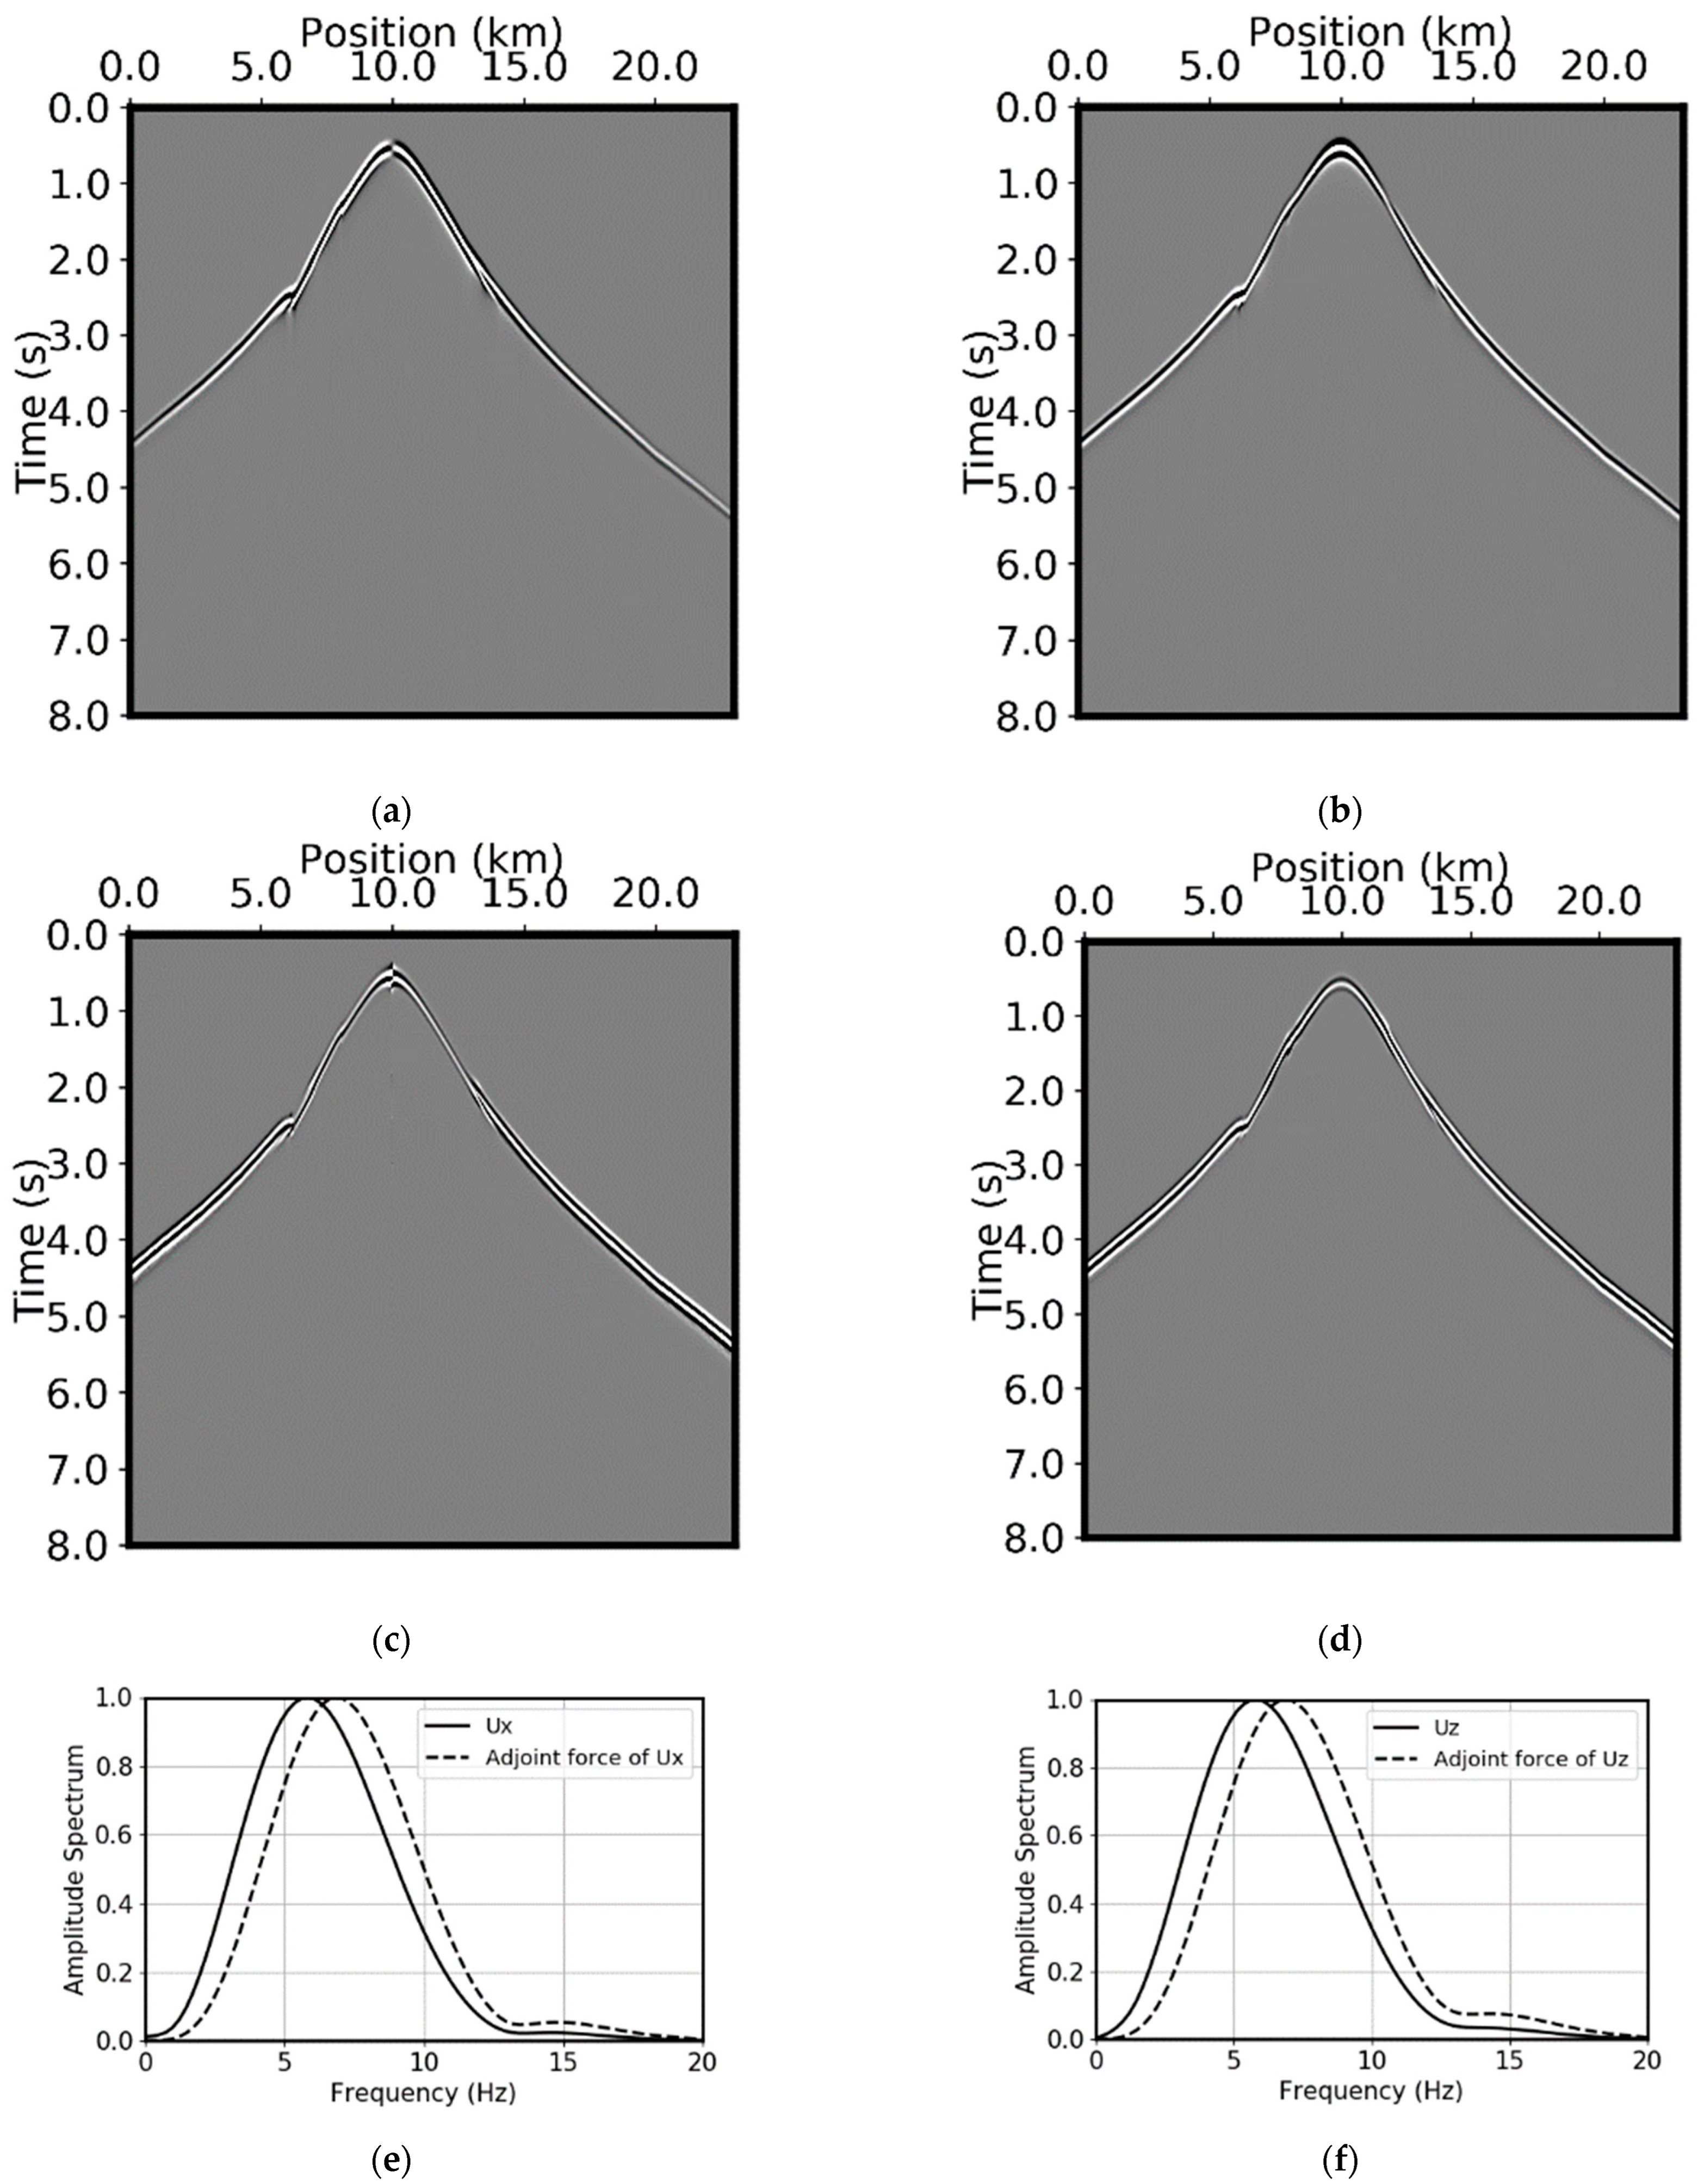
In both Equations (9) and (10), is the component of the particle velocity in the direction. needs to only contain the events whose traveltime is required to be inverted.
Note that the computation of the adjoint force (Equation (9)), and therefore the backward wavefield computation, does not need the observed data. Its computation only involves the forward wavefield. This property is important for reliable and stable computations of sensitivity kernels since this allows us to do any desired pre-processing for the synthetic data before backward extrapolation. However, when we use the traveltime inversion kernels to invert for the model perturbations, we do need to pick the traveltime errors, , between the traveltime of the observed data and the traveltime of the synthetic data from the current models for the given source-receiver pair .
The kernels in Equations (6) and (7) and the adjoint force depend on the background models,
and
, the source mechanism used for multi-component data acquisition and the source wavelet used for the forward modeling. The derivation of adjoint force, Equations (9) and (10), assumes the traveltime difference between the observed data and the synthetic data is at the time lag where their cross-correlation reaches the maximum [
12,
18]. Therefore, the spectral of both the observed data and the synthetic data have impacts on the picks of the traveltime errors [
38]. In order to obtain accurate traveltime picks, the synthetic data should be a good approximation of the observed data at the same receiver location. Therefore, the source wavelet used in the forward modeling must be carefully estimated from the real data.
Equations (5)–(7), (9) and (10) remain valid for general anisotropic elastic media. However, for practically important types of media such as isotropic elastic and transversely isotropic elastic media, these equations are too general to give clear physical insights. It will be much more desirable to formulate the sensitivity or inversion kernels in terms of the specific parameters for each particular type of media. This will be the main focus of this paper.
The accuracy of the numerical solution of the sensitivity kernels computed by this approach, particularly Equations (7), (9), and (10), can be verified by a special case of media with zero shear-wave velocity. This special case is important for oil and gas exploration in which usually only P-wave are of great interest and for studies in which only SH-wave is involved. The details of comparisons between the exact solution and the numerical solutions can be found in [
21].
3. Traveltime Sensitivity Kernels in Isotropic Elastic Media
For references to be used in the next sections for the formulation of the traveltime sensitivity kernels in VTI media, we first revisit the formulas of the traveltime sensitivity kernels in isotropic elastic media. We will see that the sensitivity kernels in anisotropic media can be decomposed into the summation of the sensitivity kernels for the background isotropic media and perturbation terms related to the presence of anisotropy.
For isotropic elastic media, the most fundamental media parameters are density
, bulk modulus
, and shear modulus
. Using these parameters, the elastic constant tensor can be represented as [
33]:
The subscript 0 in the bulk modulus
and shear modulus
are meant to be consistent with the symbols for transversely isotropic and orthorhombic media. In Equation (11),
and
is the P-wave velocity and
is the S-wave velocity. Using
,
, and
, the perturbation of traveltime can be represented as the summation of the contributions by perturbations of
,
and
,
Since the sensitivity kernels in isotropic media have been extensively studied, we mainly list the results here. Interested readers can refer to the papers cited in the reference section for additional details such as [
16,
41,
42]. The sensitivity kernel of the traveltime to density remains the same as that in Equation (6). The sensitivity kernel expressed in terms of elastic constant tensor
can be converted into kernels in terms of bulk modulus
and shear modulus
:
and,
where
is the deviator strain tensor.
Since acoustic pressure is defined as,
can also be written as,
As we will show next, when using particle-velocity and stress formulation for the simulation of the elastic wave propagations, Equation (16) is preferable to Equation (13). Therefore, the computation of
is simply the conventional reserve time migration using acoustic pressure with the final image scaled by
. However, in contrast with conventional RTM which uses the acoustic pressure data as direct input in the backward propagation, the computation of sensitivity kernels needs the adjoint force which must be computed from the multi-component particle displacements as shown in Equations (9) and (10). Equations (13) and (14) give the sensitivity kernels of the traveltime to bulk modulus and shear modulus for isotropic elastic media. In
Section 6, we will derive the corresponding kernels for VTI elastic media. Once the kernels for density, bulk modulus, and shear modulus are computed, they can be converted into kernels for other parameters, for example, for P-wave and S-wave velocities (see, e.g., [
41]).
Figure 3 shows the 3D traveltime sensitivity kernels for a homogenous isotropic elastic media. In this example, P-wave velocity is 2000 m/s, S-wave velocity is 1069 m/s, and density is 2063 kg/m
3. The source wavelet used for the forward modeling is a Ricker wavelet with dominant frequency of 6 Hz. The source is an explosive force. The wave propagation is simulated using a 3D staggered-grid finite-difference [
37]. The three components of the particle displacement at the receiver were recorded.
One critical difference between the computation of the traveltime sensitivity kernels in elastic and in acoustic media is that in acoustic media, there is only one component used for traveltime definition and picking, while in the elastic case, each of the three components can be used for traveltime picking. Therefore, in
Figure 3, we show several different kernels.
Figure 3a,c,e assume the traveltimes are picked from the
x component of particle displacement.
Figure 3b,d,f assumes the traveltimes are picked from the
z component of particle displacement. In order to compare the magnitudes and phases of all the kernels, we extract the kernels along the direction perpendicular to the central raypath and at the middle of the source-receiver.
Figure 3g plots the kernels computed using the
x component of the particle displacement (solid curve) and using only the
z component of the particle displacement (dashed curve). Several observations can be made from
Figure 3. First, the kernels in Equations (6), (13), and (14) correctly backward extrapolate both the
x and
z components. There is no image cancellation due to the polarity issues. The kernels from different components are consistent in phase. The actual distribution of the values of the kernels is slightly different. Second, the kernels are more complicated at the receiver locations. This is because, for explosive force, the contributions from the S-waves are comparable with those from the P-wave at locations close to the receiver, while at locations far from the receiver location, the S-wave contributions are small since the S-wave traveltime is large. We will prove this in the next section when we derive the analytical solutions of the kernels. Third, the Fresnel zones are visible for this simple model, as shown in
Figure 3g where the traveltime kernels are zero at the central raypath. This “standard” banana-doughnut shape [
19] only happens in very simple models. In complicated models, since there may be multiple wavepaths for one event, the kernels may not have well-defined banana-doughnut shapes. We will see this in the examples in next section. Fourth, the Fresnel zones computed using different component inputs are in the same phase but in differ in directions and spatial locations. This is important since even though different components can be used for traveltime picking, their sensitivity still result in the same traveltime given the same perturbation of the model. The difference in kernels using different component indicates that the impacts of seismic parameters are not equally contained in the data. For example, vertical component mainly contains the P-wave velocity information. However, for the inversion of S-wave velocity, horizontal component must be used.
4. Analytical Solutions of the Traveltime Sensitivity Kernels in Homogeneous Isotropic Elastic Media and the Kernel Phase Function
Equations (6), (7), (13) and (14) give the complete formulation of the sensitivity kernels in general anisotropic and isotropic elastic media. Due to various impacting factors such as the external forces, the boundary conditions and the spatial changes of the models, wavefields may be extremely complicated. General numerical methods such as finite difference may provide the complete solutions. However, essential properties are hidden in the complexity of numerical details.
In order to have a better understanding of the kernels in elastic media, we derive analytically solutions of the sensitivity kernels in homogeneous elastic isotropic media. These analytical solutions, in their simplest forms, provide insight into the properties of the inversion kernels, including their phases, amplitudes, and their variations with frequency, velocity, and acquisition geometry. When inverting media properties using traveltime under the finite-frequency assumption, understanding these properties is helpful for how the data should be pre-processed, how the kernels should be conditioned before being used for inversion, and how to identify various crosstalks between different wave modes.
We start from the simplest seismic acquisition geometry. An explosive force generates the waves in a homogenous isotropic elastic media, three components of particle displacements are acquired at a given receiver and the traveltime of these components is used for inverting the media properties. This type of acquisition applies to both land and OBN/OBC data. The traveltimes of the events are picked, and these traveltimes are used to invert the model property along the wavepath between each source and receiver. This operation is repeated for all the possible source-receiver pairs. Upon completion of this process, we build the following linear system from Equations (5) or (12),
where
is the model perturbation vector,
is the traveltime residual vector
, and
is the matrix built from sensitivity kernels. The number of rows of
is the total number of events for selected source-receiver pairs used for picking and inversion, the number of columns of
is the total number of elements of
to be updated. Therefore, how well we can solve for
depends on how well we understand the properties of
. In contrast with the traveltime inversion based on ray theory where all the elements of
are along one raypath are positive, the elements in
are oscillating in nature.
We now consider a homogenous isotropic elastic media. The P-wave velocity is
, S-wave velocity is
, and density is
. An explosive source is located at
and the receiver is at
. We define
as the ratio between S-wave velocity and P-wave velocity,
. An arbitrary point in space is denoted by
. The distances are defined as
,
, and
. The P-wave traveltime from the source to the receiver is defined as
. The P-wave traveltime time from source
to
is
. The P-wave and S-wave traveltime from the receiver
to
is defined as
and
, respectively.
is the strength of the source in the forward wavefield and
is the source wavelet. We also denote
as the source wavelet which produces the data acquired at the receiver. Ideally
for synthetic data.
is always approximate and since there is no involvement of the real data in any part of the computation of the kernels, we can always assume
.
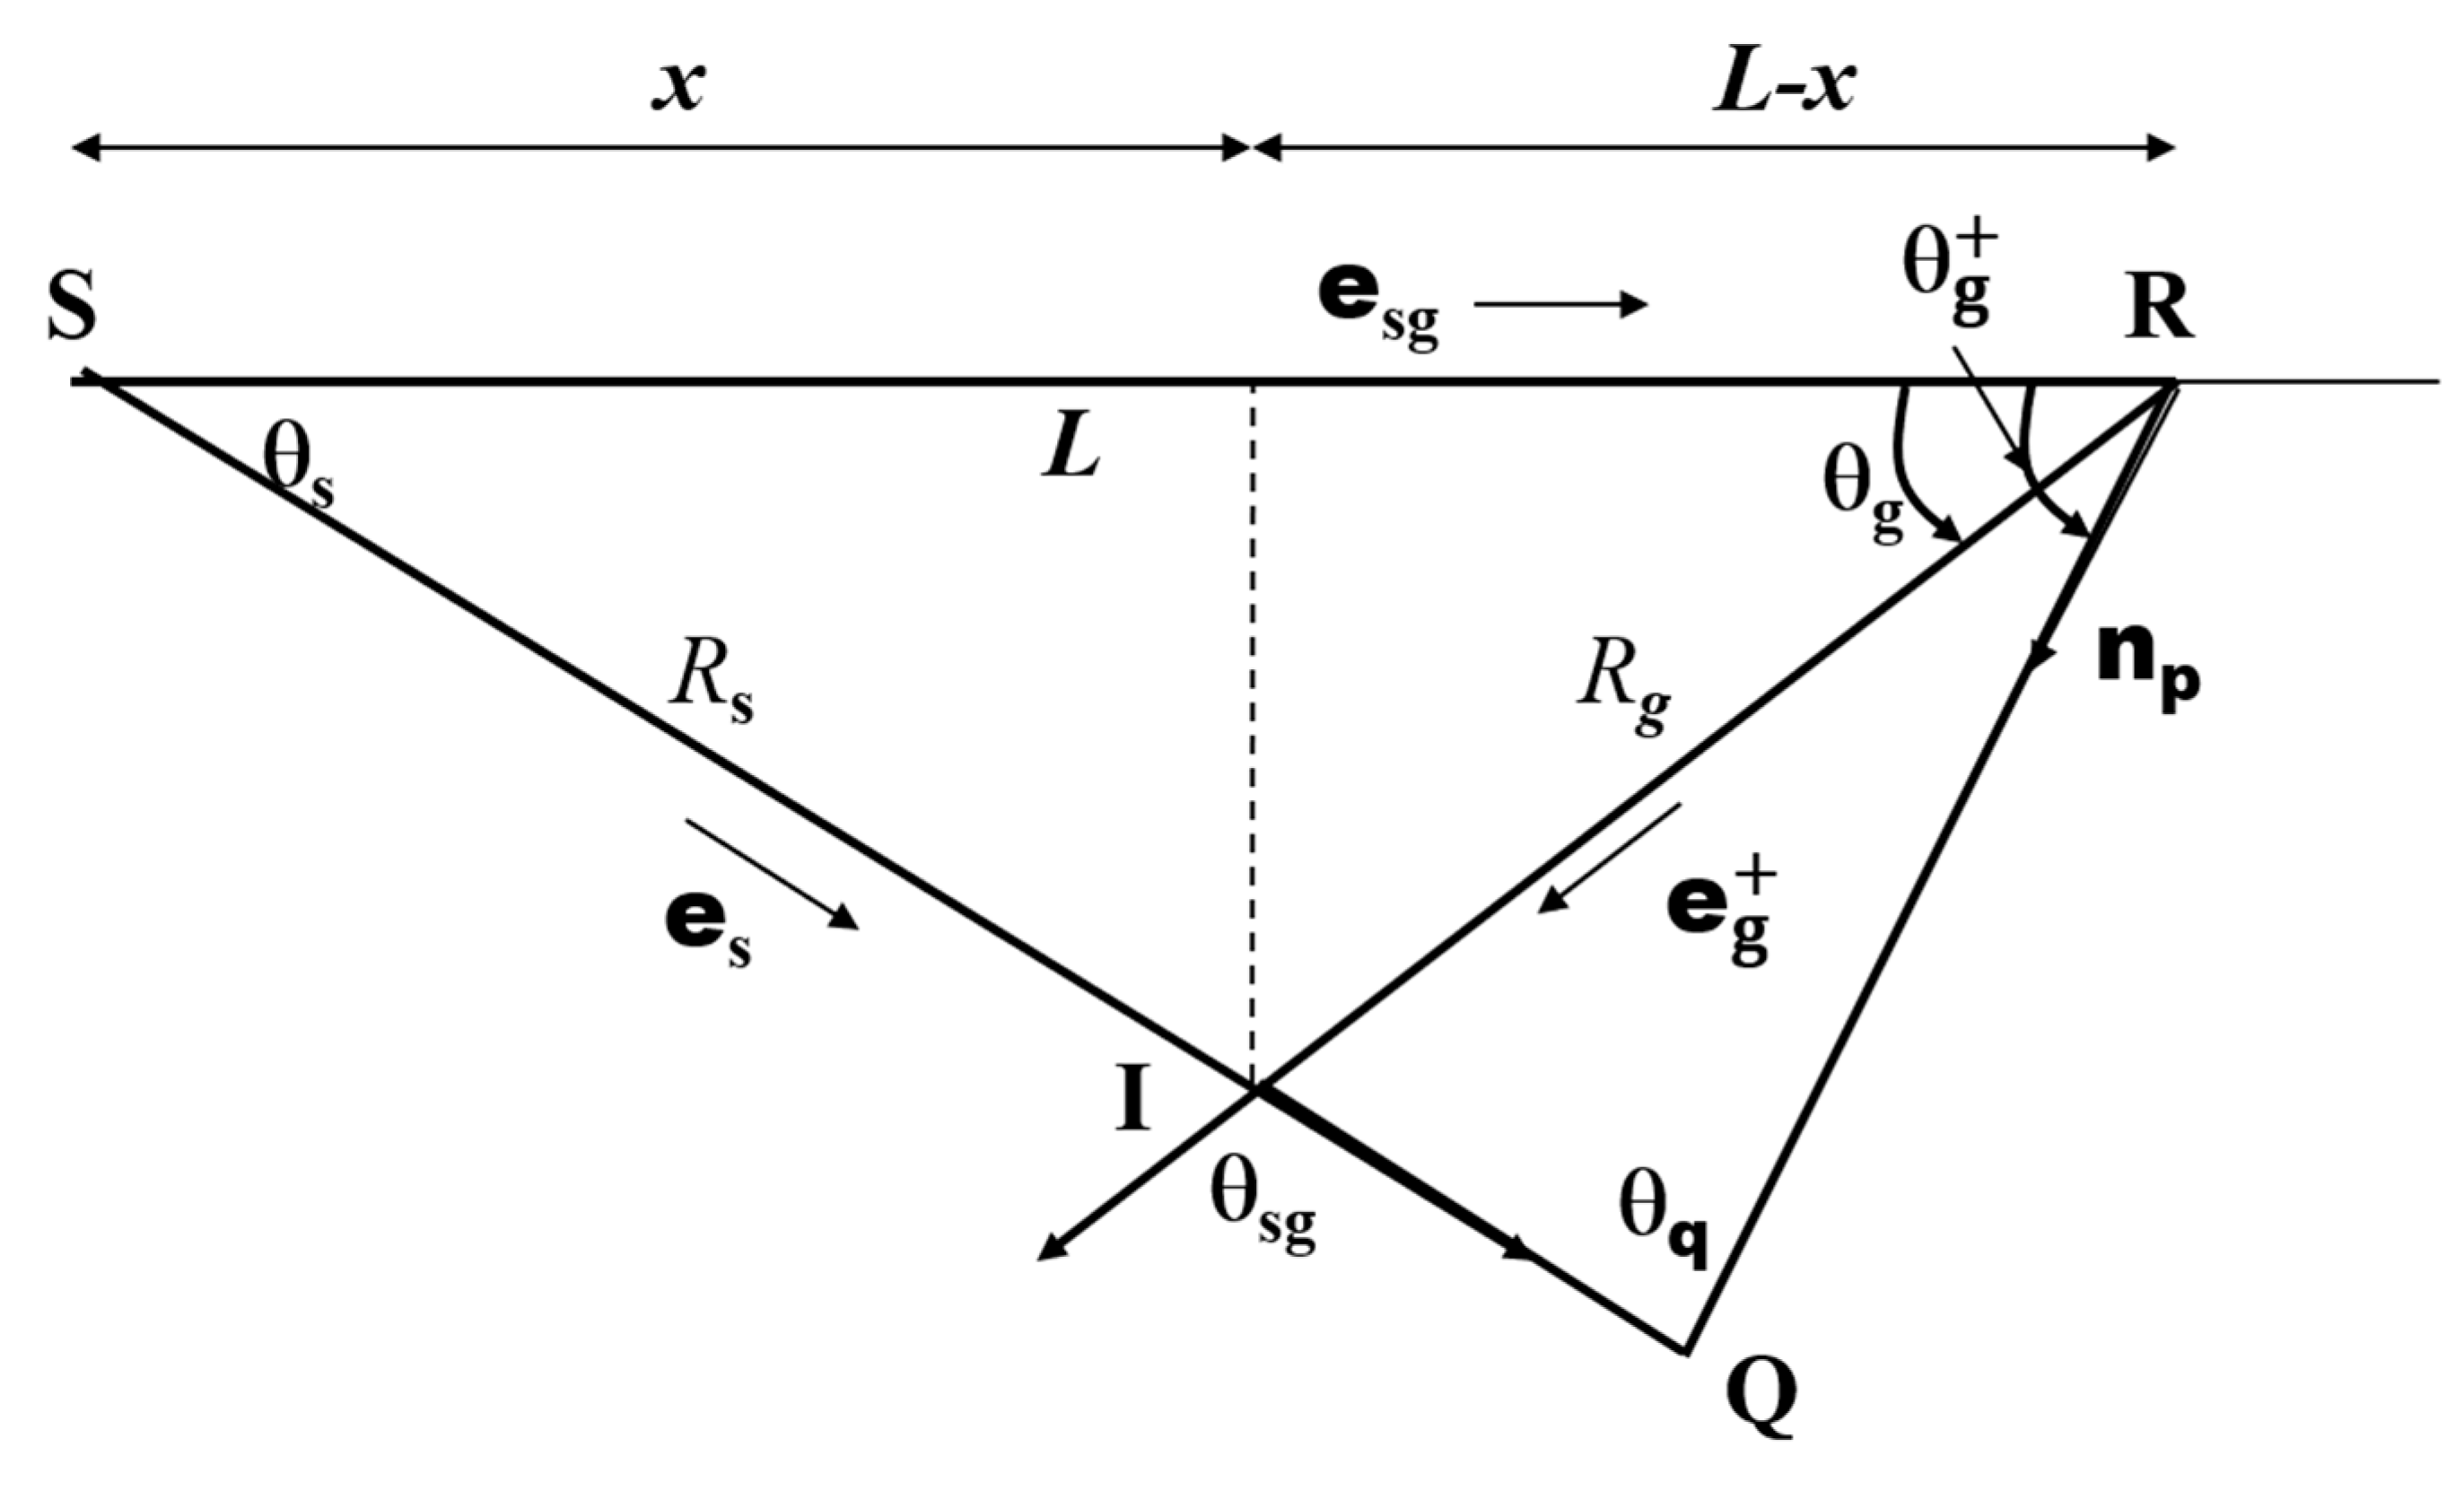
Figure 4 shows the geometrical elements and their relations.
We will see below that the traveltime residuals and play dominant roles in the kernels.
Given these definitions, the sensitivity kernels for bulk modulus
and density
can be written as:
and,
The details of the derivations are given in
Appendix A.
In Equations (18)–(21), is the unit vector from the source to point in the forward wavefield. is the unit vector from the receiver location to point for the backward wavefield. is the unit vector from the source to the receiver. is the normalized polarization vector of the adjoint force depending on which components are used for traveltime picking. is the angle between and , is the angle between and , and the angle between and . From Equations (18)–(21), we can see that the sensitivity kernel for bulk modulus is only contributed by the P-wave, however, impacted by the S-wave velocity (). The contribution to the sensitivity kernel for density comes from both P- (first term of Equation (19)) and S-wave (second term of Equation (19)) through the adjoint force at the receiver.
Although the actual forms of Equations (18)–(21) are exactly right only for homogenous isotropic elastic media, the general properties of , , and the dependency on direction remain valid for general heterogenous media. We just need to replace the amplitude and time in Equations (18)–(21)) by, e.g., asymptotic solutions. Three elements play essential roles in the sensitivity kernels, constant , function , and three normalized vectors (, , and ). We will discuss the impacts for each of them.
Constant
is defined by:
strongly depends on the relative positions of the source, receiver, and image points.
also weakly depends on the spectrum of the source wavelet. Some more detailed properties are given in
Appendix B.
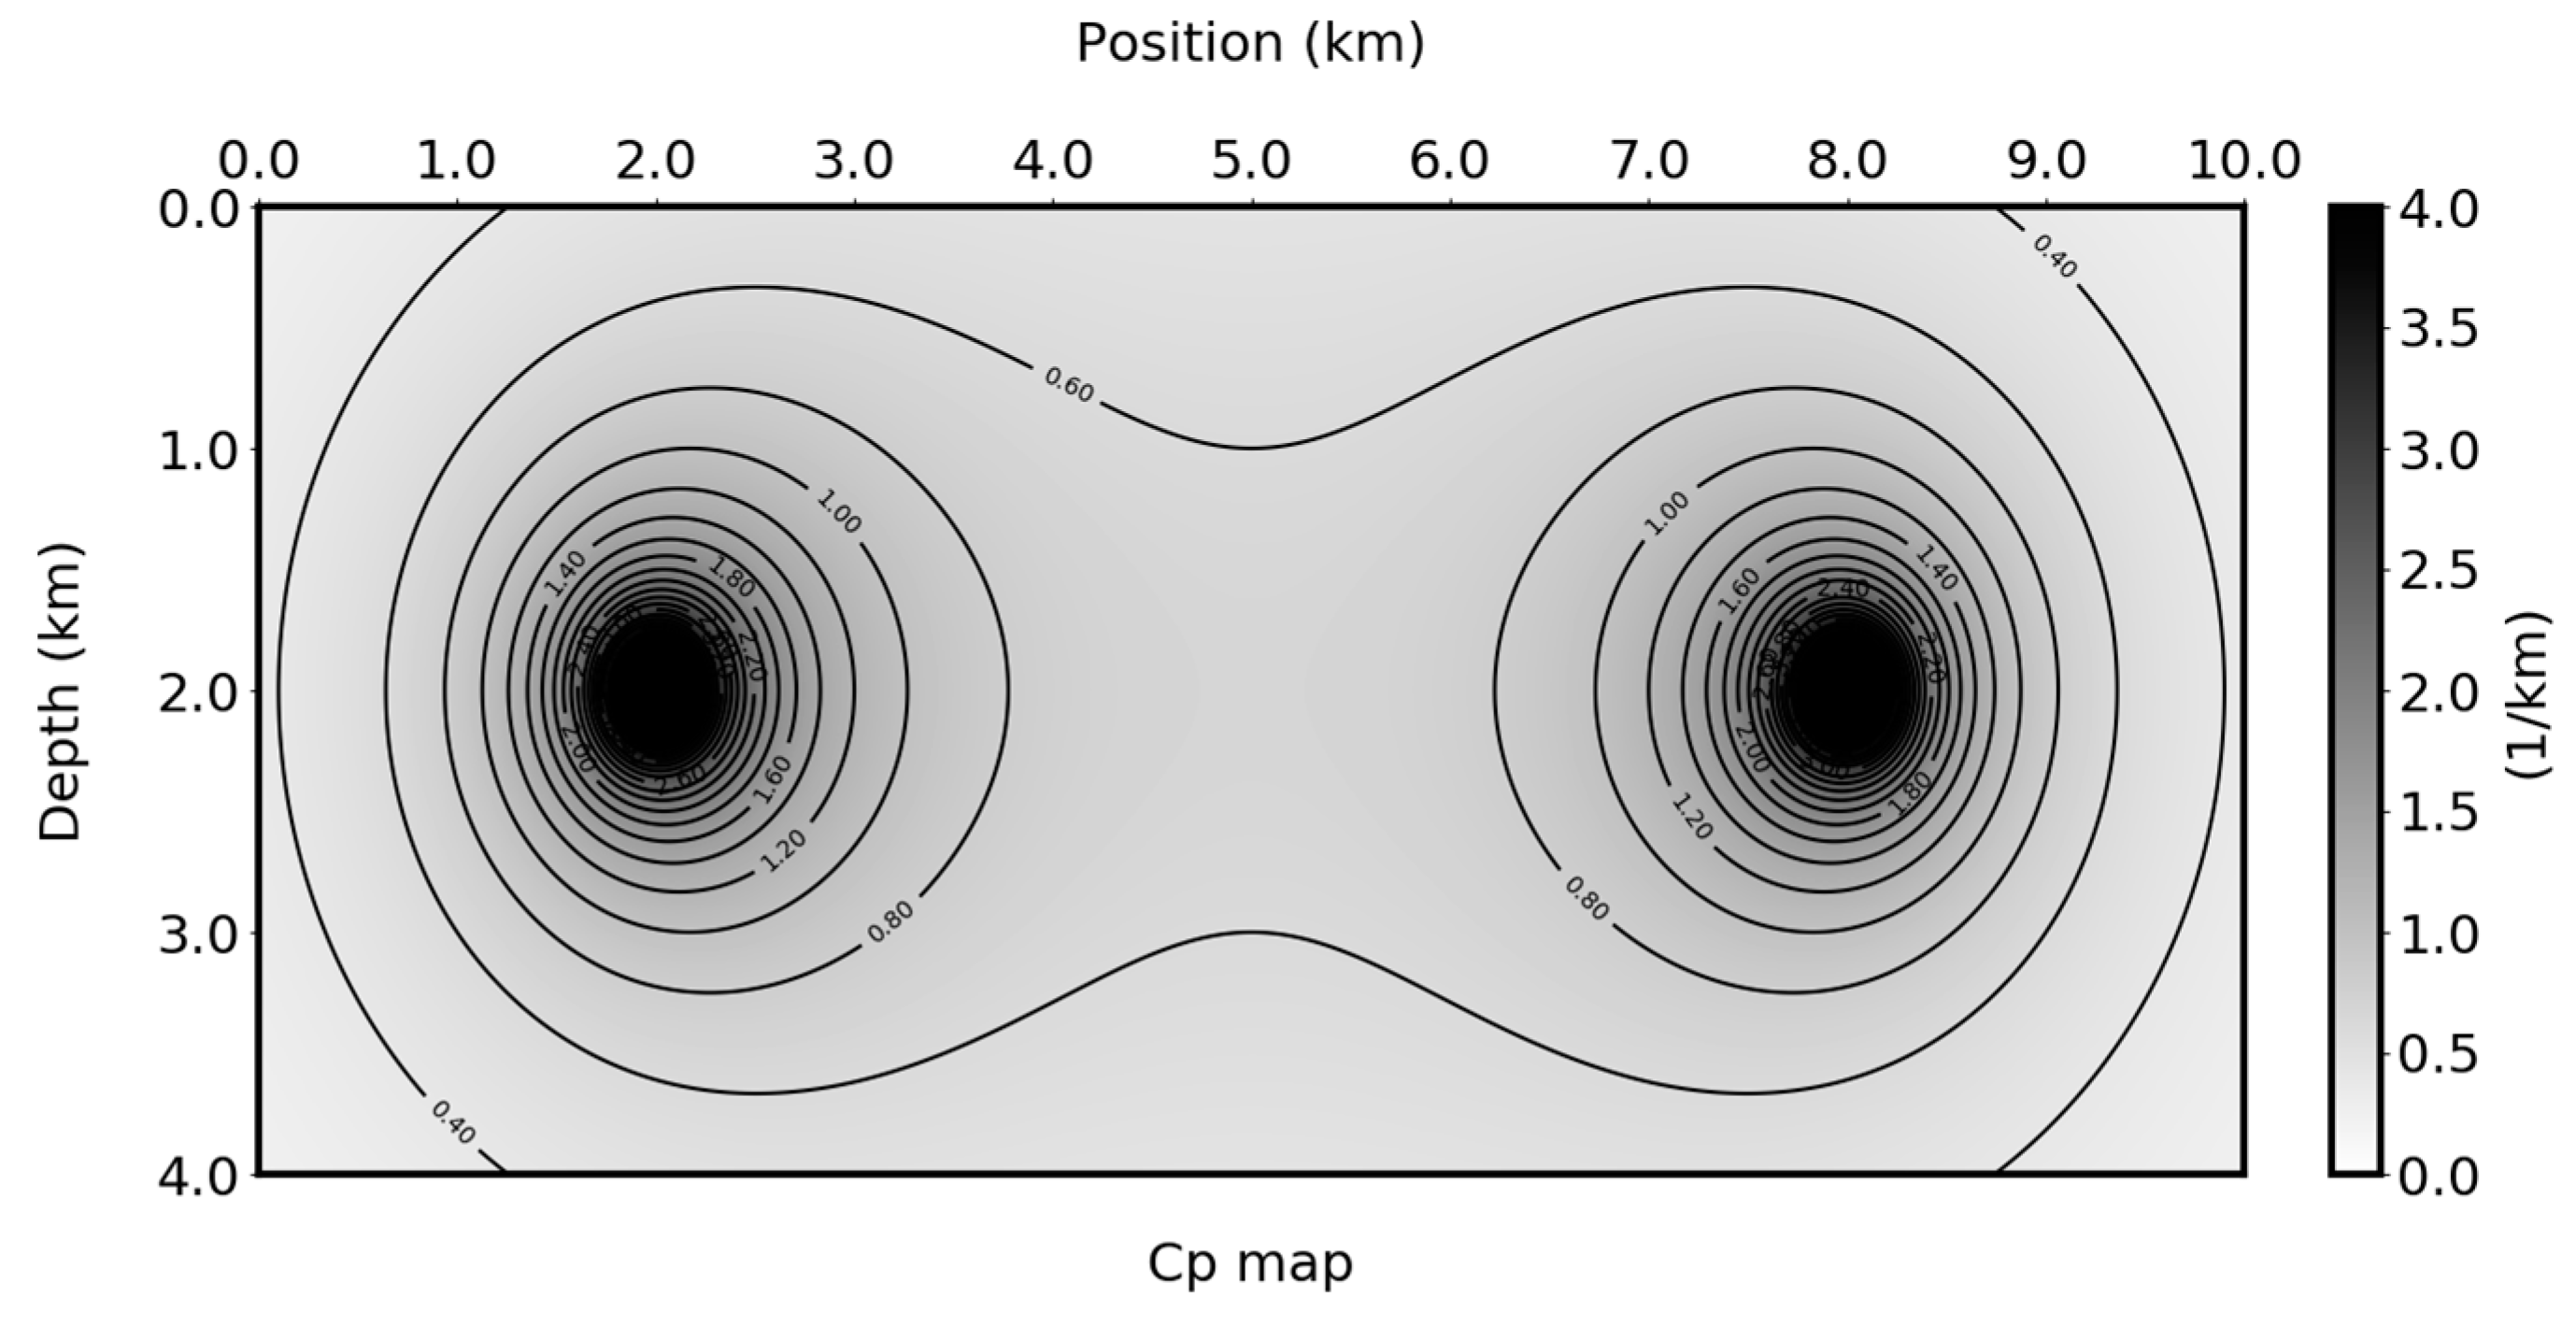
Figure 5 shows the spatial distribution of
. The factor
is a strong smoother and this smoothness of
leads to the very flat valley of the (3D) kernels near the central raypath. We can show that (also see
Appendix B) the gradient of
vanishes at the proximity of the central raypath due to the smoother
. This property, together with the fact that
is an odd function (see next), leads the zero value at the central raypath and makes the overall doughnut-shape of the cross-section of the traveltime kernels.
The function
is critical for understanding the properties of kernels. We call it the kernel phase function (KPF) and it is given by:
is the distribution density function (a positive function of frequency) and is constrained by:
can take many possible forms, such as the spectral density function from the source wavelet.
From Equation (23), we can see that
is the time derivative of cross-correlation between
and
. If we assume
,
is an odd function that is zero at time zero. Similar formulations can be found in [
12] for the case of global seismology.
The spectrum of is determined by the source wavelet used in synthetic modeling and the source wavelet estimated from the data . However, the spectrum of is has more high frequency than that of either or . is a slowly varying function and has an impact mainly on the spatial distribution of the amplitudes of the kernels. However, the oscillating nature and spectrum of the kernel are determined by which defines the Fresnel zone of the kernels. While Equations (18)–(21) and are only valid for homogeneous media, the form of remains similar for general elastic media and different types of source mechanisms. Only the spectrum of may be different. In general media, the traveltime perturbation should be replaced by , where is the traveltime between and for the given models, which can be computed using, e.g., dynamic ray tracing.
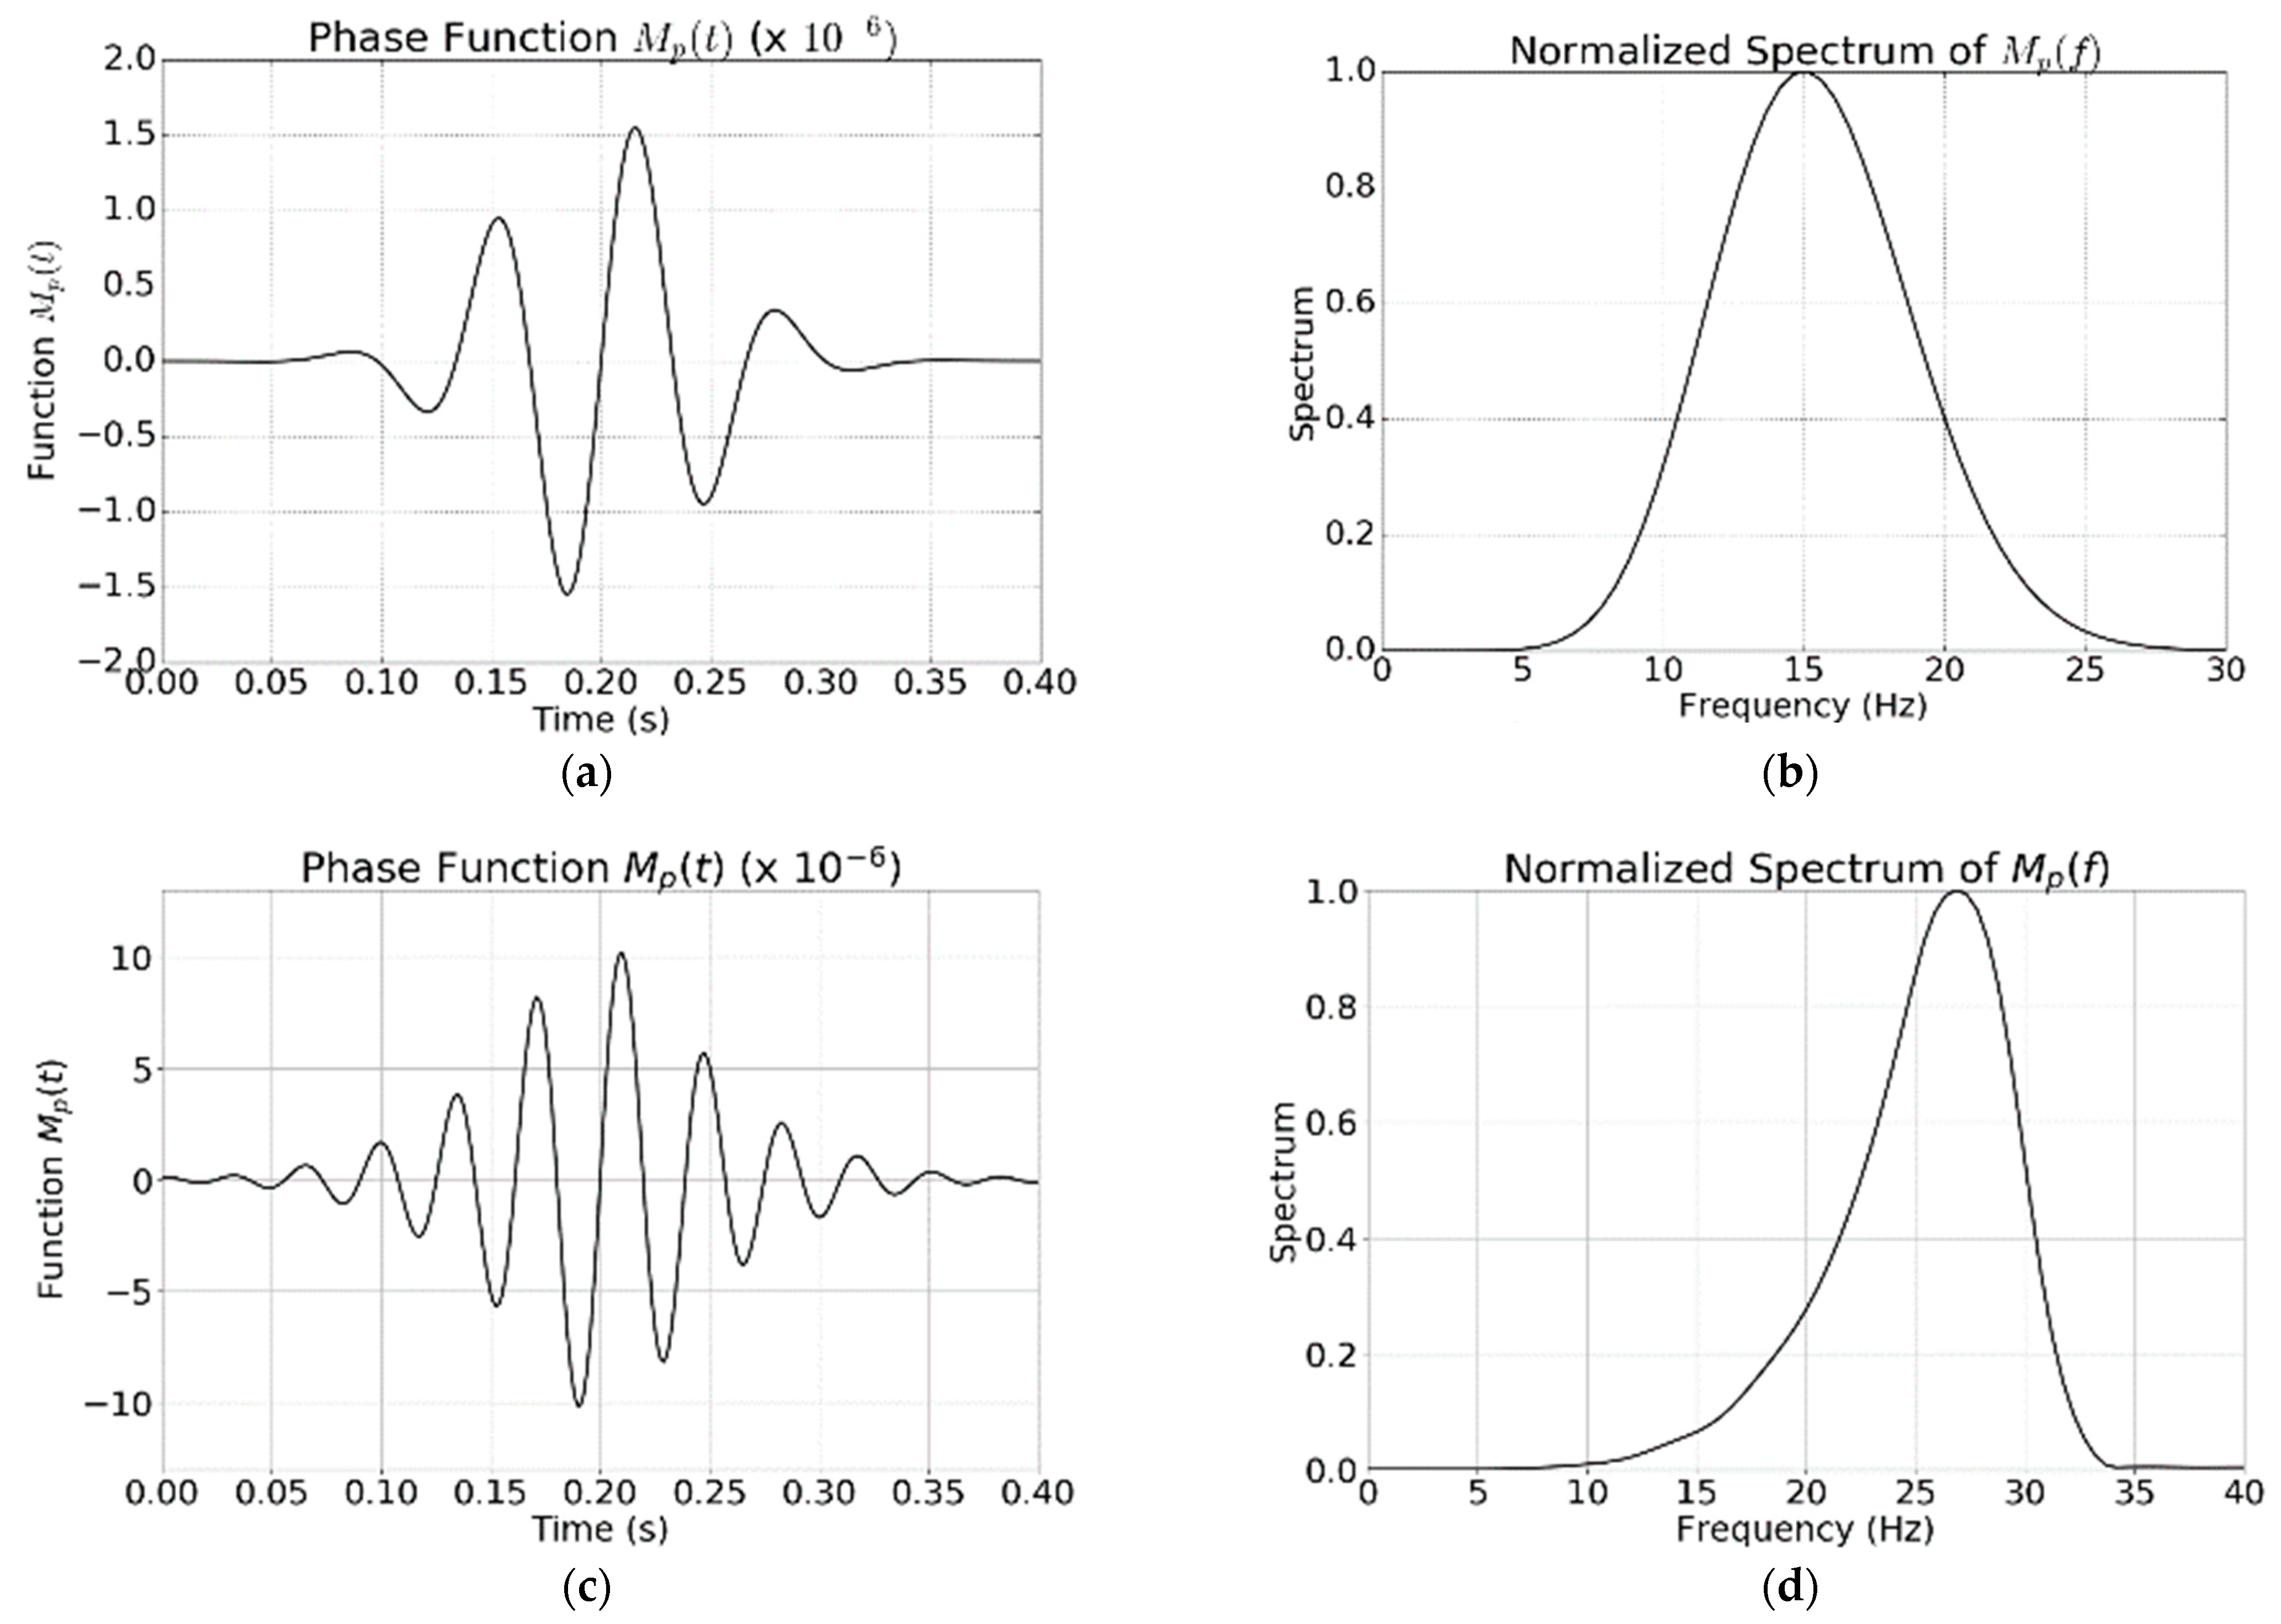
Figure 6 shows examples of
in the time-domain and their spectra. The source wavelet in
Figure 6a,b is the Ricker wavelet with a dominant frequency of 10 Hz. The source wavelet
Figure 6c,d is the bandpass waveletwith the frequency band of [
1,
2,
25,
30] Hz. For the entire function to be visible,
is shifted by 0.2 s to the right. Since the traveltime perturbation such as
is always positive, only the right half of
is used.
The waveform and spectrum of
are determined by the source wavelet. Although the effective bandwidth of the spectrum of the source wavelet in
Figure 6b,d are the same, the contents of the spectrum are quite different.
Figure 6d contain more low and high-frequency components than
Figure 6c.
From Equations (18)–(21), we also can see that the sensitivity kernel for density comes from both P-wave and S-wave through the adjoint force at the receiver. A contribution from S-wave to the density kernels is proportional to
. In homogenous media,
. For typical isotropic elastic media, suppose
, we have
. Therefore, the argument in
is much larger than the traveltime perturbation
which is the traveltime residual for the P-wave. Since
has finite and short support around time zero,
deceases rapidly and the S-wave contribution to the density kernel is small. The S-wave contribution to the density kernel is only significant when the image point is close to the receiver location, that is, when
is small. This can be seen from the kernels shown in
Figure 3. This is a very desirable property when we use the traveltime picks of OBN data to invert the sediment properties below the water bottom. In OBN data, the sources are explosive forces, and the data collected are usually 3- or 4-component data. Once we have reliable picks of traveltime, we can ignore the S-wave contribution to the density kernel. Although, this omittance may lead to less accurate and slightly lower-resolution density inversion, it leads to a more robust procedure [
14,
21].
The directional dependency of the kernels is more complicated and determined by the three dot products,
,
, and
. See
Figure 4. We shall not go into much detail about the dependency of the kernels on the propagation directions and relative position of the source, receiver, and image location. We only give the main points below. First, given a fixed source-receiver pair with a predefined source mechanism, the only impacting factor is the component used for traveltime picking which defines
. Second, both the
x and
z components lead to phase-consistent kernels. In other words, if both the
x and
z components can be used for event picking, they should be able to provide more reliable results than using just one component. Third, for surface or OBN data, the
x component is more dominant than the
z component for the shallow velocity gradient. Lastly, the P-wave modulus kernels also have contributions from the S-wave velocity, which indicates that the traveltime of the P-wave can also be used for the inversion of S-wave velocity.
6. Formulations and Decomposition of Traveltime Sensitivity Kernels in Transversely Isotropic Elastic Media
In this section, we will derive the sensitivity kernels for VTI elastic media. These traveltime kernels, in contrast with those for isotropic elastic media, contain information of both velocity and anisotropic parameters. Therefore, the traveltime misfits can be used to invert for both the velocity and anisotropy.
The wave propagation in Transversely Isotropic (TI) media can be parameterized using density and the following five (Thomsen’s) parameters [
27],
where
and
are the P-wave and S-wave velocities in the symmetry axis direction, respectively.
,
, and
are the Thomsen’s parameters. For most major types of rocks in oil and gas exploration, Thomsen’s parameters are usually small (weak anisotropy), leading to the development of a suite of seismic data processing techniques in weakly anisotropic media [
29].
Following a similar procedure as that used for the isotropic elastic case in the previous section, for VTI elastic media, the perturbation of traveltime can be represented as (here we ignore SH waves by setting
):
For weak anisotropy and P-SV waves only (
,
and
), the kernels in Equation (30) are expressed as (density kernel is given in Equation (6)):
The sensitivity kernels are scaled by the corresponding media property, for example,
. For the details of the derivations of Equations (31)–(34), see
Appendix C. In anisotropic media represented by Thomsen parameters, since these parameters are defined around zero values, we prefer using inversion kernels to sensitivity kernels.
In Equations (31)–(34),
is the bulk modulus and
is the shear modulus defined by density and the velocities in the symmetry axis direction. The impact of the anisotropy on the inversion is by
, where
and
are given by,
and,
where
,
, and
are the strain components in the
,
, and
directions, respectively. When
, the anisotropic parameters have no impact on the traveltime as it can be seen from Equation (30).
The formulations of the sensitivity kernels in Equations (31)–(34) have clear geophysical meanings and are consistent with our practical experiences. The impact of
is mainly contained in the horizontal traveling waves. This is consistent with what has been found in pseudo-acoustic VTI media [
45]. The impact of
is contained in both horizontal and vertical waves. The impacts from both
and
are small compared with those from the P- and S-wave moduli.
Instead of using the original set of anisotropic parameters,
, we can use
as a better choice. Their sensitivity kernels are given by,
One advantage of using over is that all the kernels in Equations (38)–(40) have roughly the same magnitude for visualization purposes.
Below we will compare the various kernels in isotropic and VTI elastic media.
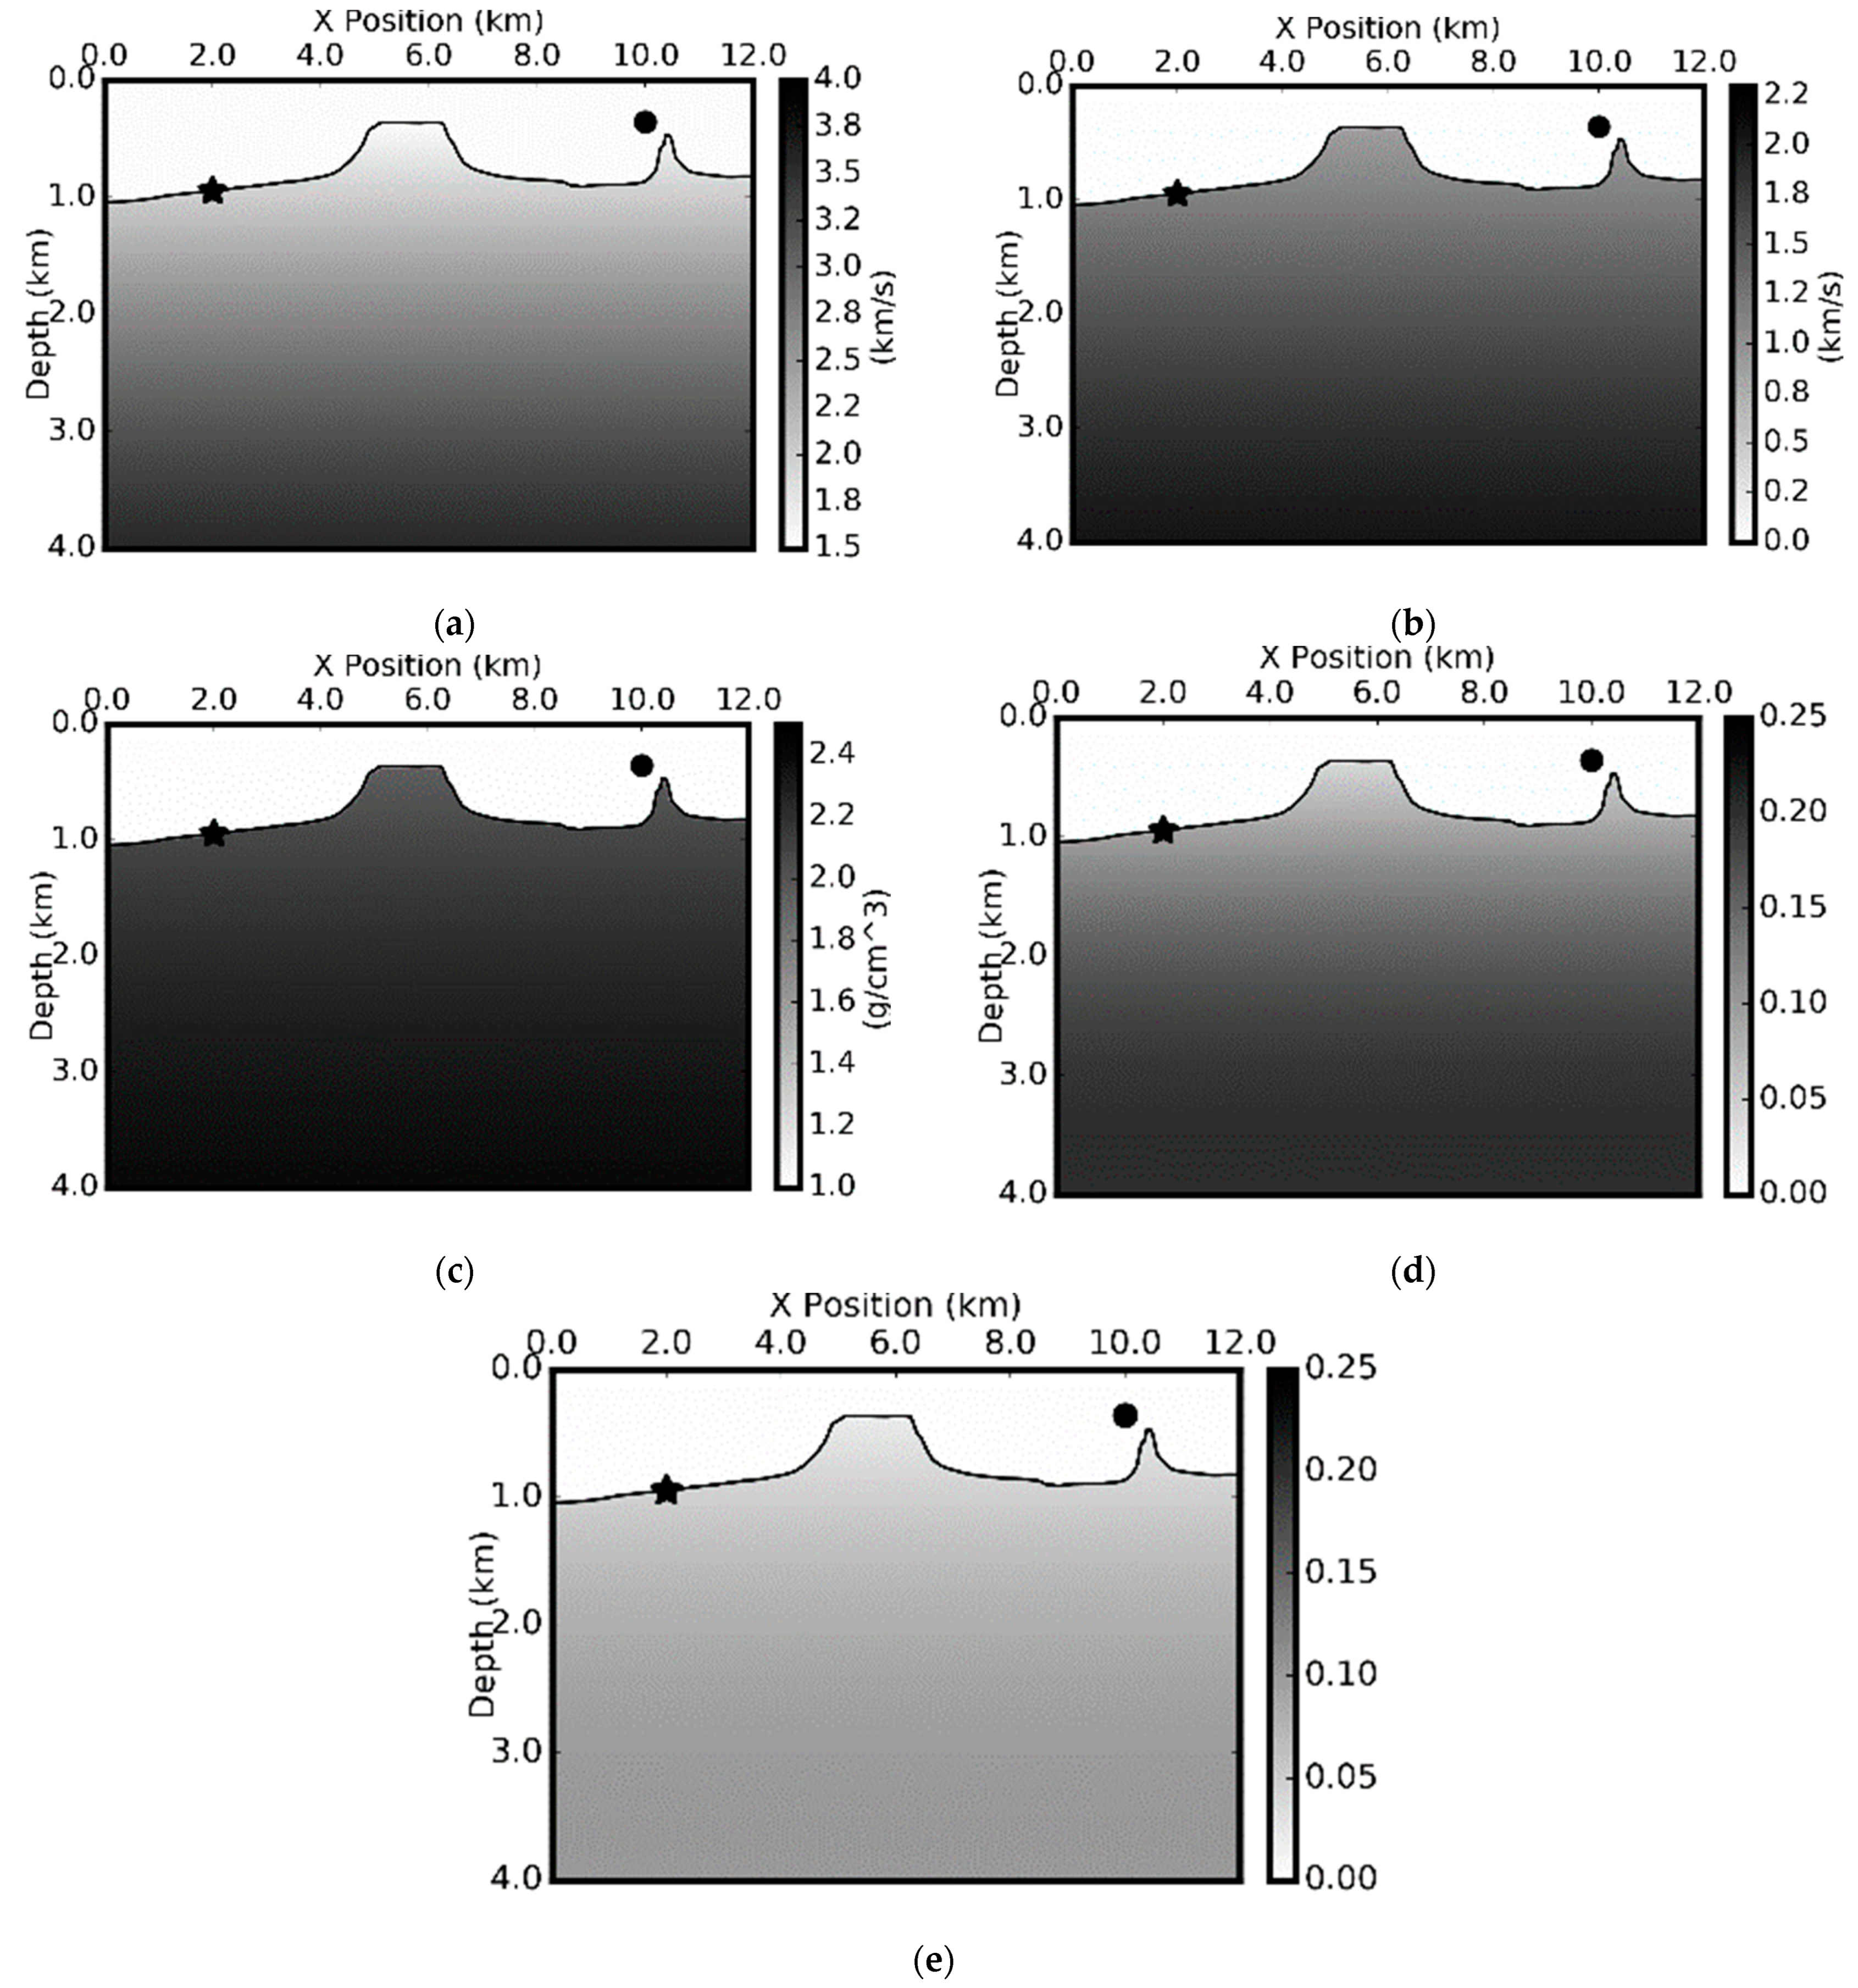
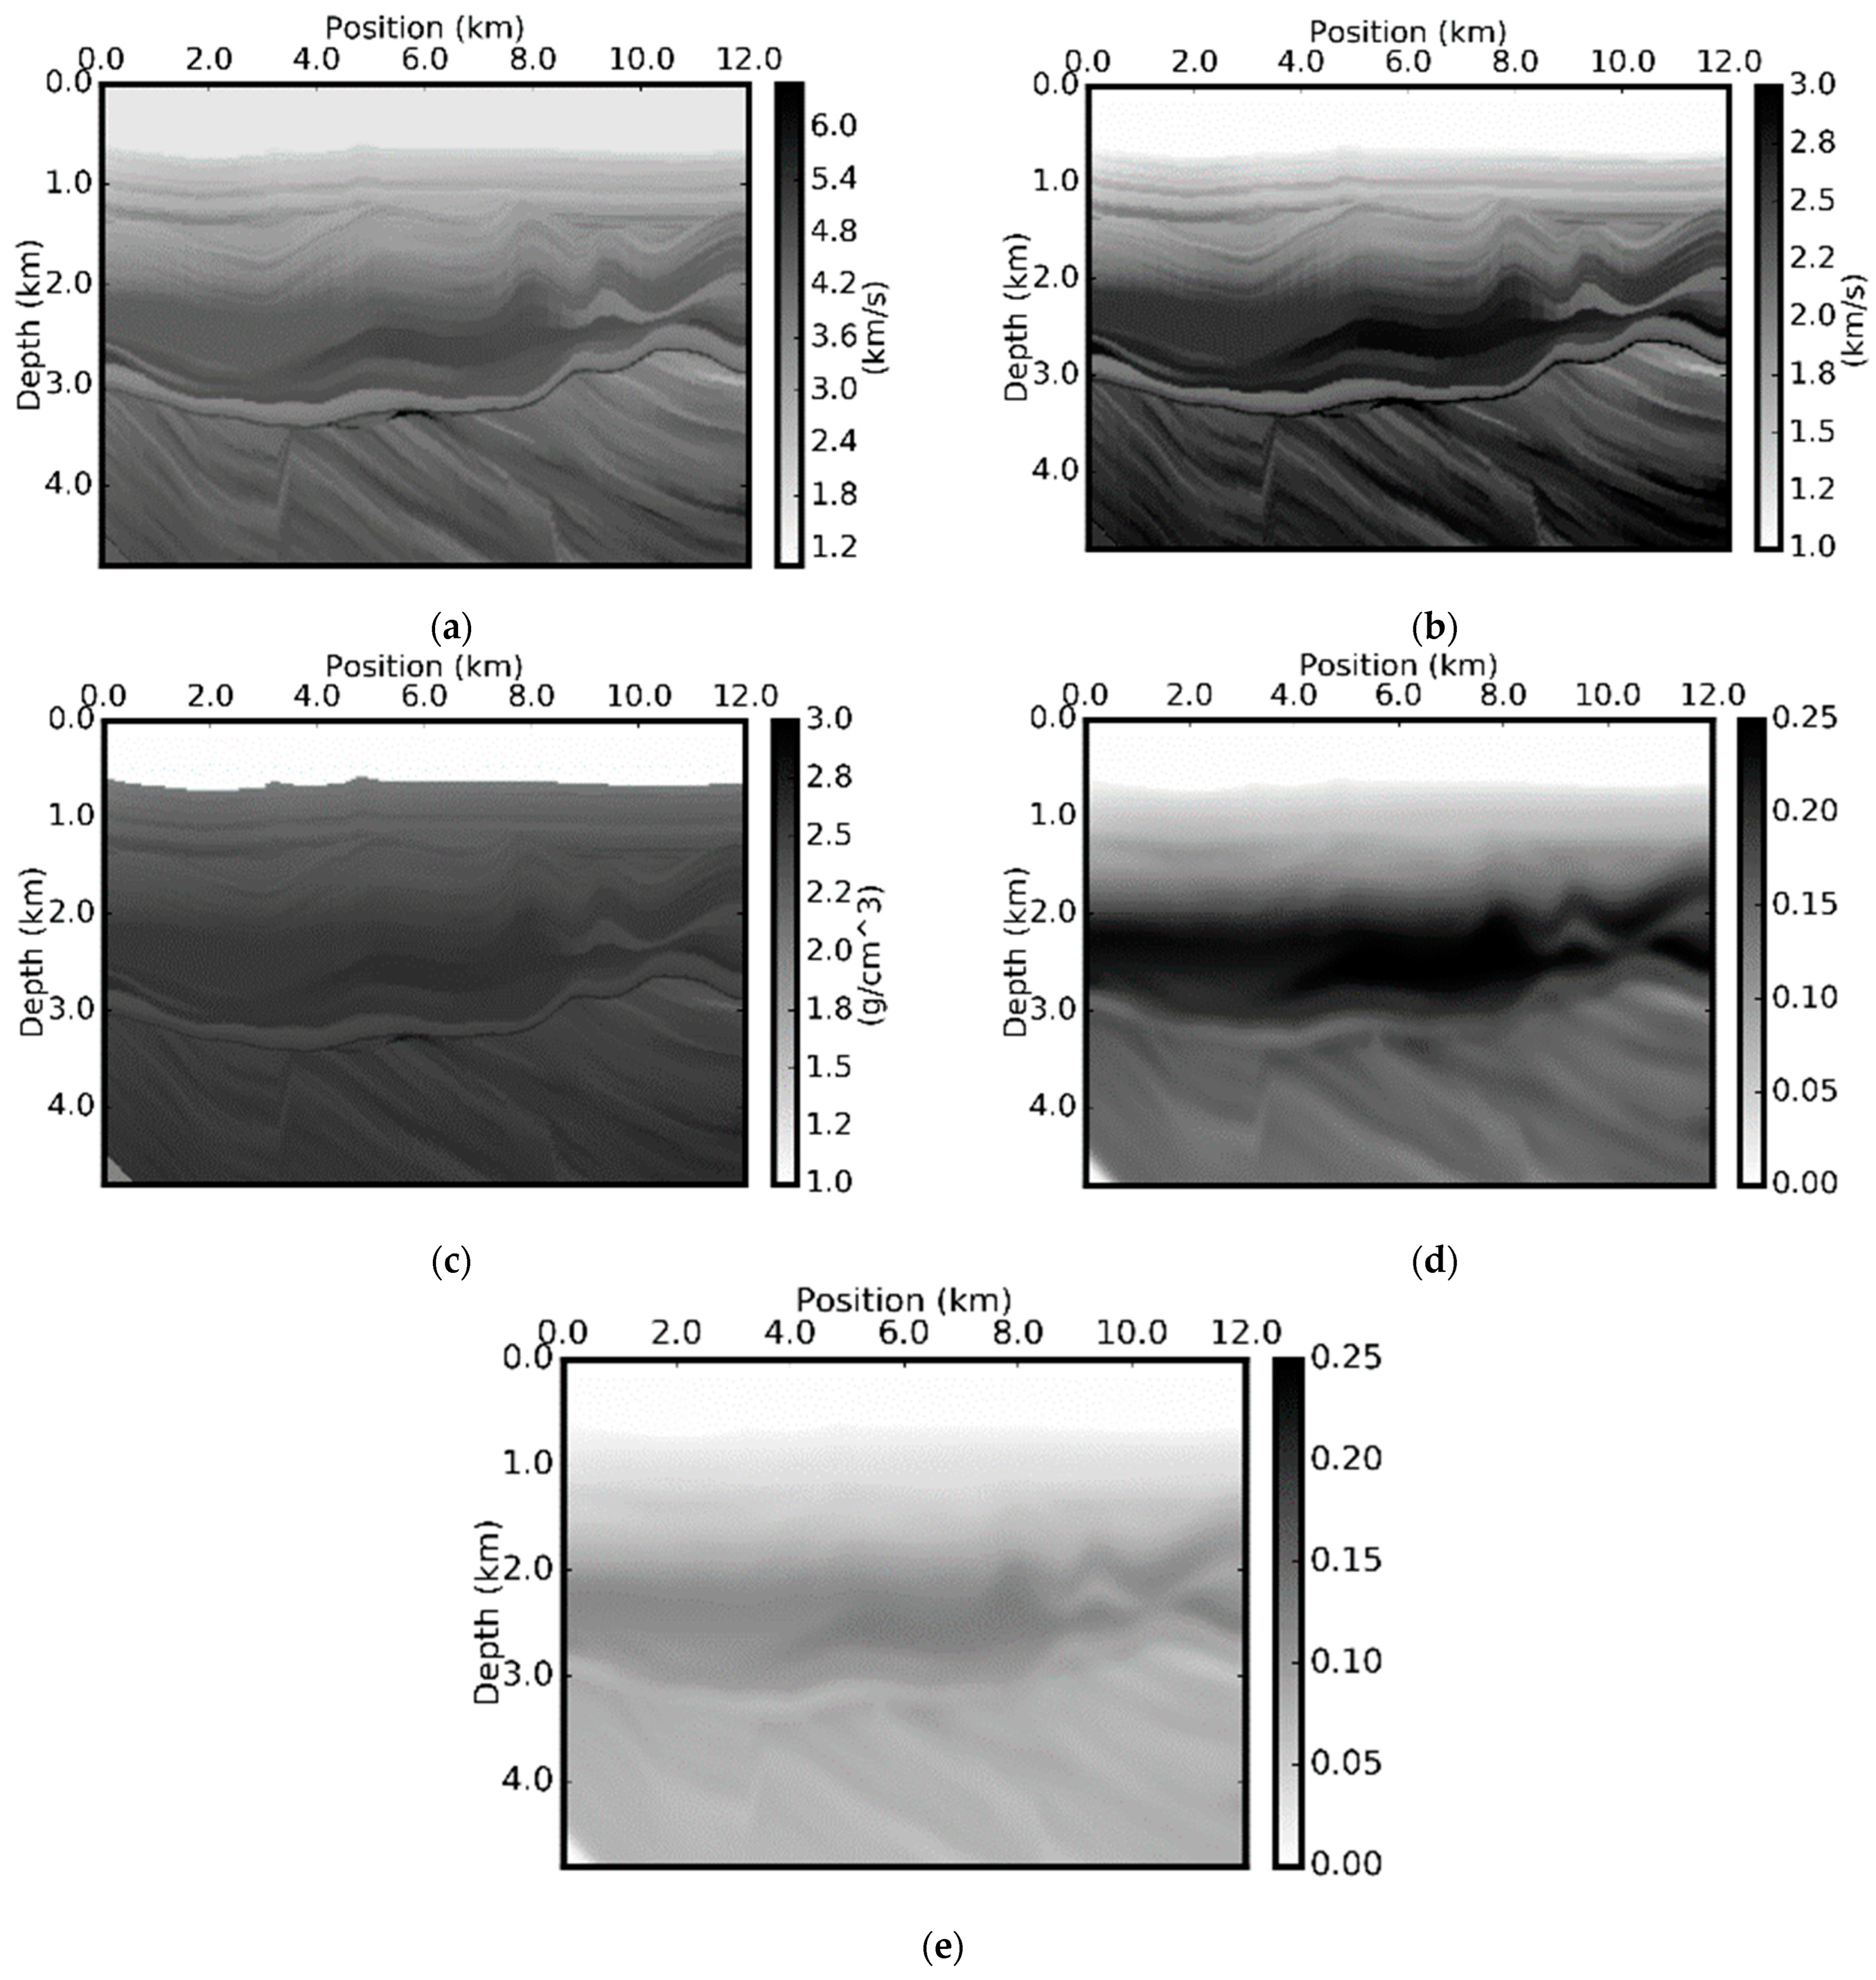
Figure 8 shows the model slices of a deep-water environment with model properties varying with depth only.
Figure 8a–e give P-wave velocity, S-wave velocity, density, Thomsen’s ε model, and Thomsen’s δ model, respectively. The star represents the source location, and the circle represents the receiver location. This shows an inverse OBN acquisition.
Figure 9 and
Figure 10 show the sensitivity kernels for isotropic elastic and VTI elastic media, respectively.
Figure 11 compares the depth profiles of the kernels in isotropic and VTI elastic media. The corresponding kernels are very similar in isotropic and VTI media. The kernels in VTI media are slightly shallower due to the higher velocity in anisotropic media.
Figure 11 also shows that anisotropy has a larger impact on the S-wave than on P-wave [
29].
Figure 12 shows the elements
,
, and
. These three terms contain all the contributions from anisotropy. The amplitude of
is less than that of the
at the source and the receiver. This confirms that
is mainly in the horizontal component of the waves and
is contained in components traveling in all directions. The combinations of
and
is shown in
Figure 12c. This combined term contributes to the P-wave and S-wave modulus in the presence of the anisotropy. This term is zero in the water since the water layer is isotropic.
8. Event Extraction and Workflow
As mentioned previously, the computation of kernels does not involve real data. Therefore, we can do any pre-processing for the forward wavefield before it is used for backward extrapolation. The final objective is to extract the desired event from the complete elastic wavefield.
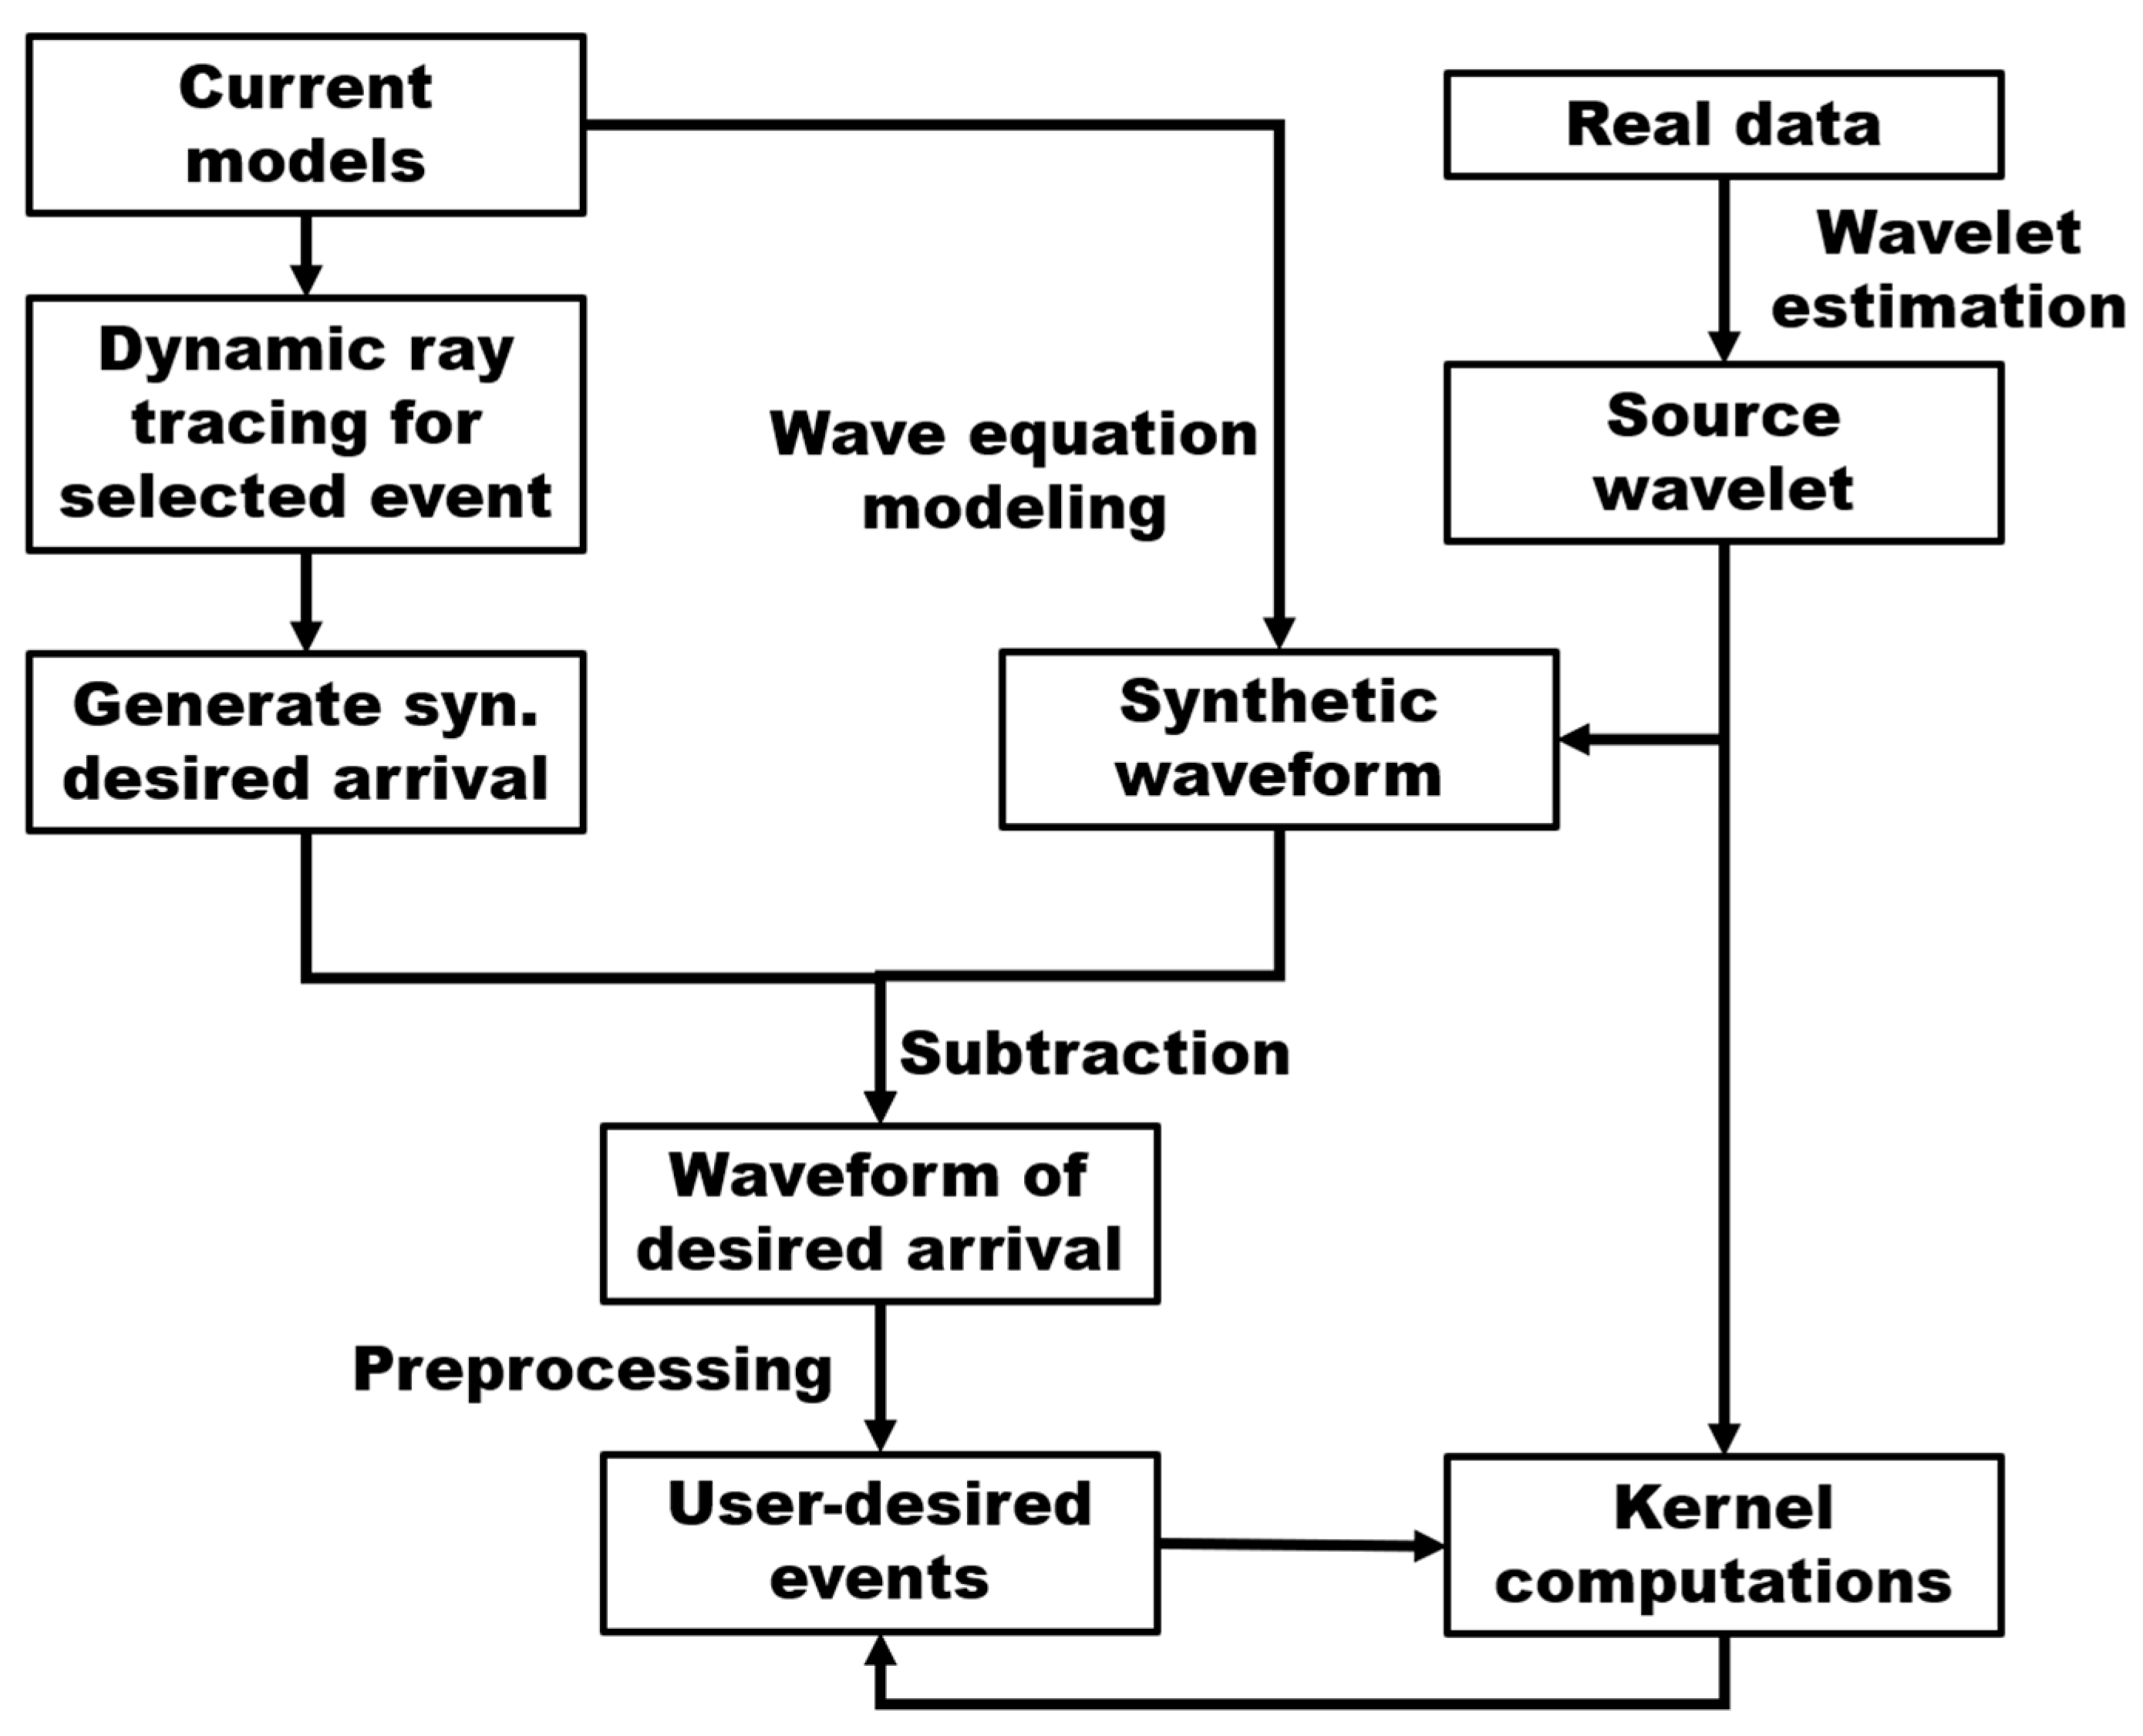
We propose a workflow (
Figure 13) extended from acoustic cases [
20,
21] for this purpose. In this workflow, we first compute the complete wavefield using finite differences. The wavefield from finite difference modeling contains both P- and S-waves and all types of wave modes including transmitted, reflected, and head waves. This wavefield must be separated into each fundamental type of wave modes (see, e.g., [
46,
47]). Due to the flexibility of ray theory for identifying wave types, we can use ray tracing to select the particular event to be used. Only traveltime is needed. After the traveltime of that event is selected, synthetic data (model) can be generated by convolving the traveltime with a source wavelet estimated from real data. We then extract the event from the finite-difference wavefield by subtraction. This workflow works well for first arrival of P-waves and S-waves, head waves, and transmitted waves. It also works for converted waves by using dual velocity during ray tracing.
One benefit of this workflow is that it separates the computations of kernels from the complexity of traveltime picking. Traveltime picking is an important topic that has been extensively studied. Therefore, the computation of kernels is simply a synthetic numerical procedure. In principle, we can compute the sensitivity kernel for any events by identifying the corresponding wavefield through wavefield separation. Therefore, the critical step is to isolate the events to be used for backward extrapolation.
The step for kernel computation in
Figure 13 can output all the kernels as described in previous section. We can also output a particular kernel, as we usually do in production, such as the kernel for P-wave velocity or shear-wave velocity for the update of velocity models. For VTI model, it is preferable to use a cascaded strategy, which entails inverting the seismic velocities first before the inversion of anisotropic parameters. Once the kernels are computed, linear system such as Equation (13) can be formed. Equation (13) is usually large but sparse and can be solved using
Lp-norm inversion [
21].
For inversion for anisotropic media, in addition to the theoretical and numerical issues considered this paper, we also need to consider how to simplify the parameterizations of anisotropy. First, one type of data acquisition mainly contains certain information of parameters. For example, surface data with long offset contain both information of velocity and ε. VSP data contains more accurate low frequency information of velocity, ε, and δ. It is usually difficult to acquire δ from seismic data. Therefore, we assume a prefixed δ during inversion.
For media with fractures, one important cause of anisotropy, the parameterization of anisotropy depends on the type of effective media. If the background media is isotropic, VTI or TTI may be sufficient. If the background media is VTI or TTI, the effective media is orthorhombic, acquisitions in three different azimuths are required to full characterize the parameters.
Of all the parameters, the inversion of velocity is the most critical step. For inversion of lateral changes of velocity structures using traveltime, dense acquisitions are required to capture the large gradient of velocity due to the high-resolution of the kernels at the locations close to the source and receivers [
19,
21]. Due to the limitation of the information contained in traveltime, inversion from traveltime usually suffers from low resolution. After major structures have been inverted, subsequent steps need to incorporate the phase and amplitude information in the data. We will come back to this point in the Discussion section.
For readers who are interested in the workflow of field data processing, please refer to [
29,
30,
48,
49].
9. Examples of Sensitivity Kernels for OBN and VSP Acquisitions in a Deep-Water Geological Environment
In this section, we will give examples of the sensitivity kernels in a deep-water salt environment for both OBN and VSP acquisition geometries.
OBN data have found many important applications in model building and imaging in deep-water exploration [
48,
49] and have shown superiority over the marine surface data due to their ultralong offsets, abundant low-frequency components, and high signal noise ratio. In addition, OBN data contain elastic properties in the data since multi-components of the particle displacements are also acquired. We will give some examples of the traveltime sensitivity kernels of OBN acquisition geometry.
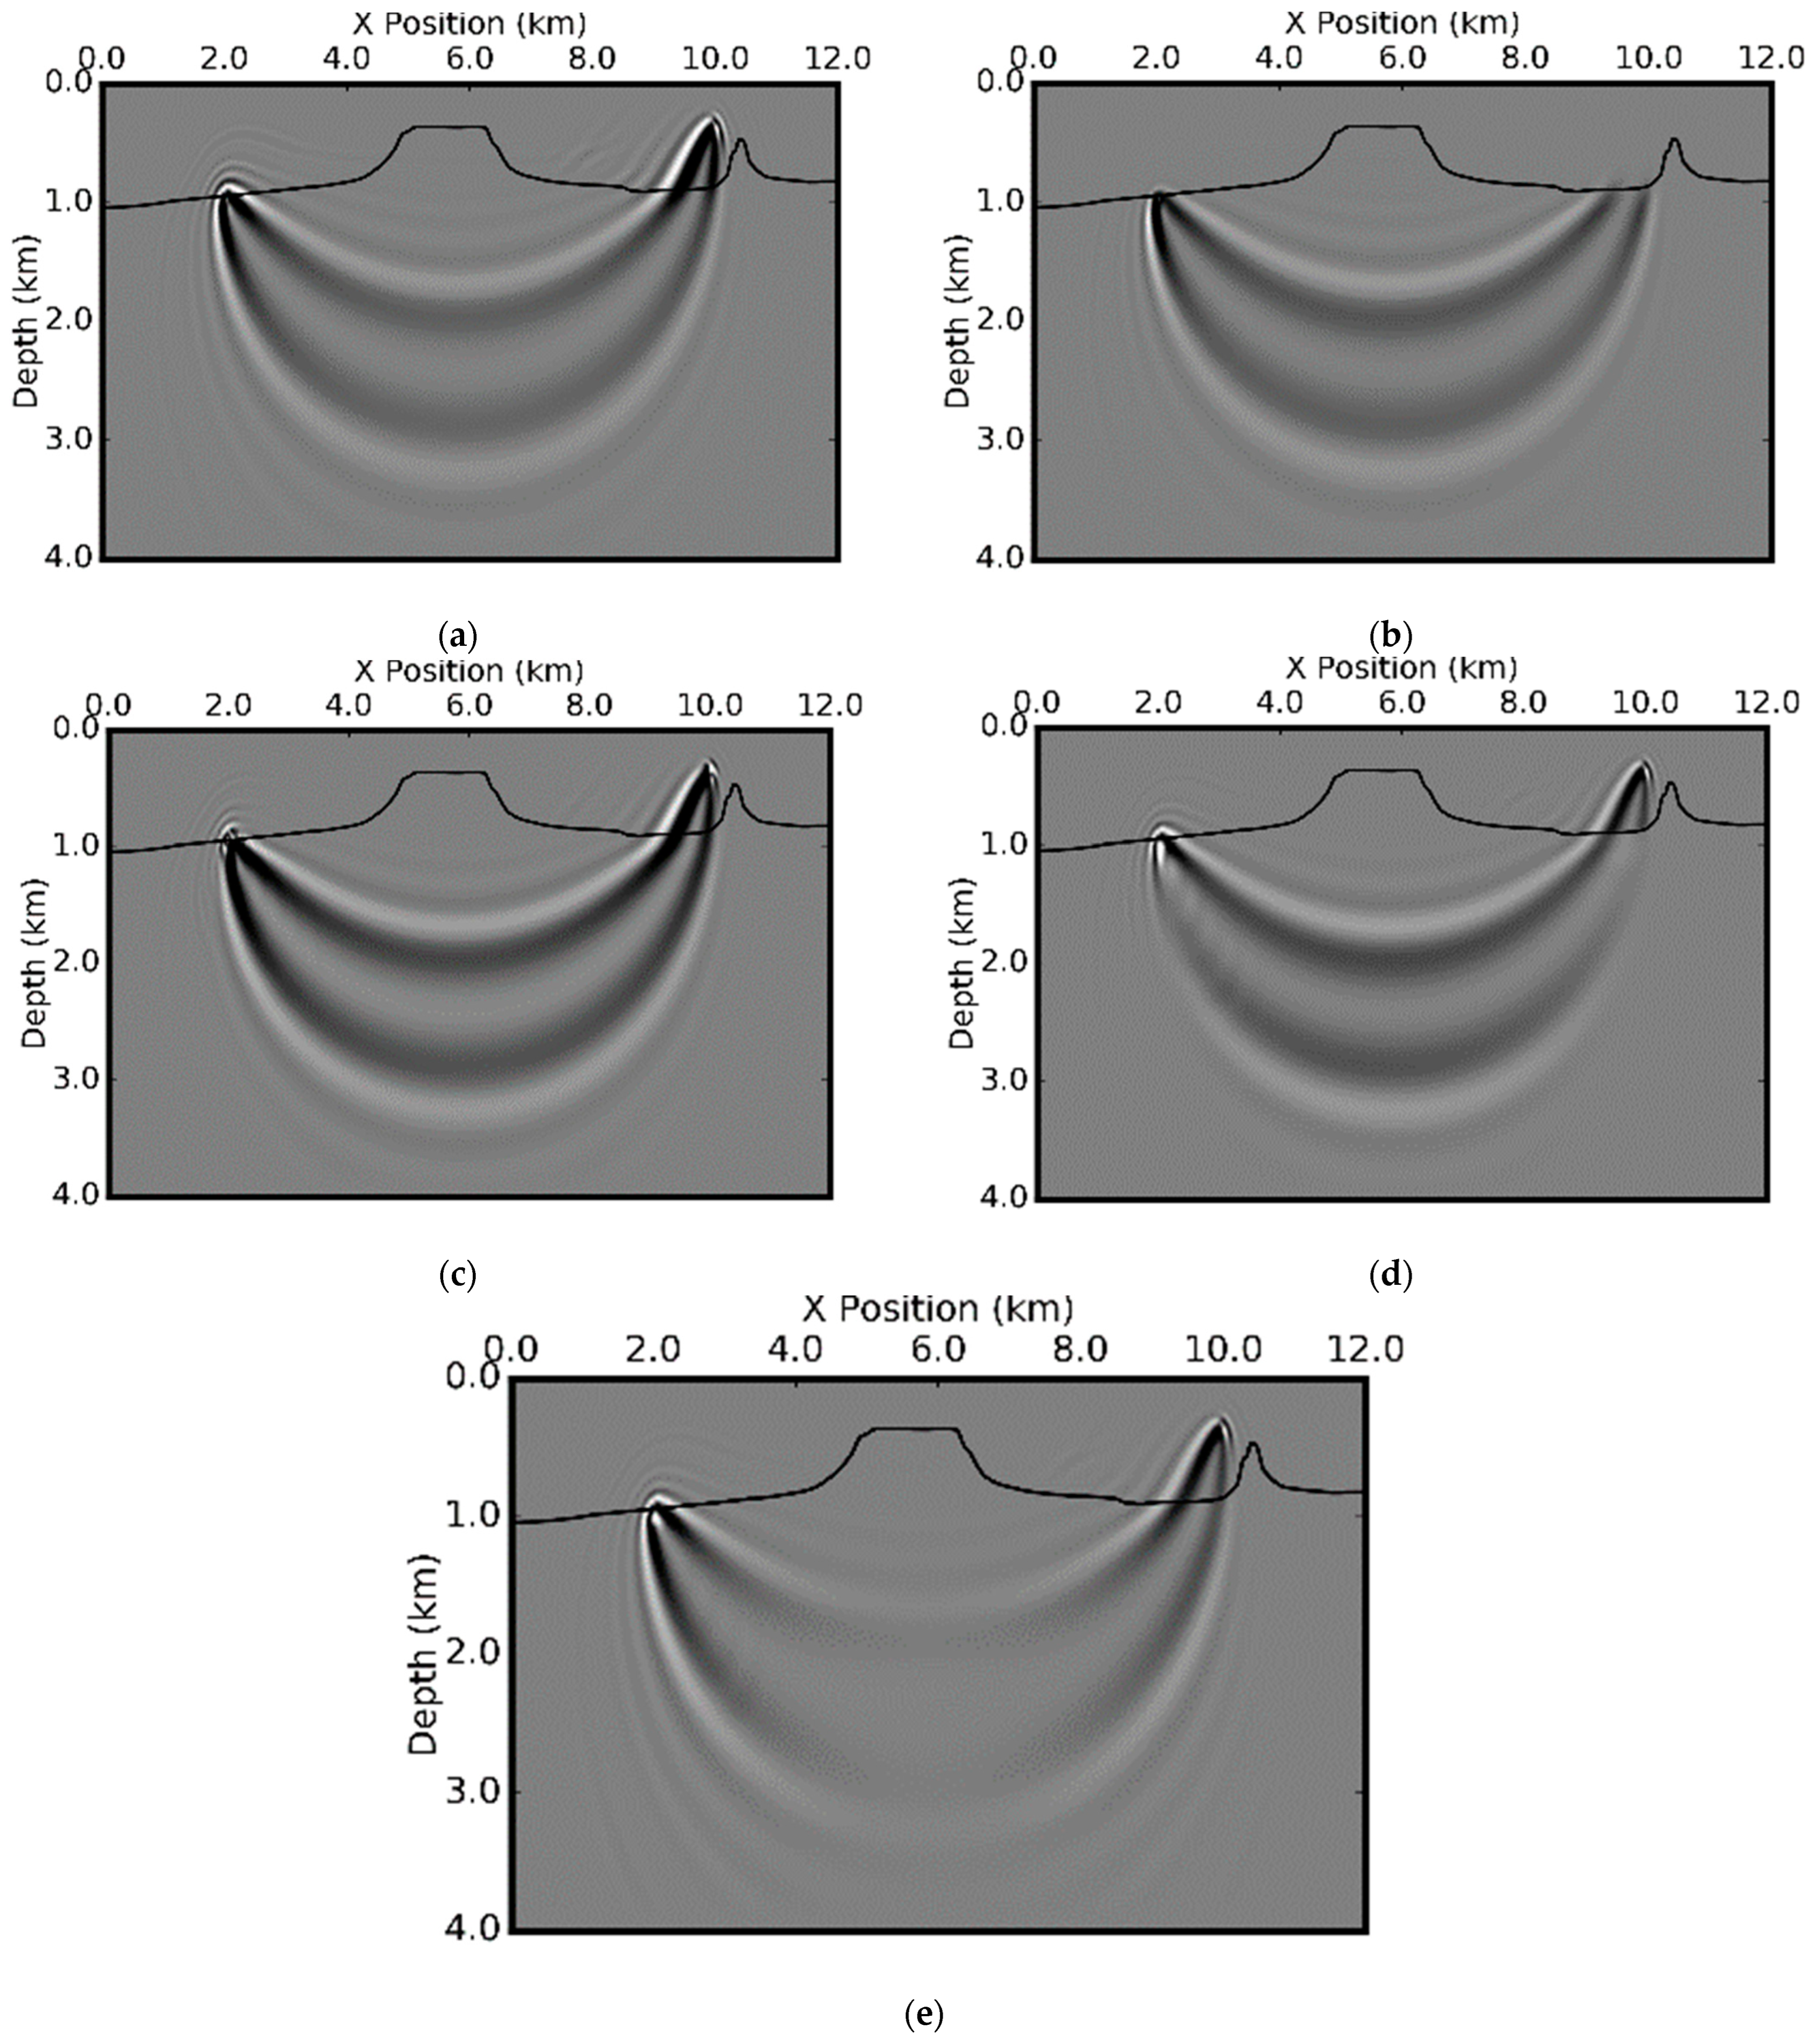
Figure 14 shows the P-wave velocity, S-wave velocity, density, Thomsen’s ε model, and Thomsen’s δ model for a deep-water salt environment. The sediments above the high velocity zone have strong anisotropy (maximum value of ε is about 23%). The source is chosen at 2 km on the water surface and the receiver location at the water bottom with a horizontal location of 10 km. This gives an offset of 8 km. For this offset, the traveltime sensitivity kernel just crosses the high-velocity layer.
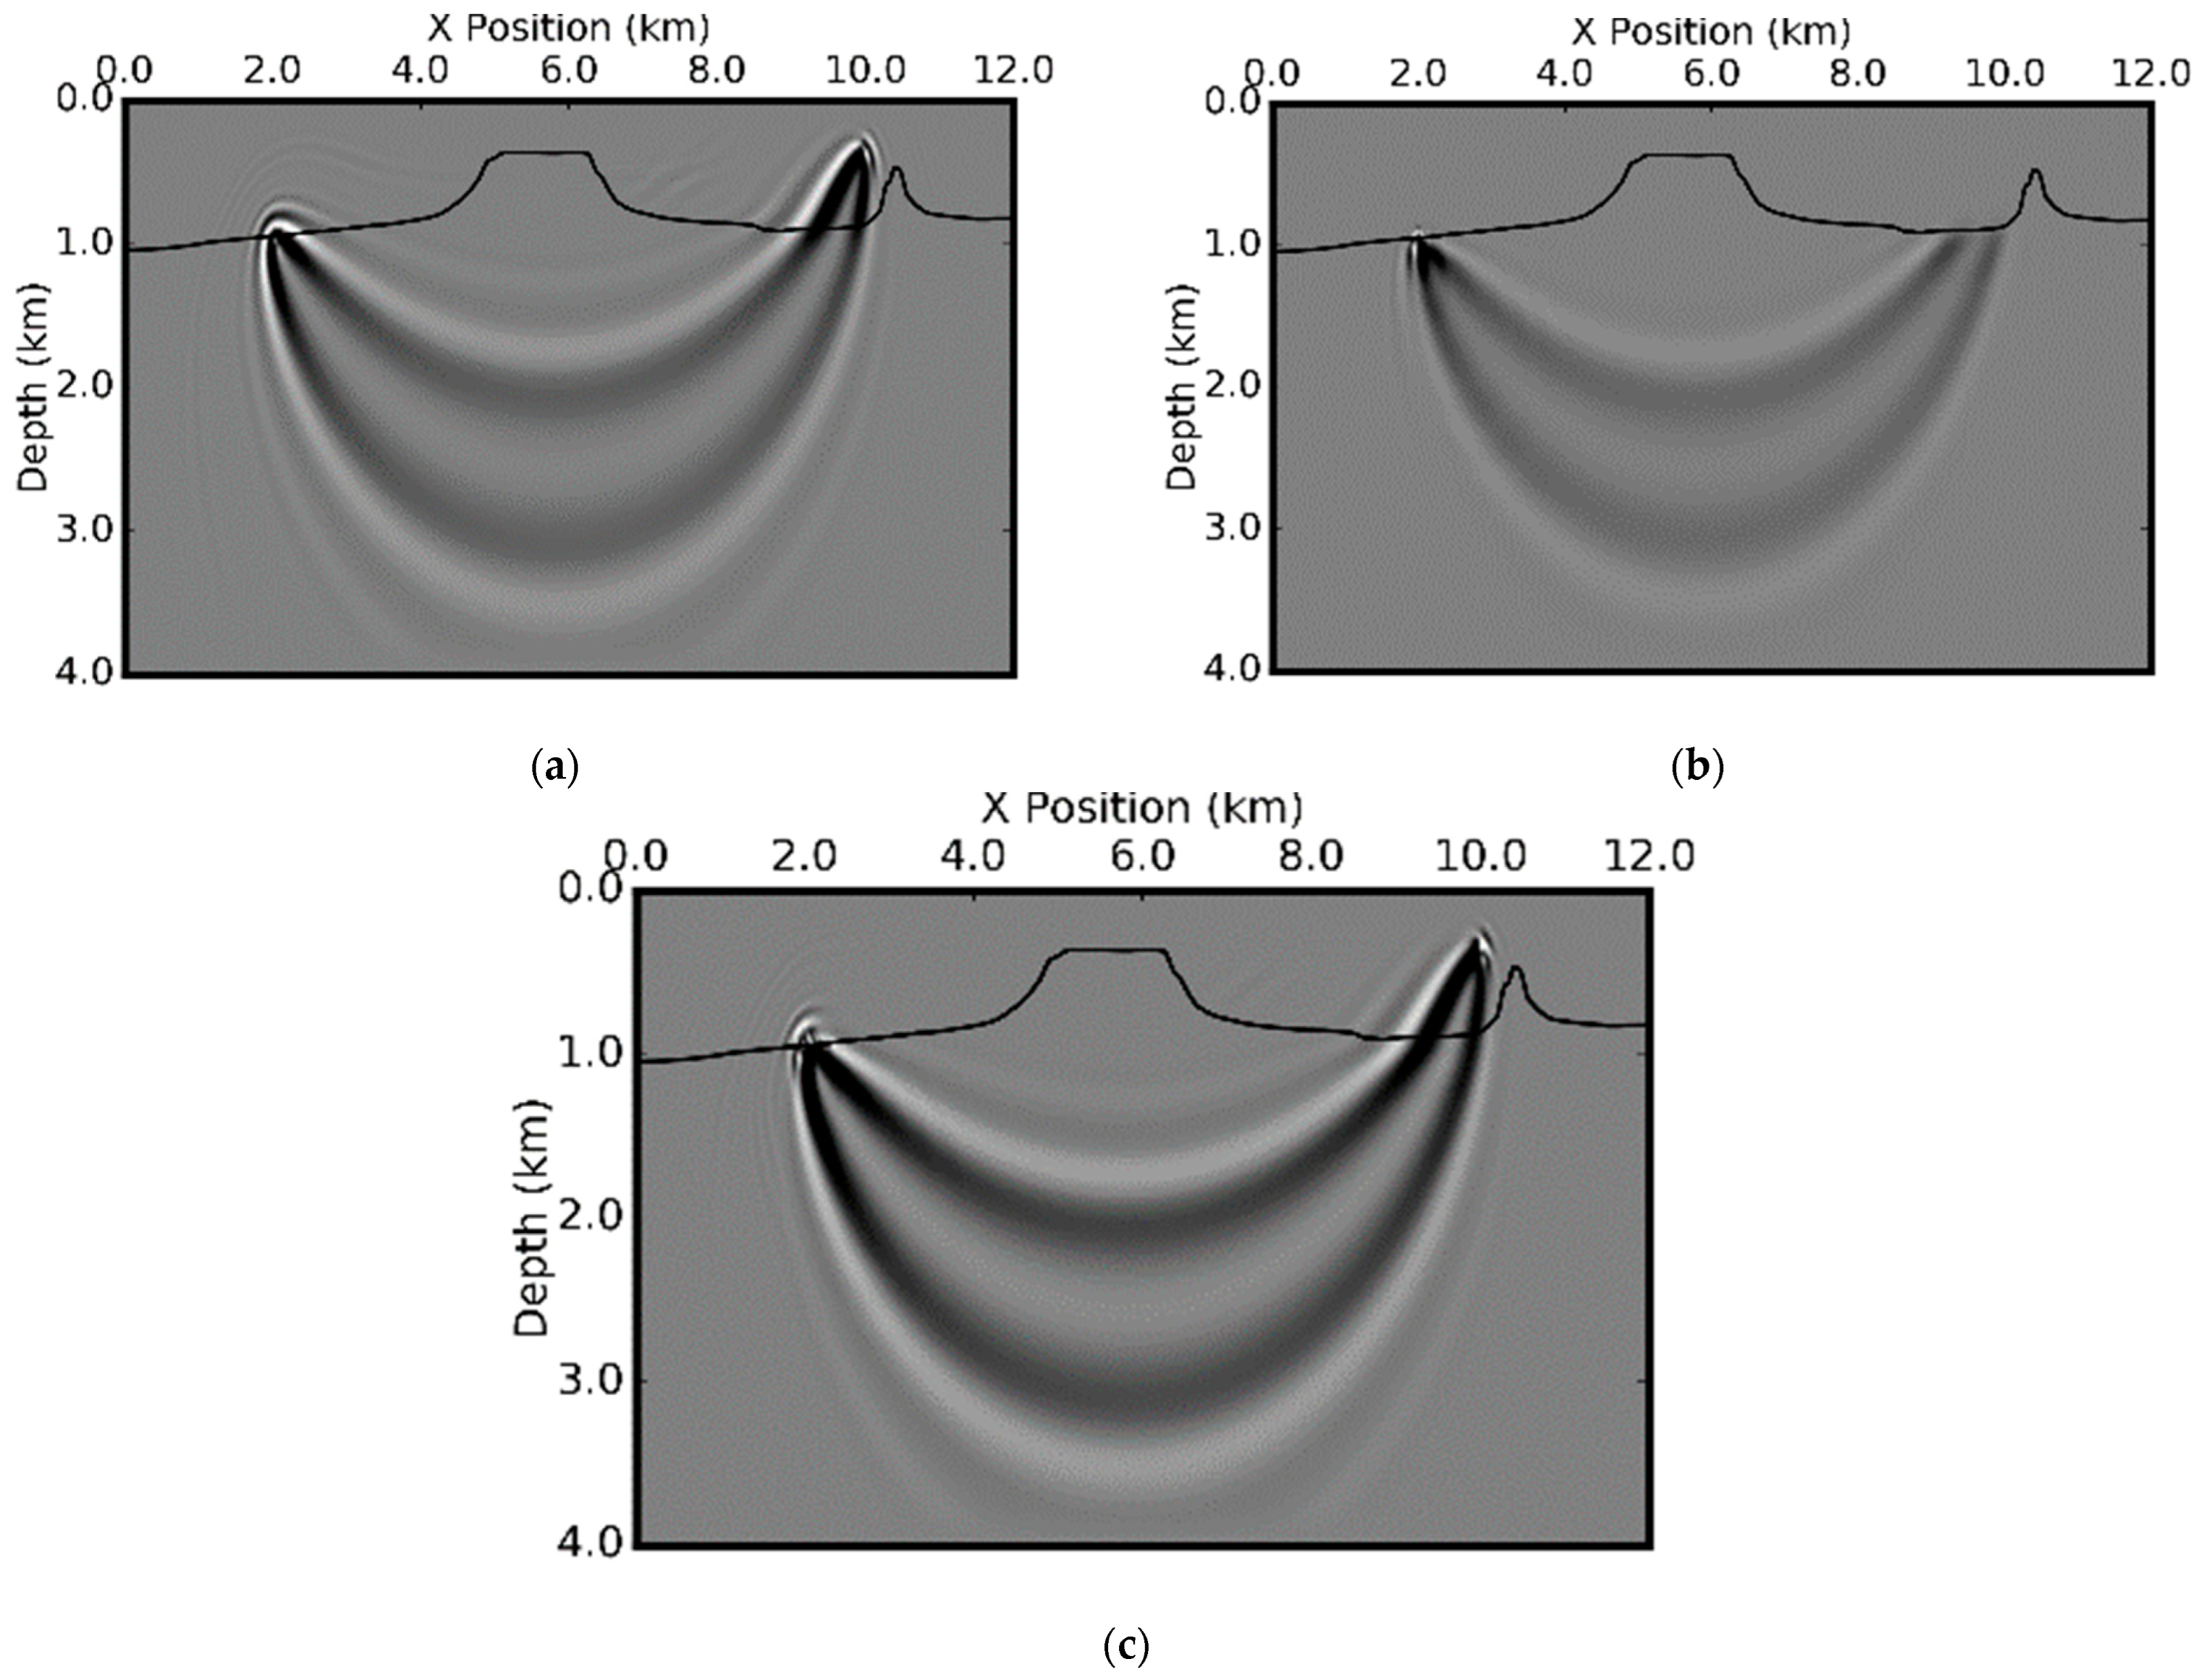
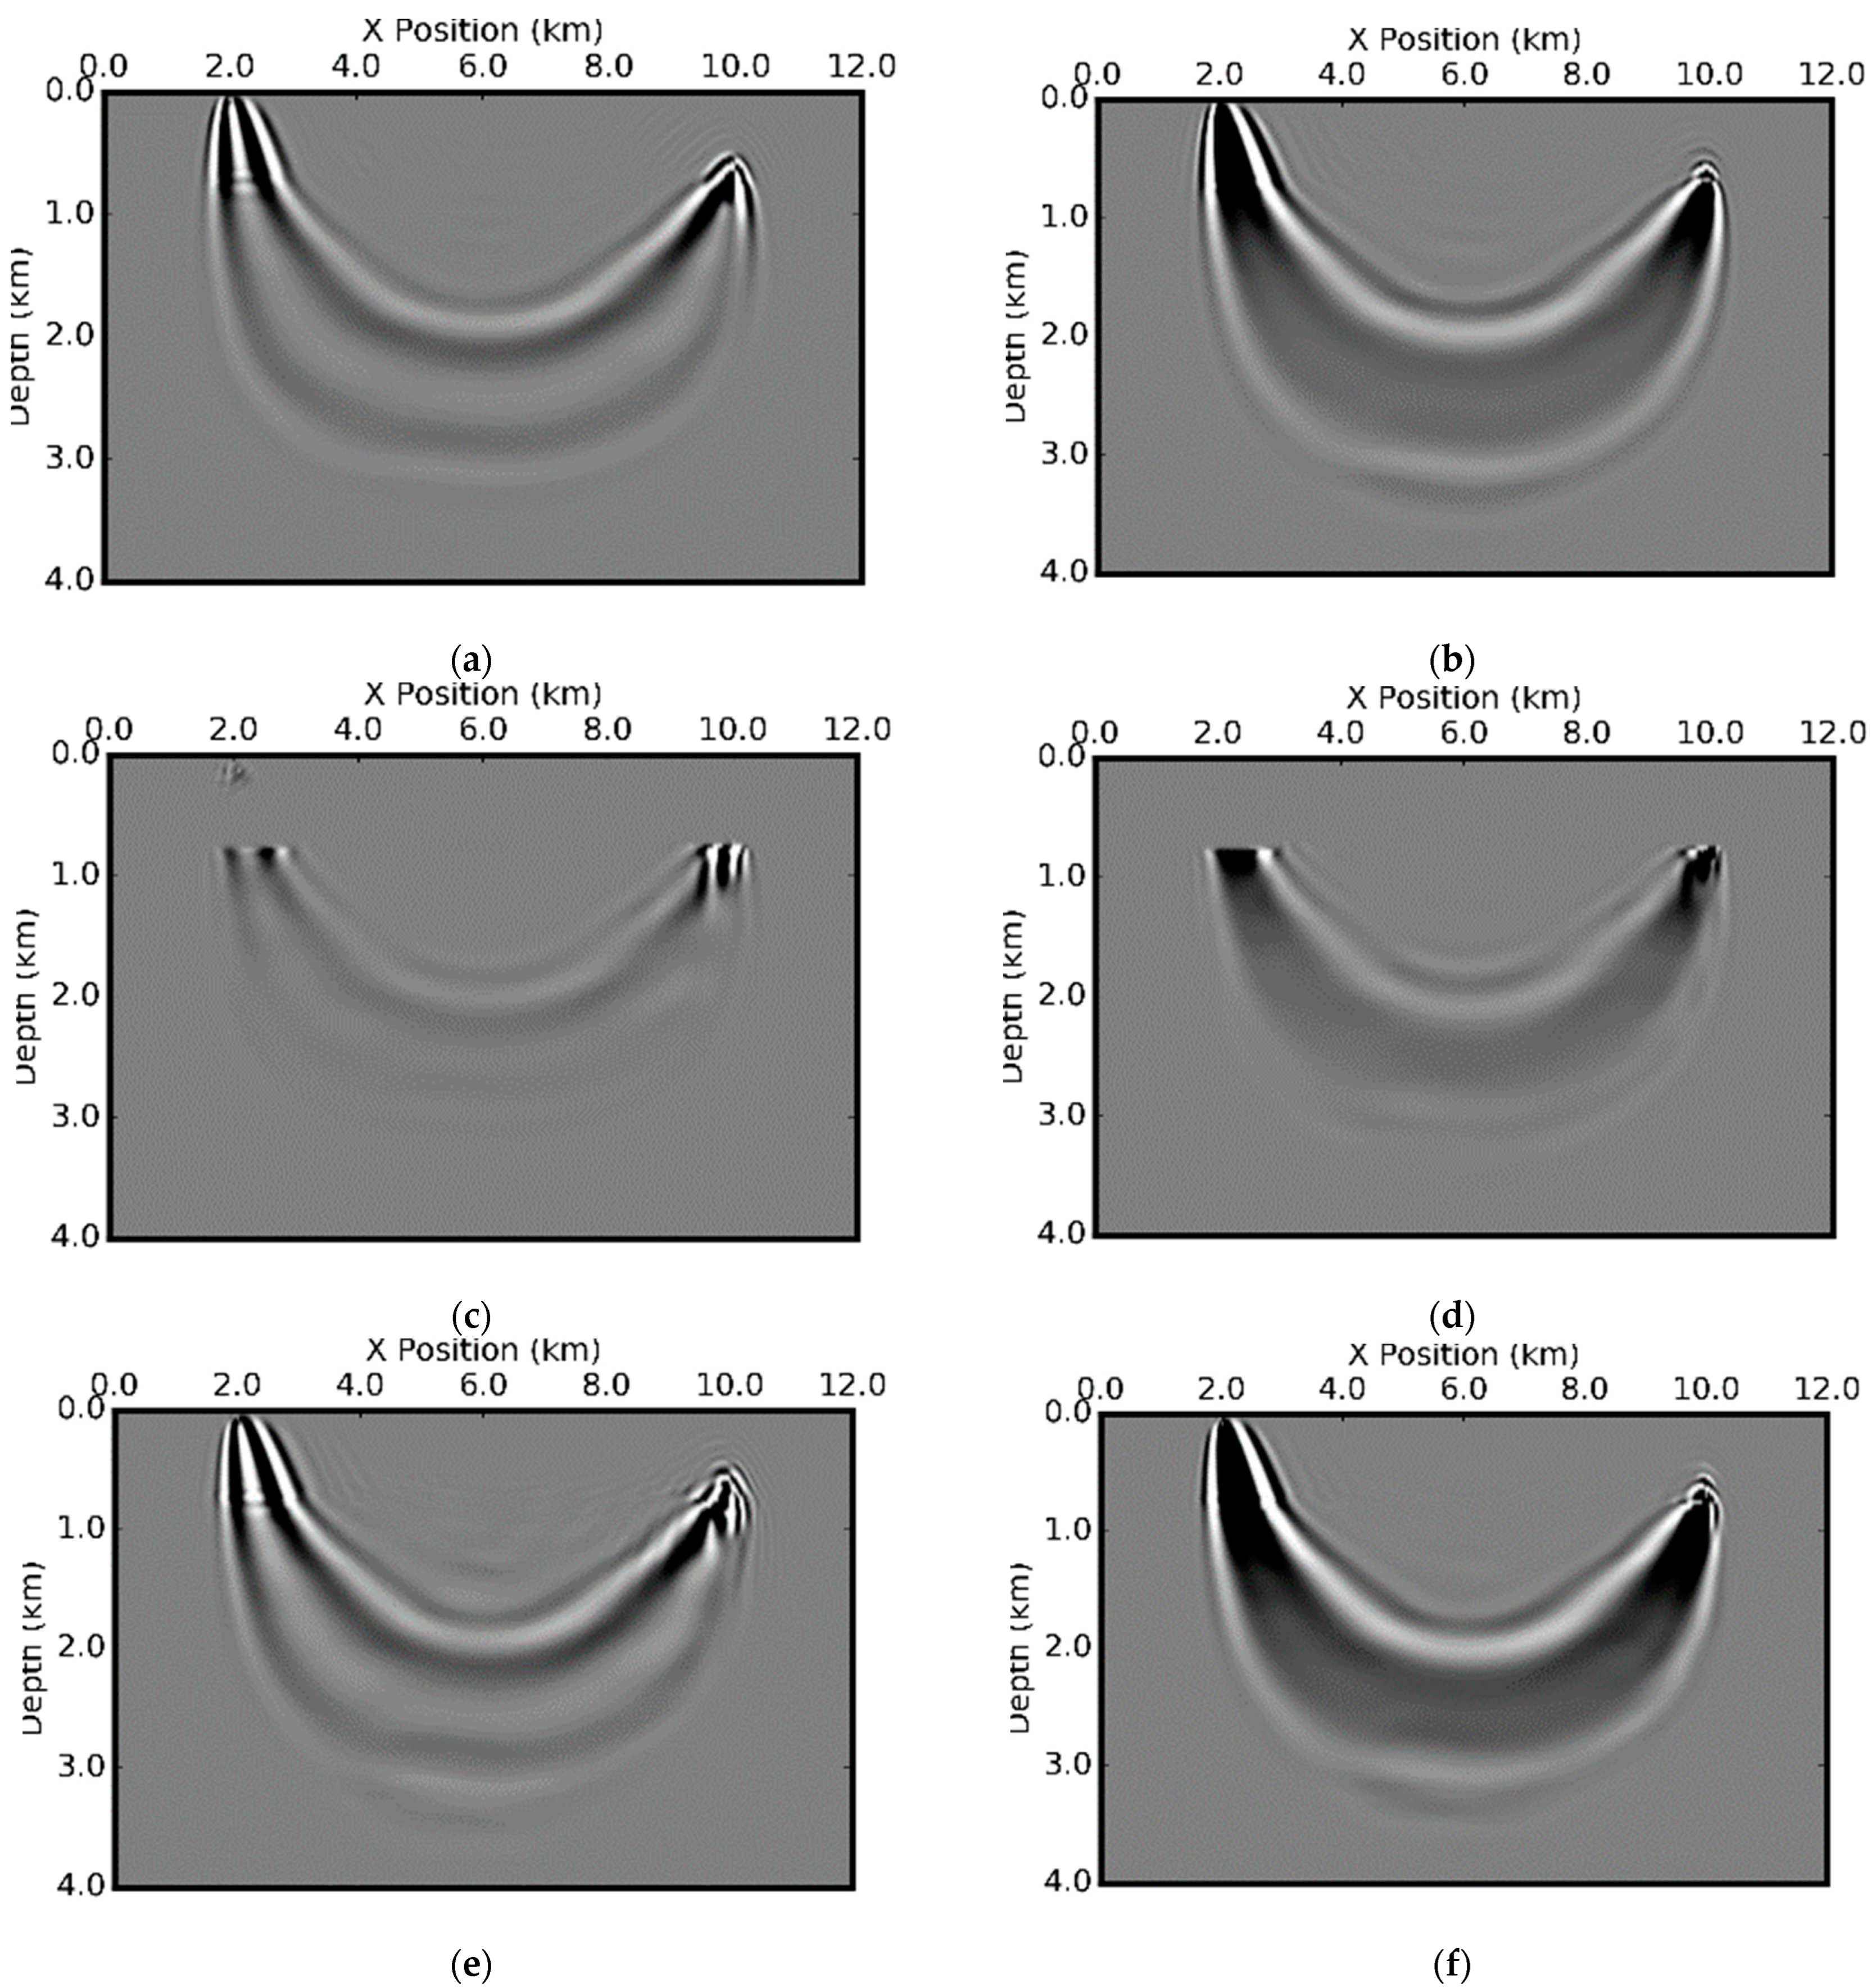
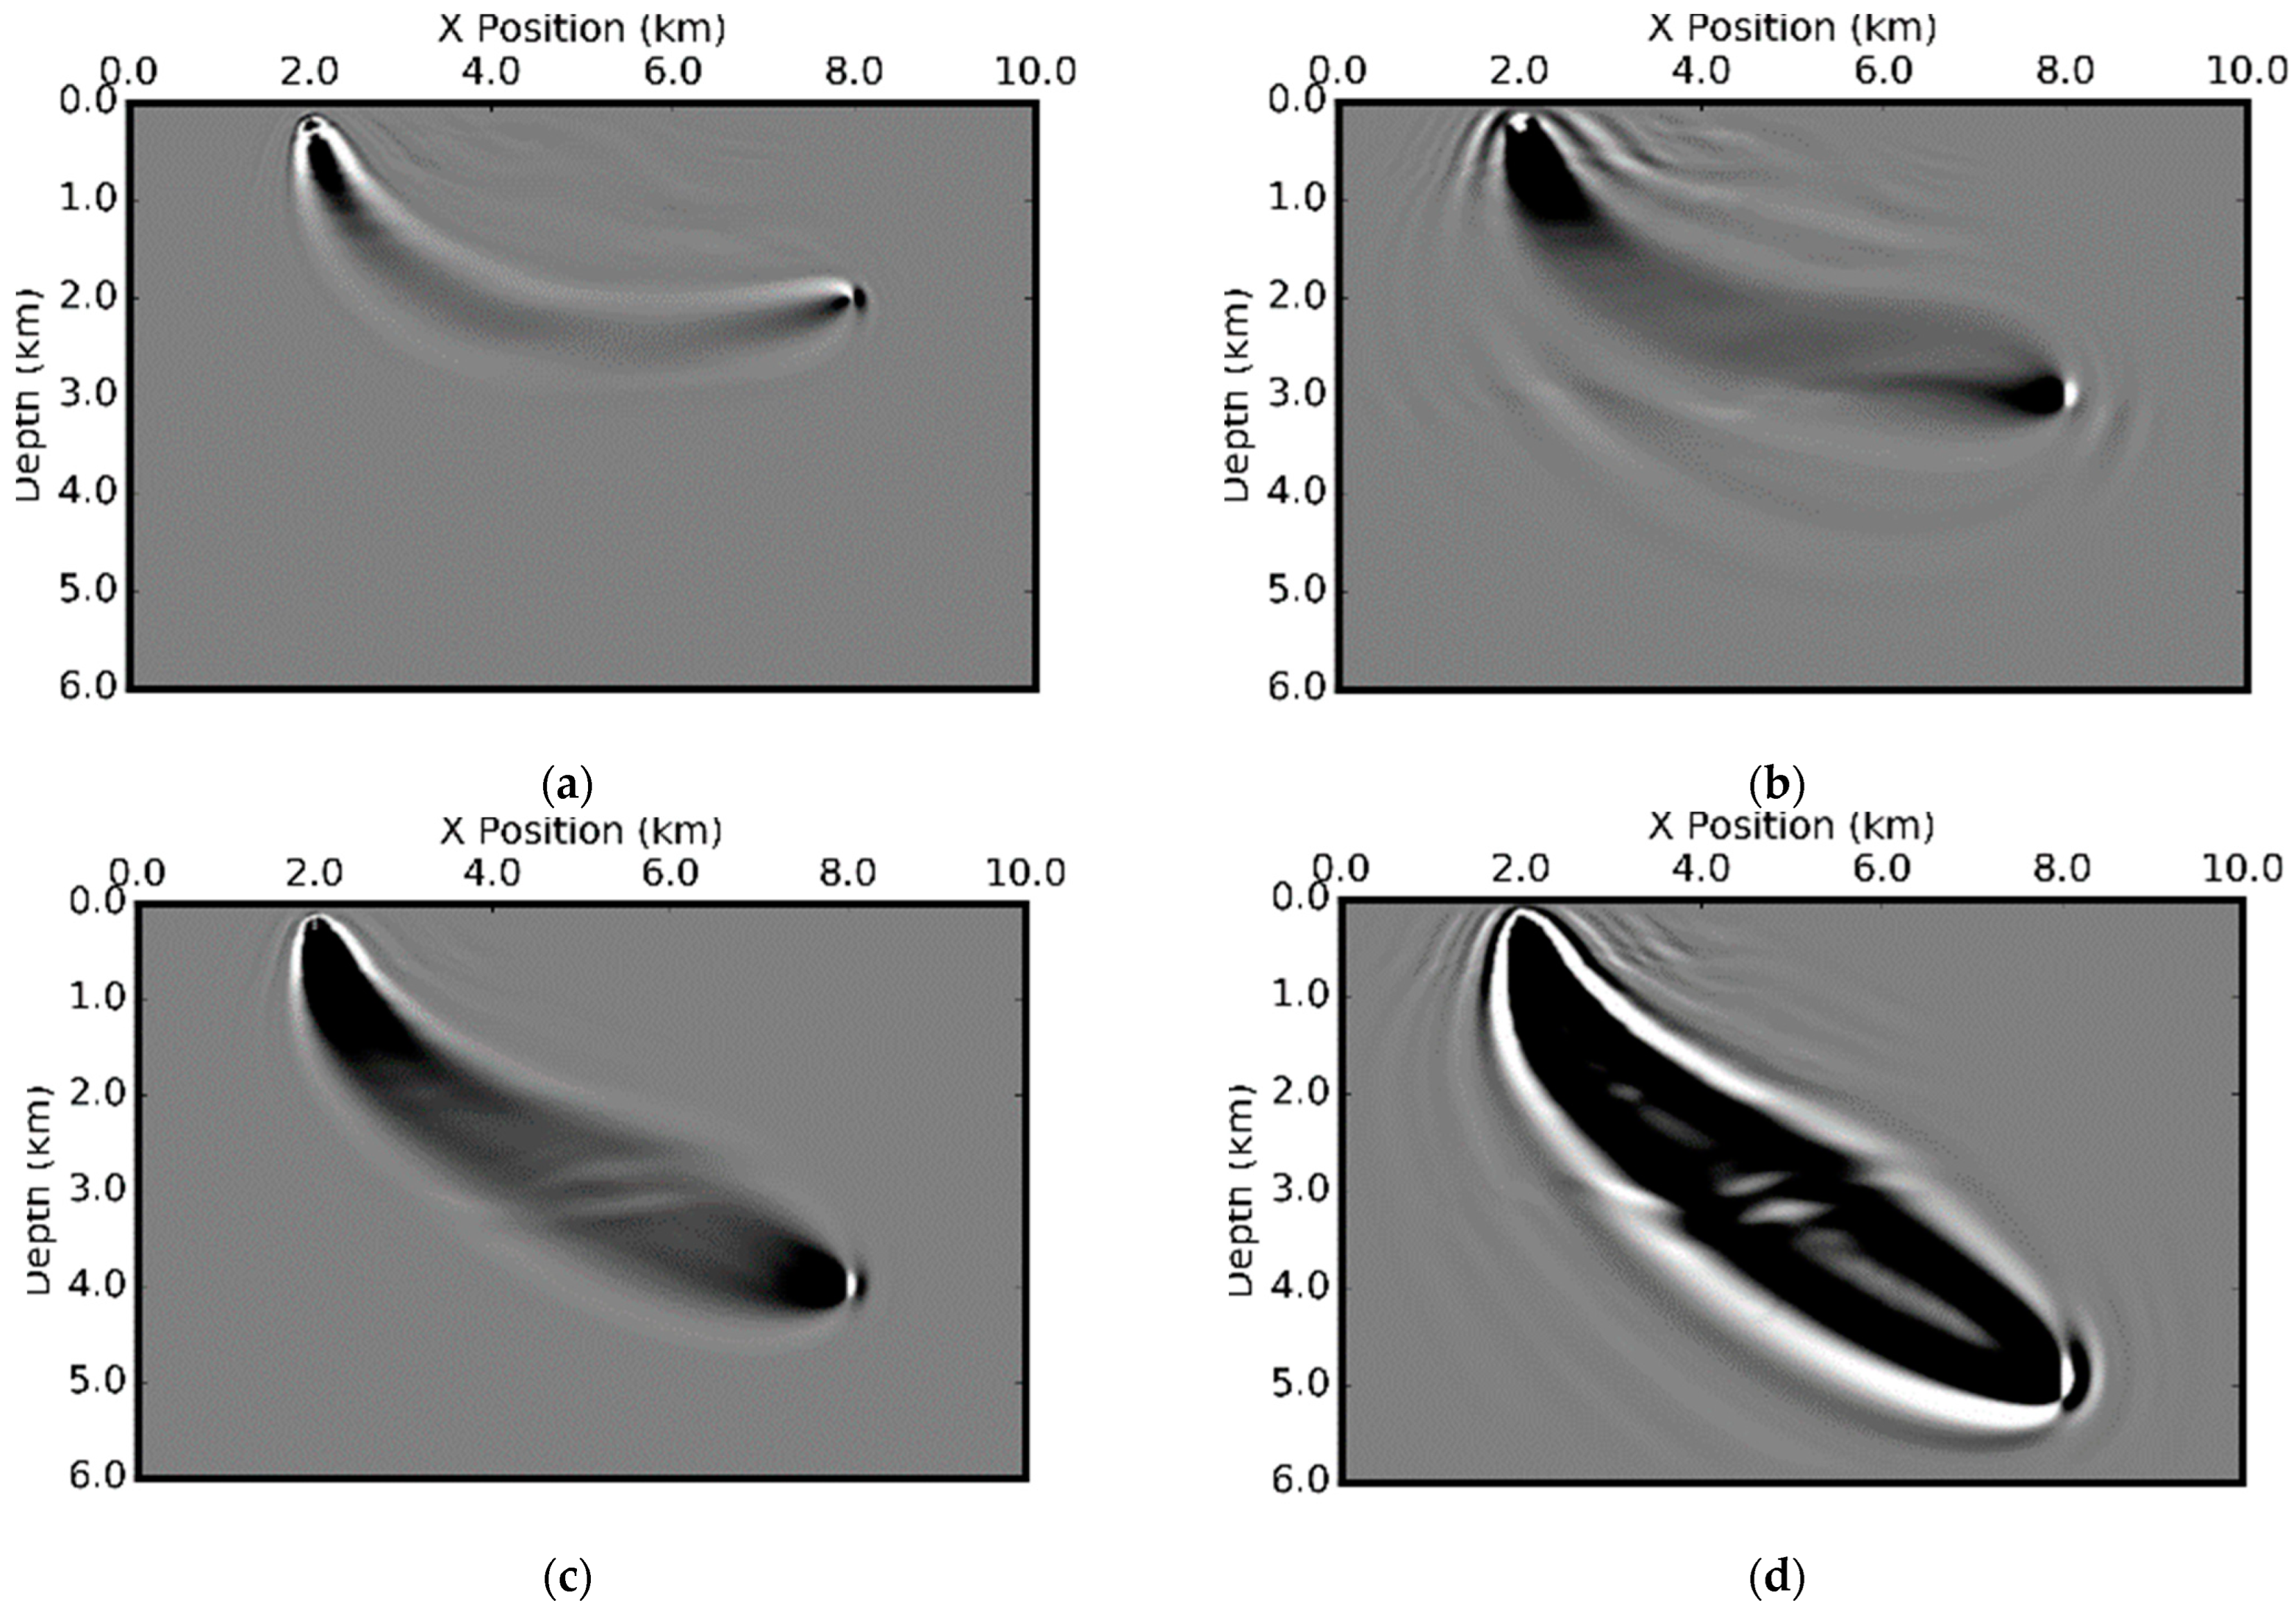
Figure 15 shows the sensitivity kernels for the P-wave modulus, S-wave modulus, and density for isotropic media using only the
x component of particle displacements as input (
Figure 15a, 15c, and 15e) and using only the
z component of particle displacements as input (
Figure 15b, 15d, and 15f). Compared with the kernels computed by ray tracing in a similar environment (
Figure 2b), the kernels computed using the 3D wave equation have much higher resolution, particularly in the direction perpendicular to the central raypath. This is precisely the direction in which the ray method suffers from low resolution in model building. For deep water environments, using the
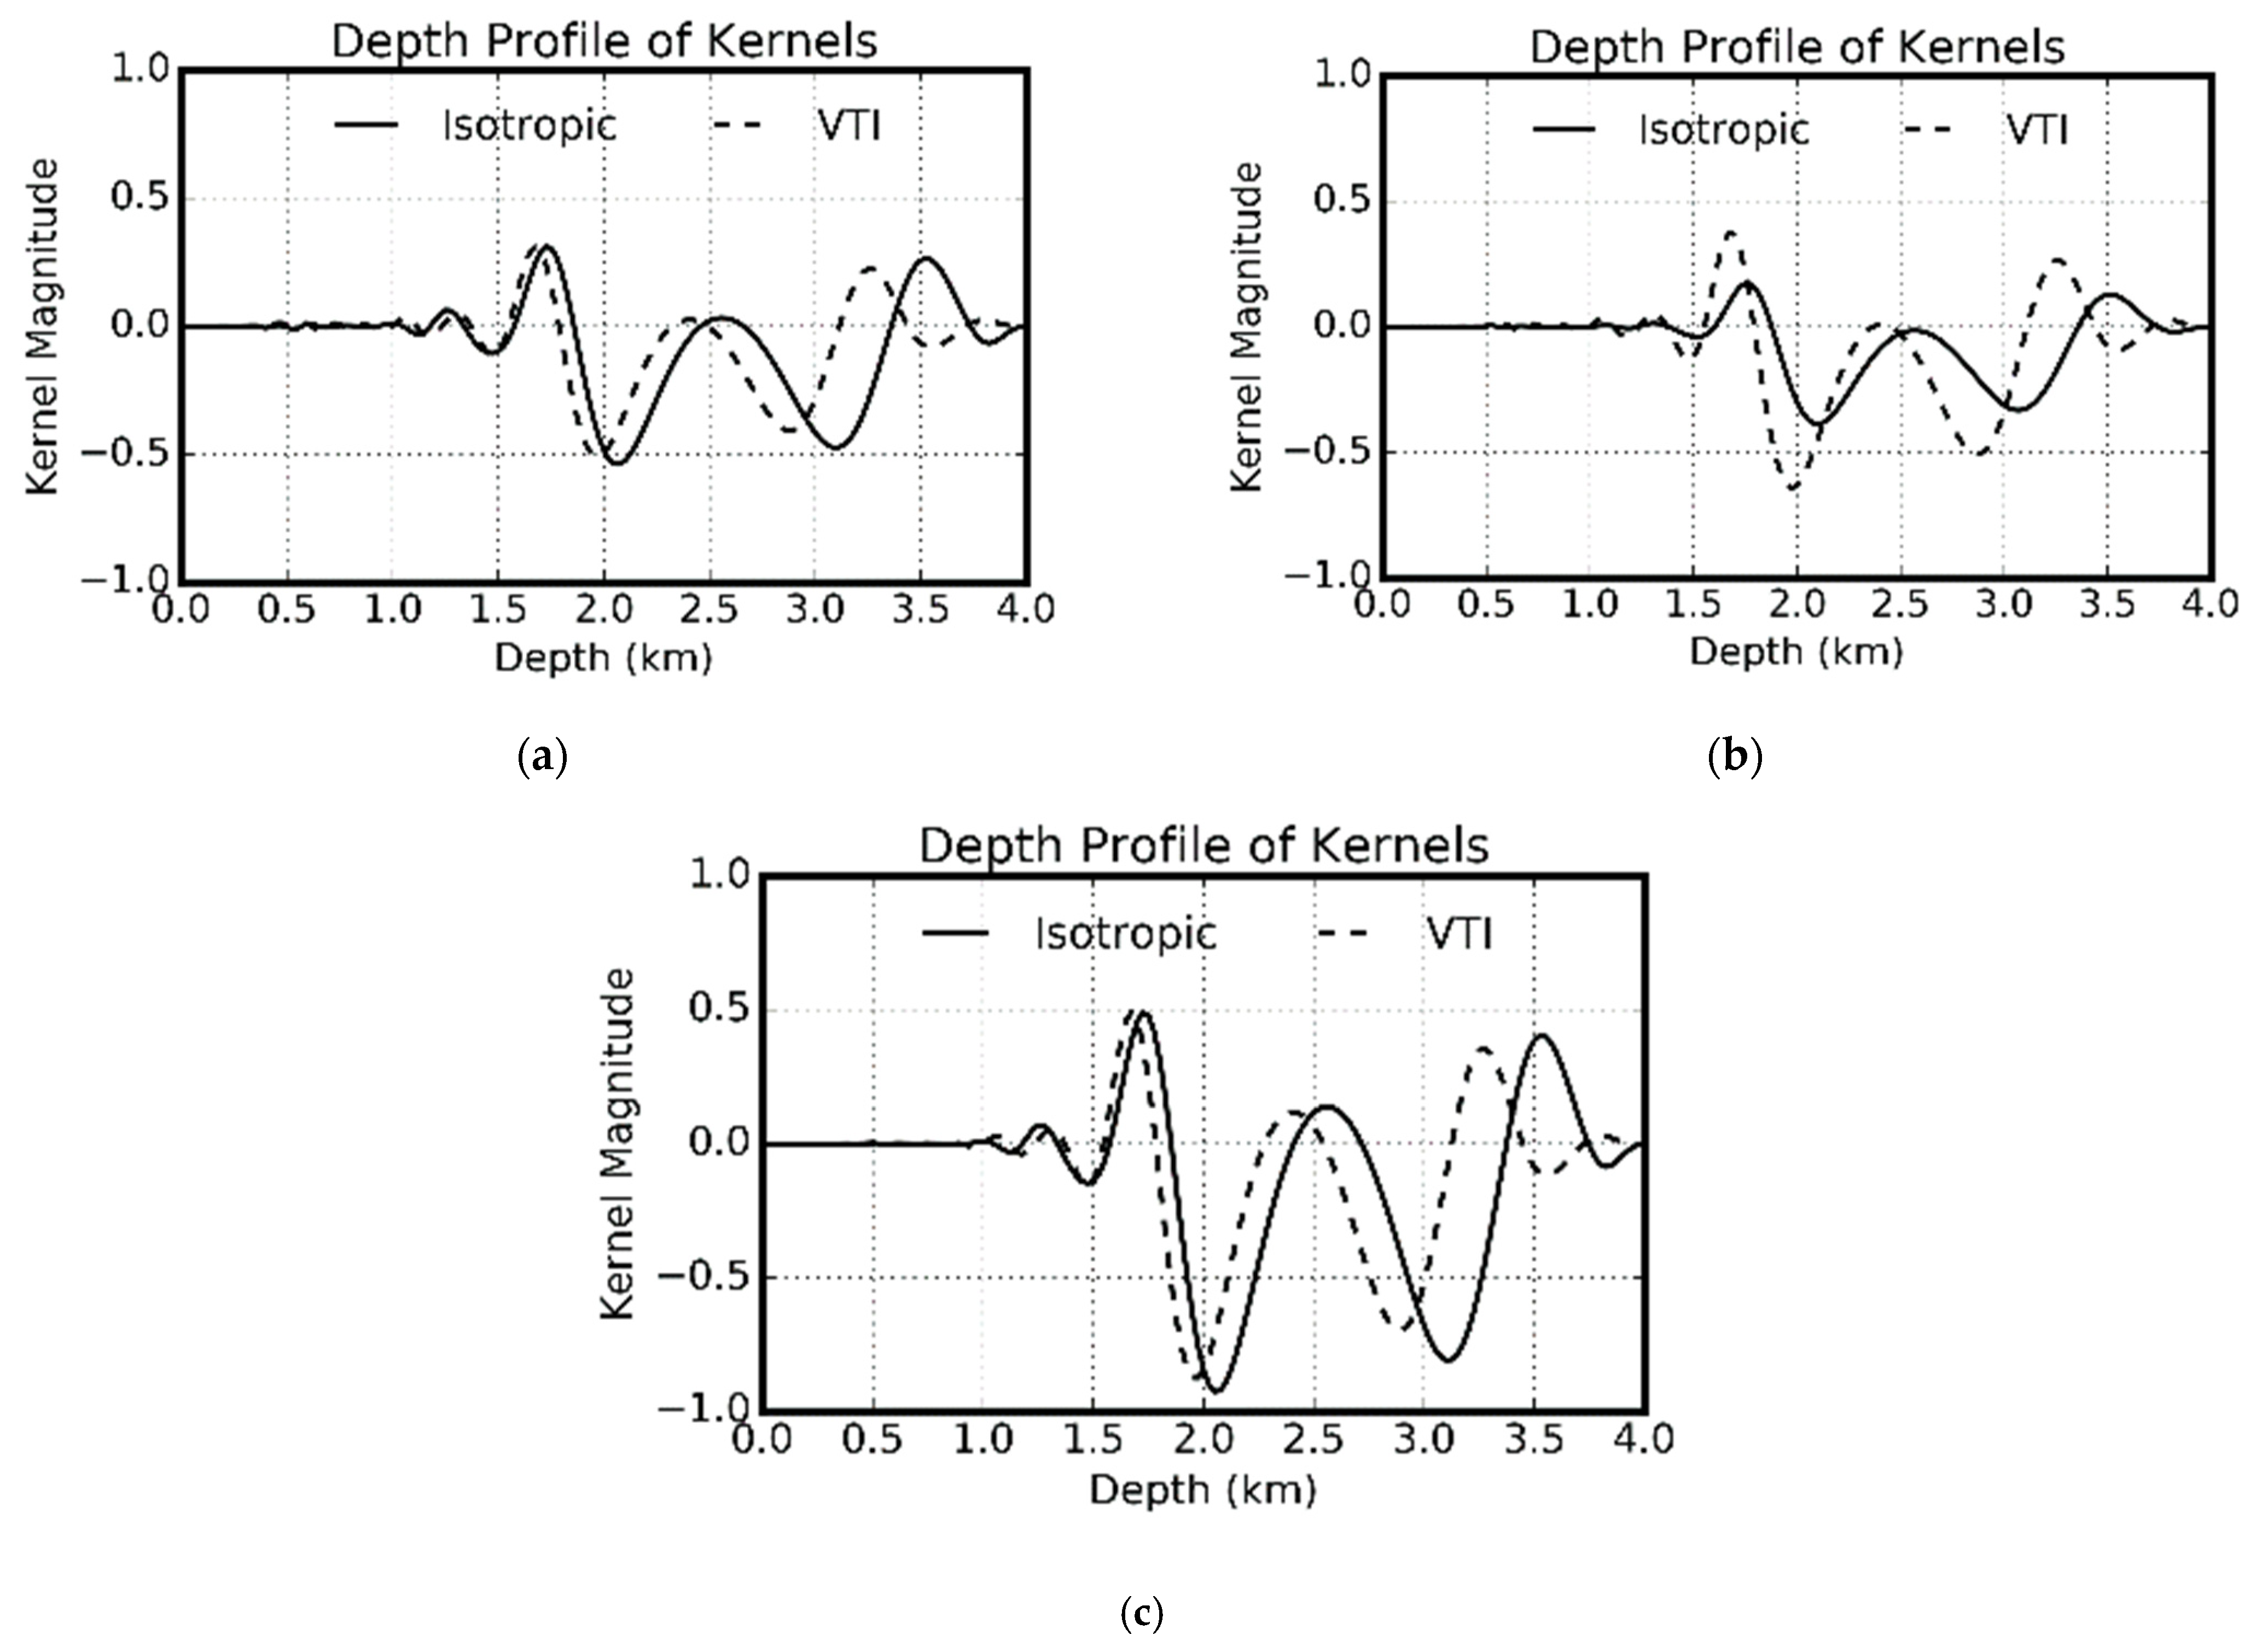
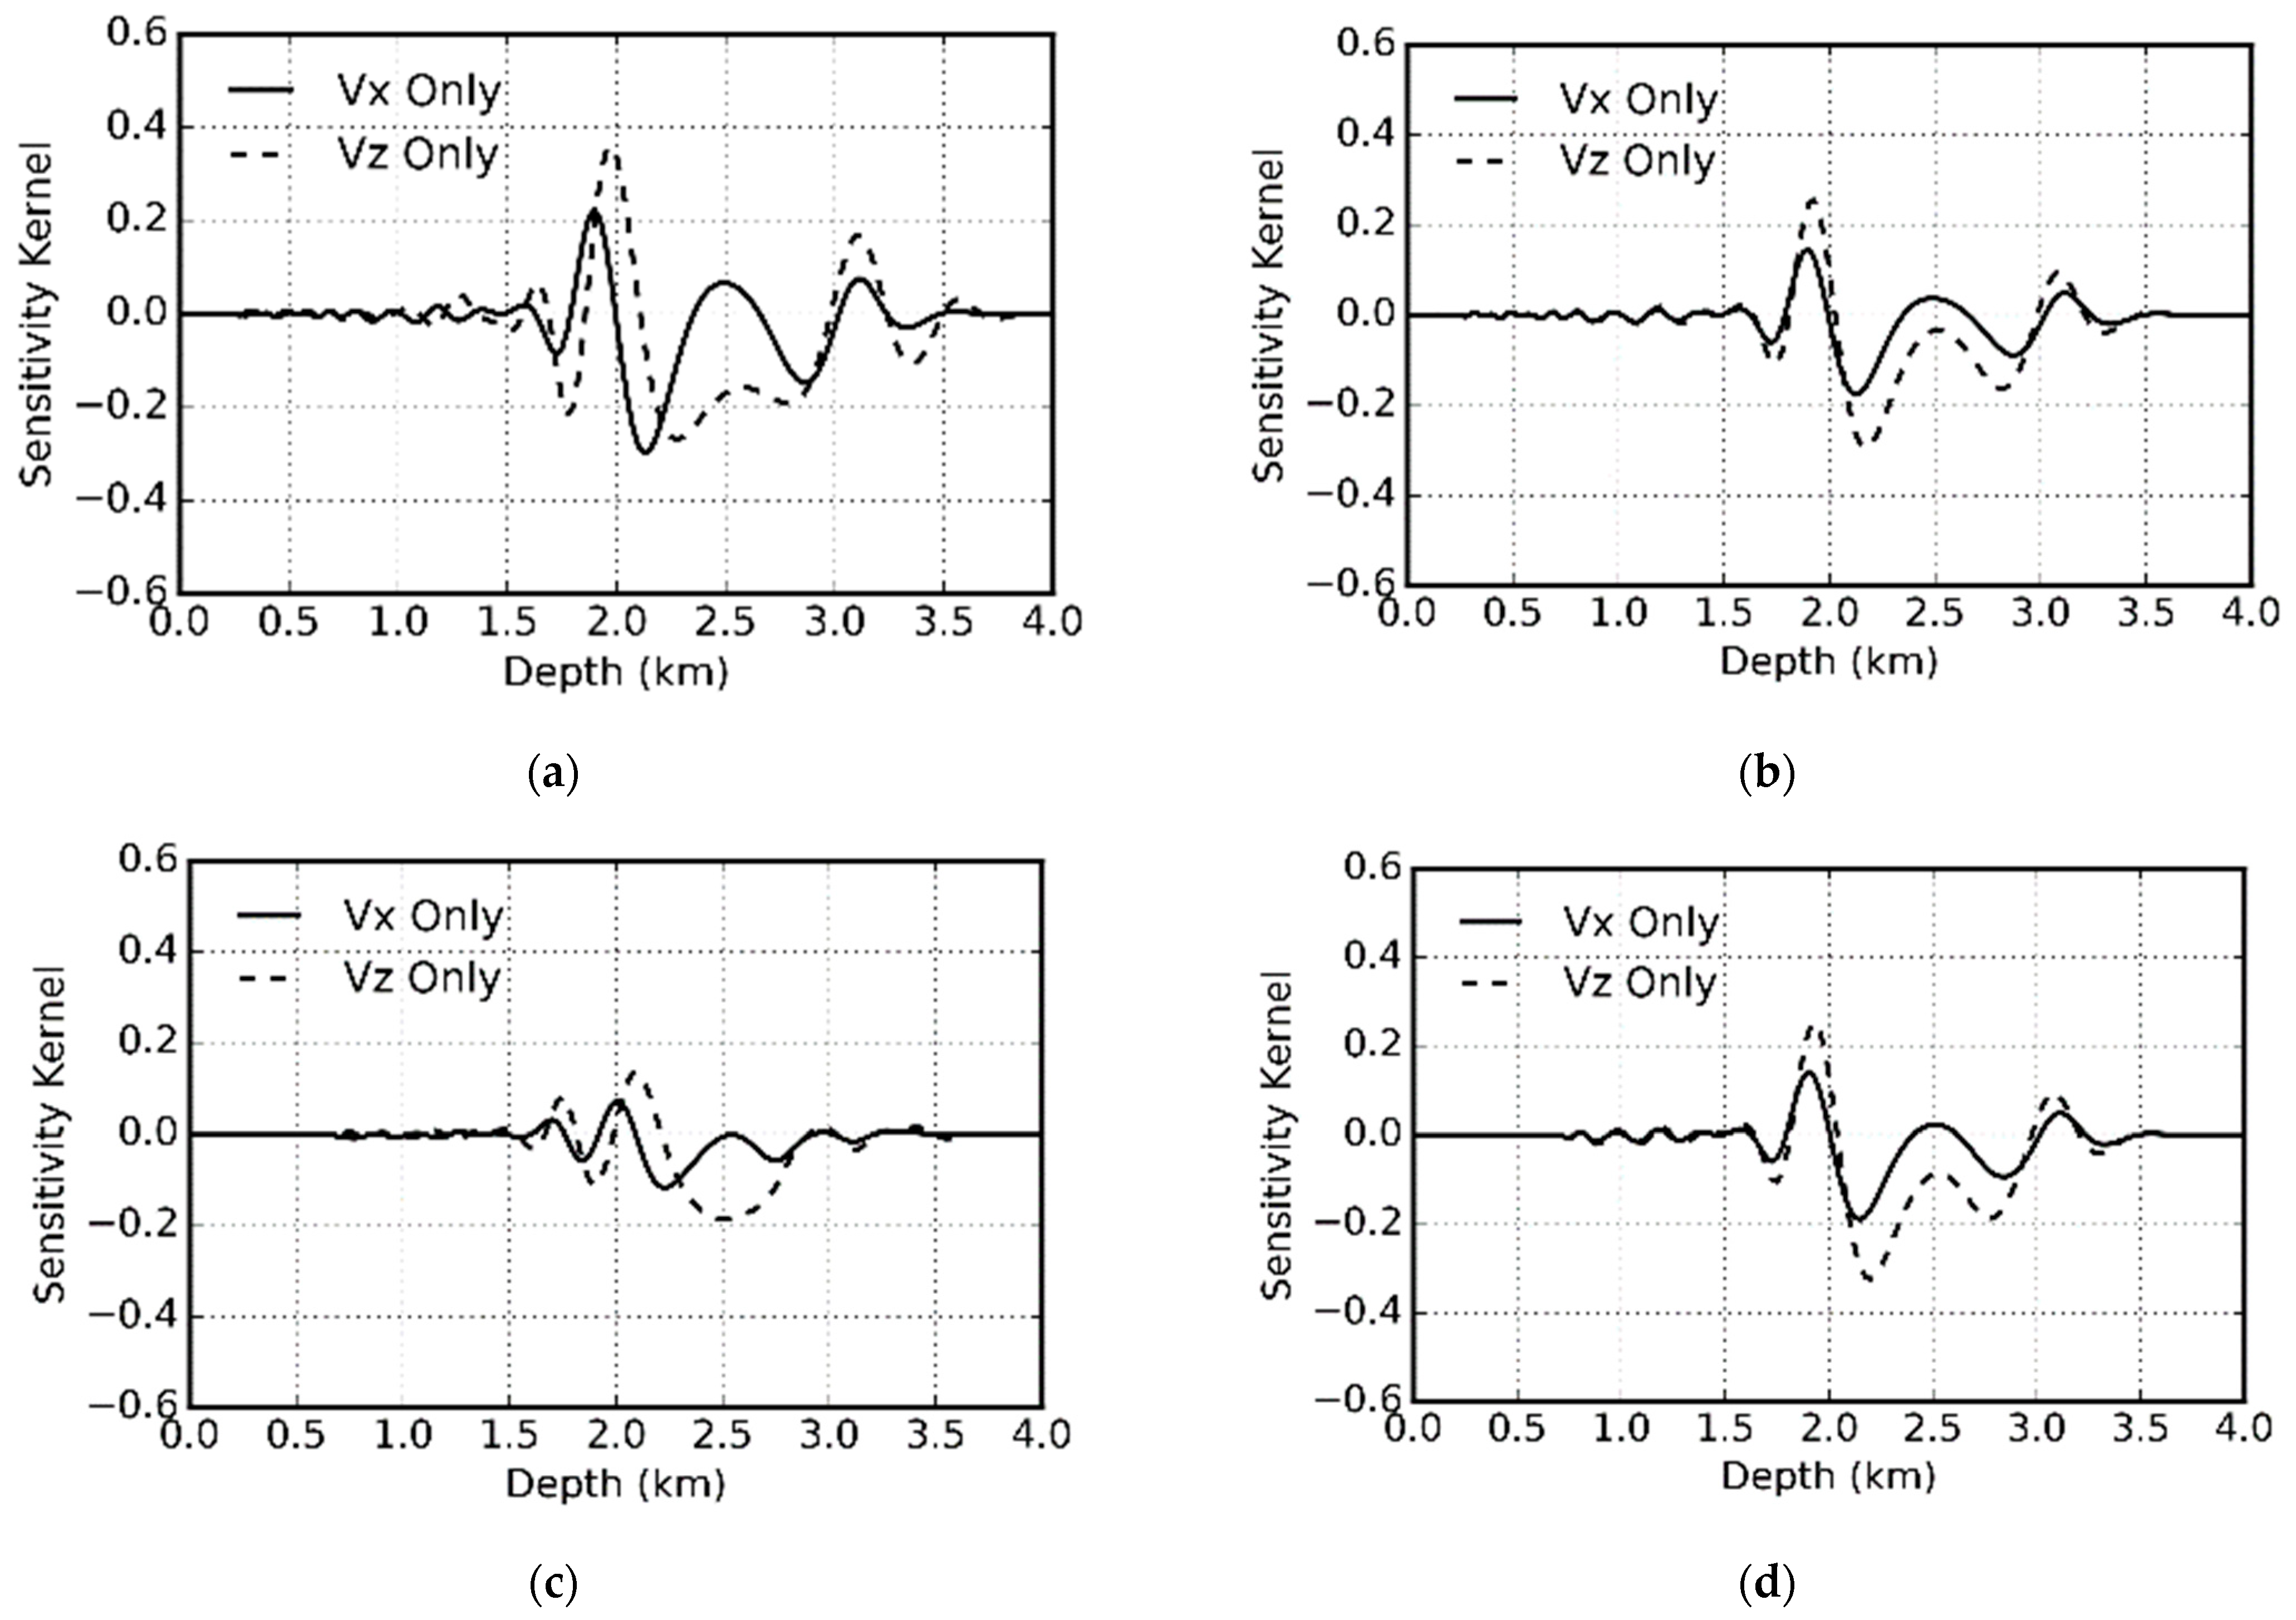
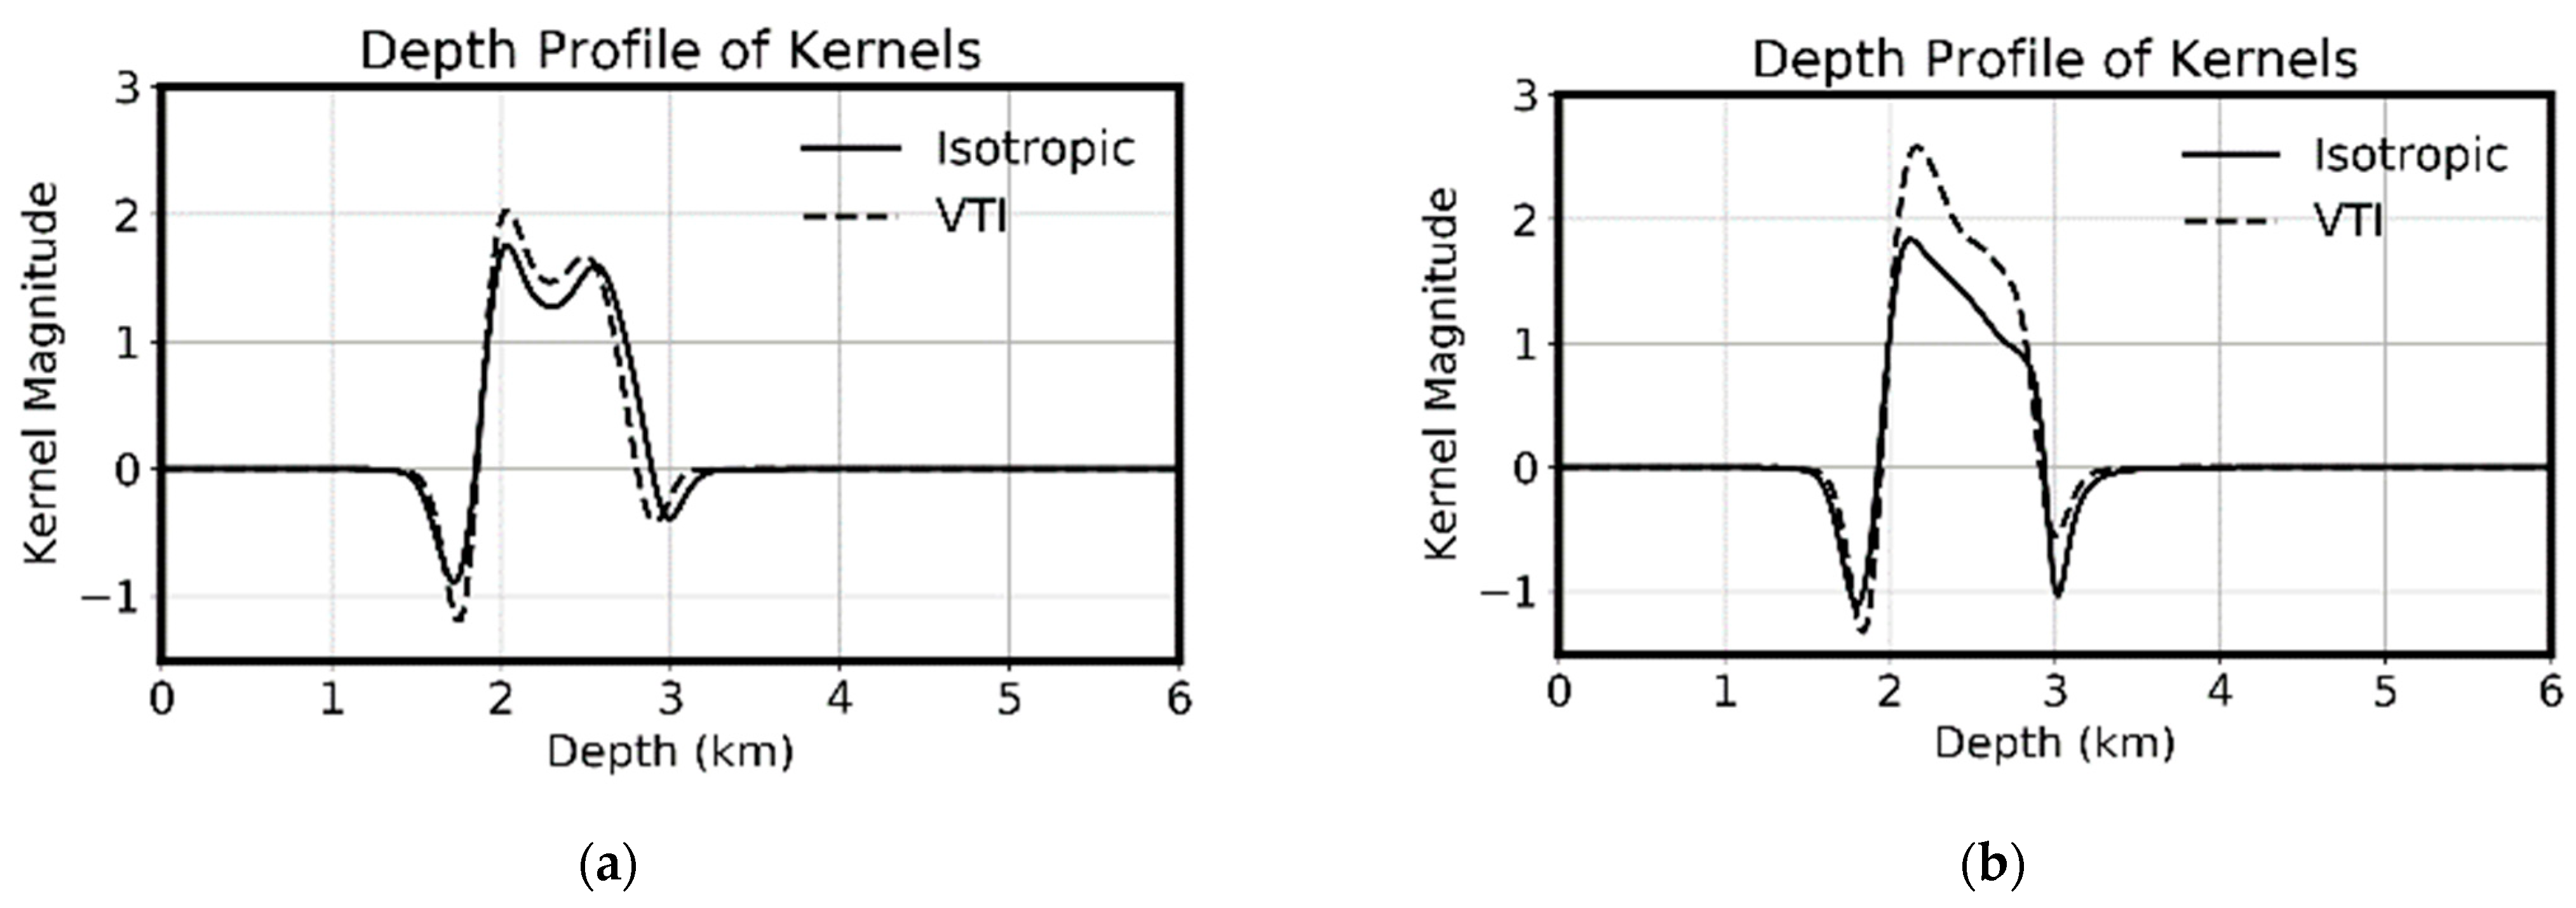
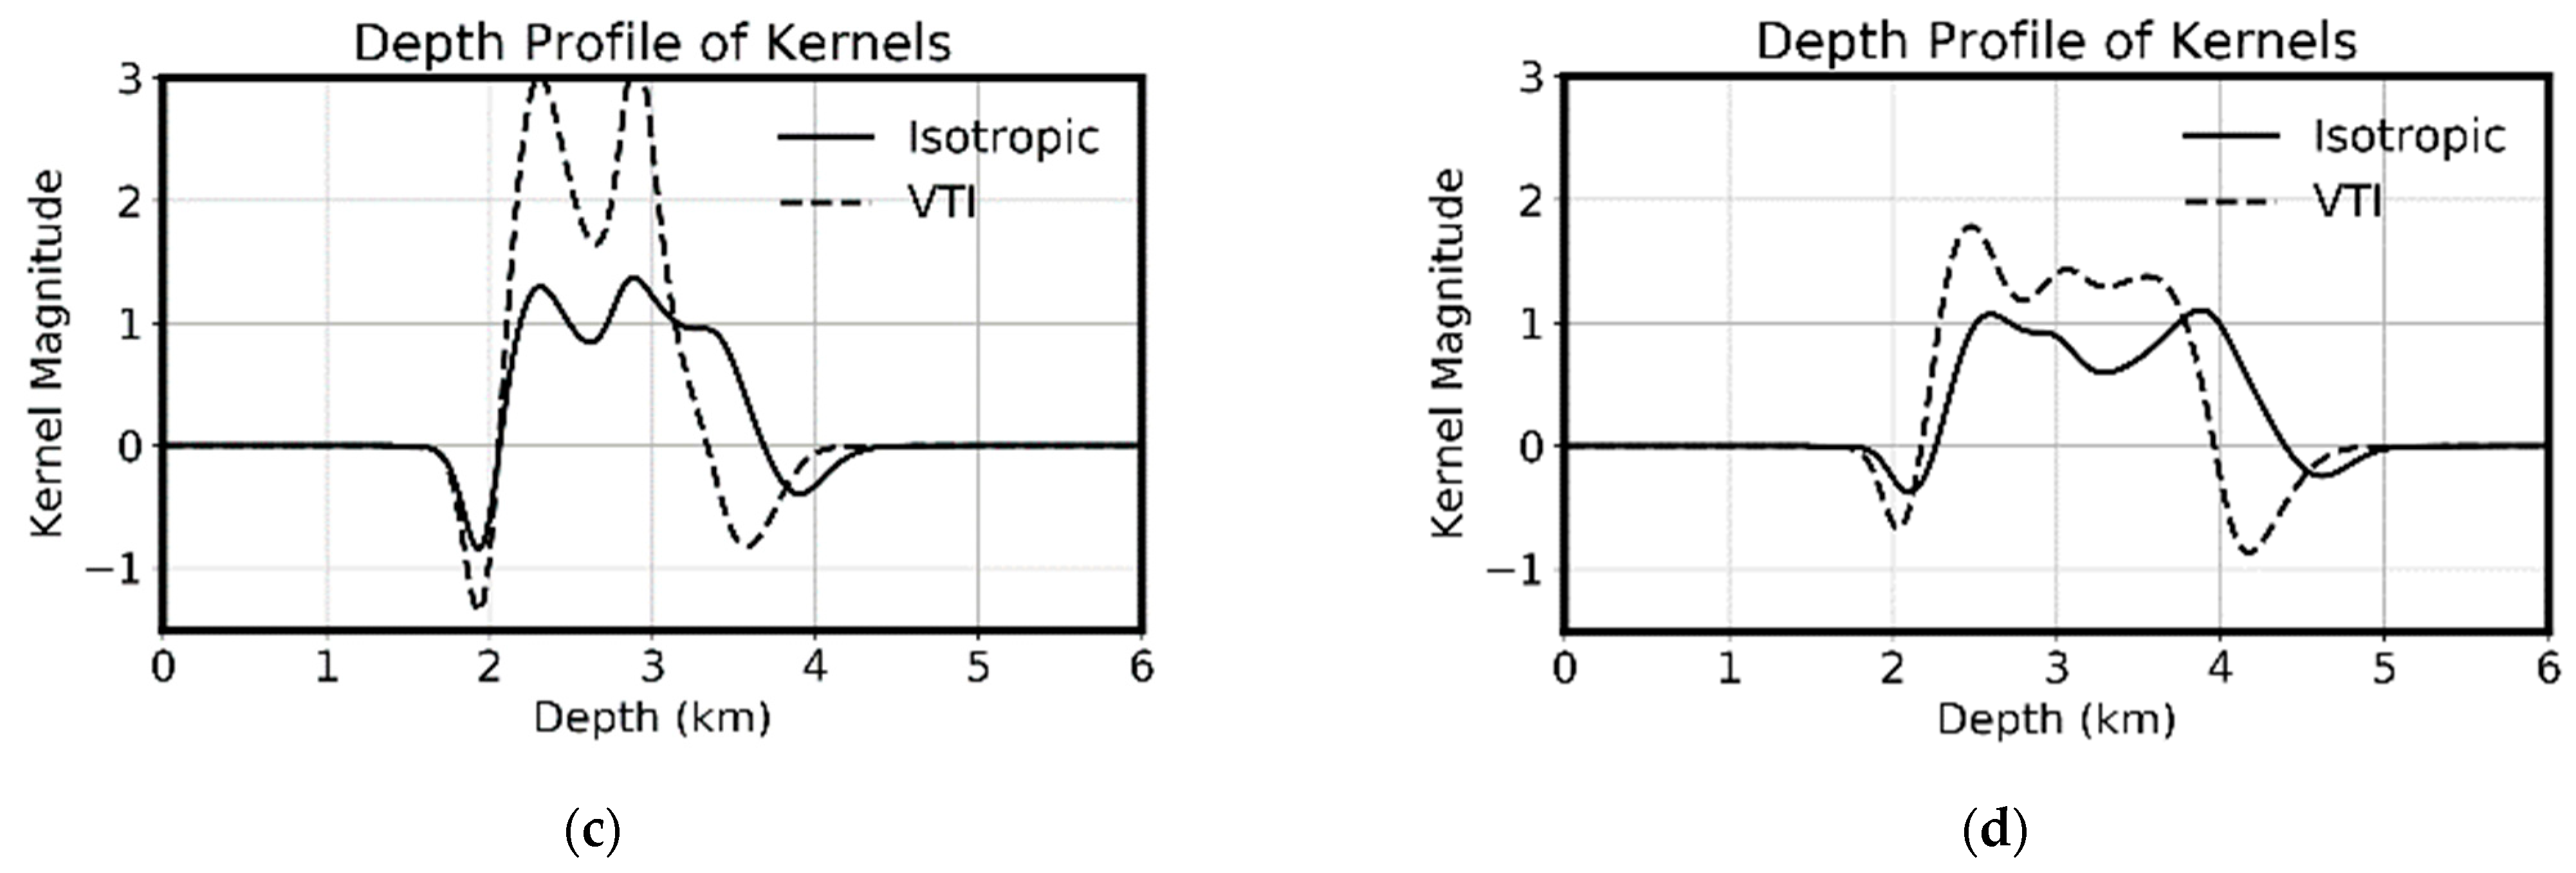
z component of the particle displacements as the input seems to give stronger sensitivity kernels. This can also be seen in
Figure 17 where the depth profiles are plotted.
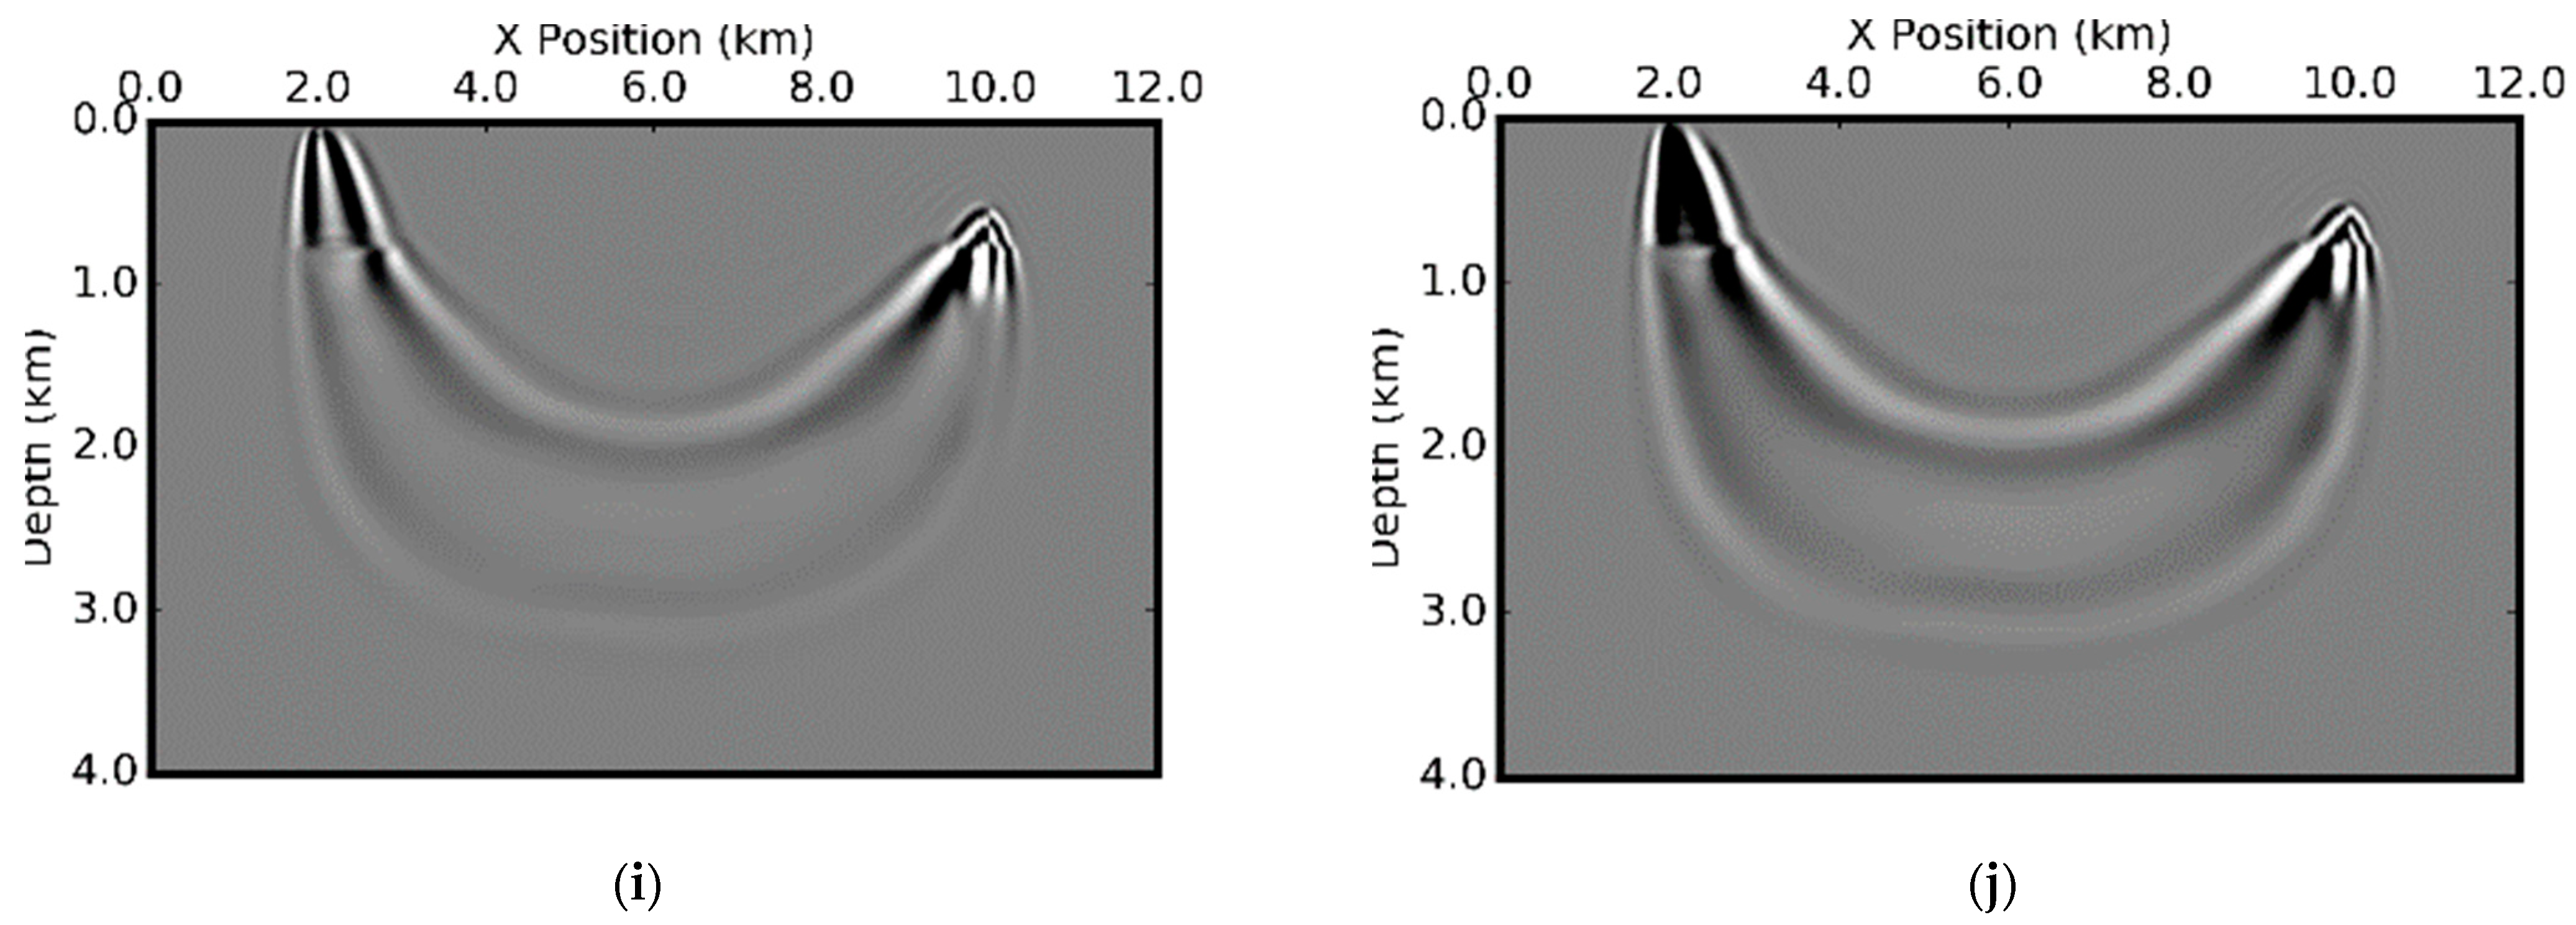
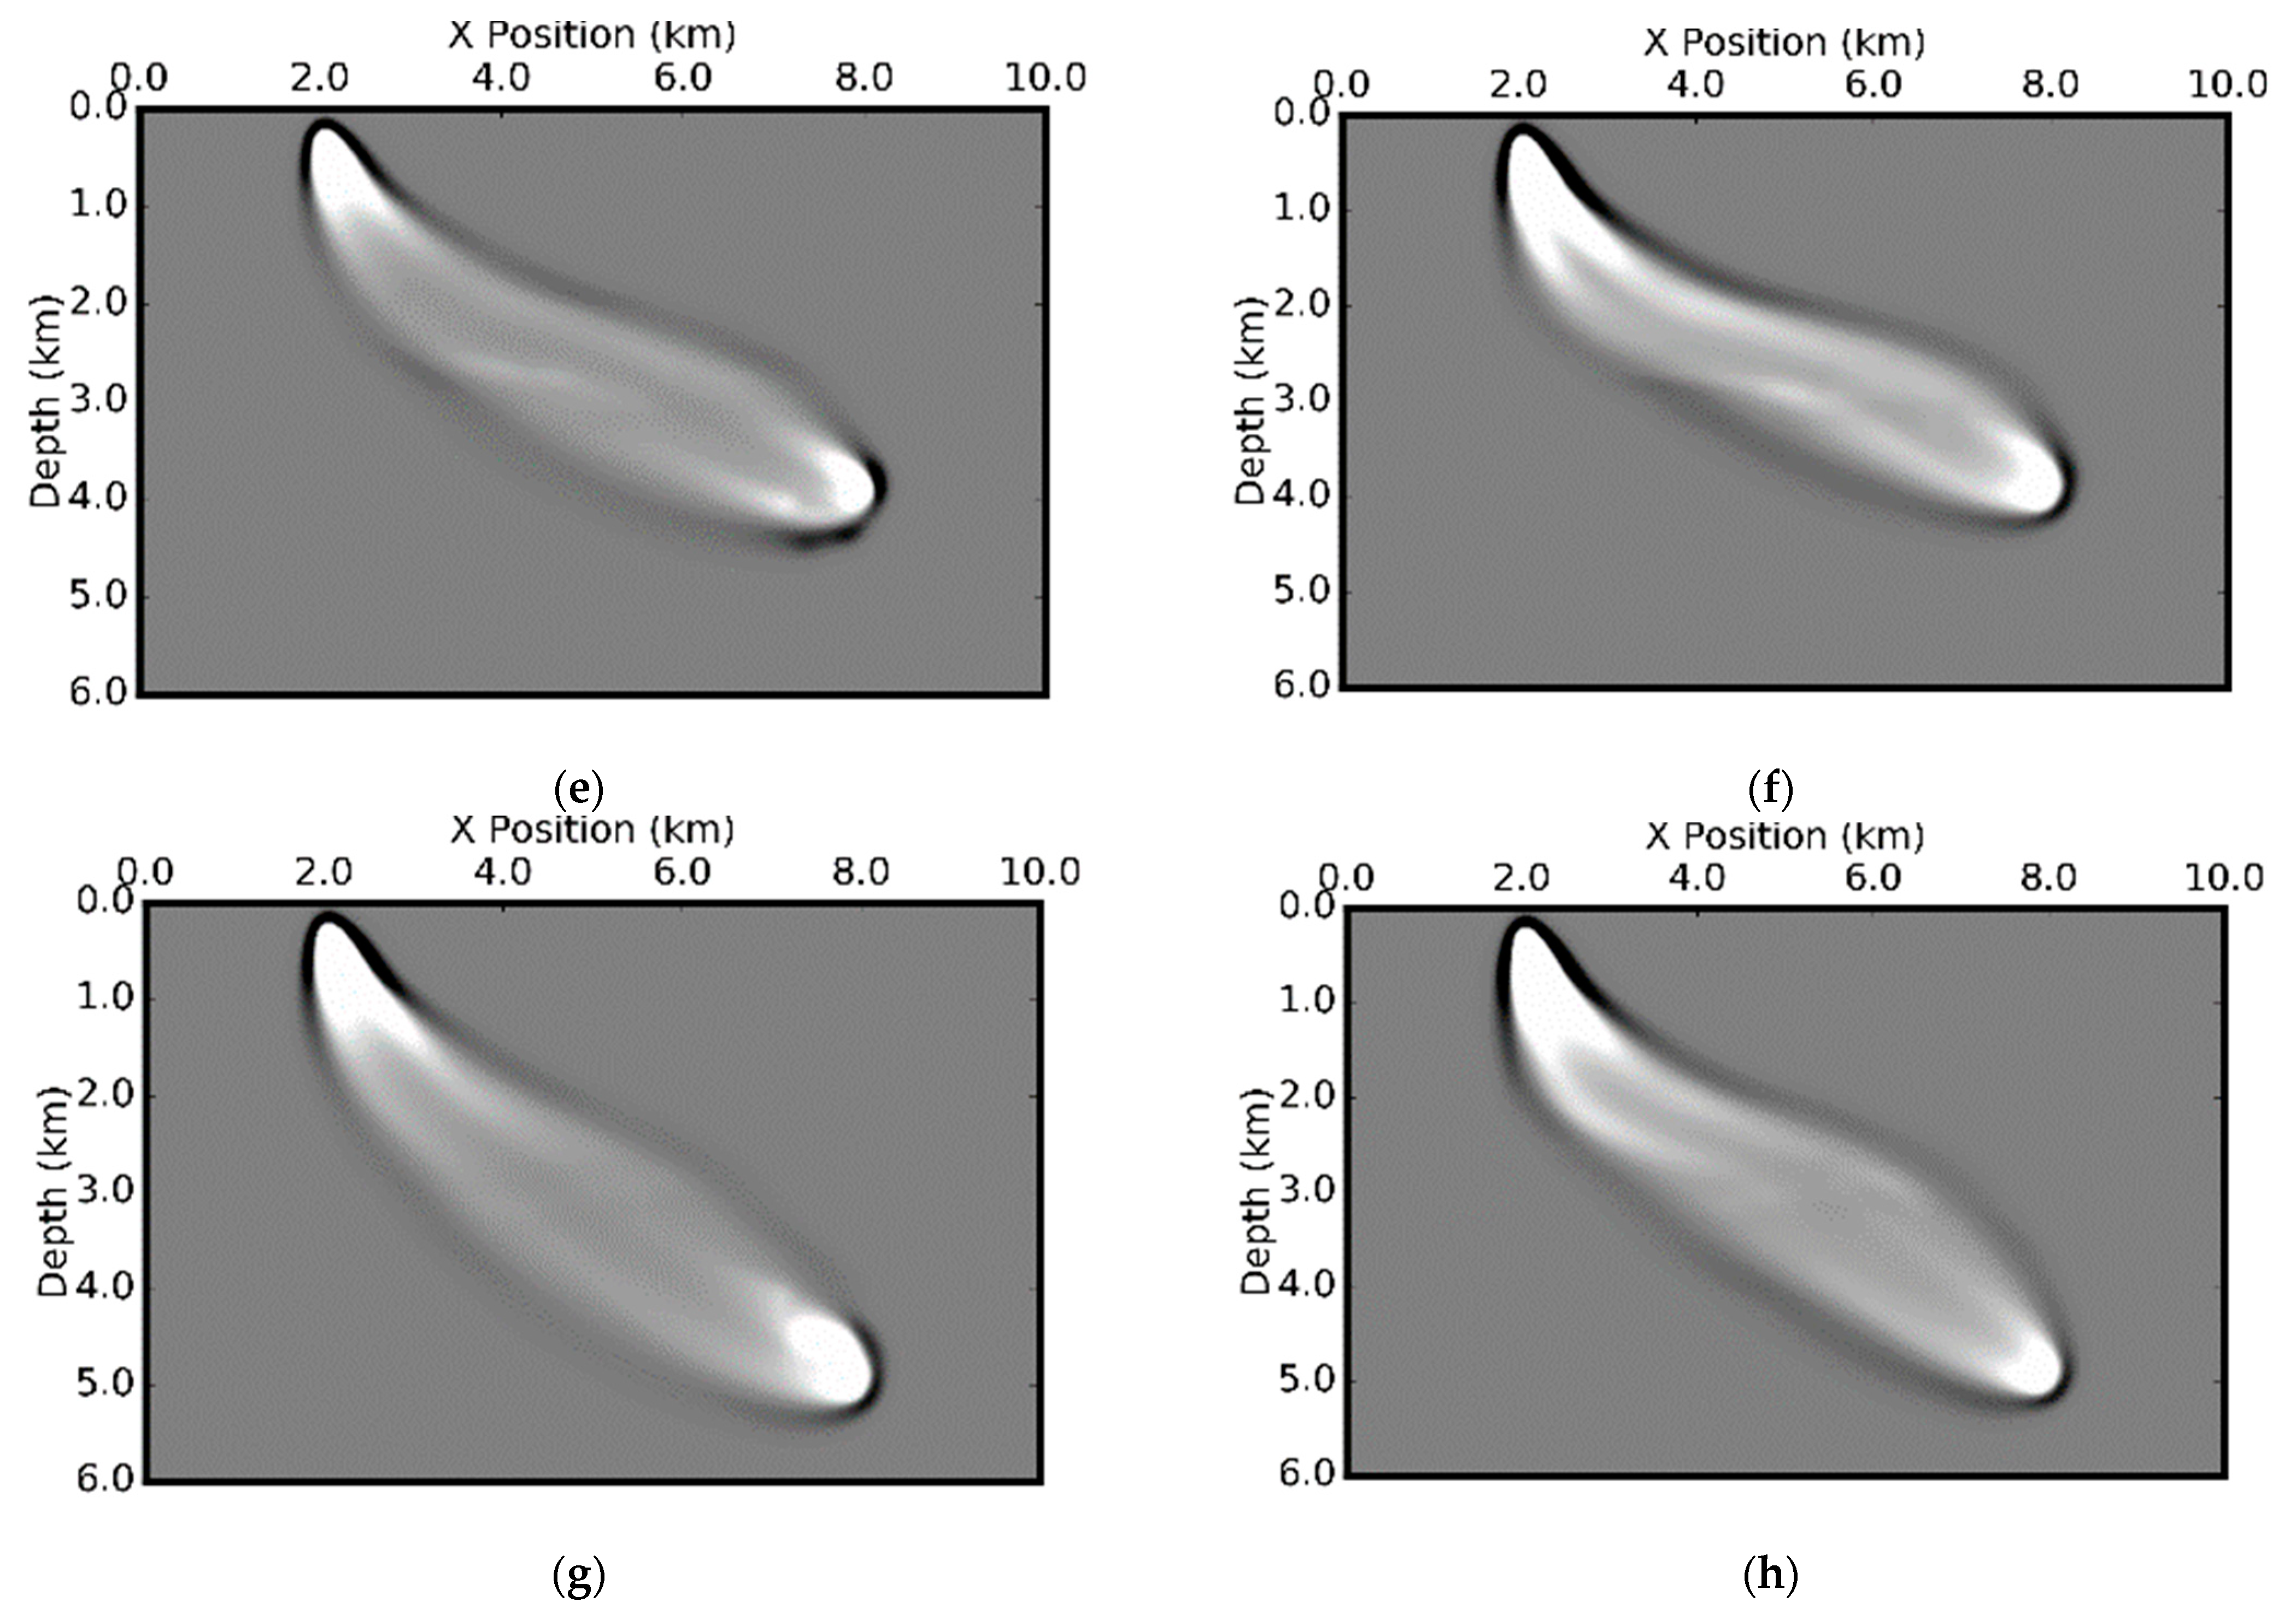
Figure 16 shows the corresponding kernels for VTI media, as well as the kernels for
and
. The kernels for
and
have smaller values in the solid layers indicating the anisotropy updates will be larger in the sediments than in the water layer. As demonstrated previously [
21], OBN acquisition can be used to invert higher-resolution velocity than surface streamer data. These kernels will be used for velocity and anisotropy inversion.
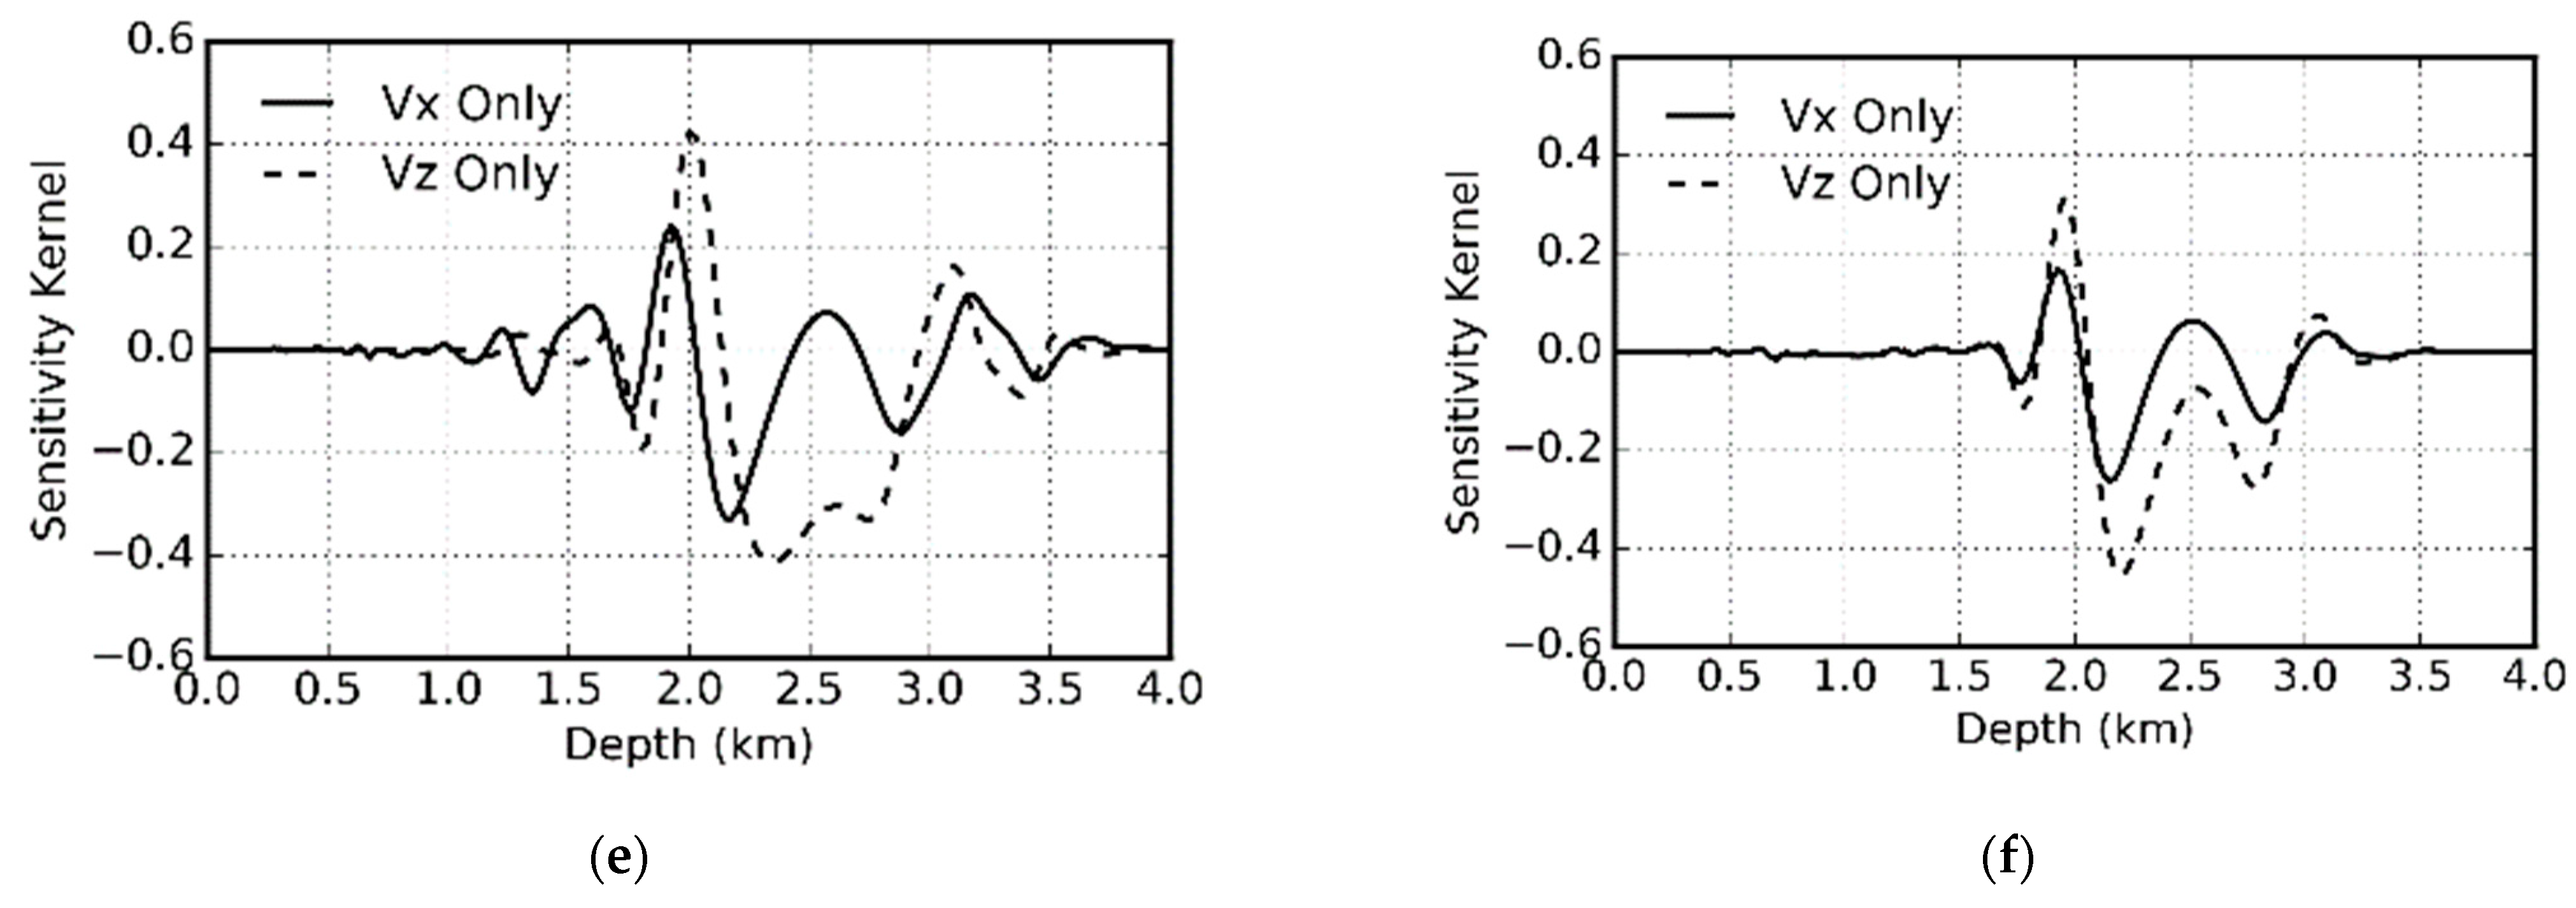
Figure 17 shows the comparisons of the kernels using
x only and using
z component as input between isotropic and VTI elastic media for P-wave modulus, S-wave modulus, and density. The phases of all the kernels are in phase. Anisotropy has a larger impact on the S-wave modulus than on the P-wave modulus. Therefore, inversion of anisotropic parameters prefers shear-wave information in the data. Density kernels do not show particular patterns, although we do observe the difference between isotropic and VTI media. They are more related to the reflections than to transmissions.
We will also show the sensitivity kernels for an important part in modeling building, that being the inversion of velocity and anisotropic parameters using traveltime of Vertical Seismic Profile (VSP). The traveltime of VSP data is measured between a source (usually on the surface) and receivers in a wellbore, where both the source and the receivers have pre-designed locations. Therefore, there is no velocity-depth ambiguity in the inversion of velocity using VSP time as compared with that using surface reflection data. VSP provides one of the most reliable approaches for local velocity (including anisotropy) model building. Conventional VSP inversion is carried out by ray theory which leads to the low resolution of the model inversion.
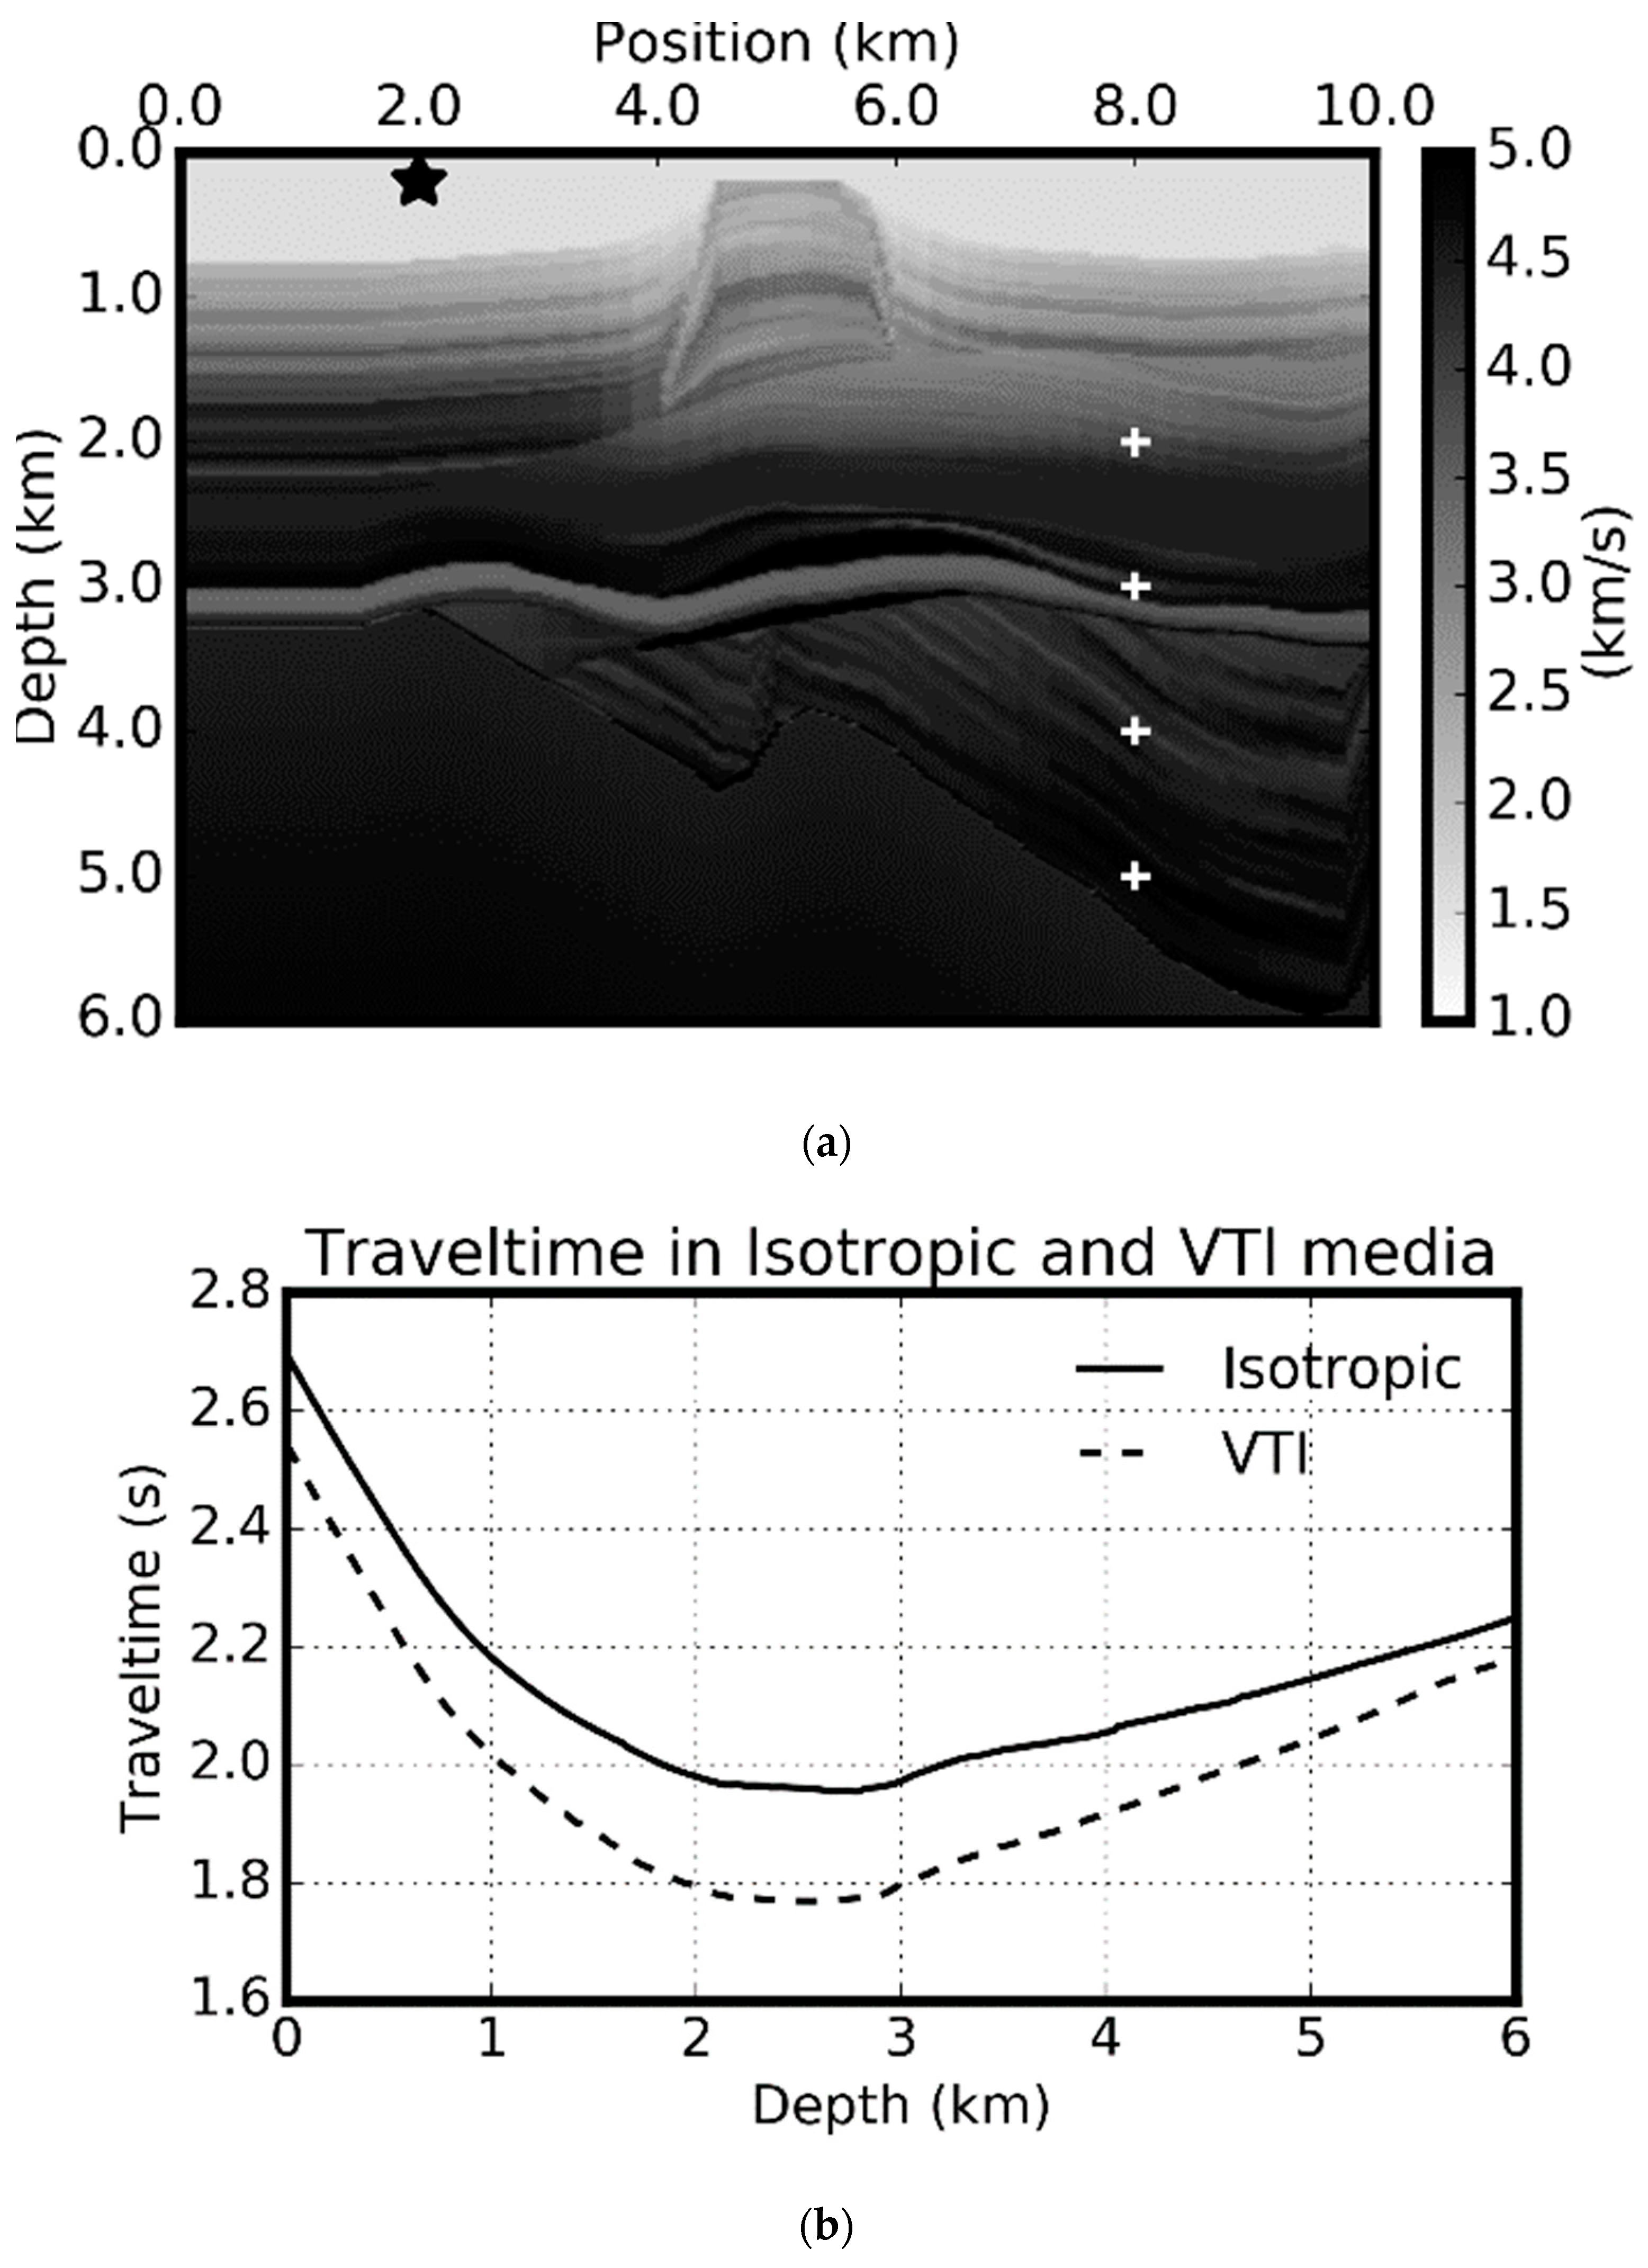
Figure 18a is the P-wave velocity model and acquisition geometry used for the investigation of VSP acquisition. The star is the source location, and the crosses represent the locations of the four receivers were used for computations of the sensitivity kernels. The first receiver is above the salt layer. The second receiver is inside the salt layer. The third and fourth receivers are in the subsalt area. We first compute the P-wave traveltime from the source to the vertical section at
x = 8 km for both isotropic and VTI media. The anisotropic parameters used for the VTI media are defined in
Figure 14d,e. The computed depth profiles of traveltime are shown in
Figure 18b. The largest difference, around a depth of 2.0 km, is about 0.2 s implying the significant impact of anisotropy. For the receiver at 2.5 km, the source-receiver pair contains the longest flat raypath which passes through the sediments just above the salt body at a depth of about 3 km. Since the anisotropy in sediment is more prominent than that in the salt bodies, the traveltime difference can be used for inverting the anisotropic parameters of the sediments. The largest difference between isotropic and VTI is when the wave propagates horizontally as this leads to the largest deviations of the propagation velocity. This is consistent with the fact that the largest difference of the sensitivity kernels between isotropic and VTI media happen for the receivers between 3-4 km. Furthermore, see
Figure 21 below.
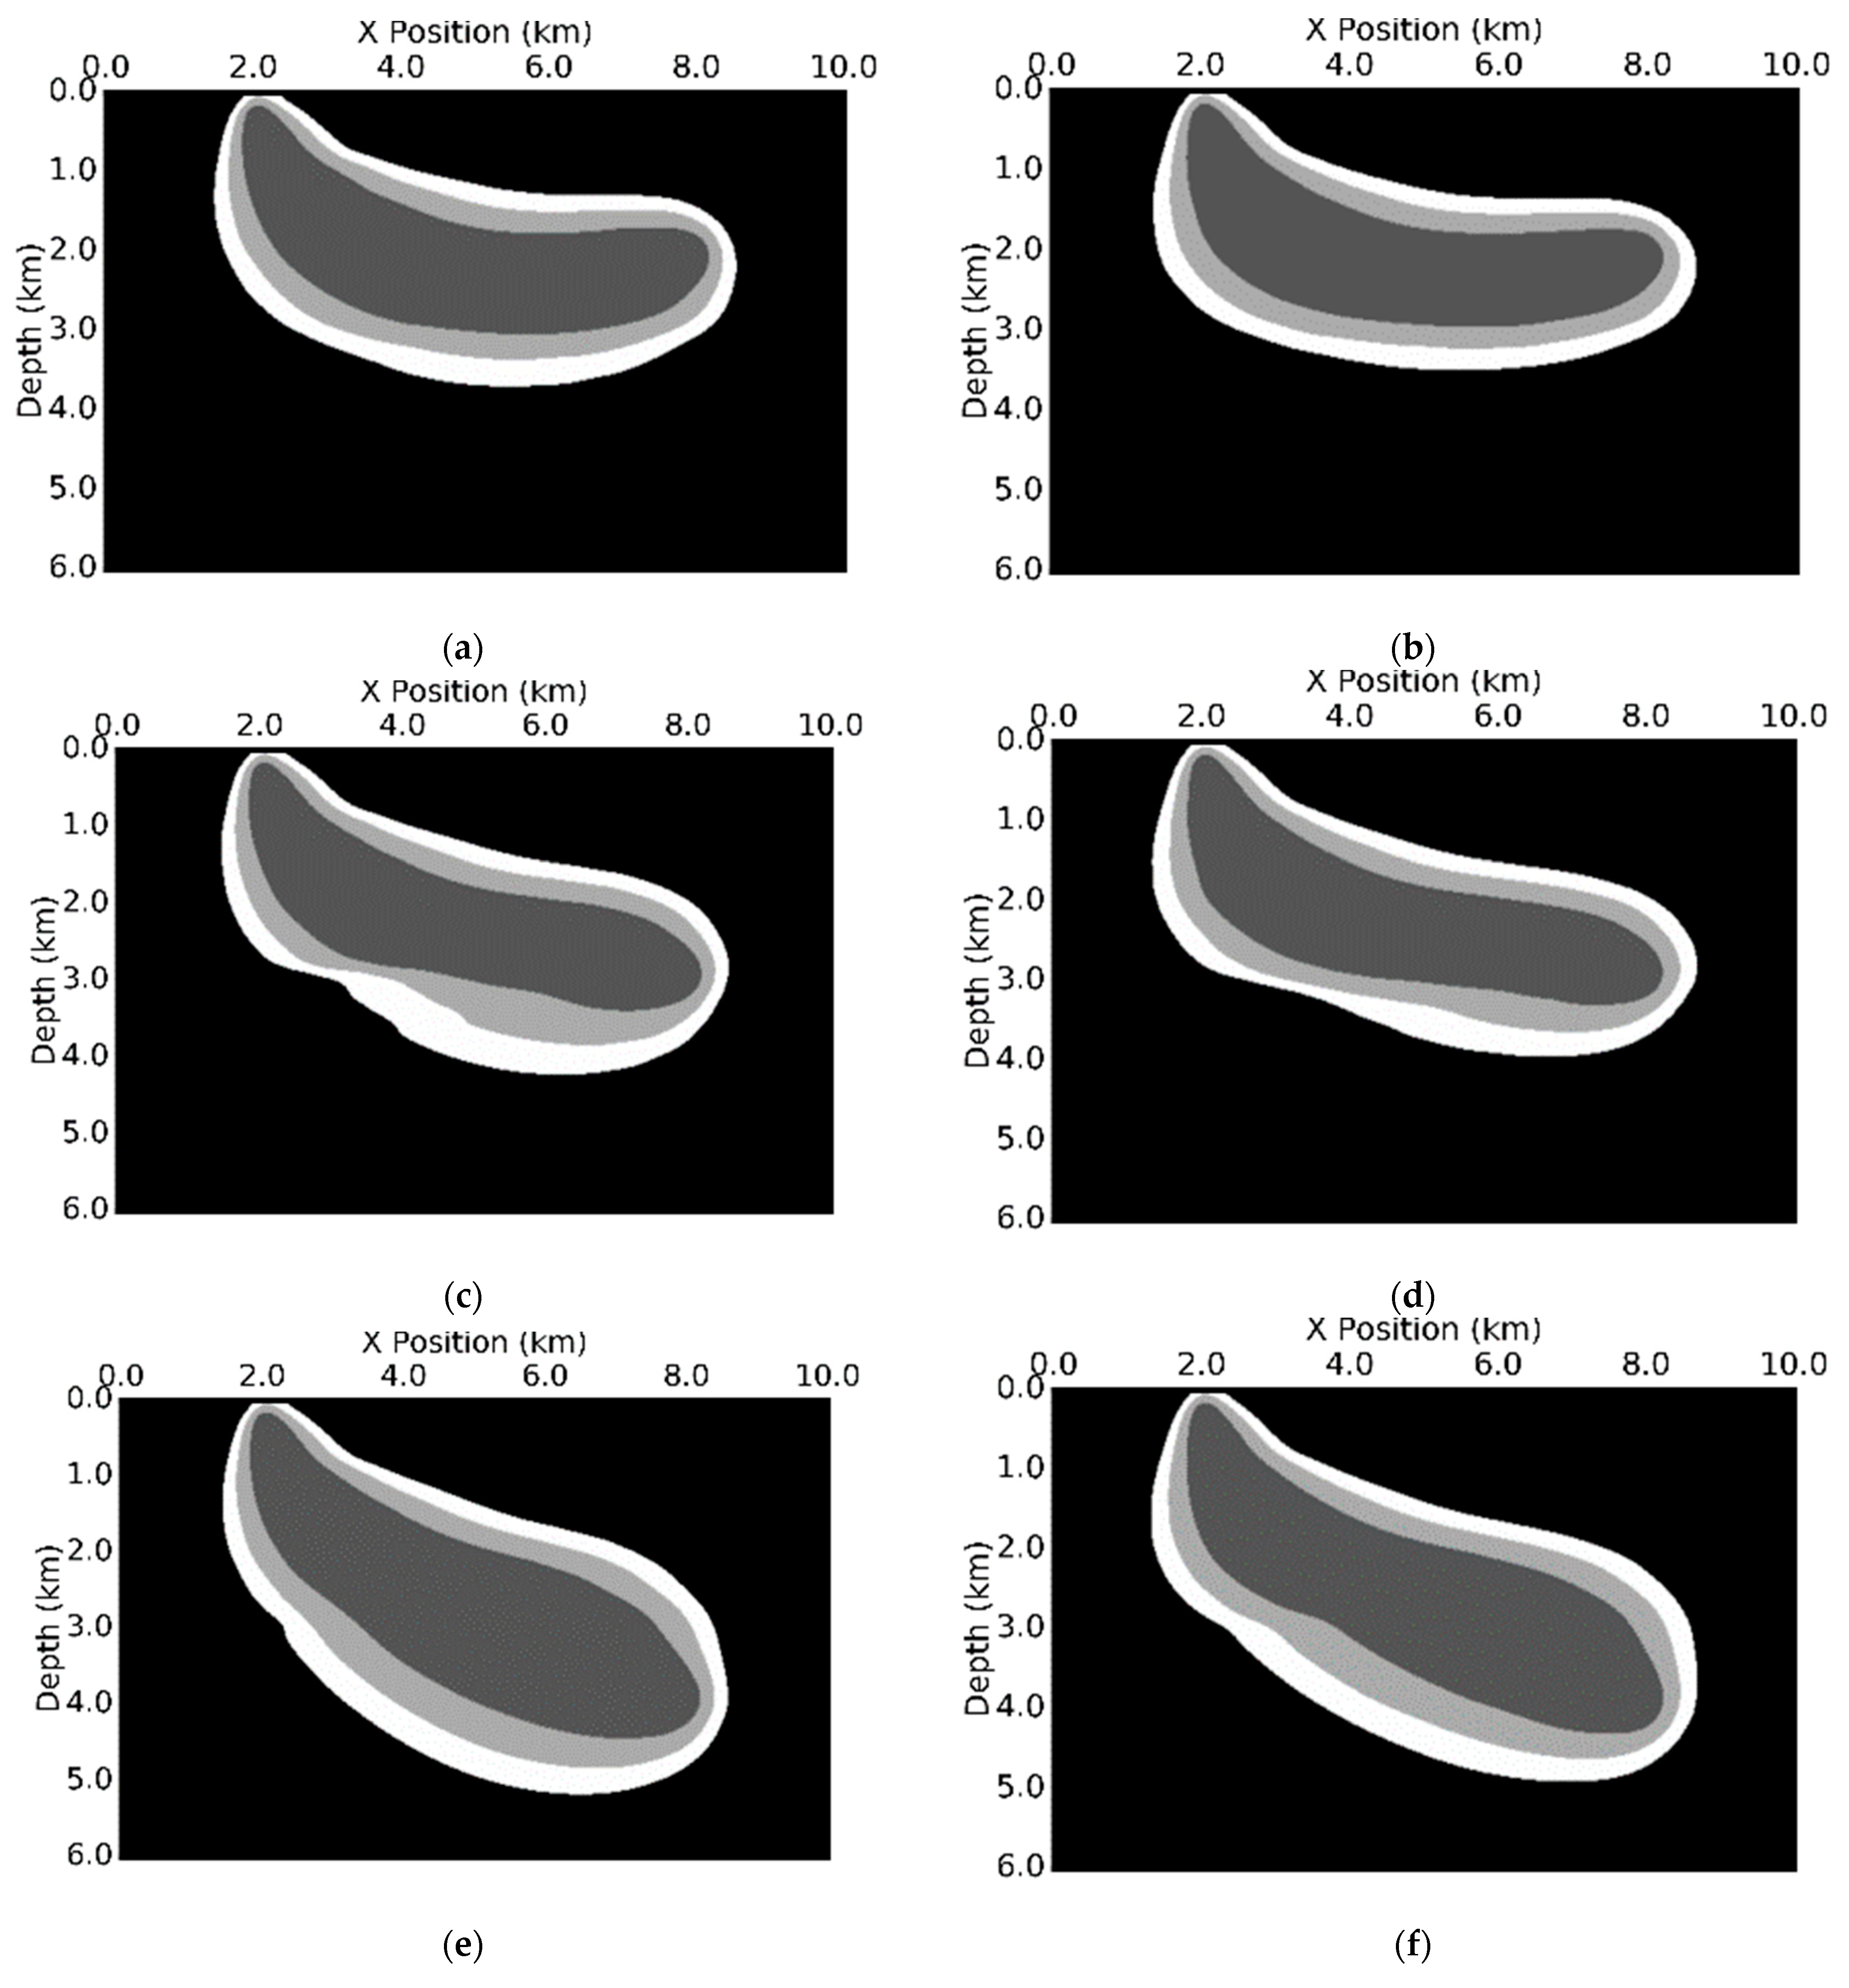
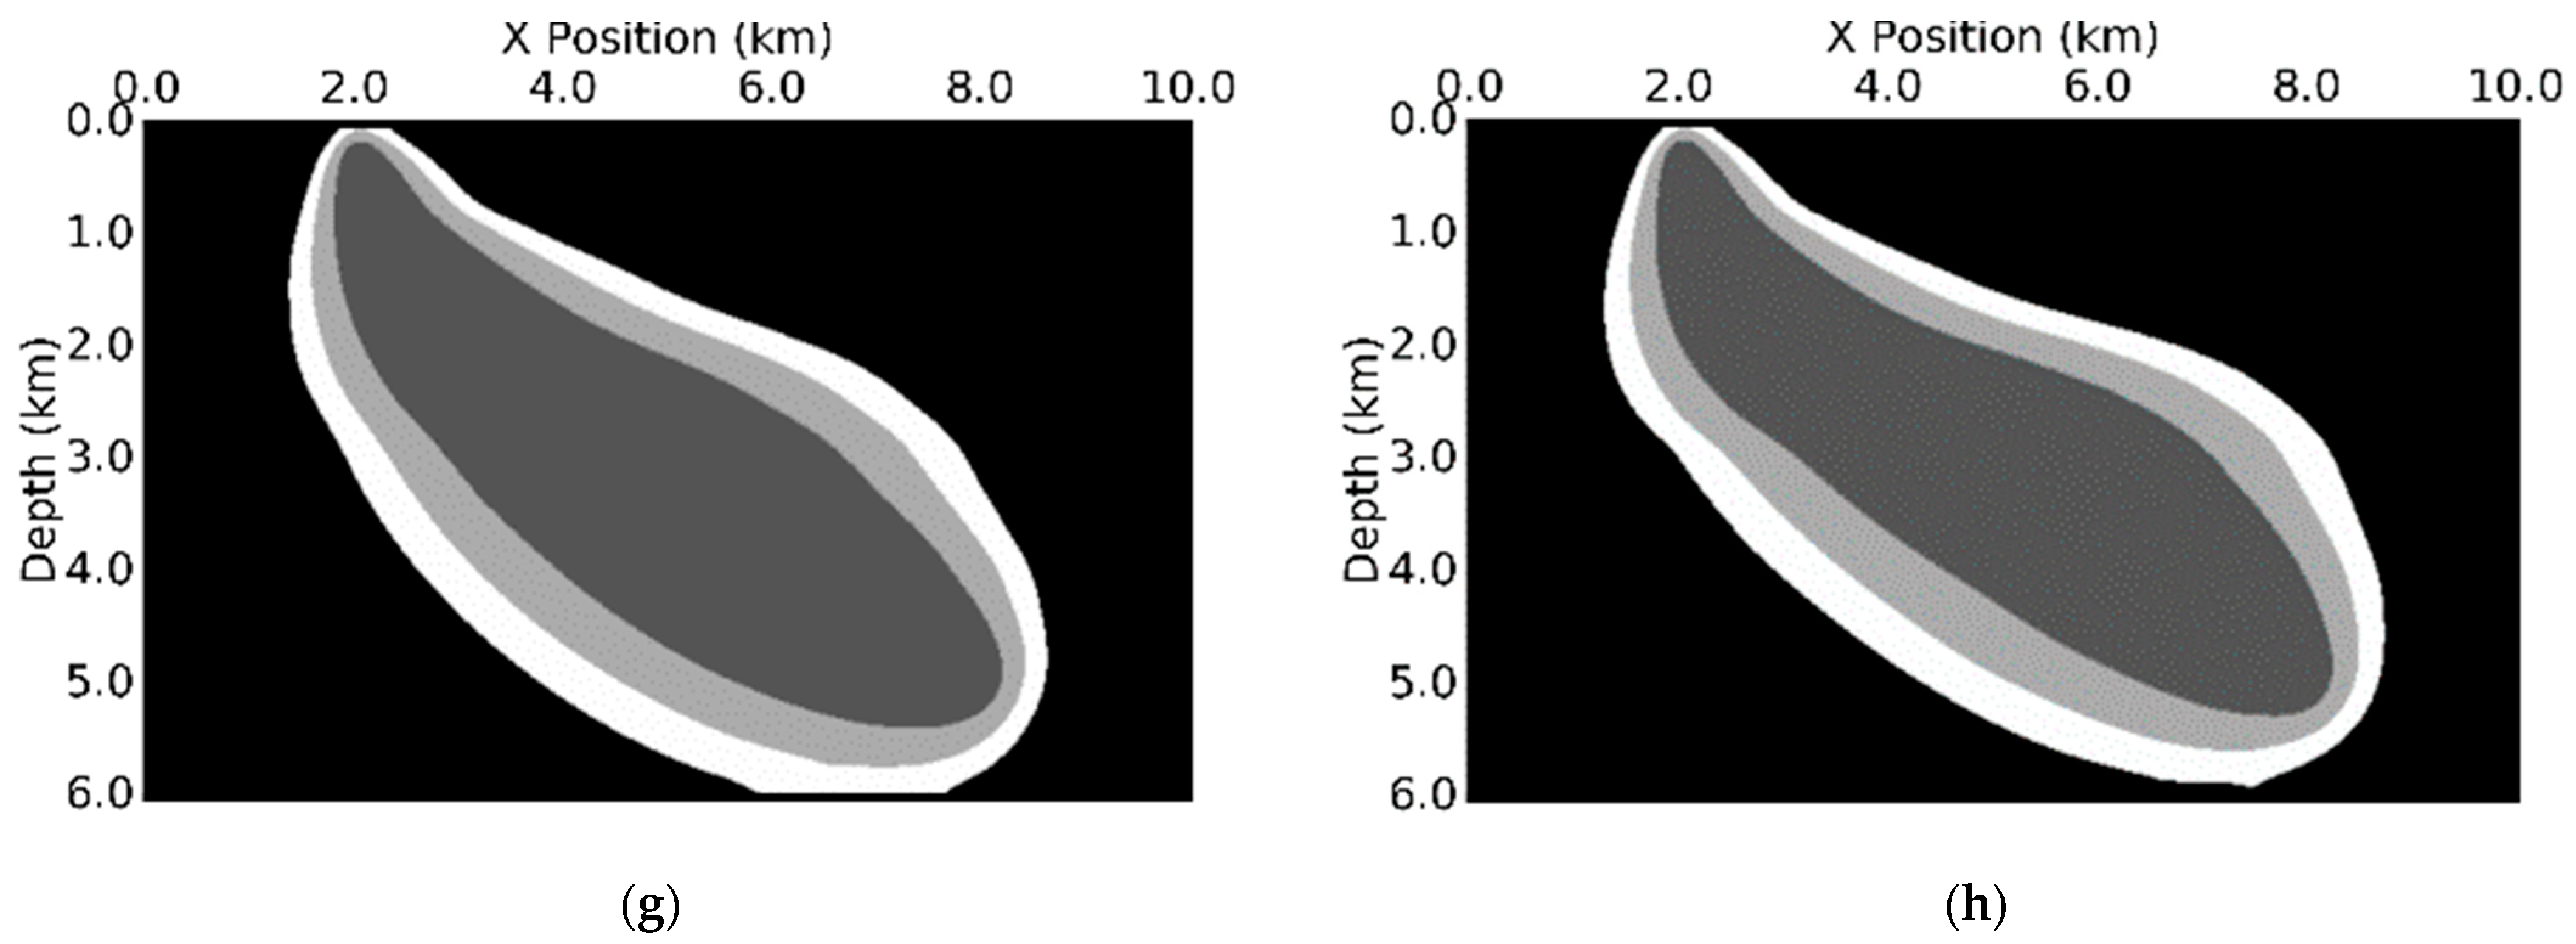
We compute the Fresnel zones and ray-based traveltime sensitivity kernels for both isotropic and VTI media in
Figure 19 and
Figure 20 for P-wave velocity only. The depth profiles of the sensitivity kernels for P-wave velocity are shown in
Figure 21. The Fresnel zones in VTI media are slightly narrower and shallower. Since the energy propagation in VTI media is angle-dependent, the actual distributions of the values of the kernel are also different.
From the depth profiles of the sensitivity kernels in
Figure 21c, we observe a significant difference in the values of the kernels in VTI and isotropic media. This indicates that there are some other factors which impact the traveltime other than the velocity itself. In contrast with the sensitivity kernels for simple models such as those shown in
Figure 2 and
Figure 10, where only one single arrival exists between one source-receiver pair, there are multiple wavepaths between one source-receiver pair here. The Fresnel zone (
Figure 4) is defined for each of the wavepaths. The final stacking of all the simple kernels from each wavepath does not show the clear flat valley where the traveltime sensitivity kernels is zeros.
Compared with the raypaths (not shown), the widths of the first Fresnel zones are approximately the magnitude of 1000 m. Therefore, more subtle model perturbations can be experienced by the finite-frequency kernel for one single source-receiver pair and fewer source-receiver pairs are needed for inversion. In contrast with the kernels from ray theory, the finite-frequency kernels contain both positive and negative values, or the wiggles. The wiggle of the kernels (
Figure 21a–c) contributes to the high-resolution inversion results.
Ray theory, due to its explicit representation of the wavefield, can provide clear physical insights. All the qualities can be explicitly formulated. However, ray theory, including dynamic ray tracing, is built on the high-frequency assumption in which plane waves are assumed at the wavefronts which are not valid in areas with strong velocity gradients. In order to see the limitations of the ray theory, we compute the sensitivity kernels for the same source-receiver pairs using finite-difference solutions of the 3D elastic wave equations [
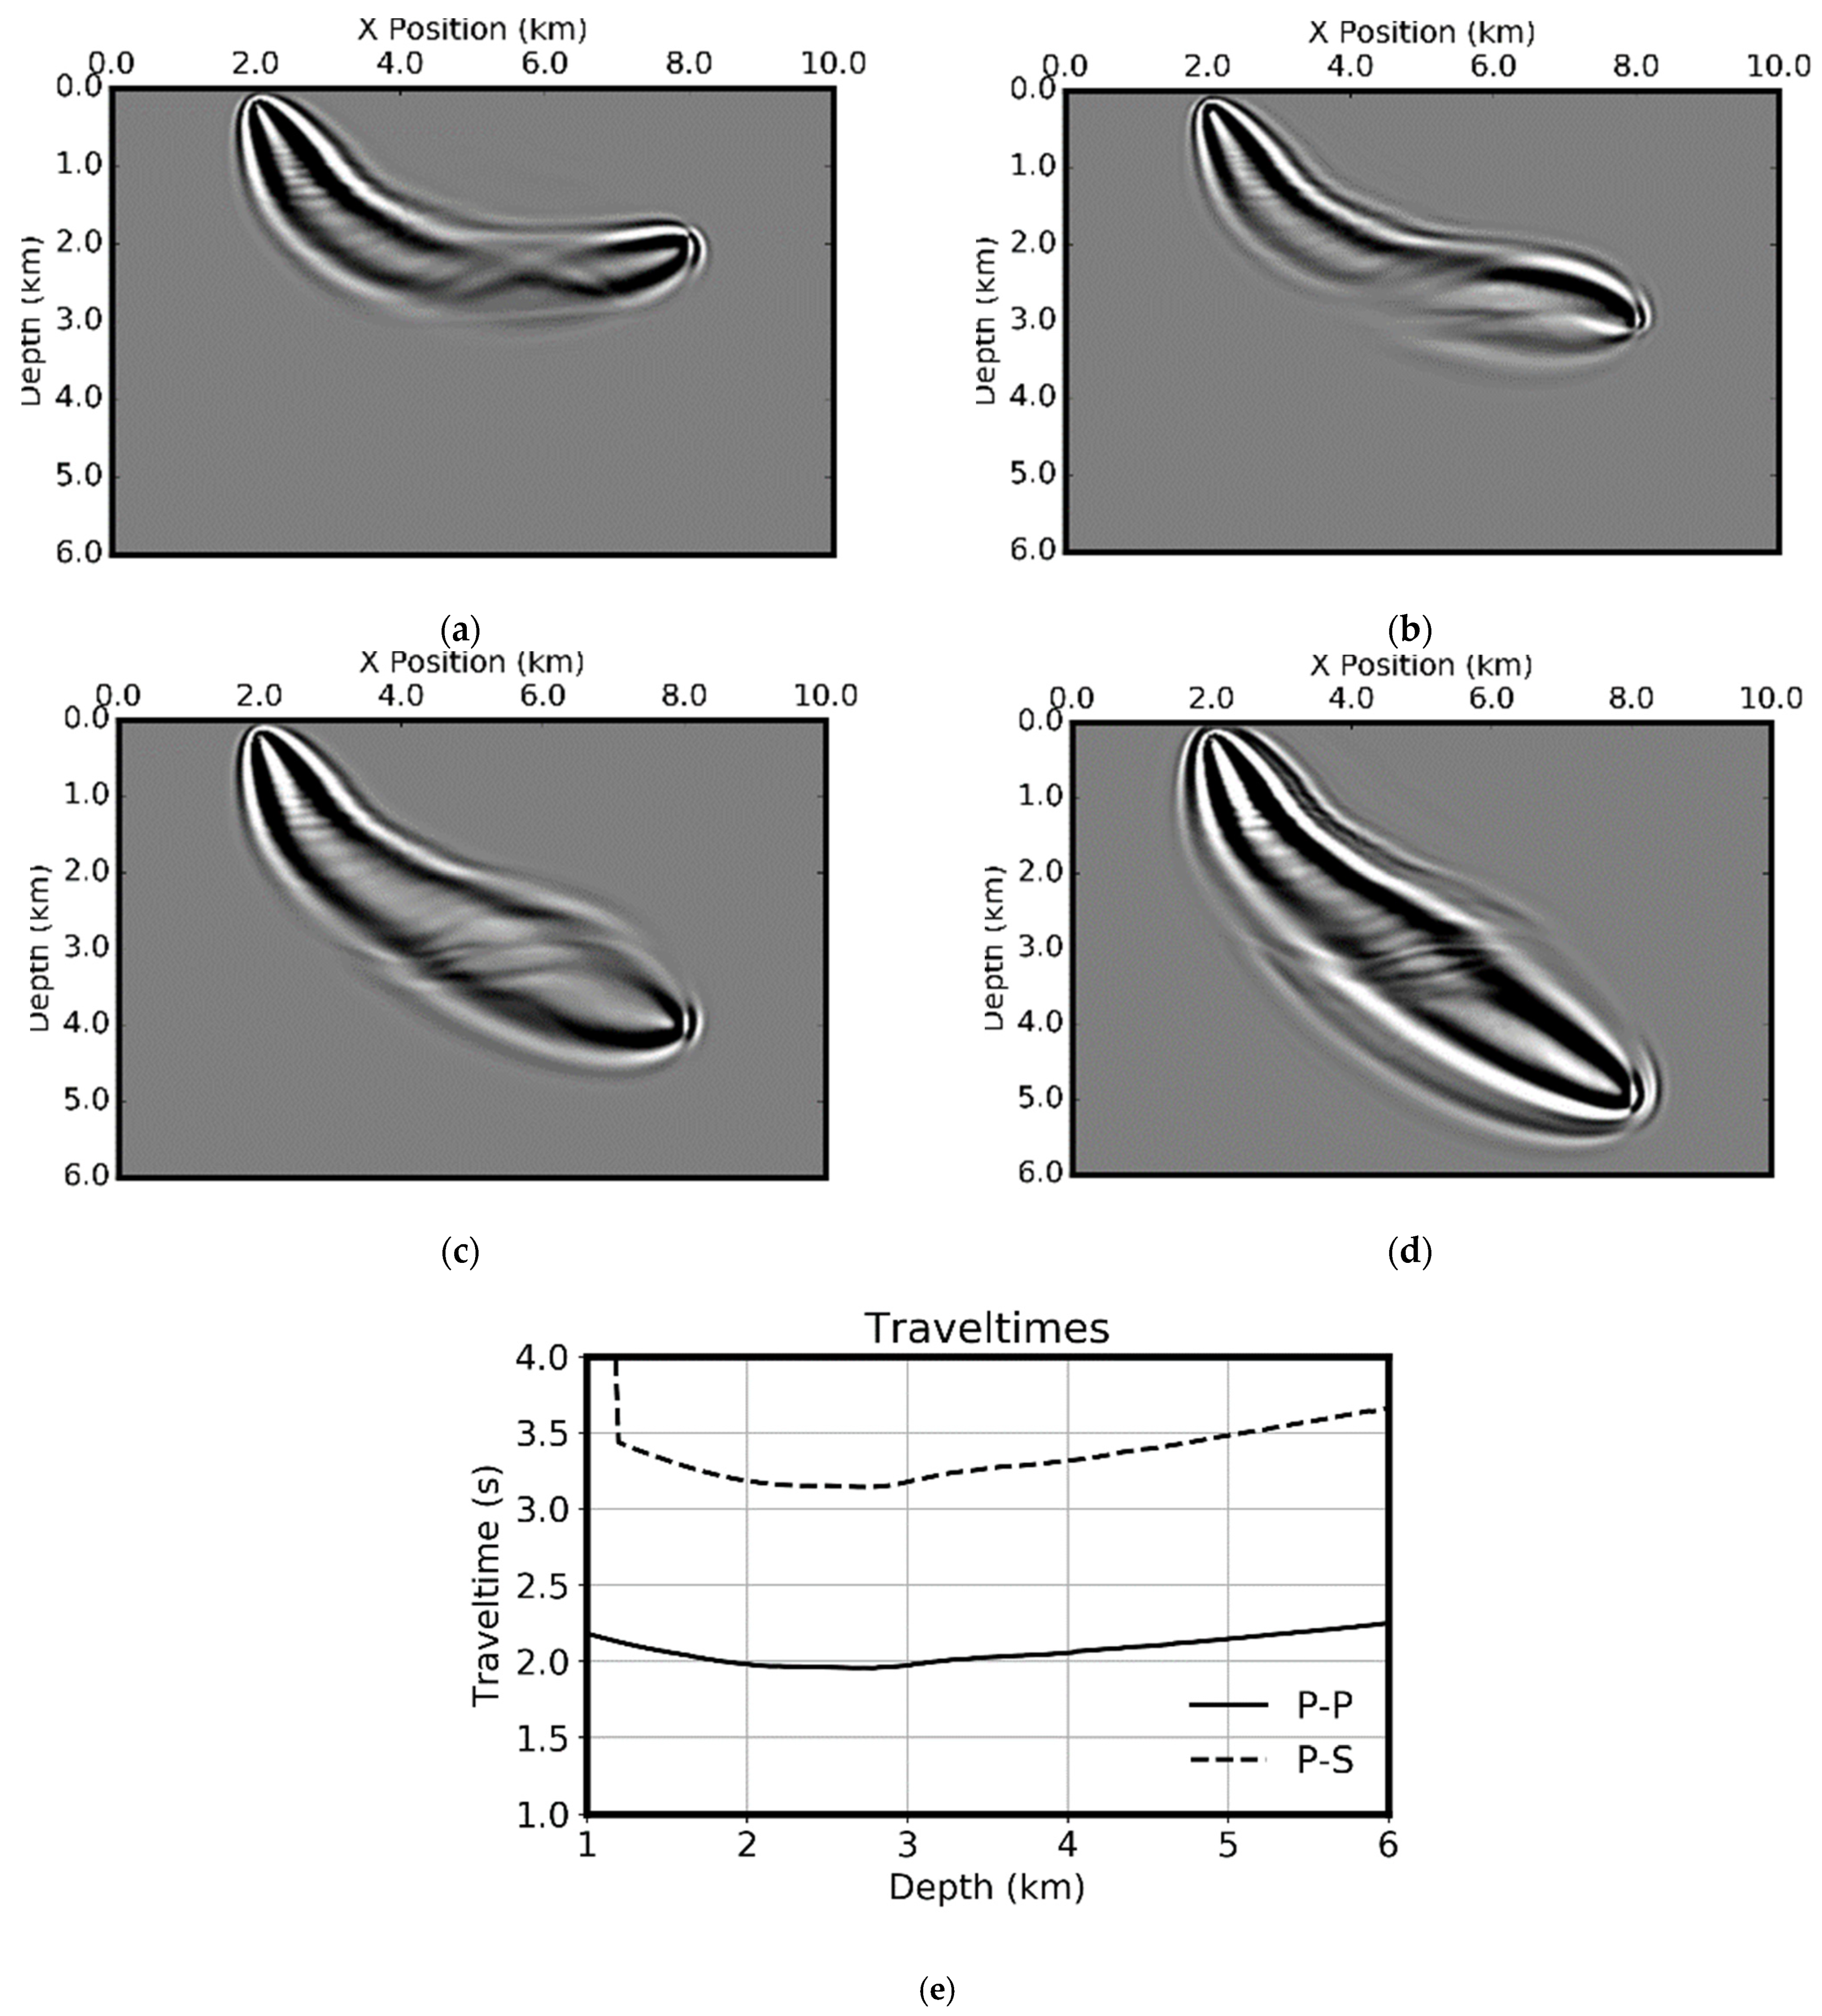
37]. These results are shown in
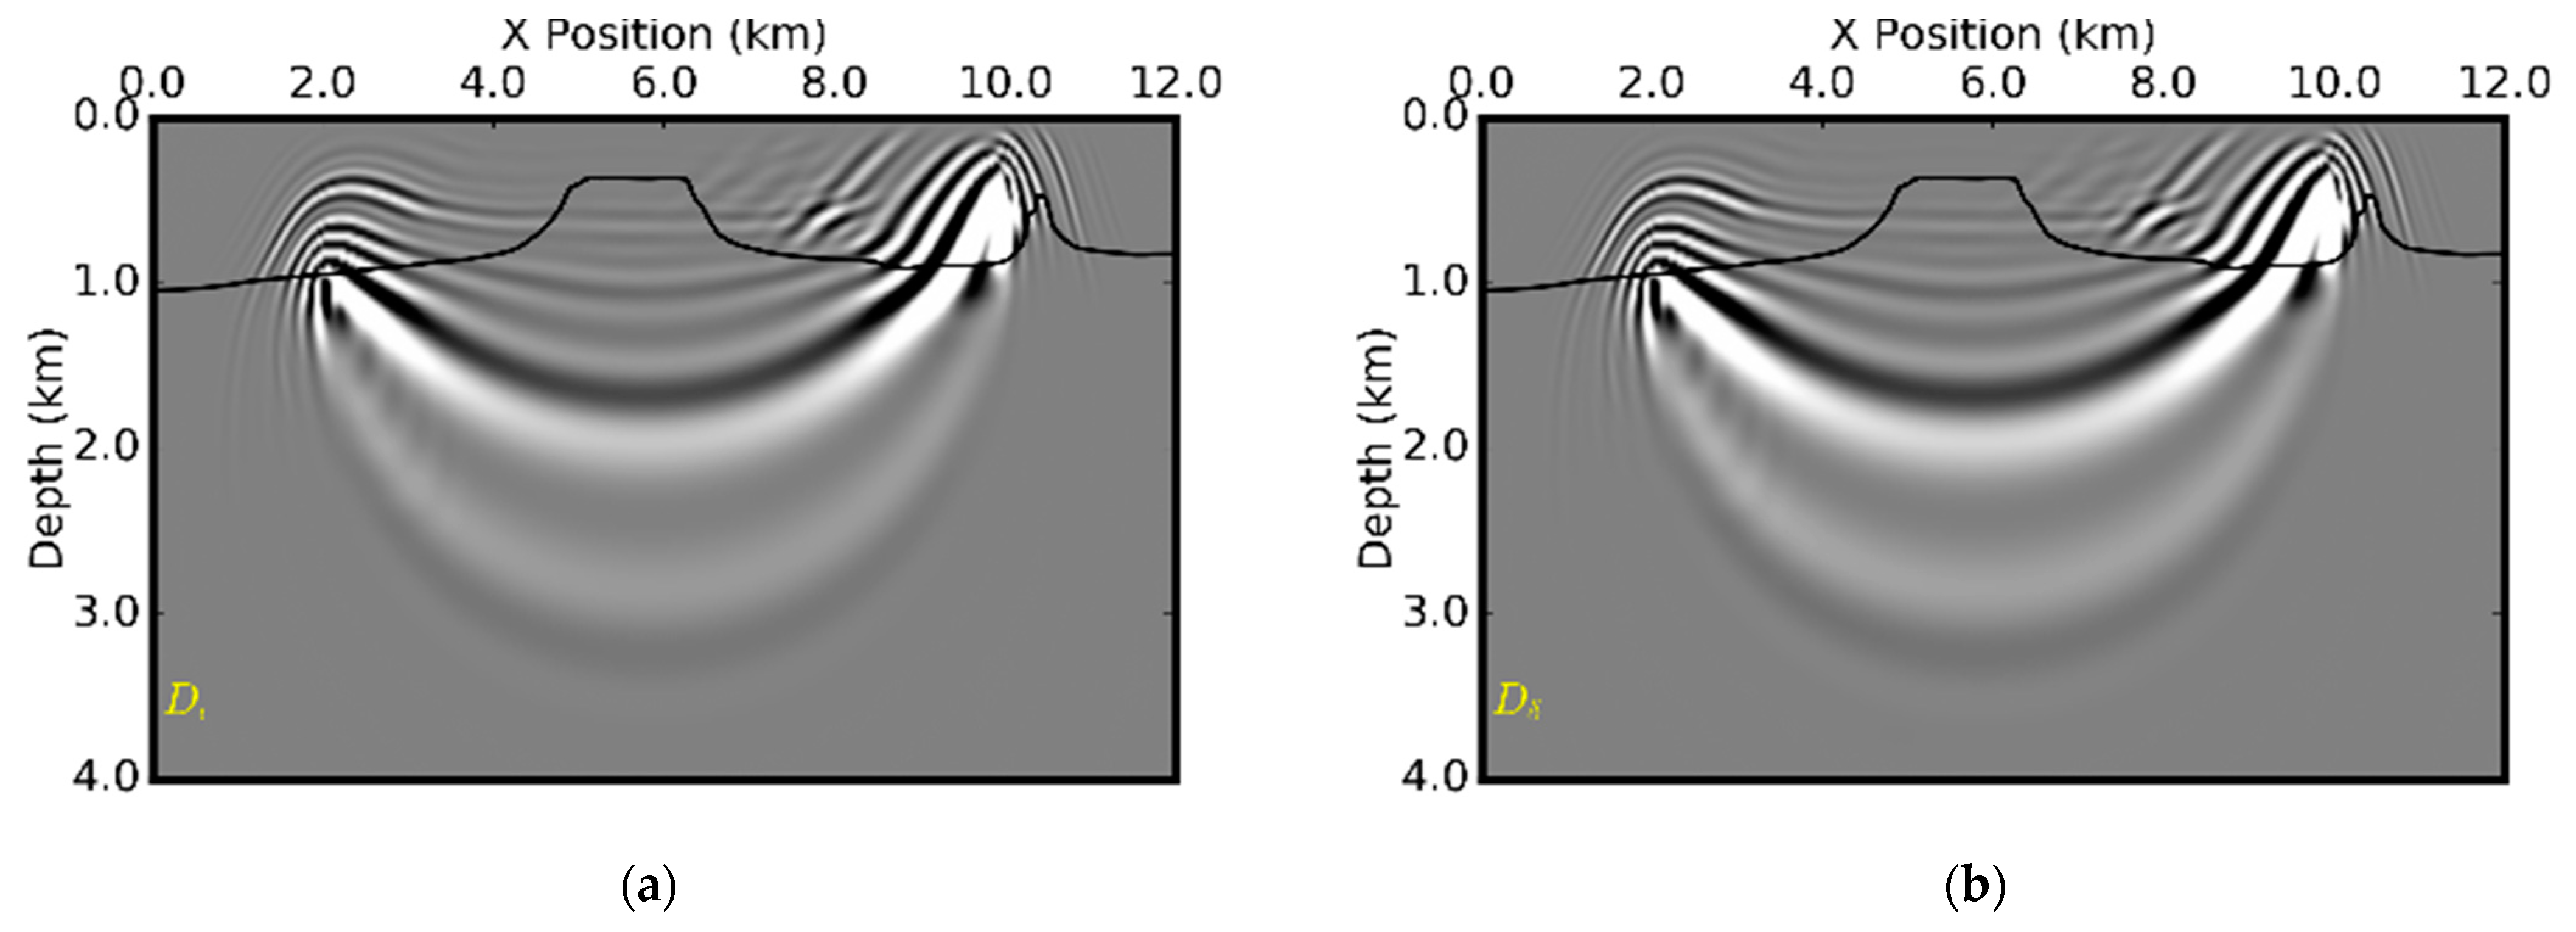
Figure 22 for the P-P first arrivals for pure P-wave velocity and
Figure 23 for the P-S first arrivals for the hybrid velocity. For comparison with the results from ray theory, the S-wave velocity is assumed to be zero and density is assumed to be constant. The hybrid model is the same in the water layer as the original P-wave velocity but replaced with S-wave velocity in the solid. Therefore, the sensitivity kernels in
Figure 22 and
Figure 23 are for P-wave velocity only. The purposes of these demonstrations are two-fold. First, we want to show that, for complicated models, full wave solutions can produce more accurate results of sensitivity kernels than ray theory. Second, we will show that once properly identified and isolated, the sensitivity kernels of both P-P and P-S events can be correctly computed.
Figure 23e shows the traveltime for P-P and P-S arrivals.
Comparing the sensitivity kernels computed using the full wave equation with those from ray theory, we can see that the full wave equation leads to a much higher resolution. This is partially due to the smoothing of the velocity model used for ray tracing, but mainly because the full wave equation method can simulate all the modes of wave propagation including not only primary reflections, but also diffractions from small anomalies, reverberations between layers, and also head waves. Secondly, the sensitivity kernels for the hybrid model are of higher resolution than for the P-wave velocity which has also been seen from the S-wave modulus kernel in elastic media. One potential application of the sensitivity kernels in the hybrid model is to invert the S-wave velocity of the geobodies, such as salt with high impedance contrasts, with their surrounding sediments [
50].
10. Discussion
The computation of sensitivity kernel is critical for the inversion of the media properties (Equation (17)). We will discuss the limitations of the proposed theory. We also discuss briefly the factors that impact the accuracy of kernels and computation performance from practical point of view.
The proposed method and its numerical implementations are full 3D and can be applied to any types of target media. Therefore, once the perturbation of the wavefield with respect to the media property can be formulated, the kernel for that media property can be derived. The numerical inversion depends on both the computations of the kernels and on the accuracy and reliability of the traveltime residuals.
The traveltime kernel is computed based on the types of events picked [
42]. For example, P-wave velocity kernels should be computed for the P-wave events. For a trace which contains events from multiple wave paths, each event needs to be used separated. The cost of the inversion is proportional to the number of sources, number of receivers and number of events per trace. Therefore, large number of simulations for all events are needed. The computation cost is high if full numerical method is used. In this case, dynamic ray-tracing based numerical implementation is preferred [
16]. For complicated geological models such as salt bodies, a clear isolation of events and their modes may be not possible. Therefore, this approach can be used for low frequency component model building in the sediment basin and for imaging purposes.
The picks of the traveltime or traveltime residual has critical impacts on the inversion. During the inversion of media properties for imaging, reliability is more important than accuracy. Since the picking of traveltime is beyond the scope of this study, interesting readers can refer to chapter 7 of [
51].
For geological settings with strong lateral variations or near surface complexities, traveltime-based inversion suffers from low-resolution issue. In these cases, methods which are more sensitive to the frequency contents should be used since they use all the information including traveltime, phase and amplitude. For an OBN example using finite-frequency traveltime, see [
21]. For the impacts of frequency contents and acquisition geometry in an acoustic media, see [
52].
Geometrical element (space dependent media properties) is one of the aspects of the complexities in the subsurface. Another dimension of complexity is caused by the physics of which anisotropy (angle dependent media properties) which is the main topic in this paper. Some practical issues related to the simplification of anisotropy have been discussed in the workflow section.
Viscoelasticity (frequency dependent media properties) must also be considered during wave simulation and inversion [
34,
41,
53]. Viscoelastic seismic modeling is able to produce better matchings with the field data and viscoelastic imaging and inversion with absorption and dispersion correction can recover the subsurface reflections and properties better than pure elastic theory [
53,
54].
This paper focuses on the geophysical aspects of the properties and computation of the sensitivity kernels. With the advances of machine learning and high-performance computing architectures such as GPU clusters, faster and more accurate methods have emerged for the solutions to more complex problems in which no existing theory formulated. One of the progresses reported is Physics-Informed Neural Networks (PINN) [
55]. PINN overcomes the non-physical issues in traditional neural network by introducing physical laws into the network and is able to seamlessly handle different constraints under a uniform framework. Therefore, more complex problems can be handled, and more accurate and realistic numerical solutions are possible. Similar work can be found in [
56] for the inversion of permeability.
