Article

Gemological Characteristics of Lvwen Stone and Its Color Genesis

1
School of Earth Sciences, China University of Geosciences, Wuhan 430074, China
2
Gemmological Institute, China University of Geosciences, Wuhan 430074, China
3
State Key Laboratory of Biogeology and Environmental Geology, China University of Geosciences, Wuhan 430074, China
4
State Key Laboratory of Geological Processes and Mineral Resources, China University of Geosciences, Wuhan 430074, China
5
Department of Geosciences, University of Cincinnati, Cincinnati, OH 45221-0013, USA
6
School of Jewelry, West Yunnan University of Applied Sciences, Tengchong 679100, China
7
National Gem & Jewelry Technology Administrative Center, Beijing 100013, China
*
Author to whom correspondence should be addressed.
Minerals 2022, 12(12), 1584; https://doi.org/10.3390/min12121584
Submission received: 24 October 2022 / Revised: 24 November 2022 / Accepted: 4 December 2022 / Published: 10 December 2022
(This article belongs to the Special Issue High-Pressure Physical and Chemical Behaviors of Minerals and Rocks)

Abstract

:
“Lvwen stone” is a yellow-green carbonate jade gemstone. In this study, the gemological characteristics and color genesis of Lvwen stone were investigated using conventional gemological testing methods and analytical techniques, such as X-ray diffraction (XRD), Fourier-transform infrared spectroscopy (FTIR), ultraviolet–visible spectroscopy (UV–VIS), laser ablation plasma mass spectrometry (LA-ICP-MS), and scanning electron microscopy (SEM). The chemical composition of Lvwen stone is mainly Ca, with lesser amounts of Mg, Mn, Cu, Zn, Fe, and other trace elements. The rare earth element distribution pattern indicates that Lvwen stone is characterized by MREE depletion and a positive Ce anomaly. The mineralogic composition of Lvwen stone is calcite, and trace-element- and crystal-size-induced colors result in its characteristic banded appearance. The white (or light green) bands consist of comparatively coarse calcite crystals (~100 μm) that are oriented perpendicularly to the band plane, accounting for their poor light transmittance. In contrast, the dark green matrix is composed of cryptocrystalline calcite crystals that are uniform in size (~10 μm) and tightly packed, resulting in superior light transmittance. Lvwen stone has a 6A14E(4D)d-d intra-ion electronic transition absorption band of Fe3+ at ~380–450 nm and a 2E→2T2(2D)d-d intra-ion electronic transition absorption band of Cu2+ at ~580–780 nm. This indicates that both the intra-ion electronic transitions of Fe3+ and Cu2+ give rise to the unique yellow-green color of the material. Lvwen stone is produced by ultra-high-pressure tectonic fluids in a relatively closed, reducing environment, and the green matrix was formed earlier than the white bands.

1. Introduction

Lvwen stone is a yellow-green gemstone, well-known for its banded appearance of alternating green and white layers. It is a type of carbonate jade, otherwise known as “Afghanistan Jade” (a generic term for carbonate jade) in China. According to its color, structure, transparency, and mineral composition, it is a semiprecious gemstone of the same kind as similar specimens from Pakistan. At present, this jade is known to be produced only in Pakistan [1]. Although Lvwen stone is a gem with a beautiful appearance, it is not common in the jewelry market due to its low hardness.
The nature and origin of Lvwen stones have received only limited attention to date. Hyrsl and Jaroslav [1] reported on its color and mineral composition, describing it as a type of green calcite exhibiting “cat’s-eye effect”. However, the coloring mechanism, genesis of the cat’s-eye effect, and chemical composition of Lvwen stone remain enigmatic. In this study, X-ray diffraction (XRD), Fourier-transform infrared spectroscopy (FTIR), ultraviolet–visible spectroscopy (UV–VIS), laser ablation plasma mass spectrometry (LA-ICP-MS), and scanning electron microscopy (SEM) were used for a comprehensive investigation of typical yellow-green Lvwen stone specimens purchased from the Donghai Jewelry Market, Lianyungang city, China. The goals of the present study are (1) to provide insights into the general mineralogy, chemical composition, microstructural characteristics, and spectroscopic features of Lvwen stones, and (2) to determine the origin of color banding, the mechanism of the cat’s-eye effect, and the geological genesis of Lvwen stones.

2. Materials and Methods

2.1. Materials

The three specimens used in this study (S1, S2, and S3) are cabochons, that is, polished but unfaceted gems, with dimensions of ~2 cm (length) × ~1.5 cm (width) × ~0.5 cm (thickness) (Figure 1). Each consists of a dark green matrix with a cryptocrystalline structure, transected by broad, evenly spaced white (or light green) bands that compose the larger part (~60%–70%) of the specimen by volume. The refractive index of all specimens is 1.63. They emit full brightness under a polarizing microscope. These properties indicate that Lvwen stone is a kind of calcite crystal aggregate instead of a single crystal. According to the national standard of the People’s Republic of China (GBT16552-2010), natural gems are divided into three categories: natural gemstones (mineral monocrystals or twin crystals), natural jades (mineral assemblages or amorphous matters), and natural organic substances. Because Lvwen stone is a calcite aggregate, it is assigned to the category of natural jades. By using the net water weighing method, the specific gravity of Lvwen stones was determined to be 2.72. They also have an estimated Mohs hardness of about three (3), which is typical of calcite.
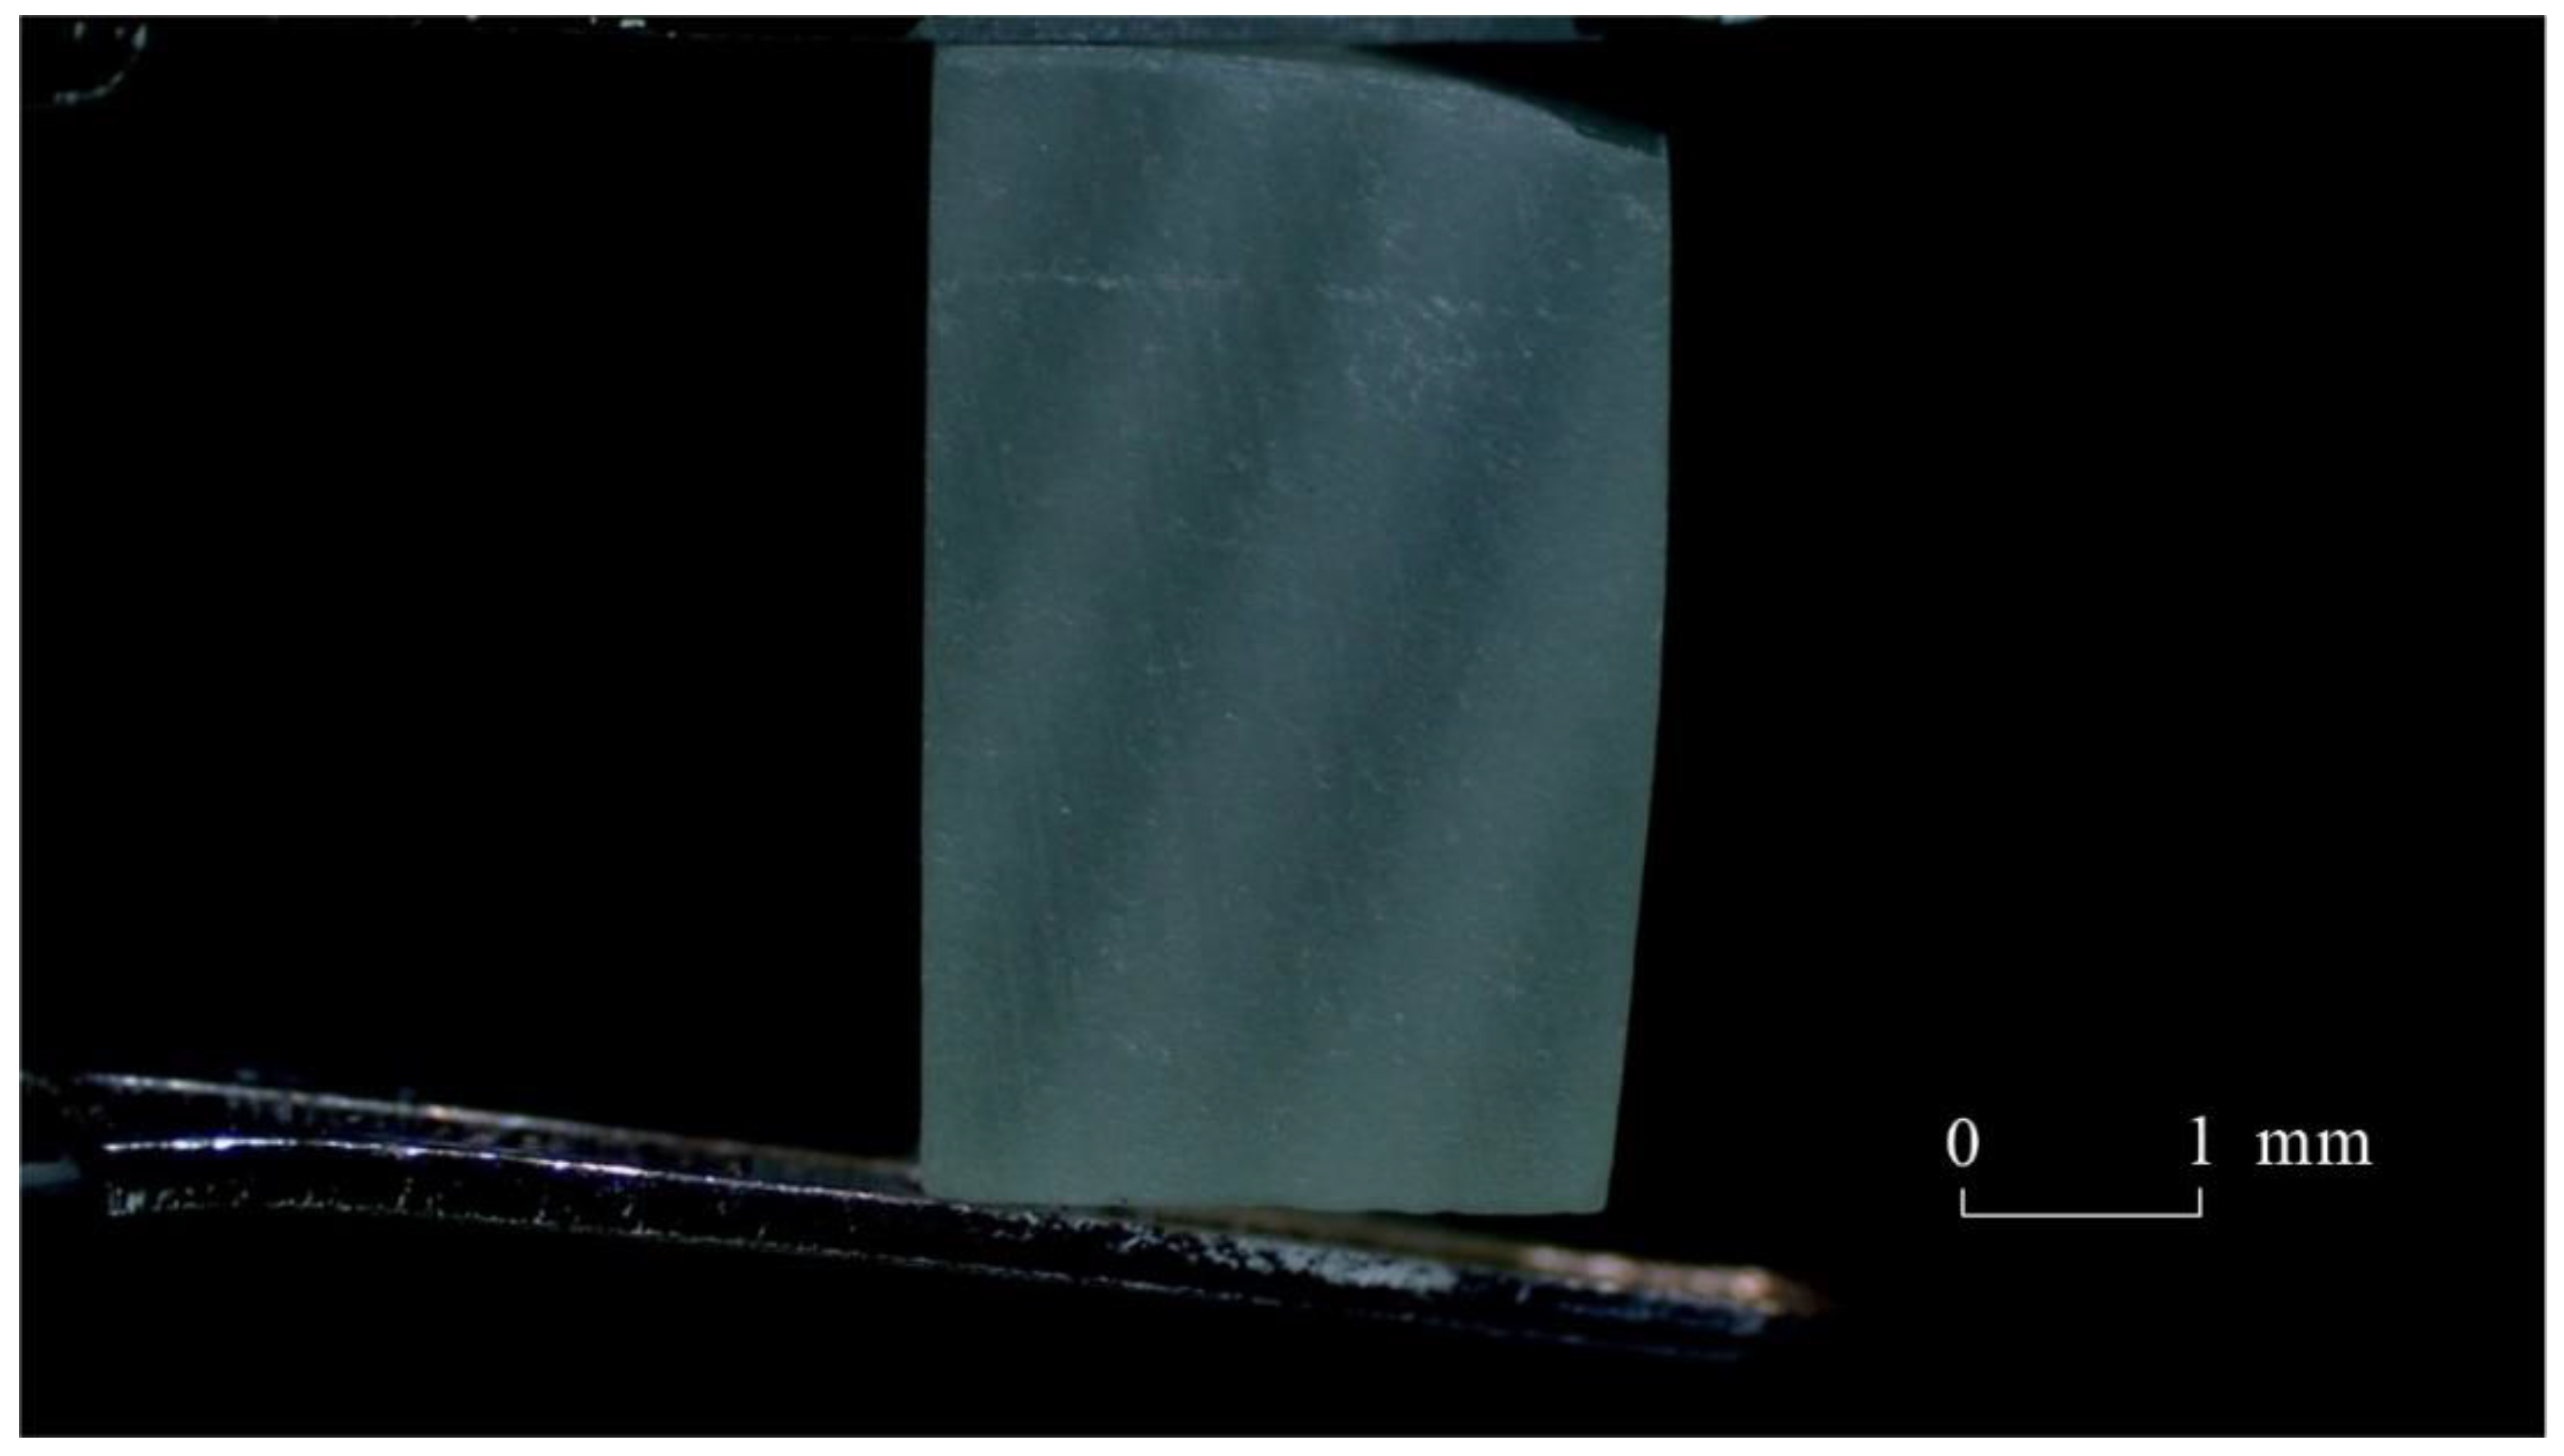
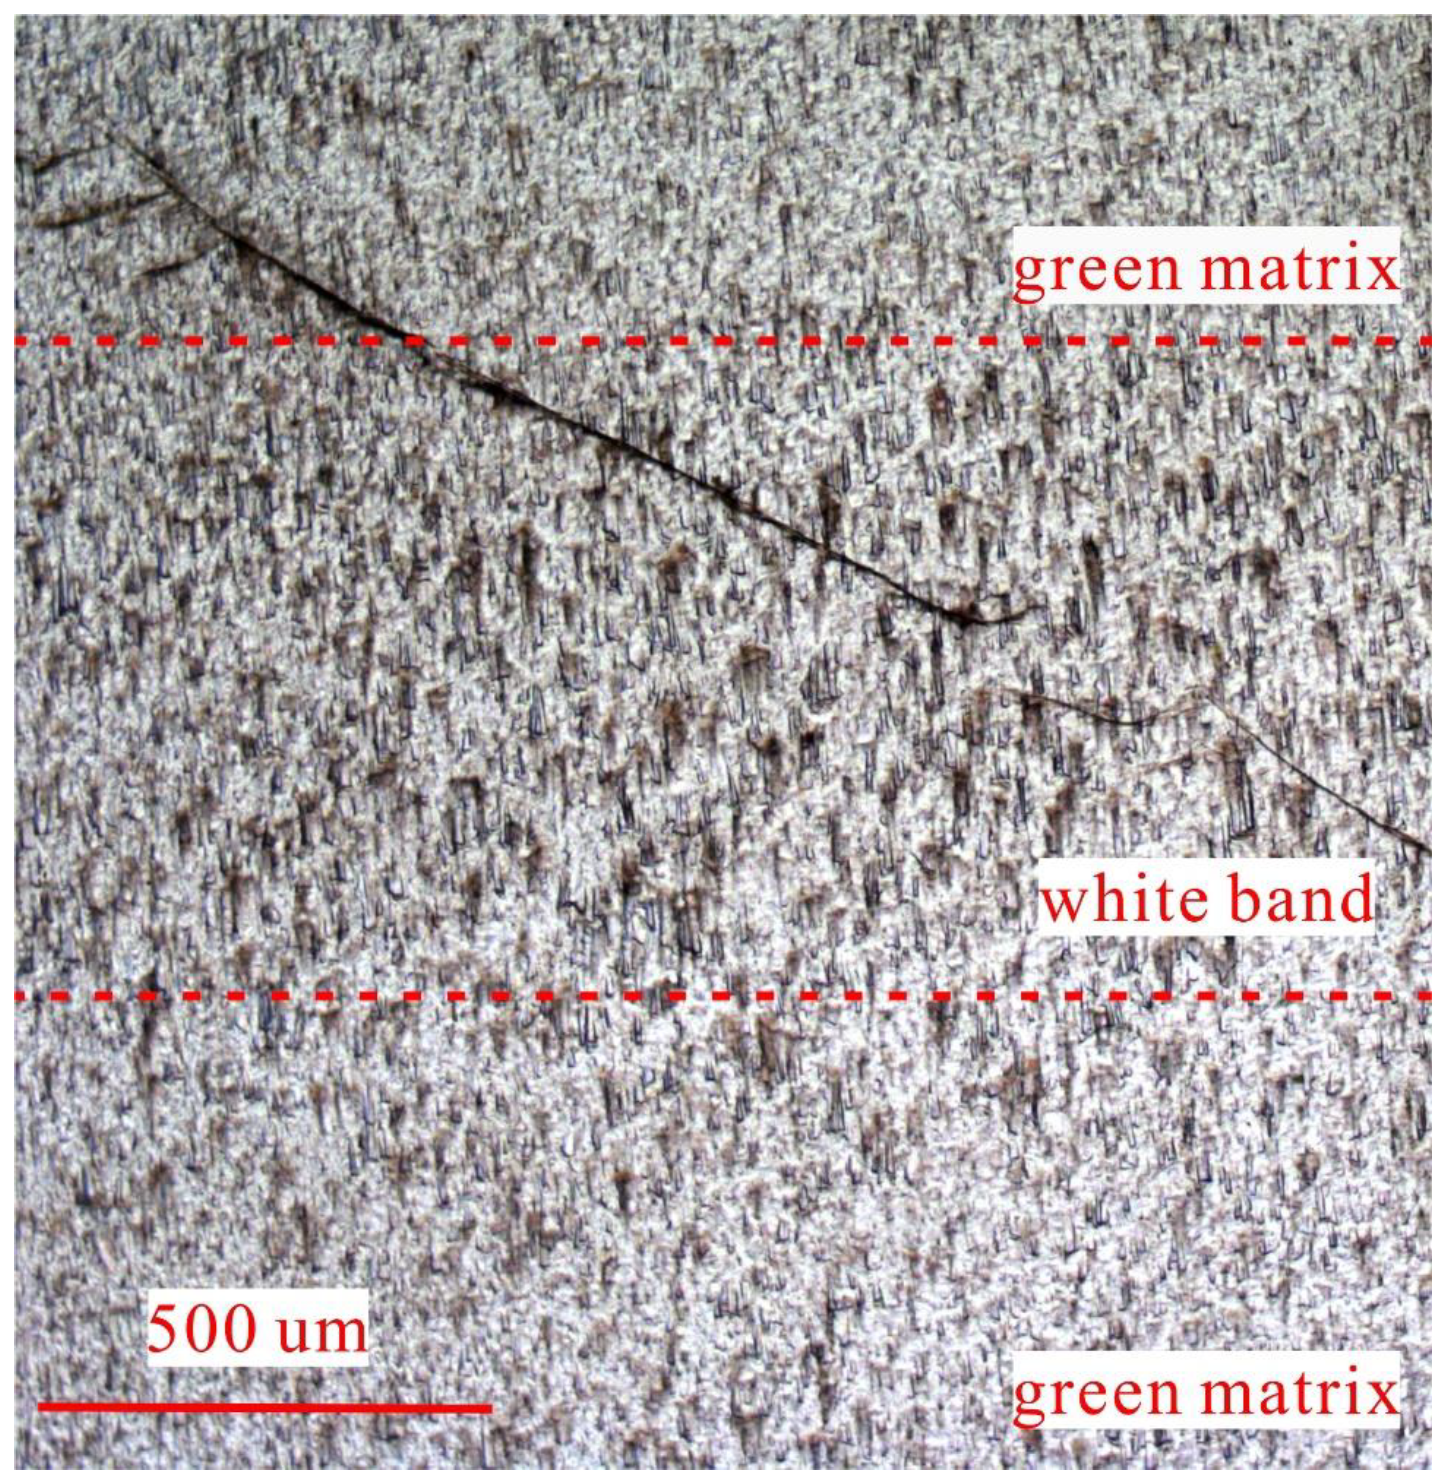
After a cabochon specimen (S1) was cut into a rectangular prism, it was found that the white bands could still be observed (Figure 2). These white bands are regularly distributed, possibly caused by the lack of chromogenic elements, indicating that the banded structure is not produced by the cat’s-eye effect (i.e., chatoyancy, which is due to either a fibrous mineral structure or fibrous inclusions in a mineral). When observed at a low magnification (50×), the green matrix was determined to be microcrystalline, composed of only faintly visible small crystals, whereas the white bands are composed of relatively coarser crystals (~100 μm). The parallel needle-like crystals of the latter are oriented perpendicular to the band planes (Figure 3).

2.2. Specimen Preparation and Testing Methods

2.2.1. Specimen Preparation

Fourier-transform infrared spectroscopy (FTIR), ultraviolet–visible spectroscopy (UV–VIS), and laser ablation plasma mass spectrometry (LA-ICP-MS) were conducted by placing the cabochon specimens of Lvwen stone directly on the analytical stage of these instruments. The specimens were then gold-coated and analyzed by scanning electron microscopy (SEM). Furthermore, a portion of the specimen S1 was ground to powder in an agate mortar to a 200-mesh fineness. The powdered sample was then compacted in a glass holder for X-ray diffraction (XRD) testing.

2.2.2. X-ray Diffraction Analysis

A Panalytical X’Pert PRO DY2198 diffractometer at the State Key Laboratory of Geological Processes and Mineral Resources, China University of Geosciences (Wuhan, China), was utilized to analyze the specimen. The X-ray diffraction (XRD) patterns were recorded with Ni-filtered Cu-Kα radiation (40 kV, 40 mA) and the following testing environment: a temperature of 20 °C and 65% RH with the pattern being recorded from 3° to 64° (2Θ) at a scan rate of 8°/min and a step size of 0.02.

2.2.3. Scanning Electron Microscope

A Quanta 200 environmental scanning electron microscope (SEM) at the State Key Laboratory of Geological Processes and Mineral Resources, China University of Geosciences (Wuhan, China), was used for SEM analysis of the specimens. This analysis was performed under the following conditions: secondary electron imaging, accelerating voltage of 20 kV, and beam current size of ~1–2 nA.

2.2.4. Fourier-Transform Infrared Spectroscopy

Fourier-transform infrared spectroscopy (FTIR) analysis of the Lvwen stone specimens was carried out on an IS50 FTIR spectrometer using the reflection method (equipped with a PIKE Technologies UpIR diffuse reflection accessory) at the Faculty of Materials Science and Chemistry, China University of Geosciences (Wuhan, China). The reflection spectrum was further corrected using the Kramers–Kronig transformation function of OPUS 7.5 to eliminate the effect of optical dispersion on the reflection spectrum. The operating conditions of the FTIR analysis were as follows: 32 scans/min, 4 cm−1 resolution, and ~400–4000 cm−1 scan range. A thorough washing of the specimens with alcohol before the IR analysis was undertaken to exclude contaminants from prior handling.

2.2.5. Laser Ablation Inductively Coupled Plasma Mass Spectrometry

An Agilent 7700e laser ablation inductively coupled plasma mass spectrometer (LA-ICP-MS) at the Wuhan Sample Solution Analytical Technology Co. Ltd., Wuhan, China, was used to measure the major and trace element concentrations of the Lvwen stone specimens. Detailed operating conditions for the laser ablation system and the ICP-MS instrument and data reduction were the same as described by Zong et al. [2]. A GeoLasPro laser ablation system that consists of a COMPexPro 102 ArF excimer laser (wavelength of 193 nm and maximum energy of 200 mJ, (Agilent Technologies Inc., Santa Clara, CA, USA) and a MicroLas optical system was utilized to perform laser sampling, whereas an Agilent 7700e ICP-MS instrument was used to acquire ion-signal intensities. Helium was applied as a carrier gas, whereas argon was used as the make-up gas and mixed with the carrier gas via a T-connector before entering the ICP-MS. A wire signal smoothing device was included in this laser ablation system [3]. The spot size and frequency of the laser were set to 32 µm and 8 Hz, respectively. The primary standard for major and trace element calibrations was SRM610, and the secondary standards were four USGS materials (MACS-3, BHVO-2G, BCR-2G, and BIR-1G). The latter were treated as unknowns [4]. Each analysis incorporated a background acquisition of approximately 20–30 s, followed by 50 s of data acquisition from the specimens. Off-line selection and integration of background and analyzed signals, time-drift correction, and quantitative calibration for major and trace element analyses were performed by an Excel-based software (ICPMSDataCal 12.2) [4].

2.2.6. Ultraviolet–Visible Spectroscopy

A UV-5000 ultraviolet–visible (UV–VIS) spectrophotometer at the Gemological Institute of the China University of Geosciences (Wuhan, China) was used to undertake UV–VIS absorption spectroscopy. To test the Lvwen stone specimens, the reflection method was applied over a test range of ~100–1200 nm using a scan speed of 800 nm/min and a resolution of 1 nm.

3. Results

3.1. X-ray Diffraction Analysis

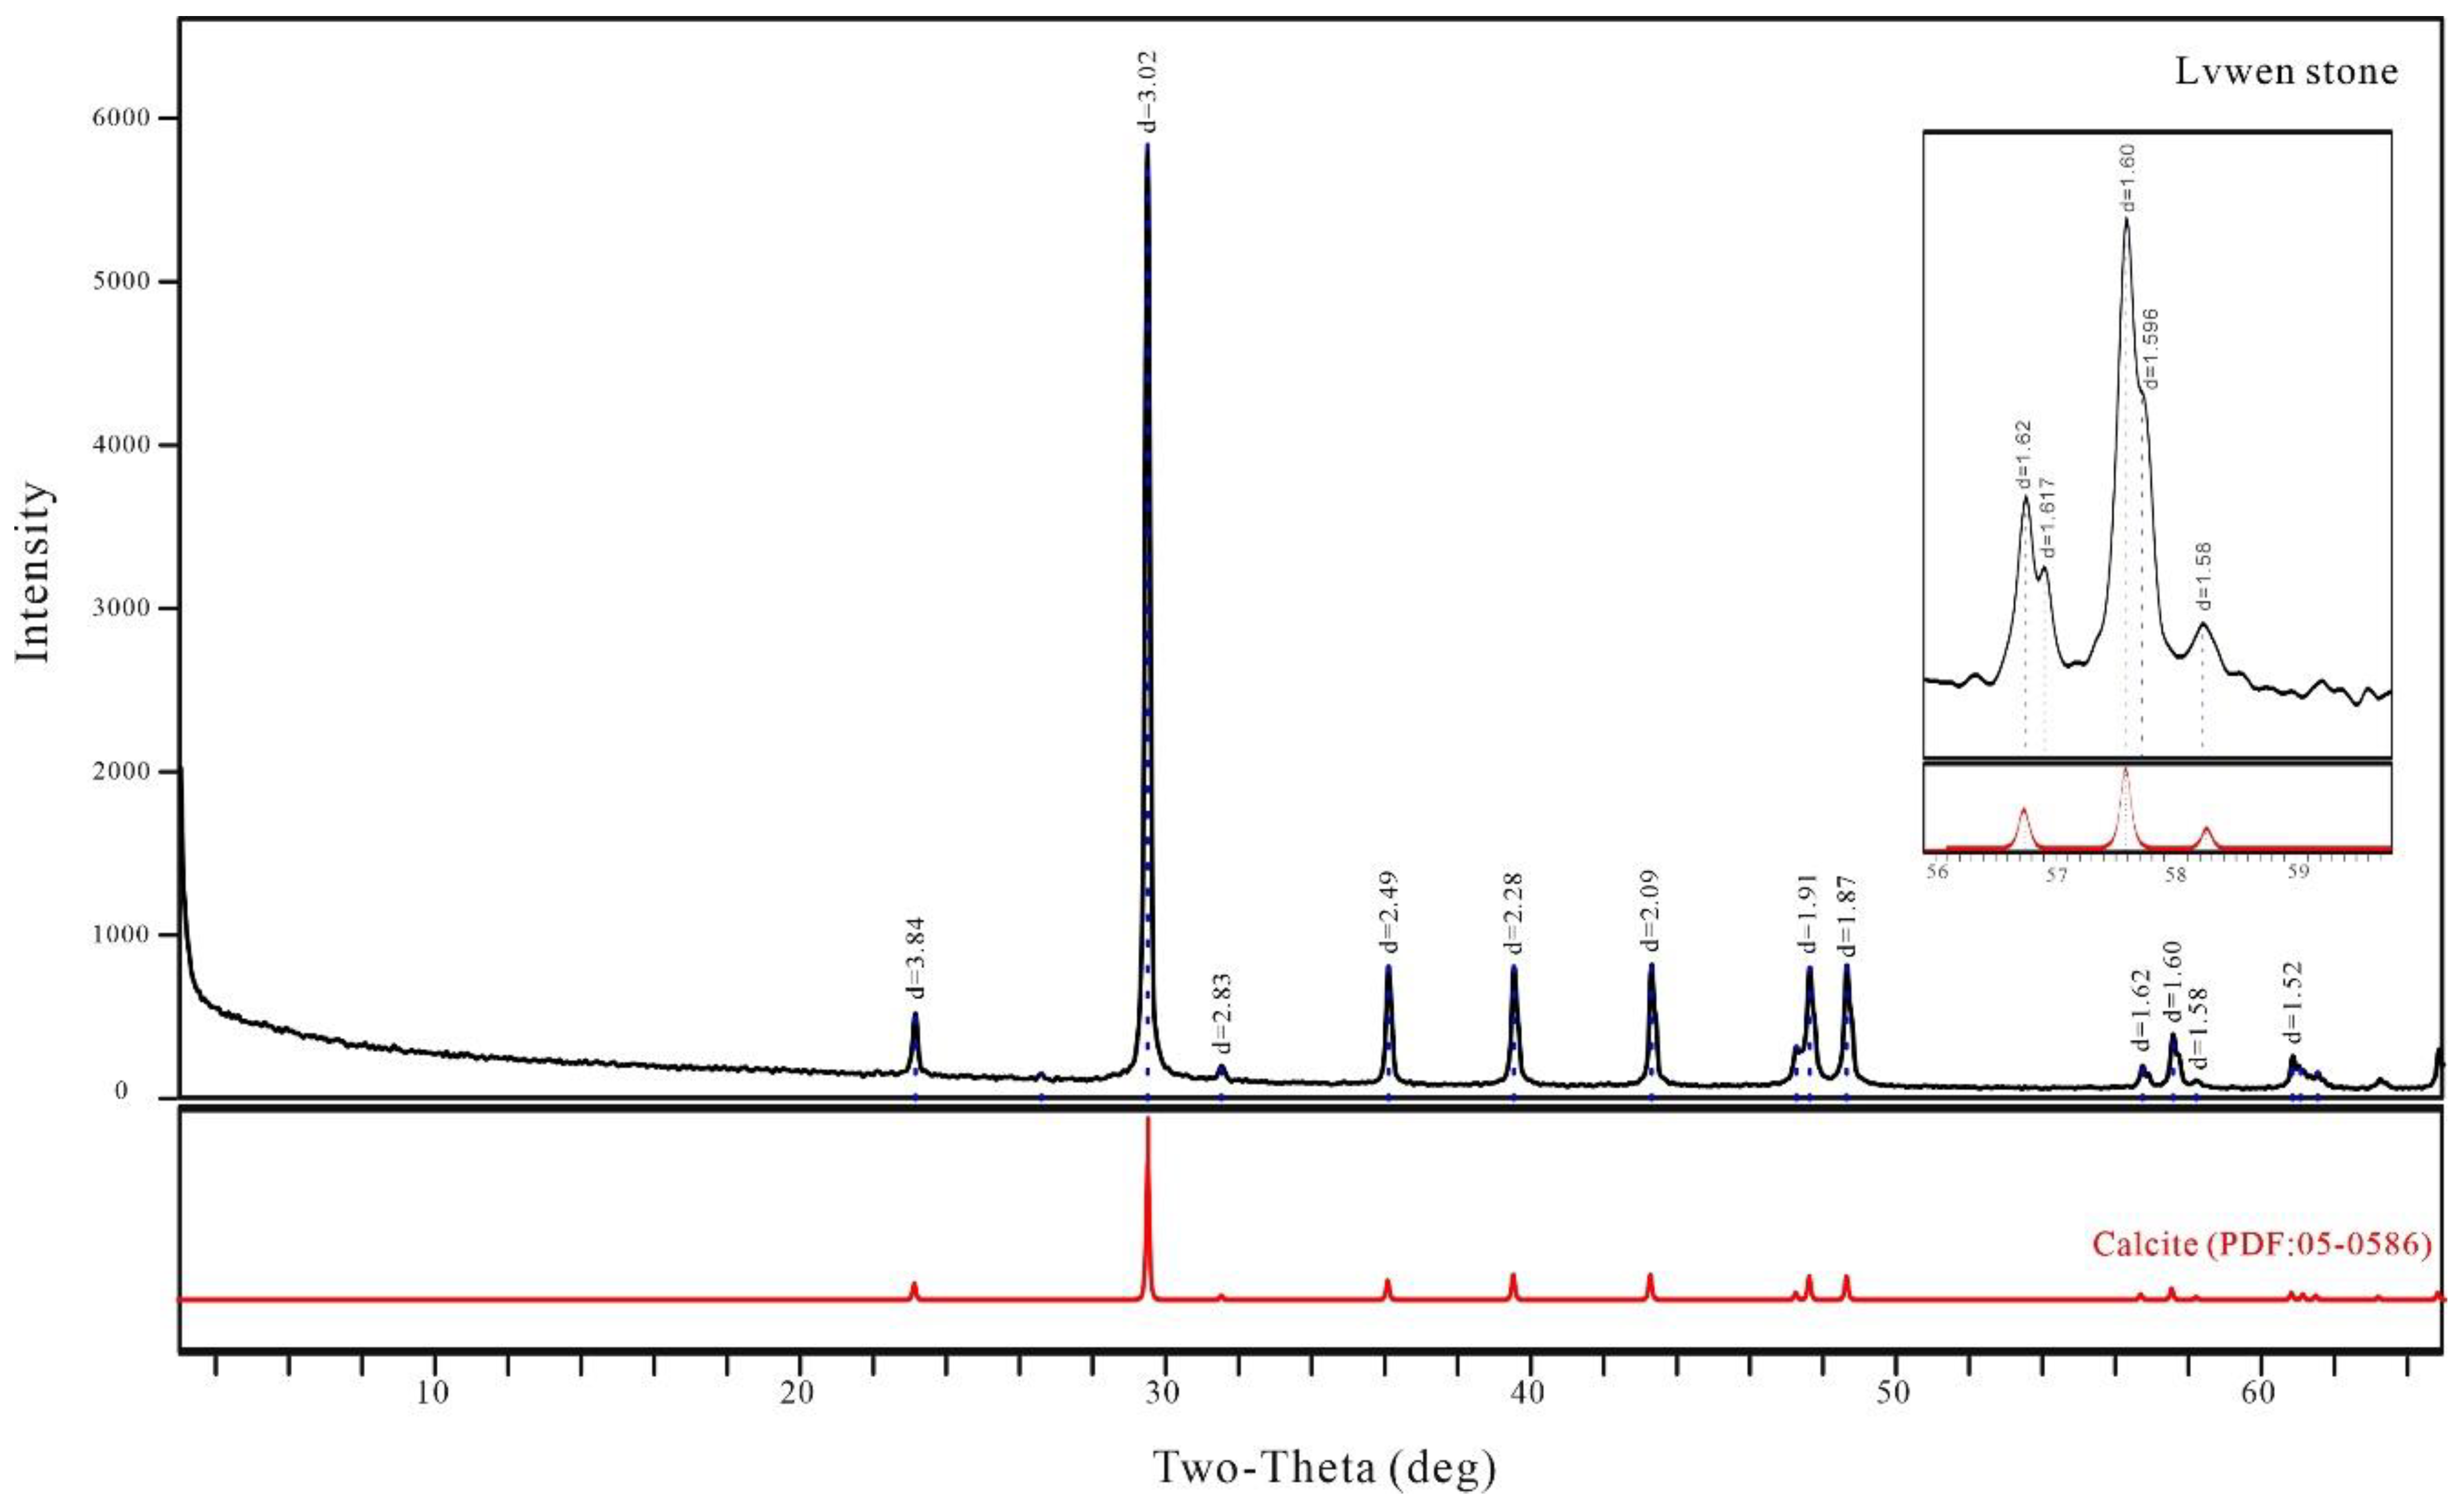
The X-ray diffraction analysis of S1 shows that the main diffraction peaks of Lvwen stone are consistent with those of typical calcite (CaCO3) (PDF:05-0586) (Figure 4). In the ICDD (International Centre for Diffraction Data) reference database, characteristic peaks of 3.84 Å (012), 3.02 Å (104), 2.49 Å (110), 2.28 Å (113), 2.09 Å (202), and 1.91 Å (018) show that calcite is the mineral composing the study specimen. Calculations with the MDI JADE 6.5 software indicate that the cell parameters of this calcite are a = 4.97 Å, c = 17.00 Å, compared with a = 4.99 Å, c = 17.06 Å for typical calcite (PDF:05-0586) *(from ICDD), and that the average size of the calcite crystals is 1737 Å (R = 9.15%).

3.2. Spectroscopic Characterization

3.2.1. Fourier-Transform Infrared Spectroscopy Analysis

The Lvwen stone specimens show obvious absorption peaks around 715, 885, ~1125, ~1490, 1796, 2510, 2854, and 2923 cm−1 (Figure 5), which are in good agreement with the infrared absorption characteristics of typical calcite [5]. The absorption peaks at 715 and 885 cm−1 are especially sharp due to the in-plane and out-of-plane bending vibrations of [CO3]2−, respectively. Broad absorption bands at ~1125 and ~1490 cm−1 are linked to the inverse symmetric stretching vibration and inverse asymmetric stretching vibration of [CO3]2−, respectively. Additionally, these two absorption features have similar intensities. The absorption at 1796 cm−1 is assigned to the symmetric stretching vibration and in-plane bending vibration of [CO3]2− [6]. The double absorptions at 2854 and 2923 cm−1 are probably related to organic inclusions of aliphatic hydrocarbons (−CH3 and −CH2−) [7].

3.2.2. Ultraviolet–Visible Spectroscopy Analysis

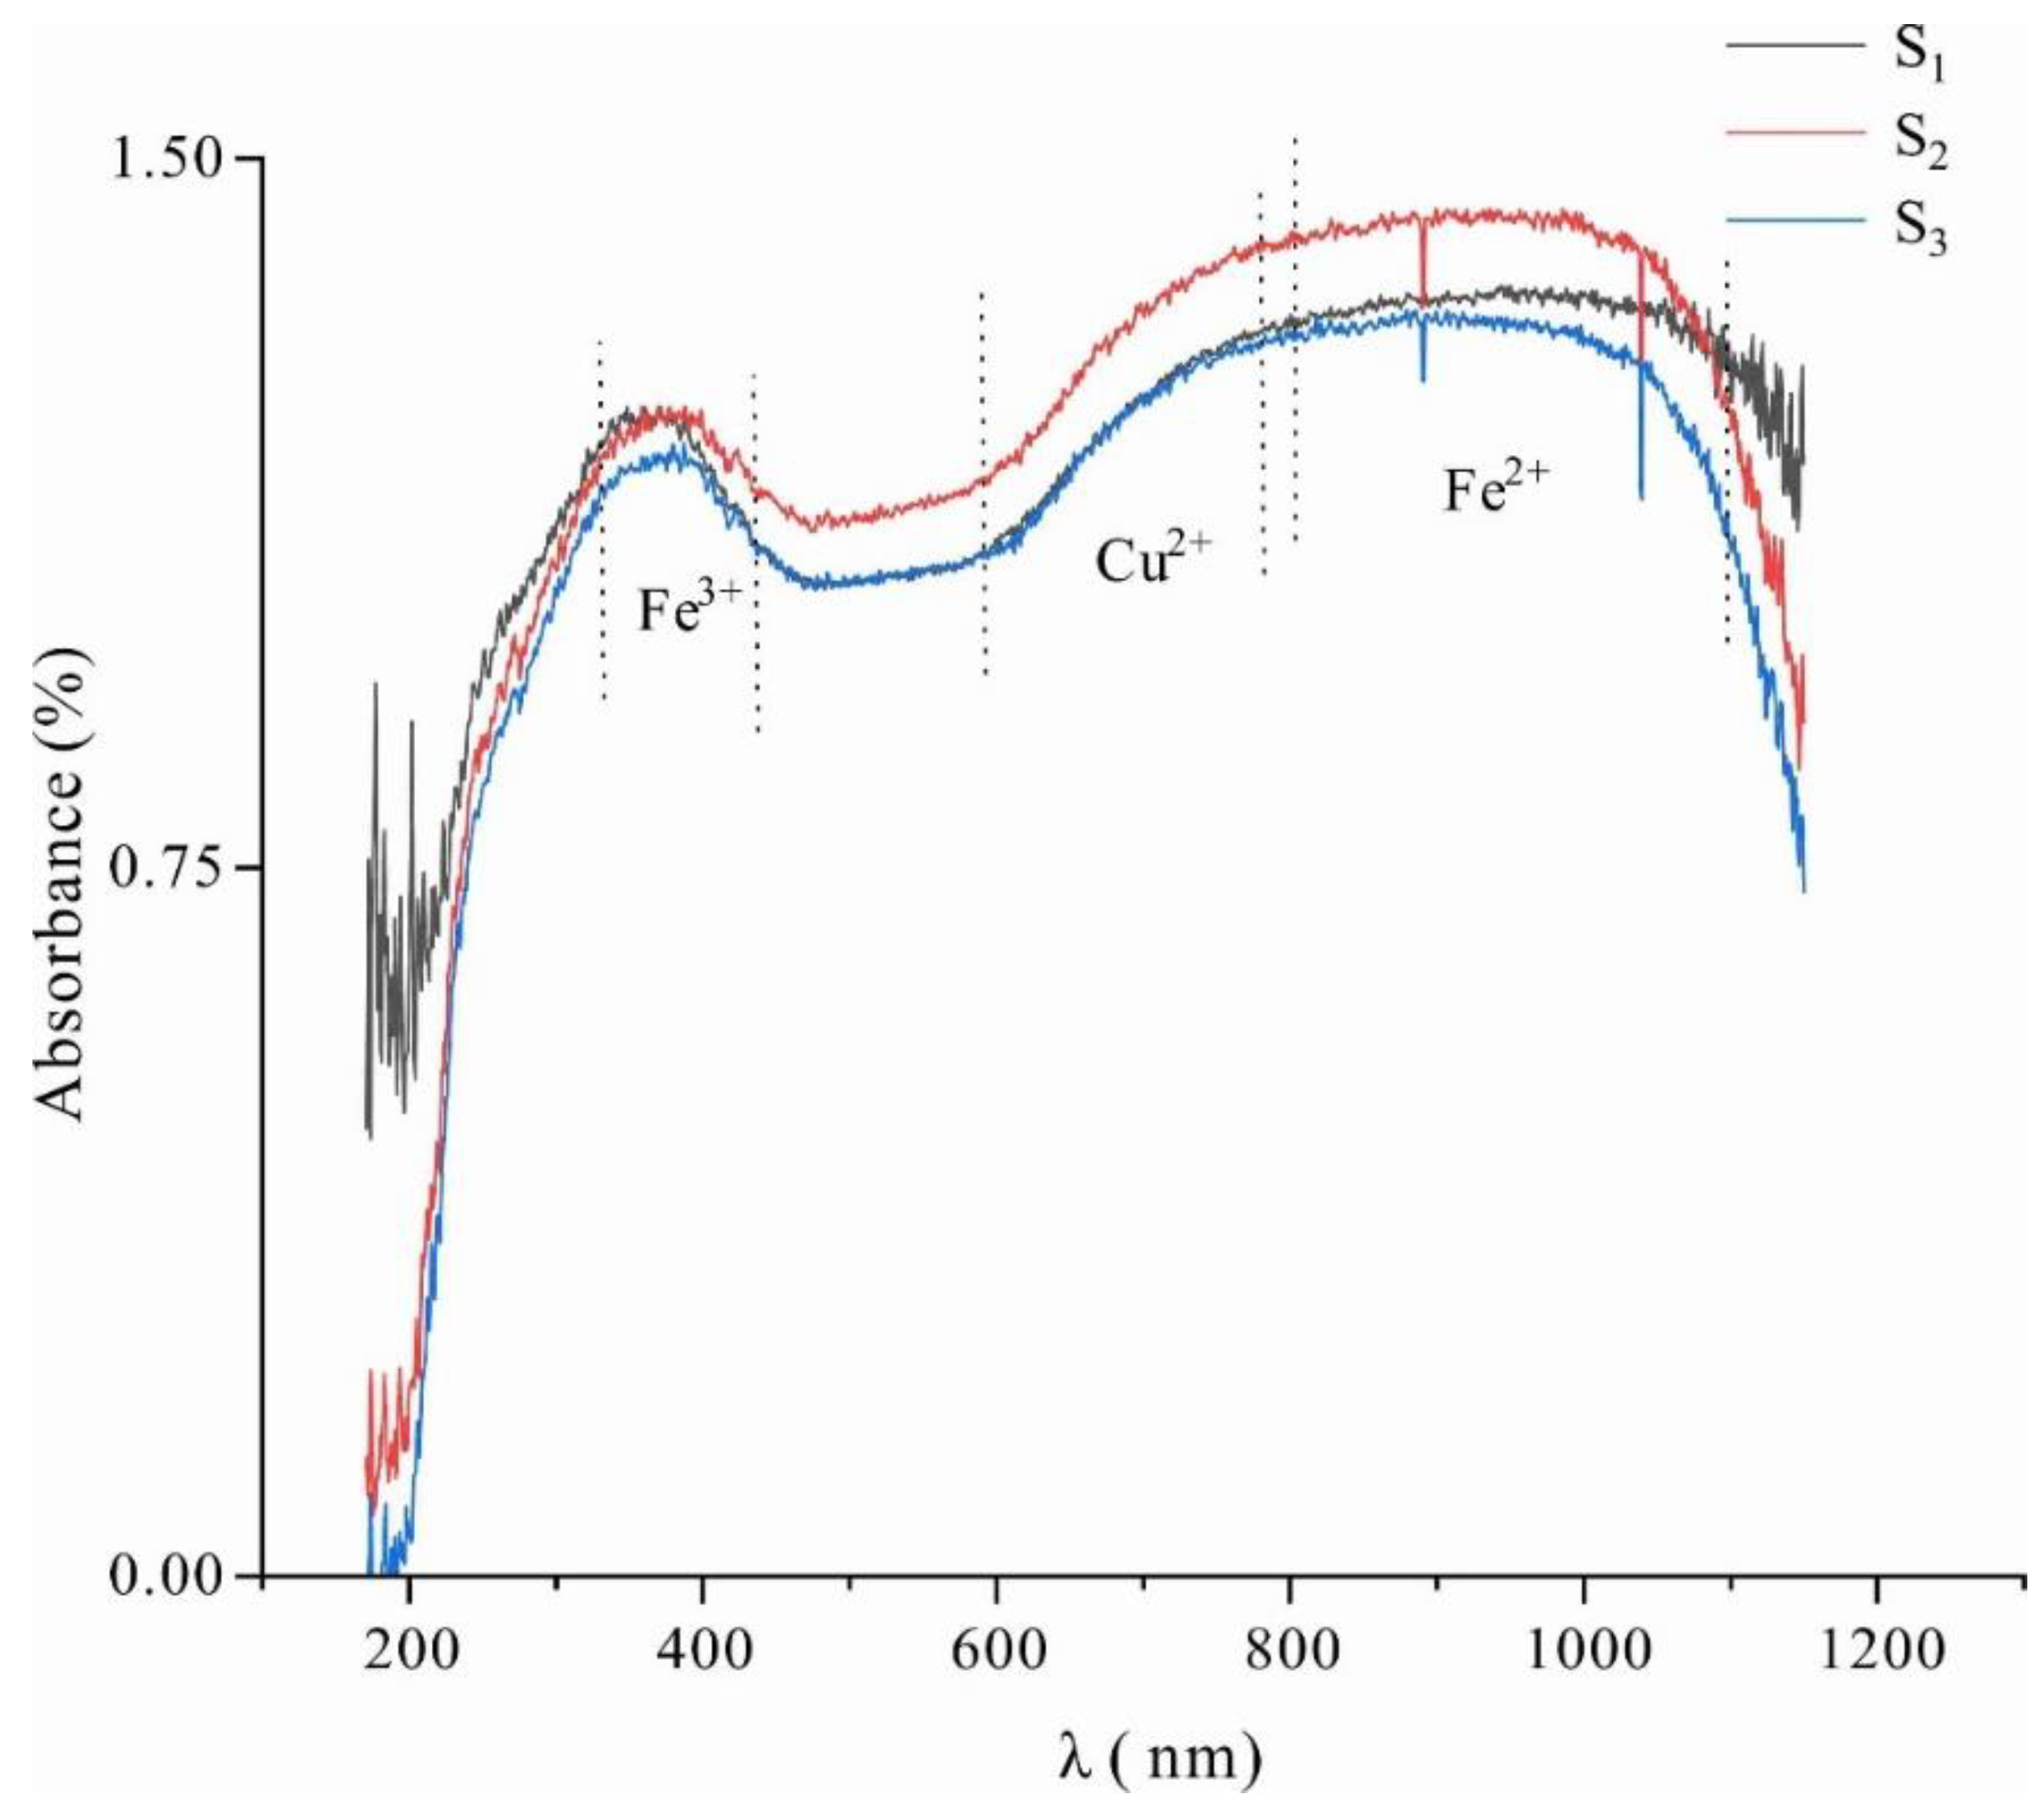
Two wide absorption bands at ~380–450 nm and ~580–780 nm are displayed in the UV–VIS spectrum (Figure 6). The absorption band at ~380–450 nm is attributed to the 6A14E(4D) d-d electron transition of Fe3+, whereas the absorption band at ~580–780 nm is caused by the 2E→2T2(2D)d-d electron transition of Cu2+ [8,9]. The absorption band at ~800–1100 nm indicates the presence of Fe2+ [10], but it is beyond the range of visible light and does not contribute to the color of Lvwen stone. Therefore, the combined adsorptions of Cu2+ and Fe3+ in the calcite lattice may account for the yellow-green color of the cabochon specimens of Lvwen stone analyzed in this study.

3.3. Chemical Compositions

Laser ablation inductively coupled plasma mass spectrometry (LA-ICP-MS) revealed a similar chemical composition for both the green matrix and the white bands of the Lvwen stone specimens—dominantly CaO (>52 wt%), with lesser amounts of MgO and MnO (~0.5 wt% and 1–2 wt%, respectively). Small amounts of Na, Si, K, Sr, and Cu are also present, with the green matrix containing more Cu and Mn than the white bands (Table 1). A number of trace metals were found in the green matrix and white bands, with the amounts of Fe and Zn generally being higher than those of V, Cr, Co, and Ni (Table 1 and Table 2). The green matrix exhibits higher concentrations of Fe, Cu, and Zn than the white bands. Because Zn is generally not a coloring agent in minerals, we infer that the yellow-green color of Lvwen stone is linked to the presence of Fe and Cu. The chemical formula of the study specimens was calculated using the anionic method (Table 3), yielding Ca0.97Mn0.02Mg0.01 [CO3].
The total amount of rare earth elements (ΣREE) is ~14.3–36.0 ppm, with the green matrix being significantly enriched (28.4–36.0 ppm; mean 30.8 ppm) relative to the white bands (14.3–23.9 ppm; mean 19.6 ppm). Both the green matrix and the white bands display a pattern of LREE and HREE enrichment and MREE depletion (Table 4, Figure 7). Cerium anomalies (δCe, calculated as δ Ce = [ Ce ] / [ La ] × [ Pr ] , where [Ce], [La], and [Pr] are chondrite-normalized values) are positive for both the green matrix (1.18–1.29) and white bands (1.04–1.25), with an overall mean of 1.21. Europium anomalies (δEu, calculated as δ Eu = [ Eu ] / [ Sm ] × [ Gd ] , where [Eu], [Sm], and [Gd] are chondrite-normalized values) are negative for both the green matrix (0.69–1.14) and white bands (0.65–1.02), with an overall mean of 0.84 (Table 4, Figure 7).

3.4. Microstructural Characteristics

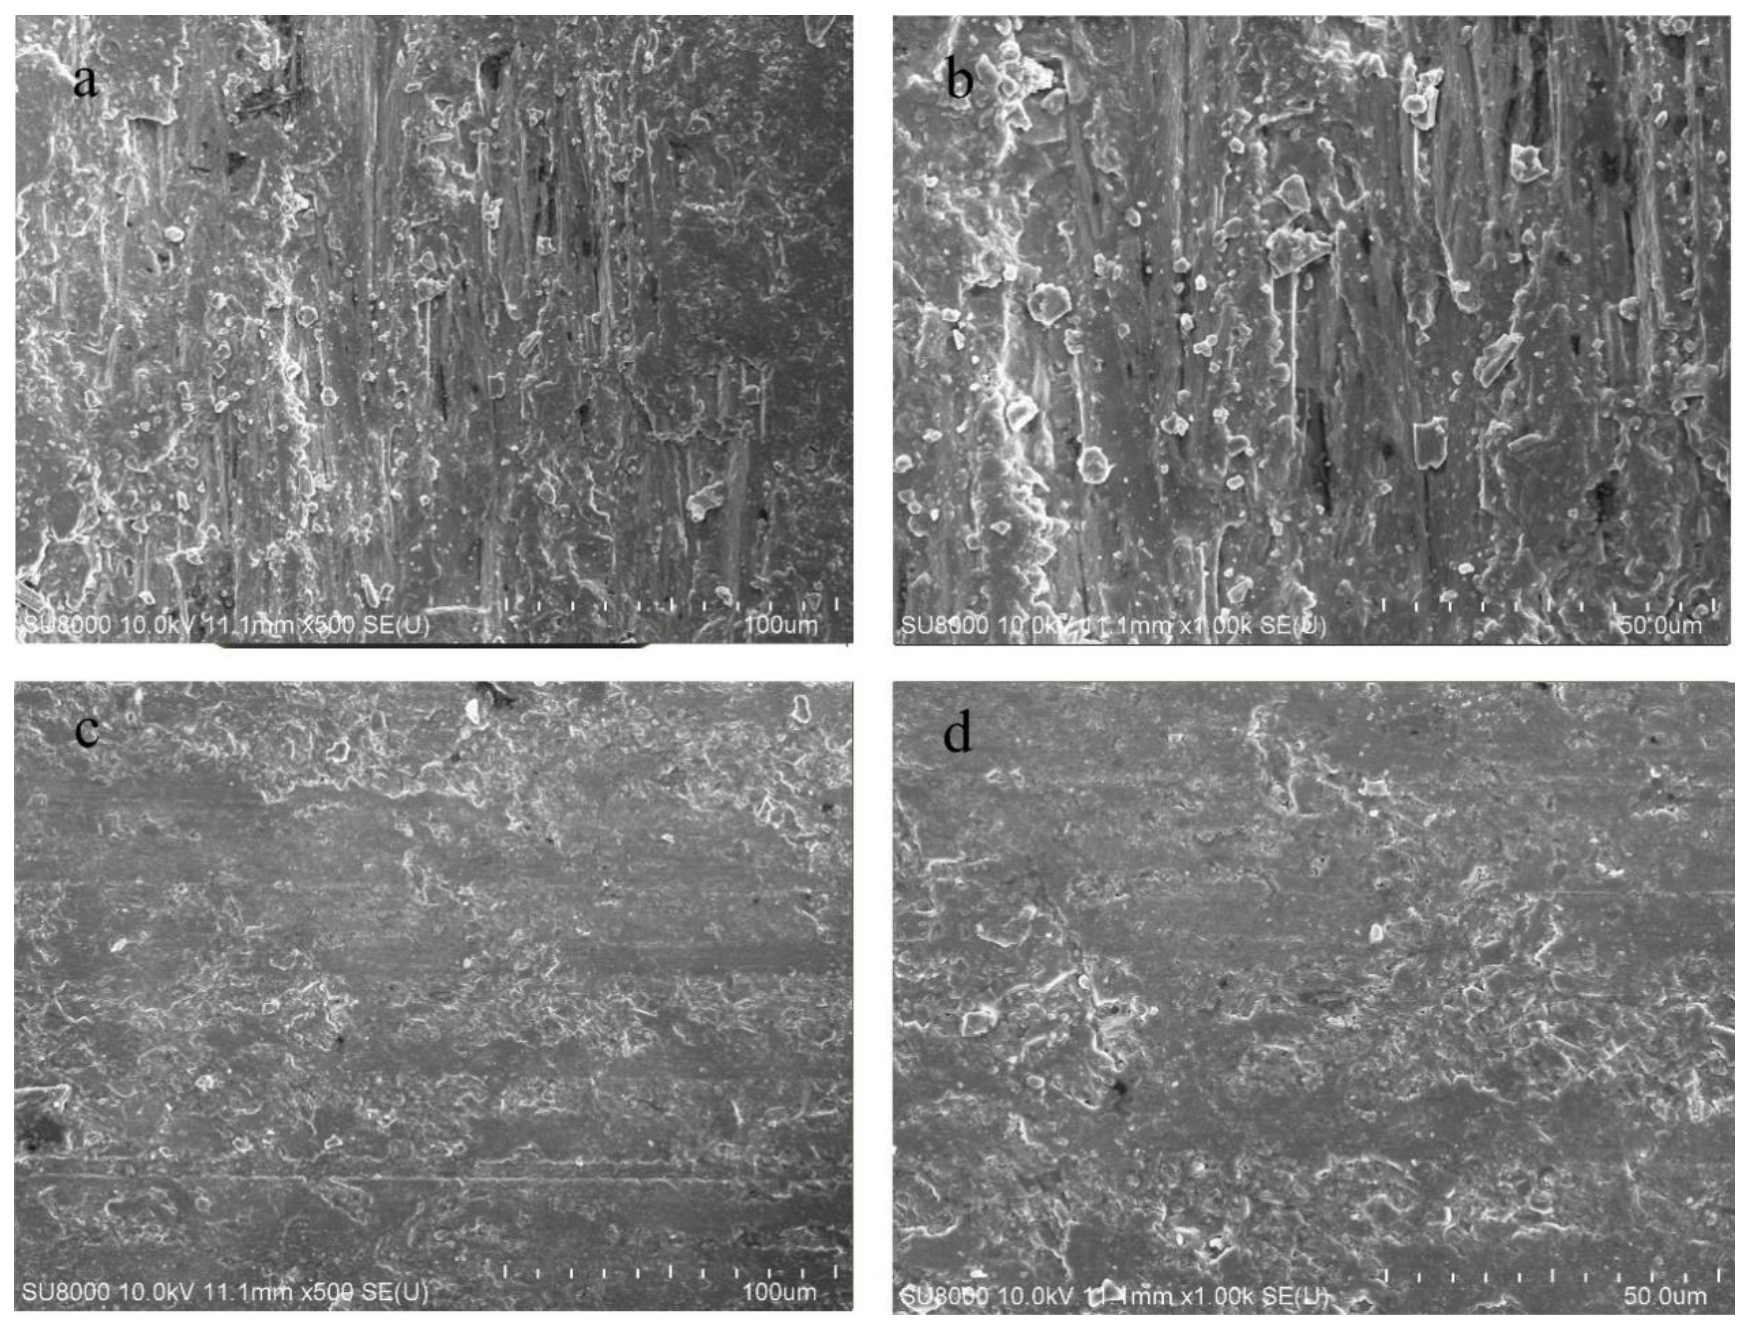
Scanning electron microscopy (SEM) revealed that most of the calcite crystals in the white bands of Lvwen stone (S1) are in the form of crystal aggregates with a size of 30−100 um. Moreover, the crystal interstices are filled with nanoscale particles and cryptocrystalline colloids. The dominant orientation of these crystals is perpendicular to the plane of the white bands (Figure 8a,b). Composed of mainly cryptocrystalline calcite with trace nanoscale particles filling in the intergranular spaces, the calcite crystals in the green matrix are not oriented and are mainly ~10 μm in size (Figure 8c,d). The crystallinity of calcite in the white bands is significantly higher than that of the green matrix. These findings are consistent with the results from optical microscopy (Figure 3).

4. Discussion

The results of the XRD, FTIR, and LA-ICP-MS analyses indicate that the mineral composition of the Lvwen stone specimens is calcite with a chemical formula of Ca0.97Mn0.02Mg0.01 [CO3]. The yellow-green hue is probably due to the presence of Fe3+ and Cu2+. Based on cell parameter calculations, the dimensions of the a0, b0, and c0 axes of calcite generally decrease with increasing isomorphic substitution of Mg2+ and Mn2+ for Ca2+ in the crystal lattice [12]. Therefore, isomorphic substitution by Mg2+ and Mn2+ may be the cause of the relatively low a0, b0, and C0 values of calcite in the Lvwen stone specimens. Isomorphic substitution may also account for the appearance of the ~1125 cm−1 absorption band and the broadening of the ~1490 cm−1 band in FTIR spectra. Thus, this process may be the main factor in the reduced symmetry of the [CO3]2− distribution in the Lvwen stone specimens compared with that of ideal calcite [5]. Two diffraction peaks (1.617 and 1.596 Å) in the XRD spectrum (Figure 4), which appear to the right of the 1.62 and 1.60 Å peaks of typical calcite (PDF:05-0586), may be due to the reduced symmetry of [CO3]2− in the calcite crystals, as revealed by FTIR.
To better study the banded structure of Lvwen stone, the S1 cabochon was cut down into a rectangular prism. The development of banding is linked to variations in the concentrations of trace-metal ions: the green matrix has a higher content of ΣREE, Cu, and Fe than the white bands (Table 2 and Table 4). Therefore, the green matrix of Lvwen stone may have formed when REEs, Cu, Fe, and other trace elements were abundant in the mineralizing fluid, whereas the white bands formed after these elements had been depleted. Micrograph and SEM observations show that the white bands contain mainly micron-sized, oriented calcite crystals, whereas the green matrix is composed of cryptocrystalline calcite and smaller crystals than the white bands (Figure 8a–d). The white bands, consisting of larger crystals, also harbor larger pores, which are the cause of their poorer light transmission. In contrast, the green matrix is composed of smaller crystals and has correspondingly smaller pores, giving rise to better light transmission. In addition, the different crystal particle sizes may also lead to the different color of the green matrix and the white bands. However, there is no research on the relationship between crystal sizes and color in natural minerals. LA-ICP-MS analysis showed that the green matrix has significantly higher contents of Fe3+ and Cu2+ than the white bands (Table 1 and Table 2). Furthermore, broad absorptions are displayed at ~380–450 and ~580–780 nm in the UV–VIS spectrum, which are related to the 6A14E(4D)d-d intra-ion electron transition of Fe3+ and 2E→2T2(2D)d-d intra-ion electron transition of Cu2+, respectively [8,9]. Absorptions in the green (~490–570 nm) and yellow (~570–580 nm) regions of the UV–VIS spectrum are relatively weak, and the mixture of these two colors produces the yellow-green color of Lvwen stone.
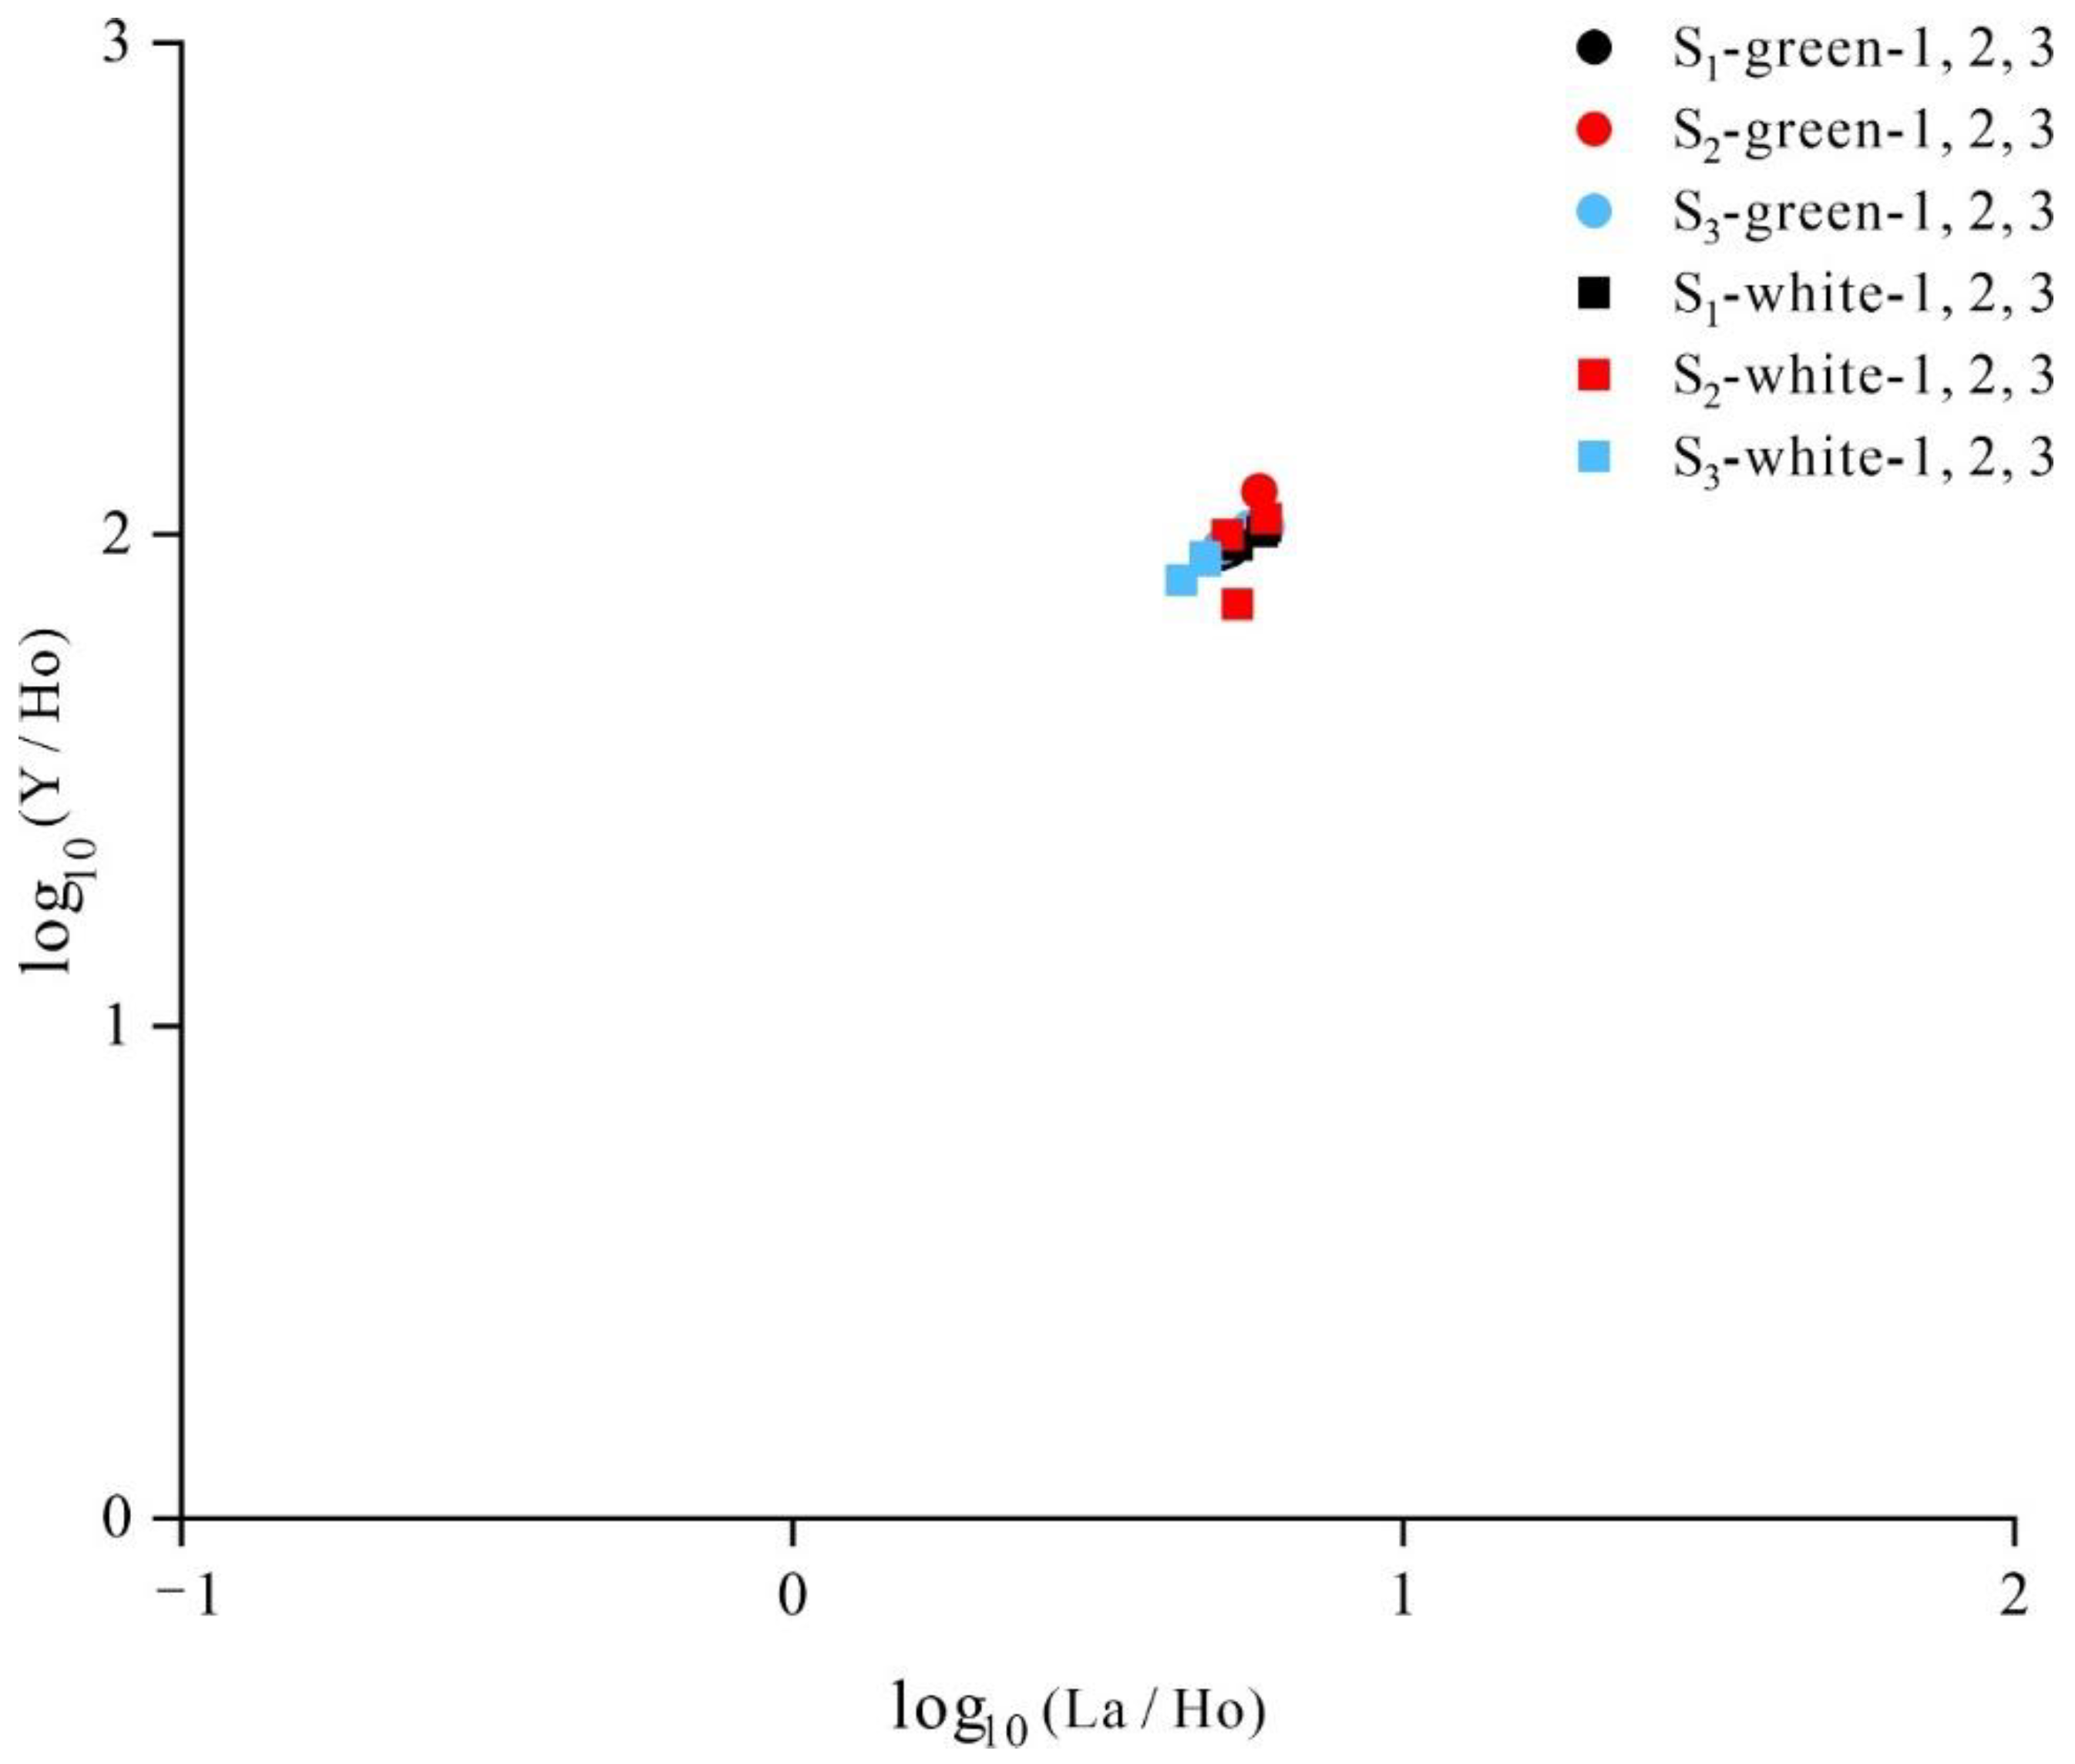
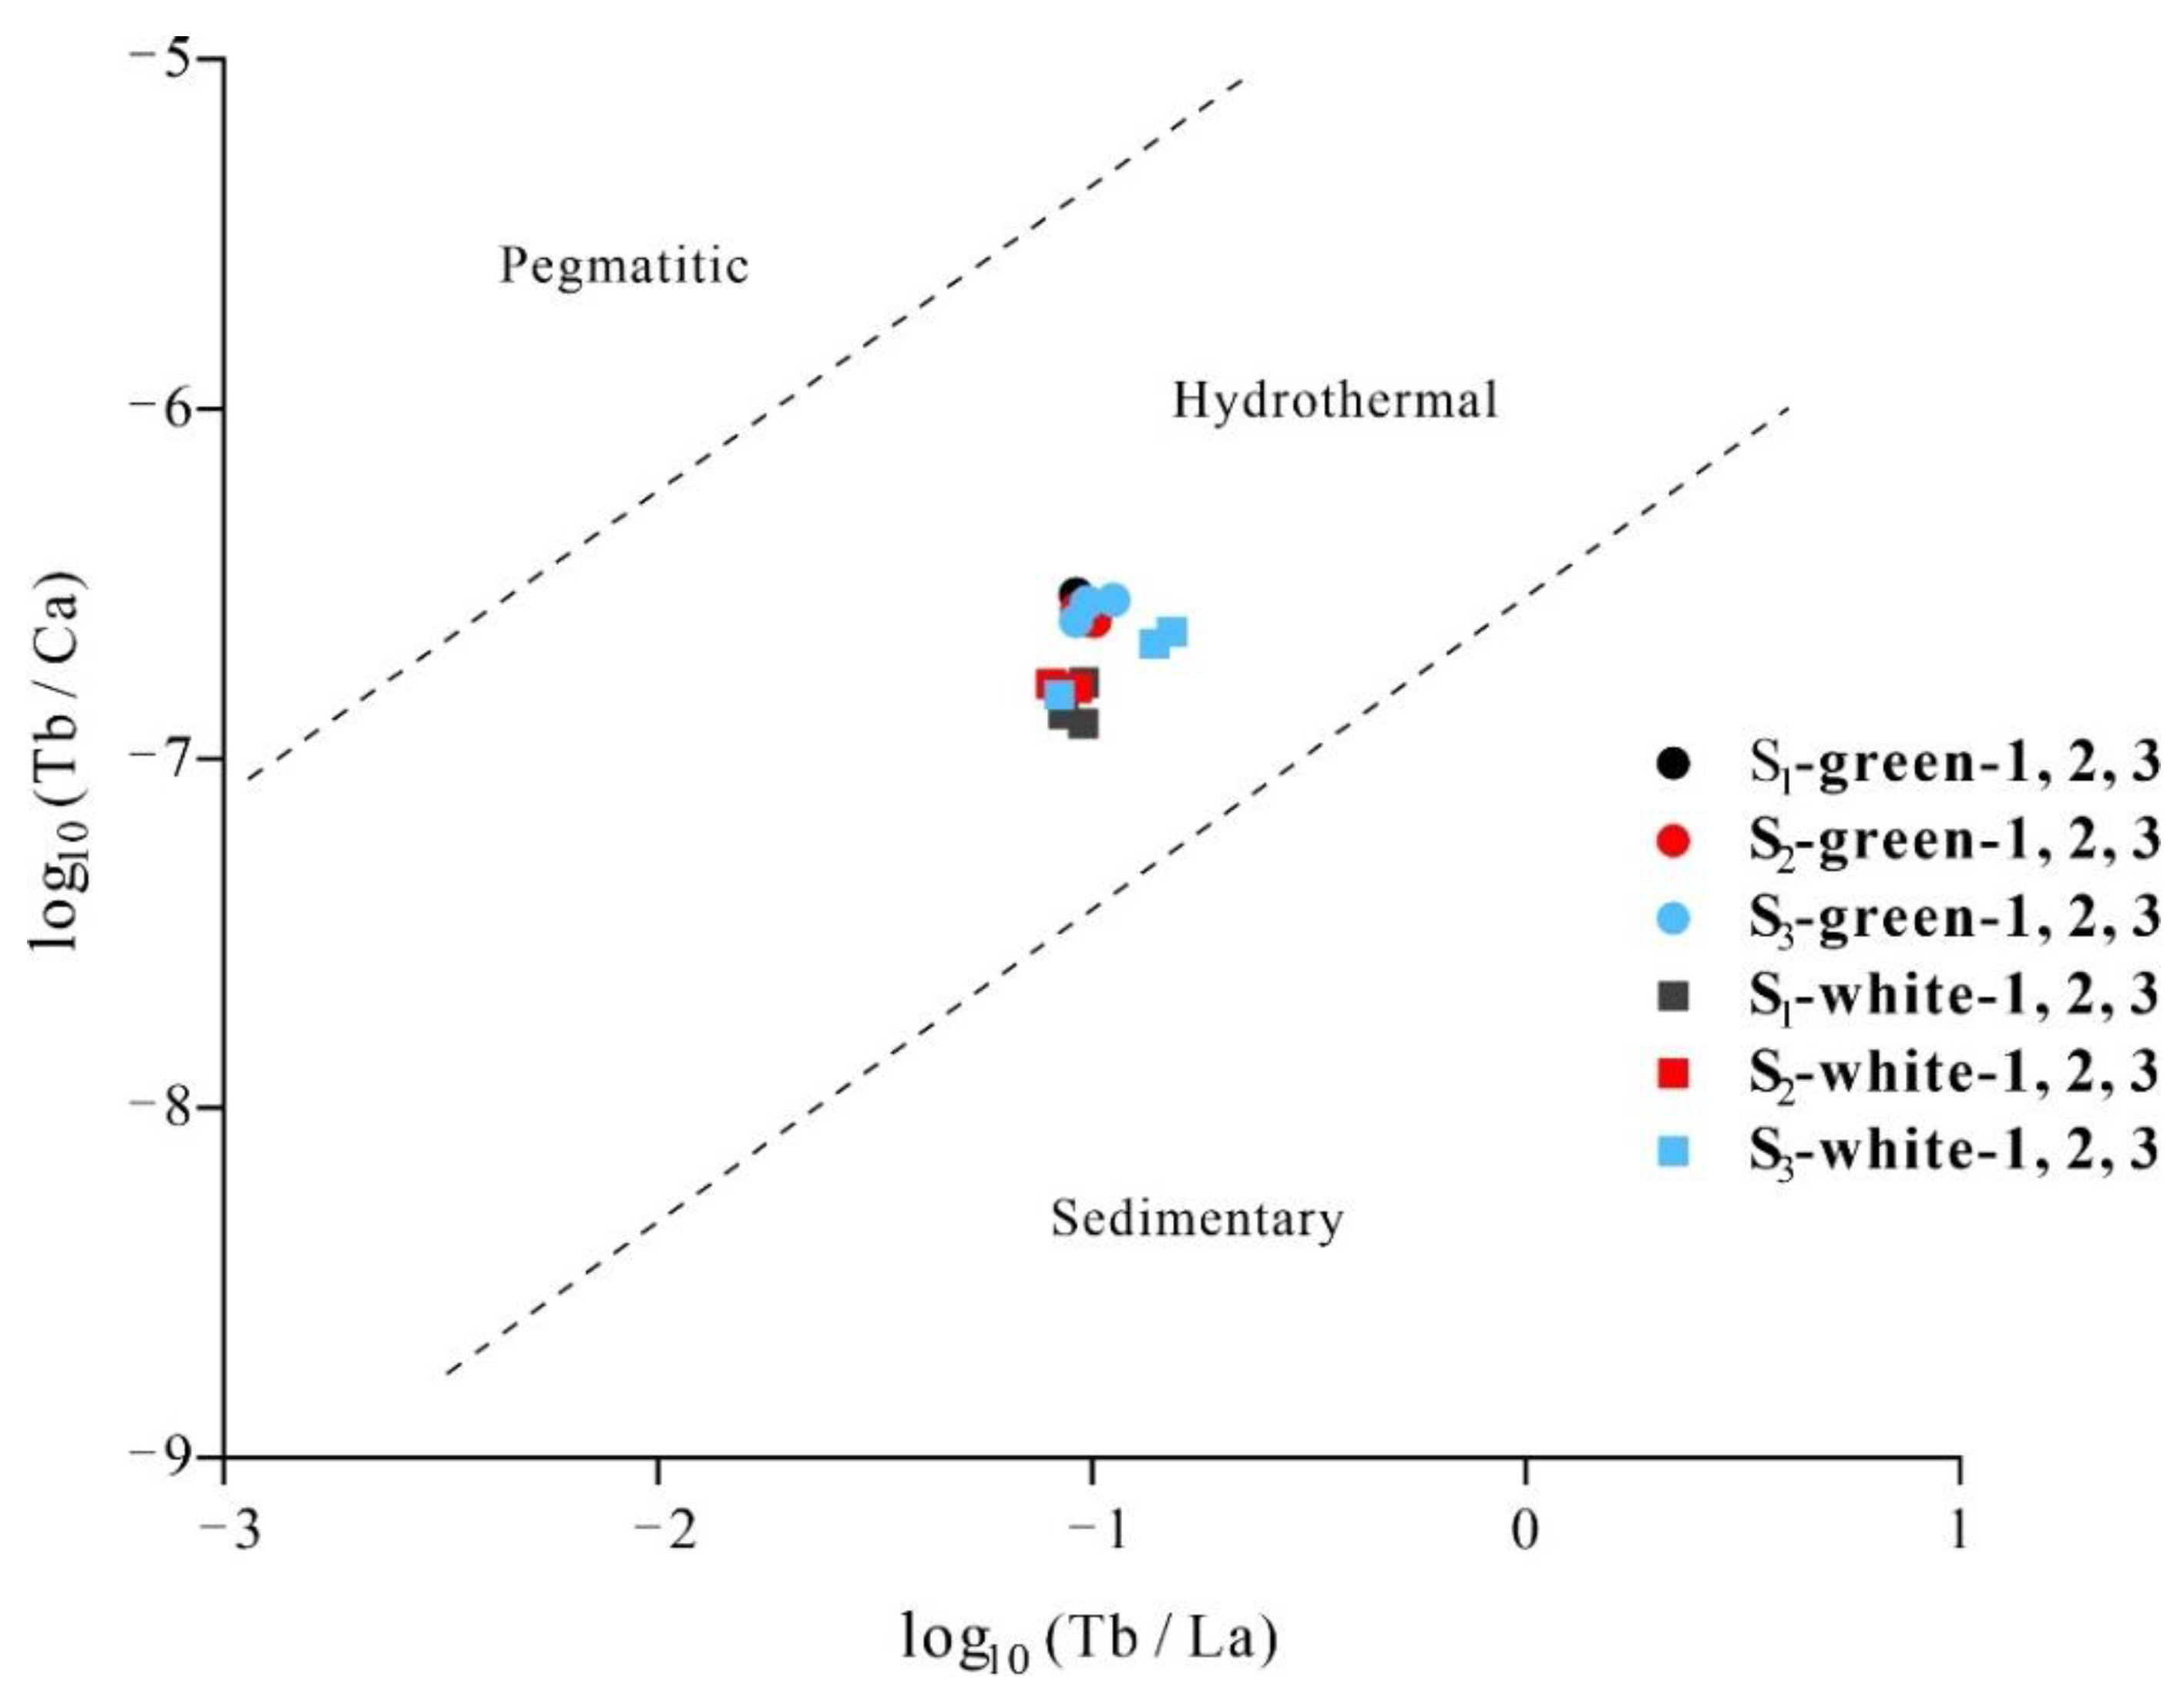
The green matrix and the white bands in Lvwen stone have a shared origin, that is, being derived from a single fluid, as inferred from a Y/Ho-La/Ho discriminant plot in which all samples yield nearly the same values (Figure 9) [13]. A hydrothermal origin can be inferred from a Tb/Ca-Tb/La discriminant plot, which shows log10(Tb/Ca) of −6.53 to −6.90 and log10(Tb/La) of −0.99 to −1.06 (Figure 10) [14]. Calcite tends to take up REEs readily owing to isomorphic substitution for Ca2+, which has a similar ironic radius [15]. Hydrothermal fluids tend to yield REE distribution patterns characterized by (1) LREE enrichment and HREE depletion, or (2) LREE and HREE depletion, and MREE enrichment [16,17]. However, Lvwen stone displays a different pattern, characterized by LREE and HREE enrichment and MREE depletion, suggesting derivation from MREE-deficient mineralizing fluids in a closed system. Among the REEs, Ce is a variable-valence element that is sensitive to changes in its redox environment. In a reducing environment, Ce is present as Ce3+, which is not fractionated relative to other trivalent REEs, but in an oxidizing environment, Ce4+ is precipitated as the highly insoluble mineral cerianite [CeO2], resulting in a negative Ce anomaly in the residual fluid [15,18]. We infer that the positive Ce anomalies (Table 4 and Figure 7) shown by both the green matrix and white bands indicate the reductive remobilization of earlier precipitated Ce-oxides by the mineralizing fluid that yielded Lvwen stone. The negative Eu anomalies (Table 4 and Figure 7) shown by both the green matrix and white bands are considered to be indicative of reducing conditions [13], which is consistent with the reductive mineralizing fluid revealed by the positive Ce anomalies. The calcite crystals in the white bands are oriented, suggesting that they formed in a specific tectonic stress regime. Previous investigations have shown that low-permeability rocks (e.g., mudstones) in foreland basins or orogenic zones have the tendency to form fibrous and parallel-growing calcite veins under ultra-high-pressure tectonic fluids, with the growth direction of the calcite crystals being perpendicular (or nearly so) to the plane of the vein [19,20,21]. We infer that Lvwen stone may have formed from such a tectonically controlled mineralizing fluid. This hypothesis is supported by the presence of fatty hydrocarbon inclusions in the calcite of the white bands, as revealed by adsorption peaks at 2923 and 2854 cm−1 in the infrared spectrum [22]. Hydrocarbon inclusions, which record the formation of fluids under abnormal pressure during tectonic deformation, are often found in calcite veins [22].
Isostructural veins in calcite crystals are divisible into three kinds based on crystal structure, morphology, and fiber arrangement: stretching veins, syntaxial veins, and antitaxial veins [23,24]. The white bands of Lvwen stone share characteristics with the stretching vein type. Stretching veins are formed in fractures filled with a vein-forming fluid from the surrounding rocks or early-generated veins, in which the growth of veins proceeds by repeated cycles of opening and closing of the host fracture [25]. During the formation of a stretching vein, a given fracture does not necessarily open at exactly the same location every time, and small changes in fracture position from one cycle to the next results in shifts in the growth interface [26], leading to the uneven boundaries of the stretching vein. Following multiple cycles of opening and closing of a fracture, the remains of the country rock or of earlier veins running parallel to fractures often appear within a vein [23,27,28]. The margins of the white bands of Lvwen stone are typically ragged, indicating that the vein-forming crystals have undergone periodic tectonic stretching [26]. The green matrix of Lvwen stone may have been a cryptocrystalline vein formed at an earlier stage, which then, due to repetitive opening and closing of tectonic fractures, gradually acquired the multiple white bands with parallel crystals seen in the study specimens, thus yielding their present, alternately green- and white-banded appearance.

5. Conclusions

(1)
The mineral composition of Lvwen stone is calcite, with crystal cell parameters of a = 4.97 and c = 17.00 Å and calcite crystals with an average grain size of 1737 Å. The cabochons used in this study have obvious white bands even after being cut into blocks, indicating that the banding is not due to chatoyancy (“cat’s-eye effect”). The white bands are composed of parallel-arranged, ~100 μm–sized calcite crystals. In contrast, the green matrix is dominated by smaller (~10 μm) cryptocrystalline calcite particles. These differences in crystallinity contribute to the contrasting transparencies of the white bands and green matrix.
(2)
The chemical formula of Lvwen stone is Ca0.97Mn0.02Mg0.01 [CO3], and the content of ΣREE in the green matrix is higher than that in the white bands. There is a significantly larger content of Fe and Cu in the green matrix as compared with the white bands, showing that the green color of the matrix is formed by the absorption of light by Fe3+ and Cu2+ in the calcite lattice, resulting from the 6A14E(4D)d-d intra-ion electron transition of Fe3+ and 2E→2T2(2D)d-d intra-ion electron transition of Cu2+, respectively. In addition, different crystal particle sizes may also affect the color of the green matrix and the white bands.
(3)
The occurrence of the ~1125 cm−1 absorption band and the broadening of the ~1490 cm−1 band on the FTIR spectrum suggest that the reduced symmetry of the [CO3]2− distribution of calcite crystals in Lvwen stone, compared with that of ideal calcite, may be related to isomorphic substitution of Mg2+ and Mn2+ for Ca2+. The double absorptions at 2923 and 2854 cm−1 reveal the presence of aliphatic hydrocarbon inclusions in the study specimens.
(4)
Discriminant diagrams show that the green matrix and white bands of Lvwen stone had the same origin, and that both are the products of hydrothermal fluids. The presence of positive Ce anomalies in both the green matrix and white bands is an indication that the mineralizing fluid reductively remobilized earlier-formed Ce-oxides that had precipitated under oxidizing conditions. The orientation of crystals in the white bands perpendicular to the band plane shows that the study specimens formed in a tectonically controlled stress regime that permitted the formation of stretching veins.

Author Contributions

Conceptualization, W.H.; methodology, Z.Y.; software, Y.W.; investigation, W.W.; resources, Y.P.; data curation, Y.Y.; writing—original draft preparation, Z.L. (Zhendong Liu); writing—review and editing, T.J.A. and H.H.; supervision, K.Y.; funding acquisition, Z.L. (Zhuo Lu). All authors have read and agreed to the published version of the manuscript.

Funding

This study was supported by National Natural Science Foundation of China (Nos. 41772045 and 41402036), Fundamental Research Funds for the Central Universities (No. CUG170106), Science and Technology Projects Entrusted by Enterprises and Institutions (2021016719), University Gemstone and Material Process Engineering Research Center Project of Yunnan Province (No. ZX20200103), and Scientific Research Fund Project of Yunnan Education Department (No. 2019J0311).

Data Availability Statement

The authors confirm that the data supporting the findings of this study are available within the article.

Acknowledgments

We are grateful to Dong Wang for the purchase of the Lvwen stone specimens. Our gratitude extends to the Wuhan Sample Solution Analytical Technology Co., Ltd., Wuhan, China, for their technical support during the in situ geochemical compositions of Lvwen stone; Qin Yang for SEM observation; and Jishun Yu for XRD analyses. We also thank three anonymous reviewers and guest editor, Lidong Dai for their constructive comments.

Conflicts of Interest

The authors declare no conflict of interest.

References

  1. Hyrsl, J. Cat’s-eye calcite from Pakistan. Gems. Gemol. 2015, 51, 199–200. [Google Scholar]
  2. Zong, K.; Klemd, R.; Yuan, Y.; He, Z.; Guo, J.; Shi, X.; Liu, Y.; Hu, Z.; Zhang, Z. The assembly of Rodinia: The correlation of early Neoproterozoic (ca. 900Ma) high-grade metamorphism and continental arc formation in the southern Beishan Orogen, southern Central Asian Orogenic Belt (CAOB). Precambrian Res. 2017, 290, 32–48. [Google Scholar] [CrossRef]
  3. Hu, Z.; Zhang, W.; Liu, Y.; Gao, S.; Li, M.; Zong, K.; Chen, H.; Hu, S. “Wave” Signal-Smoothing and Mercury-Removing Device for Laser Ablation Quadrupole and Multiple Collector ICPMS Analysis: Application to Lead Isotope Analysis. Anal. Chem. 2015, 87, 1152–1157. [Google Scholar] [CrossRef] [PubMed]
  4. Liu, Y.; Hu, Z.; Gao, S.; Günther, D.; Xu, J. In situ analysis of major and trace elements of anhydrous minerals by LA-ICP-MS without applying an internal standard. Chem. Geol. 2008, 257, 34–43. [Google Scholar] [CrossRef]
  5. Wen, L.; Liang, W.; Zhang, Z.; Huang, J. The Infrared Spectroscopy of Minerals; Chongqing University Press: Chongqing, China, 1989. [Google Scholar]
  6. Plav, B.; Kobe, S.; Orel, B. Identification of crystallization forms of CaCO3 with FTIR spectroscopy. Kovine Zlitine Tehnol. 1999, 33, 517–521. [Google Scholar]
  7. Li, R.; Dong, S.; Lehrmann, D.; Duan, L. Tectonically driven organic fluid migration in the Dabashan Foreland Belt: Evidenced by geochemistry and geothermometry of vein-filling fibrous calcite with organic inclusions. J. Asian Earth Sci. 2013, 75, 202–212. [Google Scholar] [CrossRef]
  8. Marfunin, A.d.S.; Egorova, N. Physics of Minerals and Inorganic Materials: An introduction; Springer: Berlin/Heidelberg, Germany, 1979. [Google Scholar]
  9. Farges, F.; Benzerara, K.; Brown, G.E., Jr. Chrysocolla redefined as spertiniite. Am. Inst. Phys. 2007, 882, 223–225. [Google Scholar]
  10. Gaffey, S.J. Spectral reflectance of carbonate minerals in the visible and near infrared (0.35–2.55 um): Anhydrous carbonate minerals. J. Geophys. Res. Solid Earth 1987, 92, 1429–1440. [Google Scholar] [CrossRef]
  11. McDonough, W.F.; Sun, S.S. The composition of the Earth. Chem Geol. Chem. Geol. 1995, 120, 223–253. [Google Scholar] [CrossRef]
  12. Zhao, S. Crystallography and Mineralogy (Third Edition); Higher Education Press: Beijing, China, 2017. [Google Scholar]
  13. Bau, M.; Möller, P. Rare earth element fractionation in metamorphogenic hydrothermal calcite, magnesite and siderite. Mineral. Petrol. 1992, 45, 231–246. [Google Scholar] [CrossRef]
  14. Möller, P.; Parekh, P.P.; Schneider, H.J. The application of Tb/Ca-Tb/La abundance ratios to problems of fluorspar genesis. Miner. Depos. 1976, 11, 111–116. [Google Scholar] [CrossRef]
  15. Zhong, S.; Mucci, A. Partitioning of rare earth elements (REEs) between calcite and seawater solutions at 25 C and 1 atm, and high dissolved REE concentrations. Geochim. Cosmochim. Acta 1995, 59, 443–453. [Google Scholar] [CrossRef]
  16. Lottermoser, B. Rare earth elements and hydrothermal ore formation processes. Ore Geol. Rev. 1992, 7, 25–41. [Google Scholar] [CrossRef]
  17. Haas, J.R.; Shock, E.L.; Sassani, D.C. Rare earth elements in hydrothermal systems: Estimates of standard partial molal thermodynamic properties of aqueous complexes of the rare earth elements at high pressures and temperatures. Geochim. Cosmochim. Acta 1995, 59, 4329–4350. [Google Scholar] [CrossRef]
  18. Migdisov, A.; Williams-Jones, A.; Brugger, J.; Caporuscio, F.A. Hydrothermal transport, deposition, and fractionation of the REE: Experimental data and thermodynamic calculations. Chem. Geol. 2016, 439, 13–42. [Google Scholar] [CrossRef] [Green Version]
  19. Machel, H.G. Fibrous gypsum and fibrous anhydrite in veins. Sedimentology 1985, 32, 443–454. [Google Scholar] [CrossRef]
  20. Al-Aasm, I.S.; Muir, I.; Morad, S. Diagenetic conditions of fibrous calcite vein formation in black shales: Petrographic, chemical and isotopic evidence. Bull. Can. Pet. Geol. 1993, 41, 46–56. [Google Scholar]
  21. Badertscher, N.P.; Beaudoin, G.; Therrien, R.; Burkhard, M. Glarus overthrust: A major pathway for the escape of fluids out of the Alpine orogen. Geology 2002, 30, 875–878. [Google Scholar] [CrossRef]
  22. Parnell, J.; Honghan, C.; Middleton, D.; Haggan, T.; Carey, P. Significance of fibrous mineral veins in hydrocarbon migration: Fluid inclusion studies. J. Geochem. Explor. 2000, 69, 623–627. [Google Scholar] [CrossRef]
  23. Bons, P.D.; Montenari, M. The formation of antitaxial calcite veins with well-developed fibres, Oppaminda Creek, South Australia. J. Struct. Geol. 2005, 27, 231–248. [Google Scholar] [CrossRef]
  24. Bons, P.D.; Elburg, M.A.; Gomez-Rivas, E. A review of the formation of tectonic veins and their microstructures. J. Struct. Geol. 2012, 43, 33–62. [Google Scholar] [CrossRef]
  25. Wang, M.; Chen, Y.; Xu, X. Progress on formation mechanism of the fibrous veins in mudstone and its implications to hydrocarbon migration. Adv. Earth Sci. 2015, 30, 1107–1118. [Google Scholar]
  26. Durney, D.W.; Ramsay, J.G. Incremental strains measured by syntectonic crystal growths. In Gravity and tectonics; De Jong, K.A., Scholten, R., Eds.; Wiley: New York, NY, USA, 1973; pp. 67–96. [Google Scholar]
  27. Ramsay, J.G. The crack-seal mechanism of rock deformation. Nature 1980, 284, 135–139. [Google Scholar] [CrossRef]
  28. Hilgers, C.; Urai, J.L. Microstructural observations on natural syntectonic fibrous veins: Implications for the growth process. Tectonophysics 2002, 352, 257–274. [Google Scholar] [CrossRef]
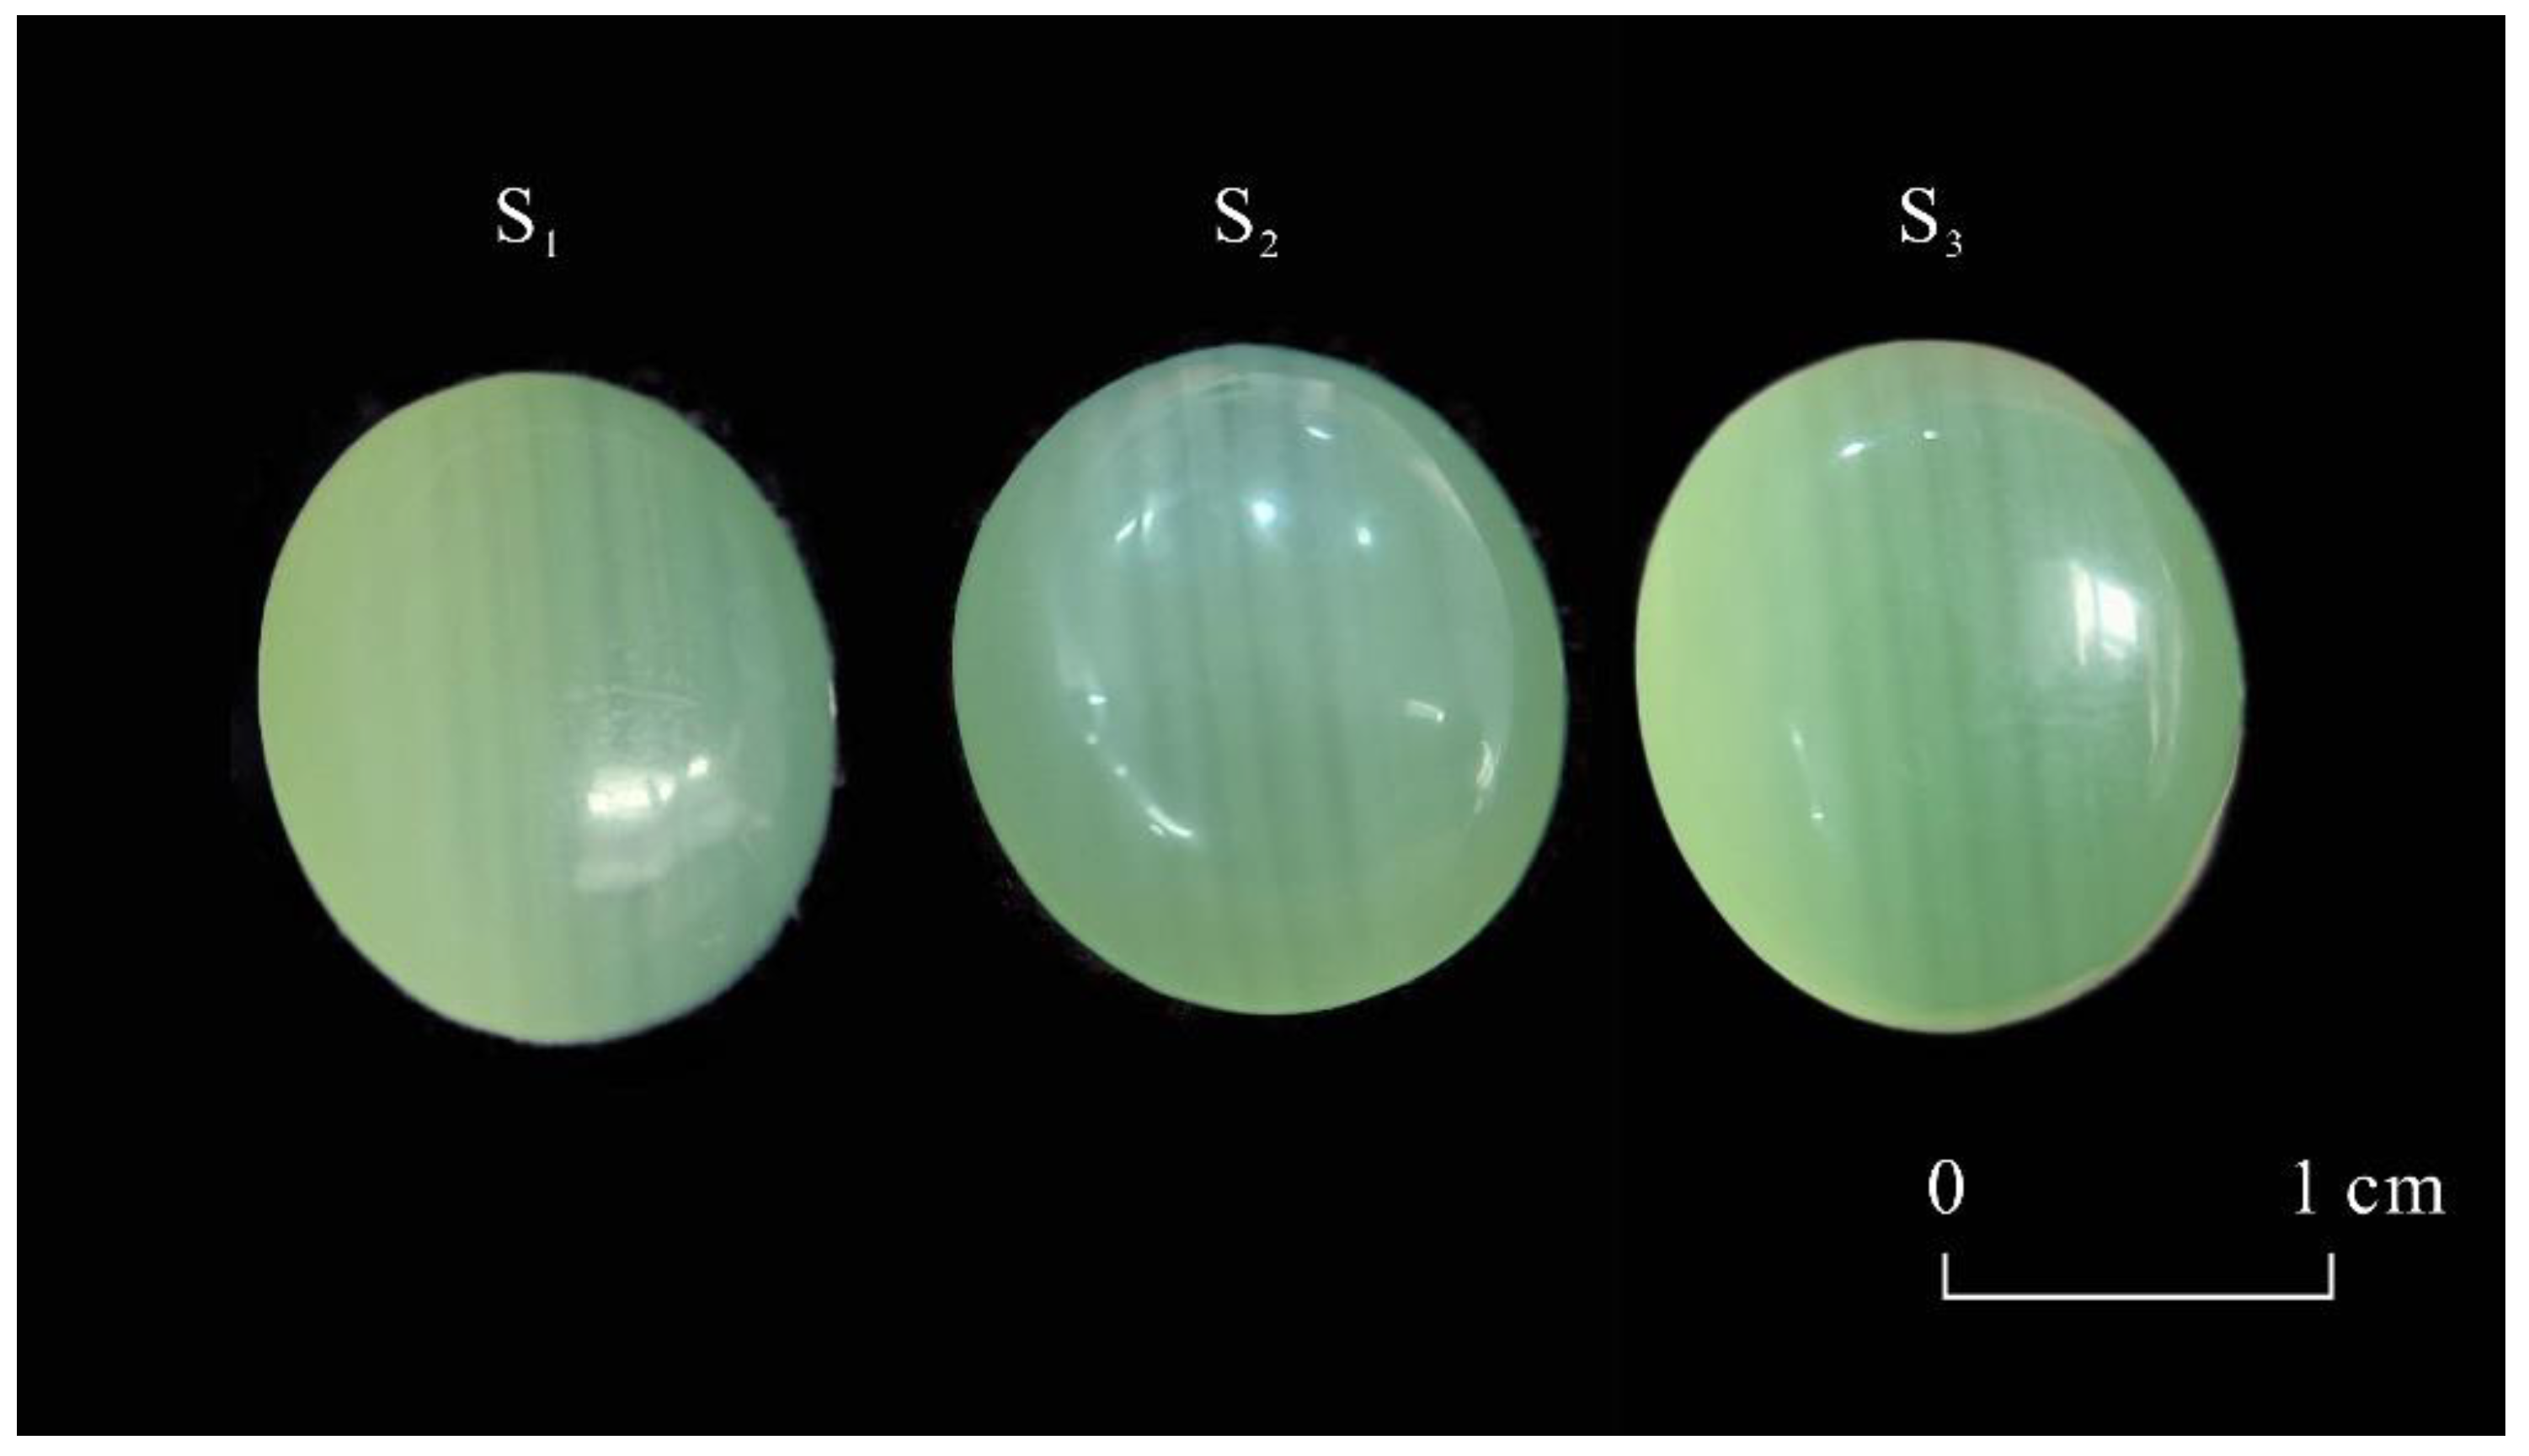
Figure 1. Cabochon specimens (S1, S2, and S3) of yellow-green Lvwen stone. All are top views.
Minerals 12 01584 g001
Figure 2. Rectangular slice through cabochon specimen S1 of Lvwen stone.
Minerals 12 01584 g002
Figure 3. Microscopic image of cabochon specimen S1 of Lvwen stone under 50× magnification.
Minerals 12 01584 g003
Figure 4. X-ray diffraction pattern of cabochon specimen S1 of Lvwen stone.
Minerals 12 01584 g004
Figure 5. Infrared spectra of three cabochon specimens of Lvwen stone.
Minerals 12 01584 g005
Figure 6. Ultraviolet–visible light (UV–VIS) spectra of three cabochon specimens of Lvwen stone.
Minerals 12 01584 g006
Figure 7. Chondrite-normalized REE patterns of three cabochon specimens of Lvwen stone.
Minerals 12 01584 g007
Figure 8. The micromorphology of minerals in cabochon specimen S1 of Lvwen stone (SEM images). (a,b) are 500× and 1000× images of white bands, respectively; (c,d) are 500× and 1000× images of green matrix, respectively.
Minerals 12 01584 g008
Figure 9. Y/Ho-La/Ho crossplot of three cabochon specimens of Lvwen stone. Values represent atomic ratios rather than weight ratios.
Minerals 12 01584 g009
Figure 10. Tb/Ca-Ta/La discriminant plot of three cabochon specimens of Lvwen stone. Values represent atomic ratios rather than weight ratios.
Minerals 12 01584 g010
Table 1. Major element oxide content of three Lvwen stone specimens (all values in wt%).
NaOMgOSiO2CaOMnOCuOSrO
S1-green-10.380.490.2152.561.620.320.36
S1-green-20.400.470.2152.451.650.340.36
S1-green-30.380.470.2652.431.680.350.36
Average0.390.480.2452.481.650.330.36
S2-green-10.360.510.3052.441.630.300.36
S2-green-20.350.470.3152.291.770.360.35
S2-green-30.350.470.3052.381.720.340.36
Average0.350.480.3052.371.710.330.36
S3-green-10.350.490.3152.571.540.290.36
S3-green-20.360.500.3152.441.620.280.37
S3-green-30.350.480.3152.331.730.350.35
Average0.350.490.3152.451.630.310.36
S1-white-10.380.560.2153.001.160.190.40
S1-white-20.400.570.2152.841.270.210.39
S1-white-30.420.580.2652.851.190.180.39
Average0.400.570.2452.901.200.190.39
S2-white-10.360.560.3053.021.140.170.38
S2-white-20.370.590.3052.981.170.170.37
S2-white-30.370.590.3252.921.170.170.38
Average0.370.580.3152.981.160.170.38
S3-white-10.370.570.3252.961.180.170.37
S3-white-20.360.570.3153.041.140.160.37
S3-white-30.360.570.3353.111.080.150.36
Average0.360.570.3253.041.140.150.37
S1-green-1 and S1-white-1 refer to the random first point of the green matrix and white bands, respectively, of S1, and so on.
Table 2. Trace element content of three Lvwen stone specimens (all values in ppm).
VCrFeCoNiZn
S1-green-10.340.51185.8838.883.20399.46
S1-green-20.260.76204.0338.363.96416.37
S1-green-30.280.78237.3839.293.22453.73
Average0.290.68209.1038.843.46423.19
S2-green-10.180.46218.6136.802.98407.60
S2-green-20.240.12268.1636.893.70471.20
S2-green-30.290.00233.8636.551.71400.73
Average0.240.20240.2136.752.80426.51
S3-green-10.310.00223.6934.952.30382.36
S3-green-20.290.00231.7237.303.44375.34
S3-green-30.280.00276.3336.381.80443.82
Average0.290.00243.9137.302.51400.51
S1-white-10.210.74135.6934.993.47226.68
S1-white-20.301.40151.0535.702.63251.09
S1-white-30.250.46109.1635.073.62220.96
Average0.250.87131.9735.253.24232.91
S2-white-10.260.99165.7736.053.23211.17
S2-white-20.170.74112.6937.962.95232.60
S2-white-30.180.00137.2238.773.07242.52
Average0.200.58138.5637.593.08228.76
S3-white-10.291.28167.0636.462.29243.10
S3-white-20.270.00124.0036.972.78241.07
S3-white-30.250.00117.1436.461.54255.99
Average0.270.43136.0736.632.20246.72
S1-green-1 and S1-white-1 refer to the random first point of the green matrix and white bands, respectively, of S1, and so on.
Table 3. Molar composition of three Lvwen stone specimens.
The Number of Cations Based on Of.u. = 3Stoichiometric Number
S1-greenS2-greenS3-greenS1-whiteS2-whiteS3-whiteTotal
Average
Mg2+0.010.010.010.010.010.010.011.00
Ca2+0.960.960.960.970.970.970.97
Mn2+0.020.020.020.020.020.020.02
C4+1.001.001.001.001.001.001.001.00
S1-green and S1-white refer to the average chemical compositions of the green matrix and white bands, respectively, of S1, and so on.
Table 4. REE characteristics of three Lvwen stone specimens (all values in ppm).
S1-green-1S1-green-2S1-green-3S2-green-1S2-green-2S2-green-3S3-green-1S3-green-2S3-green-3Average
La3.363.644.143.333.743.163.273.483.683.53
Ce8.209.2310.407.848.927.878.648.329.048.72
Pr0.810.940.940.770.830.800.900.810.780.84
Nd4.054.665.064.154.423.804.293.834.344.29
Sm1.001.251.310.971.311.241.181.021.511.20
Eu0.380.510.500.510.480.380.430.400.480.45
Gd1.952.142.671.902.022.291.992.292.062.14
Tb0.390.400.440.370.400.370.420.370.410.40
Dy2.963.303.412.683.112.902.422.503.042.92
Ho0.790.820.940.680.760.740.770.690.780.77
Er2.462.622.712.292.362.122.382.082.652.41
Tm0.350.350.380.320.320.350.330.360.330.34
Yb2.462.502.722.272.542.492.112.262.352.41
Lu0.330.300.370.330.370.320.330.260.350.33
ΣREE29.4932.6635.9828.4231.5728.8329.4628.6731.8030.76
δCe1.201.211.271.181.231.191.221.201.29
δEu0.840.950.811.140.900.690.850.810.83
S1-white-1S1-white-2S1-white-3S2-white-1S2-white-2S2-white-3S3-white-1S3-white-2S3-white-3AverageChondrite *
La2.032.241.722.462.262.642.361.972.002.190.24
Ce4.935.594.055.875.656.646.145.215.395.500.61
Pr0.450.580.380.570.570.630.610.740.660.580.09
Nd2.412.631.802.742.763.422.992.452.532.640.46
Sm0.600.810.651.000.801.010.900.880.970.850.15
Eu0.280.240.210.270.310.340.250.330.300.280.06
Gd1.191.270.861.461.281.651.511.481.441.350.20
Tb0.200.250.190.240.240.240.230.350.320.250.04
Dy1.731.701.552.061.912.492.182.142.061.980.25
Ho0.410.500.350.490.520.580.590.540.500.500.05
Er1.331.581.091.681.561.861.681.471.061.480.16
Tm0.200.220.170.270.240.270.300.250.280.240.02
Yb1.261.491.131.751.631.831.751.581.631.560.16
Lu0.230.210.170.260.290.250.250.260.280.250.02
ΣREE17.2419.3114.3221.1120.0123.8721.7319.6419.4219.63
δCe1.241.181.221.201.201.251.241.041.13
δEu1.020.720.860.680.940.810.650.890.77
S1-green and S1-white refer to the average chemical compositions of THE green matrix and white bands, respectively, of S1, and so on. * The REE data of chondrites are from [11]. McDonough WF, Sun SS. The composition of the Earth. Chem Geol. 1995, 120, 223–253.
Publisher’s Note: MDPI stays neutral with regard to jurisdictional claims in published maps and institutional affiliations.