Article

Source Apportionment of Chemical Elements and Their Geochemical Baseline Values in Surface Water of the Parauapebas River Basin, Southeast Amazon, Brazil

by
Leandro Silva Quaresma
1,
Gessica da Silva e Silva
1,
Prafulla Kumar Sahoo
1,2,*,
Gabriel Negreiros Salomão
1 and
Roberto Dall’Agnol
1,3
1
Instituto Tecnológico Vale (ITV), Rua Boaventura da Silva, 955, Belém 66055-090, Pará, Brazil
2
Department of Environmental Science and Technology, Central University of Punjab, V.P.O Ghudda, Bathinda 151401, Punjab, India
3
Programa de Pós-Graduação em Geologia e Geoquímica, Geoscience Institute, Universidade Federal do Pará (UFPA), Rua Augusto Corrêa, 1, Belém 66075-110, Pará, Brazil
*
Author to whom correspondence should be addressed.
Minerals 2022, 12(12), 1579; https://doi.org/10.3390/min12121579
Submission received: 23 October 2022 / Revised: 30 November 2022 / Accepted: 2 December 2022 / Published: 9 December 2022
(This article belongs to the Special Issue Concentration and Distribution of Heavy Metals in Soils, Volume II)

Abstract

:
The present work aims to evaluate the chemical quality and establish the geochemical baseline values of elements in the surface waters of the Parauapebas River basin (PRB), which is one of the major subbasins in the Itacaiúnas River watershed (IRW) located in the Brazilian Amazon. A total of 327 surface water samples were collected during the rainy and dry seasons in 2017. Results indicate that waters are slightly acidic to alkaline (pH 6 to 8), and there was a strong influence of the seasonal variation on water quality, with higher values of turbidity, Fe, Al, Mn, TDS, etc. in the rainy season. Two geochemical baseline types for the PRB were defined, i.e., ‘conservative baseline’ (CB), represented by the cumulative frequency curve, and the ‘environmental baseline’ (EB), comprising the sum of natural and diffuse anthropogenic contributions, represented by the 98th percentile. Except Fe, Mn and Al, the CB and EB values of various trace elements (Ba, Co, Cr, Cu, Ni, Rb, Sn, Sr, Ti, V and Zn) were lower than the recommended limits of CONAMA 357/05—class 2. The principal component analysis (PCA) identified the major geochemical association (Al-Ti-Cu-Cr-Ni-V), which is an imprint of the local geological setting. Ni and Cr showed enrichment at sites where mafic and ultramafic rocks are concentrated, while Cu concentration is mainly associated with the north and south mineralization belts. High concentrations of Fe and Mn are characteristic of the waters of this region and this is mostly influenced by specific land use activities and intense weathering/erosion of catchment materials. At the upper Parauapebas, anthropogenic contributions associated with soil use and occupation were also important along with the geogenic effects. The obtained results regarding sources of contaminants in some microbasins can be taken as a starting point for future studies on the environmental quality of the region’s water resources.

1. Introduction

Rivers/streams are open and dynamic environmental compartments whose chemical and microbiological composition of water is extremely vulnerable to several natural and anthropic factors [1]. The natural factors/processes include soil and rock type, rate of chemical weathering and erosion, vegetation cover, topography, seasonal climate conditions such as precipitation and temperature [1,2,3,4] and biogeochemical cycles [5,6]. Moreover, chemical characteristics of surface waters can be modified through naturally enriched elements in rocks and ores existing in adjacent areas [2,3,7]. In recent years, several anthropogenic interferences such as effluent dumping, domestic sewage, mining, agricultural activities, use of fertilizers, manures and pesticides, urbanization, etc. also put a huge pressure on water quality by releasing various contaminants directly into the aquatic bodies [8,9]. Therefore, it is crucial to understand the source and level of contaminants in the water body.
To assess surface water quality, it is important to define ‘geochemical baseline’ or ‘geochemical background’ values for chemical elements, as they provide the differentiation of the origin of geochemical anomalies, which may be of geogenic or anthropogenic origin [2,3]. However, this task is quite complex due to the fact that surface waters represent a thermodynamically open system and there are multiple potential sources of change in their environmental conditions [1]. Understanding these processes requires high-density sampling, together with spatial mapping based on a geographic information system—GIS—and its correlation with local lithology and anthropogenic agents, as well as the application of statistical techniques [2,10,11,12]. The concept of geochemical background/baseline has been approached by numerous scientists from different areas and there are different definitions for it [11,13]. Gałuszka [14] presented a synthesis of the existing concepts on ‘geochemical background’ and ‘geochemical baseline’. Initially, the term ‘baseline’ was used as the current concentration of chemical elements in a contemporary environmental sample [15]. However, other authors point out that ‘baseline’ is sometimes used as a synonym for ‘background’ and should correspond to an interval. It is usually represented by the concentration of a particular element in a sample taken on a specific date for a particular place, which is used as a reference to evaluate the future changes [11], while threshold value corresponds to the upper limit of the background/baseline variation [11]. However, it is often impossible to determine natural geochemical background concentrations in waters, as there is significant temporal and spatial variability in this medium. According to Nriagu [16], even in relatively clean areas, the displacement of pollutants in the air, released by natural erosion and by anthropogenic sources, potentiates the water with various elements, which compromises a precise determination of geochemical background values. In addition, geological, biological, climatic and hydrological conditions can also make it difficult to estimate baseline values in surface waters. They can influence water quality and cause enrichment of chemical element concentrations [13,17]. Therefore, estimating ‘natural baseline’ values is practically impossible and the term ‘environmental baseline’ is preferentially adopted, which comprises the effects of natural sources plus diffuse anthropogenic sources [18]. In view of the extensive discussion regarding the terms baseline and background, in this work the term ‘geochemical baseline’ was used, as it is most appropriate for surface waters.
Assessing water quality has become increasingly concerning and relevant for several river basins, including the southeastern Amazon, Brazil [19,20,21]. The northern region still lacks water quality monitoring and surveillance records [22]. In the Itacaiúnas River watershed (IRW), located in the southeastern region of the Amazon, the monitoring of surface water quality is very relevant because the region is located in the Carajás Mineral Province, where there are several large mining projects, including Sossego and Salobo copper mines, N4, N5, S11D and Serra Leste iron mines and Onça-Puma nickel mine and the Azul and Buritirama Manganês mines are now in operation. Since the 1970s, the IRW has presented significant changes in land use and land cover and in hydroclimatology [23]. The region was the target of an intense process of deforestation, mainly related to the expansion of extensive cattle ranching [24]. Such changes caused changes in the landscape, ecosystems and also affected the processes of flow and discharge of rivers in the basin [25,26,27]. The intense changes in the IRW have caused the degradation of riparian areas [28] and caused changes in the hydrological cycle [29]. In addition, questions have been raised about possible contamination generated by the mineral industry, particularly in the areas of influence of Onça-Puma mining in the Cateté River basin and in the Igarapé Gelado area, located immediately north of the N4 iron mines, and N5 in Carajás. In this sense, the lack of more consistent knowledge about the geochemistry of the waters in this region is worrying, as this makes it difficult to assess the possible impact of mining and prevents decision-making based on scientific data. To allow a clear visualization of the current geochemical conditions of the basin and create the bases for its monitoring, the Vale Institute of Technology (ITV), Belém, Brazil develops the research project ‘Itacaiúnas Geochemical Mapping and Background project’ (ItacGMB), in which the present research is included. Surface water studies carried out in areas close to the N4 and N5 iron mines in Carajás [30] and in the basins of the Vermelho and Sororó Rivers [3] and the entire basin [2] have already been reported. The present study is specifically focused on the Parauapebas River basin (PRB) as there is a lack of detailed information about the quality and geochemistry of surface waters of this sub-basin and a significant number of people and communities depend on this river and its tributaries to meet their diverse water needs.
The objective of this work is to evaluate the chemical quality of surface waters and to define geochemical baseline values for the Parauapebas River basin, located in the central portion of the IRW. The specific objectives are to: (i) evaluate the surface water quality and its compliance with CONAMA resolutions 357/05—class 2 [31] and WHO/1993 [32]; (ii) understand the spatial and seasonal variations of water quality parameters and their controlling factors; and (iii) define geochemical baseline values of different chemical elements in surface waters. This will allow for the monitoring of future human actions on the natural environment, provide a way to more accurately measure potential environmental impacts and be essential for directing mitigating actions.

2. Materials and Methods

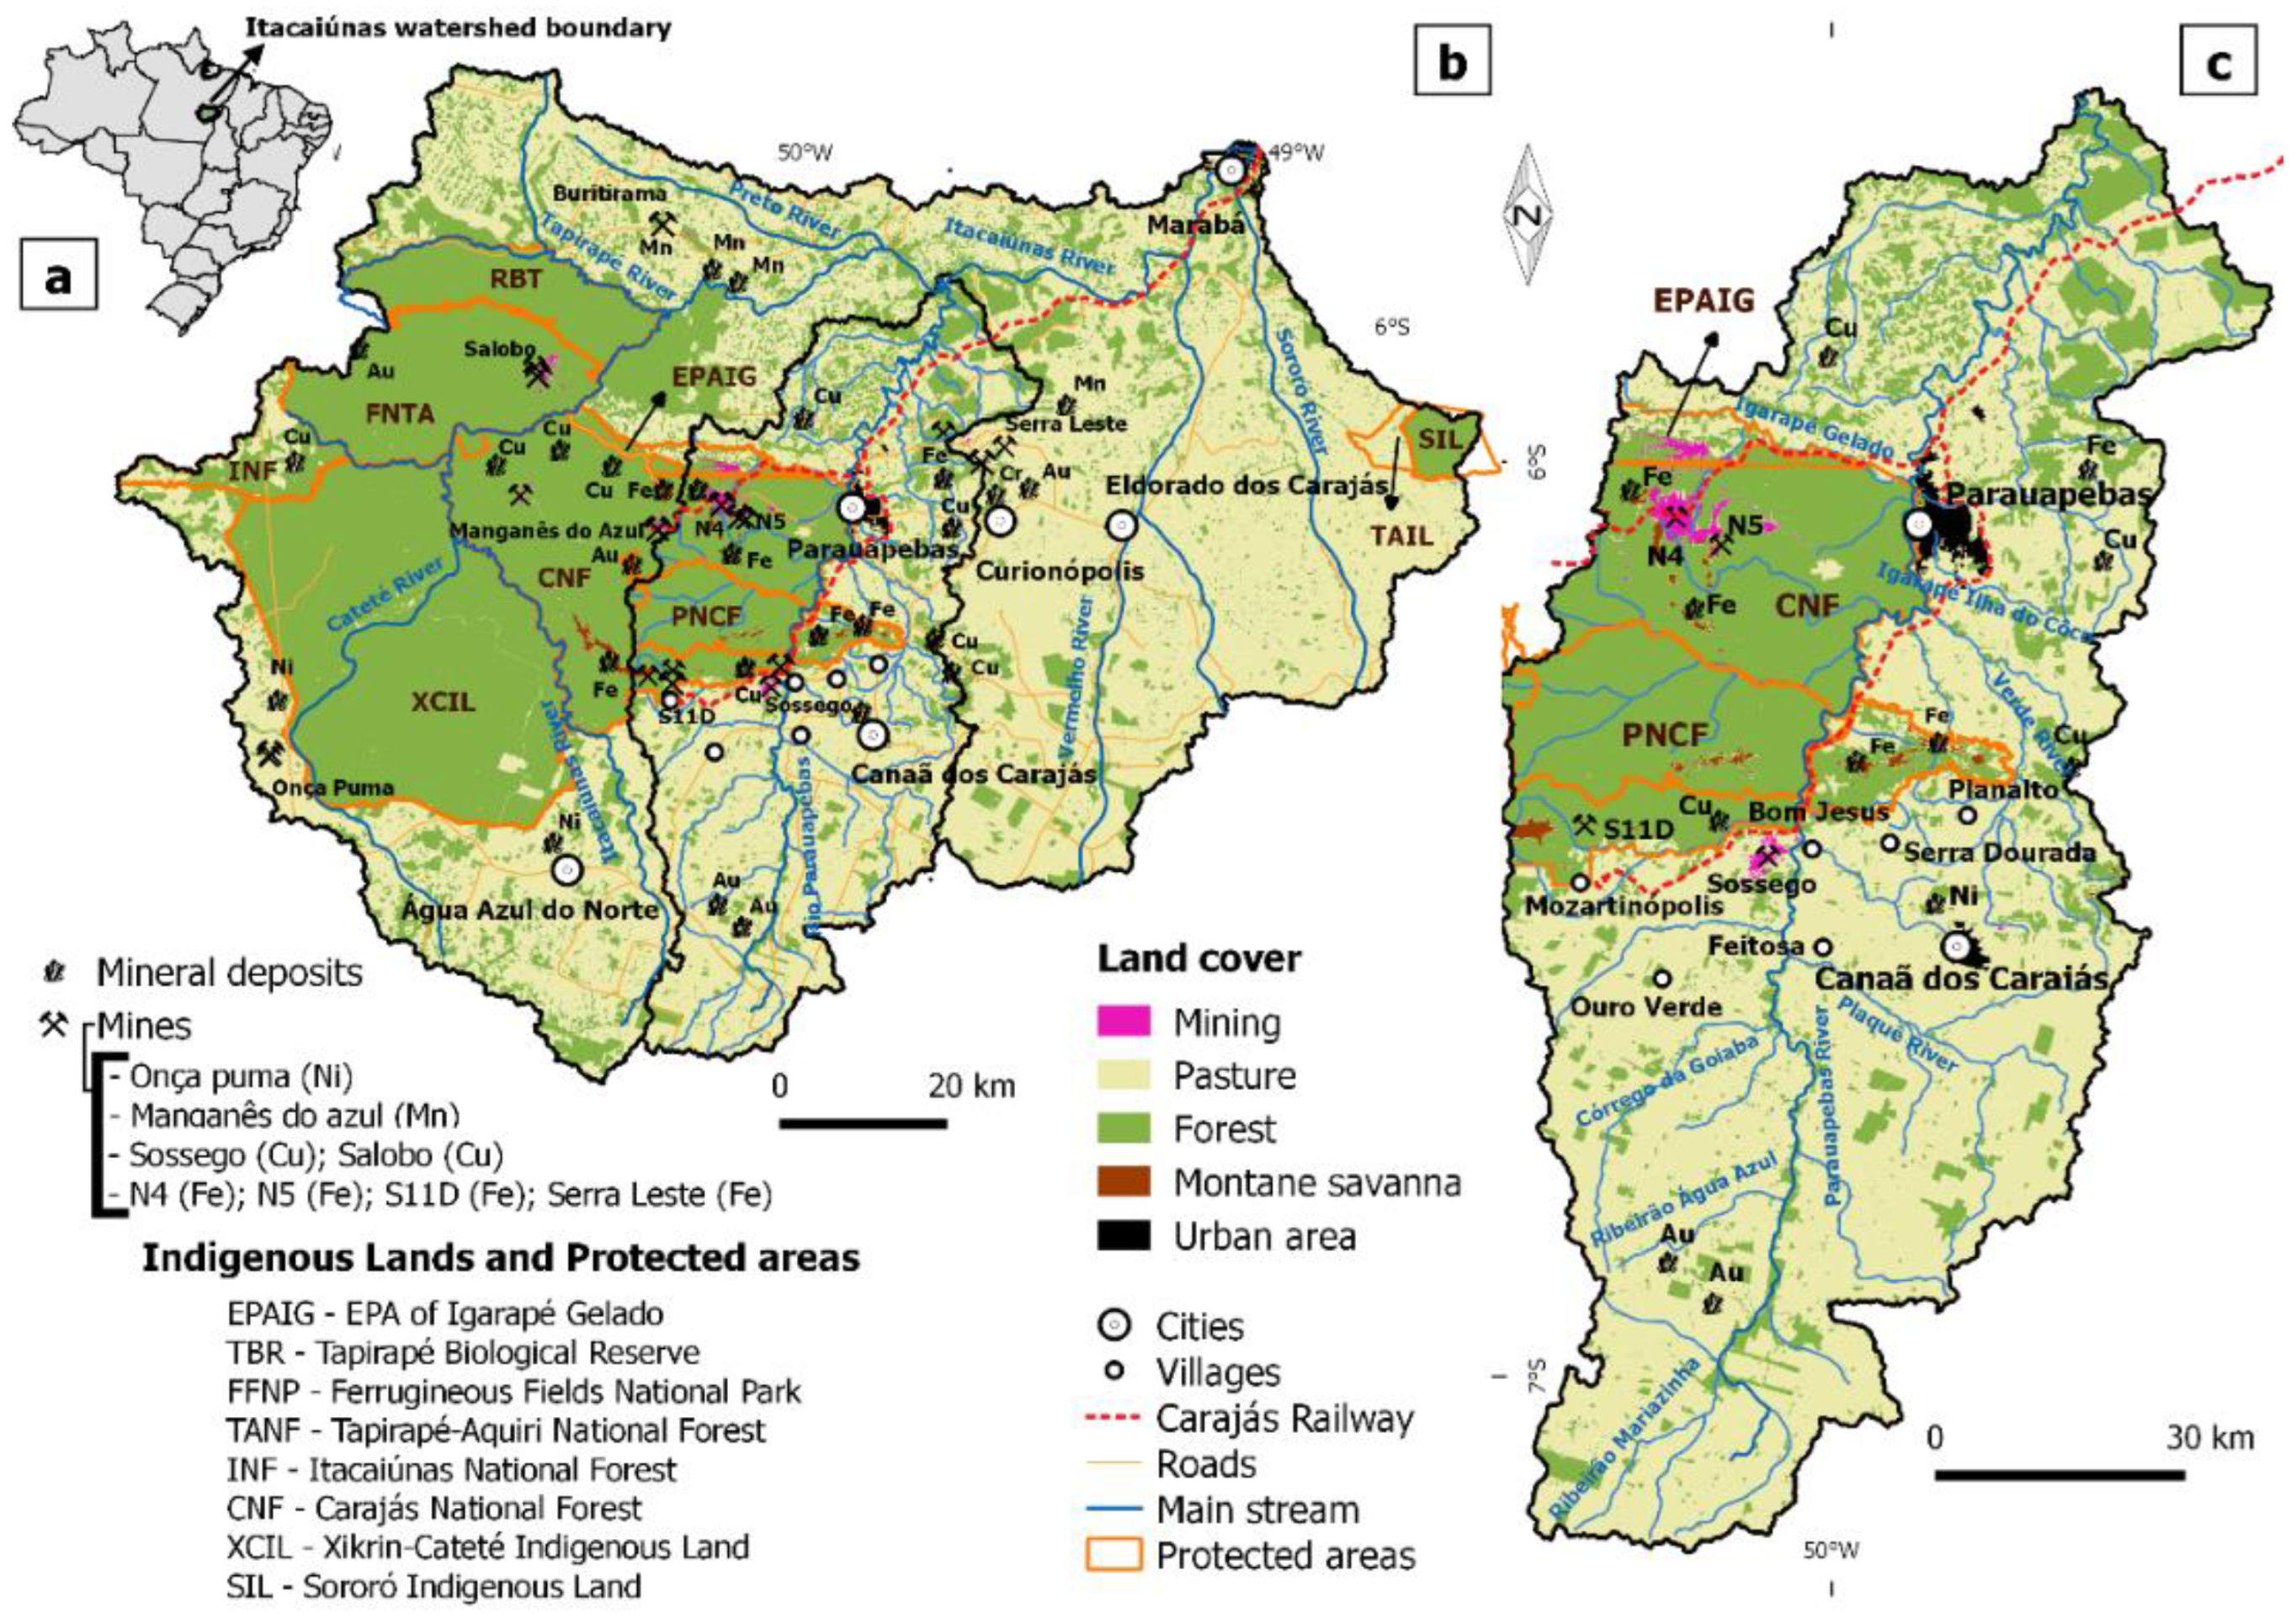
2.1. Characteristics of the Study Area

Itacaiúnas River watershed—IRW—is located in the southeast of the state of Pará (Figure 1a) and approximately 600 km south of the equator [23]. The study region, the Parauapebas River basin—PRB (Figure 1c)—has an area of 9522 km2 and is located in the Carajás Mineral Province and in the IRW, which includes part or all of six municipalities, namely: Marabá, Parauapebas, Curionópolis, Eldorado dos Carajás, Canaã dos Carajás and Água Azul do Norte, as well as active mines of Fe, Ni, Cu and Mn (Figure 1b). In terms of land use and land cover, the region was almost entirely covered by tropical forest, but pasture lands are currently predominant, and the remaining forests are found in protected areas that constitute the mosaic of conservation units of Carajás (Figure 1b), comprising: Tapirapé Biological Reserve (IBR), Tapirapé-Aquiri National Forest (TANF), Itacaiúnas National Forest (INF), Igarapé Gelado Environmental Protection Area (APA-IG), Carajás National Forest (CNF), Ferruginosos Field National Park (FFNP) and Xikrin-Cateté Indigenous Land (XCIL). Outside the Carajás mosaic, in the extreme northeast of the basin, are the Sororó (SIL) and Tuwa Apekuokawera (TAIL) indigenous lands. In the study region, PRB (Figure 1c), there are significant contrasts in terms of geological aspects, soils, rainfall and especially land use and occupation, which ensures diversified landscapes. It includes the cities of Parauapebas, the sixth most populous in the state of Pará, and Canaã dos Carajás, both with less than 50% of their sewage treated [33]. In addition, in these two municipalities, there are several villages located in the vicinity, such as: Mozartinópolis, Ouro Verde, Feitosa, Bom Jesus, Serra Dourada and Planalto (Figure 1c). The region has been deforested for decades, mainly for livestock use [23], in a similar way to what has been observed throughout the IRW.

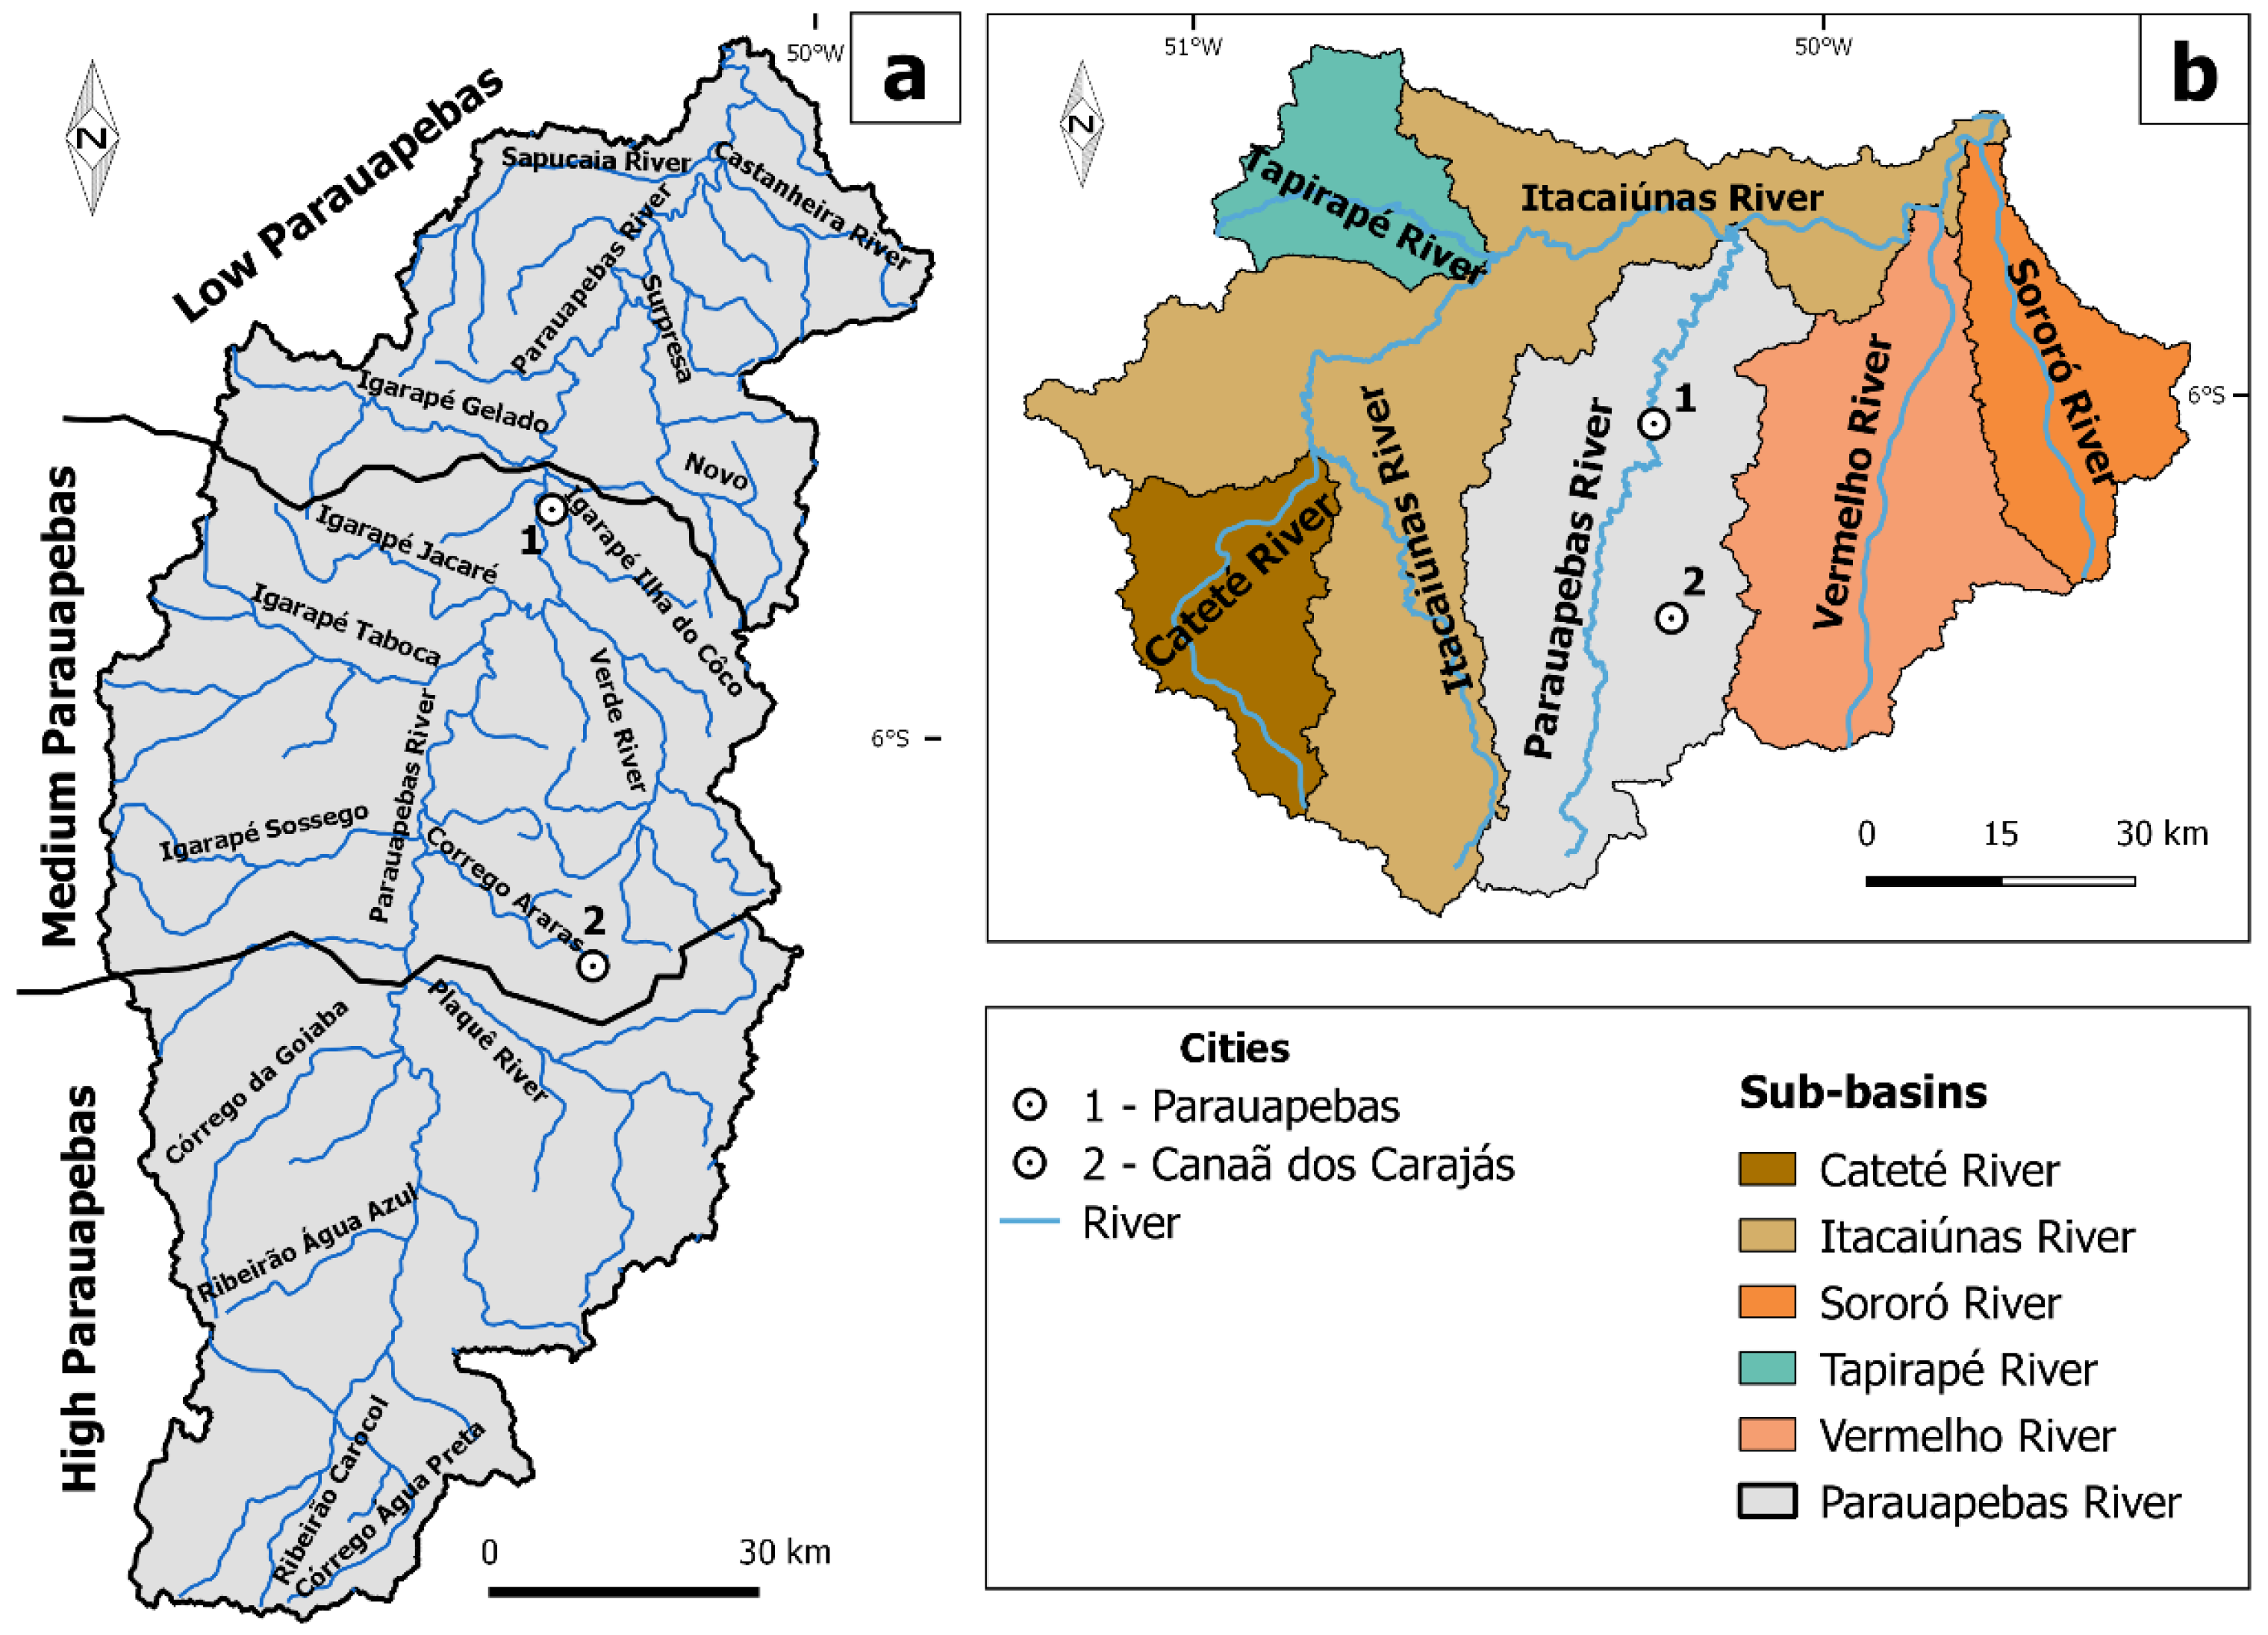
2.2. Hydrography, Vegetation and Climate

The IRW is divided into six main subbasins, namely: Cateté, Itacaiúnas, Tapirapé, Parauapebas, Vermelho and Sororó Rivers (Figure 2b). The Parauapebas River is one of the main tributaries of the Itacaiúnas River (Figure 2) and it always moves towards the north (Figure 2a). The drainages in the study region do not have a defined framework. Therefore, according to Art. 42 of CONAMA resolution 357/05, PRB’s watercourses were considered as class 2. The tributary drainages of the upper Parauapebas are mostly intermittent, as their main source of supply is rainfall. As this is drastically reduced in the dry season, several tributaries of this stretch of the Parauapebas River are completely dry and the Parauapebas itself starts to flow over the regional base level, presenting a rocky bed and little lateral contribution [34]. The middle and lower Parauapebas are supplied by perennial streams that descend from Serra dos Carajás and protected areas, covered by tropical forest and also by underground aquifers, their drainage being perennial and with the possibility of navigation in certain stretches. When moving in the S-N direction, that is, from upstream to downstream of the river, changes are observed not only in terms of river flow, but also in terms of vegetation and riparian forest along the Parauapebas River, resulting in different scenarios, merging protected areas and stretches with urban occupation (Figure 2b). The vegetation cover varies a lot and there can be found forest of igapó, forest of floodplain, forest of terra firme, forest of vine and dry forest. These types depend on soil characteristics and physical variables such as humidity, altitude, slope, pH, permeability, degree of flooding, etc. [35].
As for the climate of the region, according to the Köppen classification [36], it has a tropical, hot and humid climate, with an average annual temperature of 27.2 °C, with an annual relative humidity of 80%. Precipitation in the region presents spatial and seasonal variation, with a strong contrast between the rainy season, which extends from November to April, with March being the most representative, reaching a monthly average of 299.10 mm of precipitation, and the dry period is from May to October, with June being the month with the lowest rainfall, with an average of 20.52 mm [27].

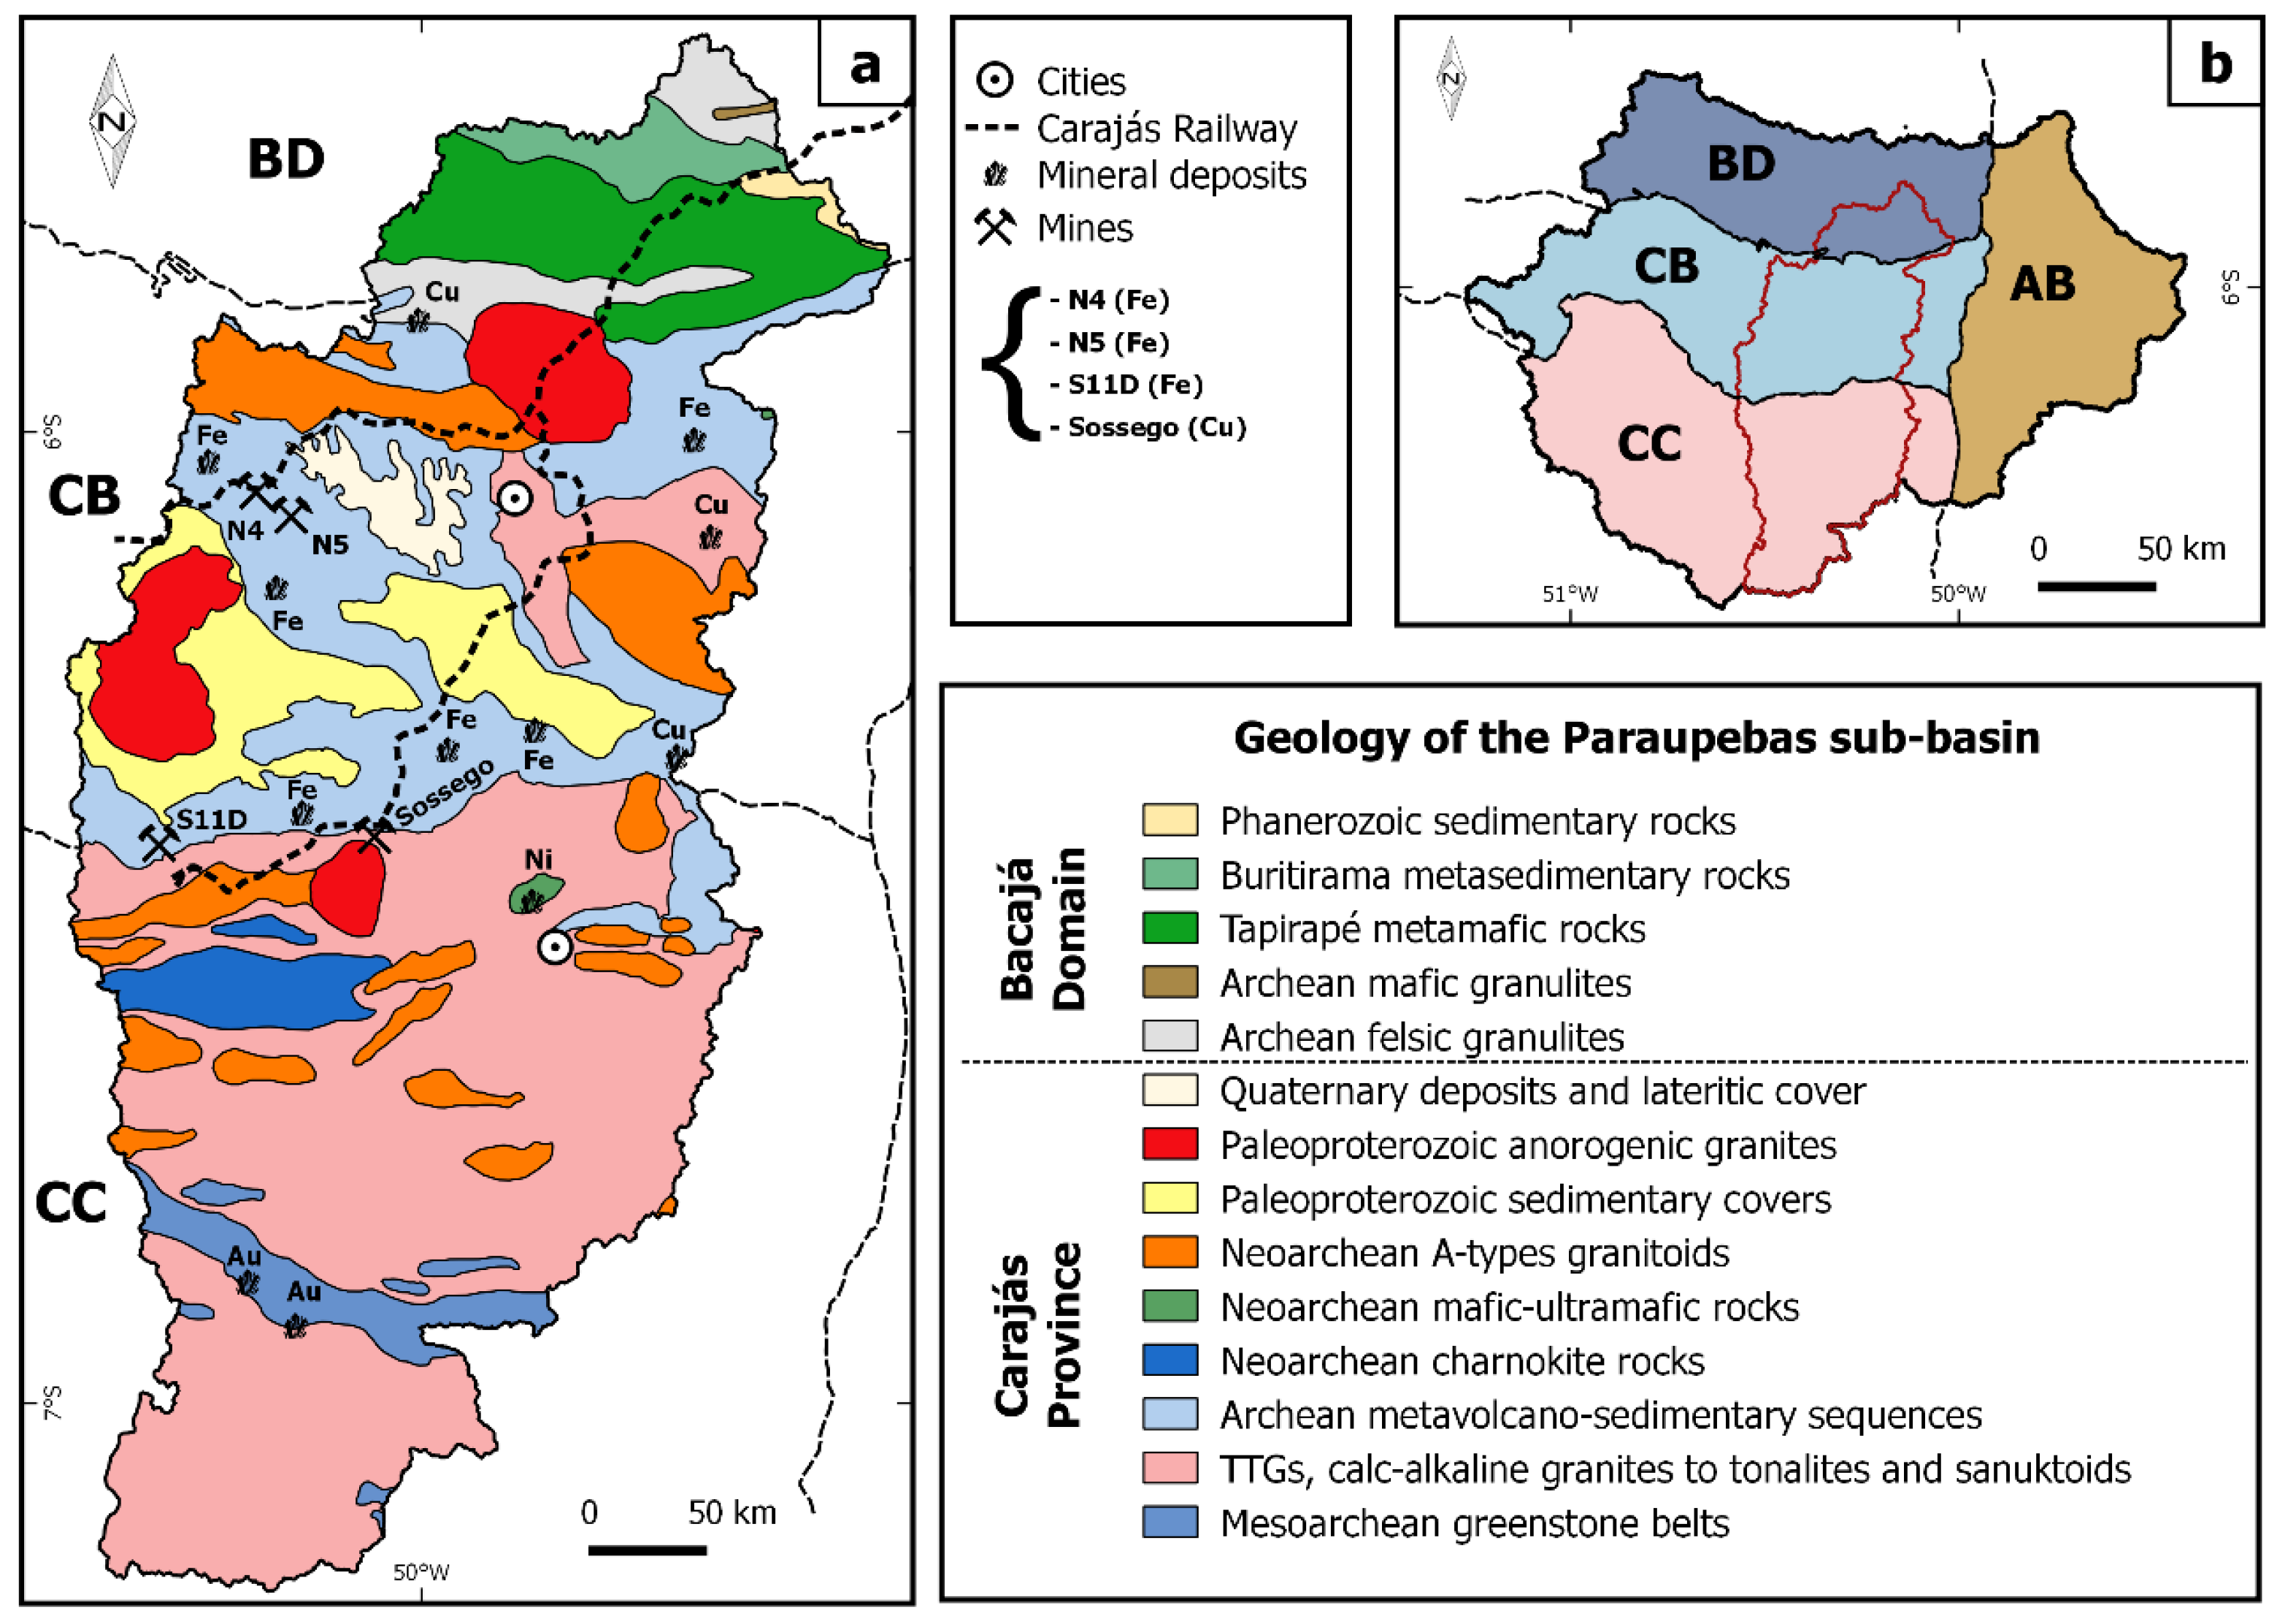
2.3. Geological Setting of the Region
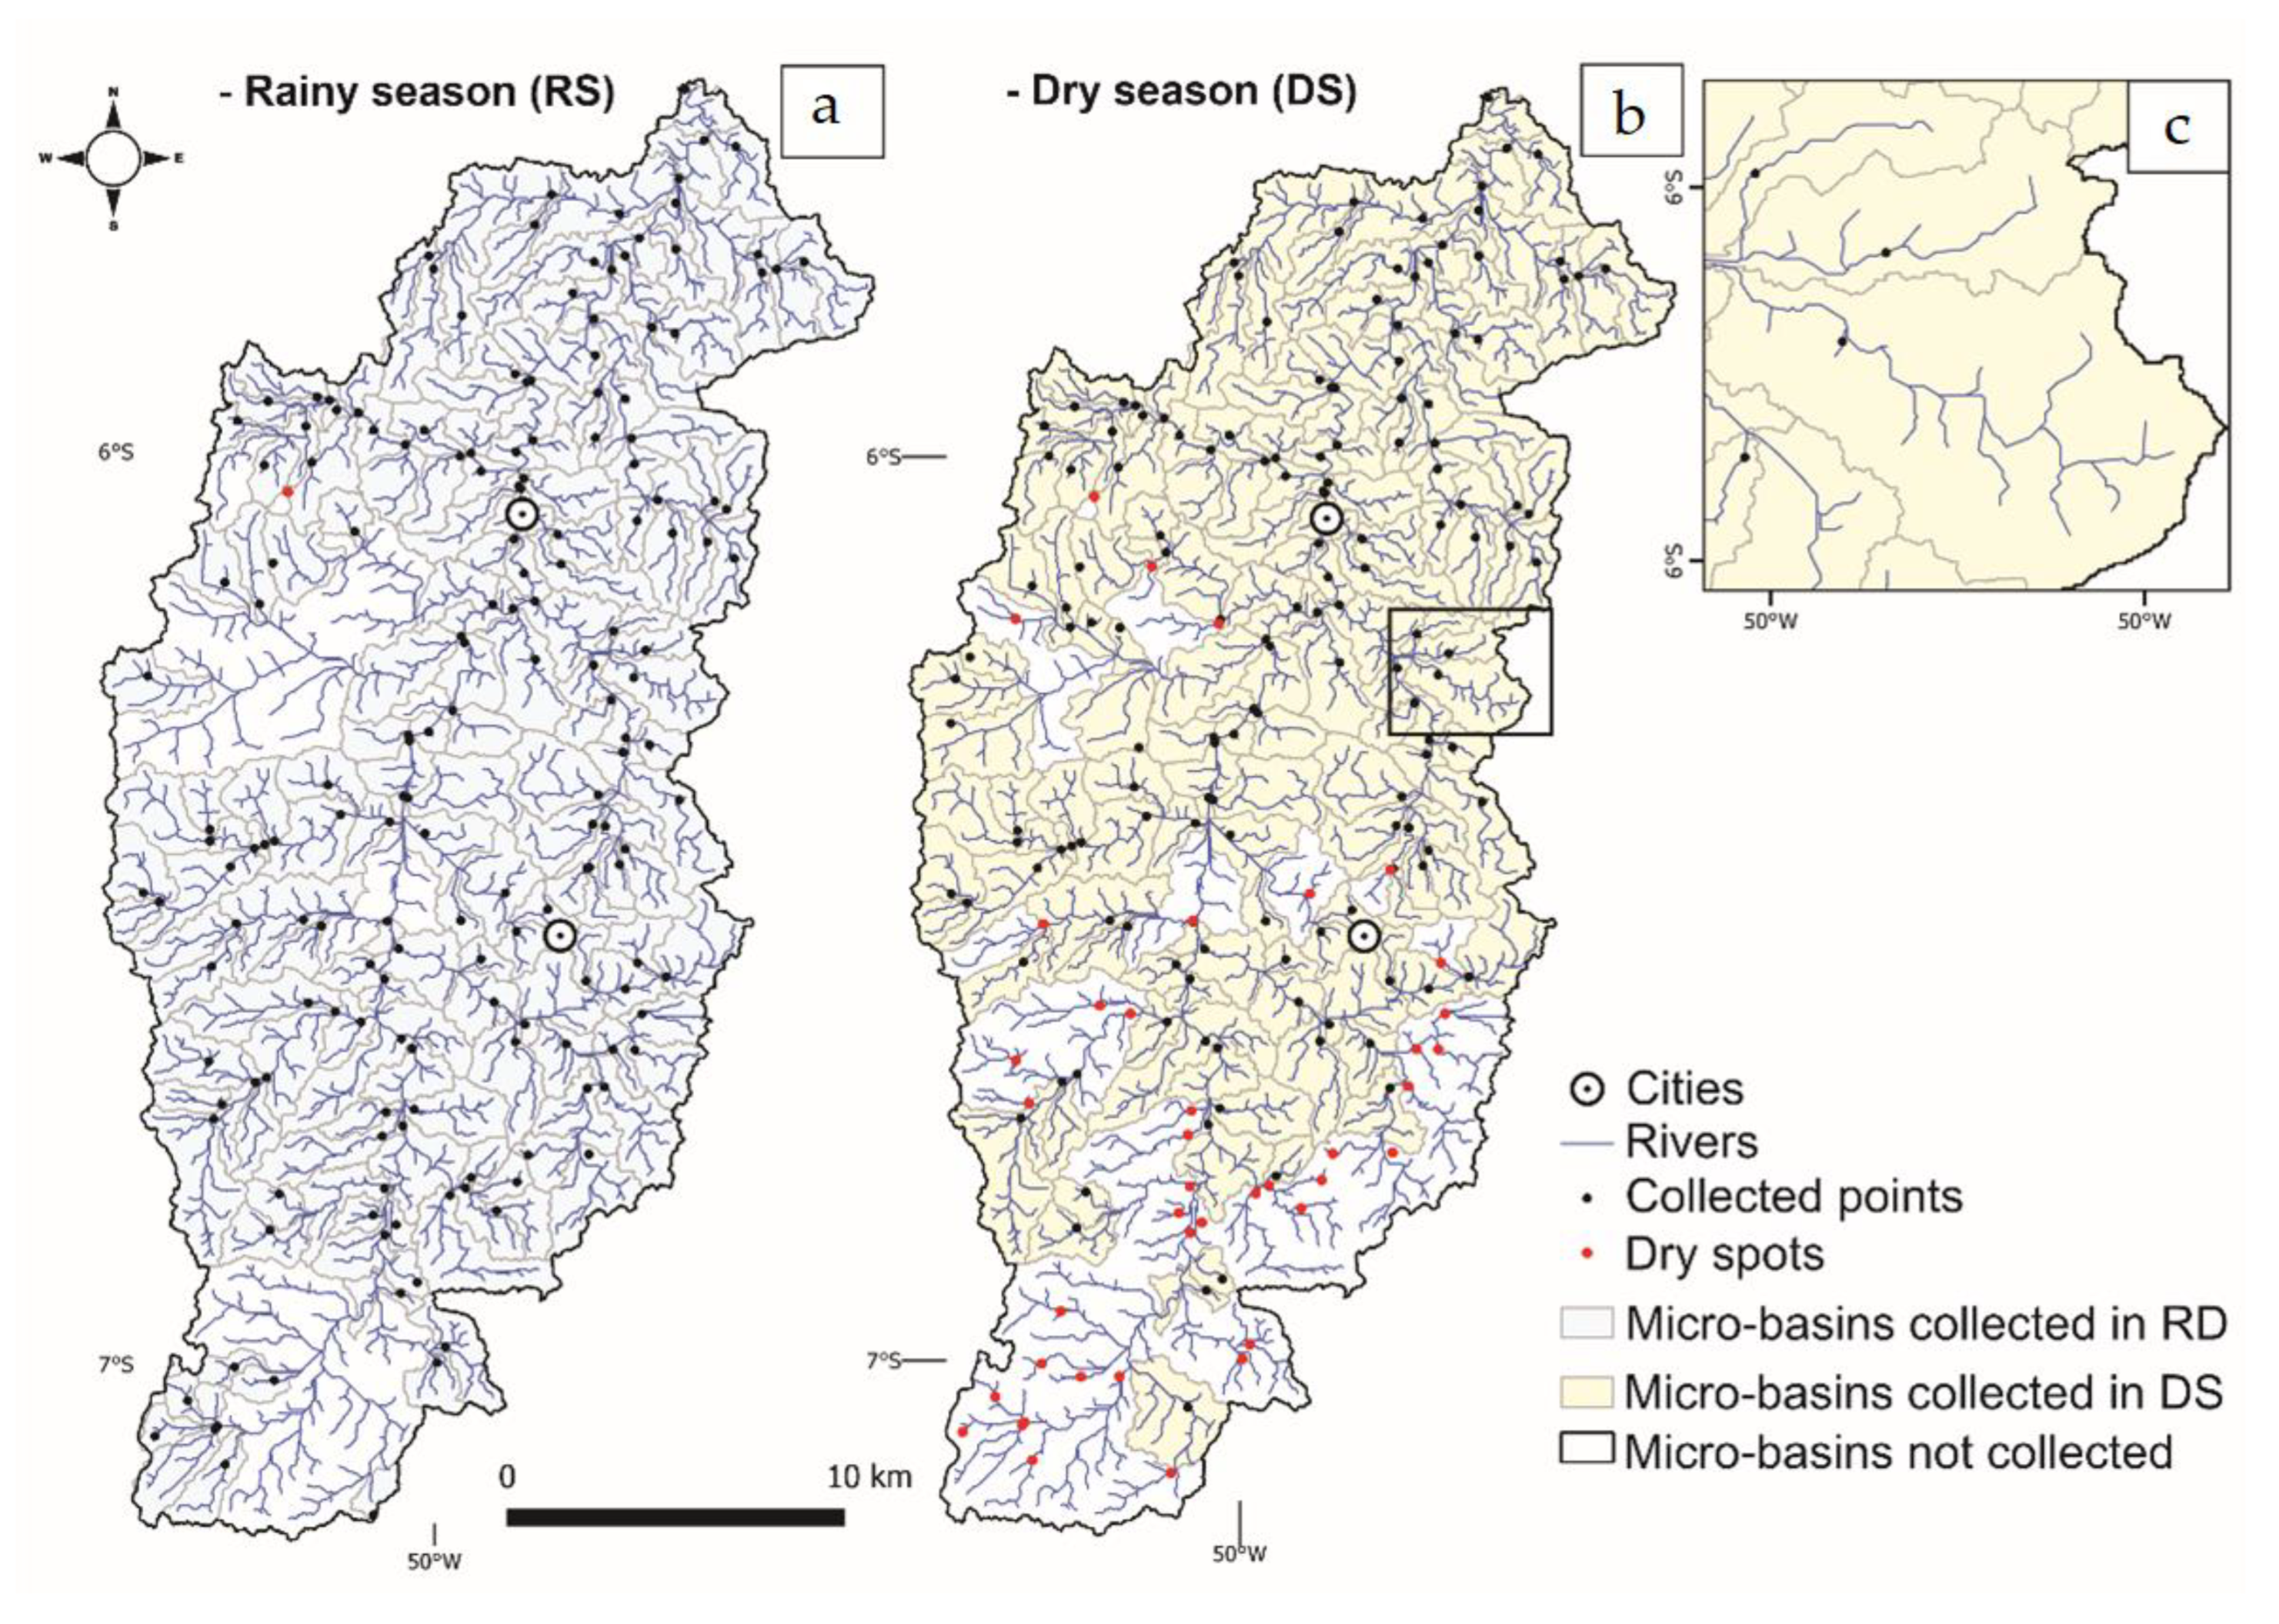
The Carajás Province, a section of the Archean crust in the southeast of the Amazon Craton [37], is well known for its great metallogenetic potential. It can be divided into four tectonic domains, to put it simply (Figure 3): in the northern portion, the Bacajá domain (BD), whose evolution started in the Archean, but was concentrated in the Paleoproterozoic period [37]; in the central–west portion, the Carajás Basin (CB), formed basically by Neoarchean supracrustal units [38]; in the southern portion, the Canaã dos Carajás, Sapucaia and Rio Maria (CC) domains, with Mesoarchean to Neoarchean ages and consisting mainly of granitoid rocks [39,40] and, finally, the Araguaia Belt (AB), located in the eastern portion of the basin and formed at the end of the Neoproterozoic to the beginning of the Phanerozoic [41]. The PRB is located in the BD, CB and CC domains (Figure 3b), which are home to several active mines and mineral deposits. The BD (Figure 3a) contains Archean felsic and mafic granulites, metasedimentary lithotypes from the manganese-rich Buritirama Formation and mafic rocks from the Tapirapé Formation, in addition to Phanerozoic sedimentary covers. In the CB, mafic metavolcanic rocks with associated banded iron formations largely predominate [37,38]. It contains the N4, N5 and S11D mines and other large iron mineral deposits (Figure 3a). Neoarchaean or Paleoproterozoic type A granitic body also occurs in this domain, with the basement of the basin formed by tonalite–trondhjemite (TTG) associations and calc-alkaline granites [40]. In addition, Paleoproterozoic and Phanerozoic sedimentary covers are found, as well as lateritic covers and Quaternary deposits. In the CC (Figure 3a), where the Sossego mine is located, granitoid rocks, such as TTGs, calc-alkaline granites to tonalites, magnesium-rich (sanukitoids), Neoarchean type A granites and Paleoproterozoic anorogenic granites predominate. In addition, there are metamafic sequences (greenstone belts), charnochitic rocks and Neoarchean mafic–ultramafic rocks, where nickel deposits are located [37,38,39].

2.4. Sampling

The surface water samples were collected in two different periods, during the rainy season from March to May, and during the dry season from August to October, in the year 2017. Samples were collected from each watershed (Figure 4), preferably in the central channel of the river. The location of the sampling points was selected based on the proximity of the mouth of the main drainage of the microbasin (topography), geology and land use and cover. The company Bioagri Ambiental Ltd., Brazil was responsible for the sample collections under the supervision of the project’s technical team. A single sample was collected and divided into two aliquots: one aliquot of 30 mL for the determination of anions and Ptotal and another aliquot of 60 mL was acidified with 1 M ultrapure nitric acid (pH < 2) immediately after collection for the analysis of metallic elements. After collection, all samples were immediately stored at <4 °C in an ice box and sent to the laboratory for chemical analysis. In different watersheds, 175 samples were collected in the rainy season with only one dry point (Figure 4), and 152 samples were collected in the dry season (Figure 4), with 41 dry points recorded. In both periods, a limited number of watersheds could not be sampled, as they were not allowed to enter certain properties and some drainages did not have access conditions or were completely dry, a fact observed especially in the dry season. The vast majority of these intermittent drainages are located in the upper reaches of the Parauapebas River. To ensure data reliability, 22 samples were collected in duplicate, at a rate of one duplicate for every 15 samples. Sampling and sample preservation procedures were performed following the Standard Methods for Examination of Water and Sewage [42].

2.5. Water Quality Parameters and Analytical Techniques

Physico-chemical parameters such as temperature, pH, dissolved oxygen (DO), redox potential (Eh) and electrical conductivity (EC) were measured in situ with a multiparametric probe (Hanna model 98194), while total dissolved solids (TDS) and turbidity were analyzed in the laboratory using gravimetric and nephelometric methods, respectively. The anions such as nitrate (NO3), sulfate (SO42−), fluoride (F) and chloride (Cl) were analyzed by ion chromatography and total phosphorus (Ptotal) was measured using the colorimetric method after acid digestion. The total concentrations of 35 chemical elements were analyzed by an inductively coupled plasma mass spectrometer (ICP-MS), following the methods described by the SMWW and the preparation techniques recommended by the EPA. All chemical analyses were carried out in the certified laboratories of the company Bioagri Ambiental Ltd. in the city of Piracicaba, Brazil, following the analytical procedures adopted in SMWW [42].

3. Results

3.1. Basic Characteristics

The physical–chemical parameters, anions and elements along with the percentage of samples that presented results below the DL are presented in Table S1. Among the 47 parameters analyzed (Supplementary Table S1), 31 showed statistical relevance and were suitable for more in-depth approaches and discussions. The other elements (Ag, As, Be, Cd, Pb, Pb, Sb, Se, Ce, Cs, Ga, La, W, Hf, Mo, Tl and Hg), among them some considered potentially toxic elements such as As, Cd, Pb and Hg, presented values below the detection limit—DL—in more than 88% of the samples. These elements were not subjected to statistical calculations. In the PRB, high concentrations of Fe were observed, above 1 mg/L in more than 90% of the samples in the rainy season and in 52% in the dry season. Thus, it is evident that it is an element with high concentrations in surface waters, a fact commonly observed in the region of Carajás, where the IRW is located, as already registered in other studies [3,30]. Although the concentrations of NO3, SO42−, F, B, Co, Cr, Ni and V were below the DL in a significant percentage of samples, these parameters were retained considering the available results with values above the DL being relevant for the present study.

3.2. Descriptive Statistics

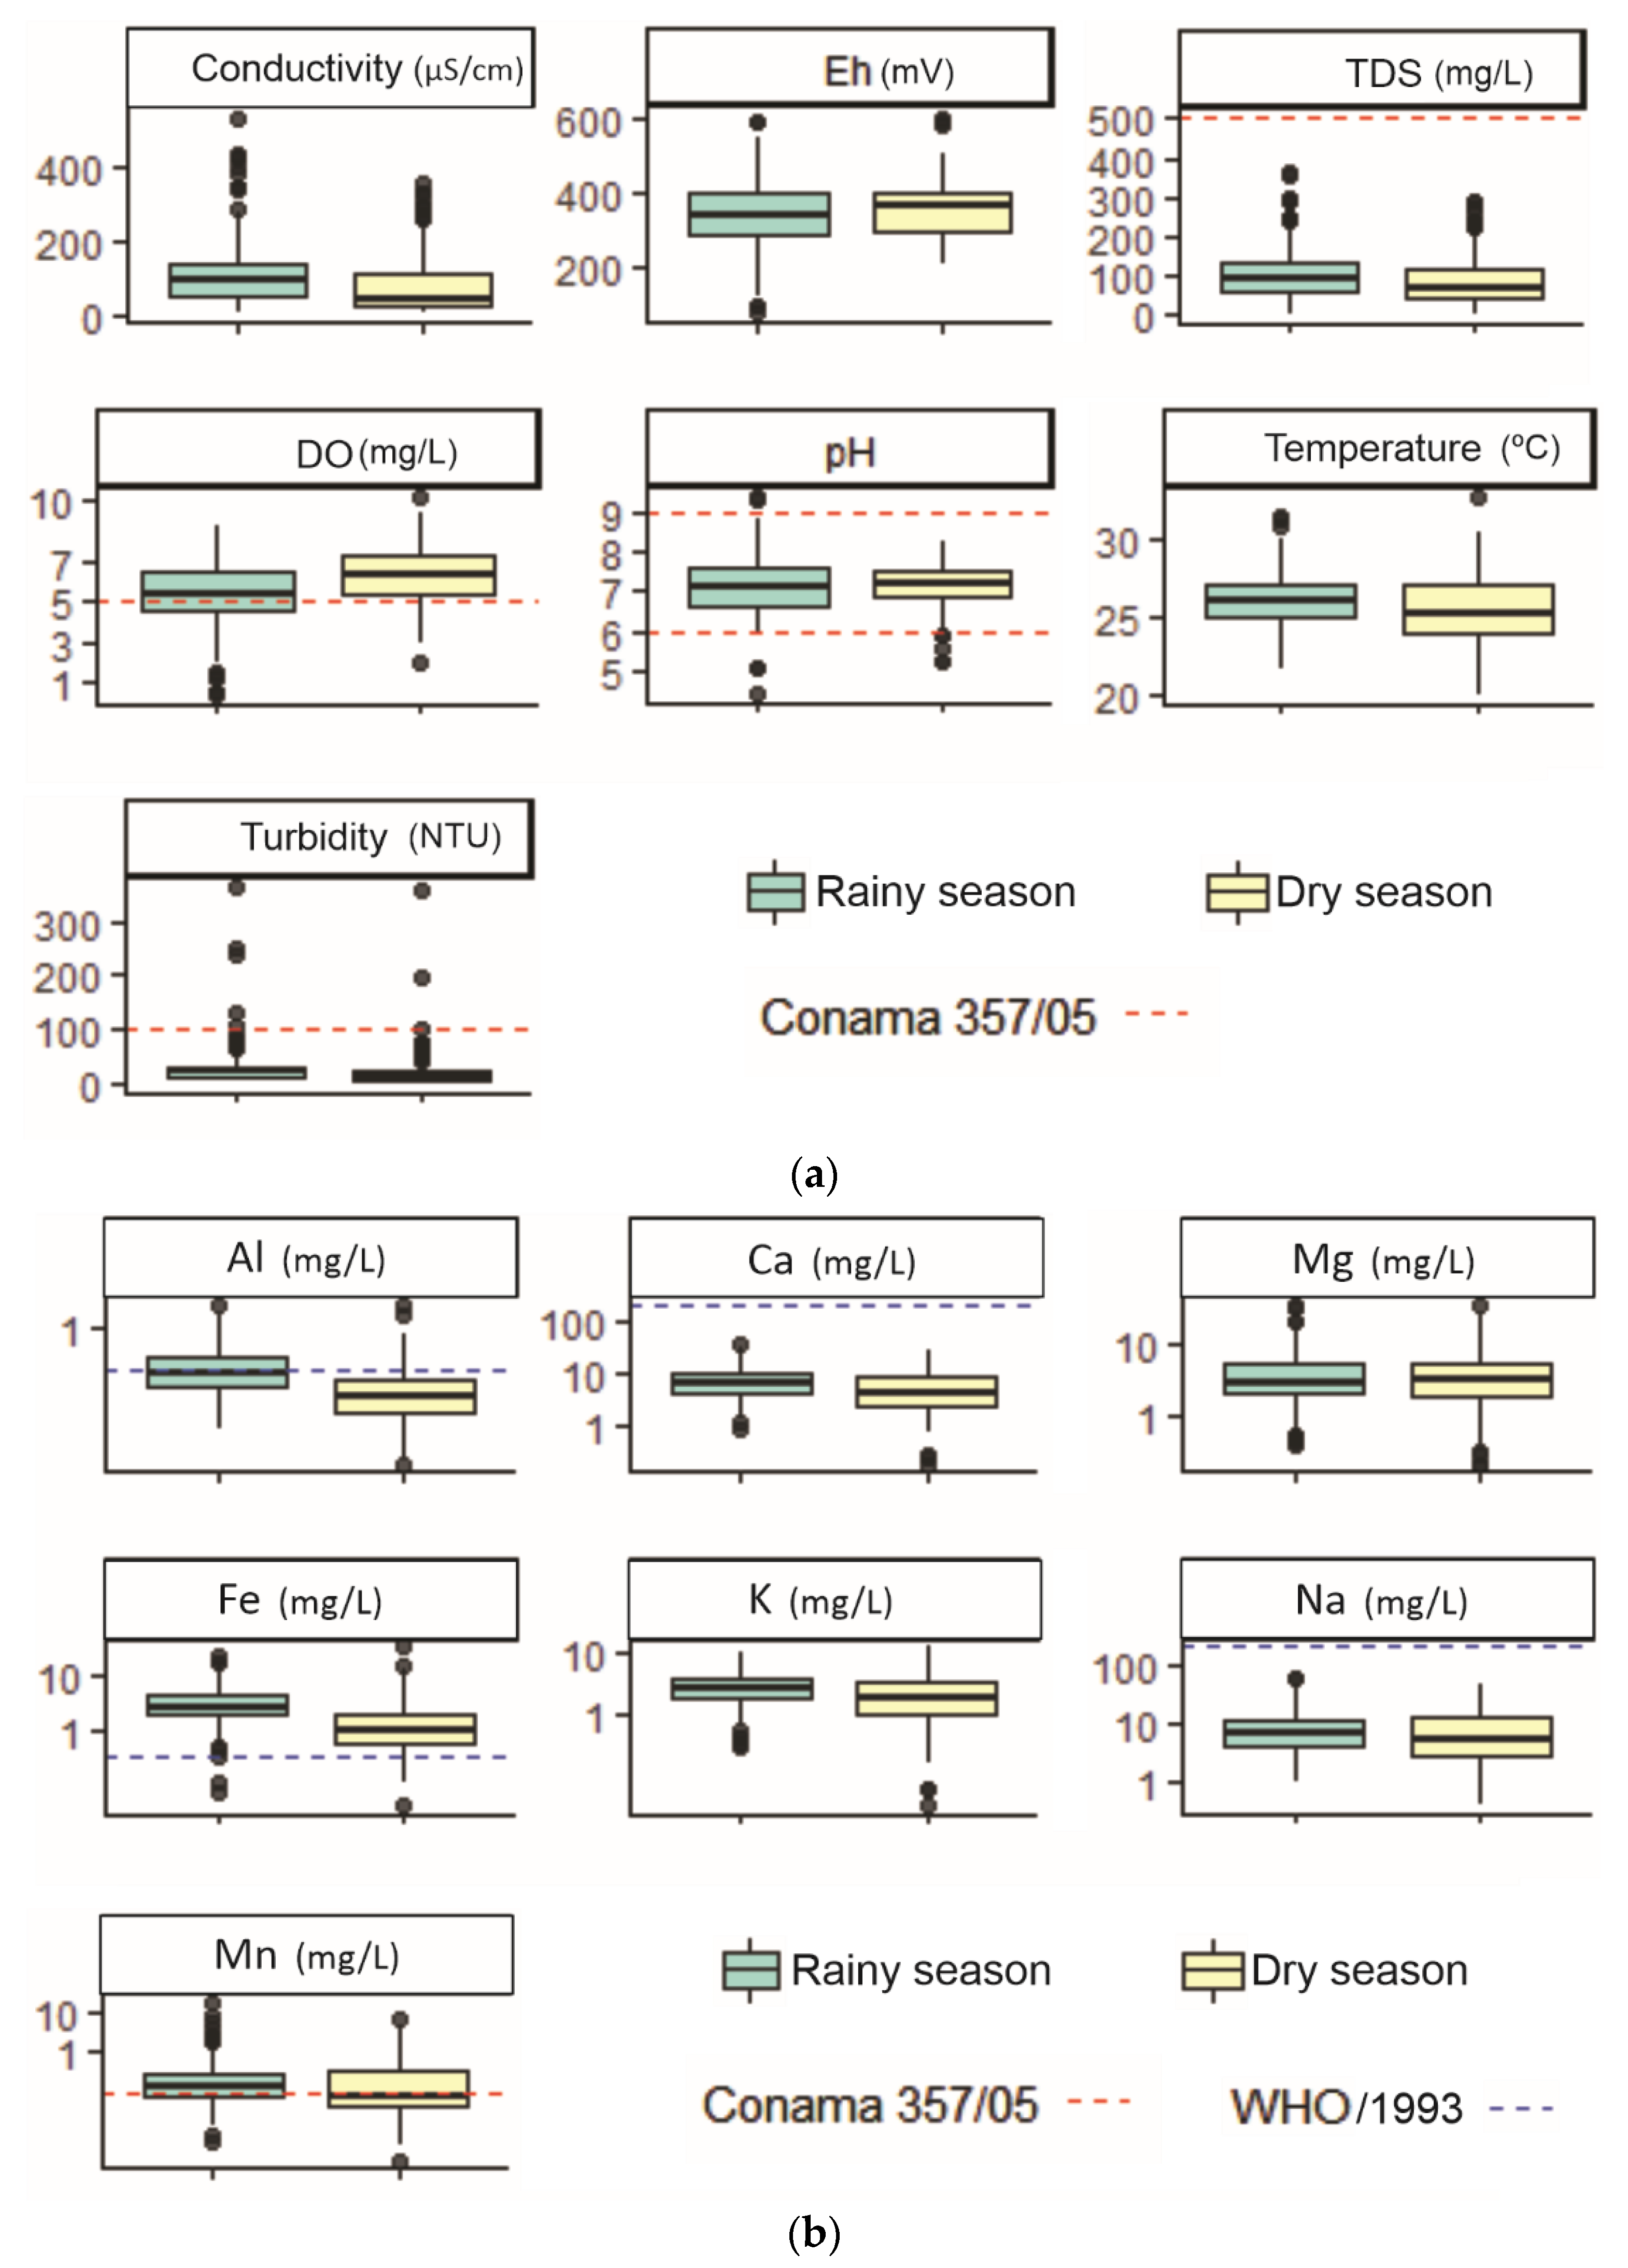
3.2.1. Physico-Chemical Parameters

Table 1 presents the basic statistics of physical–chemical parameters and main chemical constituents in the surface water of the basin for the rainy and dry seasons. In general, the water quality parameters data behave as non-normal, as their coefficients of variation were high, with the exception of pH and temperature. This indicates that different factors control the processes acting in the studied surface waters. For the empirical evaluation of the data, the representation by boxplot was adopted, as illustrated in Figure 5a,b. In them, the maximum limits for the different parameters established by CONAMA resolution 357/05 are shown in red dashed lines, for surface waters considered class 2 of the study region. For elements that do not fit into the resolution, the values established by the World Health Organization (WHO, 1993; blue dashed line) were adopted for reference and comparison. The physical–chemical parameters, for which there are limits in the resolution of CONAMA 357/05, showed results in some samples above the maximum allowed value (MPV). For pH, the occurrence of five samples in the rainy period and seven samples in the dry period with results below the minimum value and two samples only in the rainy period with results superior to the MPV was verified. The boxplot shows (Figure 5a) a similar distribution of pH in the two periods, with a predominance of pH values between 6 and 8 (rainy: 89.7% and dry: 93.4%), with the medians coinciding and the mean value being slightly higher in the dry period (Table 1). There are a limited number of points that deviate from the dominant distribution and show a pH lower than 6 or higher than 8. However, in the rainy period, almost 50% of the data are lower than pH 7, while in the dry season, this is approximately 35%. This could possibly be due to the greater abundance of organic matter and material carried into the rivers during the rainy season, since a large part of the study region is devoid of vegetation cover, which makes the rains more easily transport these materials, changing the chemistry of the water. Dissolved oxygen, according to the boxplot (Figure 5a) and Table 1, showed higher concentrations in the dry period. For total dissolved solids—TDS—all samples exhibited values below the maximum value stipulated by CONAMA 357 resolution in both periods (Figure 5a). In general, the temperature of the drainages was between 25 and 26 °C in both periods, with the lowest mean and median values recorded in the dry period (Table 1). On the other hand, a lower maximum temperature value and a smaller range of variation (21.6 to 31.4 °C) were observed in the rainy period compared to the dry period (20.1 to 32.5 °C). Turbidity was higher than the MPV in seven different watersheds in both periods, two in the rainy period (ranging from 198 to 361 NTU) and five in the dry period (ranging from 106 to 360 NTU). In general, the environment of the study area proved to be an oxidant, with a redox potential above 300 mV in more than 70% of the sample set for the two periods. For Cl and F anions, but mainly for F, the means and medians were higher in the dry season (Table 1), but all the results obtained are below the limit value established by CONAMA 357. SO42− was not present in samples above the MPV. On the other hand, NO3 and Ptotal were present in some samples, in both periods, above the stipulated limit (Figure 5a). The Ptotal shows higher values for median, Q1 and Q3 in the rainy season compared to the dry season (Table 1 and Figure 5a).

3.2.2. Major and Trace Elements

The boxplot representation of the major elements (cations) in the surface waters of the PRB (Figure 5b) revealed a greater similarity in terms of the variations between the two periods, with the concentrations of some elements being clearly higher in the rainy period (Table 1). Among these elements, Fe shows an entirely different behavior, with 98.3% of the samples in the rainy season and 89.5% in the dry season exceeding the maximum limit of 0.3 mg/L recommended by the WHO (Figure 5b). For Mn, most of the samples in the two periods were above the stipulated limit set by the CONAMA resolution. Although the mean and median values of Mn (Figure 5b and Table 1) were close in the two periods, slightly higher values were found in the rainy season. However, in a few samples, higher concentrations of Mn were found in the dry period. The behavior of Al differs from that of Mn, with the number of samples being smaller, but still quite significant, especially in the rainy period (Table 1 and Figure 5b), whose results exceed the limit stipulated by the WHO. Among the trace elements analyzed, five elements present in both periods were lower than the stipulated maximum limits, namely Cr, Co, V and B (below the MPV of CONAMA 357 resolution) and Cu (in relation to the WHO) (Figure 5b). Meanwhile, Ba in one sample in the dry season and Zn in two samples in the rainy season showed a higher concentration than the respective limits established by CONAMA 357 (Figure 5b). For the elements Sn, Sr, Ti and Rb, there are no reference values defined by CONAMA or the WHO. With the exception of Zn and Sn, all other trace elements showed higher mean and median values in the rainy season (Table 1 and Figure 5b).

3.3. Spatial Distribution

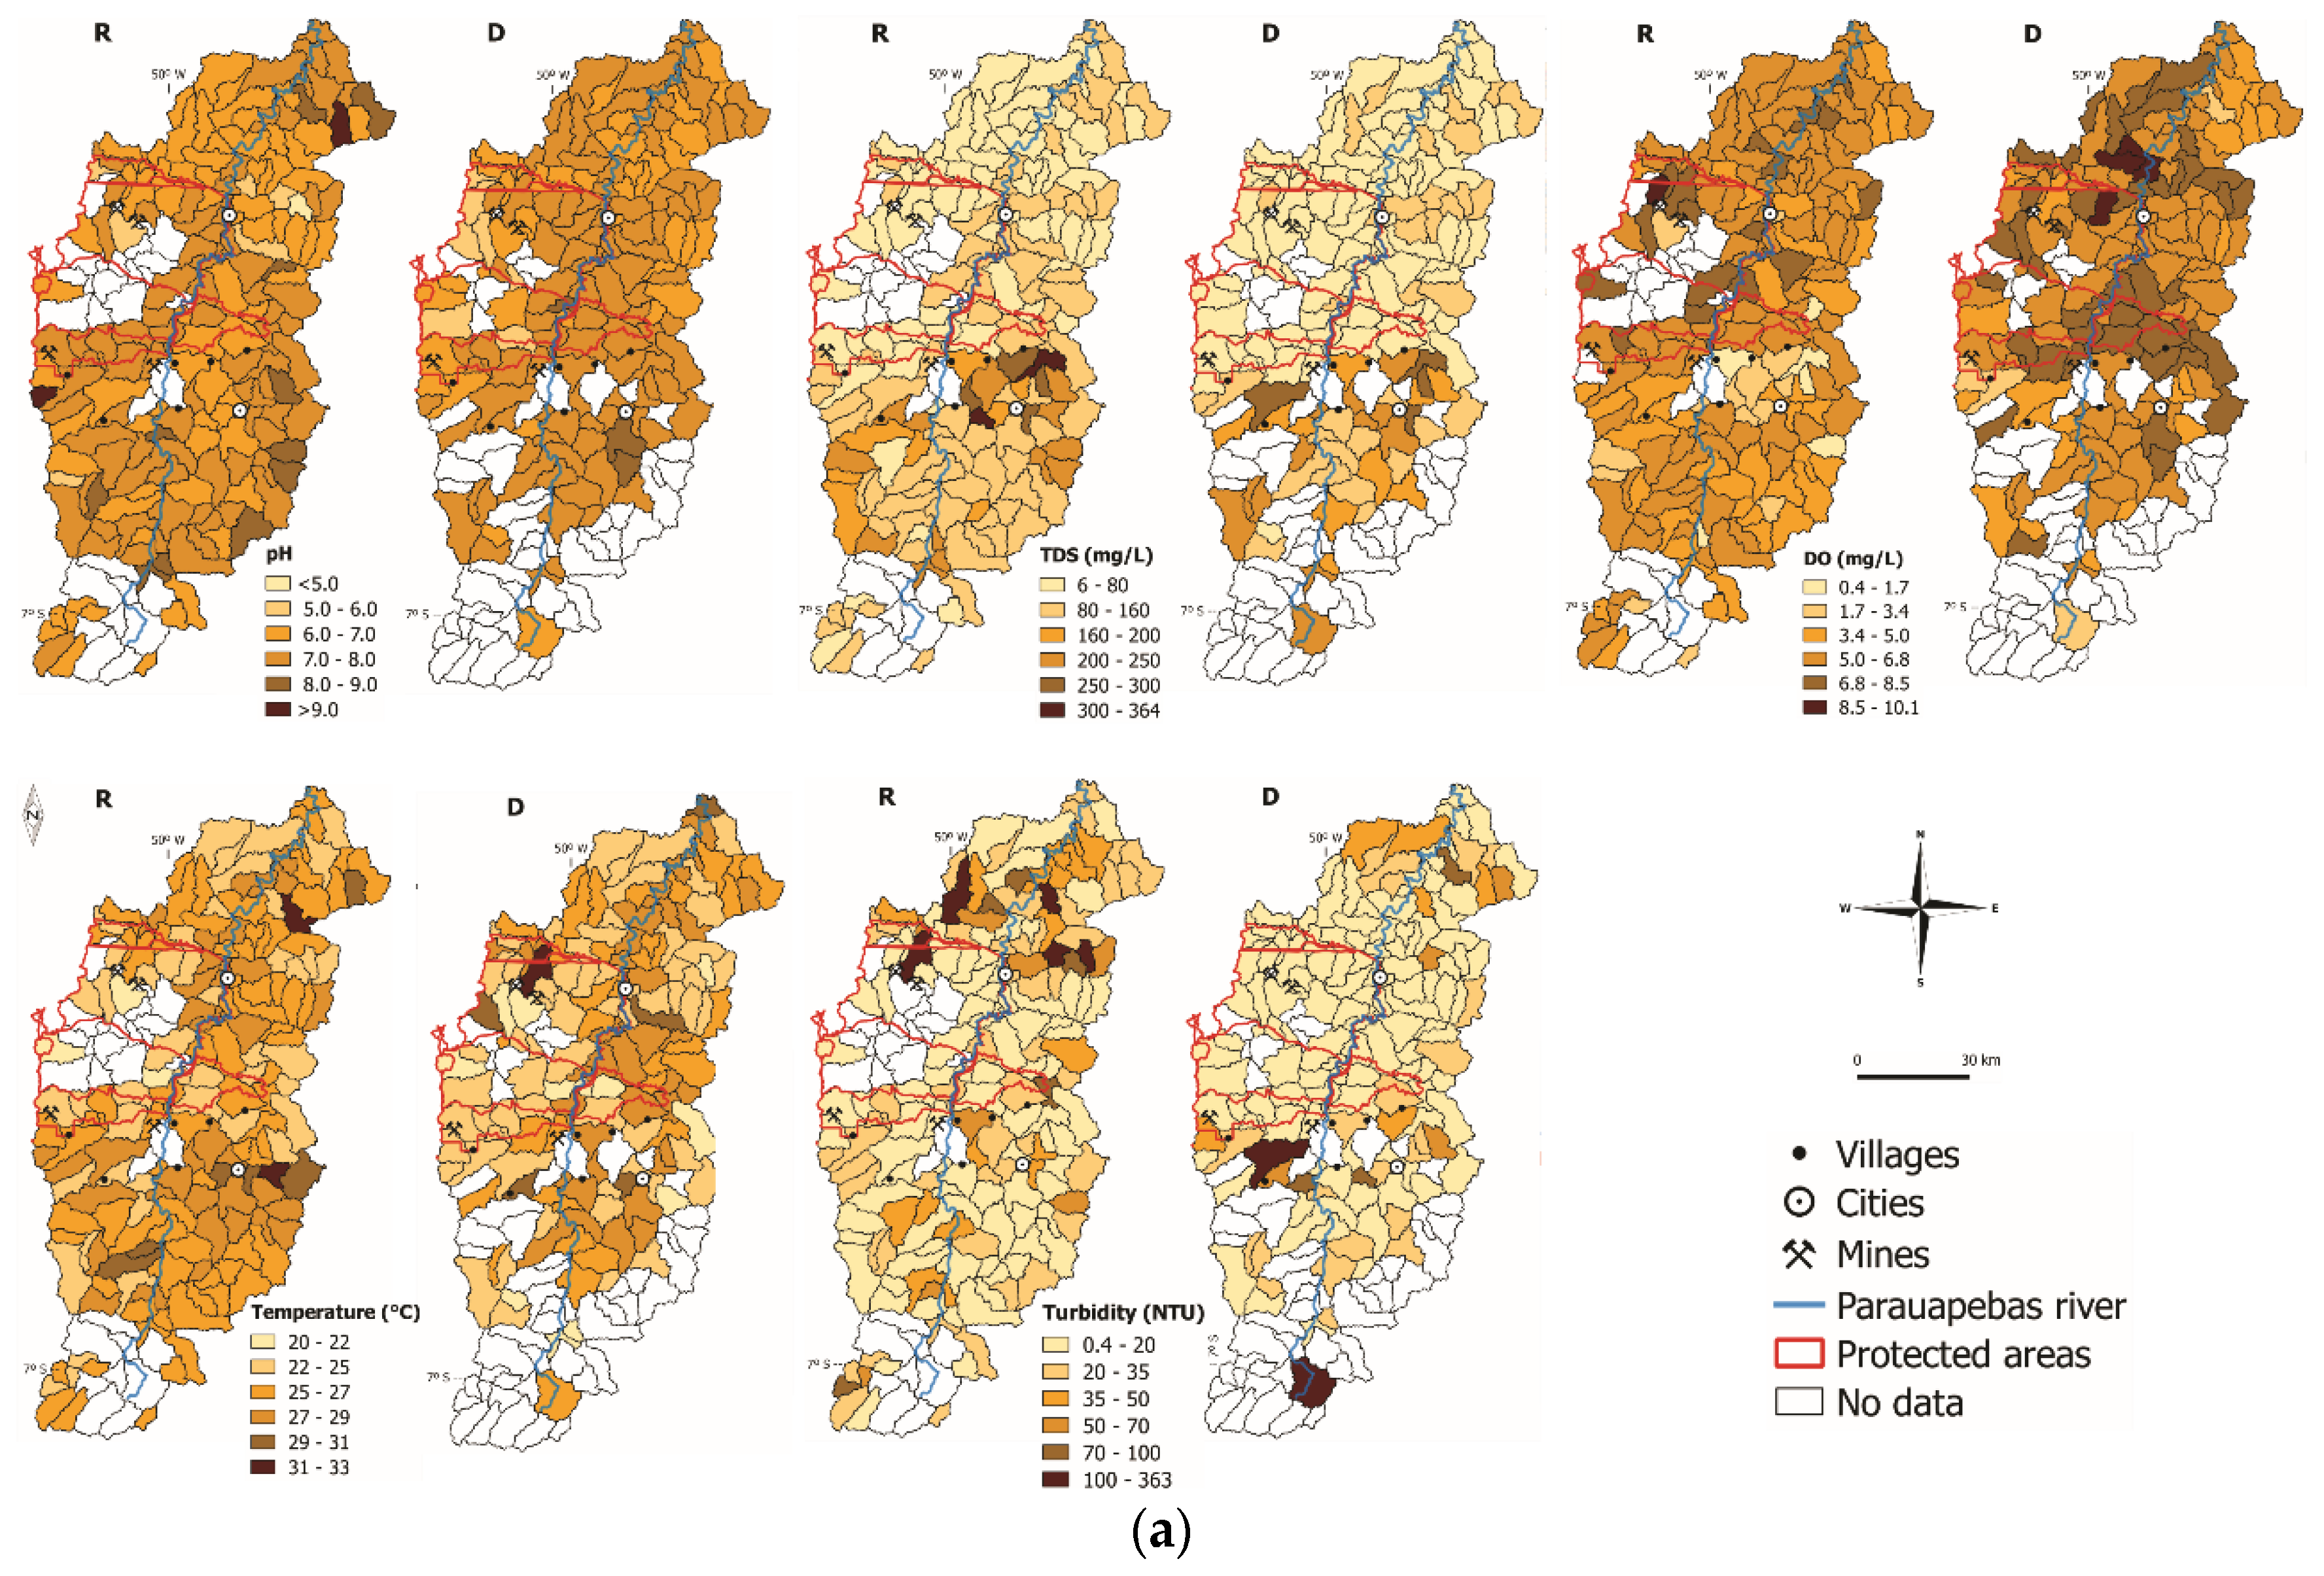
3.3.1. Physico-Chemical Parameters
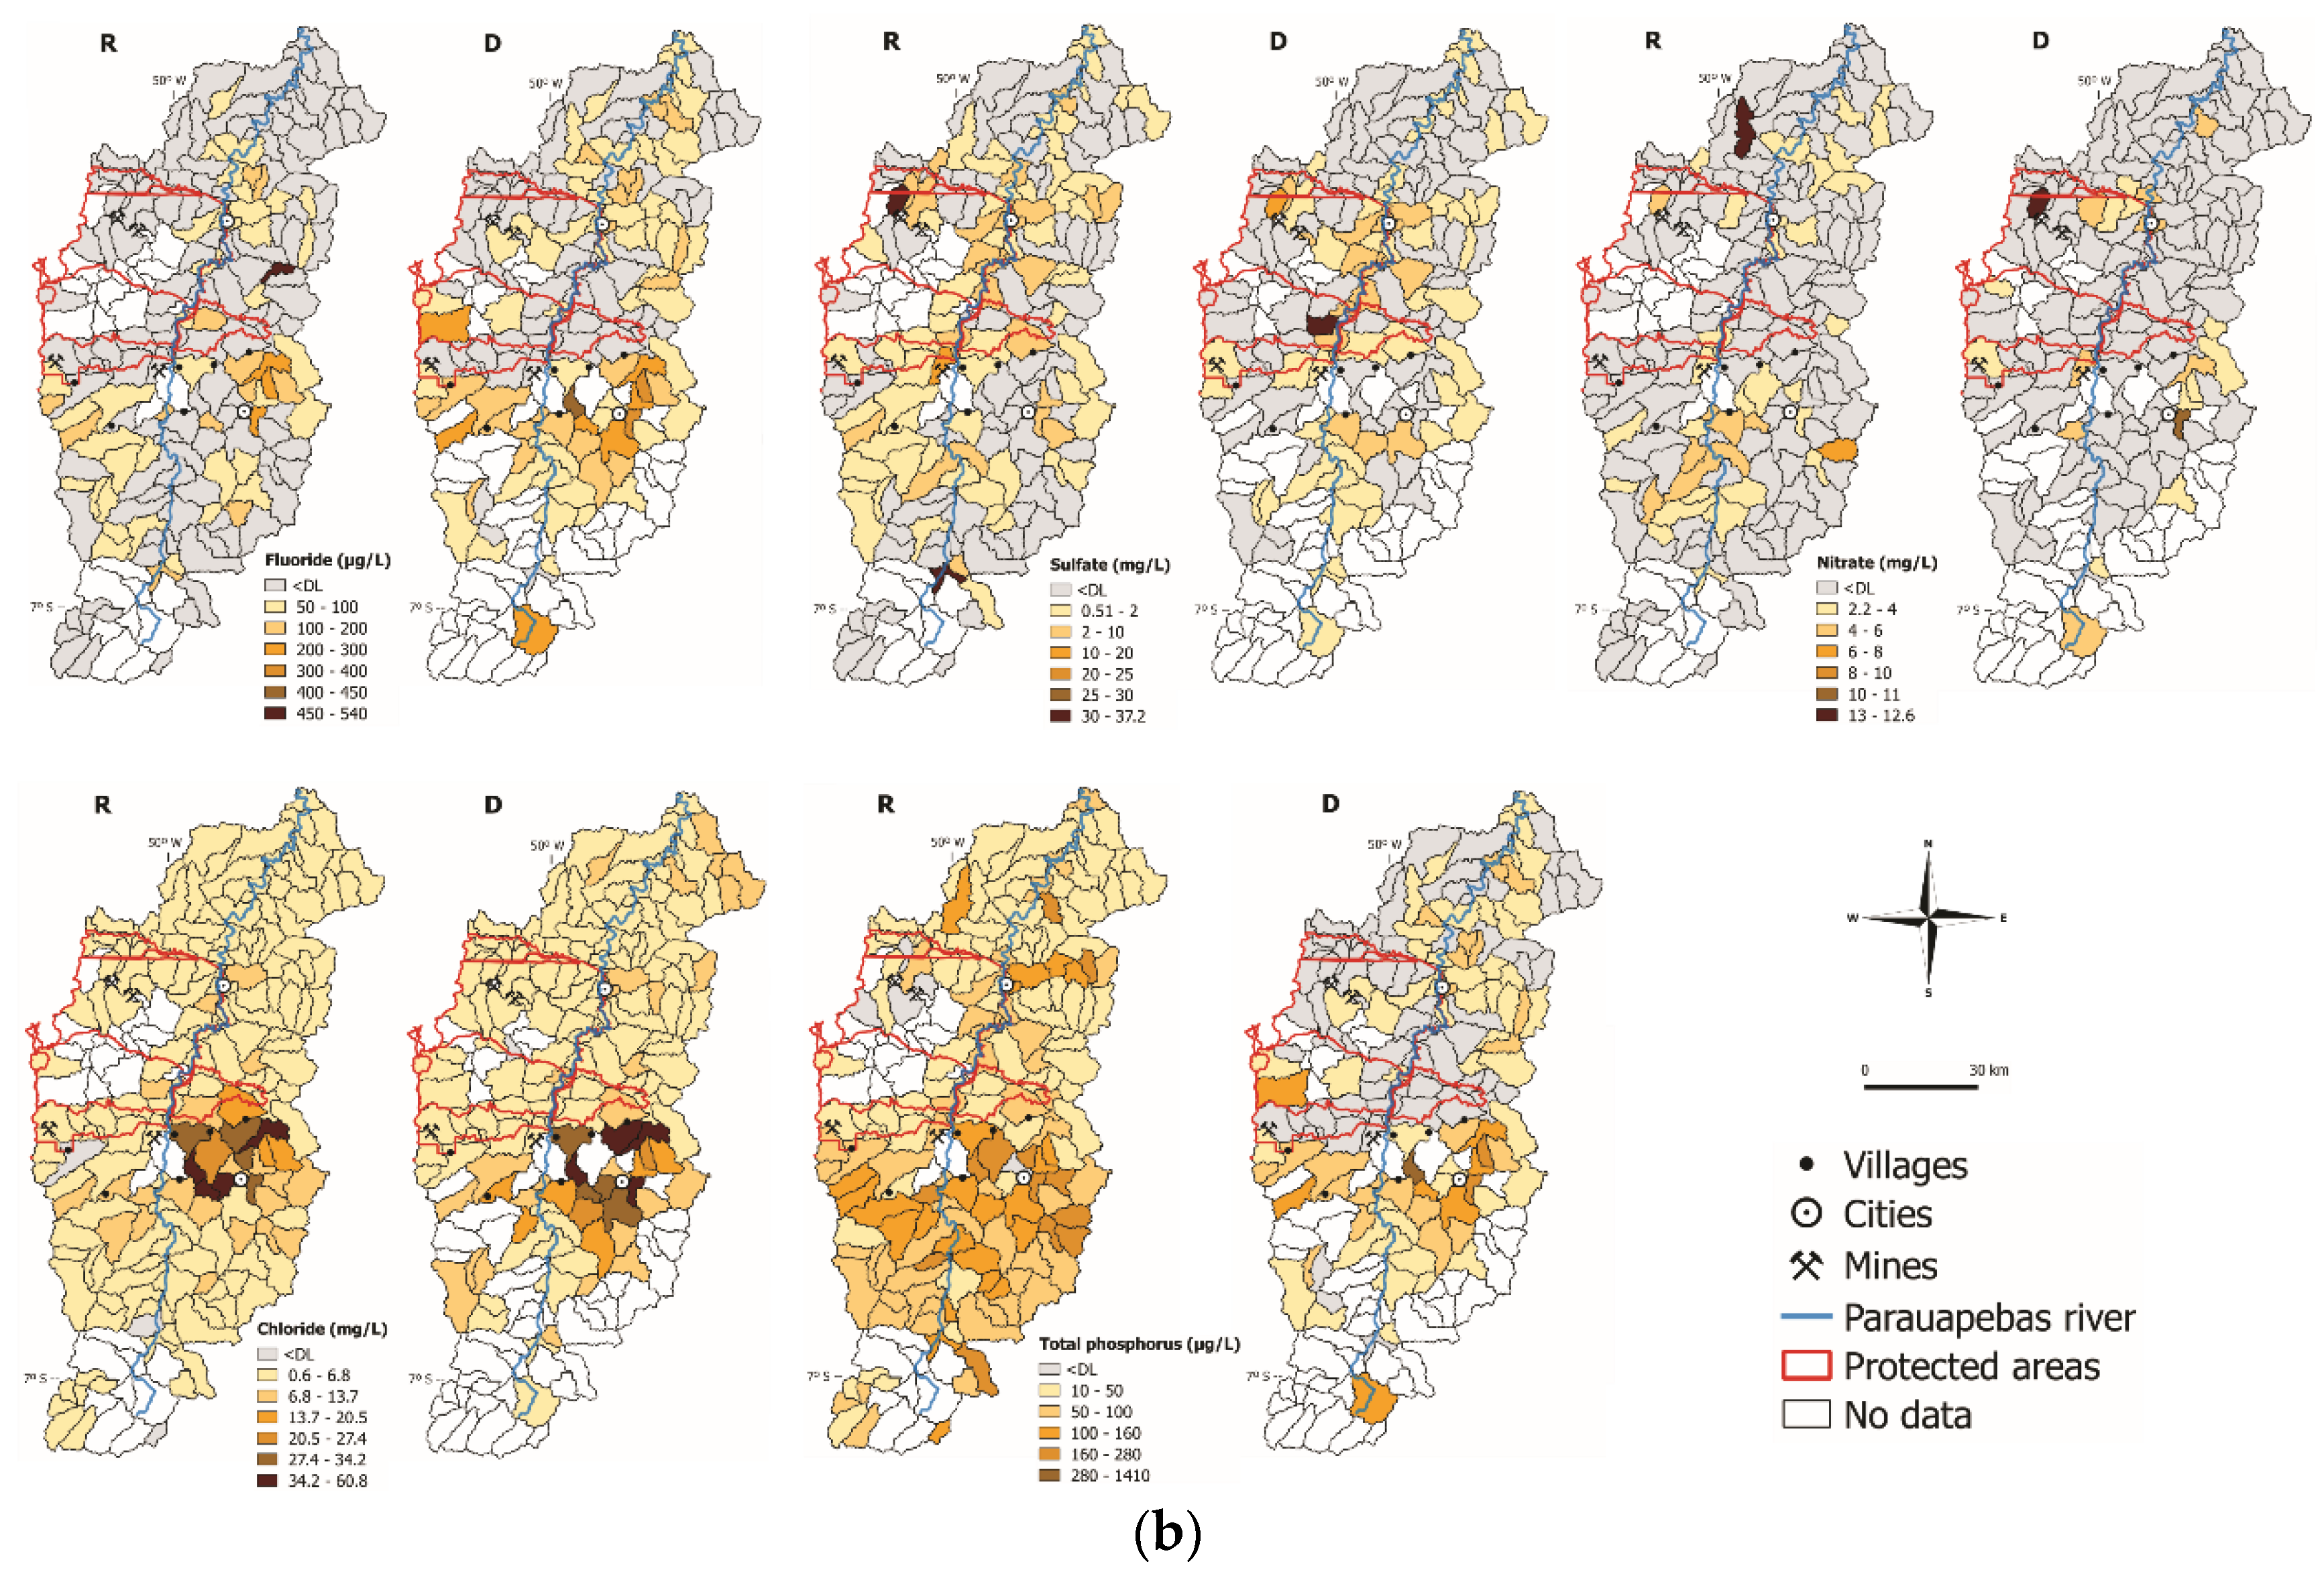
The spatial distributions of water quality variables are presented in Figure 6a–c. As previously mentioned, some watersheds could not be sampled in the rainy season due to impossibility of access. In addition, during the dry season, several microbasins whose drainages are intermittent were dry during the sampling period. As a result, in the dry season the sampling of the upper Parauapebas was significantly impaired. Electrical conductivity and TDS show a strong positive correlation (Figure 6a), and showed higher values in the central strip of the basin at the limit between the upper and middle Parauapebas, with a clear decrease in the lower course of the river. The values are higher on the right bank of the river and in watersheds located near the city of Canaã dos Carajás and the Sossego mine. The concentrations were slightly higher in the rainy season (cf. Figure 6a), probably due to the greater transport of particles to the drainages through the surface flow. In the upper and middle Parauapebas region, intermittent drainage and lower flow are concentrated [34], which provide low self-purification capacity to rivers [43], resulting in higher concentrations of dissolved ions. It is worth noting, however, that from the set of watersheds whose waters were analyzed, all of them showed TDS values below the MPV (500 mg/L), in CONAMA resolution 357/05, class 2. The amount of DO available in surface waters was higher in the dry season (Table 1), and in the rainy season, some watersheds showed values below the limit stipulated by CONAMA resolution 357 (Figure 6a). These watersheds are concentrated in the central portion of the basin, close to the city of Canaã dos Carajás and the Sossego mine, that is, in an area similar to that in which higher values of EC and TDS were observed. The watersheds that presented DO concentrations above 6.8 mg/L are located in the middle and lower Parauapebas, and largely in protected areas, such as Flona de Carajás, APA do Gelado and Campos Ferruginosos National Park, in areas covered by tropical forest or where there are remnants of forest or secondary vegetation. There is total dominance of DO values above 5.0 mg/L, that is, compatible with the minimum values established in CONAMA resolution 357/05, as observed for EC and TDS. In the dry season, fourteen watersheds showed DO values lower than 5.0. This number is slightly higher in the rainy season, as already noted (cf. Figure 6a).
In general, the surface waters of the basin presented a pH ranging from 6 to 8 in both periods, with rare values below 5.0 or above 9.0. In both periods, 70% of the samples showed redox potential values above 300 mV. The verified values were all positive (Figure 6a). However, in the rainy season, in the low course and preferably on the left bank of the Parauapebas, in areas located partly in the Carajás Flona domains and where there are fragments of secondary forests (Figure 1c), several watersheds with values above 500mV were observed. (Figure 6a). In the dry season, values of the same order are more restricted and are located in the middle Parauapebas. The temperature values verified in the dry season, in most of the microbasins on the right bank of the Parauapebas River, a deforested area with a predominance of pastures and devoid of riparian forest in several stretches and close to urban centers, are above 27 °C and are slightly higher than those presented by the microbasins on the left bank, partially located in protected areas or under their influence (Figure 6a). A similar contrast is also observed in the rainy season, when a large number of watersheds, mostly in the southeastern region of the basin and in the vicinity of Canaã dos Carajás, revealed surface water temperature values above 27 °C (Figure 6a). The turbidity values were higher in the rainy season, with values below the maximum limit of CONAMA 357, equal to 100 NTU, predominating in the basin. Only five watersheds in the rainy period and two in the dry period presented turbidity above the maximum value stipulated by CONAMA (Figure 6a). During the rainy season, the watersheds that had above-average turbidity values, including some above the permitted limit, are largely located in the north of the study region (Figure 6a). In the dry season, two watersheds presented turbidity above the CONAMA limit and, in one of them, the value found was higher than in the rainy period in the same watershed.

3.3.2. Major Ions

Among the anions, the Cl contents in the surface waters of the lower portion of the middle and lower Parauapebas are very low and generally less than 13.7 mg/L. Comparatively higher concentrations occur occasionally, particularly in microbasins located in the southern portion of the middle Parauapebas, close to the city of Canaã dos Carajás and the Sossego mine, but in no case exceeding the value of 60.8 mg/L, being, therefore, well below the maximum limit stipulated in the CONAMA resolution. For sulfate, although a very large number of samples, in both periods, revealed concentrations below the DL (Figure 6b), comparatively higher concentrations of this anion were observed along the course of the Parauapebas River and in the southern portion of the middle. Somewhat higher values were also recorded in relation to the basin average in the microbasin north of the N4 iron mine (Figure 6b). However, no watershed showed a concentration above the limit stipulated by CONAMA 357. Additionally, no significant differences were observed between the two periods. The other anions, NO3 and F, show dominance of concentrations below the DL and do not reveal marked differences between the two periods. In only three watersheds, located in the area of influence of the N4 mine, in the lower Parauapebas on the left bank and in the city of Canaã dos Carajás, the concentrations of NO3 exceeded the maximum limit stipulated by CONAMA 357/05. For F, comparatively higher contents are found in the surface waters of the upper portion of the middle Parauapebas, coinciding with the area of occurrence of the Southern Copper Belt [44]. In the lower Parauapebas, there is a dominance of contents below the DL in the waters of the sampled microbasins, mainly during the rainy season. In the surface waters, the Ptotal content was 2.8% below the DL in the rainy season and 17% in the dry season. For this element, 37 watersheds in the rainy and 14 in the dry period presented concentrations exceeding the maximum value allowed by CONAMA 357.
The levels of major components of surface water such as Ca, Mg, Na, K, Fe, Mn and Al are somewhat higher in the rainy season and tend to increase in the south–central portion of the basin (Figure 6c). Fe also exhibits higher contents during the rainy season, while Mg does not vary significantly in the two periods. The spatial distribution of Mn concentrations is remarkably similar to that of Fe (Figure 6c), especially in the rainy season. However, in the dry period, in the upper Parauapebas, several watersheds showed enrichment in the concentration of this element, which was not observed for Fe. Considering the average values, Mn concentrations are still higher in the rainy season. Al also showed higher levels in water during the rainy season (Table 1), in which it has as a particularity the fact that it does not show a notable contrast in concentration in different parts of the basin. During the dry season, the microbasins with higher contents tend to be concentrated in the limit zone between the upper and middle Parauapebas. In both periods, several watersheds, mainly in the rainy season, exhibited concentrations above the maximum limit stipulated by WHO/1993.

3.3.3. Trace Elements

For trace elements, Cr, Ni and Co present concentrations below the detection limit in a large number of microbasins, with significant values being obtained, in most cases, in areas of occurrence of mafic and ultramafic rocks. As a result, these elements present similarities in their spatial distributions. The contents of these three elements in the surface waters of the basin are always lower than the maximum value stipulated by CONAMA 357/05. Rb, Sr and Ba are three elements with geochemical affinity, which showed similar spatial distributions with higher concentrations in the upper and upper portion of the middle Parauapebas, located in the Canaã dos Carajás, Sapucaia and Rio Maria—CC—domains, where feldspar-rich granitoid rocks dominate. Sr and Ba are relatively abundant and present contents above the DL in almost all watersheds sampled in both periods. The same is not true for Rb, which exhibits contents below the DL in a large number of watersheds. Among these three elements, only Ba has a maximum limit defined by CONAMA 357/05, corresponding to 700 µg/L. In general, the contents of Ba are well below this value. Only one watershed in the dry season, which presents the maximum value of the analyzed set, exceeded this value. Titanium shows some analogies with Rb, Sr and Ba, particularly in the rainy season, when it shows higher concentrations in the upper portion of the middle and upper Parauapebas. Ti contents are not very high, but only locally below DL.
Copper presents a different behavior in relation to the other elements already discussed. Higher levels were found in microbasins located in the middle Parauapebas, in the central part of the basin, and in others aligned in the east–west direction at the height of the city of Parauapebas, in the Carajás Basin domain, formed mainly by metavolcanic rocks, mafic and banded iron formations. These two zones with notable copper enrichment correspond to the north and south copper belts [44], with the Sossego copper mine and several other copper deposits along the southern belt, among which are 118 and Cristalino. Despite the higher levels along these belts, nowhere in the basin does the Cu content exceed the maximum limit allowed by WHO/1993, which is 2000 µg/L. Zinc also exhibits a very particular behavior, with similar average levels in the two periods, but contrasting in terms of spatial distribution. In the rainy season, higher concentrations were observed in the CC domain, while in the upper part of the basin, a significant number of watersheds revealed contents below the DL. In the dry season, the concentrations were higher than the R and the watersheds that presented higher contents are aligned according to the north and south copper belts. In no sample was a value obtained above the MPV of CONAMA 357/05, which corresponds to 700 µg/L. Tin shows low concentration, with a large number of samples showing composition below the DL. Its concentration was higher in the dry season and its spatial distribution is irregular, and the factors that control it are not clear. Vanadium and B also showed low concentrations, with a predominance of values below the DL in both periods (Figure 6c). The analyzed samples reveal much lower levels of V and B than the maximum value admitted by CONAMA 357/05, corresponding, respectively, to 100 µg/L and 500 µg/L.

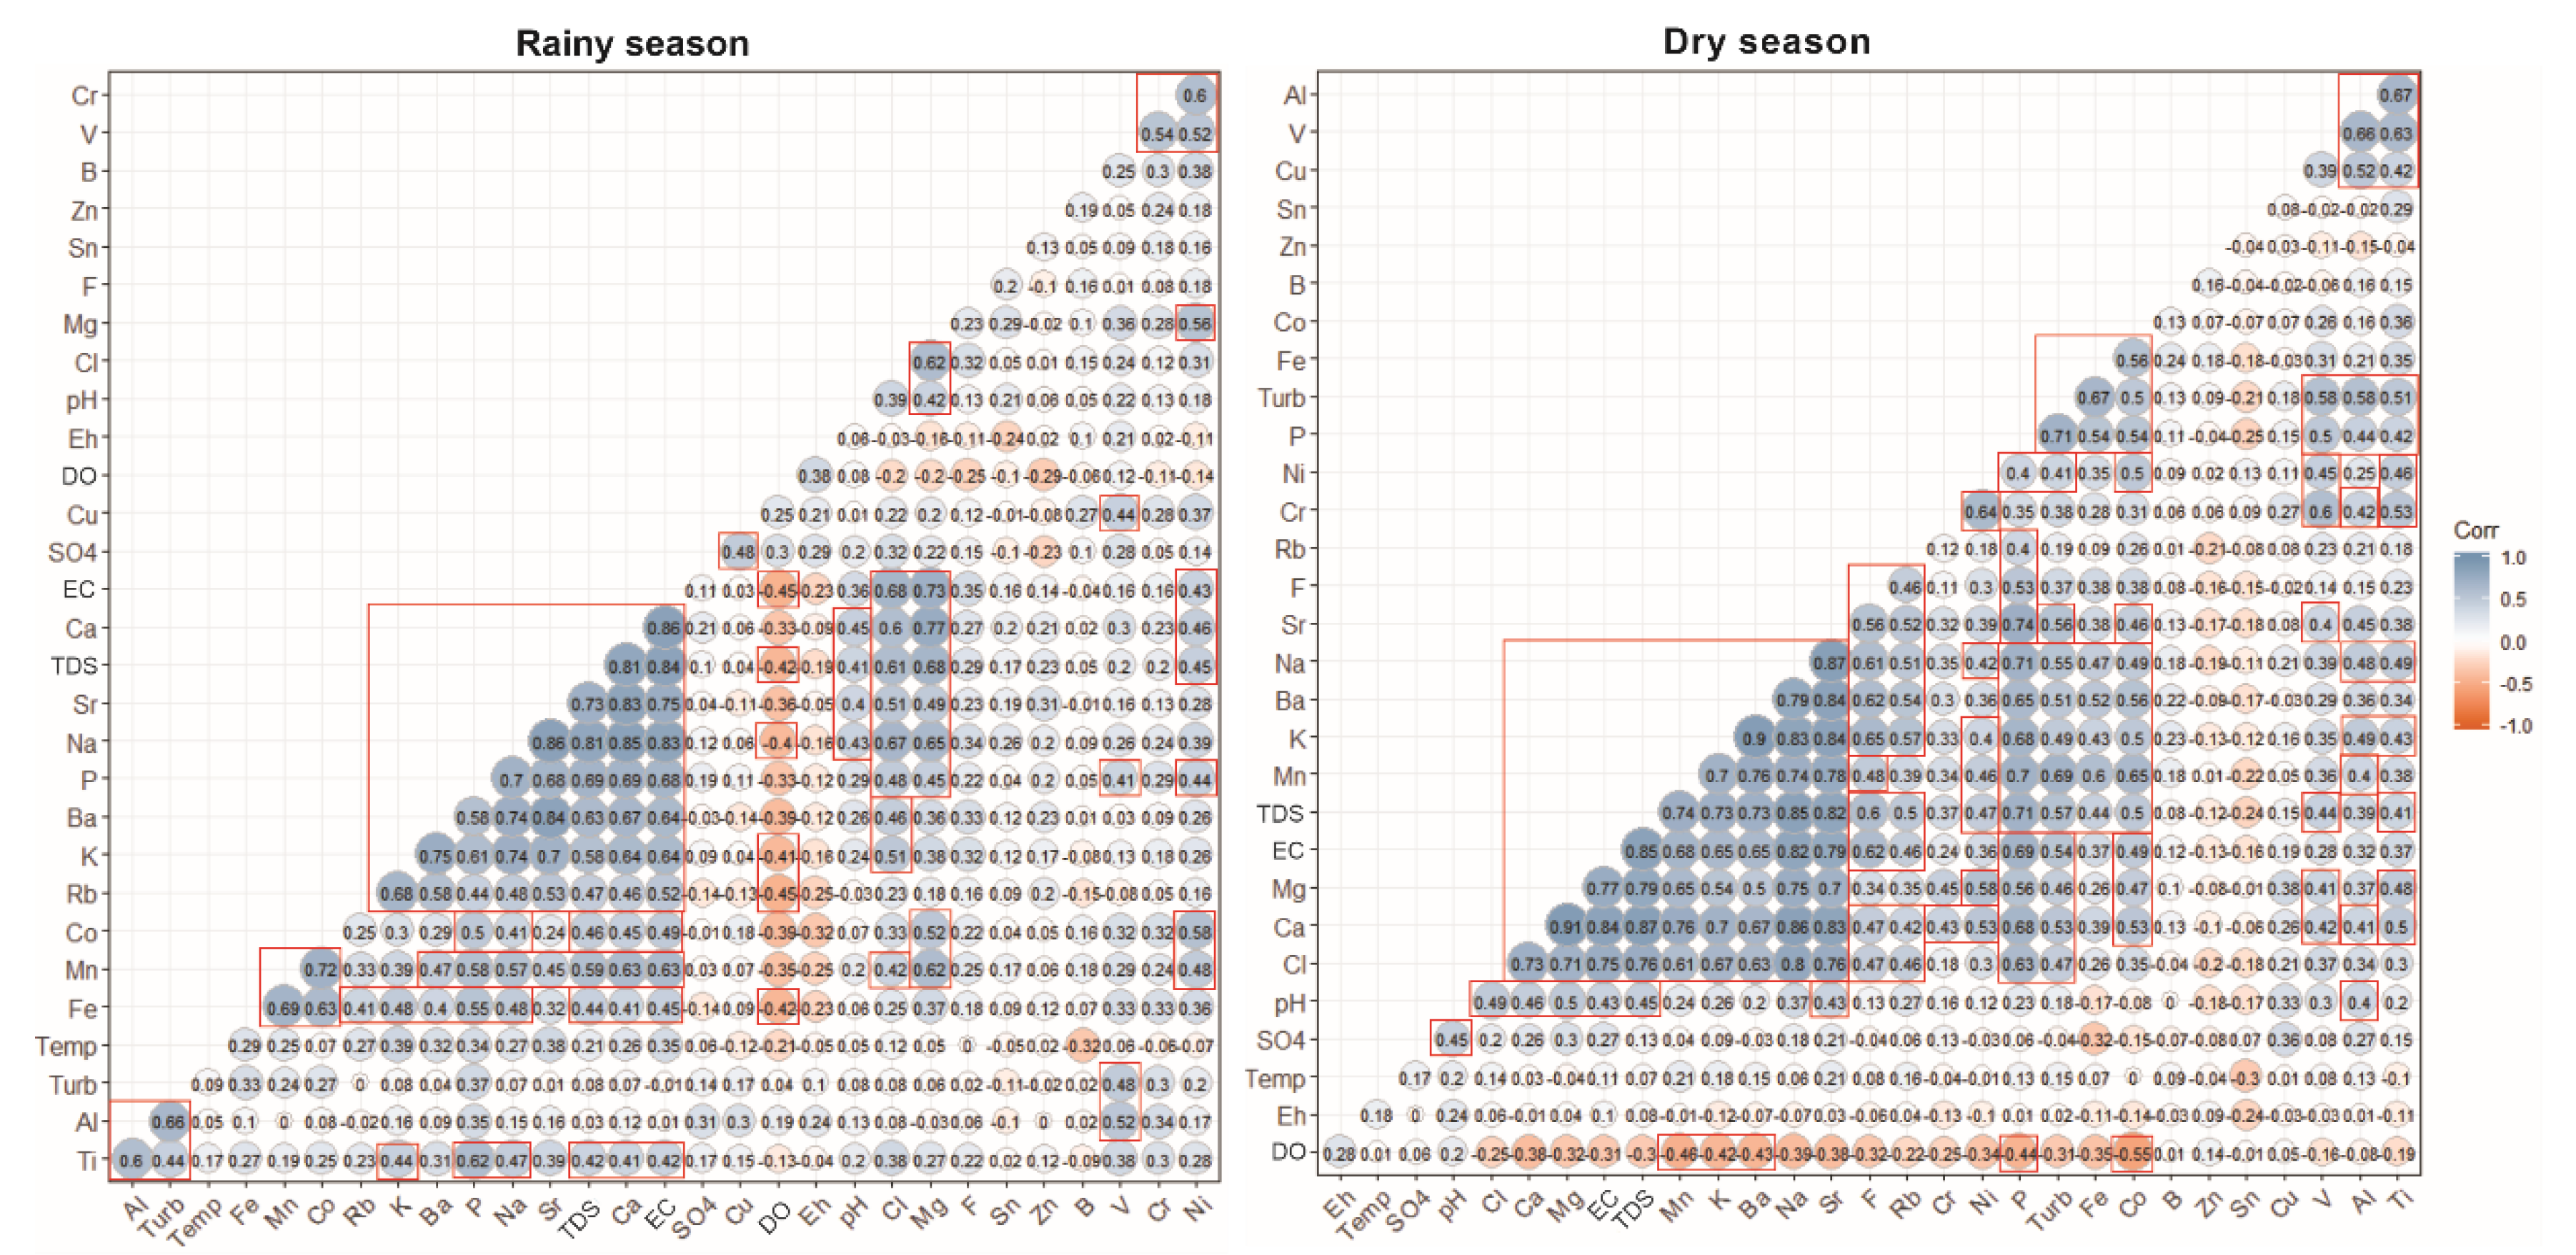
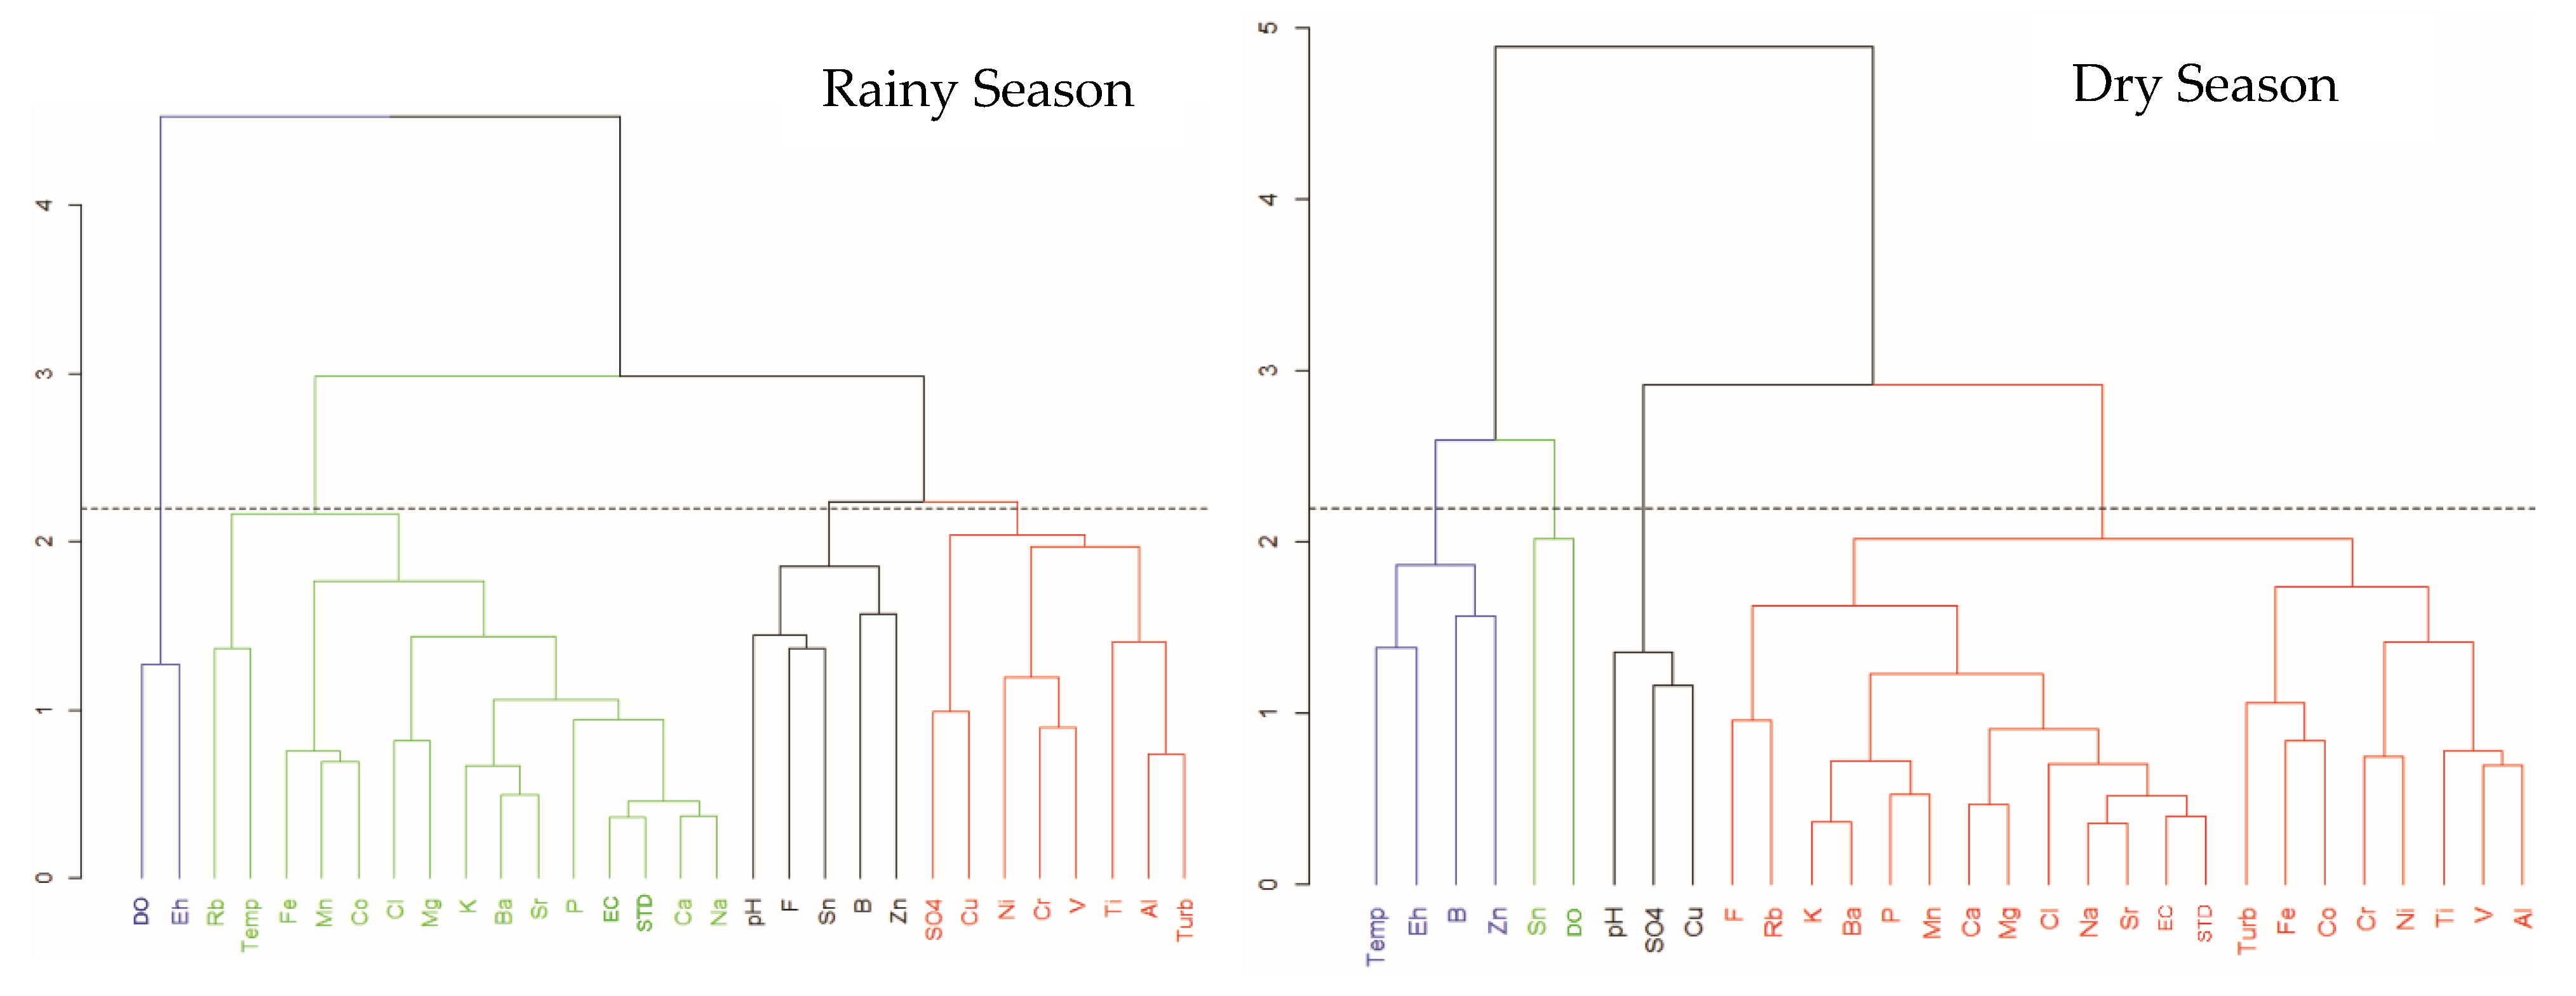
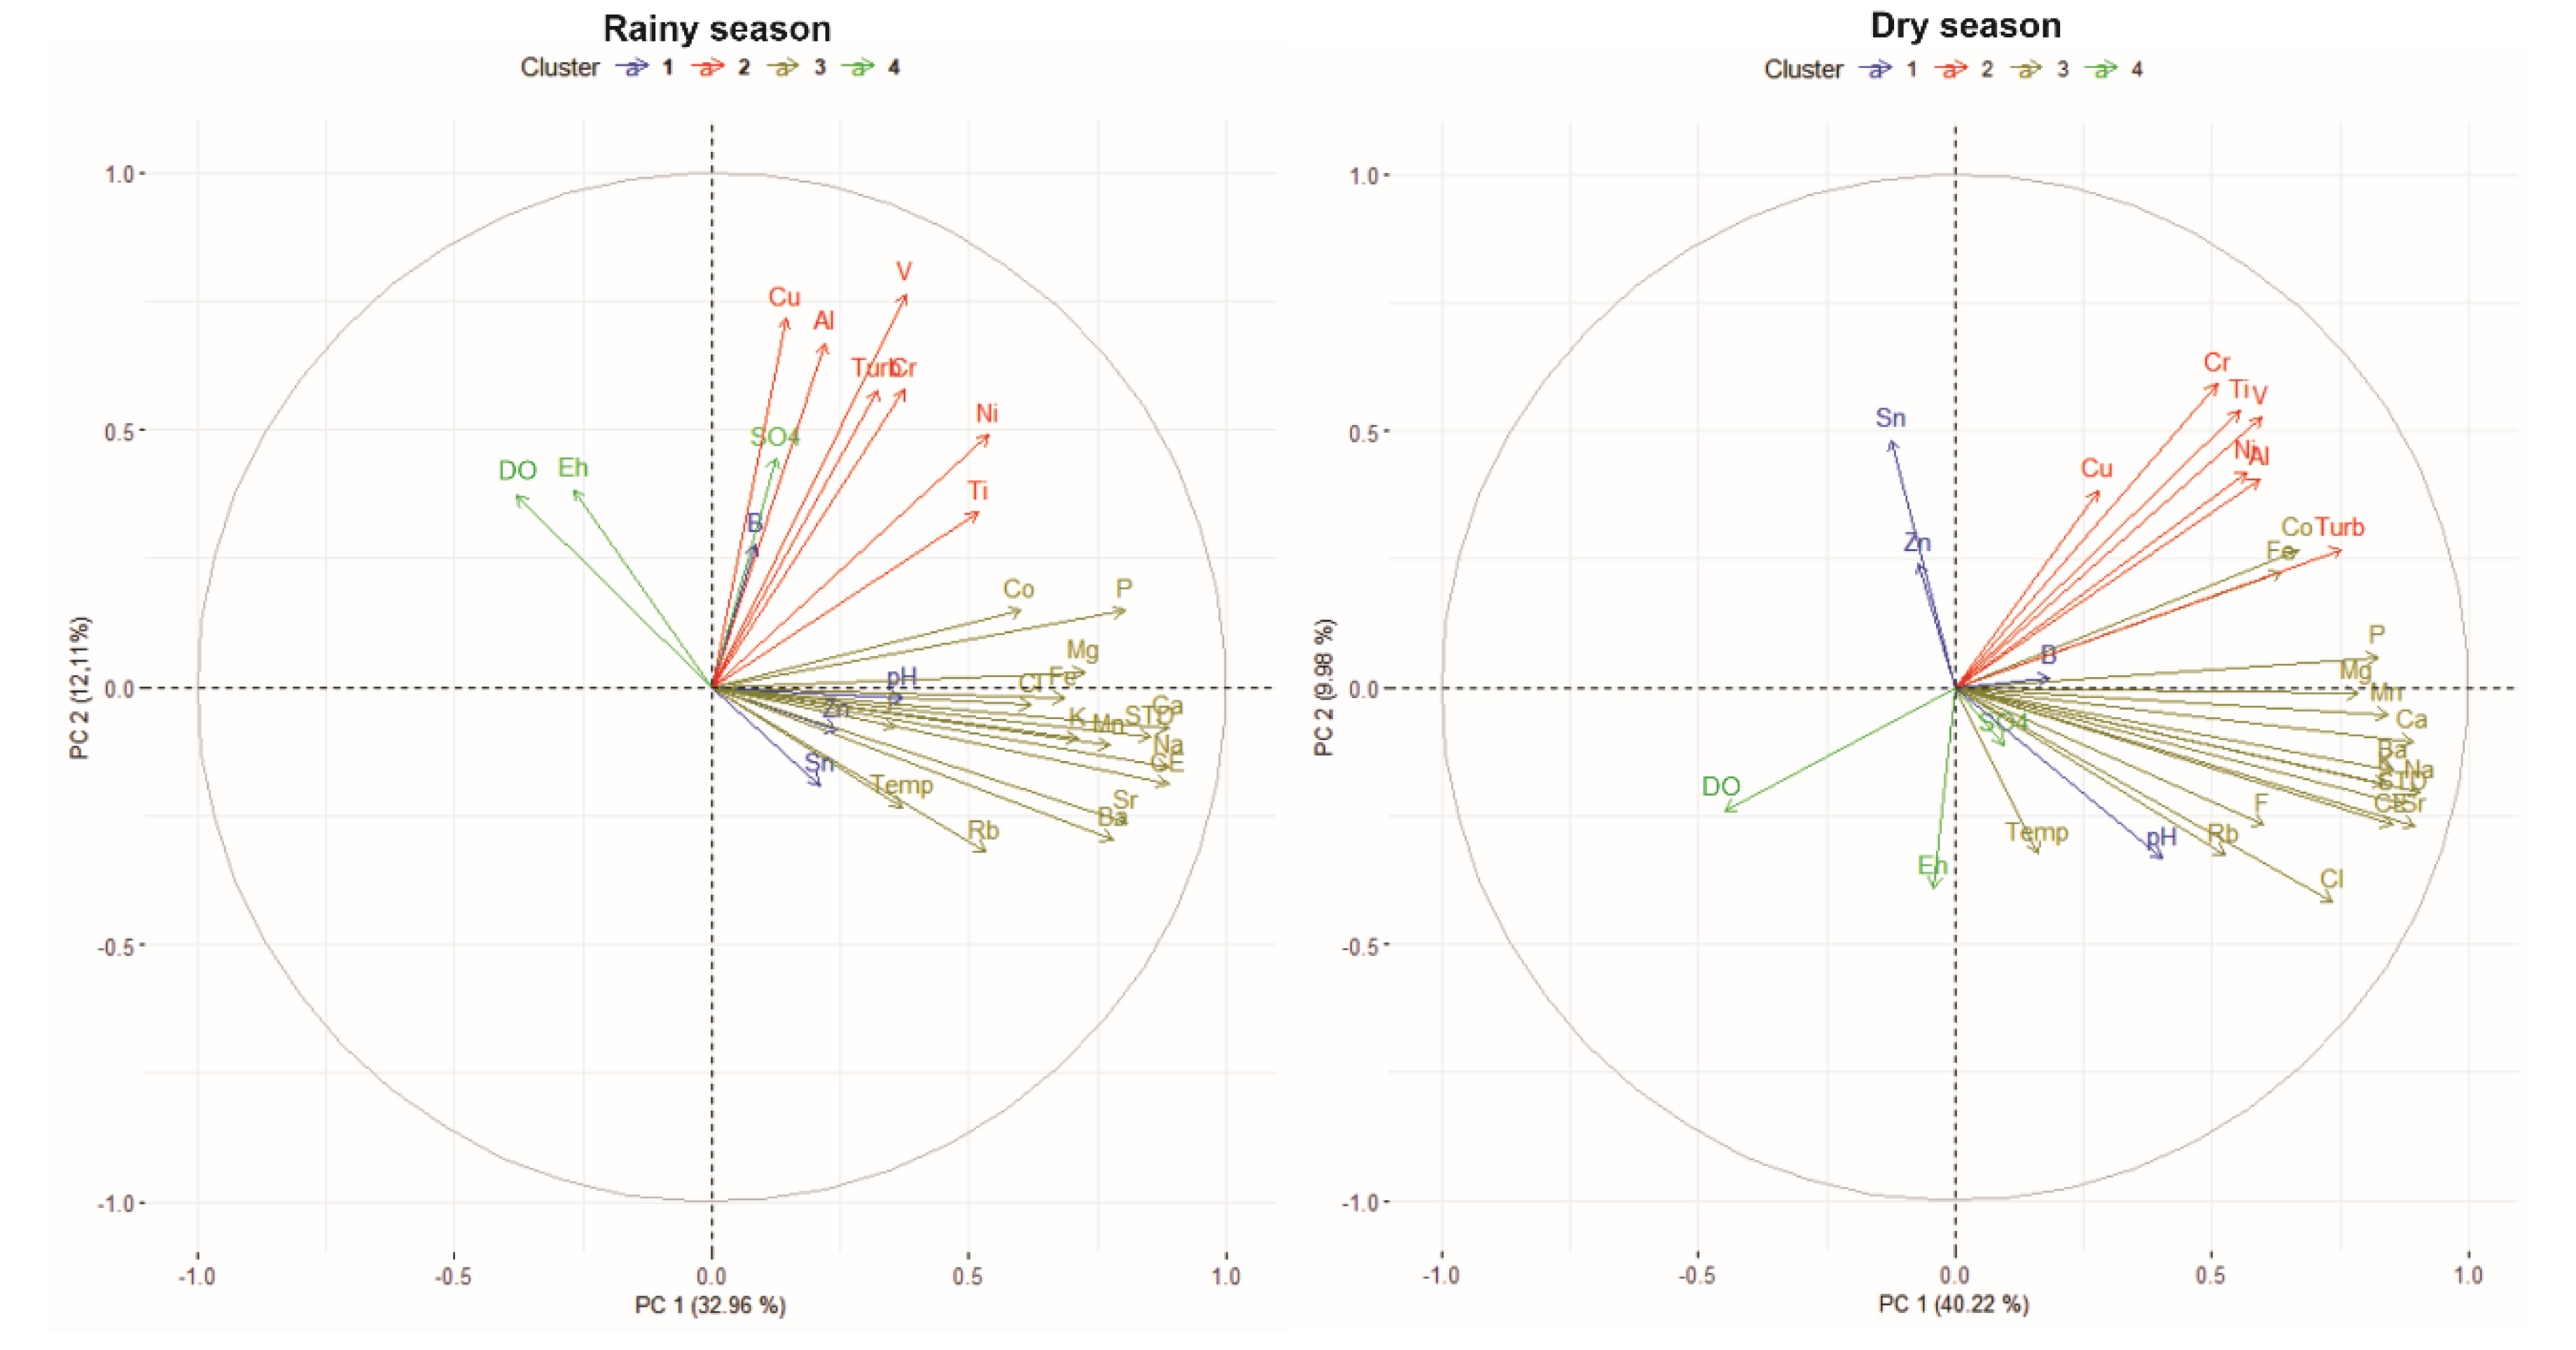
3.4. Multivariate Statistics

To verify the intercorrelation between the water quality variables, the Spearman correlation was applied using the following scale: 0.00 ≤ r < 0.10 (negligible), 0.10 ≤ r ≤ 0.39 (weak), 0.40 ≤ r ≤ 0.69 (moderate), 0.70 ≤ r ≤0.89 (strong) and r ≥ 0.90 (very strong) [45]. The correlations with shades of darker blue show a positive correlation ranging from moderate to strong (Figure 7). In the rainy season, turbidity exhibits a moderate correlation with Ti, Al and V, and a weak correlation with Fe and P (Figure 7). In the dry season, it correlated strongly with Ptotal (r = 0.71) and moderately with Ti, Al and V, Cl, Ca, Mg, EC, TDS, Mn, K, Ba, Na, Sr, Ni, Fe and Co (Figure 7). The TDS showed a strong correlation with EC, Ca, Sr and Na in the rainy season, and, in the dry season, these same variables in addition to Cl, Mg, Mn, K, Ba and P. The pH shows moderate correlation with some alkaline earth and alkaline elements (Ca, Mg, Na and Sr) and TDS in the rainy season, and in the dry season, a moderate correlation was observed for the same variables, with the exception of Na, in addition to Cl, Al, SO42− and EC. Temperature and Eh showed no moderate or strong correlation with any other variable (Figure 7). Dissolved oxygen was shown to be negatively correlated (weakly to moderately) in both periods with EC, TDS, Fe, Mn, P, Co (Figure 7). The alkaline and alkaline-earth elements showed moderate or predominantly strong correlation between them in both periods (Figure 7). Very strong correlations were not observed in the rainy season, while in the dry season, Ca and Mg and K and Ba showed strong correlation (Figure 7).
Fe shows strong correlations with Mn (r = 0.69) and Co (r = 0.63) in both rainy and dry seasons, but Mn presents additional strong correlations with more variables such as Ca, K, Ba, Na, Sr, Ptotal and TDS (Figure 7). In the hierarchical cluster analysis, based on the degree of correlation, four main groups were identified in both periods, which are represented with different colors in the dendrogram (Figure 8). The groupings defined in rainy and dry periods are different, but they show some analogies. In the dry season, there is a large group (red group) subdivided into two subgroups, the first being formed by alkaline and alkaline earth elements, plus F, Ptotal, Mn, Cl, EC and TDS, and the second by turbidity, Fe, Co, Cr, Ni, Ti, V and Al. In the rainy season, many of these parameters of the two subgroups are shown to be grouped, but gathered in different groups. Thus, the elements that formed the first subgroup in the dry period (red grouping), where alkaline and alkaline earth elements dominate, appear in the same subgroup during the rainy period (green group), with the exception of F and Rb plus Fe and Co, and there is another subgroup, constituted by Rb and temperature (green R group). The elements of the second subgroup (red group) in the dry period defined another group during the rainy season, bringing together Ni, Cr, V, Ti, Al and turbidity, but without Fe and Co, plus SO42− and Cu (red grouping) of the rainy period. In the rainy season, DO and Eh gathered in a single group, while in the dry season Eh defined a subgroup with temperature, associated in the same cluster with another subgroup.
Principal component analysis was adopted to explain the variability of the data (Figure 9). Five main principal components (PCs) were used, which together explain 65.06% of the data for the rainy season and 68.62% for the dry season. The variables with significant loadings around each PC formed some elemental clusters (Figure 9). In the rainy period, cluster 1 (light brown color), with higher weights on PC1, comprises Na, EC, Ca, TDS, Sr, Ptotal, Ba, Mn, Mg, K. PC1 has a variability of 32.96% compared to PC2 (12.11%) (Figure 9) and hence the former is the main component to explain the variables that exert more influence on the surface water characteristics of the PRB. In the 2nd cluster (red color) in the rainy period, Al, Ti, Cu, turbidity, V, Cr and Ni are closely associated, which were positively loaded with both PC1 and PC2, while DO and Eh are closely associated in cluster 3 (green color).
In the dry season, PC1 showed a larger variability of 40.22% (Figure 9), and it was influenced by more variables and these had greater weights when compared to the rainy season. Such variability is explained by the strong positive weight for Na, Sr, Ca, TDS, EC, Ba, Mn, K, P, Mg, Cl, Fe and Co, which grouped together (cluster 1; light brown color) This cluster is similar to the rainy period, except for a few exceptions. It was also indicated that Cr, Ti, V, Al, Ni, Cu and turbidity were grouped together (cluster 2; red color), with moderate positive weight on PC1 and PC2, similar to the rainy period.
In general, what has already been observed in the dendrogram and in the Spearman correlation is confirmed. In both periods, the alkaline and alkaline earth elements, Ptotal, Co, Fe, Mn, Cl, EC and TDS are grouped in a cluster. As for the DO and Eh variables, they are associated in the same cluster and are correlated in both rainy and dry seasons, however, DO is highly negatively correlated with Fe, Mn and Co in both periods.

3.5. Geochemical Baseline Estimation of Metals in Surface Water of the Parauapebas River Basin

Table 2 illustrates the results obtained with the different statistical techniques applied to define the baseline values. In addition, the maximum contents allowed for the different elements are listed, as established by CONAMA 357/05—class 2 and WHO/1993. For the elements V, B, Co, Cr and Ni in both periods, Sn in the rainy season and Rb in the dry season, which presented % <DL above 47%, it was not possible to apply the 2σ interactive and distribution function techniques calculated due to their limitations. For the median technique + 2MAD, restrictions were also observed for the elements Co, Cr and Ni in both periods, Rb, V and B in the dry season and Sr in the rainy season. In the case of the TIF technique, the upper baseline value was overestimated and could not be used for the elements Sr, Zn, Rb and B in the two periods, for Ti and Sn in the rainy season and for Cr in the dry season.
Of the most widely applied techniques in the current literature, the 2σ interactive technique produced the lowest baseline values, similar with the values estimated by the calculated distribution function, the 75th percentile and the cumulative frequency curve, for many elements, including Ba, Fe, Ti, Rb, Cu, and Sn. On the other hand, the TIF technique provided the highest baseline values, which are close to the values corresponding to the 98th percentile or are higher. The median + 2MAD technique provided values lower than or situated between those of the 95th and 98th percentiles or, more rarely, slightly higher than both.
When comparing the two periods, it is possible to notice wide variations in the superior values of baseline, observing higher concentrations for most of the elements, in the rainy season. Fe, Al, Sr, Ti, Rb and Ni provide higher values in the rainy season in all applied techniques. Cu, B, V, Co and Cr show similar behavior, but one or more techniques showed higher values in the dry season. Ba and Mn show, depending on the technique applied, higher values in one or another period. Finally, Zn and Sn show dominance of higher baseline values in the dry season, in line with the fact that they also present higher levels in this period.
Among the baseline threshold values calculated for the 15 metals considered, in all applied techniques, the Mn baseline exceeds the maximum limit of CONAMA 357/05 and the same is verified for the Fe and Al baselines in relation to the values established by WHO/1993. The cumulative frequency curve together with the baseline values indicated by the interactive technique, distribution function, median + 2 MAD, P 98 and TIF were represented in cumulative frequency diagrams for the 15 trace elements considered, being illustrated for the elements Fe, Cu and Zn. The elements that presented a coefficient of variation greater than 100%, which are the vast majority, as is typical of geochemical data, were plotted on a logarithmic scale.

4. Discussion

4.1. Influence of Seasonal Variations on the Geochemistry of Surface Water

The results of the geochemical survey revealed the influence of seasonal variations in the PRB. Although the concentrations of most elements were lower than the respective maximum values stipulated by CONAMA 357/05 and WHO/1993, for most of them, there were distinctions between seasonal periods and concentration values. For DO, values below the minimum stipulated by CONAMA (5 mg/L) were observed in a significant number of samples during the rainy season. Possibly, this is due to the greater amount of organic matter carried to the water body due to the intense surface flow present in the region during the rainy season. The increase in organic matter in surface water would cause a greater consumption of DO by bacteria, resulting in the release of gases [46,47], and would cause a decrease in DO values. Furthermore, the moderate negative correlation between DO and TDS (r = −0.42) demonstrates that the material carried during the rainy period contributes to lower DO values. Electrical conductivity and TDS showed a tendency to higher values in the rainy season, with a notable concentration in the two periods in the upper Parauapebas, which corresponds to the most deforested region of the basin [23]. The highest concentrations in the rainy season are strongly related to the intense rainfall regime, which causes greater leaching and surface flow with transport of materials to drainages, especially in deforested areas [48,49,50]. In the watersheds located adjacent to the cities of Parauapebas and Canaã dos Carajás, higher values of these parameters were also observed, possibly related to discharges of domestic effluents, reflecting the absence of sewage treatment.
The Eh values were entirely positive and in 70% of the samples, in both periods, they exhibited values above 300 mV, indicating environments of oxidizing conditions [51]. In the rainy season, in the low course and preferably on the left bank of the Parauapebas, in areas located partly in the Carajás Flona domains, several microbasins with values above 500mV were observed. In the dry period, values of the same order are more restricted and are located in the middle Parauapebas. Possibly, such higher values are related to aerobic degradation, a process that requires higher concentrations of DO [52]. The fact that DO and Eh are associated in the same group during the rainy season favors this hypothesis. However, the correlation between them is not very strong (r = 0.38, R and r = 0.28, D), revealing that other factors must also influence Eh. Although this parameter is important, the results must be carefully evaluated. According to Jardim [51], in complex environments such as natural aquatic systems, the kinetics of ions do not always allow thermodynamic equilibrium conditions to be established.
Higher values of turbidity were observed during the rainy season, and are largely located in the north of the study region. Possibly, the increase in turbidity is related to the greater precipitation and accentuated growth of the superficial flow, observed in the lower Parauapebas [34], providing a greater volume of solid or suspended material carried to the rivers. In addition, intense deforestation in the region [23] has also caused an increase in surface flow [53], as observed in the Vermelho and Sororó River basins [3] and in other areas of the Amazon region [48,49,50]. In the dry period, two watersheds presented turbidity above the CONAMA limit, and in one of them, the value found was higher than that of the rainy period in the same watershed. Possible explanations for this would be local activities, such as human or animal interference (livestock) during this period, or the occurrence of sudden rains during or immediately before the collection of these samples, which could cause sediment breakdown or suspension of particulate materials. However, it should be noted that this is not a general rule, as it was not verified in most of the basin, nor in other IRW subbasins [3,54].
Regarding pH, no significant differences were observed between the two periods. More than 89% of the samples, in the two periods, exhibited pH values in the range of 6 to 8. In five watersheds in the rainy period, values below 6 were verified, with three of them located near the city of Parauapebas, possibly indicating the emission of pollutants, perhaps related to the dumping of untreated effluents, resulting in a decrease in pH. The other two watersheds, one located south of the N5 mine, in a forested area, do not seem to be affected by the mine, as the sampling point is located upstream. The other watershed, on the other hand, is located in the Igarapé Gelado Environmental Protection Area and at the point where the sample was collected, the water presented muddy characteristics and there was only undergrowth (grasses), suggesting the possibility of a greater contribution of organic matter by surface flow, altering water chemistry and causing lower pH value. In the dry season, another seven watersheds, all located in environmental protection areas, presented pH < 6, one of them being the same as mentioned above, located in the APA do Igarapé Gelado, and of the other six, four are in the Flona de Carajás near the N4 and N5 mines and two in the Campos Ferruginosos National Park. In these six samples, the pH ranged from 5.18 to 5.91. Teixeira (2016) also observed in the N3 and N4WSul regions pH values < 6 during the dry period, showing that this is also true in other areas of the basin. The lower pH in this period is due to bacterial decomposition of organic compounds in the sediments, which results in the production of CO2, which forms carbonic acid and various other organic acids, which causes an increase in acidity [55]. Some major components, exemplified by Al, Ca and K as well as some trace elements (Ba, Rb, Sr, Ti, V), showed slightly higher concentrations in the rainy season, explained mainly by the fact that leaching and particle transport are intensified during this period [56]. Fe is significantly enriched in the rainy season, while Mn is poorly enriched in this period. However, the positive correlation between Fe and Mn in the rainy season indicates that surface runoff brings associated Fe–Mn particles to water bodies. However, this should not be the dominant factor, as the correlation between Fe and Mn is only moderate, which indicates the action of an additional transport process and/or a different ionic association of Fe and Mn in the water. Moreover, the moderate positive correlation between turbidity and Fe, Al, Ti and Mn in both periods indicates the role of suspended solids in the form of Fe/Mn oxyhydroxide colloids and clay particles controlling the total concentrations of these elements in surface water. Therefore, where there was considerable turbidity, the overall concentrations of these ions were increased. In addition, the moderate negative correlation between DO and Fe (r = −0.42) in the rainy season and the moderate negative correlation between DO and Mn (r = −0.46) in the dry season indicate that the reductive dissolution of oxides of Fe and Mn may be an additional factor influencing Fe and Mn concentrations.

4.2. Influence of Lithology vs. Anthropic Effects on Water Geochemistry

In the Parauapebas River basin, a significant influence of the geological environment and local lithologies on the concentrations of several trace elements was observed. Copper concentrations in several watersheds, in both periods, were below the DL. However, the watersheds that presented higher values were concentrated in the central part of the basin, and in the lower Parauapebas, aligned in an east–west direction at the height of the city of Parauapebas, in the Carajás Basin domain, formed mainly by mafic metavolcanic rocks and banded iron formations. These two zones with notable copper enrichment correspond to the north and south copper belts [44,57], with the Sossego copper mine and several other deposits of this metal, including 118 and Cristalino. It is concluded that copper enrichment in the surface waters of the Parauapebas River basin is controlled by geological and metallogenetic and non-anthropogenic characteristics. The contents of this element are always below 2000 µg/L, MPV stipulated by WHO/1993. In general, what has already been observed in the PCA and dendrogram is confirmed by the Spearman correlation coefficients. The strong positive association of Ti, Al, Ni, Cr, Cu and V in PCA along with their strong-to-moderate positive correlations is indicative of bedrock lithology (geologic setting), which is mainly influenced by the mafic to intermediate metavolvanic rocks, while Cu in particular is controlled by the mineralized Cu belts. Cr and Ni have great geochemical affinity and effectively showed similarities in their spatial distributions, which was observed in the clusters in both periods. Cr and Ni exhibit moderate correlation in both periods (r = 0.6, R; r = 0.64, D). The occurrences of these elements are mainly associated with mafic–ultramafic bodies and also with mafic sequences [38,58], whose occurrences are distributed in the three geological domains. To the north of the basin, in the Bacajá domain, during the dry season, several watersheds on the right bank of the Parauapebas River, located in the presence of mafic rocks of the Tapirapé Formation, showed higher contents. Other microbasins, located in the Carajás basin, where metamafic volcanic rocks dominate, also showed significant values, particularly during the rainy season. Finally, in the southern portion of the basin, in the Canaã dos Carajás, Sapucaia and Rio Maria domains, there is enrichment in these elements associated with the metamafic–ultramafic rocks of the Sapucaia greenstone belt [59] and in the vicinity of the city of Canaã dos Carajás, where the red Ni mineral deposit is found, associated with a mafic–ultramafic body. Although the mentioned areas have presented relative enrichment in these elements, concentrations above the MPV of CONAMA 357 were not verified in any of the sampled watersheds. Cobalt showed similarity in its spatial distribution to Cr and Ni, although with a lower degree of correlation. On the other hand, despite its low concentration values, Co exhibits a strong correlation with Mn in R (r = 0.72) and moderate in D (r = 0.65). It also has a moderate correlation with Fe (r = 0.63, R; r = 0.56, D). During weathering, this element is considered relatively mobile in oxidizing environments, as is the case with the PRB. Furthermore, it has strong affinity with clay minerals and hydrated oxides of Fe and Mn [60]. However, DO is negatively correlated with Fe, Mn and Co in both periods, which is an indication of dissolution Fe–Mn oxides in a reducing environment.
Ca, Na, K, Sr, Ba and Rb are elements that have geochemical affinity with each other, and the correlation between them is strong or moderate in both seasons. Furthermore, these alkaline and alkaline earth elements were clustered with Fe, Mn, EC and TDS in both periods, indicating that these major ions are mainly controlling the TDS levels of the surface water of the PRB. Concentrations of the alkaline and alkaline earth elements were higher in the upper and middle portion of the Parauapebas, a region where feldspar-rich granitoid rocks predominate [39,40], indicating a strong influence of the geological environment and dominant lithologies in the anomalous concentrations of these elements. As these elements with greater mobility exhibit higher concentrations in the upper Parauapebas, the most deforested region, it is suggested that their enrichment in surface waters is associated with lithological factors, in addition to anthropogenic alterations related to changes in land use and cover. The spatial distribution of watersheds with higher values of EC and TDS also reflects the geological context of the basin, as there is a remarkable coincidence in the limit between the zone of maximum and minimum values with that between the domains of the Neoarchaeans of Canaã dos Carajás and Sapucaia and the Neoarchaean basin of Carajás. The former is predominantly formed by granitoids of TTG associations and calc-alkaline to subalkaline granites, with subordinate mafic schists, which are rich in highly mobile elements such as K+, Na+, Mg2+ and Ca2+. The cited ions, plus Sr and Ba, present a strong correlation with EC and TDS, and they occur in the same cluster at both stations.
This explains the fact that they present concentrations above the DL in the waters of all the sampled watersheds. Minerals that contain such elements are easily destabilized during weathering processes in a tropical climate, and their more mobile constituents are remobilized and transported in solution, thus being able to be found in all drainages. The chloride concentrations present in natural waters are derived from the dissolution of salts [61], such as sodium chloride (NaCl), or from the leaching of ferromagnesian minerals [62] (Santos 1997). However, higher concentrations in surface waters can also be caused by discharges of domestic and industrial effluents [63]. In the PRB, higher levels of Cl in watersheds located near Canaã dos Carajás seem to be influenced by the Southern Copper Belt [44], as it was found that chlorine was enriched in mafic minerals of widely distributed hydrothermal zones [40,57].

4.3. Influence of Land Use and Coverage on Water Geochemistry

It was verified that some watersheds had DO levels above 6.8 mg/L. These watersheds are located in the middle and lower Parauapebas, and largely in protected areas, such as Flona de Carajás, APA do Gelado and Campos Ferruginosos National Park, in areas covered by tropical forest or where there are remnants of forest or vegetation. This fact demonstrates the influence of forest cover and the presence of riparian forest, possibly serving as a thermal buffer [64,65], contributing to the maintenance of DO concentrations in drainage, by increasing the capacity to retain solar radiation and maintain the temperature of the drainage, thus reducing the possibility of dissociation of gases, caused by the increase in temperature [66]. For Ptotal, higher values were observed during the rainy season. In this period, 37 watersheds presented concentrations above the MPV of CONAMA 357 and another 14 during the dry period. Most of them are located in the upper Parauapebas stretch, the most deforested region, as already discussed. In this sense, it is suggested for these watersheds that these higher values are related to the growth of the surface flow provided by the intense rainfall regimes during the rainy period, which favor the transport of particles to the drainages. Evidence of this is the moderate to strong positive correlation between Ptotal and the alkaline and alkaline earth metals. In addition to these same correlations, a strong positive correlation between Ptotal and turbidity (r = 0.71) is observed during the dry period. Salomão [3] also observed Ptotal values above the MPV in the Vermelho and Sororó River basins, especially in the rainy season and mainly in the Sororó River basin, where approximately 50% of the values were above the MPV [3]. The origin of these values may be related to livestock activities (bovine manure), the discharge of untreated domestic effluents and, to a lesser extent, the use of fertilizers [67], commonly used in agriculture. However, one cannot be conclusive regarding the last point, as it is known that this type of activity is not remarkable in the PRB. Among the parameters under study, almost all were in accordance with the limits of CONAMA 357/05 and WHO/1993 resolutions, with the exception of the elements Fe and Mn, which in almost all samples exceeded the maximum limit of resolutions. Salomão [3] also observed high values for these elements in the Vermelho and Sororó River basins, located in the eastern portion of the IRW.
Elevated levels of Fe and Mn in surface waters are the dominant geochemical signature in the PRB, with moderate to strong weights being observed in both periods, and this situation is maintained in other subbasins of the IRW [2,3,54], although the maximum value of the middle Itacaiúnas subbasin is much lower than the other subbasins of the IRW. When compared with basins of other Brazilian states, there is a superposition of values between the Corumbataí River basin and the middle Itacaiúnas River basin, while the Santa Bárbara River basin in Minas Gerais has very high Fe and Mn contents, lower than those of the IRW subbasins. In the Amazon, the supergenic environment is characterized by a marked enrichment of iron and manganese and this is reflected in aquatic environments, as deforestation tends to favor higher levels of iron and manganese in surface waters [3]. In areas with preserved vegetation, lower values were observed for Fe when compared to deforested areas. Teixeira [30] obtained significant Fe values in surface waters located in areas considered pristine, located in the vicinity of mineral bodies N3 and N4WSul in Carajás. However, when compared to the rest of the basin, the Fe contents are much lower. Such Fe values were obtained in protected areas, but in areas close to the N4 and N5 iron mines, where the Carajás formations, consisting of banded iron formations, and Parauapebas, were formed by metavolcanic rocks rich in iron. Therefore, it is observed that the high values of Fe contained in the surface waters of the PRB are not related to geological conditions, nor to the localized presence of Fe mines, considering that this feature has a wide distribution in different subbasins of the region. The Gibbs chart (Figure 10) allows the evaluation of the main processes that control the hydrogeochemistry of the PRB. Among those considered, the graph indicates a predominance of rock weathering processes, with subordinate influence of precipitation, assuming that rock weathering is the main process controlling the hydrogeochemistry of this subbasin. From the positive, moderate to strong correlations between the major components Ca, Na, Mg and K, they indicate that the weathering of silicate minerals is the main factor controlling the water chemistry of the PRB. This type of weathering is a source of HCO3 which adsorbs H+ ions from the water and contributes to the increase in pH. Evidence of this is the positive correlation between Ca, Mg, Na and K and pH.

4.4. Geochemical Baseline Values for Metals in the Parauapebas River Basin

Different methodologies have been suggested in the literature to determine baseline values [2,3,10,11,14,68,69,70,71,72,73,74,75,76,77], however, the best way to estimate these values is not clear. Therefore, several authors have used multiple methodologies and critically examined the different baseline/background values obtained [2,3,68,69,70,71,72]. Furthermore, when choosing the most appropriate technique to be used to determine baseline values, prior knowledge of local characteristics, such as geology, level of anthropogenic influence, and presence or absence of preserved areas, is necessary [2,3]. The baseline values of the different elements in the surface waters of the PRB exhibited wide variations considering the various techniques used. Therefore, two levels of baseline values can be established: the first one is conservative baseline (CB), which is more likely to reflect a natural condition; and the second one has higher values and can be representative of an environmental baseline (EB), which includes both natural sources and diffuse anthropogenic sources.
For CB, the 2σ interactive technique and the distribution function would be the most appropriate as they remove a significant number of outliers and exhibit more realistic results [3,10,69]. The CB results would be equivalent to the natural baseline. However, for trace elements such as V, B, Co, Cr and Ni in the two periods, and Rb in the dry season and Sn in the rainy season, it was not possible to establish CB values, as they presented about 50% of values below the DL, which makes the application of these two techniques unfeasible. For such elements, the values indicated by the cumulative frequency curve were adopted.
Ba, Fe, Mn and Al were the only elements that presented higher baseline values for all statistical techniques applied, reflecting the fact that they are present in all samples with contents above the DL. Generally, as already observed for most elements, the baseline values were higher during the rainy season, as a result of the influence of seasonal variation. Only Zn and Sn showed dominance of higher baseline values in the dry season, in line with the fact that they also present higher levels in this period. In some regions, where there was a dominant influence of geology on the concentrations of some elements, such as Ni, Cu and Cr, a lot of attention is needed, as baseline values are not consistent with the reality of other areas in the river basin, where values below the DL predominate. Therefore, it must be considered on a case-by-case basis. In addition, CB values cannot be considered only, as the PRB was intensively deforested [23], which is certainly influenced by anthropic factors, and possible contribution of this factor should be taken into account, mainly in urbanized or totally deforested areas. From this perspective, more realistic values can result from the median + 2MAD, 95th percentile, 98th percentile and Tukey inner fence techniques. Such techniques would provide values representative of the sum of natural contributions plus diffuse anthropogenic contributions, with the resulting values understood as the environmental baseline (EB) [2,70]. Consequently, in the context of the PRB, not only the CB values be considered, but also the EB values, in view of the reality of this basin. However, among the mentioned techniques, only the 95th and 98th percentiles exhibited baseline values for the 15 calculated metals. The TIF method, although widely used in the literature [2,3], does not assume outlier values for some distributions. Therefore, the 98th percentile values were shown to be the most adequate to represent the upper EB in the PRB.
Assuming conservative baseline values for the 15 elements calculated, during the rainy season, Fe and Mn are above the maximum values stipulated by WHO/1993 and by CONAMA 357/05, respectively. In the dry season, Fe is also higher than the MPV by the WHO, while the Mn, depending on the technique considered, may be above or close to the MPV stipulated by CONAMA. The Al values, in the rainy season, were also above or close to the MPV stipulated by the WHO, while in the dry season Al presented a conservative baseline value below the MPV. On the other hand, for these three elements (Fe, Mn and Al), in both periods, the upper environmental baseline was well above the MPV. For the other elements, the baseline values for the multiple techniques used are lower than the maximum values stipulated by the WHO and CONAMA. Baseline values above the MPV stipulated for Fe and Mn were also observed by Salomão et al. [3] and Silva [54]. This reinforces that the maximum values stipulated by the Brazilian resolution (CONAMA 357/05), or even by the WHO, are not realistic for the Amazon region and particularly for the PRB and other sub-basins of the IRW [2]. This situation was also observed in soils and stream sediments of the IRW, Brazil [69,70,71,72]. Therefore, making comparisons based on international reference standards, without taking into account local factors such as geological, hydrological and climatological conditions and the dynamics of land use and cover, which can vary widely from one region to another, can result in underestimating or overestimating environmental risks for a given region [2,3,17]. The present study of the surface waters of the Parauapebas River basin, mainly for Fe and Mn, which exceeded the limits stipulated by the WHO and by CONAMA, illustrates how the current Brazilian legislation needs adjustments that take into account the peculiarities of each region in Brazil.

5. Conclusions

This study revealed that seasonal variations strongly influence the chemical characteristics of water of the PRB, with higher concentration levels during the rainy season. The most significant parameters in the basin are Fe and Mn, which exceeded the maximum values allowed by CONAMA Resolution 357/05—class 2 in several samples. The use of multivariate statistics was an indispensable tool to understand geochemical affinities and identify the geochemical signature of the catchment basin. For various trace elements, the positive association of Ti, Al, Ni, Cr, Cu and V is indicative of the influence of mafic to intermediate metavolcanic rocks, while Cu is specifically influenced by the north and southern belts of mineralizations. This clearly indicates a dominant geogenic control for the enrichment of these elements. The deforested areas also have a strong influence on the geochemical signature of surface waters, especially increasing the contribution of material carried to drainage during the rainy season, which consequently tends to display higher concentrations of Fe, Al, Mn and turbidity.
The use of multiple statistical techniques was essential to define the most suitable baseline levels of chemical elements for the PRB. Based on the techniques used, two types of baseline were defined: one considered as a ‘conservative baseline’ by excluding significant numbers of outliers, which can be seen as a natural baseline; and the other one is ‘environmental baseline’, which would be more comprehensive and encompass natural plus contributions from non-point anthropogenic sources. Thus, the latter would serve as the most appropriate baseline for the PRB. When compared to the CONAMA limit, the both baseline values of Fe, Mn and Al in the PRB are higher than the stipulated limit, which reinforces the inadequacy of Brazilian law, as the studied basin have peculiarities that should be considered for the proposition of values appropriate to the context of this basin. Moreover, considering the high turbidity and elevated levels of Fe, Mn and Al in surface water of the PRB, it is recommended to treat the raw surface waters of the basin (after coagulation/flocculation/sedimentation and solids–water separation) before use for domestic purposes.

Supplementary Materials

The following supporting information can be downloaded at: https://www.mdpi.com/article/10.3390/min12121579/s1, Table S1: Physicochemical parameters, anions and elements with statistical representation.

Author Contributions

Conceptualization, L.S.Q., R.D., P.K.S.; methodology, L.S.Q., G.N.S., G.d.S.e.S.; formal analysis, L.S.Q., P.K.S.; investigation, data curation, L.S.Q., G.N.S., G.d.S.e.S.; writing—original draft preparation, L.S.Q., P.K.S.; writing—review and editing, R.D., G.N.S.; visualization, L.S.Q., G.d.S.e.S.; supervision, R.D. All authors have read and agreed to the published version of the manuscript.

Funding

This research was financially supported by Vale Institute of Technology (ITV), Belém, Brazil and Vale SA (Gerência de Meio Ambiente Corredor Norte).

Data Availability Statement

Not applicable.

Acknowledgments

The present work was part of the Itacaiúnas Geochemical Mapping and Background project (ItacGMB). This projects has been developed and financially supported by the Instituto Tecnológico Vale (ITV), Belém, Brazil. This work was also financially supported by Vale (Gerência de Meio Ambiente Corredor Norte) and grants from Conselho Nacional de Desenvolvimento Científico e Tecnológico—CNPq to RD (proc. 402727/2018-5; Proc. 444306/2018-8; proc. 304.648/2019-1) and SCSRD (proc. 300443/2019-6).

Conflicts of Interest

The authors declare no conflict of interest. The funders had no role in the design of the study; in the collection, analyses or interpretation of data; in the writing of the manuscript; or in the decision to publish the results.

References

  1. Hem, J.D. Study and Interpretation of The Chemical Characteristics of Natural Water, 3rd ed.; US Geological Survey Water-Supply: Alexandria, VA, USA, 1985; Paper No. 2254. [Google Scholar]
  2. Sahoo, P.K.; Dall’Agnol, R.; Salomão, G.N.; da Silva Ferreira Junior, J.; Silva, M.S.; e Souza Filho, P.W.M.; Powell, M.A.; Angélica, R.S.; Pontes, P.R.; da Costa, M.F.; et al. High Resolution Hydrogeochemical Survey and Estimation of Baseline Concentrations of Trace Elements in Surface Water of the Itacaiúnas River Basin, Southeastern Amazonia: Implication for Environmental Studies. J. Geochem. Explor. 2019, 205, 106321. [Google Scholar] [CrossRef]
  3. Salomão, G.; Dall’Agnol, R.; Sahoo, P.; Ferreira, J., Jr.; Silva, M.; Souza-Filho, P.; Berrêdo, J.F.; Nascimento, W., Jr.; Costa, M. Geochemical Distribution and Threshold Values Determination of Heavy Metals in Stream Water in the Sub-Basins of Vermelho and Sororó Rivers, Itacaiúnas River Watershed, Eastern Amazon, Brazil. Geochim. Bras. 2018, 32, 180–198. [Google Scholar] [CrossRef]
  4. Gómez, R.; Arce, M.I.; Baldwin, D.S.; Dahm, C.N. Water Physicochemistry in Intermittent Rivers and Ephemeral Streams; Academic Press: Cambridge, MA, USA, 2017; pp. 109–134. [Google Scholar] [CrossRef]
  5. Boyer, E.W.; Hornberger, G.M.; Bencala, K.E.; McKnight, D.M. Response characteristics of DOC flushing in an alpine catchment. Hydrol. Processes 1997, 11, 1635–1647. [Google Scholar] [CrossRef]
  6. Kump, L.R.; Brantley, S.L.; Arthur, M.A. Chemical weathering, atmospheric CO2, and climate. Annu. Rev. Earth Planet Sci. 2000, 28, 611–667. [Google Scholar] [CrossRef] [Green Version]
  7. Bundschuh, J.; Prakash, J.; Mushtaq, S.; Vithanage, M.; Guilherme, L.R.G.; Reardon-Smith, K.; Parvez, F.; Morales-Simfors, N.; Ghaze, S.; Pudmenzky, C.; et al. Medical Geology in the Framework of the Sustainable Development Goals. Sci. Total Environ. 2016, 581, 87–104. [Google Scholar] [CrossRef] [PubMed]
  8. Silveira, M.P. Aplicação do Biomonitoramento Para Avaliação da Qualidade da Água em Rios; Embrapa Meio Ambiente: Jaguariúna, Brazil, 2004; p. 68. [Google Scholar]
  9. Khatri, N.; Tyagi, S. Influences of natural and anthropogenic factors on surface and groundwater quality in rural and urban areas. Front. Life Sci. 2014, 8, 23–39. [Google Scholar] [CrossRef]
  10. Matschullat, J.; Ottenstein, R.; Reimann, C. Geochemical Background—Can We Calculate It? Environ. Geol. 2000, 39, 990–1000. [Google Scholar] [CrossRef]
  11. Reimann, C.; Garrett, R.G. Geochemical Background—Concept and Reality. Sci. Total Environ. 2005, 350, 12–27. [Google Scholar] [CrossRef] [PubMed]
  12. Urresti-Estala, B.; Carrasco-Cantos, F.; Vadillo-Pérez, I.; Jiménez-Gavilán, P. Determination of Background Levels on Water Quality of Groundwater Bodies: A Methodological Proposal Applied to a Mediterranean River Basin (Guadalhorce River, Málaga, Southern Spain). J. Environ. Manag. 2013, 117, 121–130. [Google Scholar] [CrossRef]
  13. Galuszka, A. Different approaches in using and understanding the term “Geochemical Background”—Pratical implications for environmental studies. Pol. J. Environ. Stud. 2007, 16, 389–395. [Google Scholar]
  14. Galuszka, A. A Review of Geochemical Background Concepts and an Example Using Data from Poland. Environ. Geol. 2007, 52, 861–870. [Google Scholar] [CrossRef]
  15. Tidball, R.R.; Erdman, J.A.; Ebens, R.J. Geochemical baselines for sagebrush and soil, Powder River Basin, Montana Wyoming. United States Geol. Surv. OpenFile Rep. 1974, 74, 6–13. [Google Scholar]
  16. Nriagu, J.O. A global assessment of natural sources of atmospheric trace metals. Nature 1989, 338, 47–49. [Google Scholar] [CrossRef]
  17. Arpine, H.; Gayane, S. Determination of Background Concentrations of Hydrochemical Parameters and Water Quality Assessment in the Akhuryan River Basin (Armenia). Phys. Chem. Earth 2016, 94, 2–9. [Google Scholar] [CrossRef]
  18. Wendland, F.; Berthold, G.; Blum, A.; Elsass, P.; Fritsche, J.-G.; Kunkel, R.; Wolter, R. Derivation of natural background levels and threshold values for groundwater bodies in the Upper Rhine Valley (France, Switzerland and Germany). Desalination 2008, 226, 160–168. [Google Scholar] [CrossRef]
  19. Jardim, C.H. A “Crise Hídrica” No Sudeste do Brasil: Aspectos Climáticos e Repercussões Ambientais. Rev. Tamoios 2015, 11, 67–83. [Google Scholar] [CrossRef] [Green Version]
  20. Martirani, L.A.; Peres, I.K. Water crisis in São Paulo: News coverage, public perception and the right to information. Ambiente E Soc. 2016, 19, 1–20. [Google Scholar] [CrossRef]
  21. Nobre, C.; Marengo, J.; Seluchi, M.; Cuartas, L.; Alves, L. Some Characteristics and Impacts of the Drought and Water Crisis in Southeastern Brazil during 2014 and 2015. J. Water Resour. Prot. 2016, 8, 252–262. [Google Scholar] [CrossRef] [Green Version]
  22. Vasconcelos, C.H.; Andrade, R.C.d.; Bonfim, C.V.; Resende, R.M.d.S.; Queiroz, F.B.d.; Daniel, M.H.B.; Grigoletto, J.C.; Cabral, A.R.; Redivo, A.L.; Lacerda, J.C.V.; et al. Surveillance of the Drinking Water Quality Din the Legal Amazon: Analysis of Vulnerable Areas. Cad. Saúde Coletiva 2016, 24, 14–20. [Google Scholar] [CrossRef] [Green Version]
  23. Souza-Filho, P.W.M.; de Souza, E.B.; Silva, R.O., Jr.; Nascimento, W.R.; Versiani de Mendonça, B.R.; Guimarães, J.T.F.; Dall’Agnol, R.; Siqueira, J.O. Four Decades of Land-Cover, Land-Use and Hydroclimatology Changes in the Itacaiúnas River Watershed, Southeastern Amazon. J. Environ. Manag. 2016, 167, 175–184. [Google Scholar] [CrossRef]
  24. Martinelli, L.A.; Naylor, R.; Vitousek, P.M.; Moutinho, P. Agriculture in Brazil: Impacts, Costs, and Opportunities for a Sustainable Future. Curr. Opin. Environ. Sustain. 2010, 2, 431–438. [Google Scholar] [CrossRef]
  25. Lima, L.S.; Coe, M.T.; Soares Filho, B.S.; Cuadra, S.V.; Dias, L.C.P.; Costa, M.H.; Lima, L.S.; Rodrigues, H.O. Feedbacks between Deforestation, Climate, and Hydrology in the Southwestern Amazon: Implications for the Provision of Ecosystem Services. Landsc. Ecol. 2014, 29, 261–274. [Google Scholar] [CrossRef] [Green Version]
  26. Sajikumar, N.; Remya, R.S. Impact of Land Cover and Land Use Change on Runoff Characteristics. J. Environ. Manag. 2015, 161, 460–468. [Google Scholar] [CrossRef] [PubMed]
  27. Silva, R., Jr.; Queiroz, J.C.B.; Ferreira, D.; Tavares, A.; Souza-Filho, P.; Guimarães, J.T.F.; Rocha, E.J.P. Estimativa de precipitação e vazões médias para a bacia hidrográfica do rio Itacaiúnas (BHRI), Amazônia Oriental, Brasil. Rev. Bras. de Geogr. Física 2017, 10, 1638–1654. [Google Scholar] [CrossRef] [Green Version]
  28. Deegan, L.A.; Neill, C.; Haupert, C.L.; Ballester, M.V.R.; Krusche, A.V.; Victoria, R.L.; Thomas, S.M.; de Moor, E. Amazon Deforestation Alters Small Stream Structure, Nitrogen Biogeochemistry and Connectivity to Larger Rivers. Biogeochemistry 2011, 105, 53–74. [Google Scholar] [CrossRef]
  29. D’Almeida, C.; Vörösmarty, C.J.; Hurtt, G.C.; Marengo, J.A.; Dingman, S.L.; Keim, B.D. The effects of deforestation on the hydrological cycle in Amazonia: A review on scale and resolution. Int. J. Climatol. 2007, 27, 633–647. [Google Scholar] [CrossRef]
  30. Teixeira, S.S. Estudo Da Qualidade Das Águas Superficiais e Estimativa de Background na Área Das Minas de Ferro da Serra Norte, Carajás. Master’s Thesis, Instituto Tecnológico Vale—ITV, Belém, Brazil, 2016; p. 128. [Google Scholar]
  31. CONAMA—CONSELHO NACIONAL DE MEIO AMBIENTE. Resolução Nº 357, de 17 de Março de 2005. Dispõe Sobre a Classificação dos Corpos de Água e Diretrizes Ambientais Para o Seu Enquadramento, Bem Como Estabelece as Condições e Padrões de Lançamento de Efluentes, e dá Outras Providências. Diário Oficial [da] República Federativa do Brasil. Brasília, DF, 18 mar. 2005. Available online: https://www.icmbio.gov.br/cepsul/images/stories/legislacao/Resolucao/2005/res_conama_357_2005_classificacao_corpos_agua_rtfcda_altrd_res_393_2007_397_2008_410_2009_430_2011.pdf (accessed on 15 April 2018).
  32. World Health Organization—WHO. Guidelines for Drinking-Water Quality: Volume 1: Recommendations, 2nd ed.; World Health Organization: Geneva, Switzerland, 1993; p. 188. [Google Scholar]
  33. IBGE—Instituto Brasileiro de Geografia e Estatística. Censo demográfico. 2018. Available online: https://www.ibge.gov.br/ (accessed on 15 April 2018).
  34. GAT. Itacaiúnas: Estudo de Gestão Ambiental Territorial da Bacia do Itacaiúnas; Caderno 3: Marabá, Brazil, 2007; p. 261. [Google Scholar]
  35. Zappi, D.C. Paisagens e Plantas de Carajás—Landscape and Plants of Carajás; ITV: Belém, Brasil, 2017; p. 248. [Google Scholar]
  36. Alvares, C.A.; Stape, J.L.; Sentelhas, P.C.; De Moraes Gonçalves, J.L.; Sparovek, G. Köppen’s Climate Classification Map for Brazil. Meteorol. Zeitschrift. 2013, 22, 711–728. [Google Scholar] [CrossRef]
  37. Vasquez, M.L.; Rosa-Costa, L.T.; Silva, C.M.G.; Ricci, P.S.F.; Barbosa, J.P.O.; Klein, E.L.; Lopes, E.C.S.; Macambira, E.M.B.; Chaves, C.L.; Carvalho, J.M.A.; et al. Geologia e Recursos Minerais do Estado do Pará: Sistema de Informações Geográficas–SIG: Texto Explicativo dos Mapas Geológico e Tectônico e de Recursos Minerais do Estado do Pará; CPRM: Belem, Brazil, 2008; p. 328. [Google Scholar]
  38. Martins, P.L.G.; Toledo, C.L.B.; Silva, A.M.; Chemale, F.; Santos, J.O.S.; Assis, L.M. Neoarchean Magmatism in the Southeastern Amazonian Craton, Brazil: Petrography, Geochemistry and Tectonic Significance of Basalts from the Carajás Basin. Precambrian Res. 2017, 302, 340–357. [Google Scholar] [CrossRef]
  39. Feio, G.R.L.; Dall’Agnol, R.; Dantas, E.L.; Macambira, M.J.B.; Santos, J.O.S.; Althoff, F.J.; Soares, J.E.B. Archean Granitoid Magmatism in the Canaã Dos Carajás Area: Implications for Crustal Evolution of the Carajás Province, Amazonian Craton, Brazil. Precambrian Res. 2013, 227, 157–185. [Google Scholar] [CrossRef]
  40. Dall’Agnol, R.; Cunha, I.R.V.d.; Guimarães, F.V.; Oliveira, D.C.d.; Teixeira, M.F.B.; Feio, G.R.L.; Lamarão, C.N. Mineralogy, Geochemistry, and Petrology of Neoarchean Ferroan to Magnesian Granites of Carajás Province, Amazonian Craton: The Origin of Hydrated Granites Associated with Charnockites. Lithos 2017, 277, 3–32. [Google Scholar] [CrossRef]
  41. Miyagawa, L.D.J.P.P.; Gorayeb, P.S.D.S. Pillow Basalts of Morro Do Agostinho Ophiolite Suite: Records of Seafloor in the Midwestern Portion of Araguaia Belt [Basaltos Almofadados Da Suíte Ofiolítica Morro Do Agostinho: Registros de Fundo Oceânico Na Porção Centro-Oeste Do Cinturão Araguaia]. Geol. USP Ser. Cient. 2013, 13, 111–124. [Google Scholar] [CrossRef]
  42. APHA—American Public Health Association. Standard Methods for The Examination of Water and Wastewater, 22nd ed.; American Public Health Association: Washington, DC, USA, 2012; p. 1360. [Google Scholar]
  43. Andrade, L.N. Autodepuração dos corpos d’água. Rev. da Biol. 2010, 5, 16–19. [Google Scholar] [CrossRef]
  44. Moreto, C.P.N.; Monteiro, L.V.S.; Xavier, R.P.; Creaser, R.A.; DuFrane, S.A.; Tassinari, C.C.G.; Sato, K.; Kemp, A.I.S.; Amaral, W.S. Neoarchean and Paleoproterozoic Iron Oxide-Copper-Gold Events at the Sossego Deposit, Carajas Province, Brazil: Re-Os and U-Pb Geochronological Evidence. Econ. Geol. 2015, 110, 809–835. [Google Scholar] [CrossRef]
  45. Schober, P.; Schwarte, L.A. Correlation Coefficients: Appropriate Use and Interpretation. Anesth. Analg. 2018, 126, 1763–1768. [Google Scholar] [CrossRef] [PubMed]
  46. Chapman, D. Water Quality Assessments—A Guide to Use of Biota, Sediments and Water in Environmental Monitoring, 2nd ed.; CRC Press: Boca Raton, FL, USA, 1996; p. 609. [Google Scholar]
  47. Marotta, H.; Santos, R.O.D.; Enrich-Prast, A. Monitoramento Limnológico: Um Instrumento Para a Conservação Dos Recursos Hídricos No Planejamento e Na Gestão Urbano-Ambientais. Ambiente Soc. 2008, 11, 67–79. [Google Scholar] [CrossRef] [Green Version]
  48. Panday, P.K.; Coe, M.T.; Macedo, M.N.; Lefebvre, P.; Castanho, A.D.d.A. Deforestation Offsets Water Balance Changes Due to Climate Variability in the Xingu River in Eastern Amazonia. J. Hydrol. 2015, 523, 822–829. [Google Scholar] [CrossRef]
  49. Levy, M.C.; Lopes, A.V.; Cohn, A.; Larsen, L.G.; Thompson, S.E. Land Use Change Increases Streamflow Across the Arc of Deforestation in Brazil. Geophys. Res. Lett. 2018, 45, 3520–3530. [Google Scholar] [CrossRef]
  50. Nóbrega, R.L.B.; Lamparter, G.; Hughes, H.; Guzha, A.C.; Amorim, R.S.S.; Gerold, G. A Multi-Approach and Multi-Scale Study on Water Quantity and Quality Changes in the Tapajós River Basin, Amazon. Int. Assoc. Hydrol. Sci. 2018, 377, 3–7. [Google Scholar] [CrossRef] [Green Version]
  51. Jardim, W.F. Medição e Interpretação de Valores do Potencial Redox (Eh) em Matrizes Ambientais. Quim. Nova. 2014, 37, 1233–1235. [Google Scholar]
  52. Flyhammar, P.; Hakansson, K. The release of heavy metals in stabilized MSW by oxidation. Sci. Total Environ. 1999, 243, 291–303. [Google Scholar] [CrossRef]
  53. Pontes, P.R.M.; Cavalcante, R.B.L.; Sahoo, P.K.; da Silva, R.O., Jr.; Sousa, M.; Agnol, R.D.; Siqueira, J.O. The Role of Protected and Deforested Areas in the Hydrological Processes of Itacaiúnas River Basin, Eastern Amazonia. J. Environ. Manag. 2019, 235, 489–499. [Google Scholar] [CrossRef] [PubMed]
  54. Silva, G.S. Baselines Geoquímicos e Avaliação da Qualidade Química da Água Superficial na Sub-Bacia do Médio Rio Itacaiúnas, Região de Carajás—PA. Master’s Thesis, Instituto Tecnológico Vale—ITV, Belem, Brazil, 2019; p. 108. [Google Scholar]
  55. Wetzel, R.G. The oxygen content in freshwater. In Limnology; Brown, M., Ed.; Michigan State University: Hickory Corners, MI, USA, 1983; p. 172. [Google Scholar]
  56. Lark, R.M.; Bearcock, J.M.; Ander, E.L. How Does Temporal Variation Affect the Value of Stream Water as a Medium for Regional Geochemical Survey? J. Geochem. Explor. 2016, 169, 211–233. [Google Scholar] [CrossRef]
  57. Monteiro, L.V.S.; Xavier, R.P.; Hitzman, M.W.; Juliani, C.; de Souza Filho, C.R.; Carvalho, E.d.R. Mineral chemistry of ore and hydrothermal alteration at the Sossego iron oxide-copper-gold deposit, Carajás Mineral Province, Brazil. Ore Geol. Rev. 2008, 34, 317–336. [Google Scholar] [CrossRef]
  58. Rosa, W.D. Complexos Acamadados da Serra da Onça e Serra do Puma: Geologia e Petrologia de Duas Intrusões Máfico-Ultramáficas Com Sequência de Cristalização Distinta na Província Arqueana de Carajás, Brasil. Master’S Thesis, Universidade de Brasília, Brasilia, Brazil, 2014; p. 87. [Google Scholar]
  59. Sousa, S.D.; Monteiro, L.V.S.; Oliveira, D.C.D.; Silva, M.A.D.; Moreto, C.P.N.; Juliani, C. O Greenstone Belt Sapucaia na região de Água Azul do Norte, Província Carajás: Contexto geológico e caracterização petrográfica e geoquímica. Contrib. Geol. Amaz. 2015, 9, 317–338. [Google Scholar]
  60. Kabata-Pendias, A.; Pendias, H. Trace Elements in Soils and Plants, 2nd ed.; CRC Press: London, UK, 1992. [Google Scholar]
  61. Lima, C.S. Estudo da Qualidade da Água na Sub-Bacia do Ribeirão do Carmo (MG), Com Ênfase na Geoquímica e na Comunuidade Zooplanctônica. Master’s Thesis, Universidade Federal de Ouro Preto—UFOP, Ouro Preto, Brasil, 2013; p. 157. [Google Scholar]
  62. Santos, A.C. Noções de Hidroquímica. Hidrol. Conceitos e Apl. 1997, 3, 81–108. [Google Scholar]
  63. SEMAD—Secretaria Estadual de Meio Ambiente e Desenvolvimento. Relatório Anual 2009: Monitoramento da Qualidade das Águas Superficiais da Bacia do Rio Doce; Instituto Mineiro de Gestão das Águas: Belo Horizonte, Brazil, 2009; p. 444. [Google Scholar]
  64. Fritzsons, E.; Mantovani, L.E.; Neto, A.C.; Rizzi, N.E. A influência da floresta ciliar sobre a temperatura das águas do rio Capivari, Região Cárstica curitibana. Floresta 2005, 35, 395–407. [Google Scholar] [CrossRef]
  65. Dugdale, S.J.; Malcolm, I.A.; Kantola, K.; Hannah, D.M. Stream Temperature under Contrasting Riparian Forest Cover: Understanding Thermal Dynamics and Heat Exchange Processes. Sci. Total Environ. 2018, 610, 1375–1389. [Google Scholar] [CrossRef]
  66. Silva, L.A.; Carvalho, L.S.; Lopes, W.A.; Pereira, P.A.d.P.; Andrade, J.B.d. Solubilidade e Reatividade de Gases. Quim. Nova 2017, 40, 824–832. [Google Scholar] [CrossRef]
  67. Carpenter, S.R.; Caraco, N.F.; Correll, D.L.; Howarth, R.W.; Sharpley, A.N.; Smith, V.H. Nonpoint Pollution of Surface Waters with Phosphorus and Nitrogen. Ecol. Appl. 1998, 8, 559–568. [Google Scholar] [CrossRef]
  68. Nakić, Z.; Posavec, K.; Bacïani, A. A Visual Basic Spreadsheet Macro for Geochemical Background Analysis. Ground Water 2007, 45, 642–647. [Google Scholar] [CrossRef]
  69. Sahoo, P.K.; Dall’Agnol, R.; Salomão, G.N.; Junior, J.S.F.; Silva, M.S.; Filho, P.W.M.S.; Costa, M.L.; Angélica, R.S.; Filho, C.A.M.; Costa, M.F.; et al. Regional-scale mapping for determining geochemical background values in soils of the Itacaiúnas River Basin, Brazil: The use of compositional data analysis (CoDA). Geoderma 2020, 376, 114504. [Google Scholar]
  70. Sahoo, P.K.; Dall’Agnol, R.; Salomão, G.N.; da Silva Ferreira, J.; da Silva, M.S.; Martins, M.G.C.; Souza Filho, P.W.M.; Powell, M.A.; Maurity, C.W.; Angélica, R.S.; et al. Source and background threshold values of potentially toxic elements in soils by multivariate statistics and GIS-based mapping—A high-density sampling survey in the Parauapebas basin from Brazilian Amazonia. J. Environ. Geochem. Health 2020, 42, 255–282. [Google Scholar]
  71. Salomão, G.N.; Dall’Agnol, R.; Sahoo, P.K.; Angélica, R.S.; de Medeiros Filho, C.A.; Junior, J.S.F.; Silva, M.S.; Filho, P.W.M.S.; Junior, W.R.N.; Costa, M.F.; et al. Geochemical mapping in stream sediments of the Carajás Mineral Province: Background values for the Itacaiúnas River watershed, Brazil. Appl. Geochem. 2020, 118, 104608. [Google Scholar]
  72. Salomão, G.N.; Dall’Agnol, R.; Angélica, R.S.; Sahoo, P.K.; Wang, X. Geochemical mapping in stream sediments of the Carajás Mineral Province, part 2: Multi-element geochemical signatures using Compositional Data Analysis (CoDA). J. S. Am. Earth Sci. 2021, 110, 103361. [Google Scholar]
  73. Jarva, J. Geochemical Baselines in The Assessment of Soil Contamination in Finland; Geological Survey of Finland: Espoo, Finland, 2016; p. 52. [Google Scholar]
  74. Rodrigues, A.S.d.L. Caracterização da Bacia do rio Gualaxo do Norte, MG, Brasil: Avaliação Geoquímica Ambiental e Proposição de Valores de Background. Ph.D. Thesis, Universidade Federal de Ouro Preto, Ouro Preto, Brazil, 2012; p. 162. [Google Scholar]
  75. Reimann, C.; Fabian, K.; Birke, M.; Filzmoser, P.; Demetriades, A.; Négrel, P.; Oorts, K.; Matschullat, J.; de Caritat, P.; Albanese, S.; et al. GEMAS: Establishing Geochemical Background and Threshold for 53 Chemical Elements in European Agricultural Soil. Appl. Geochem. 2018, 88, 302–318. [Google Scholar] [CrossRef] [Green Version]
  76. Reimann, C.; Filzmoser, P.; Garrett, R.G. Background and Threshold: Critical Comparison of Methods of Determination. Sci. Total Environ. 2005, 346, 1–16. [Google Scholar] [CrossRef]
  77. Rodrigues, A.S.d.L.; Malafaia, G.; Costa, A.T.; Júnior, H.A.N. Background Values for Chemical Elements in Sediments of the Gualaxo do Norte River Basin, MG, Brazil. Rev. Ciências Ambient. 2014, 7, 15–32. [Google Scholar]
Figure 1. (a) Location of Itacaiúnas River watershed (IRW); (b) watershed of the Itacaiúnas River in the region of Carajás, showing the delimitation of the study area; (c) Parauapebas River basin (study area). Land use and occupation in 2013, according to Souza-Filho et al. (2016) [23].
Minerals 12 01579 g001
Figure 2. (a) Sub-basin of the Parauapebas River; (b) hydrographic subbasins included in the IRW.
Minerals 12 01579 g002
Figure 3. (a) Geological map of the Parauapebas River basin; (b) geological domains present in the IRW: Carajás Province with Carajás Basin (CB) and Canaã dos Carajás, Sapucaia and Rio Maria domains (CC); Bacajá Domain (BD); Araguaia Belt (AB).
Minerals 12 01579 g003
Figure 4. Location of surface water samples collected in the Parauapebas River basin: (a) in the rainy season; (b) in the dry season; (c) the detail showing the collection of a sample per microbasin.
Minerals 12 01579 g004
Figure 5. (a) Boxplot showing the distribution of physico-chemical parameters in surface waters of the Parauapebas River basin in the rainy and dry seasons. (b) Boxplot showing the distribution of chemical elements in surface waters of the Parauapebas River basin in the rainy and dry seasons.
Minerals 12 01579 g005
Figure 6. (a) Spatial distribution of physico-chemical parameters in surface waters of the Parauapebas River Basin in the rainy (R) and dry (D) seasons. (b) Spatial distribution of anions in surface waters in the rainy (R) and dry (D) seasons. (c) Spatial distribution of major cations and metals in surface waters in the rainy (R) and dry (D) seasons.
Minerals 12 01579 g006aMinerals 12 01579 g006bMinerals 12 01579 g006c
Figure 7. Spearman correlation coefficients showing the relations between water quality variables in surface waters of the Parauapebas River basin in the rainy and dry seasons.
Minerals 12 01579 g007
Figure 8. Hierarchical cluster analysis showing the association between parameters in surface waters of the Parauapebas River basin in the rainy and dry seasons.
Minerals 12 01579 g008
Figure 9. PCA analysis showing the association between parameters in surface waters of the Parauapebas River basin in the rainy and dry seasons.
Minerals 12 01579 g009
Figure 10. Gibbs plot showing the major hydrogeochemical processes controlling water chemistry in the Parauapebas River basin in the rainy and dry seasons.
Minerals 12 01579 g010
Table 1. Descriptive statistics for physico-chemical parameters, anions, Ptotal, major components (cations) and trace elements of surface waters from the Parauapebas River basin.
ParametersUnitySDLMinMaxAMedSDCVarQ1Q3
Physico-chemical parametersDOmg/LR0.10.48.85.35.41.528.54.66.4
D210.16.36.31.320.95.47.2
pH-R-4.49.47.17.20.7106.77.6
D5.28.37.27.20.67.86.97.6
Temperature°CR-21.631.426.126.11.8724.927.1
D20.132.525.325.12.39.22427.1
ECμS/cmR114534116.69491.878.853149
D1335789.15080.790.732117.8
EhmVR-79.9596.3349.8343.2101.729.1285.6402.8
D208.6605.8354.3368.581.222.9295.5405
TDSmg/LR56364106.19465.561.862133
D729188.86766.274.644115.5
TurbidityNTUR0.12.436329.120.139.5135.612.331.5
D0.436119.311.635.3183.15.919.9
Anions and PtotalSO42−mg/LR0.5<0.532.91.4<0.53.7268.3<0.51.3
D<0.537.31.2<0.53.4290<0.51
Fμg/LR50<5054050.3<5058.6116.5<5060
D<5043075.2<5071.394.9<50100
Clmg/LR0.5<0.558.96.14.27.7125.62.36.4
D<0.560.87.44.610135.32.47.7
Ptotalμg/LR10<1027071.76058.180.930100
D<10141055.220136.9248.1<1050
NO3mg/LR2.2<2.212.61.7<2.21.482.2<2.2<2.2
D<2.2121.6<2.21.593<2.2<2.2
Major components (cations)Femg/LR0.020.0622.43.62.53.291.21.744.3
D0.0432.32.11.03.7174.50.52.0
Mnmg/LR0.0010.006180.510.141.6318.90.080.3
D0.00197.20.50.081.0217.60.050.3
Almg/LR0.0010.01942.50.30.20.3119.90.090.32
D0.00492.30.140.070.26183.60.040.13
Camg/LR0.0010.936.28.06.76.276.94.19.7
D0.228.26.24.05.893.42.38.2
Mgmg/LR0.0010.434.54.63.04.7103.62.15.4
D0.236.64.93.15.4109.31.85.5
Kmg/LR0.0010.3113.12.81.859.31.84.1
D0.0312.92.72.02.384.11.03.7
Namg/LR0.0011.161.99.47.28.893.5411.1
D0.447.59.25.59.097.92.912.5
Trace elementsBaμg/LR113.341291.371.567.273.650.4106
D2.296788.749.85110.6124.630.8103.3
Bμg/LR1<134.83.51.145.1145.5<14.8
D<115.42.5<13.0122.2<13.6
Cuμg/LR1<11333.91.7311.1282.3<13.7
D<114.62.11.552.1100.3<12.7
Crμg/LR1<115.31.3<11.9150.3<11.4
D<17.010.9<11.0110.8<1<1
Niμg/LR1<1211.4<12.2157.9<11.7
D<112.51.3<11.9154.2<11.1
Vμg/LR1<114.31.51.051.9123.3<11.8
D<1151.3<11.8139.4<11.4
Znμg/LR1<144520.38.448.0236.82.023.2
D<115422.411.8529.4131.35.729.0
Snμg/LR1<115.22.11.052.6122.5<12.9
D<117.52.41.72.7114.31.042.5
Coμg/LR1<133.81.8<13.4187.4<11.8
D<129.91.5<13.1205.6<11.2
Srμg/LR15.650789.857.596.2107.220.2126
D<138162.927.782.9131.813.571.3
Rbμg/LR1<139.49.67.78.083.25.113.6
D<121.35.05.25.1101.4<18.2
Tiμg/LR1<162.88.95.69.1102.03.212
D<128.14.63.354.190.42.15.4
Notes: S—Season; D: dry period; R: rainy period; DL—Detection Limit; Min—Minimum; Max—Maximum; A—Average; Med—Median; SD—Standard Deviation; CVar—Coefficient of Variation; Q1—First Quartile; Q3—Third Quartile.
Table 2. Geochemical baseline threshold values of selected elements in both periods of the Parauapebas River basin.
ElementUnit%<DLCV (%)CFP75I2σDFM_MADP95P98TIFMPV
Ba_Rµg/L073.6104.0106.0106.2125.9204.2235.3308.3323.6700 *
Ba_D0124.696.0101.864.894.6316.2256.8394.5595.7
Fe_Rmg/L091.23.74.23.24.57.89.714.215.50.3 **
Fe_D0174.53.52.01.32.06.99.713.014.3
Mn_Rmg/L0318.90.40.30.20.31.01.73.41.90.1 *
Mn_D0217.60.30.30.10.20.72.64.16.5
Al_Rmg/L0119.90.260.30.20.41.00.71.41.80.2 **
Al_D0183.60.130.10.10.150.40.40.70.8
Sr_Rµg/L0107.296.6125.598.2130.6-299.6378.4-NP
Sr_D0.7131.825.071.034.459.9275.4248.2310.8-
Ti_Rµg/L5.1102.08.811.87.511.538.925.329.5-NP
Ti_D6.590.45.75.45.36.513.511.815.221.38
Zn_Rµg/L21236.820.022.84.120.5218.852.9127.8-180 *
Zn_D2131.39.028.910.725.9134.956.8150.7-
Rb_Rµg/L23.383.213.113.613.715.438.924.428.1-NP
Rb_D47.7101.47.77.9---14.616.5-
Cu_PCµg/L32.4282.34.33.72.23.928.8410.928.575.02000 **
Cu_PE24.8100.34.12.72.93.28.137.19.6-
V_Rµg/L47.2123.32.01.8--9.554.56.612.6100 *
V_D58.2149.41.81.4---4.26.87.1
B_Rµg/L48.3145.55.04.8--13.1812.515.4-500 *
B_D52.3122.26.43.5---9.111.8-
Sn_Rµg/L48.9122.53.32.9--9.556.711.5-NP
Sn_D24.2114.34.62.52.93.55.507.012.49.0
Co_Rµg/L56.8187.43.11.8---6.110.211.950 *
Co_D68205.61.31.2---5.411.04.7
Cr_Rµg/L64.2150.31.51.4---4.19.06.350 *
Cr_D78.4110.84.0----3.23.8-
Ni_Rµg/L64.2157.92.91.7---4.37.710.0250 *
Ni_D73.2154.22.71.1---5.07.93.5
Note: DL—Detection limit; CV—Coefficient of variation; CF—Cumulative frequency curve; P75—75th percentile; I2σ—Interactive technique 2σ; FD—Distribution function; M_MAD—Median + 2MAD; P95—95th percentile; P98—98th percentile; TIF—Tukey inner fence; MPV—Maximum value allowed; NP—Does not have MPV; * CONAMA 357/05 class 2; ** World Health Organization/1993; (-) elements for which higher baseline values could not be calculated.
Publisher’s Note: MDPI stays neutral with regard to jurisdictional claims in published maps and institutional affiliations.

