Article

Influence of Biomacromolecules on Calcium Phosphate Formation on TiO2 Nanomaterials

Laboratory for Biocolloids and Surface Chemistry, Division of Physical Chemistry, Ruđer Bošković Institute, Bijenička cesta 54, 10000 Zagreb, Croatia
*
Author to whom correspondence should be addressed.
Minerals 2022, 12(12), 1557; https://doi.org/10.3390/min12121557
Submission received: 10 October 2022 / Revised: 18 November 2022 / Accepted: 30 November 2022 / Published: 2 December 2022
(This article belongs to the Special Issue Biomineral Inspired Materials for Regenerative Medicine)

Abstract

:
Calcium phosphates (CaP) composites with biomacromolecules and/or nanomaterials have recently emerged as a potential solution to improve the poor mechanical properties and biological response of CaP. Among the methods available for preparation of such composites, precipitation at low temperatures attracts special interest as it allows preservation of the activity of biomacromolecules. However, precipitation of CaP in the presence of two additives is a complex process that needs to be studied in detail to rationalize composite preparation. This study aimed to investigate co-precipitation of CaP on different TiO2 nanomaterials (TiNMs), including nanoparticles (TiNPs), nanoplates (TiNPls), nanotubes (TiNTs), and nanowires (TiNWs), in the presence of bovine serum albumin (BSA) and chitosan (Chi). The obtained results have shown that both BSA and Chi inhibited transformation of amorphous to crystalline CaP, even in the presence of TiNMs at concentrations that promoted transformation. Chi proved to be a stronger inhibitor due to its more flexible structure. The presence of BSA and Chi did not influence the composition of the CaP formed as calcium-deficient hydroxyapatite (CaDHA) was formed in all the systems. However, both macromolecules influenced the morphology of the formed CaDHA in different ways depending on the type of TiNM used. BSA and Chi adsorbed on all the TiNMs, as confirmed by zeta potential measurements, but this adsorption reduced the amount of CaP formed on TiNMs only in the case of TiNWs. The obtained results contribute to the understanding of the influence of BSA and Chi on CaP precipitation in the presence of nanomaterials and thus to the rational design of CaP-based multi-composite materials.

Graphical Abstract

1. Introduction

Among various materials available for bone regeneration, calcium phosphates (CaP) are among the most frequently used since the main mineral component of vertebrate hard tissue is calcium phosphate. More specifically, it is a non-stoichiometric, poorly crystalline, calcium-deficient hydroxyapatite doped with sodium, magnesium, and carbonate called biological apatite [1]. Of the 13 known CaP phases for bone tissue engineering, the most important are hydroxyapatite [HAP, Ca10(PO4)6(OH)2], calcium-deficient apatite [CaDHA, Ca10−x(HPO4)x(PO4)6−x(OH)2−x, 0 < x < 1], octacalcium phosphate [OCP, Ca8(HPO4)2(PO4)4·5H2O], α and β tricalcium phosphates [α-, β-TCP, Ca3(PO4)2], and calcium hydrogenphosphate dihydrate [DCPD, CaHPO4·2H2O] [1,2]. They are non-toxic, bioactive, osteoconductive, and support osteoblast adhesion and proliferation. However, they have low elasticity, mechanical reliability, and fracture toughness, as well as high brittleness [1,3]. To overcome these drawbacks, to better mimic bone tissue, and to introduce additional functionalities, CaP are frequently functionalized, either by doping with different ions or by preparing composites with various biologically active compounds, or, more recently, with different nanomaterials [3,4].
Functionalization of CaP with biomacromolecules is frequently pointed out as a way to better mimic bone structure since bone itself is an organic–inorganic composite of biological apatite and type I collagen fibers [5]. In this sense, two biomacromolecules of special interest are chitosan (Chi) and bovine serum albumin (BSA). Chitosan is a natural linear polysaccharide composed of D-glucosamine and N-acetyl D-glucosamine units [6,7]. It is biocompatible, biodegradable, bioactive, non-toxic, and possesses antibacterial and antiviral properties [7]. In bone tissue engineering, it is mostly used in the form of hydrogels and scaffolds to functionalize CaP, or as a component of drug delivery systems [3,7,8,9,10]. Serum albumin is the most abundant protein in mammalian blood [11] and is the first protein to surround implants that come into contact with blood, modifying their immunogenic response [12]. Therefore, functionalization with BSA is considered as a way to improve the bioactivity of CaP, but also as a model for sustained release drug delivery systems [3,13,14,15]. Most studies are performed with BSA because it is a very abundant protein, most similar to human serum albumin, and inexpensive [16]. Precipitation of CaP in the presence of biomacromolecules at low temperatures is considered an efficient way to functionalize CaP while maintaining the bioactivity of the biomacromolecule of interest [3]. Moreover, if the concentrations of the reactants are close to the physiological concentration, this is also considered as a way to elucidate biomineralization processes [17,18]. Despite the importance of BSA and Chi in the development of CaP-based bone regeneration materials, their influence on precipitation of CaP has not yet been fully elucidated.
In recent years, addition of inorganic nanomaterials to CaP has been considered a promising solution to improve their poor mechanical properties [19,20,21]. Since some nanomaterials have additional properties, such as antibacterial or magnetic, this is also a way to obtain multifunctional materials [22,23].
Among the various nanomaterials, TiO2 nanomaterials (TiNMs) are of special interest due to the excellent mechanical properties and biocompatibility of TiO2 [2]. Various synthetic procedures have been investigated for preparation of CaP composites with TiNMs (CaP/TiNMs) [24,25,26,27,28,29]. However, these were high-temperature and not environmentally friendly methods. Low-temperature wet chemical processes are attracting increasing attention because they offer better control of the CaP phase formed and the possibility of incorporating biologically active molecules into the composites while preserving their bioactivity. Moreover, they require simple equipment and are inexpensive [30]. To the best of our knowledge, only Ruso et al. [31] and our group [32,33] have used such methods to prepare CaP/TiNM composites. Ruso et al. have shown that amorphous calcium phosphate (ACP) can be formed from simulated body fluid (SBF) after one day on decahedral anatase nanoparticles with a high content of reactive {100} facets [31]. On the other hand, our group [32,33] was able to prepare CaDHA composites with TiNMs of different morphologies within one hour by precipitating CaDHA in the presence of TiNMs.
A combination of biomacromolecules and nanomaterials could open a wide range of possibilities for design of multifunctional composite biomaterials. This was recently demonstrated by Cojocaru et al. [22], who prepared biopolymer/calcium phosphate/magnetic nanoparticles by co-precipitation. However, precipitation of CaP in the presence of two additives is a complex process that needs to be studied in detail to rationalize composite preparation.
To elucidate precipitation of calcium phosphate in the presence of two types of additives, i.e., biomacromolecules and TiNMs, in this paper, we have investigated formation of CaP on TiNMs of different dimensionality and composition (anatase nanoparticles (TiNPs) and nanoplates (TiNPls), titanate nanotubes (TiNTs), and nanowires, which are a mixture of TiO2(B) and titanate (TiNWs)) in the presence of BSA and Chi to contribute to development of a mild preparation procedure of ternary biomacromolecule/CaP/NMs composites.

2. Materials and Methods

2.1. Materials

Analytical-grade chemicals were used in all experiments. Calcium chloride (CaCl2), sodium hydrogenphosphate (Na2HPO4), anatase TiO2 nanoparticles, TiO2 P25 Degussa (75% anatase, 25% rutile), titanium tetraisopropoxide (TTIP), hydrofluoric acid (HF), sodium hydroxide (NaOH), hydrochloric acid (HCl), bovine serum albumin, and chitosan (medium molecular weight) were purchased from Sigma Aldrich, Darmstadt, Germany. All experiments were performed in ultrapure water (UPW, Hydrolab HLP 10 UV, Straszyn, Poland, conductivity 0.5 μS cm−1).

2.2. Preparation of TiO2 Nanomaterials

For anatase TiNPls preparation, the modified procedure of Han et al. [34] was used. To the TTIP placed in a Teflon dish, HF was added dropwise, and the reaction mixture was placed in an autoclave at 180 °C for 24 h. The obtained precipitate was filtered and washed with UPW. The excess fluoride ions were removed by incubating the TiNPls with 0.1 mol L−1 NaOH for 24 h and washed with UPW until the conductivity of the mother liquor was below 10 μS cm−1. Afterward, the fluoride residues were removed by calcination at 500 °C for 2 h [35].
Both titanate/TiO2 (B) TiNWs and titanate TiNTs were synthesized by alkaline hydrothermal synthesis [36]. The required amount of TiO2 P25 particles was suspended in a 10 mol L−1 NaOH solution using magnetic stirring and sonication for 2 h. The prepared suspensions were transferred to a Teflon-lined autoclave. TiNWs were prepared by heating suspension at 180 °C for 24 h while the suspension was heated at 146 °C for 48 h to obtain TiNTs. The formed products were filtered and washed with UPW. The excess Na+ ions were removed by suspending TiNWs and TiNTs in 0.1 mol L−1 HCl and magnetically stirring for 3 h. Both TiNMs were washed with UPW until the conductivity of the mother liquor was lower than 10 μS cm−1, subsequently filtered, and dried at 100 °C for 8 h.
Detailed characterization of TiNMs was previously published [32,33].

2.3. Precipitation Experiments

CaCl2 and Na2HPO4 stock solutions were obtained by dissolving the appropriate amount of analytical grade chemicals, which were dried overnight in a desiccator over silica gel in UPW. HCl was used to adjust the pH of the Na2HPO4 stock solution to 7.4. TiNMs stock suspensions (γ = 1 g L−1) were obtained by suspending the appropriate amount of powder in UPW using ultrasound and stored in glass bottles in the dark. BSA stock solution (γ = 10 g L−1) was prepared by dissolving the appropriate amount of BSA in UPW. Chitosan stock solution (γ = 200 mg L−1) was prepared by dissolving the required amount of chitosan in 1 mol L−1 HCl using ultrasound for 2 h.
The cationic and anionic reactant solutions were prepared by diluting the CaCl2 and Na2HPO4 stock solutions, respectively, to the concentration c = 8 × 10⁻³ mol dm−3. After dilution, the pH of the anionic reactant solution was readjusted if necessary. The control precipitation system (system without the additives) was prepared by fast mixing equal volumes of cationic and anionic reactant solutions, resulting in the initial reactant concentrations c(CaCl2) = c(Na2HPO4) = 4 × 10⁻³ mol dm−3 at pH = 7.4. To investigate the effect of the additives on CaP precipitation, the required volumes of BSA and chitosan stock solutions and TiNMs stock suspensions were added to the anionic reactant solution before mixing the reactant solutions. The pH of the anionic reactant solution was readjusted if needed. Precipitation experiments were performed in a double-walled vessel without additional stirring at 25 ± 0.1 °C. Since precipitation of CaP consequentially leads to changes in pH, monitoring pH changes in precipitation systems was used to follow the advancement of the precipitation process (Metrohm 701 pH/Ion meter). From the obtained pH vs. time curves, the induction times for transformation of the amorphous to crystalline phase (ti) were determined at the intersection of the tangents drawn on the first two sections of the sigmoidal pH vs. time curve [37,38,39]. In this sense, ti represents the time elapsed between the appearance of ACP and the secondary precipitation of the crystalline phase [37]. Based on ti, the precipitates were filtered after 60 min in the case of the control system and the systems containing BSA and/or TiNMs and after 120 min in the case of the systems containing chitosan and/or TiNMs. The filtered precipitates were washed three times with UPW and ethanol. Subsequently, they were dried in the nitrogen stream and stored in a desiccator until further analysis by powder X-ray diffraction (PXRD), Fourier-transformed infrared spectroscopy (FTIR), and scanning electron microscopy (SEM).

2.4. Characterization Methods

PXRD patterns of the precipitates were obtained by Panalytical Aeris Research Edition (Malvern Pananalytical, Malvern, Worcestershire, UK) in Bragg–Brentano geometry using CuKα radiation. An angular scan range of 5° to 70° 2θ with a step size of 0.02° 2θ and a scan rate of 1° min−1 was used.
The FTIR spectra of the samples were recorded in the range 4000−400 cm−1 with a resolution of 1 cm−1 using an FTIR spectrometer equipped with an attenuated total reflection module (Tensor I, Bruker, Ettlingen, Germany). The obtained spectra are the average of 16 scans. To analyze FTIR spectra in more detail, first- and second-order differentiation were used. The obtained spectra were differentiated using the procedure described by Uskoković [40]. In short, FTIR spectra in the range 1200–400 cm−1 were differentiated using a manual differentiation routine in Origin Pro 2021b. First- and second-order differentiated spectra were further smoothed using the manual Lowess routine with a proportion span of 0.01.
The morphology of the investigated materials was observed using a field emission scanning electron microscope (FE-SEM; JEOL JSM-7000F microscope, Tokyo, Japan). The precipitates were put on a sample holder covered with carbon glue. The excess powder was removed by a gentle flow of nitrogen gas.
The zeta potential (ζ) of TiNMs in an anionic reactant solution in the presence of BSA and Chi was determined by electrophoretic light scattering. Measurements were performed using a photon correlation spectrophotometer equipped with a 532 nm “green” laser (Zetasizer Nano ZS, Malvern Instruments, Worcestershire, UK). The zeta potential was calculated from the measured electrophoretic mobility using Henry’s equation using the Smoluchowski approximation. Each measurement was repeated five times. The measurements were processed by Zetasizer Software 7.13 (Malvern Instrument Worcestershire, UK). All measurements were performed at 25.0 ± 0.1 °C.

3. Results and Discussion

To clarify the influence of BSA and Chi on CaDHA/TiNMs composites, their effect on the kinetics of crystalline phase precipitation and the properties of the crystalline phases were determined both in the absence and presence of the respective TiNMs.

3.1. The Influence of the Biomacromolecules on the Induction Time for Crystalline Phase Precipitation

Under near physiological conditions, precipitation of CaP can occur through formation of an amorphous precursor, amorphous calcium phosphate (ACP) [18]. ACP can further be transformed, depending on experimental conditions, in OCP, DCPD, CaDHA, and/or HAP when it remains in contact with the mother liquor [37,38,41,42,43,44]. Precipitation of CaP results in a decrease in pH, reflecting different stages of the precipitation process. This allows the precipitation process to be followed, at least semiquantitatively, by monitoring changes in the pH of the precipitation system. In all the investigated systems, precipitation began immediately after mixing of the reactant solutions, as evidenced by the turbidity of the systems. The pH vs. time curves obtained in all the investigated precipitation systems (Figure 1 and Figure 2) had a typical sigmoidal shape reflecting three stages of the precipitation process [37,38,45,46]. In the first stage, the pH drop is small or negligible and corresponds to formation of ACP. In the second stage, secondary precipitation of the crystalline phase on formed ACP occurs, followed by an abrupt decrease in pH. In the final stage, solution-mediated growth and phase transformation occur, also followed by a slight change in pH. Since no changes in the shape of the pH vs. time curves were observed, it can be concluded that none of the investigated additives altered the pathway of ACP transformation to the crystalline phase, as was previously observed for several different types of additives, such as ions (magnesium [47,48] and citrate ions [39]), small molecules (amino acids [47]), and macromolecules (phosphorylated osteopontin peptides [46] and polyelectrolytes [37]). In addition, the small drop in pH in the first stage, observed in all the precipitation systems, according to Du et al. [49], indicates that formation of a basic structural unit of ACP, Posner’s clusters, and, consequently, of ACP proceeds through the ligand substitution reaction in which non-coordinated, partially protonated phosphate ions replace the water molecule in the Ca2+ coordination sphere.
The induction times of crystalline phase formation determined in different precipitation systems are provided in Table 1 and Table 2. Both BSA and Chi prolonged the time needed for ACP transformation to the crystalline phase, consistent with the previously observed behavior of proteins and polyelectrolytes [37,50]. However, chitosan acted as a stronger inhibitor as the inhibitory effect was observed at much lower concentrations (7.5–15.0 mg L−1), at which no BSA effect was observed. Moreover, at concentrations of 50 mg L−1 or more, chitosan completely inhibited formation of CaP as no precipitate was observed even after 24 h. The difference in the behavior of BSA and Chi could be due to the different molecular structures. The BSA molecule has a rigid, compact, heart-like-shaped form [51], whereas CS is a flexible, linear polysaccharide [52,53]. Bar-Yosef Ofir et al. [37] suggested that the inhibitory effect of the flexible polyelectrolytes, at higher concentrations, is due to their spreading and arranging in a flat position at the surface of ACP particles, most probably in an irreversible manner. Due to that, transport of constitutive ions to the surface of the ACP particles and, consequently, secondary nucleation are inhibited. A similar explanation could be applied to BSA and Chi. Flexible Chi can cover the surface of the particles more efficiently at much lower concentrations than rigid BSA, leading to the difference in their inhibitory effect.
As far as we are aware, there are no data in the available literature on the promoter or inhibitor role of Chi.
In the systems containing both biomacromolecules and TiNMs, the determined ti was longer than in the control system or the presence of TiNMs alone (Table 2.). We have previously shown that TiNMs have an effect on ACP transformation opposite to that observed for polyelectrolytes [32,33]. At low concentrations, TiNMs inhibit ACP transformation, while, at high concentrations, they promote it. This was explained by obstruction of crystallization within the ACP particles formed in the solution at low TiNMs concentrations and promotion of transformation at higher TiNMs concentrations, at which ACP dominantly forms on the surface of the TiNMs [32,33]. However, addition of BSA or Chi to the precipitation systems resulted in ti longer than in the systems containing only TiNMs. As expected, the difference in ti between systems containing only TiNMs and systems containing both TiNMs and biomacromolecules decreased with increasing TiNMs concentration. It is worth noting that, at lower investigated concentrations of TiNPs and TiNWs, induction times in the presence of chitosan are longer than in the system containing only chitosan. This confirms the conclusion that flexible macromolecules that can effectively cover the surface of ACP particles are more efficient inhibitors of ACP transformation.
To the best of our knowledge, no literature data on the influence of BSA and Chi on rate of ACP transformation exists. However, Damen et al. [54] showed that anatase or rutile powders can serve as a substrate for secondary nucleation even in the presence of 40 mg mL−1 BSA, although, at that concentration of BSA, precipitation was completely inhibited in the control system. On the other hand, BSA inhibits formation of CaP on titanium surfaces, whether it is in solution or preadsorbed on titanium [55,56,57,58].

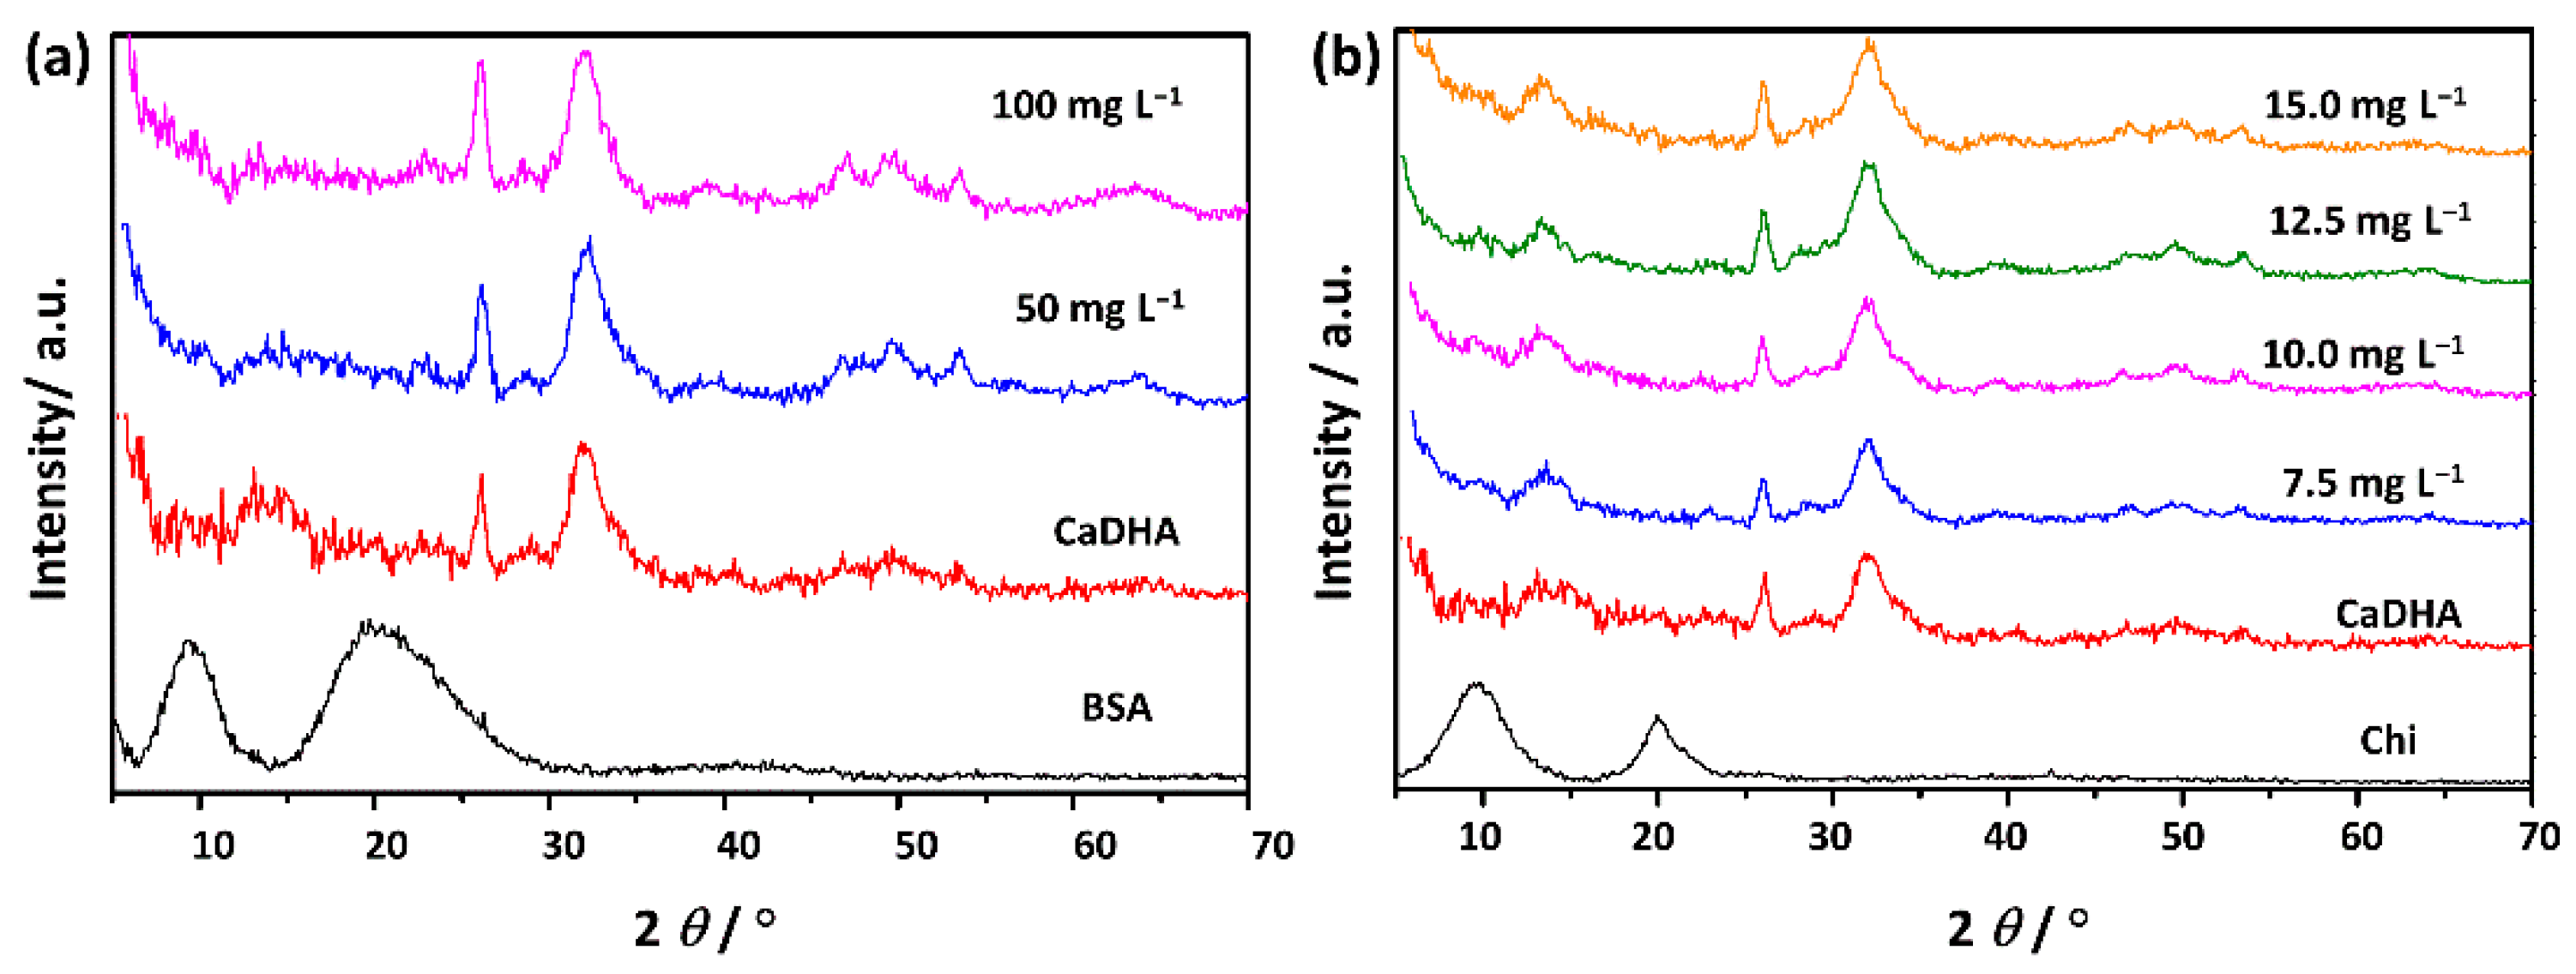
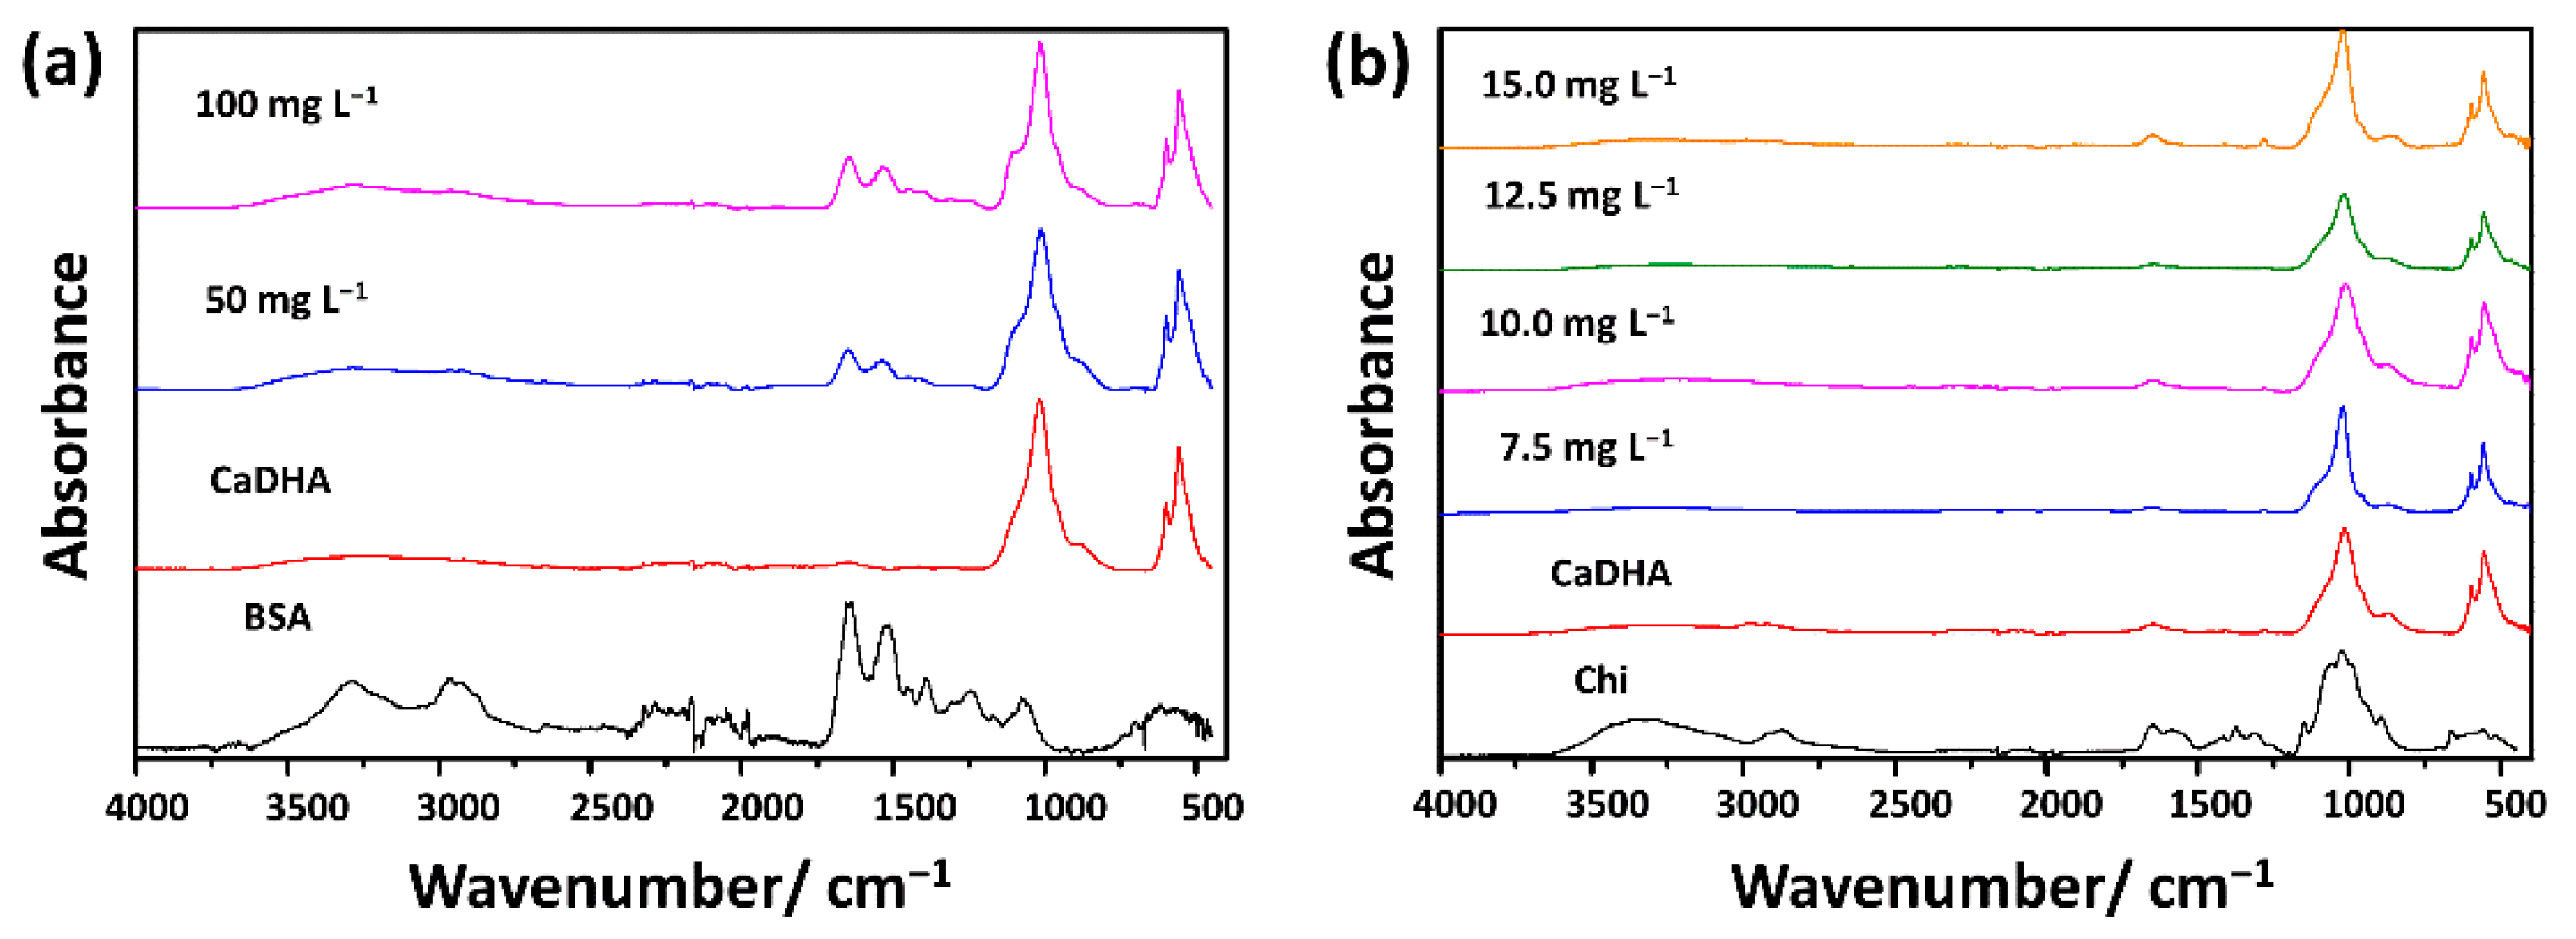
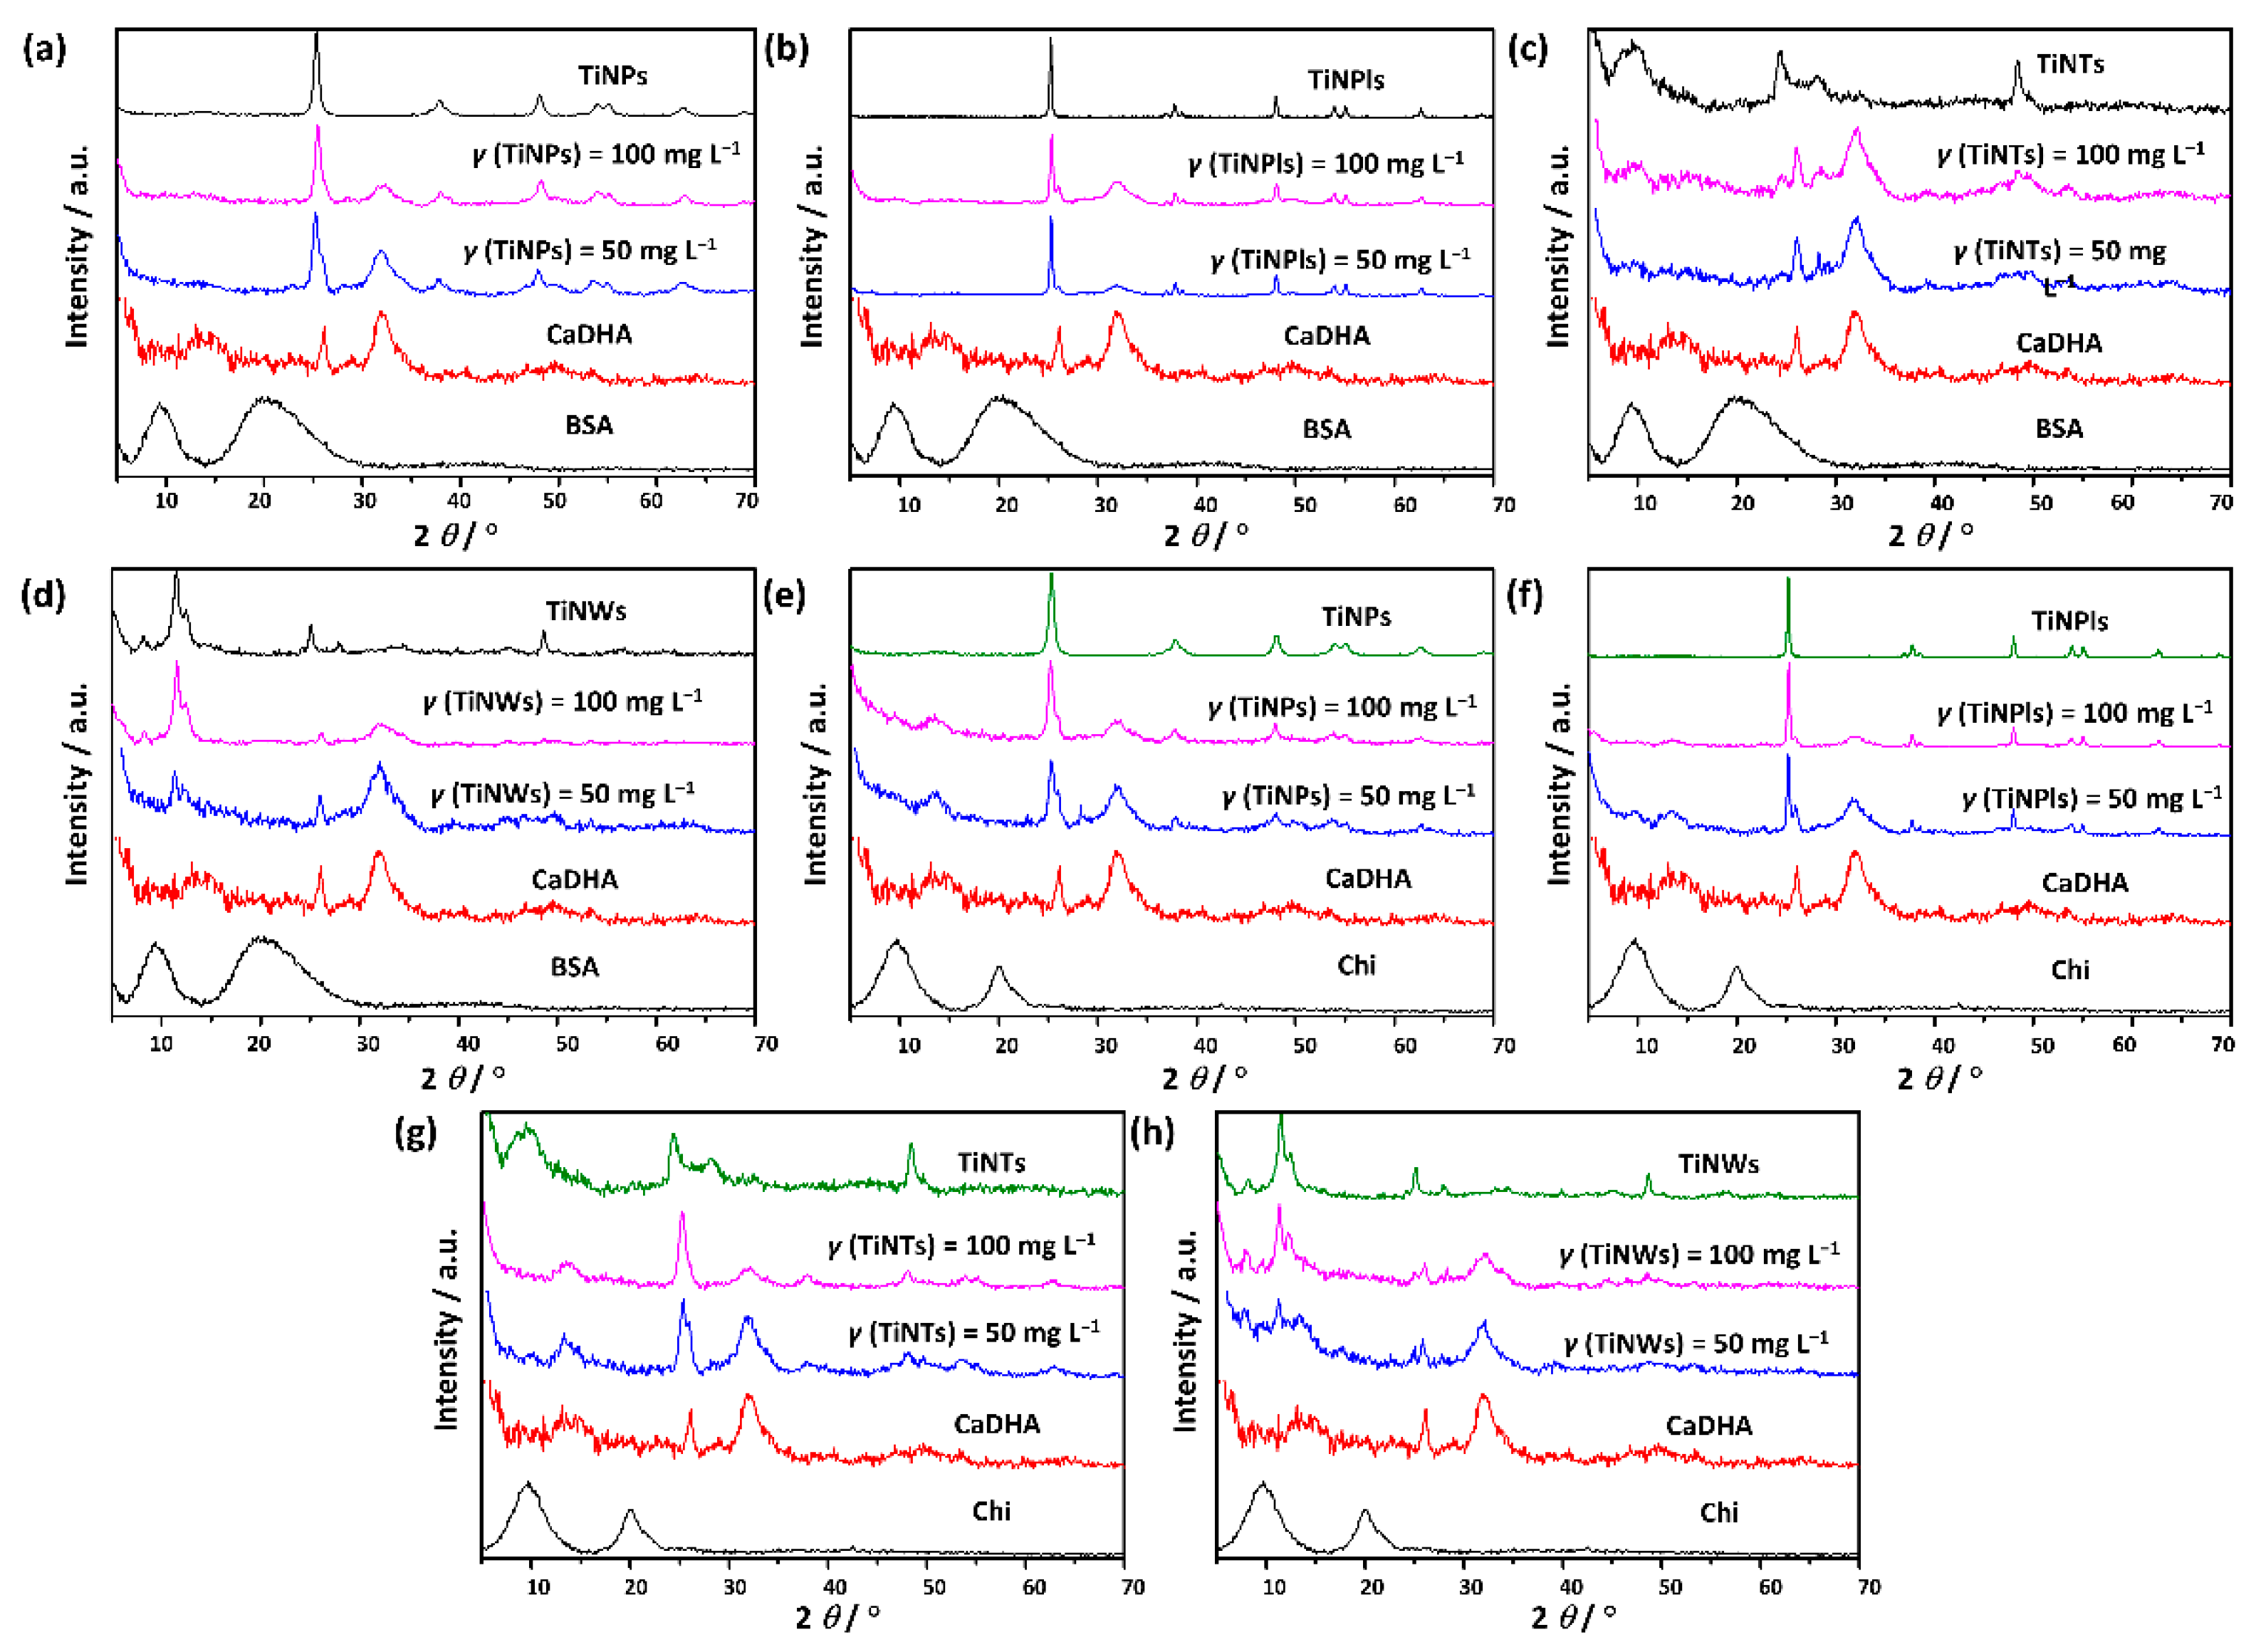
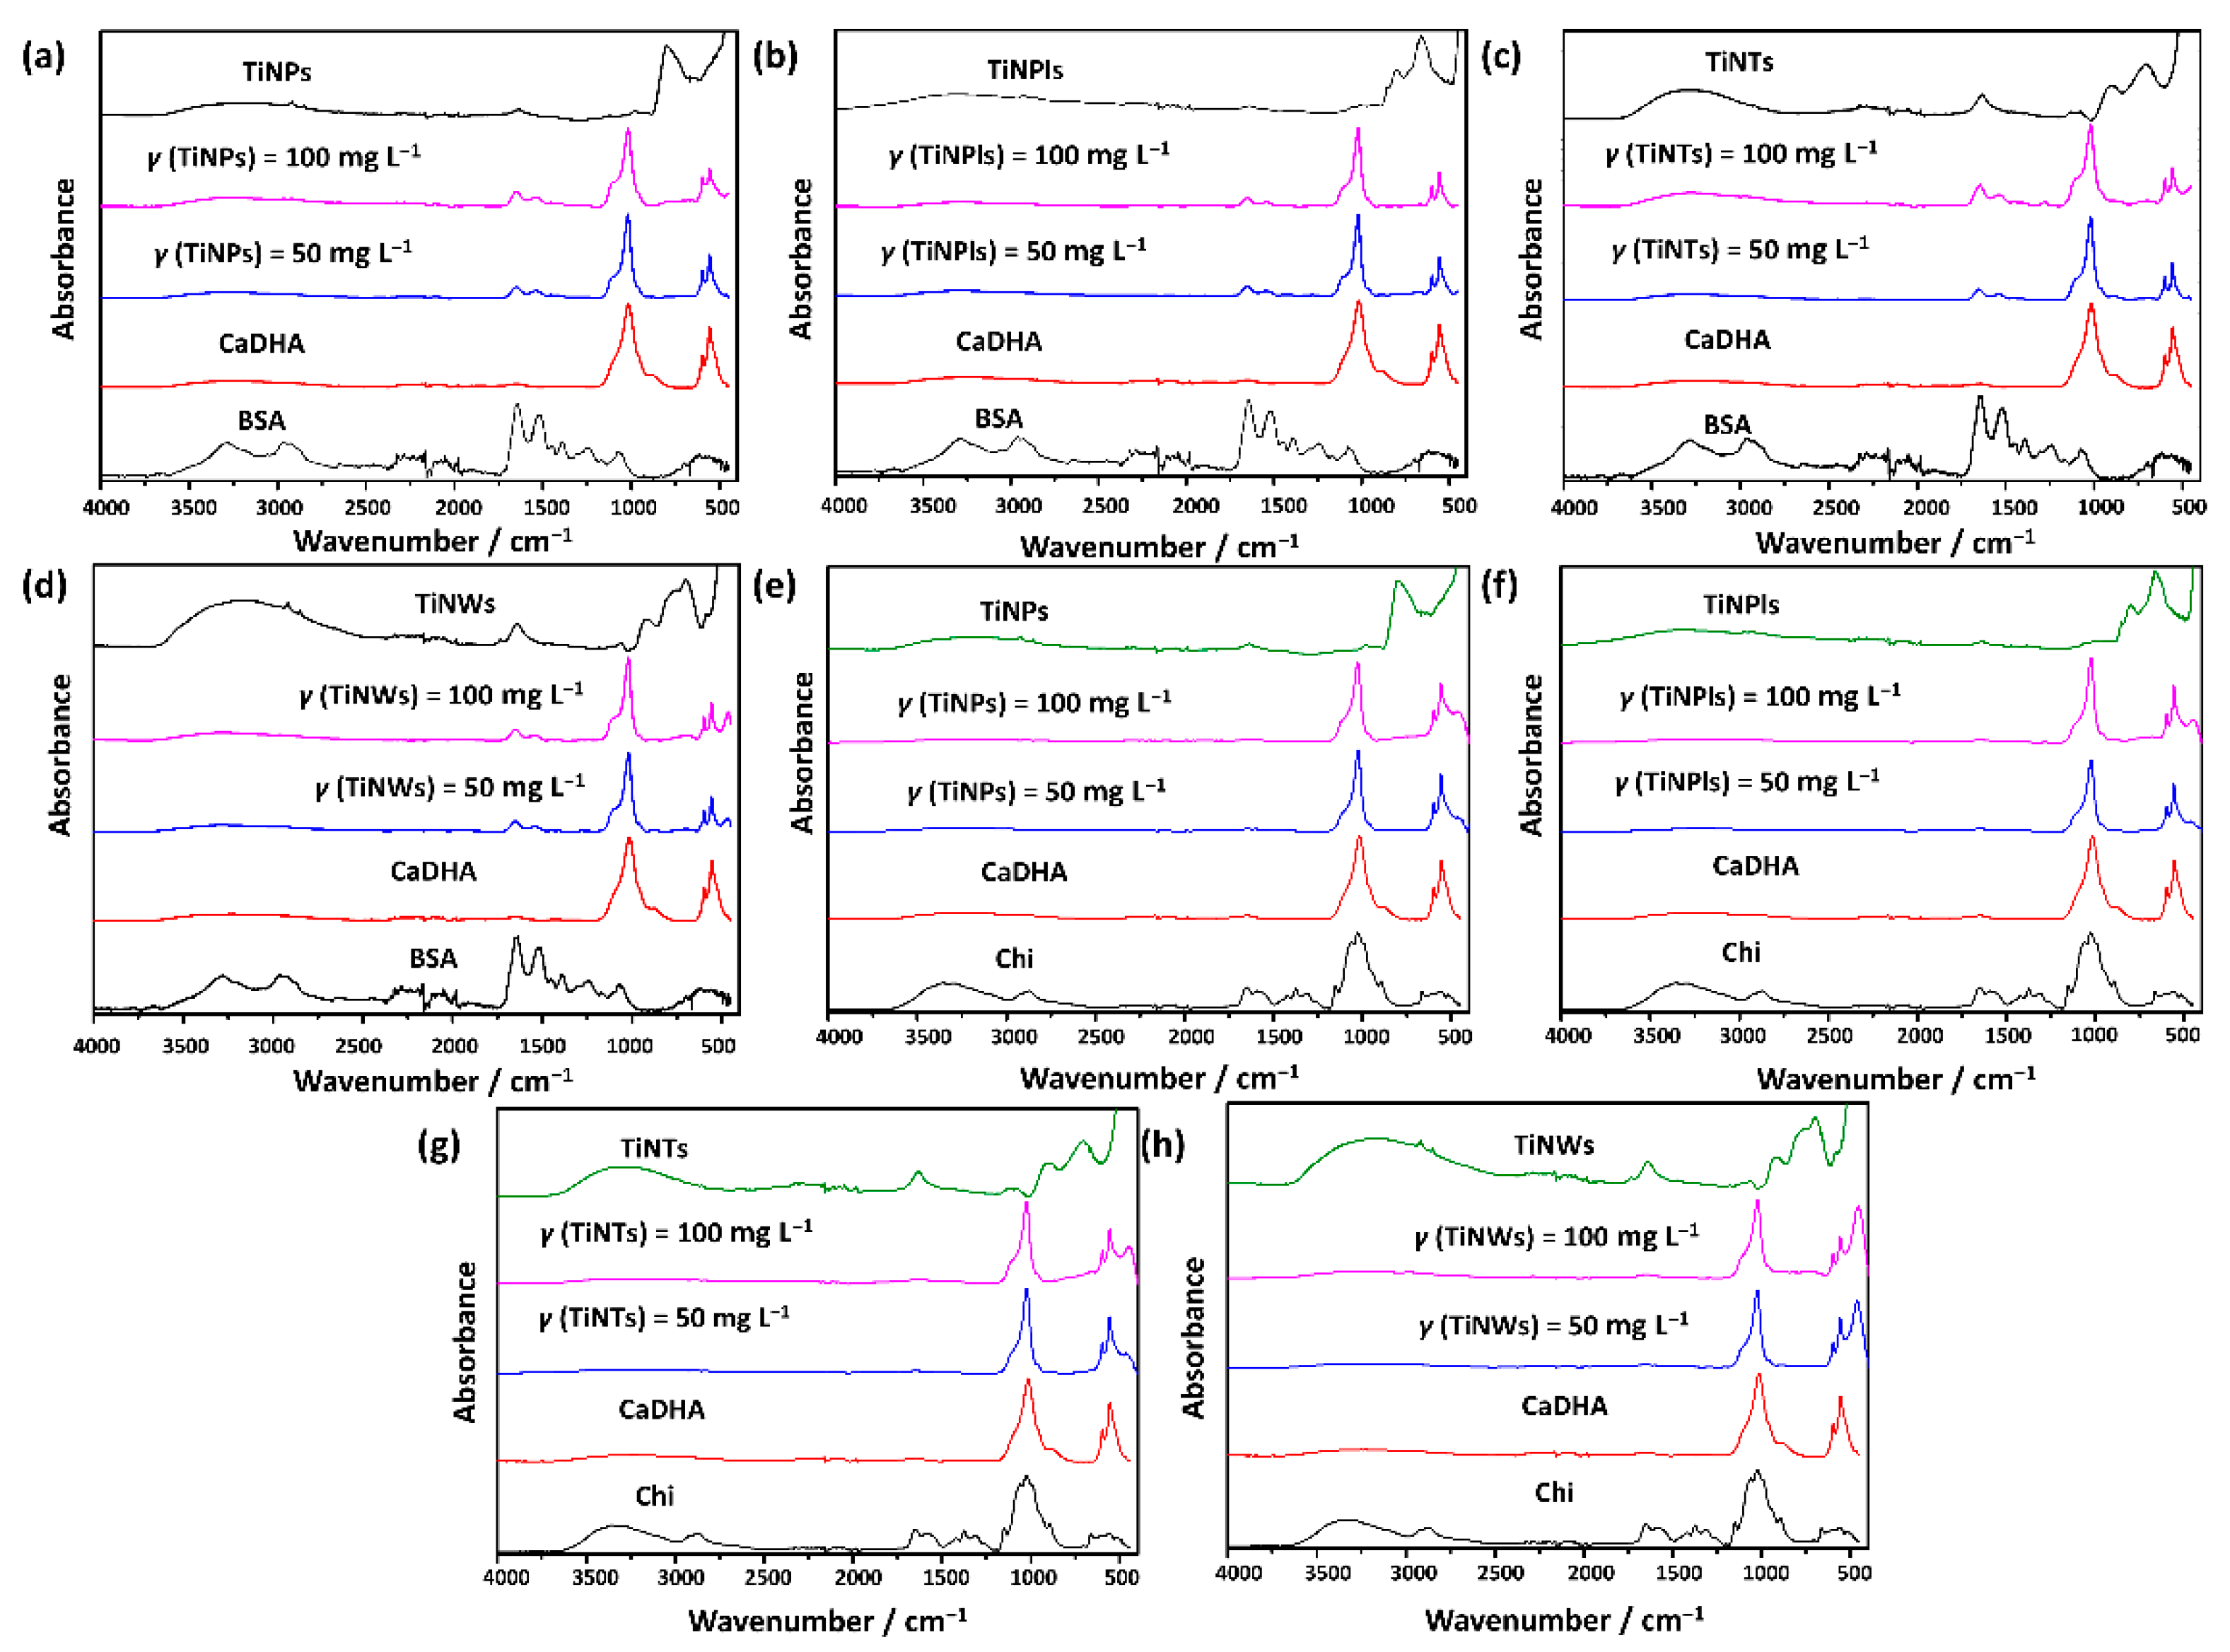
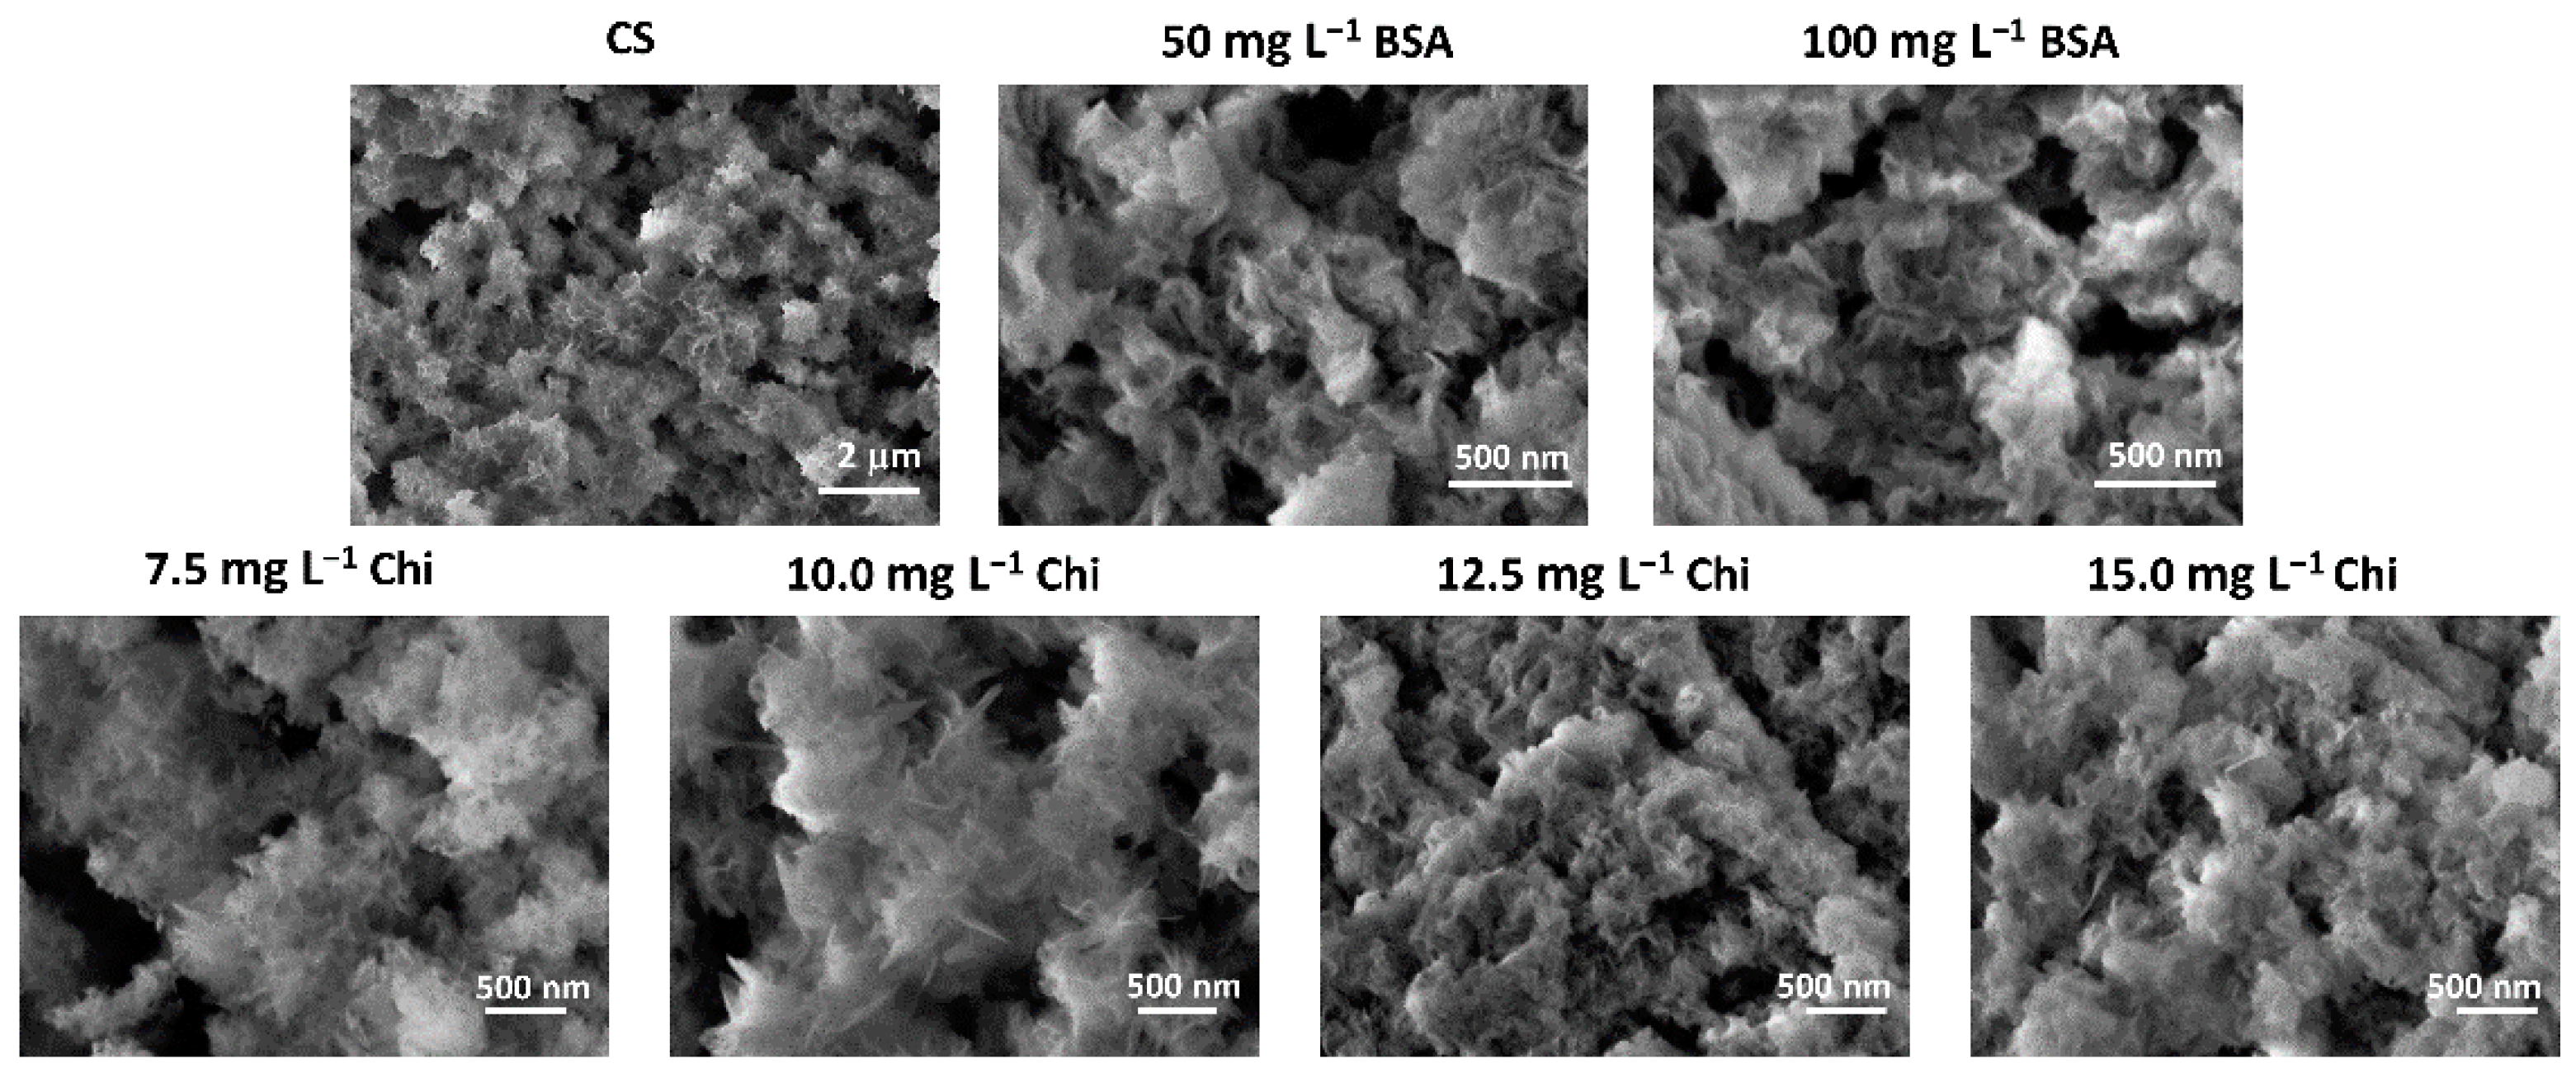
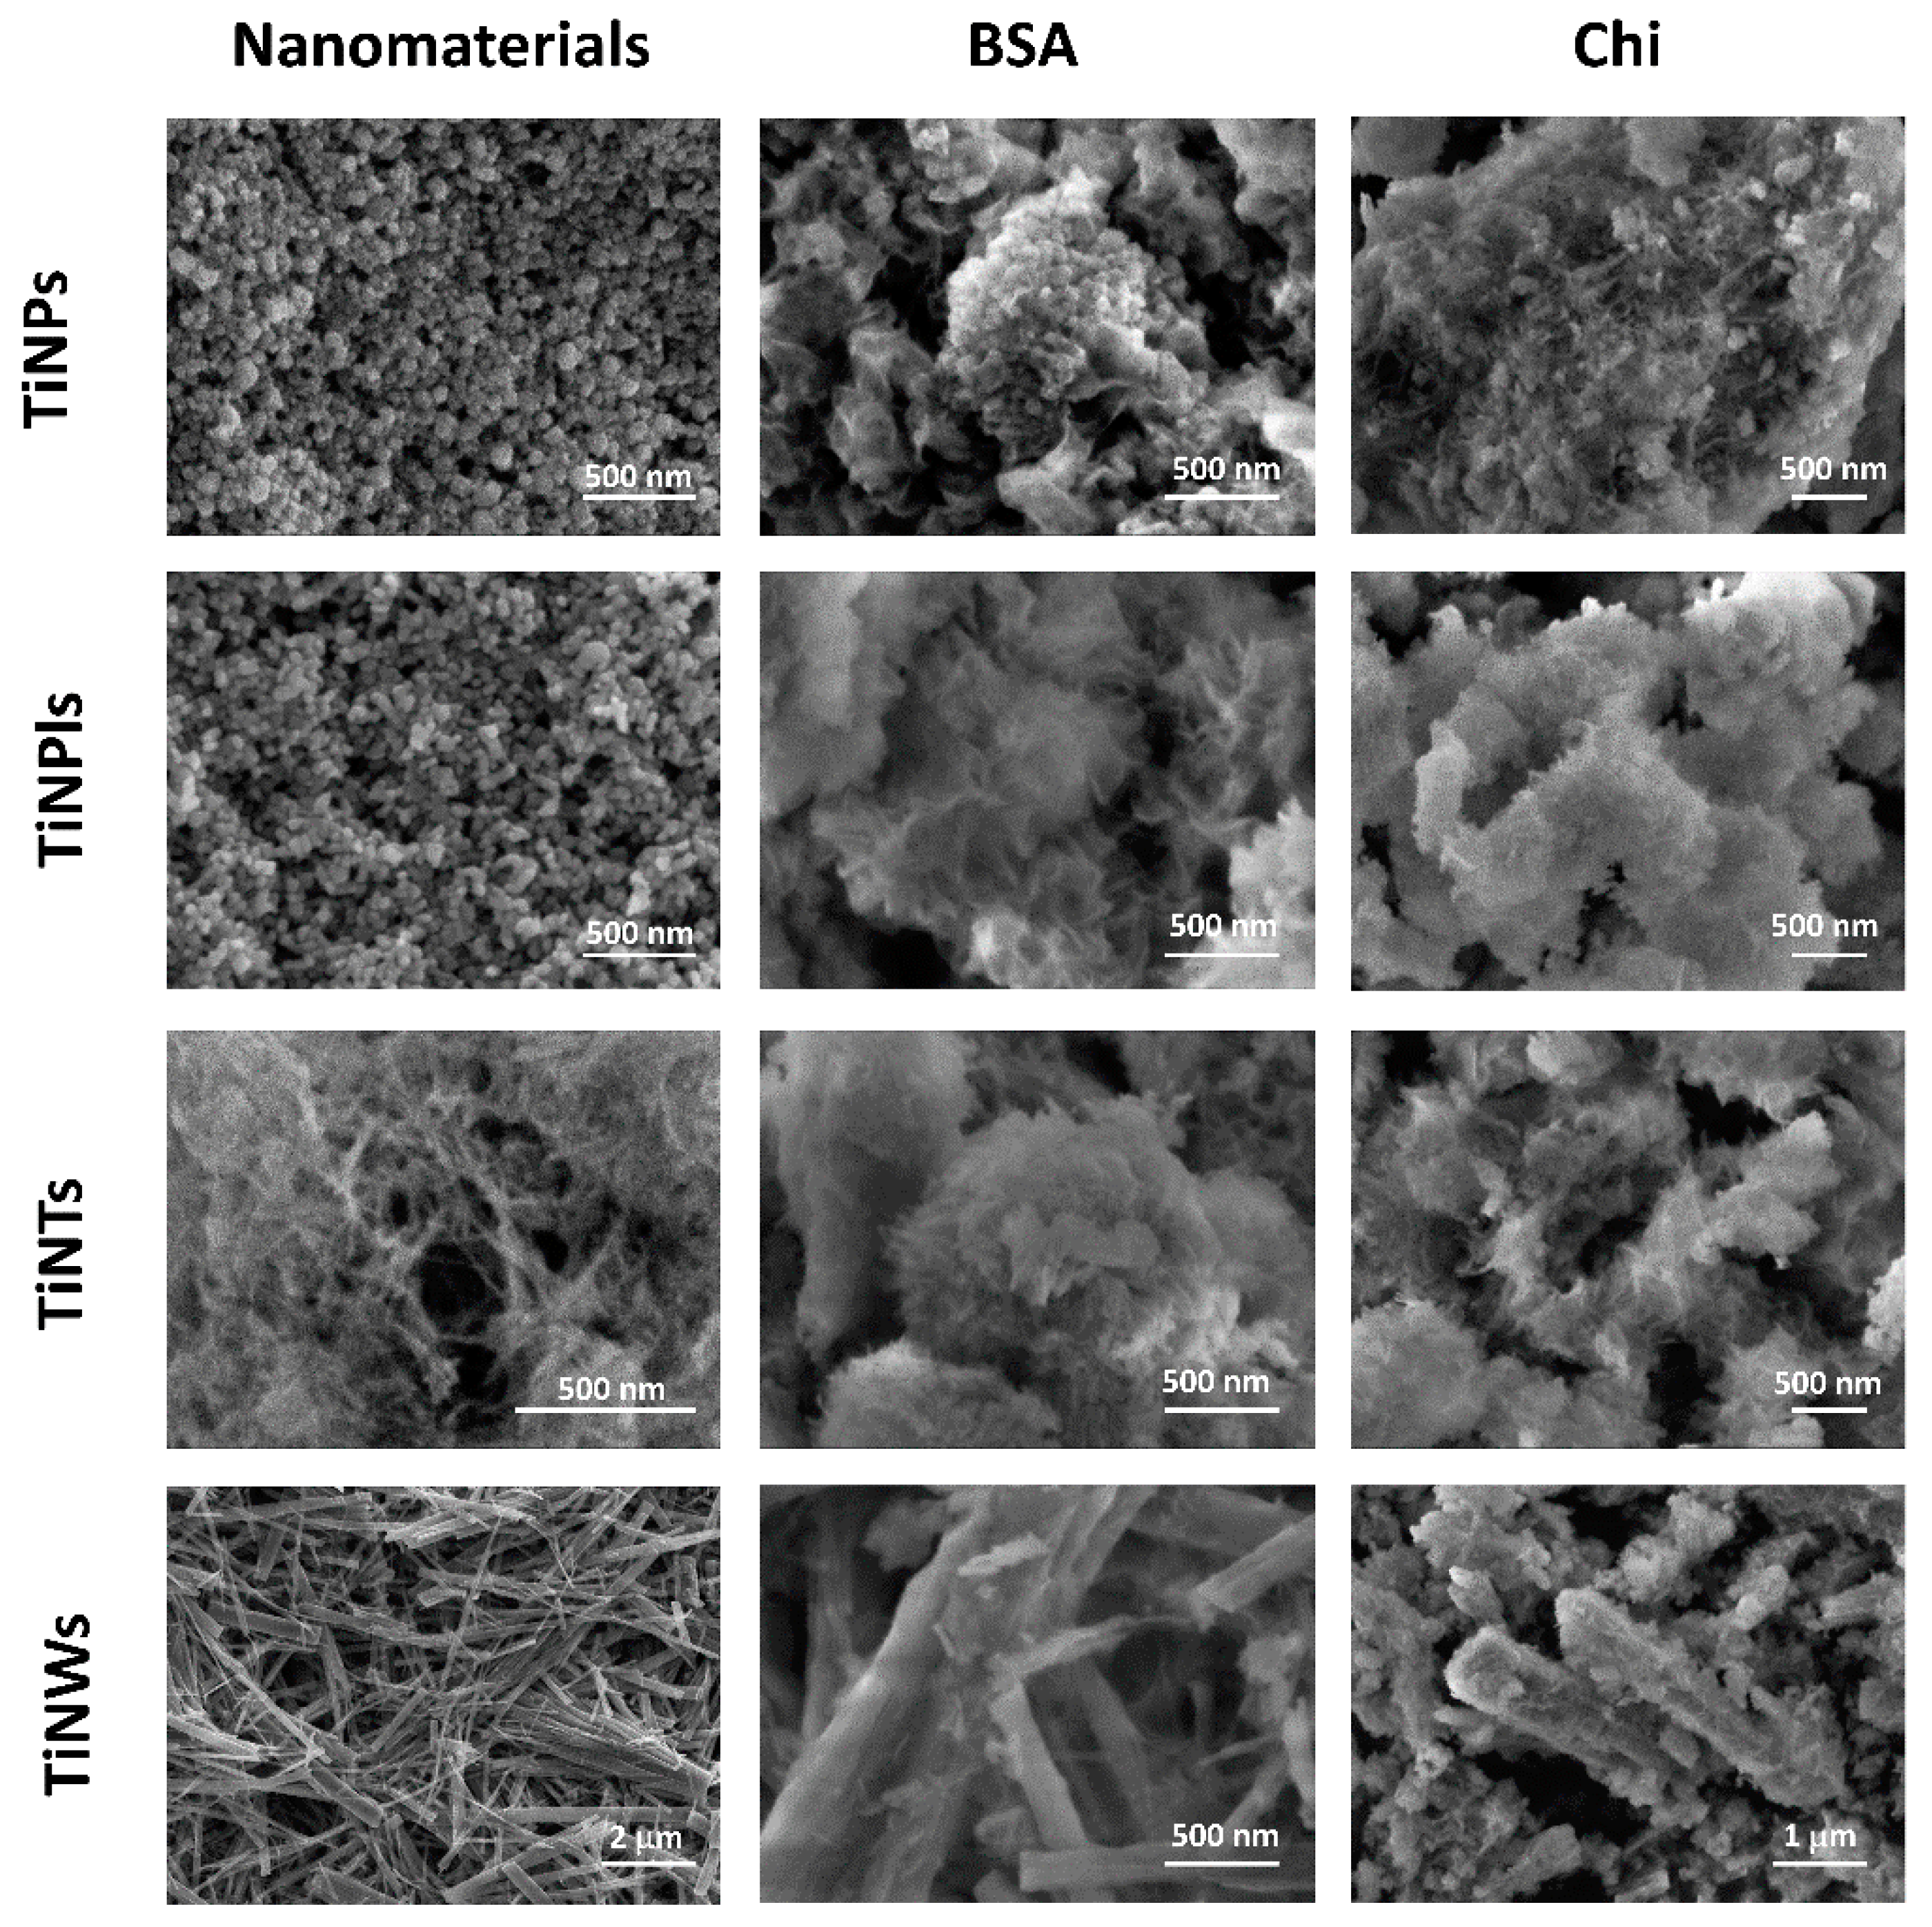
3.2. Influence of Biomacromolecules on the Properties of Crystalline Phase

CaP’s precipitation systems are usually supersaturated with several different phases. In such systems, polymers can cause changes in the composition of the precipitates either by selectively adsorbing onto the nuclei or crystals of one phase or by serving as a template for formation of a phase that would not have formed otherwise [18,50]. To determine the influence of BSA and Chi on the composition and morphology of the crystalline phase, PXRD, FTIR, and SEM analysis of precipitates formed after 60 min of aging time in the systems containing BSA and 120 min aging time in the systems containing Chi were performed. According to the previous studies, the transition from amorphous to crystalline phase ends when the abrupt drop in pH ends [37,46]. Therefore, the chosen aging times correspond to the third stage of the precipitation process.
The PXRD patterns and FTIR spectra of the precipitates formed in the control system and in the systems containing different BSA and chitosan concentrations are shown in Figure 3 and Figure 4, respectively. Previous studies have shown that, in contact with mother liquor, ACP can transform into OCP, CaDHA, DCPD, and/or HAP [37,38,41,42,43,44]. In the PXRD pattern of the precipitate formed in the control system after 60 min of aging time, prominent peaks were observed at 2θ around 26.1° and 32.0°, as well as low-intensity peaks at wider angles, namely at 46.5°, 49.6°, and 53.2° (Figure 3). Comparing the positions of the observed peaks with PDF cards, it was concluded that the observed peaks do not correspond to DCPD (JCPDS Card No.: 09-0077). Although peaks at a similar position can be observed in the PXRD patterns of HAP (JCPDS Card No.: 09-0432) and OCP (JCPDS Card No.: 074-1301), the width and the shape of the observed prominent peaks do not correspond to the HAP or OCP, especially of the peak at 2θ 32.0°. In addition, several characteristic OCP and HAP peaks were not observed. However, such PXRD patterns, appearing as the patterns of poorly crystalline apatites, are characteristic of CaDHA, as observed previously [59,60,61].
Formation of CaDHA was confirmed by the FTIR spectrum that contained bands characteristic of O–H and P–O vibrations. The low-intensity band characteristic of O–H stretching was observed at 3631–2518 cm−1, while the band characteristic of H–O–H deformation was observed at 1636 cm−1 [62]. Characteristic phosphate vibration bands were observed at 1104 cm−1, 1017 cm−1, 868 cm−1, 592 cm−1, and 561 cm−1, corresponding to ν3a triply degenerate asymmetric stretching mode of PO 4 3 (P–O bond), ν3c triply degenerate asymmetric stretching mode of PO 4 3 (P–O bond), HPO 4 2 vibration, ν4 triply degenerate bending mode of PO 4 3 (O–P–O bond), and ν4 triply degenerate bending mode of PO 4 3 (O–P–O bond), respectively [62,63]. The lack of hyperfine structure of phosphate bands confirms that OCP and HAP were not formed [64]. No bands characteristic of carbonate [62] were detected.
Formation of CaDHA at the investigated experimental conditions is in line with the previous investigation, which has shown that CaDHA can form in a rather broad reactant concentration domain [65].
The presence of BSA did not influence the composition of the formed precipitates, but the intensity of the peaks at wider angles around 2θ 47.0°, 49.6°, and 53.6° was slightly increased, as well as the width of the peak at 2θ 32.0° (Figure 3a). No significant changes were observed in the PXRD patterns of the precipitates formed in the presence of Chi (Figure 3b). No changes in the composition of the precipitates induced by BSA or Chi present in solution were previously observed [13,66]. However, when CaP was prepared on porous chitosan membranes by sequential immersion in calcium and phosphate solutions, an effect on morphology, organization, and composition was observed [67].
The FTIR spectra of the precipitates formed in the presence of BSA (Figure 4a) contained, in addition to the bands characteristic of CaDHA, bands characteristic of BSA, namely amide A related to N–H stretching (around 3285 cm−1), amide B (around 2950 cm−1), C = O stretching of amide I (around 1650 cm−1), C–N stretching and N–H bending vibrations of amide II (around 1530 cm−1) and/or CH2 scissoring (around 1450 cm−1) [68,69,70]. Since the precipitates were extensively washed, this indicates incorporation of BSA into CaDHA. Compared to the FTIR spectrum of pure BSA, the shift in wavenumbers of C=O stretching from amide I towards higher wavenumbers and CH2 bending toward lower wave numbers indicated a possible change in BSA conformation. The closer analysis of spectra in the phosphate bands range 1200–400 cm−1 revealed that the shoulder at 1104 cm−1 became somewhat more pronounced (Figure S1a–c). The second-order differentiated spectra revealed no significant change in the position of FTIR bands (Figure S1c), indicating no significant change in the formed CaDHA [40]. None of the chitosan bands could be unambiguously assigned because the most intensive chitosan bands overlapped with phosphate bands (Figure 4b). The bands observed at around 1650 cm−1 can be assigned to both the H2O vibration or C=O stretching of amide I, while the bands at around 1020 cm−1 can be assigned to ν3c triply degenerate asymmetric stretching mode of PO 4 3 (P–O bond) or C = O vibration in Chi [62,71]. In comparison with the spectra of the CaDHA formed in the control system in the phosphate band region, a somewhat more pronounced shoulder at 1104 cm−1 was observed (Figure S1d–f). As in the case of BSA, no significant change in the position of phosphate bands was observed (Figure S1f).
A detailed description of the PXRD patterns and FTIR spectra of TiNMs is provided in our previous work [32,33]. In the PXRD spectra of the precipitates formed in the presence of either BSA or chitosan and TiNMs (Figure 5), the peaks characteristic of CaDHA and the corresponding TiNM were detected. No peaks of other CaP phases were detected. However, the width of the peak at 2θ 32.0° increased in the presence of the additives.
The FTIR spectra of the precipitates formed in the presence of BSA contained bands characteristic of BSA (Figure 6a), indicating its incorporation into the composites. Moreover, the shift in the position of the amide II band towards higher wave numbers indicated possible changes in BSA conformation. In the FTIR spectra of the precipitates formed in the presence of chitosan (Figure 6b), the band at 1598 cm−1 could be assigned unambiguously to the vibration of the protonated amino group in chitosan only in the case of TiNPs at a higher concentration [71], suggesting that Chi was also incorporated into the CaDHA. The second-order differentiated spectra revealed no significant change in phosphate bands position in the spectra of any precipitate (Figures S2–S5).
In contrast to our observation, a previous study of CaP coatings prepared on a Ti alloy showed that the composition of the coating gradually changed from OCP to a mixture of OCP and carbonate apatite with increasing BSA concentration. However, the BSA concentrations were much higher than in this study [72].
The data on Chi influence on precipitate composition are contradictory. In the study by Aimoli et al. [73], it was shown that chitosan can influence the ratio of the phases in calcium phosphate mixtures formed in both acidic (pH 4.8) and alkaline (pH 8.4) solutions. On the other hand, Fadeeva et al. [66] did not observe changes in the precipitate composition as DCPD formed at pH 3.0 and ACP at pH 9.0 both in the absence and presence of Chi. This would indicate that the effect of Chi on CaP composition is highly dependent on the experimental conditions.
Both BSA and chitosan influenced the morphology of the obtained CaDHA. In the control system, spherical aggregates of leaf-like crystals characteristic of CaDHA [65] were obtained (Figure 7). In the presence of BSA, denser aggregates of irregular, non-developed leaf-like crystals were obtained. With increasing concentration of chitosan, a gradual change in morphology was observed as crystals became less developed (Figure 7). These results are in accordance with the previous studies showing that BSA can affect the morphology of CaP coatings [72], while, in the presence of chitosan, a decrease in the sizes of HAP [73] and DCPD [66] crystals was observed.
The morphological changes in CaDHA caused by the presence of BSA and chitosan in the systems containing TiNMs were strongly dependent on the type of TiNMs (Figure 8). In the case of TiNPs, smaller, more densely packed crystals were obtained in the presence of BSA (Figure 8) compared to the system without BSA [32], while larger crystals were formed in the presence of chitosan (Figure 8). However, in the presence of TiNPls and TINTs, denser crystals and better covering TiNMs were obtained in the presence of both BSA and chitosan (Figure 8) than in their absence [32,33]. Contrarily, in the case of TiNWs, the presence of both biomacromolecules resulted in less coverage of TiNWs compared to the system without BSA and chitosan (Figure 8) [33].
To verify that these effects were due to adsorption of BSA and chitosan on TiNMs, considering that both biopolymers and TiNMs were added to the anionic reactant solution, the zeta potential of biopolymers and TiNMs was determined in the presence of biopolymers immediately upon adding BSA or chitosan (Table 3). BSA particles in an anionic reactant solution have a negative zeta potential (−15.9 mV), while Chi is almost neutral (0.04 mV). In the presence of BSA, the zeta potential of TiNMs became less negative compared to suspensions in an anionic reactant solution without BSA [33,34]. The zeta potential of TiNMs even became slightly positive in the presence of Chi (Table 3).
After adsorption of BSA and Chi, a certain degree of conformational changes in their molecules can be expected depending on the surface arrangement of Ti–OH groups. On the one hand, these conformational changes can lead to formation of sites at which CaP can nucleate and, consequently, to better surface coverage, as we observed for TiNPls and TiNTs and as was previously observed for BSA adsorbed on HAP crystals [74]. On the other hand, they can prevent formation of CaP if the arrangement of functional groups in the adsorbed biomacromolecules and ions does not match the structure of the forming CaP phase, as we observed for TiNWs.

4. Conclusions

The influence of BSA and Chi on formation and properties of the crystalline phase in the presence of TiNMs with different morphologies was investigated. It was found that both BSA and Chi, at the investigated concentrations, inhibit ACP transformation into the crystalline phase. Chi was a more efficient inhibitor due to its more flexible structure. The inhibition effect was observed even in the presence of TiNMs in the concentrations in which they promote transformation. The only exception were TiNTs, which promoted transformation in the presence of BSA but not Chi. Although neither biomacromolecule influenced the composition of the crystalline phase, since CaDHA was formed in all the systems, they did affect the morphology. It was also shown that adsorption of biomacromolecules can lead to either higher (TiNPls and TiNTs) or lower (TiNWs) surface coverage of TiNMs with CaDHA crystals depending on the structure and morphology of the TiNMs.
The obtained results confirm that ternary biomacromolecule/CaP/NMs composites can be prepared by co-precipitation and reveal possibilities for fine-tuning the composites’ properties.

Supplementary Materials

The following supporting information can be downloaded at: https://www.mdpi.com/article/10.3390/min12121557/s1, Figure S1: FTIR spectra and corresponding first- and second-order derivatives of bovine serum albumin (BSA), chitosan (Chi), calcium-deficient hydroxyapatite (CaDHA), and CaDHA formed in the presence of BSA or Chi. Figure S2: FTIR spectra and corresponding first- and second-order derivatives of calcium-deficient hydroxyapatite (CaDHA) formed in the control system and in the presence of bovine serum albumin or chitosan and TiO2 nanoparticles. Figure S3: FTIR spectra and corresponding first- and second-order derivatives of calcium-deficient hydroxyapatite (CaDHA) formed in the control system and in the presence of bovine serum albumin or chitosan and TiO2 nanoplates. Figure S4: FTIR spectra and corresponding first- and second-order derivatives of calcium-deficient hydroxyapatite (CaDHA) formed in the control system and in the presence of bovine serum albumin or chitosan and titanate nanotubes. Figure S5: FTIR spectra and corresponding first- and second-order derivatives of calcium-deficient hydroxyapatite (CaDHA) formed in the control system and in the presence of bovine serum albumin or chitosan and TiO2(B)/titanate nanowires.

Author Contributions

Conceptualization, M.D.S.; methodology, I.E. and M.D.S.; formal analysis, I.E. and M.D.S.; investigation, I.E.; writing—original draft preparation, M.D.S.; writing—review and editing, M.D.S.; visualization, I.E.; funding acquisition, M.D.S. All authors have read and agreed to the published version of the manuscript.

Funding

This research was funded by Croatian Science Foundation, Grant HRZZ- IP-2018-01-1493.

Data Availability Statement

The data presented in this study are available in the article.

Conflicts of Interest

The authors declare no conflict of interest.

References

  1. Dorozhkin, S.V. Calcium Orthophosphates: Applications in Nature, Biology, and Medicine; Pan Stanford: Singapore, 2012; ISBN 978-981-4316-62-0. [Google Scholar]
  2. Biomaterials Science: An Introduction to Materials in Medicine, 2nd ed.; Ratner, B.D. (Ed.) Elsevier Academic Press: Amsterdam, The Netherlands; Boston, MA, USA, 2004; ISBN 978-0-12-582463-7. [Google Scholar]
  3. Dorozhkin, S.V. Functionalized Calcium Orthophosphates (CaPO4) and Their Biomedical Applications. J. Mater. Chem. B 2019, 7, 7471–7489. [Google Scholar] [CrossRef]
  4. Bigi, A.; Boanini, E. Functionalized Biomimetic Calcium Phosphates for Bone Tissue Repair. J. Appl. Biomater. Funct. Mater. 2017, 15, e313–e325. [Google Scholar] [CrossRef]
  5. Weiner, S.; Wagner, H.D. THE MATERIAL BONE: Structure-Mechanical Function Relations. Annu. Rev. Mater. Sci. 1998, 28, 271–298. [Google Scholar] [CrossRef]
  6. Kumar, M.N.V.R.; Muzzarelli, R.A.A.; Muzzarelli, C.; Sashiwa, H.; Domb, A.J. Chitosan Chemistry and Pharmaceutical Perspectives. Chem. Rev. 2004, 104, 6017–6084. [Google Scholar] [CrossRef]
  7. Croisier, F.; Jérôme, C. Chitosan-Based Biomaterials for Tissue Engineering. Eur. Polym. J. 2013, 49, 780–792. [Google Scholar] [CrossRef] [Green Version]
  8. Nardecchia, S.; Gutiérrez, M.C.; Serrano, M.C.; Dentini, M.; Barbetta, A.; Ferrer, M.L.; del Monte, F. In Situ Precipitation of Amorphous Calcium Phosphate and Ciprofloxacin Crystals during the Formation of Chitosan Hydrogels and Its Application for Drug Delivery Purposes. Langmuir 2012, 28, 15937–15946. [Google Scholar] [CrossRef]
  9. Ignjatović, N.; Wu, V.; Ajduković, Z.; Mihajilov-Krstev, T.; Uskoković, V.; Uskoković, D. Chitosan-PLGA Polymer Blends as Coatings for Hydroxyapatite Nanoparticles and Their Effect on Antimicrobial Properties, Osteoconductivity and Regeneration of Osseous Tissues. Mater. Sci. Eng. C 2016, 60, 357–364. [Google Scholar] [CrossRef] [Green Version]
  10. Sukpaita, T.; Chirachanchai, S.; Pimkhaokham, A.; Ampornaramveth, R.S. Chitosan-Based Scaffold for Mineralized Tissues Regeneration. Mar. Drugs 2021, 19, 551. [Google Scholar] [CrossRef]
  11. Farrugia, A. Albumin Usage in Clinical Medicine: Tradition or Therapeutic? Transfus. Med. Rev. 2010, 24, 53–63. [Google Scholar] [CrossRef]
  12. Tang, L.; Eaton, J.W. Natural Responses to Unnatural Materials: A Molecular Mechanism for Foreign Body Reactions. Mol. Med. 1999, 5, 351–358. [Google Scholar] [CrossRef]
  13. Kato, K.; Lee, S.; Nagata, F. Preparation of Protein–Peptide–Calcium Phosphate Composites for Controlled Protein Release. Molecules 2020, 25, 2312. [Google Scholar] [CrossRef]
  14. Ozhukil Kollath, V.; Mullens, S.; Luyten, J.; Traina, K.; Cloots, R. Protein–Calcium Phosphate Nanocomposites: Benchmarking Protein Loading via Physical and Chemical Modifications against Co-Precipitation. RSC Adv. 2015, 5, 55625–55632. [Google Scholar] [CrossRef] [Green Version]
  15. Tomoda, K.; Ariizumi, H.; Nakaji, T.; Makino, K. Hydroxyapatite Particles as Drug Carriers for Proteins. Colloids Surf. B Biointerfaces 2010, 76, 226–235. [Google Scholar] [CrossRef]
  16. Xu, Z.; Grassian, V.H. Bovine Serum Albumin Adsorption on TiO2 Nanoparticle Surfaces: Effects of PH and Coadsorption of Phosphate on Protein–Surface Interactions and Protein Structure. J. Phys. Chem. C 2017, 121, 21763–21771. [Google Scholar] [CrossRef]
  17. Bleek, K.; Taubert, A. New Developments in Polymer-Controlled, Bioinspired Calcium Phosphate Mineralization from Aqueous Solution. Acta Biomater. 2013, 9, 6283–6321. [Google Scholar] [CrossRef]
  18. Sikirić, M.D.; Füredi-Milhofer, H. The Influence of Surface Active Molecules on the Crystallization of Biominerals in Solution. Adv. Colloid Interface Sci. 2006, 128–130, 135–158. [Google Scholar] [CrossRef]
  19. Kargupta, R.; Bok, S.; Darr, C.M.; Crist, B.D.; Gangopadhyay, K.; Gangopadhyay, S.; Sengupta, S. Coatings and Surface Modifications Imparting Antimicrobial Activity to Orthopedic Implants. Wiley Interdiscip. Rev. Nanomed. Nanobiotechnol. 2014, 6, 475–495. [Google Scholar] [CrossRef]
  20. Ben-Nissan, B.; Macha, I.; Cazalbou, S.; Choi, A.H. Calcium Phosphate Nanocoatings and Nanocomposites, Part 2: Thin Films for Slow Drug Delivery and Osteomyelitis. Nanomedicine 2016, 11, 531–544. [Google Scholar] [CrossRef] [Green Version]
  21. Brennan, S.A.; Ní Fhoghlú, C.; Devitt, B.M.; O’Mahony, F.J.; Brabazon, D.; Walsh, A. Silver Nanoparticles and Their Orthopaedic Applications. Bone Jt. J. 2015, 97-B, 582–589. [Google Scholar] [CrossRef] [Green Version]
  22. Cojocaru, F.D.; Balan, V.; Popa, M.I.; Lobiuc, A.; Antoniac, A.; Antoniac, I.V.; Verestiuc, L. Biopolymers—Calcium Phosphates Composites with Inclusions of Magnetic Nanoparticles for Bone Tissue Engineering. Int. J. Biol. Macromol. 2019, 125, 612–620. [Google Scholar] [CrossRef]
  23. Keskar, M.; Sabatini, C.; Cheng, C.; Swihart, M.T. Synthesis and Characterization of Silver Nanoparticle-Loaded Amorphous Calcium Phosphate Microspheres for Dental Applications. Nanoscale Adv. 2019, 1, 627–635. [Google Scholar] [CrossRef] [Green Version]
  24. Salarian, M.; Xu, W.Z.; Wang, Z.; Sham, T.-K.; Charpentier, P.A. Hydroxyapatite–TiO2 -Based Nanocomposites Synthesized in Supercritical CO2 for Bone Tissue Engineering: Physical and Mechanical Properties. ACS Appl. Mater. Interfaces 2014, 6, 16918–16931. [Google Scholar] [CrossRef]
  25. Oktar, F.N. Hydroxyapatite–TiO2 Composites. Mater. Lett. 2006, 60, 2207–2210. [Google Scholar] [CrossRef]
  26. Joseph Nathanael, A.; Mangalaraj, D.; Chen, P.C.; Ponpandian, N. Mechanical and Photocatalytic Properties of Hydroxyapatite/Titania Nanocomposites Prepared by Combined High Gravity and Hydrothermal Process. Compos. Sci. Technol. 2010, 70, 419–426. [Google Scholar] [CrossRef]
  27. Que, W.; Khor, K.A.; Xu, J.L.; Yu, L.G. Hydroxyapatite/Titania Nanocomposites Derived by Combining High-Energy Ball Milling with Spark Plasma Sintering Processes. J. Eur. Ceram. Soc. 2008, 28, 3083–3090. [Google Scholar] [CrossRef]
  28. Giannakopoulou, T.; Todorova, N.; Romanos, G.; Vaimakis, T.; Dillert, R.; Bahnemann, D.; Trapalis, C. Composite Hydroxyapatite/TiO2 Materials for Photocatalytic Oxidation of NOx. Mater. Sci. Eng. B 2012, 177, 1046–1052. [Google Scholar] [CrossRef]
  29. Milella, E. Preparation and Characterisation of Titania/Hydroxyapatite Composite Coatings Obtained by Sol–Gel Process. Biomaterials 2001, 22, 1425–1431. [Google Scholar] [CrossRef]
  30. Duan, K.; Wang, R. Surface Modifications of Bone Implants through Wet Chemistry. J. Mater. Chem. 2006, 16, 2309. [Google Scholar] [CrossRef]
  31. Ruso, J.M.; Verdinelli, V.; Hassan, N.; Pieroni, O.; Messina, P.V. Enhancing CaP Biomimetic Growth on TiO2 Cuboids Nanoparticles via Highly Reactive Facets. Langmuir 2013, 29, 2350–2358. [Google Scholar] [CrossRef]
  32. Erceg, I.; Selmani, A.; Gajović, A.; Panžić, I.; Iveković, D.; Faraguna, F.; Šegota, S.; Ćurlin, M.; Strasser, V.; Kontrec, J.; et al. Calcium Phosphate Formation on TiO2 Nanomaterials of Different Dimensionality. Colloids Surf. A Physicochem. Eng. Asp. 2020, 593, 124615. [Google Scholar] [CrossRef]
  33. Erceg, I.; Selmani, A.; Gajović, A.; Radatović, B.; Šegota, S.; Ćurlin, M.; Strasser, V.; Kontrec, J.; Kralj, D.; Maltar-Strmečki, N.; et al. Precipitation at Room Temperature as a Fast and Versatile Method for Calcium Phosphate/TiO2 Nanocomposites Synthesis. Nanomaterials 2021, 11, 1523. [Google Scholar] [CrossRef]
  34. Han, X.; Kuang, Q.; Jin, M.; Xie, Z.; Zheng, L. Synthesis of Titania Nanosheets with a High Percentage of Exposed (001) Facets and Related Photocatalytic Properties. J. Am. Chem. Soc. 2009, 131, 3152–3153. [Google Scholar] [CrossRef]
  35. Sofianou, M.-V.; Trapalis, C.; Psycharis, V.; Boukos, N.; Vaimakis, T.; Yu, J.; Wang, W. Study of TiO2 Anatase Nano and Microstructures with Dominant {001} Facets for NO Oxidation. Environ. Sci. Pollut. Res. 2012, 19, 3719–3726. [Google Scholar] [CrossRef]
  36. Selmani, A.; Špadina, M.; Plodinec, M.; Delač Marion, I.; Willinger, M.G.; Lützenkirchen, J.; Gafney, H.D.; Redel, E. An Experimental and Theoretical Approach to Understanding the Surface Properties of One-Dimensional TiO2 Nanomaterials. J. Phys. Chem. C 2015, 119, 19729–19742. [Google Scholar] [CrossRef]
  37. Bar-Yosef Ofir, P.; Govrin-Lippman, R.; Garti, N.; Füredi-Milhofer, H. The Influence of Polyelectrolytes on the Formation and Phase Transformation of Amorphous Calcium Phosphate. Cryst. Growth Des. 2004, 4, 177–183. [Google Scholar] [CrossRef]
  38. Selmani, A.; Coha, I.; Magdić, K.; Čolović, B.; Jokanović, V.; Šegota, S.; Gajović, S.; Gajović, A.; Jurašin, D.; Dutour Sikirić, M. Multiscale Study of the Influence of Cationic Surfactants on Amorphous Calcium Phosphate Precipitation. CrystEngComm 2015, 17, 8529–8548. [Google Scholar] [CrossRef] [Green Version]
  39. Chen, Y.; Gu, W.; Pan, H.; Jiang, S.; Tang, R. Stabilizing Amorphous Calcium Phosphate Phase by Citrate Adsorption. CrystEngComm 2014, 16, 1864–1867. [Google Scholar] [CrossRef]
  40. Uskoković, V. Visualizing Different Crystalline States during the Infrared Imaging of Calcium Phosphates. Vib. Spectrosc. 2020, 108, 103045. [Google Scholar] [CrossRef]
  41. Eans, E.D.; Gillessen, I.H.; Posne, A.S. Intermediate States in the Precipitation of Hydroxyapatite. Nature 1965, 208, 365–367. [Google Scholar] [CrossRef]
  42. Brečević, L.; Füredi-Milhofer, H. Precipitation of Calcium Phosphates from Electrolyte Solutions: II. The Formation and Transformation of the Precipitates. Calcif. Tissue Res. 1972, 10, 82–90. [Google Scholar] [CrossRef]
  43. Christoffersen, J.; Christoffersen, M.R.; Kibalczyc, W.; Andersen, F.A. A Contribution to the Understanding of the Formation of Calcium Phosphates. J. Cryst. Growth 1989, 94, 767–777. [Google Scholar] [CrossRef]
  44. Pan, H.; Liu, X.Y.; Tang, R.; Xu, H.Y. Mystery of the Transformation from Amorphous Calcium Phosphate to Hydroxyapatite. Chem. Commun. 2010, 46, 7415. [Google Scholar] [CrossRef]
  45. Jiang, S.; Jin, W.; Wang, Y.-N.; Pan, H.; Sun, Z.; Tang, R. Effect of the Aggregation State of Amorphous Calcium Phosphate on Hydroxyapatite Nucleation Kinetics. RSC Adv. 2017, 7, 25497–25503. [Google Scholar] [CrossRef] [Green Version]
  46. Li, S.; Wang, L. Phosphorylated Osteopontin Peptides Inhibit Crystallization by Resisting the Aggregation of Calcium Phosphate Nanoparticles. CrystEngComm 2012, 14, 8037. [Google Scholar] [CrossRef]
  47. Yang, X.; Xie, B.; Wang, L.; Qin, Y.; Henneman, Z.J.; Nancollas, G.H. Influence of Magnesium Ions and Amino Acids on the Nucleation and Growth of Hydroxyapatite. CrystEngComm 2011, 13, 1153–1158. [Google Scholar] [CrossRef]
  48. Ding, H.; Pan, H.; Xu, X.; Tang, R. Toward a Detailed Understanding of Magnesium Ions on Hydroxyapatite Crystallization Inhibition. Cryst. Growth Des. 2014, 14, 763–769. [Google Scholar] [CrossRef]
  49. Du, L.-W.; Bian, S.; Gou, B.-D.; Jiang, Y.; Huang, J.; Gao, Y.-X.; Zhao, Y.-D.; Wen, W.; Zhang, T.-L.; Wang, K. Structure of Clusters and Formation of Amorphous Calcium Phosphate and Hydroxyapatite: From the Perspective of Coordination Chemistry. Cryst. Growth Des. 2013, 13, 3103–3109. [Google Scholar] [CrossRef]
  50. Füredi-Milhofer, H.; Sarig, S. Interactions between Polyelectrolytes and Sparingly Soluble Salts. Prog. Cryst. Growth Charact. Mater. 1996, 32, 45–74. [Google Scholar] [CrossRef]
  51. Bujacz, A. Structures of Bovine, Equine and Leporine Serum Albumin. Acta Cryst. D Biol Cryst. 2012, 68, 1278–1289. [Google Scholar] [CrossRef]
  52. Younes, I.; Rinaudo, M. Chitin and Chitosan Preparation from Marine Sources. Structure, Properties and Applications. Mar. Drugs 2015, 13, 1133–1174. [Google Scholar] [CrossRef]
  53. Islam, S.; Bhuiyan, M.A.R.; Islam, M.N. Chitin and Chitosan: Structure, Properties and Applications in Biomedical Engineering. J. Polym. Environ. 2017, 25, 854–866. [Google Scholar] [CrossRef]
  54. Damen, J.J.M.; Ten Cate, J.M.; Ellingsen, J.E. Induction of Calcium Phosphate Precipitation by Titanium Dioxide. J. Dent. Res. 1991, 70, 1346–1349. [Google Scholar] [CrossRef]
  55. Serro, A.P.; Fernandes, A.C.; Saramago, B.; Lima, J.; Barbosa, M.A. Apatite Deposition on Titanium Surfaces—The Role of Albumin Adsorption. Biomaterials 1997, 18, 963–968. [Google Scholar] [CrossRef]
  56. Serro, A.P.; Bastos, M.; Pessoa, J.C.; Saramago, B. Bovine Serum Albumin Conformational Changes upon Adsorption on Titania and on Hydroxyapatite and Their Relation with Biomineralization. J. Biomed. Mater. Res. 2004, 70A, 420–427. [Google Scholar] [CrossRef]
  57. Stenport, V.; Kjellin, P.; Andersson, M.; Currie, F.; Sul, Y.-T.; Wennerberg, A.; Arvidsson, A. Precipitation of Calcium Phosphate in the Presence of Albumin on Titanium Implants with Four Different Possibly Bioactive Surface Preparations. An in Vitro Study. J. Mater. Sci. Mater. Med. 2008, 19, 3497–3505. [Google Scholar] [CrossRef]
  58. Lima, J.; Sousa, S.R.; Ferreira, A.; Barbosa, M.A. Interactions between Calcium, Phosphate, and Albumin on the Surface of Titanium. J. Biomed. Mater. Res. 2001, 55, 45–53. [Google Scholar] [CrossRef]
  59. Dorozhkin, S.V. Amorphous Calcium (Ortho)Phosphates. Acta Biomater. 2010, 6, 4457–4475. [Google Scholar] [CrossRef]
  60. Liou, S.-C.; Chen, S.-Y.; Lee, H.-Y.; Bow, J.-S. Structural Characterization of Nano-Sized Calcium Deficient Apatite Powders. Biomaterials 2004, 25, 189–196. [Google Scholar] [CrossRef]
  61. Boanini, E.; Gazzano, M.; Bigi, A. Ionic Substitutions in Calcium Phosphates Synthesized at Low Temperature. Acta Biomater. 2010, 6, 1882–1894. [Google Scholar] [CrossRef]
  62. Koutsopoulos, S. Synthesis and Characterization of Hydroxyapatite Crystals: A Review Study on the Analytical Methods. J. Biomed. Mater. Res. 2002, 62, 600–612. [Google Scholar] [CrossRef]
  63. Mochales, C.; Wilson, R.M.; Dowker, S.E.P.; Ginebra, M.-P. Dry Mechanosynthesis of Nanocrystalline Calcium Deficient Hydroxyapatite: Structural Characterisation. J. Alloys Compd. 2011, 509, 7389–7394. [Google Scholar] [CrossRef]
  64. Drouet, C. Apatite Formation: Why It May Not Work as Planned, and How to Conclusively Identify Apatite Compounds. BioMed. Res. Int. 2013, 2013, 490946. [Google Scholar] [CrossRef] [Green Version]
  65. Buljan Meić, I.; Kontrec, J.; Domazet Jurašin, D.; Njegić Džakula, B.; Štajner, L.; Lyons, D.M.; Dutour Sikirić, M.; Kralj, D. Comparative Study of Calcium Carbonates and Calcium Phosphates Precipitation in Model Systems Mimicking the Inorganic Environment for Biomineralization. Cryst. Growth Des. 2017, 17, 1103–1117. [Google Scholar] [CrossRef]
  66. Fadeeva, I.V.; Barinov, S.M.; Fedotov, A.Y.; Komlev, V.S. Interactions of Calcium Phosphates with Chitosan. Dokl. Chem. 2011, 441, 387–390. [Google Scholar] [CrossRef]
  67. Aimoli, C.G.; Beppu, M.M. Precipitation of Calcium Phosphate and Calcium Carbonate Induced over Chitosan Membranes: A Quick Method to Evaluate the Influence of Polymeric Matrices in Heterogeneous Calcification. Colloids Surf. B Biointerfaces 2006, 53, 15–22. [Google Scholar] [CrossRef]
  68. Bronze-Uhle, E.; Costa, B.C.; Ximenes, V.F.; Lisboa-Filho, P.N. Synthetic Nanoparticles of Bovine Serum Albumin with Entrapped Salicylic Acid. Nanotechnol. Sci. Appl. 2016, 10, 11–21. [Google Scholar] [CrossRef] [Green Version]
  69. Kong, J.; Yu, S. Fourier Transform Infrared Spectroscopic Analysis of Protein Secondary Structures. Acta Biochim. Biophys. Sin. 2007, 39, 549–559. [Google Scholar] [CrossRef] [Green Version]
  70. Rohiwal, S.S.; Satvekar, R.K.; Tiwari, A.P.; Raut, A.V.; Kumbhar, S.G.; Pawar, S.H. Investigating the Influence of Effective Parameters on Molecular Characteristics of Bovine Serum Albumin Nanoparticles. Appl. Surf. Sci. 2015, 334, 157–164. [Google Scholar] [CrossRef]
  71. Tanase, C.E.; Popa, M.I.; Verestiuc, L. Biomimetic Chitosan-Calcium Phosphate Composites with Potential Applications as Bone Substitutes: Preparation and Characterization. J. Biomed. Mater. Res. 2012, 100B, 700–708. [Google Scholar] [CrossRef]
  72. Liu, Y.; Layrolle, P.; de Bruijn, J.; van Blitterswijk, C.; de Groot, K. Biomimetic Coprecipitation of Calcium Phosphate and Bovine Serum Albumin on Titanium Alloy. J. Biomed. Mater. Res. 2001, 57, 327–335. [Google Scholar] [CrossRef]
  73. Aimoli, C.G.; de Lima, D.O.; Beppu, M.M. Investigation on the Biomimetic Influence of Biopolymers on Calcium Phosphate Precipitation-Part 2: Chitosan. Mater. Sci. Eng. C 2008, 28, 1565–1571. [Google Scholar] [CrossRef]
  74. Marques, P.A.A.P.; Serro, A.P.; Saramago, B.J.; Fernandes, A.C.; Magalhães, M.C.F.; Correia, R.N. Mineralisation of Two Phosphate Ceramics in HBSS: Role of Albumin. Biomaterials 2003, 24, 451–460. [Google Scholar] [CrossRef]
Figure 1. Representative pH vs. time curves obtained in the control system (CS) and in the presence of different concentrations of (a) bovine serum albumin (BSA) and (b) chitosan (Chi). c(CaCl2) = c(Na2HPO4) = 4 × 10⁻³ mol dm−3, pHinit = 7.4, ϑ = (25 ± 0.1) °C.
Minerals 12 01557 g001
Figure 2. Representative pH vs. time curves obtained in the control system (CS) and in the presence of (ad) 50 mg L−1 BSA and (e,f) 15 mg L−1 of chitosan (Chi) and different concentrations of TiO2 nanomaterials: (a,e) TiO2 nanoparticles (TiNPs), (b,f) TiO2 nanoplates (TiNPls), (c,g) titanate nanotubes (TiNTs), (d,h) nanowires (TiNWs). C(CaCl2) = c(Na2HPO4) = 4 × 10⁻³ mol dm−3, pHinit = 7.4, ϑ = (25 ± 0.1) °C.
Minerals 12 01557 g002
Figure 3. PXRD patterns of the precipitates obtained in the control system (CaDHA) and in the presence of different concentrations of (a) bovine serum albumin (BSA) after 60 min and (b) chitosan (Chi) after 120 min. c(CaCl2) = c(Na2HPO4) = 4 × 10⁻³ mol dm−3, pHinit = 7.4, ϑ = (25 ± 0.1) °C.
Minerals 12 01557 g003
Figure 4. FTIR spectra of the precipitates obtained in the control system (CaDHA) and the presence of different concentrations of (a) bovine serum albumin (BSA) after 60 min and (b) chitosan (Chi) after 120 min. c(CaCl2) = c(Na2HPO4) = 4 × 10⁻³ mol dm−3, pHinit = 7.4, ϑ = (25 ± 0.1) °C.
Minerals 12 01557 g004
Figure 5. PXRD patterns of the precipitates obtained in the control system (CaDHA) and in the presence of (ad) 50 mg L−1 bovine serum albumin (BSA) or (e,f) 15 mg L−1 of chitosan (Chi) and different concentrations of TiO2 nanomaterials: (a,e) TiO2 nanoparticles (TiNPs), (b,f) TiO2 nanoplates (TiNPls), (c,g) titanate nanotubes (TiNTs), (d,h) nanowires (TiNWs. c(CaCl2) = c(Na2HPO4) = 4 × 10⁻³ mol dm−3, pHinit = 7.4, ϑ = (25 ± 0.1) °C.
Minerals 12 01557 g005
Figure 6. FTIR spectra of the precipitates obtained in the control system (CaDHA) and in the presence of (ad) 50 mg L−1 bovine serum albumin (BSA) or (e,f) 15 mg L−1 of chitosan (Chi) and different concentrations of TiO2 nanomaterials: (a,e) TiO2 nanoparticles (TiNPs), (b,f) TiO2 nanoplates (TiNPls), (c,g) titanate nanotubes (TiNTs), (d,h) nanowires (TiNWs). c(CaCl2) = c(Na2HPO4) = 4 × 10⁻³ mol dm−3, pHinit = 7.4, ϑ = (25 ± 0.1) °C.
Minerals 12 01557 g006
Figure 7. SEM micrographs of the precipitates obtained in the control system (CS) and in the presence of different concentrations of bovine serum albumin (BSA) after 60 min and chitosan (Chi) after 120 min. c(CaCl2) = c(Na2HPO4) = 4 × 10⁻³ mol dm−3, pHinit = 7.4, ϑ = (25 ± 0.1) °C.
Minerals 12 01557 g007
Figure 8. SEM micrographs of the TiO2 nanomaterials and the precipitates obtained in the precipitation systems containing in addition bovine serum albumin (BSA) or chitosan (Chi) after 60 min and 120 min, respectively. c(CaCl2) = c(Na2HPO4) = 4 × 10⁻³ mol dm−3, γ (TiNMs) = γ (BSA) = 100 mg L−1, γ (Chi) = 15 mg L−1, pHinit = 7.4, ϑ = (25 ± 0.1) °C.
Minerals 12 01557 g008
Table 1. Average induction times for crystalline phase formation (ti) obtained from pH vs. time curves from 3 measurements, with standard deviations in the control system [32,33] and in the precipitation systems containing different concentrations of bovine serum albumin (BSA) and chitosan (Chi). c(CaCl2) = c(Na2HPO4) = 4 × 10⁻³ mol dm−3, pHinit = 7.4, ϑ = (25 ± 0.1) °C.
ti/min
γ/mg L−107.510.012.515.050.0100.0
BSA29.4 ± 3.2 39.7 ± 1.045.1 ± 0.9
Chi45.1± 2.134.9 ± 1.249.1 ± 1.146.4 ± 1.1
Table 2. Average induction times for crystalline phase formation (ti) obtained from pH vs. time curves from 3 measurements, with standard deviations in the precipitation systems containing TiNMs and different concentrations of bovine serum albumin (BSA) and chitosan (Chi). c(CaCl2) = c(Na2HPO4) = 4 × 10⁻³ mol dm−3, pHinit = 7.4, ϑ = (25 ± 0.1) °C.
ti/min
BSAChi
TiNMsγ/mg L−10 *5015
TiNPs5028.4 ± 0.840.7 ± 5.355.6 ± 2.1
10022.4 ± 1.234.9 ± 0.537.0 ± 1.1
TiNPls5027.1 ± 0.637.9 ± 2.537.5 ± 1.4
10025.3 ± 0.935.9 ± 1.034.0 ± 1.6
TiNTs5017.4 ± 0.928.2 ± 1.131.9 ± 0.9
10017.9 ± 2.020.3 ± 1.533.4 ± 1.5
TiNWs5029.2 ± 1.337.3 ± 1.757.6 ± 2.3
10023.2 ± 1.638.8 ± 4.250.2 ± 0.3
* Data from [32,33].
Table 3. Zeta potential of TiO2 nanoparticles (TiNPs), nanoplates (TiNPls), nanotubes (TiNTs), nanowires (TiNWs), bovine serum albumin (BSA), and chitosan (Chi) TiO2 nanomaterials in anionic reactant solution (c(Na2HPO4) = 8 × 10⁻³ mol dm−3, pHinit = 7.4, γ (TiNMs) = γ (BSA) 200 mg L−1, γ (Chi) = 30 mg L−1) at (25 ± 0.1) °C.
ζ/mV
SampleAnionicAnionic + BSAAnionic + Chi
TiNPs−45.9 ± 2.2 a−32.6 ± 1.33.13 ± 0.56
TiNPls−53.0 ± 2.5 b−34.3 ± 2.03.61 ± 1.22
TiNTs−40.5 ± 1.6 a−31.2 ±1.73.01 ± 0.46
TiNWs−55.0 ± 2.0 b−39.5 ± 1.93.50 ± 0.14
BSA−15.9 ± 4.7//
Chi−0.04 ± 0.11//
a—data from reference [32], b—data from reference [33].
Publisher’s Note: MDPI stays neutral with regard to jurisdictional claims in published maps and institutional affiliations.

