
A New Shear Constitutive Model Characterized by the Pre-Peak Nonlinear Stage


Abstract
1. Introduction
2. Model Development
3. Model Validation
4. Discussion
5. Conclusions
Author Contributions
Funding
Data Availability Statement
Conflicts of Interest
Appendix A
References
- Schreyer, H.; Sulsky, D. Constitutive and numerical framework for modeling joints and faults in rock. Int. J. Numer. Anal. Met. 2016, 40, 1253–1283. [Google Scholar] [CrossRef]
- Luo, X.; Cao, P.; Liu, T.; Zhao, Q.; Meng, G.; Fan, Z.; Xie, W. Mechanical behaviour of anchored rock containing weak interlayer under uniaxial compression: Laboratory test and coupled dem-fem simulation. Minerals 2022, 12, 492. [Google Scholar] [CrossRef]
- Yong, R.; Qin, J.-B.; Huang, M.; Du, S.-G.; Liu, J.; Hu, G.-J. An innovative sampling method for determining the scale effect of rock joints. Rock Mech. Rock Eng. 2019, 52, 935–946. [Google Scholar] [CrossRef]
- Hu, G.J.; Ma, G.; Liu, J.; Qi, K. Size effect of the number of parallel joints on uniaxial compressive strength and characteristic strength. Minerals 2022, 12, 62. [Google Scholar] [CrossRef]
- Lin, Q.; Cao, P.; Meng, J.; Cao, R.; Zhao, Z. Strength and failure characteristics of jointed rock mass with double circular holes under uniaxial compression: Insights from discrete element method modelling. Theor. Appl. Fract. Mec. 2020, 109, 102692. [Google Scholar] [CrossRef]
- Fan, X.; Yu, H.; Deng, Z.; He, Z.; Zhao, Y. Cracking and deformation of cuboidal sandstone with a single nonpenetrating flaw under uniaxial compression. Theor. Appl. Fract. Mec. 2022, 119, 103284. [Google Scholar] [CrossRef]
- Saadat, M.; Taheri, A. A cohesive discrete element based approach to characterizing the shear behavior of cohesive soil and clay-infilled rock joints. Comput. Geotech. 2019, 114, 103109. [Google Scholar] [CrossRef]
- Xie, S.; Han, Z.; Hu, H.; Lin, H. Application of a novel constitutive model to evaluate the shear deformation of discontinuity. Eng. Geol. 2022, 304, 106693. [Google Scholar] [CrossRef]
- Cai, W.; Zhu, H.; Liang, W. Three-dimensional stress rotation and control mechanism of deep tunneling incorporating generalized Zhang–Zhu strength-based forward analysis. Eng Geol. 2022, 308, 106806. [Google Scholar] [CrossRef]
- Yang, Z.; Wu, Y.; Zhou, Y.; Tang, H.; Fu, S. Assessment of machine learning models for the prediction of rate-dependent compressive strength of rocks. Minerals 2022, 12, 731. [Google Scholar] [CrossRef]
- Petrounias, P.; Giannakopoulou, P.P.; Rogkala, A.; Lampropoulou, P.; Koutsopoulou, E.; Papoulis, D.; Tsikouras, B.; Hatzipanagiotou, K. The impact of secondary phyllosilicate minerals on the engineering properties of various igneous aggregates from greece. Minerals 2018, 8, 329. [Google Scholar] [CrossRef]
- Gronen, L.H.; Sindern, S.; Katzmarzyk, J.L.; Bormann, U.; Hellmann, A.; Wotruba, H.; Meyer, F.M. Mineralogical and chemical characterization of zr-ree-nb ores from khalzan buregtei (mongolia)approaches to more efficient extraction of rare metals from alkaline granitoids. Minerals 2019, 9, 217. [Google Scholar] [CrossRef]
- Wang, J.A.; Park, H.D. Fluid permeability of sedimentary rocks in a complete stress-strain process. Eng. Geol. 2002, 63, 291–300. [Google Scholar] [CrossRef]
- Xie, S.; Lin, H.; Cheng, C.; Chen, Y.; Wang, Y.; Zhao, Y.; Yong, W. Shear strength model of joints based on Gaussian smoothing method and macro-micro roughness. Comput. Geotech. 2022, 143, 104605. [Google Scholar] [CrossRef]
- Patel, S.; Martin, C.D. Effect of stress path on the failure envelope of intact crystalline rock at low confining stress. Minerals 2020, 10, 1119. [Google Scholar] [CrossRef]
- Xu, X.Q.; Wu, W.L.; Xu, W.B. Sulfate-dependent shear behavior of cementing fiber-reinforced tailings and rock. Minerals 2020, 10, 1032. [Google Scholar] [CrossRef]
- Han, Z.; Li, D.; Li, X. Dynamic mechanical properties and wave propagation of composite rock-mortar specimens based on SHPB tests. Int. J. Min. Sci. Technol. 2022, 32, 793–806. [Google Scholar] [CrossRef]
- Wu, Y.; Zhou, Y. Hybrid machine learning model and Shapley additive explanations for compressive strength of sustainable concrete. Constr. Build. Mater. 2022, 330, 127298. [Google Scholar] [CrossRef]
- Han, Z.; Li, D.; Li, X. Effects of axial pre-force and loading rate on Mode I fracture behavior of granite. Int. J. Rock Mech. Min Sci. 2022, 157, 105172. [Google Scholar] [CrossRef]
- Pardoen, B.; Seyedi, D.M.; Collin, F. Shear banding modelling in cross-anisotropic rocks. Int. J. Solids Struct. 2015, 72, 63–87. [Google Scholar] [CrossRef]
- Bahaaddini, M.; Hagan, P.C.; Mitra, R.; Hebblewhite, B.K. Scale effect on the shear behaviour of rock joints based on a numerical study. Eng. Geol. 2014, 181, 212–223. [Google Scholar] [CrossRef]
- Asadollahi, P.; Tonon, F. Constitutive model for rock fractures: Revisiting Barton’s empirical model. Eng. Geol. 2010, 113, 11–32. [Google Scholar] [CrossRef]
- Mehrishal, S.; Sharifzadeh, M.; Song, J.J.; Shahriar, K. An investigation of the possibility of estimating the residual shear strength of rough joints using planar small joint in limestone rocks. J. Struct. Geol. 2021, 142, 104220. [Google Scholar] [CrossRef]
- Wang, X.Q.; Kang, H.P.; Gao, F.Q. Numerical investigation on the shear behavior of jointed coal mass. Comput. Geotech. 2019, 106, 274–285. [Google Scholar] [CrossRef]
- Karami, A.; Stead, D. Asperity degradation and damage in the direct shear test: A hybrid fem/dem approach. Rock Mech. Rock Eng. 2008, 41, 229–266. [Google Scholar] [CrossRef]
- Asadi, M.S.; Rasouli, V.; Barla, G. A laboratory shear cell used for simulation of shear strength and asperity degradation of rough rock fractures. Rock Mech. Rock Eng. 2013, 46, 683–699. [Google Scholar] [CrossRef]
- Bahaaddini, M.; Hagan, P.C.; Mitra, R.; Khosravi, M.H. Experimental and numerical study of asperity degradation in the direct shear test. Eng. Geol. 2016, 204, 41–52. [Google Scholar] [CrossRef]
- Cai, W.; Zhu, H.; Liang, W. Three-dimensional tunnel face extrusion and reinforcement effects of underground excavations in deep rock masses. Int. J. Rock Mech. Min. Sci. 2022, 150, 104999. [Google Scholar] [CrossRef]
- Meng, F.; Zhou, H.; Li, S.; Zhang, C.; Wang, Z.; Kong, L.; Zhang, L. Shear behaviour and acoustic emission characteristics of different joints under various stress levels. Rock Mech. Rock Eng. 2016, 49, 4919–4928. [Google Scholar] [CrossRef]
- Cui, G.; Zhang, C.; Han, H.; Zeng, Z.; Zhou, H.; Jingjing, L.U. Experiment study on shear behavior of artificial joint under CNL and CNS boundary conditions. Chin. J. Rock Mech. Eng. 2019, 38, 3384–3392. [Google Scholar]
- Fan, W.; Cao, P.; Long, L. Degradation of joint surface morphology, shear behavior and closure characteristics during cyclic loading. J. Cent South Univ. 2018, 25, 653–661. [Google Scholar] [CrossRef]
- Jing, L. A review of techniques, advances and outstanding issues in numerical modelling for rock mechanics and rock engineering. Int. J. Rock Mech. Min. Sci. 2003, 40, 283–353. [Google Scholar] [CrossRef]
- Muralha, J.; Grasselli, G.; Tatone, B.; Blumel, M.; Chryssanthakis, P.; Jiang, Y.J. ISRM Suggested Method for Laboratory Determination of the Shear Strength of Rock Joints: Revised Version. Rock Mech. Rock Eng. 2014, 47, 291–302. [Google Scholar] [CrossRef]
- Xie, S.J.; Lin, H.; Chen, Y.F.; Yong, R.; Xiong, W.; Du, S.G. A damage constitutive model for shear behavior of joints based on determination of the yield point. Int. J. Rock Mech. Min. Sci. 2020, 128, 104269. [Google Scholar] [CrossRef]
- Vakili, A. An improved unified constitutive model for rock material and guidelines for its application in numerical modelling. Comput. Geotech. 2016, 80, 261–282. [Google Scholar] [CrossRef]
- Cai, W.; Zhu, H.; Liang, W.; Wang, X.; Su, C.; Wei, X. A post-peak dilatancy model for soft rock and its application in deep tunnel excavation. J. Rock Mech. Geotech. Eng. 2022. [Google Scholar] [CrossRef]
- Cai, W.; Zhu, H.; Liang, W.; Vu, B.; Su, C.; Zhang, K.; Wang, X. Three-dimensional forward analysis and real-time design of deep tunneling based on digital in-situ testing. Int. J. Mech. Sci. 2022, 226, 107385. [Google Scholar] [CrossRef]
- Singh, H.K.; Basu, A. Evaluation of existing criteria in estimating shear strength of natural rock discontinuities. Eng. Geol. 2018, 232, 171–181. [Google Scholar] [CrossRef]
- Develi, K. Computation of direction dependent joint surface parameters through the algorithm of triangular prism surface area method: A theoretical and experimental study. Int. J. Solids Struct. 2020, 202, 895–911. [Google Scholar] [CrossRef]
- Xie, S.J.; Lin, H.; Wang, Y.X.; Chen, Y.F.; Xiong, W.; Zhao, Y.L.; Du, S. A statistical damage constitutive model considering whole joint shear deformation. Int. J. Damage Mech. 2020, 29, 988–1008. [Google Scholar] [CrossRef]
- Xie, S.J.; Han, Z.Y.; Chen, Y.F.; Wang, Y.X.; Zhao, Y.L.; Lin, H. Constitutive modeling of rock materials considering the void compaction characteristics. Arch. Civ. Mech. Eng. 2022, 22, 60. [Google Scholar] [CrossRef]
- Lin, Q.B.; Cao, P.; Wen, G.P.; Meng, J.J.; Cao, R.H.; Zhao, Z.Y. Crack coalescence in rock-like specimens with two dissimilar layers and pre-existing double parallel joints under uniaxial compression. Int. J. Rock Mech. Min. Sci. 2021, 139, 104621. [Google Scholar] [CrossRef]
- Goodman, R.E. Methods of Geological Engineering in Discontinuous Rocks; West Publishing, Co.: St. Paul, MN, USA, 1976. [Google Scholar]
- Saeb, S.; Amadei, B. Modelling rock joints under shear and normal loading. Int. J. Rock Mech. Min. Sci. 1992, 29, 267–278. [Google Scholar] [CrossRef]
- Kulhawy, F.H. Stress deformation properties of rock and rock discontinuities. Eng. Geol. 1975, 9, 327–350. [Google Scholar] [CrossRef]
- Bandis, S.C.; Lumsden, A.C.; Barton, N.R. Fundamentals of rock joint deformation. Int. J. Rock Mech. Min. Sci. 1983, 20, 249–268. [Google Scholar] [CrossRef]
- Desai, C.S.; Fishman, K.L. Plasticity-based constitutive model with associated testing for joints. Int. J. Rock Mech. Min. Sci. 1991, 28, 15–26. [Google Scholar] [CrossRef]
- Nassir, M.; Settari, A.; Wan, R. Joint stiffness and deformation behaviour of discontinuous rock. J. Can. Petrol. Technol. 2010, 49, 78–86. [Google Scholar] [CrossRef]
- Ban, L.; Qi, C.; Shan, R.; Tao, Z.; Xia, C.; Jiang, K. Pre-peak shear constitutive model considering the softening shear stiffness and its influencing factors. J. China Coal. Soc. 2018, 43, 2765–2772. (In Chinese) [Google Scholar]
- Kou, M.M.; Liu, X.R.; Tang, S.D.; Wang, Y.T. Experimental study of the prepeak cyclic shear mechanical behaviors of artificial rock joints with multiscale asperities. Soil Dyn. Earthq. Eng. 2019, 120, 58–74. [Google Scholar] [CrossRef]
- Shen, H.; Liu, Y.; Liu, B.; Li, H.; Wu, D.; Peng, B. Nonlinear theoretical model for describing shear mechanical behaviors of rock joints. Chin. J. Rock Mech. Eng. 2021, 40, 2421–2433. [Google Scholar]
- Zhao, H.; Zhou, S.; Zhao, M.H.; Shi, C.J. Statistical micromechanics-based modeling for low-porosity rocks under conventional triaxial compression. Int. J. Geomech. 2018, 18, 04018019. [Google Scholar] [CrossRef]
- Li, X.; Cao, W.-G.; Su, Y.-H. A statistical damage constitutive model for softening behavior of rocks. Eng. Geol. 2012, 143, 1–17. [Google Scholar] [CrossRef]
- Weibull, W. A statistical distribution function of wide applicability. J. Appl. Mech. 1951, 18, 293–297. [Google Scholar] [CrossRef]
- Xie, S.J.; Lin, H.; Wang, Y.X.; Cao, R.H.; Yong, R.; Du, S.G.; Li, J. Nonlinear shear constitutive model for peak shear-type joints based on improved Harris damage function. Arch. Civ. Mech. Eng. 2020, 20, 1–14. [Google Scholar] [CrossRef]
- Cao, W.G.; Li, X.; Zhao, H. Damage constitutive model for strain-softening rock based on normal distribution and its parameter determination. J. Cent. South Univ. 2007, 14, 719–724. [Google Scholar] [CrossRef]
- Palchik, V. Stress-strain model for carbonate rocks based on Haldane’s distribution function. Rock Mech. Rock Eng. 2006, 39, 215–232. [Google Scholar] [CrossRef]
- Lin, H.; Feng, J.J.; Cao, R.H.; Xie, S.J. Comparative analysis of rock damage models based on different distribution functions. Geotech. Geol. Eng. 2021, 40, 301–310. [Google Scholar] [CrossRef]
- Sun, Z.; Niu, D.; Wang, X.; Zhang, L.; Luo, D. Bond behavior of coral aggregate concrete and corroded Cr alloy steel bar. J. Build. Eng. 2022, 61, 105294. [Google Scholar] [CrossRef]
- Wang, Z.-L.; Li, Y.-C.; Wang, J.G. A damage-softening statistical constitutive model considering rock residual strength. Comput. Geosci. 2007, 33, 1–9. [Google Scholar] [CrossRef]
- Yang, B.C.; Xue, L.; Wang, M.M. Evolution of the shape parameter in the Weibull distribution for brittle rocks under uniaxial compression. Arab. J. Geosci. 2018, 11, 1–7. [Google Scholar] [CrossRef]
- Shen, P.; Tang, H.; Wang, D.; Ning, Y.; Zhang, Y.; Su, X. A statistical damage constitutive model based on unified strength theory for embankment rocks. Mar. Georesour. Geotec. 2020, 38, 818–829. [Google Scholar] [CrossRef]
- Xie, S.J.; Lin, H.; Chen, Y.F.; Wang, Y.X. A new nonlinear empirical strength criterion for rocks under conventional triaxial compression. J. Cent. South Univ. 2021, 28, 1448–1458. [Google Scholar] [CrossRef]
- Deng, J.A.; Gu, D.S. On a statistical damage constitutive model for rock materials. Comput. Geosci. 2011, 37, 122–128. [Google Scholar] [CrossRef]
- Lu, C.S.; Danzer, R.; Fischer, F.D. Fracture statistics of brittle materials: Weibull or normal distribution. Phys. Rev. E 2002, 65, 067102. [Google Scholar] [CrossRef] [PubMed]
- Basu, B.; Tiwari, D.; Kundu, D.; Prasad, R. Is Weibull distribution the most appropriate statistical strength distribution for brittle materials? Ceram. Int. 2009, 35, 237–246. [Google Scholar] [CrossRef]
- Zhou, X.P.; Yang, H.Q. Micromechanical modeling of dynamic compressive responses of mesoscopic heterogenous brittle rock. Theor. Appl. Fract. Mec. 2007, 48, 1–20. [Google Scholar] [CrossRef]
- Palchik, V. Simple stress–strain model of very strong limestones and dolomites for engineering practice. Geomech. Geophys. Geo-Energy Geo-Resour. 2019, 5, 345–356. [Google Scholar] [CrossRef]
- Bao, H.; Xu, X.; Lan, H.; Yan, C.; Xu, J. Stiffness model of rock joint by considering anisotropic morphology. J. Traffic Transp. Eng. 2021, 11, 1–18. (In Chinese) [Google Scholar]
- Wang, S.; Chester, S.A. Experimental characterization and continuum modeling of inelasticity in filled rubber-like materials. Int. J. Solids Struct. 2018, 136, 125–136. [Google Scholar] [CrossRef]
- Wang, S.; Chester, S.A. Modeling thermal recovery of the Mullins effect. Mech. Mater. 2018, 126, 88–98. [Google Scholar] [CrossRef]
- Wang, W.; Yao, Q.; Tang, C.; Li, X.; Chong, Z.; Xu, Q. Experimental study on the shear characteristics and weakening mechanism of water-bearing rock joints. Bull. Eng. Geol. Environ. 2021, 80, 7653–7668. [Google Scholar] [CrossRef]
- Lei, D.X.; Lin, H.; Chen, Y.F.; Cao, R.H.; Wen, Z.J. Effect of cyclic freezing-thawing on the shear mechanical characteristics of nonpersistent joints. Adv. Mater. Sci. Eng. 2019, 2019, 9867681. [Google Scholar] [CrossRef]
- Li, B.; Ye, X.; Dou, Z.; Zhao, Z.; Li, Y.; Yang, Q. Shear strength of rock fractures under dry, surface wet and saturated conditions. Rock Mech. Rock Eng. 2020, 53, 2605–2622. [Google Scholar] [CrossRef]
- Xie, S.; Han, Z.; Lin, H. A quantitative model considering crack closure effect of rock materials. Int. J. Solids Struct. 2022, 251, 111758. [Google Scholar] [CrossRef]
- Basu, A.; Ram, B.K.; Nanda, N.K.; Nayak, S.S. Deterioration of shear strength parameters of limestone joints under simulated acid rain condition. Int. J. Rock Mech. Min. Sci. 2020, 135, 104508. [Google Scholar] [CrossRef]
- Behnia, M.; Nateghpour, B.; Tavakoli, J.; Broujerdi, M.S. Comparison of experimental and empirical methods for estimating the shear strength of rock joints based on the statistical approach. Environ. Earth Sci. 2020, 79, 361. [Google Scholar] [CrossRef]


| Group | Water | Cement | Sand | Silicon | Water Reducer |
|---|---|---|---|---|---|
| a | 1 | 2 | 2 | 0 | 0 |
| b | 1 | 2 | 3 | 0.1 | 0.1 |
| c | 1 | 2 | 3 | 0.2 | 0.2 |
| Joint Samples | Model Expression of the Proposed Model | R2 | |||
|---|---|---|---|---|---|
| Proposed Model | Ban et al. [49] Model | Bandis et al. [46] Model | Nassir et al. [48] Model | ||
| a-0.2MPa-0° | 0.999 | 0.991 | 0.997 | 0.994 | |
| a-0.2MPa-90° | 0.998 | 0.99 | 0.98 | 0.98 | |
| a-0.2MPa-180° | 0.983 | 0.982 | 0.98 | 0.98 | |
| a-0.2MPa-270° | 0.996 | / | 0.97 | 0.97 | |
| a-0.5MPa-0° | 0.999 | 0.994 | 0.987 | 0.98 | |
| a-0.5MPa-90° | 0.982 | 0.98 | 0.981 | 0.972 | |
| a-0.5MPa-180° | 0.977 | / | 0.96 | 0.97 | |
| a-0.5MPa-270° | 0.983 | 0.991 | 0.983 | 0.983 | |
| a-1.0MPa-0° | 0.999 | 0.99 | 0.983 | 0.974 | |
| a-1.0MPa-90° | 0.998 | 0.992 | 0.98 | 0.984 | |
| a-1.0MPa-180° | 0.995 | 0.993 | 0.985 | 0.993 | |
| a-1.0MPa-270° | 0.996 | 0.995 | 0.986 | 0.99 | |
| b-0.2MPa-0° | 0.985 | 0.99 | 0.981 | 0.983 | |
| b-0.2MPa-90° | 0.994 | 0.989 | 0.984 | 0.985 | |
| b-0.2MPa-180° | 0.998 | 0.998 | 0.988 | 0.98 | |
| b-0.2MPa-270° | 0.945 | 0.993 | 0.975 | 0.973 | |
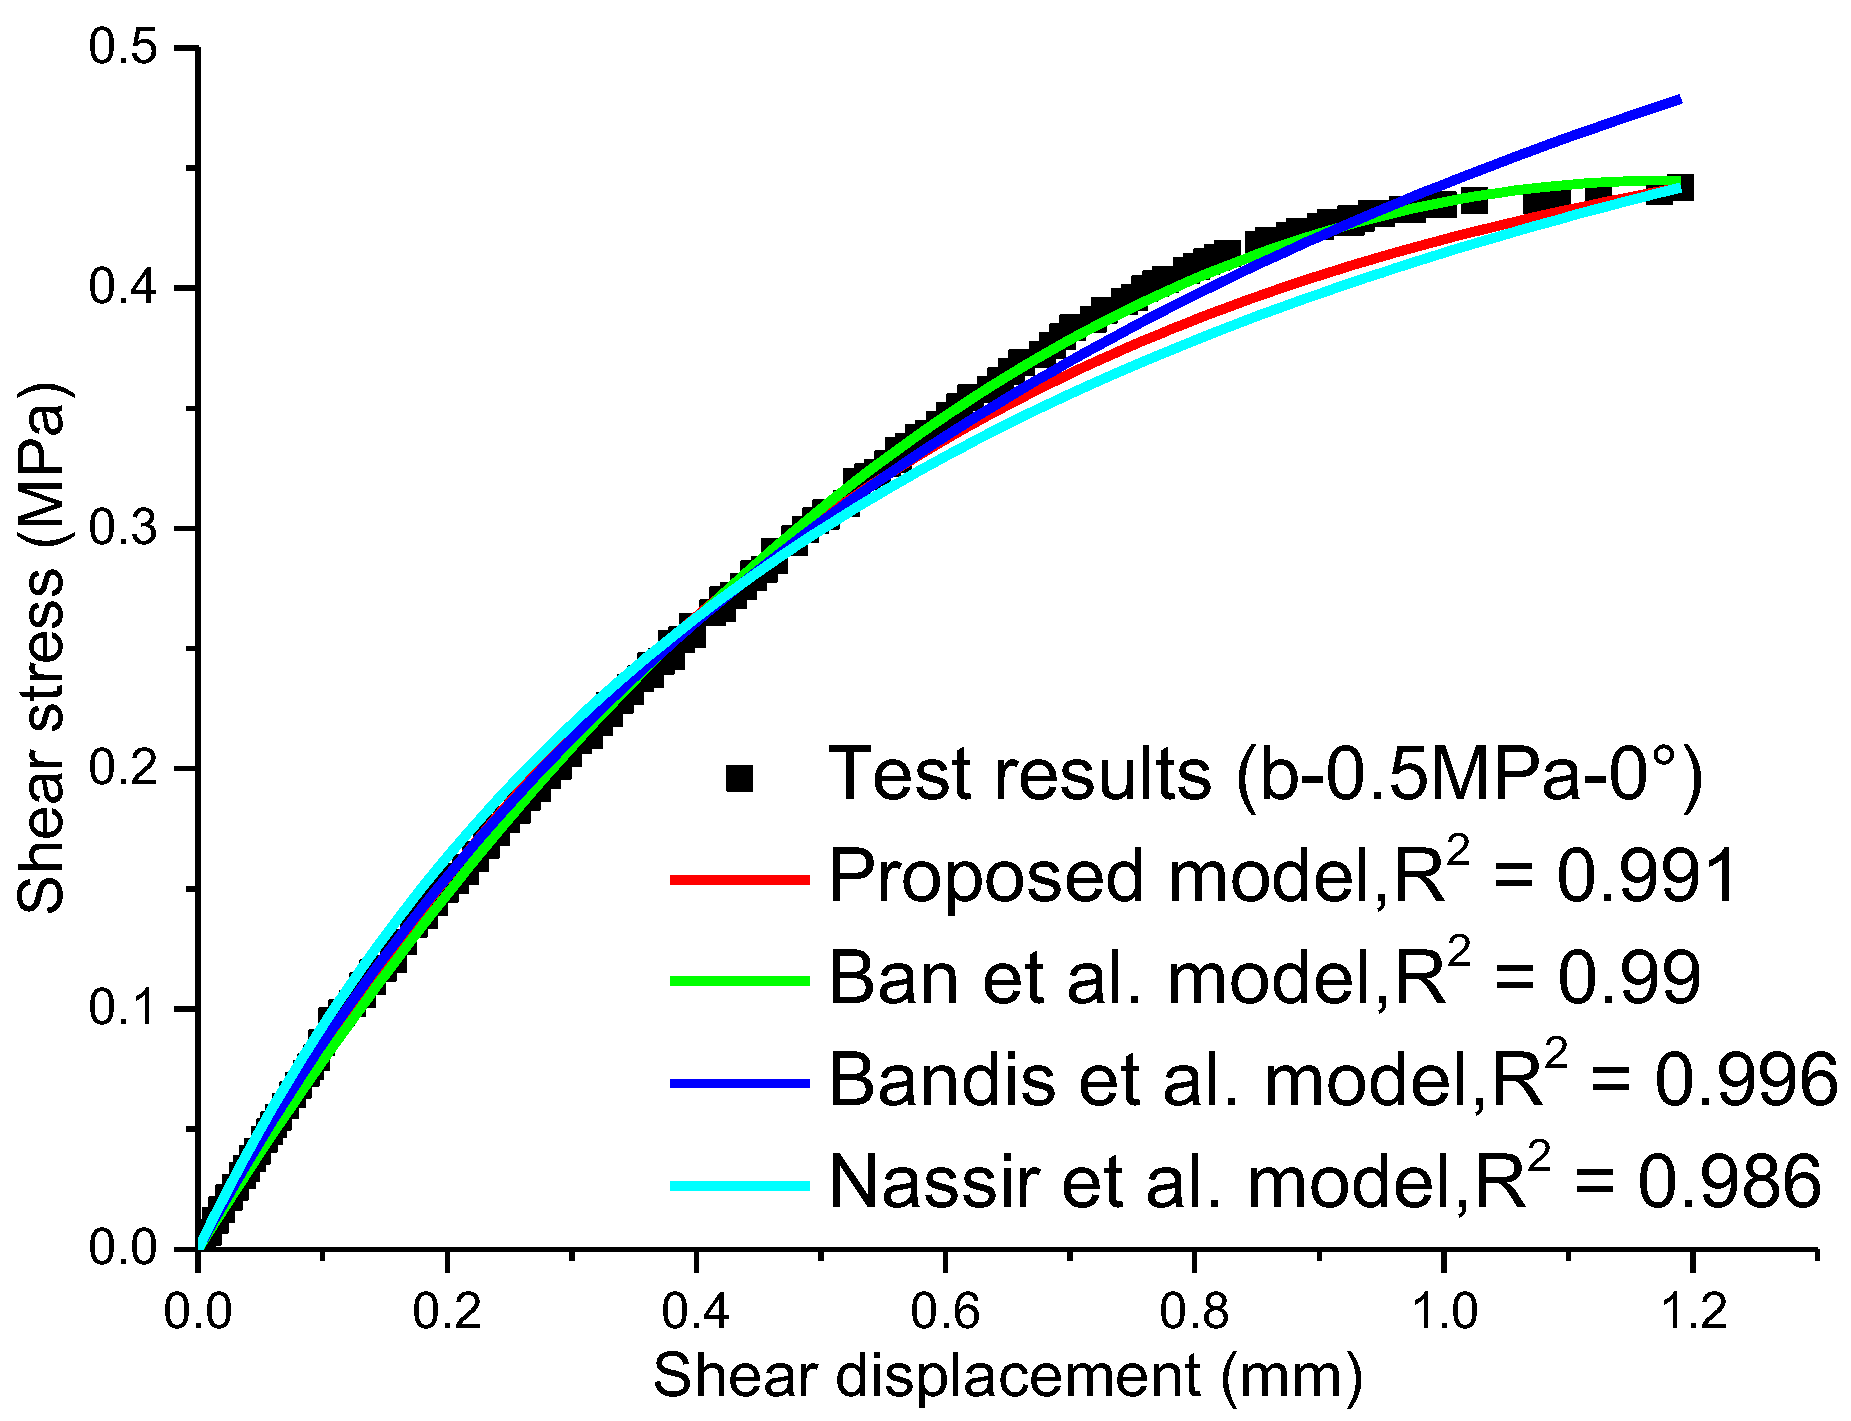
| b-0.5MPa-0° | 0.991 | 0.99 | 0.996 | 0.986 | |
| b-0.5MPa-90° | 0.979 | 0.99 | 0.989 | 0.988 | |
| b-0.5MPa-180° | 0.983 | 0.979 | 0.994 | 0.984 | |
| b-0.5MPa-270° | 0.987 | 0.99 | 0.991 | 0.984 | |
| b-1.0MPa-0° | 0.992 | 0.99 | 0.992 | 0.99 | |
| b-1.0MPa-90° | 0.996 | 0.99 | 0.99 | 0.987 | |
| b-1.0MPa-180° | 0.976 | 0.992 | 0.981 | 0.979 | |
| b-1.0MPa-270° | 0.997 | 0.99 | 0.991 | 0.99 | |
| c-0.2MPa-0° | 0.976 | 0.998 | 0.976 | 0.998 | |
| c-0.2MPa-90° | 0.935 | 0.96 | 0.951 | 0.94 | |
| c-0.2MPa-180° | 0.98 | 0.996 | 0.97 | 0.96 | |
| c-0.2MPa-270° | 0.985 | 0.995 | 0.98 | 0.982 | |
| c-0.5MPa-0° | 0.975 | 0.99 | 0.971 | 0.973 | |
| c-0.5MPa-90° | 0.988 | 0.99 | 0.964 | 0.983 | |
| c-0.5MPa-180° | 0.983 | 0.985 | 0.979 | 0.976 | |
| c-0.5MPa-270° | 0.99 | 0.99 | 0.981 | 0.98 | |
| c-1.0MPa-0° | 0.995 | 0.99 | 0.982 | 0.981 | |
| c-1.0MPa-90° | 0.997 | 0.99 | 0.977 | 0.983 | |
| c-1.0MPa-180° | 0.984 | 0.996 | 0.973 | 0.981 | |
| c-1.0MPa-270° | 0.998 | 0.99 | 0.981 | 0.983 | |
Publisher’s Note: MDPI stays neutral with regard to jurisdictional claims in published maps and institutional affiliations. |
© 2022 by the authors. Licensee MDPI, Basel, Switzerland. This article is an open access article distributed under the terms and conditions of the Creative Commons Attribution (CC BY) license (https://creativecommons.org/licenses/by/4.0/).
Share and Cite
Xie, S.; Lin, H.; Han, Z.; Duan, H.; Chen, Y.; Li, D. A New Shear Constitutive Model Characterized by the Pre-Peak Nonlinear Stage. Minerals 2022, 12, 1429. https://doi.org/10.3390/min12111429
Xie S, Lin H, Han Z, Duan H, Chen Y, Li D. A New Shear Constitutive Model Characterized by the Pre-Peak Nonlinear Stage. Minerals. 2022; 12(11):1429. https://doi.org/10.3390/min12111429
Chicago/Turabian StyleXie, Shijie, Hang Lin, Zhenyu Han, Hongyu Duan, Yifan Chen, and Diyuan Li. 2022. "A New Shear Constitutive Model Characterized by the Pre-Peak Nonlinear Stage" Minerals 12, no. 11: 1429. https://doi.org/10.3390/min12111429
APA StyleXie, S., Lin, H., Han, Z., Duan, H., Chen, Y., & Li, D. (2022). A New Shear Constitutive Model Characterized by the Pre-Peak Nonlinear Stage. Minerals, 12(11), 1429. https://doi.org/10.3390/min12111429