Article

Effects of Freeze–Thaw Cycling on Dynamic Compressive Strength and Energy Dissipation of Sandstone

1
State Key Laboratory of Hydraulic Engineering Simulation and Safety, School of Civil Engineering, Tianjin University, Tianjin 300072, China
2
Institute of Defense Engineering, AMS, Beijing 100036, China
*
Author to whom correspondence should be addressed.
Minerals 2022, 12(10), 1331; https://doi.org/10.3390/min12101331
Submission received: 22 September 2022 / Revised: 17 October 2022 / Accepted: 18 October 2022 / Published: 20 October 2022
(This article belongs to the Special Issue Failure Characteristics of Deep Rocks)

Abstract

:
In this study, the dynamic compressive strength and dissipated energy of rocks were investigated under hydrostatic pressure after different freeze–thaw cycles (FTCs). A split Hopkinson pressure bar (SHPB) with a lateral confining pressure chamber was used for the dynamic testing of sandstone specimens. The results indicated that under a certain loading rate and hydrostatic pressure, both the dissipative energy and dynamic compression strength of rocks decreased with the increase in the number of FTCs. The hydrostatic pressure significantly increased the dissipated energy and dynamic compression strength of rocks, and the enhancement became more pronounced as the number of FTCs increased. By analyzing the energy and damage characteristics of the specimens, after 40 FTCs, the internal damage of the specimens became critical and desensitized the dissipated energy to the loading rate. Based on the testing results, an empirical function was proposed to describe how the dissipated energy was related to the number of FTCs, hydrostatic pressure, and loading rate. It was demonstrated that the dissipated energy had a negative linear relation with FTC, which was enhanced by confinement. The dissipated energy of the specimen corresponded to the dynamic compression strength according to a quadratic function.

1. Introduction

Freeze–thaw cycling (FTC) refers to the alternating phenomenon of the freezing and thawing of water contained in the surface and interior of a structural member and is the result of the phase transition between water and ice in the material caused by temperature change [1]. Studies indicated that freeze–thaw weathering has a significant influence on rock degradation and rock engineering stability in cold regions [2,3,4,5,6]. FTC weathering leads to the initiation of internal cracks in the rock, causing the reduction in rock strength, and eventually leads to the damage of the rock mass [2,3,7].
The effect of FTC on the petrophysical properties of rocks has been extensively studied. It was indicated that the number of FTCs had a certain influence on the change in rock porosity and that the P-wave velocity also showed a decreasing trend with the increase in the FTC number [8,9,10]. Park et al. [11] studied the petrophysical and mechanical properties of granite and sandstone under the effect of FTC and indicated that the specific heat capacity and Poisson’s ratio of rock tended to decrease with the decrease in the freezing temperature. Thomachot and Matsuoka [12] found that the water content and the number of FTCs were the most important in the dilation of the materials. Tan et al. [13] obtained the effect of FTC on the mechanical properties of granite, including strength, deformation characteristics, elastic modulus, cohesive strength, and internal friction angle. Some studies indicated that the rock wave velocity decreased with the increase in the FTC number and that the decreasing trend was related to lithology [14,15].
Under the effect of FTC, the physical properties of rocks are weakened, so the mechanical properties of rocks also change greatly. Numerous studies showed that water content, loading rate, temperature, and the number of FTCs had important effects on the uniaxial compressive strength, P-wave velocity, and fracture of rocks [10,16,17,18,19,20,21]. Chen et al. [22] indicated that different initial water contents had an effect on the uniaxial compressive strength of rock after FTC. When the initial water content was above 70%, the compressive strength of the rock decreased sharply with the increase in the water content. Bayram [23] developed a statistical model to predict the degradation of uniaxial compression strength using intact tests of impact strength, modulus of elasticity, and water absorption. Amin Jamshidi [24] indicated a new petro-mechanical predictor parameter to predict the strength of granitic stones after FTC. Ren et al. [25] indicated that the damage caused by FTC was mainly concentrated on the side and edge area of rock specimens.
The above-mentioned studies mainly focused on the effect of FTC on the mechanical properties of rocks under static loading conditions. In practical engineering, rock masses are subjected to dynamic loads such as explosions and earthquakes. In recent years, the split Hopkinson pressure bar (SHPB) was widely used in the study of rock dynamic mechanics. Xia and Yao [26] gave a detailed introduction to the history of SHPB, working principle, wave shaping technology, and its application in rock dynamic tests. Some scholars used the SHPB system to systematically study various mechanical properties of rock materials, such as dynamic tensile properties, compressive properties, and fracture properties [26,27]. Numerous studies showed that the dynamic compression strength, dynamic tensile strength, and elastic modulus of rock decreased with the increase in the FTC number [28,29,30,31,32].
Material damage is a state instability phenomenon driven by energy, and energy dissipation is the fundamental cause of rock deformation and damage. Studying the energy dissipation laws of rocks in cold regions under different working conditions can effectively reveal the dynamic failure mechanism of rocks. Xie et al. [33] indicated that rock damage was associated with energy dissipation and release; therefore, the dissipated energy is often used to evaluate damage accumulation in rock materials [34]. Wang et al. [35] analyzed the stress–strain curve and energy evolution curve of the specimen, as well as the dynamic mechanical properties and energy index. A precise FTC rock damage model was established by Feng et al. [36]. Lundberg [37] performed dynamic compression tests on granite and limestone to evaluate the energy absorption of the specimens during crushing and indicated that the absorbed energy increased significantly when the load exceeded a certain level. Zhou et al. [32] established an increasing model of the relationship among porosity, absorbed energy, and the number of FTCs. Li et al. [38] applied dynamic loads to granite and measured the energy absorption; the results indicated that the size distribution of the fragments was determined by the energy absorption of the specimens. Deng et al. [39] further analyzed the effect of FTC on sandstone damage from the perspective of energy and found that the energy required to damage the specimen under dynamic impact load increased with the increase in the FTC number.
Recently, numerous studies were carried out on the effect of dynamic rock properties under FTC, but few researchers focused on the effect of hydrostatic confining pressure. However, in cold regions, deeply buried rock structures are also affected by FTC. Some studies showed that the physical and mechanical properties of rocks under the effect of hydrostatic pressure were quite different from those without hydrostatic pressure [40,41]. It is of great significance to study the dynamic mechanical properties and the energy dissipation of rock subjected to hydrostatic pressure.
In order to fill the gap, in this study, the dynamic compressive properties and energy dissipation of green sandstone specimens under the combined effects of freeze–thaw cycling, hydrostatic pressure, and loading rate were studied.

2. Specimen Preparation

2.1. Specimen Configuration and Basic Properties

Sedimentary rock is widely distributed on the surface of the Earth and is an important area for human activities such as resources and energy development, and underground engineering construction. In the current study, the rock specimens were made of green sandstone from Dazhou, Sichuan of China. The mineral composition of this rock was measured [42]; as shown in Figure 1, quartz and plagioclase were the main components of green sandstone. With reference to the dynamic test requirements of International Society for Rock Mechanics (ISRM), the specimens were made into discs with a nominal diameter of 50 mm and a thickness of 25 mm. The specimen end surfaces were polished to straightness of ±0.02 mm and a roughness of 0.5% over the full thickness [43], as shown in Figure 2. The mechanical and physical properties of green sandstone were measured in the previous study [44]. The density of green sandstone was 2.44 g/cm3; the P-wave velocity and the static compressive strength were 3674 m/s and 62.97 MPa, respectively. The elastic modulus and Poisson’s ratio were 7.83 GPa and 0.22, respectively.

2.2. Freeze–Thaw Cycling Weathering

The green sandstone specimens were divided into six groups and prepared with 0, 10, 20, 30, 40, and 50 FTCs, respectively. At first, all specimens were dried for 48 h until the mass no longer changed and then cooled to room temperature naturally. All specimens were immersed in distilled water in a vacuum container for 48 h, and the surface of the water was at least 20 mm higher than the specimens. According to Chinese Standard for test methods of engineering rock mass (GB/T 50266-2013), the temperature range of the FTC process was set at −20–20 °C. The temperature control curve of the FTC process is shown in Figure 3. The fully saturated specimens were placed in the freeze–thaw box for 4 h under the condition of −20 °C; then, the frozen specimens were immersed in warm distilled water at 20 °C for 4 h. Altogether, this was one freeze–thaw cycle.

3. Experimental Techniques

3.1. Loading System

A split Hopkinson pressure bar (SHPB) with a lateral confining pressure chamber and an axial pressure cylinder was used for the dynamic testing of green sandstone specimens. The material of the bar was martensitic steel with Young’s modulus of 211 GPa and a P-wave velocity of 5270 m/s. As the schematic diagram shows in Figure 4, the SHPB system could be divided into four parts: the bullet (impact bar), the incident bar, the transmission bar, and the absorption bar. The lengths of the bullet, incident bar, transmitted bar, and absorption bar were 0.35 m, 3.0 m, 1.8 m, and 0.5 m, respectively [44].
The confining pressure device could provide axial pressure and hydrostatic confining pressure, and the maximum confining pressure that the device could provide was 60 MPa. The working principle of the system was detailed in earlier studies. The strain gauges were attached on the surfaces of the incident bar and transmitted bar to measure the incident strain ( ε I ), the reflected strain ( ε R ), and the transmitted strain ( ε T ).
According to the dynamic mechanic test method for rock proposed by ISRM, an effective test should satisfy the dynamic stress balance conditions:
σ 1 = σ 2
where σ 1 and σ 2 are the loading stresses on the two ends of the rock specimen. In other words, all parts inside the specimen should satisfy the following formula:
ε I t + ε R t = ε T t
where ε I t is the incidence strain, ε R t is the reflected strain, and ε T t is the transmitted strain. Moreover, the typical dynamic stress balance curve is shown in Figure 5.
On this basis, the dynamic compressive strength and strain of the specimens could be calculated using the three-wave method, and the calculation formula is as follows:
σ s = P 1 + P 2 2 A s = A E 2 A s ε I + ε R + ε T = A E A s ε T
ε = C 0 L 0 0 t ( ε I ε R ε T ) d t = 2 C 0 L 0 0 t ε R d t
ε ˙ = C 0 L 0 ε I ε R ε T = 2 C 0 L 0 ε R
where σ s is the stress of the material, A s is the cross-sectional area of the specimen, and L 0 is the length of the specimen. Along with the above equations, the stress–strain curve of the specimen material at the strain rate of ε ˙ could be obtained.
Figure 6 shows the relationship between the dynamic compressive stress and loading time. The linear slope of the fitting in the rising phase was defined as the loading rate. Then, the variation law of the compressive strength of the specimens with the loading rate under the effects of different freeze–thaw cycles and confining pressure could be obtained.
In this study, three groups of different hydrostatic pressures (0 MPa, 2 MPa, and 4 MPa) were set. Among them, 0 MPa was the control test. Under each hydrostatic pressure, six groups of freeze–thaw cycle conditions (0 FTC, 10 FTC, 20 FTC, 30 FTC, 40 FTC, and 50 FTC) were set. Under each working condition, at least five tests with different loading rates were performed.

3.2. Single-Loading Technology

For a traditional split Hopkinson pressure bar, the reflected tensile wave can be reflected again at the impinging end of the incident bar to form a compression wave, causing the secondary loading or even multiple loading of the specimen, which is not conducive to the energy analysis of a specimen. To solve this problem, a single-loading technique was used in the current study, as shown in Figure 7. By setting the length of the prepared slit between the flange and the mass block, the prepared slit was closed when the reflected tension wave reached the impacting end of the incident bar. Due to the limitation of the mass block, the wave impedance at this end was much greater than the wave impedance of the incident bar, and the reflected tension wave remained a tension wave after reflection at this end [45]. The wave did not load the specimen in secondary compression or even multiple times, so the single loading of the specimen was achieved. The calculation of the prepared slit is shown below [46]:
S = 0 T 0 ε i c 0 d t
where ε i is the strain in the incident bar and the integration region, T 0 , is the loading pulse width.

4. Results and Discussions

4.1. Stress–Strain Curve

Based on the information of the incident wave, reflected wave, and transmitted wave collected during the test, the stress–strain curve of each green sandstone specimen subjected to dynamic shock compression failure was obtained with the three-wave method. Figure 8 shows the dynamic compressive stress–strain curves of the specimens under the hydrostatic pressures of 0 MPa and 2 MPa, respectively, before FTC treatment. Under the same working conditions, the peak point of the stress–strain curve increased with the increase in the loading rate.
The stress–strain curves could be roughly divided into four stages: (I) compression of fissures, (II) linear deformation of rock, (III) yield of rock, and (IV) failure of rock. Typical schematic diagrams of different macroscopic failure stages of the specimens are also shown in Figure 9. The compression of fissures was the initial stage of the specimen loading process. Judging from the microstructural characteristics of the material, the green sandstone specimen had certain primary disconnected micro-cracks, and these micro-cracks were closed under pressure in this stage. In the stage of the linear deformation of rock, the stress–strain curve rose approximately linearly. The slope of the curve was defined as the elastic modulus of the specimen under this working condition. In the stage of the the yield of rock, with the increase in the stress, the slope of the curve decreased, and the local failure inside the specimen gradually developed; then, the crack ruptured through, which led to the generation of new cracks and the expansion of the original cracks.
After the specimens reached the peak point, the stress decreased rapidly. At this time, the stress–strain curve was closely related to the loading rate. As is shown in Figure 8a,b, the green sandstone specimens under confining pressure had an obvious strain-softening trend until reaching the residual strength point after the failure stage; then, they showed a significant rebound.
Under the condition of no confining pressure, the strain continued to increase after the specimens entered the failure stage, and there was no rebound stage, which indicated that the specimen was completely broken. When the loading rate was low (661 GPa/s in Figure 8a, 969 GPa/s in Figure 8b), the specimens remained intact after being impacted, and the stress–strain curve showed a rebound trend immediately after the peak point. When the loading rate was high, the stress–strain curve continued to decrease with the increase in the strain after the peak point. At this time, the specimens still had a certain residual strength. Under the action of a large loading rate, the reduction rate of residual strength after the peaks decreased with the increase in the loading rate and appeared as a relatively gentle stage; then, the curve rebounded. Under the effect of hydrostatic pressure, the higher the loading rate was, the more obvious this stage was (2463 GPa/s and 2920 GPa/s in Figure 8b).

4.2. Dynamic Compressive Strength

Dynamic compressive strength is an important parameter to measure the mechanical properties of rock. Figure 10 shows the variation in dynamic compressive strength with the loading rate in green sandstone specimens under different hydrostatic pressure and FTCs. It could be seen that under the condition of a certain hydrostatic pressure, the dynamic compressive strength of the specimens increased approximately linearly with the loading rate. Under the condition of a constant loading rate, the dynamic compressive strength decreased with the increase in FTCs. The reason was that under the influence of FTC, the defects of the specimens continued to accumulate, and the impact resistance decreased.
Figure 11 shows the variation in dynamic compressive strength with the number of FTCs for two loading rates (1000 GPa/s and 2000 GPa/s) and different hydrostatic pressures. Under the conditions of the same loading rate and FTCs, the dynamic compressive strength of the specimen under the effect of hydrostatic pressure was significantly higher than that of the specimen without hydrostatic pressure, and the greater the hydrostatic pressure was, the greater the strength was. Under the conditions of 0 FTC and 1000 GPa/s, the strength of the specimen under 2 MPa hydrostatic pressure increased by 39.81% compared with that under 0 MP hydrostatic pressure, and the growth rate increased with the increase in FTCs. After 50 FTCs, the growth rate reached 70.47%. Under the conditions of 0 FTC and 2000 GPa/s, the strength of the specimen under 2 MPa hydrostatic pressure increased by 27.66% compared with that under 0 MPa hydrostatic pressure; after 50 FTCs, the growth rate reached 62.89%. The same trend could be found from the 2 MPa curve to the 4 MPa curve. It showed that the effect of hydrostatic pressure could significantly improve the dynamic compressive strength of the specimens, and the improvement effect was more obvious with more FTCs.
A linear fit analysis was performed on the data points, and the fitting parameters and coefficient of determination are shown in Table 1:
σ = k N + b
where N is the number of FTCs, σ is the dynamic compressive strength, and k and b are the fitting parameters. The slope, k , represents the rate of change in dynamic compression strength with N , and b represents the dynamic compression strength when the number of FTCs is 0.
The dynamic compression strength decreased with the increase in FTCs, and the rate of reduction decreased with the increase in hydrostatic pressure, which indicated that the hydrostatic pressure constraint could reduce the weathering damage to the specimen caused by FTC.

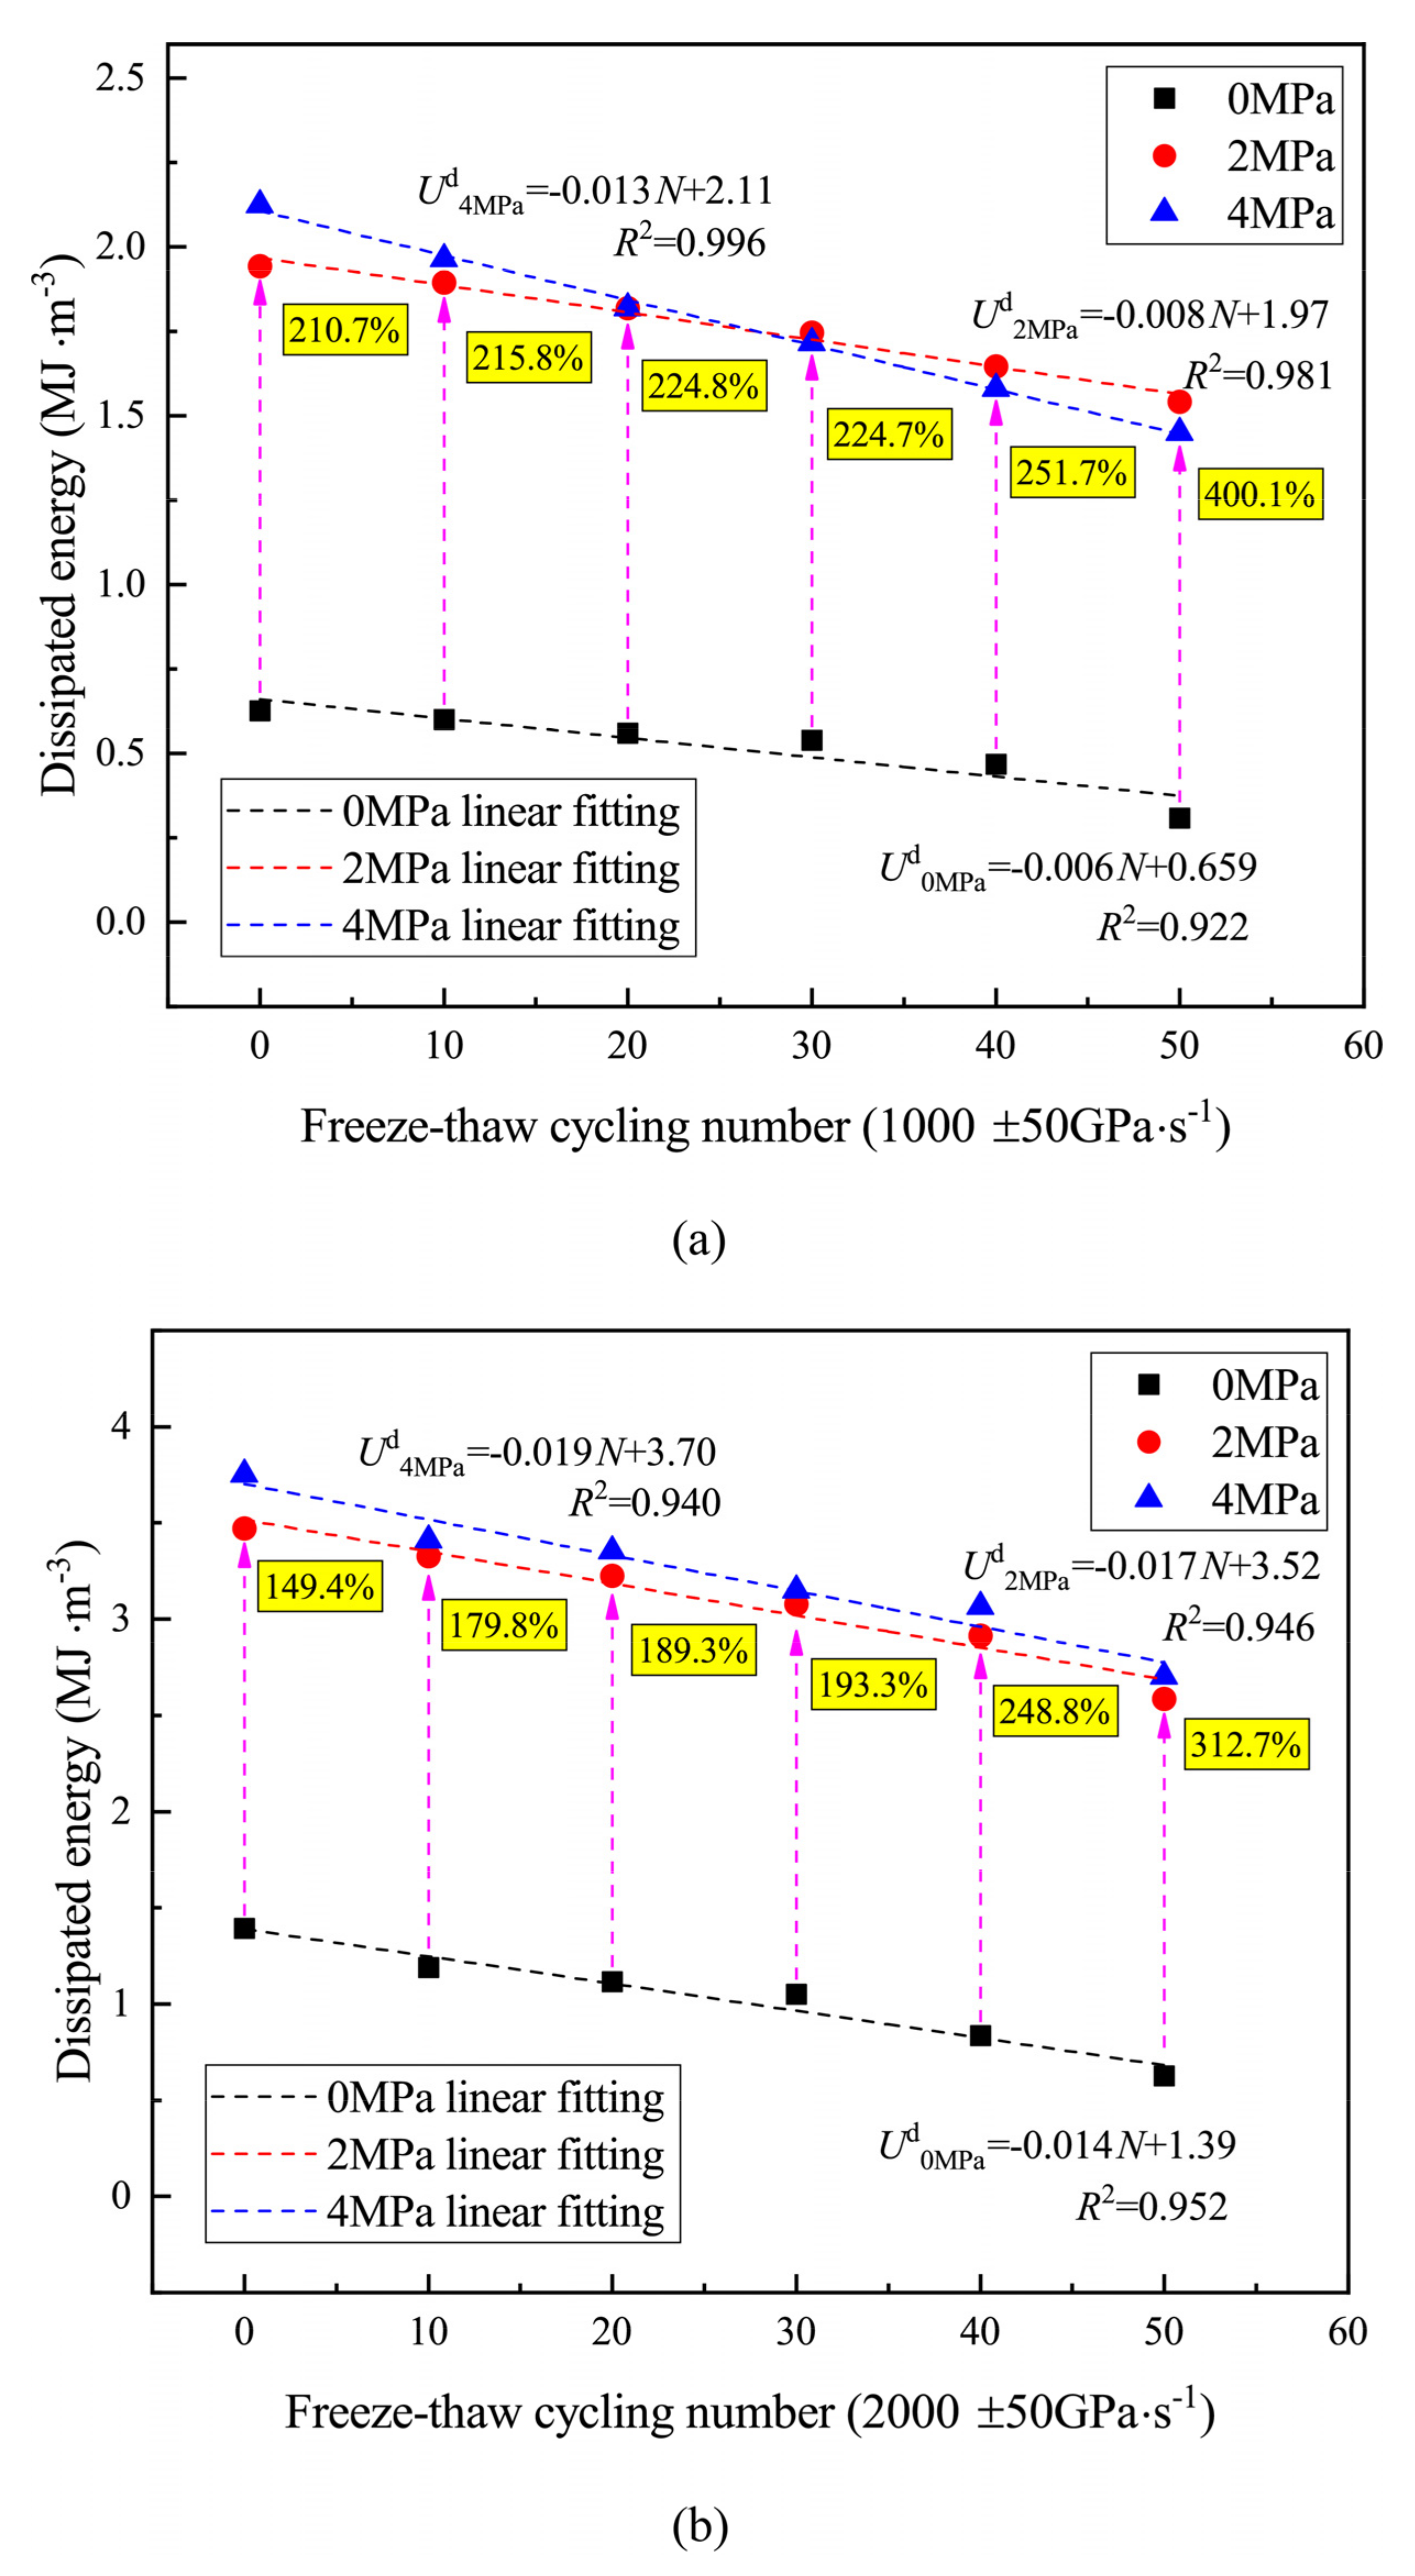
4.3. Dissipated Energy

In dynamic experiments, the entire experimental system satisfies the law of conservation of energy. The energy in the whole SHPB system is divided into four parts: incident energy ( U I ), transmission energy ( U T ), reflection energy ( U R ), and energy input on the specimen, which is also called absorption energy of specimen ( U S ):
U I t = A 0 C 0 E σ I 2 t d t = A 0 C 0 E ε I 2 t d t
U R t = A 0 C 0 E σ R 2 t d t = A 0 C 0 E ε R 2 t d t
U T t = A 0 C 0 E σ T 2 t d t = A 0 C 0 E ε T 2 t d t
where E ,   C 0 , and A 0 represent the elastic modulus, longitudinal wave velocity, and cross-sectional area of the incident bar (transmission bar), respectively. According to the law of conservation of energy, the energy ( U S ) absorbed by the specimen is:
U S = U I U R + U T
Previous studies indicated that the dissipated energy of the specimen accounts for about 95% of the energy input to the entire specimen [47]. Therefore, the energy absorbed by the specimen was used to approximate the dissipated energy ( U d ):
U d = U S
Figure 12 shows the variation in the dissipated energy of the specimen with the loading rate under different hydrostatic pressures and FTCs. It could be seen that under the same working conditions, the dissipated energy of the specimen showed an approximately linear increasing trend with the loading rate. When the number of FTCs was certain, the internal damage of the specimen could be considered to be approximately the same, and the increase in the loading rate made the specimen more severely damaged, so the energy required was greater.
An empirical formula was proposed to fit the dissipated energy of rock related to the loading rate, the number of freeze–thaw cycles, and the confining pressure:
U c d = U 0 d 1 α N N 0 1 + β ln 1 + P P 0 σ ˙ σ ˙ 0 μ
where σ ˙ is the loading rate; N is the number of freeze–thaw cycles; P is the hydrostatic confining pressure; U c d is the dissipated energy of the specimen when the strain rate is σ ˙ ; P 0 and N 0 are the reference hydrostatic pressure and reference freeze–thaw cycles, where the values are both 1; and U 0 d is the dissipated energy of the specimen when the strain rate is σ ˙ 0 . In this study, the value of the dissipated energy of the specimen under the loading rate of 500 GPa/s without hydrostatic pressure and freeze–thaw cycles was taken as U 0 d . α, β, and μ are the fitting parameters related to the number of freeze–thaw cycles, hydrostatic pressure, and loading rate, respectively. Table 2 shows the fitting parameters (α, β, μ) and coefficient of determination ( R 2 ). It could be seen that the coefficients of determination were all greater than 90%, so the fitting was reasonable, and the fitting curve is shown in Figure 12.
It should be noted here that when the hydrostatic pressure was 0 MPa, the change rate of dissipated energy under the conditions of 40 FTCs and 50 FTCs was obviously lower than that for other FTC numbers. It indicated that the internal damage of the specimens reached a large value after 40 FTCs, which desensitized the energy required for specimens to break. It could be analyzed from Table 2 that when the hydrostatic pressure was 0 MPa, parameter μ of the loading rate corresponding to 40 FTCs and 50 FTCs (0.835 and 0.922) was smaller than the correlation coefficient for 0 FTC (1.006). However, when the hydrostatic pressure was 2 MPa and 4 MPa, this pattern did not manifest. The reason was that the effect of hydrostatic pressure could offset a part of the damage to the specimens, so that the effect of loading rate on the dissipation energy of the specimen did not decrease. Under the effect of hydrostatic pressure, as the number of FTCs increased, the fitting parameter (β) of hydrostatic pressure decreased, indicating that FT weathering reduced the effect of hydrostatic pressure on dissipated energy.
Figure 13 shows the variation law of the dissipated energy with the number of FTCs when the loading rate was about 1000 GPa/s and 2000 GPa/s. At a certain loading rate, the dissipated energy decreased with the increase in FTCs. As FTC progressed, the specimen was subjected to the frost heave effect of pore water, and the internal damage gradually increased, which was reflected in the increase in pores and the development of cracks. It could be seen from the experimental results that this damage was close to linear. Under the same conditions, the specimen needed to absorb less energy to break. A linear fit was performed on the data, and the fitting results are displayed in Table 3:
U d = η N + γ
where N is the number of FTCs, U d is the dissipated energy, and η and γ are the fitting parameters. The slope, η , represents the rate of change of dissipated energy with N , and γ represents the dissipated energy when the number of FTC is 0.
Under the two loading rates, with the increase in hydrostatic pressure, the absolute value of the correlation coefficient (η) of FTC increased, which indicated that the hydrostatic pressure enhanced the effect of FTC on the dissipated energy of the specimen. The dissipated energy of the specimens subjected to hydrostatic pressure was higher than that of the specimen not subjected to hydrostatic pressure under the same conditions. Hydrostatic pressure can enhance the dynamic mechanical properties of rock, limit the deformation of rock, and reduce the damage of rock caused by the load, so that more energy can be stored in the rock. Therefore, the rock specimens needed to absorb more energy to break. It is worth noting that under the conditions of 0 FTCs and 1000 GPa/s, the hydrostatic pressure was increased from 0 MPa to 2 MPa, and the dissipated energy increment was 210.7%. Under the condition of 50 FTCs, the dissipated energy increment was 400.1%. The same trend could also be seen under the hydrostatic pressure of 2000 GPa/s. The dissipated energy increment showed an increasing trend with the increase in FTCs. It showed that the effect of hydrostatic pressure could effectively improve the dissipation energy of the specimen, and the improvement effect was more obvious for the specimen subjected to more freeze–thaw cycles.

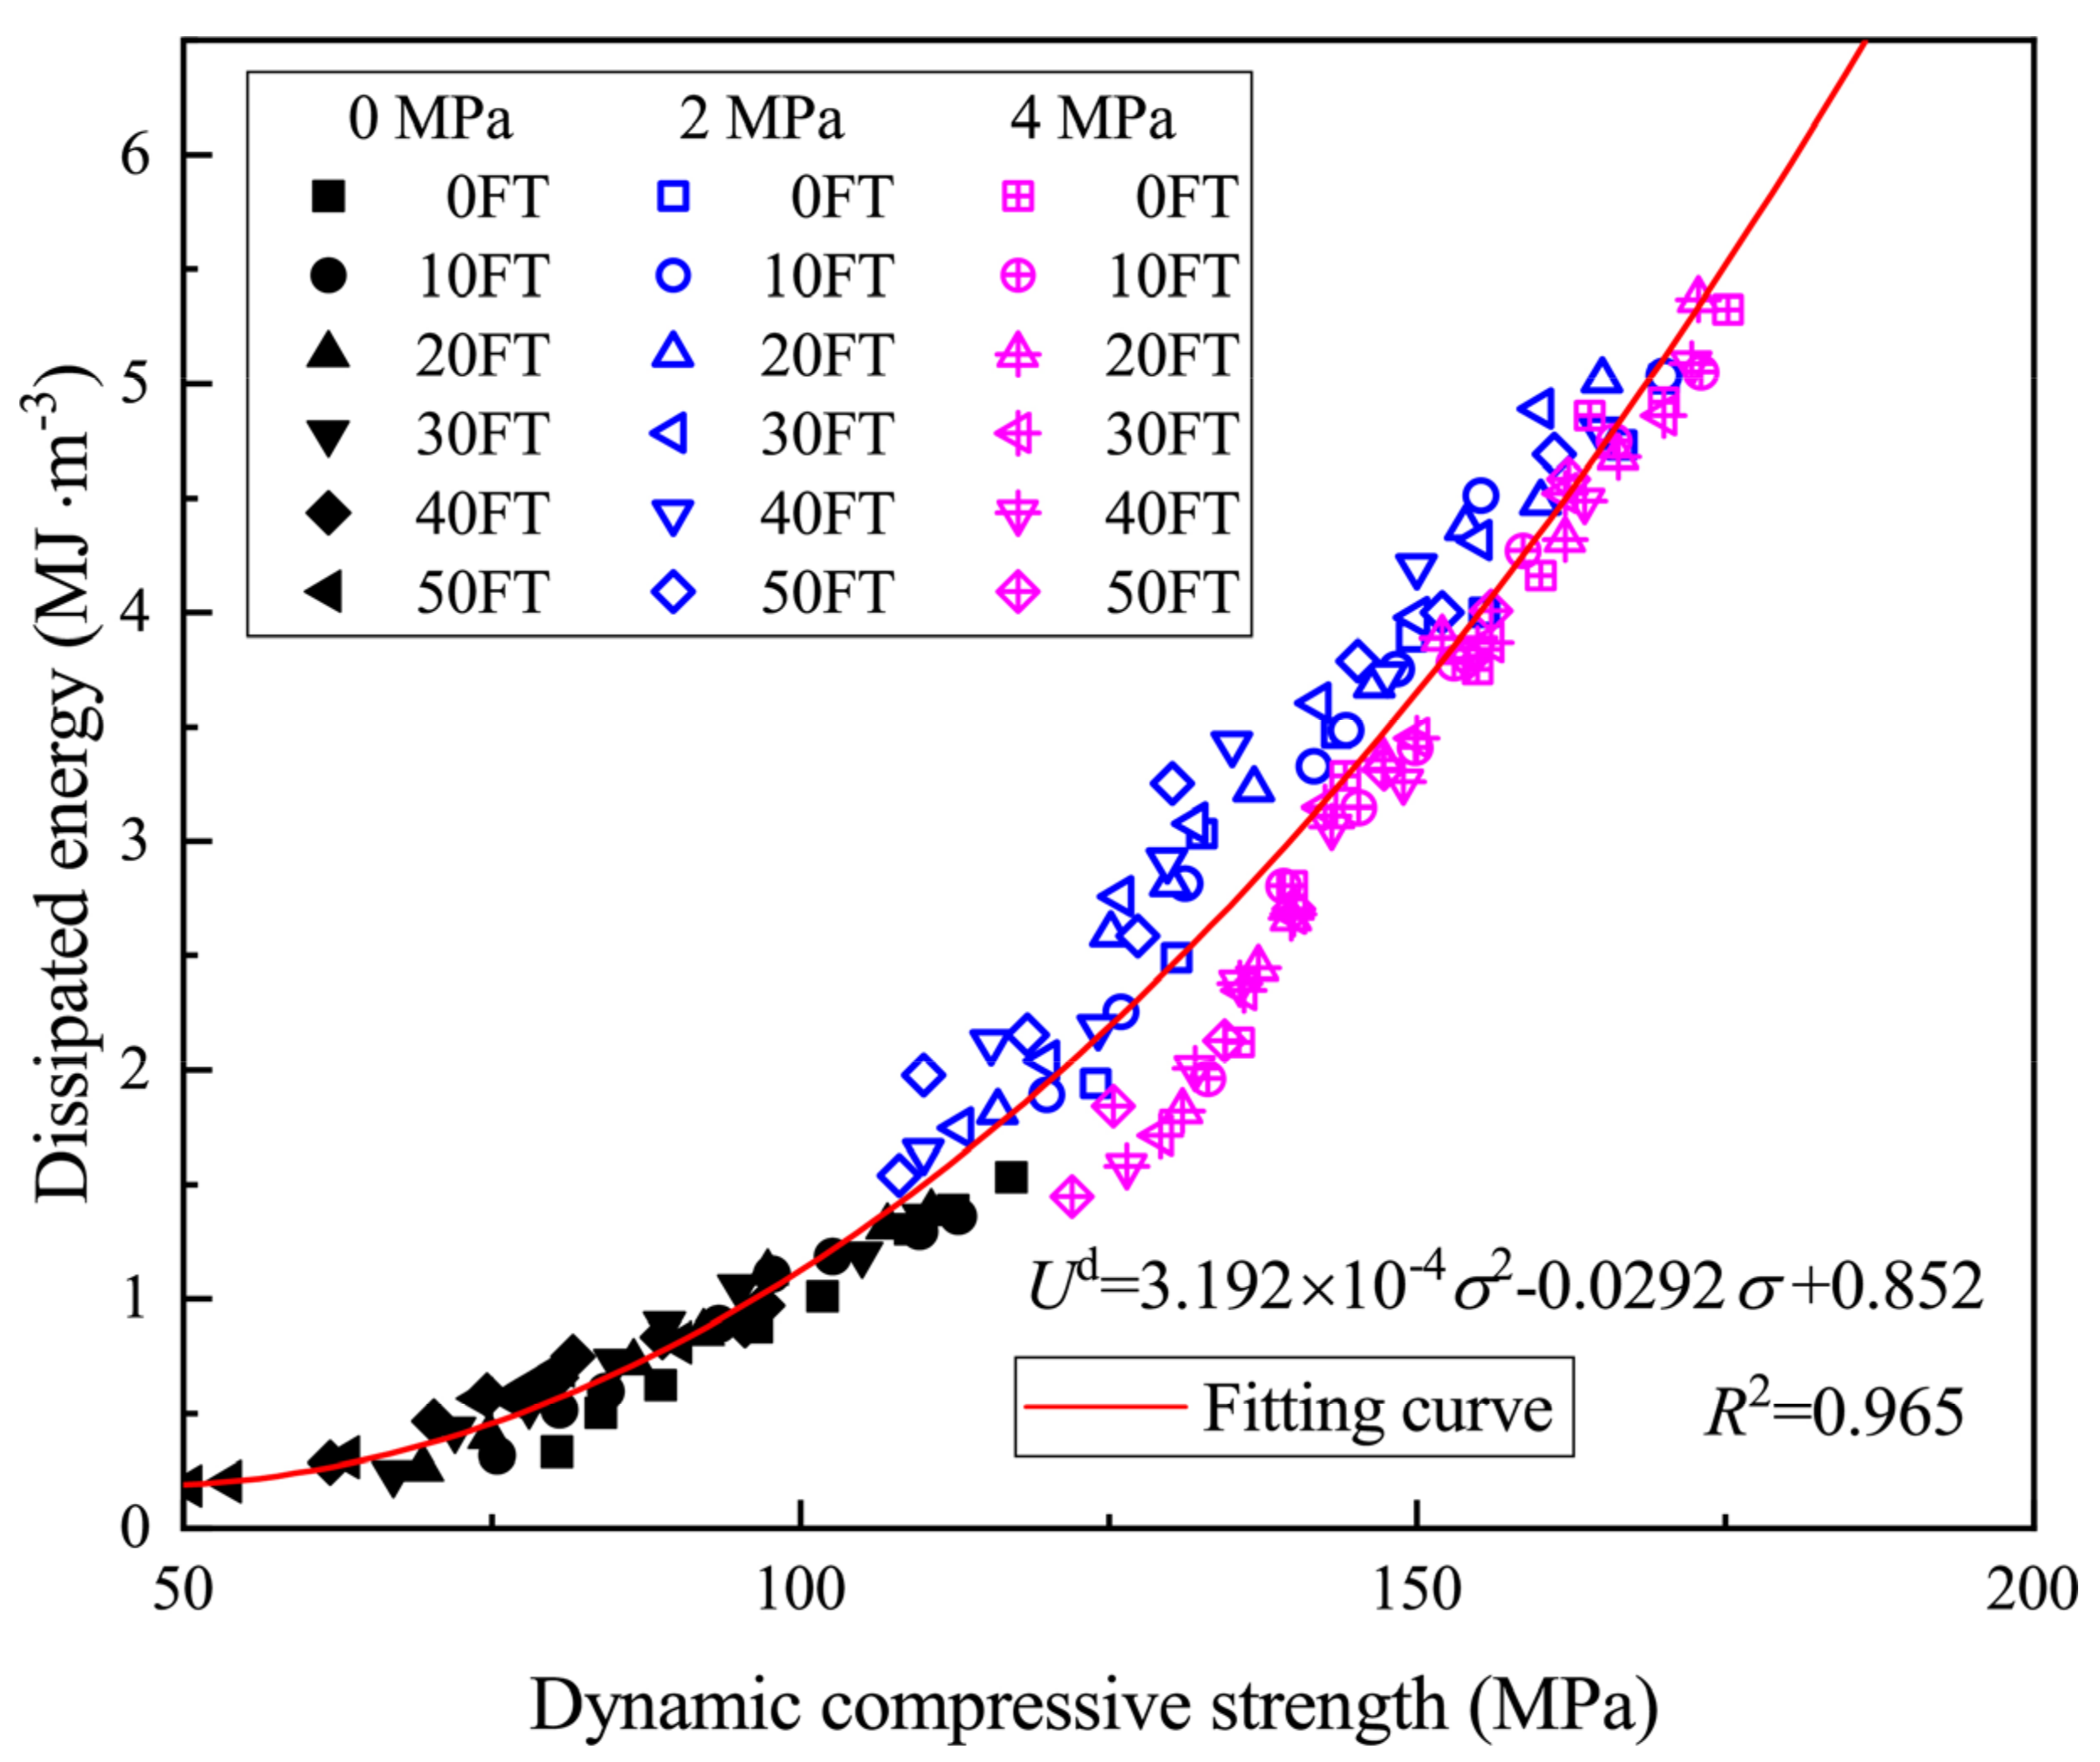
4.4. Dissipated Energy vs. Dynamic Compression Strength

Dynamic compression strength is an important parameter to describe the rock properties and is a key indicator of rock damage; rock fragmentation also directly effects the dissipation of energy. Therefore, the dynamic compression strength can be used to describe the energy dissipation of rock materials. As can be seen from Figure 14, the dissipated energy increased with the increase in dynamic compression strength and showed a certain trend. The following equation was obtained by fitting the data:
U d = 3.192 × 10 4 σ 2 0.0292 σ + 0.852
where U d is the dissipated energy and σ is dynamic compression strength.
The dissipated energy varied as a quadratic function of the dynamic compression strength, and the trend was almost independent of the number of FTCs, hydrostatic pressure, and loading rate. During the destruction process, the rock needs to continuously absorb energy for the formation and development of internal cracks. When the absorbed energy reaches a certain value, the fracture throughs, and the rock is damaged, the energy dissipated; at this time, the rock reaches dynamic compression strength. For rock with certain internal damage and external force, the energy required to achieve damage was determined, so there was a correspondence between the energy and dynamic compression strength of rock.

4.5. Damage Characteristics Analysis

Studying the characteristics of a specimen after damage is important for the analysis of specimens subjected to FTC and external loading. For the specimens that were not subjected to hydrostatic pressure, the degree of damage was severe after loading, and the block sizes of the damaged specimens were well defined, so the average fragment size could be used as a relevant parameter to quantify the damage characteristics of the specimens. In the case of specimens subjected to hydrostatic pressure, the appearance of the damaged specimen remained intact due to the constraints of hydrostatic pressure, and the CT value could be used to quantify the internal damage of the specimens.

4.5.1. Average Fragment Size

A fragmentation analysis was carried out by sieving the fragmented rocks. The sieving device included nine sieves of 40 mm, 20 mm, 10 mm, 5 mm, 2 mm, 1 mm, 0.5 mm, 0.25 mm, and 0.075 mm. The average fragment size of the specimens after damage was indicated as δ , and the equation used is as follows:
δ = 1 i δ i = 1 i η i d i
where i is the number of the sieve (i = 1, 2, 3, …,10), η i is the ratio of the mass of fragments to the initial mass of rock for each sieve, and d i is the average value of the maximum and minimum particle sizes for each sieve.
The average fragment size reflected the size level of the specimen blocks after damage. A larger average fragment size indicated a larger proportion of large fragments of the specimen and a more complete specimen after damage. A smaller average fragment size indicated a larger proportion of small fragments of the specimen and a greater degree of damage to the specimen.
The calculated statistics for the average fragment size of specimens subjected to different FTCs and certain loading rates (1000 GPa/s and 2000 GPa/s) are shown in Figure 15. It could be seen that the average fragment size of specimens decreased with the increase in the number of FTCs under the same approximate loading rate conditions. After 40 FTCs, the average fragment size decreased rapidly, indicating that after 40 FTCs, the internal damage of the specimen increased dramatically, leading to a greater degree of fragmentation. As the loading rate increased, the average fragment size tended to decrease, which indicated that the sensitivity of the fragment size of sandstone specimens to the number of FTCs after damage was stronger at lower loading rates and relatively weaker at higher loading rates.

4.5.2. CT Value

CT (Computed Tomography) scanning is a technique that can realize the analysis of the internal construction of a specimen without damaging it. The principle is to reconstruct the internal construction according to the different transmission rates of different densities of matter to X-rays. In this paper, the CT value was used to characterize the relative value of the attenuation coefficient of the specimen to X-rays and was calculated as follows:
C T = μ c μ w μ w × 1000
where CT is the CT value of the specimen; μ c is the attenuation coefficient of the specimen to X-rays, which can be measured using CT scanning; and μ w is the attenuation coefficient of distilled water to X-rays.
The specimens that were not loaded were subjected to FTC and the CT values were measured as a control group. Figure 16 shows the CT value of the specimen subjected to different FTCs and the decay rate of the CT value vs. FTCs for the same approximate loading rate (1000 GPa/s). The CT value of the specimen decreased as the number of FTCs increased, indicating that the ability of the specimen to transmit X-rays was diminished. This is because the attenuation capacity of air for X-rays is lower than that of rock materials, and the more fractures are in the rock, the smaller the CT value is. With the increase in the number of FTCs under the effect of a similar loading rate, the volume of pores and fractures inside the rock specimen increased, and the degree of damage became more intense. It could be seen that the decay rate of the CT value was almost constant after 40 FTCs, indicating that the internal damage of the specimen reached a large value after 40 FTCs, which was consistent with the dissipated energy analysis reported above. The decay rate of the CT value for the specimens at 4 MPa was lower than that at 2 MPa, indicating that the effect of hydrostatic pressure could eliminate a part of the internal damage of the specimen and helped to improve the mechanical properties of the specimen.

5. Conclusions

In this study, the dynamic compression strength and energy changes of saturated sandstone after FTC were systematically studied under different hydrostatic confining stresses. First, 0, 10, 20, 30, 40, and 50 FTC processing was performed on green sandstone specimens. Then, dynamic compression tests on the specimens were performed with different loading rates under the hydrostatic pressures of 0 MPa, 2 MPa, and 4 MPa. By analyzing the stress–strain curve, dynamic compression strength, dispersion energy, and damage characteristics, the main conclusions were as follows:
(1)
The dynamic failure process after FTC had obvious stages, and its stress–strain curve could be roughly divided into four stages: compression of fissures, linear deformation of rock, yield of rock, and failure of rock. Under different working conditions, the rock destruction phases were different. Under the effect of high loading rate and hydrostatic pressure, the stress–strain curve rebounded after a relatively gentle stage. This phenomenon became more obvious as the loading rate increased;
(2)
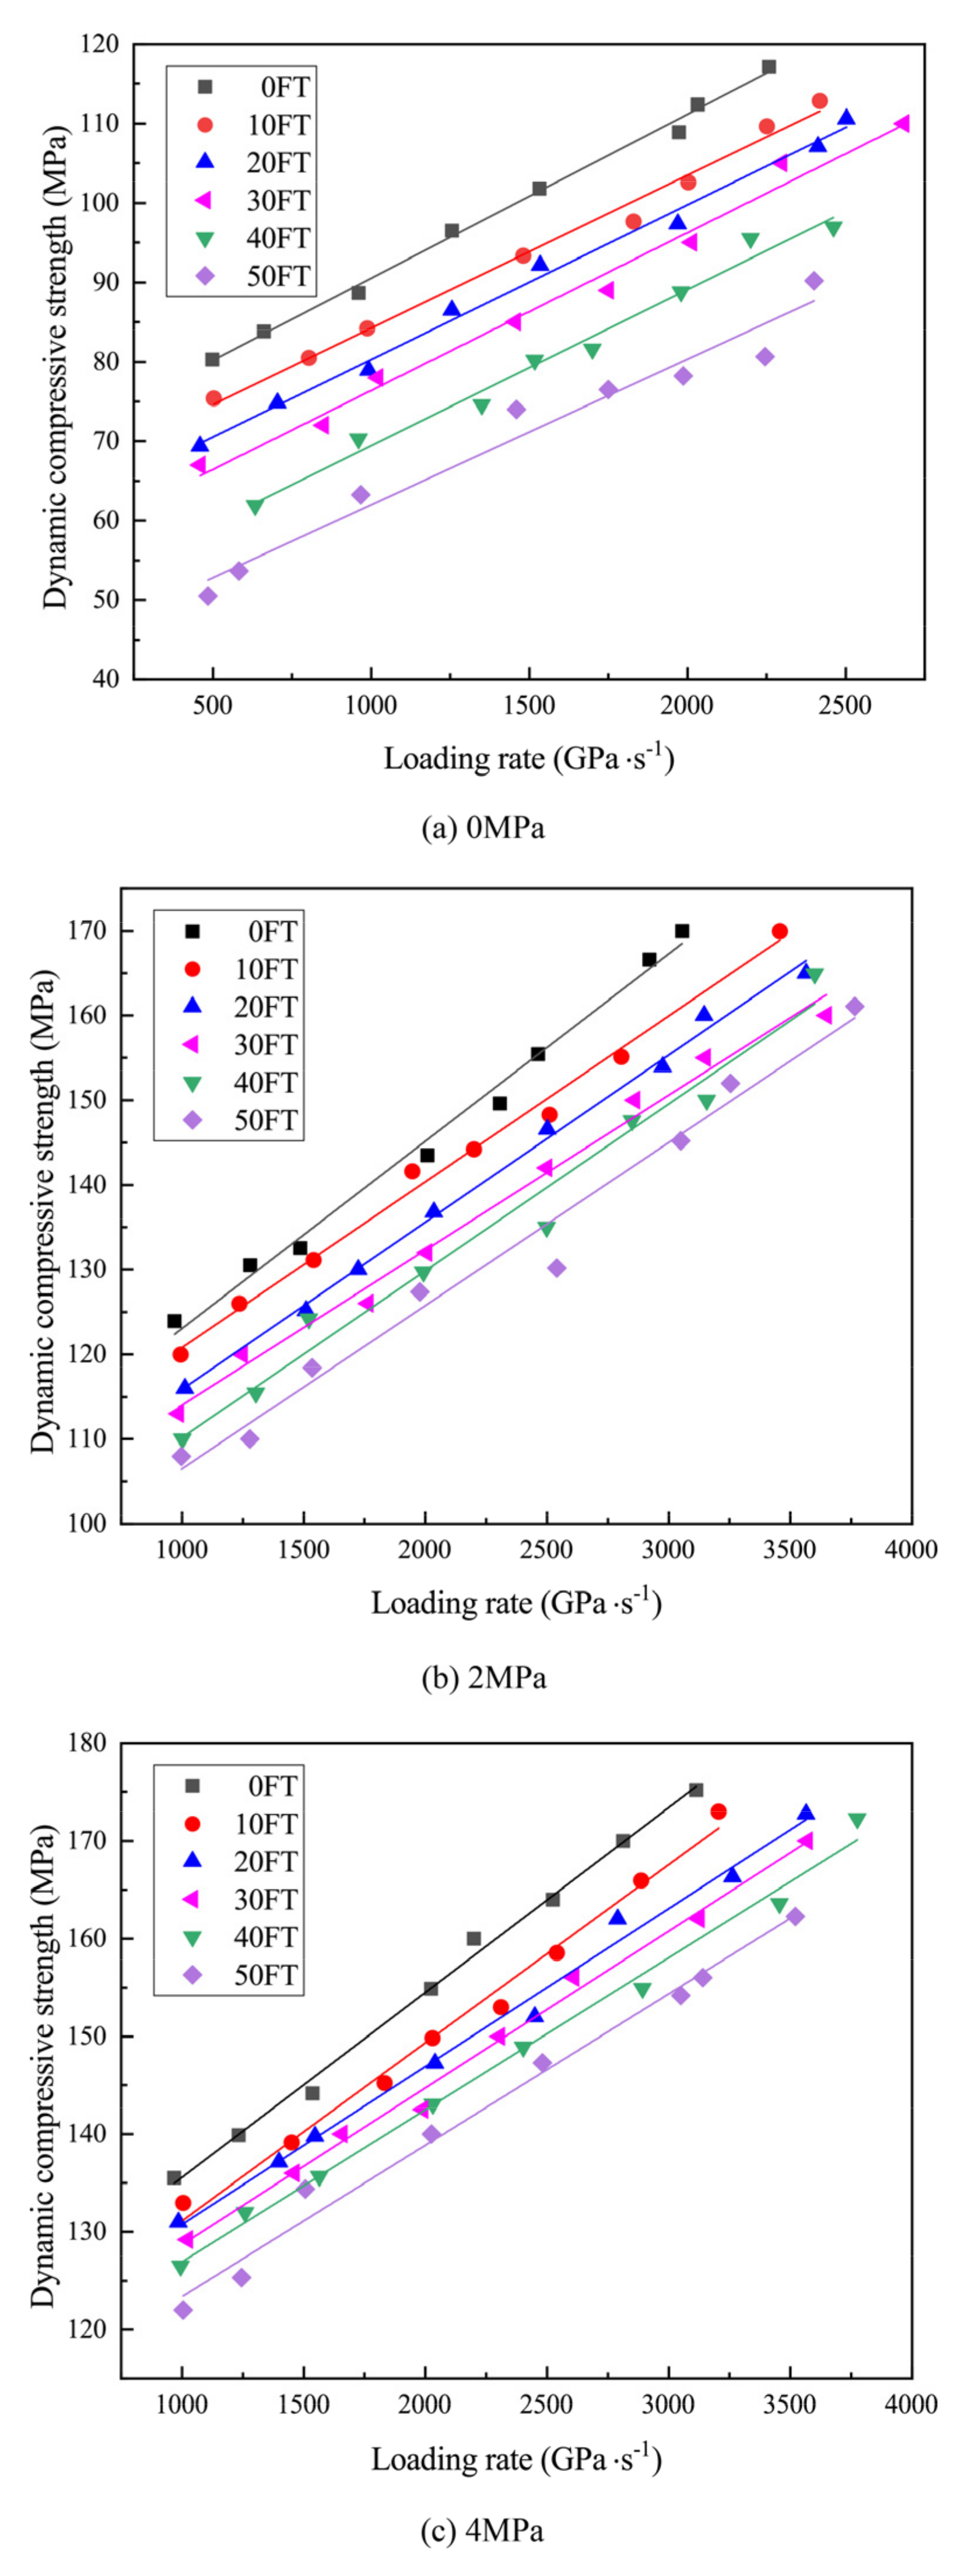
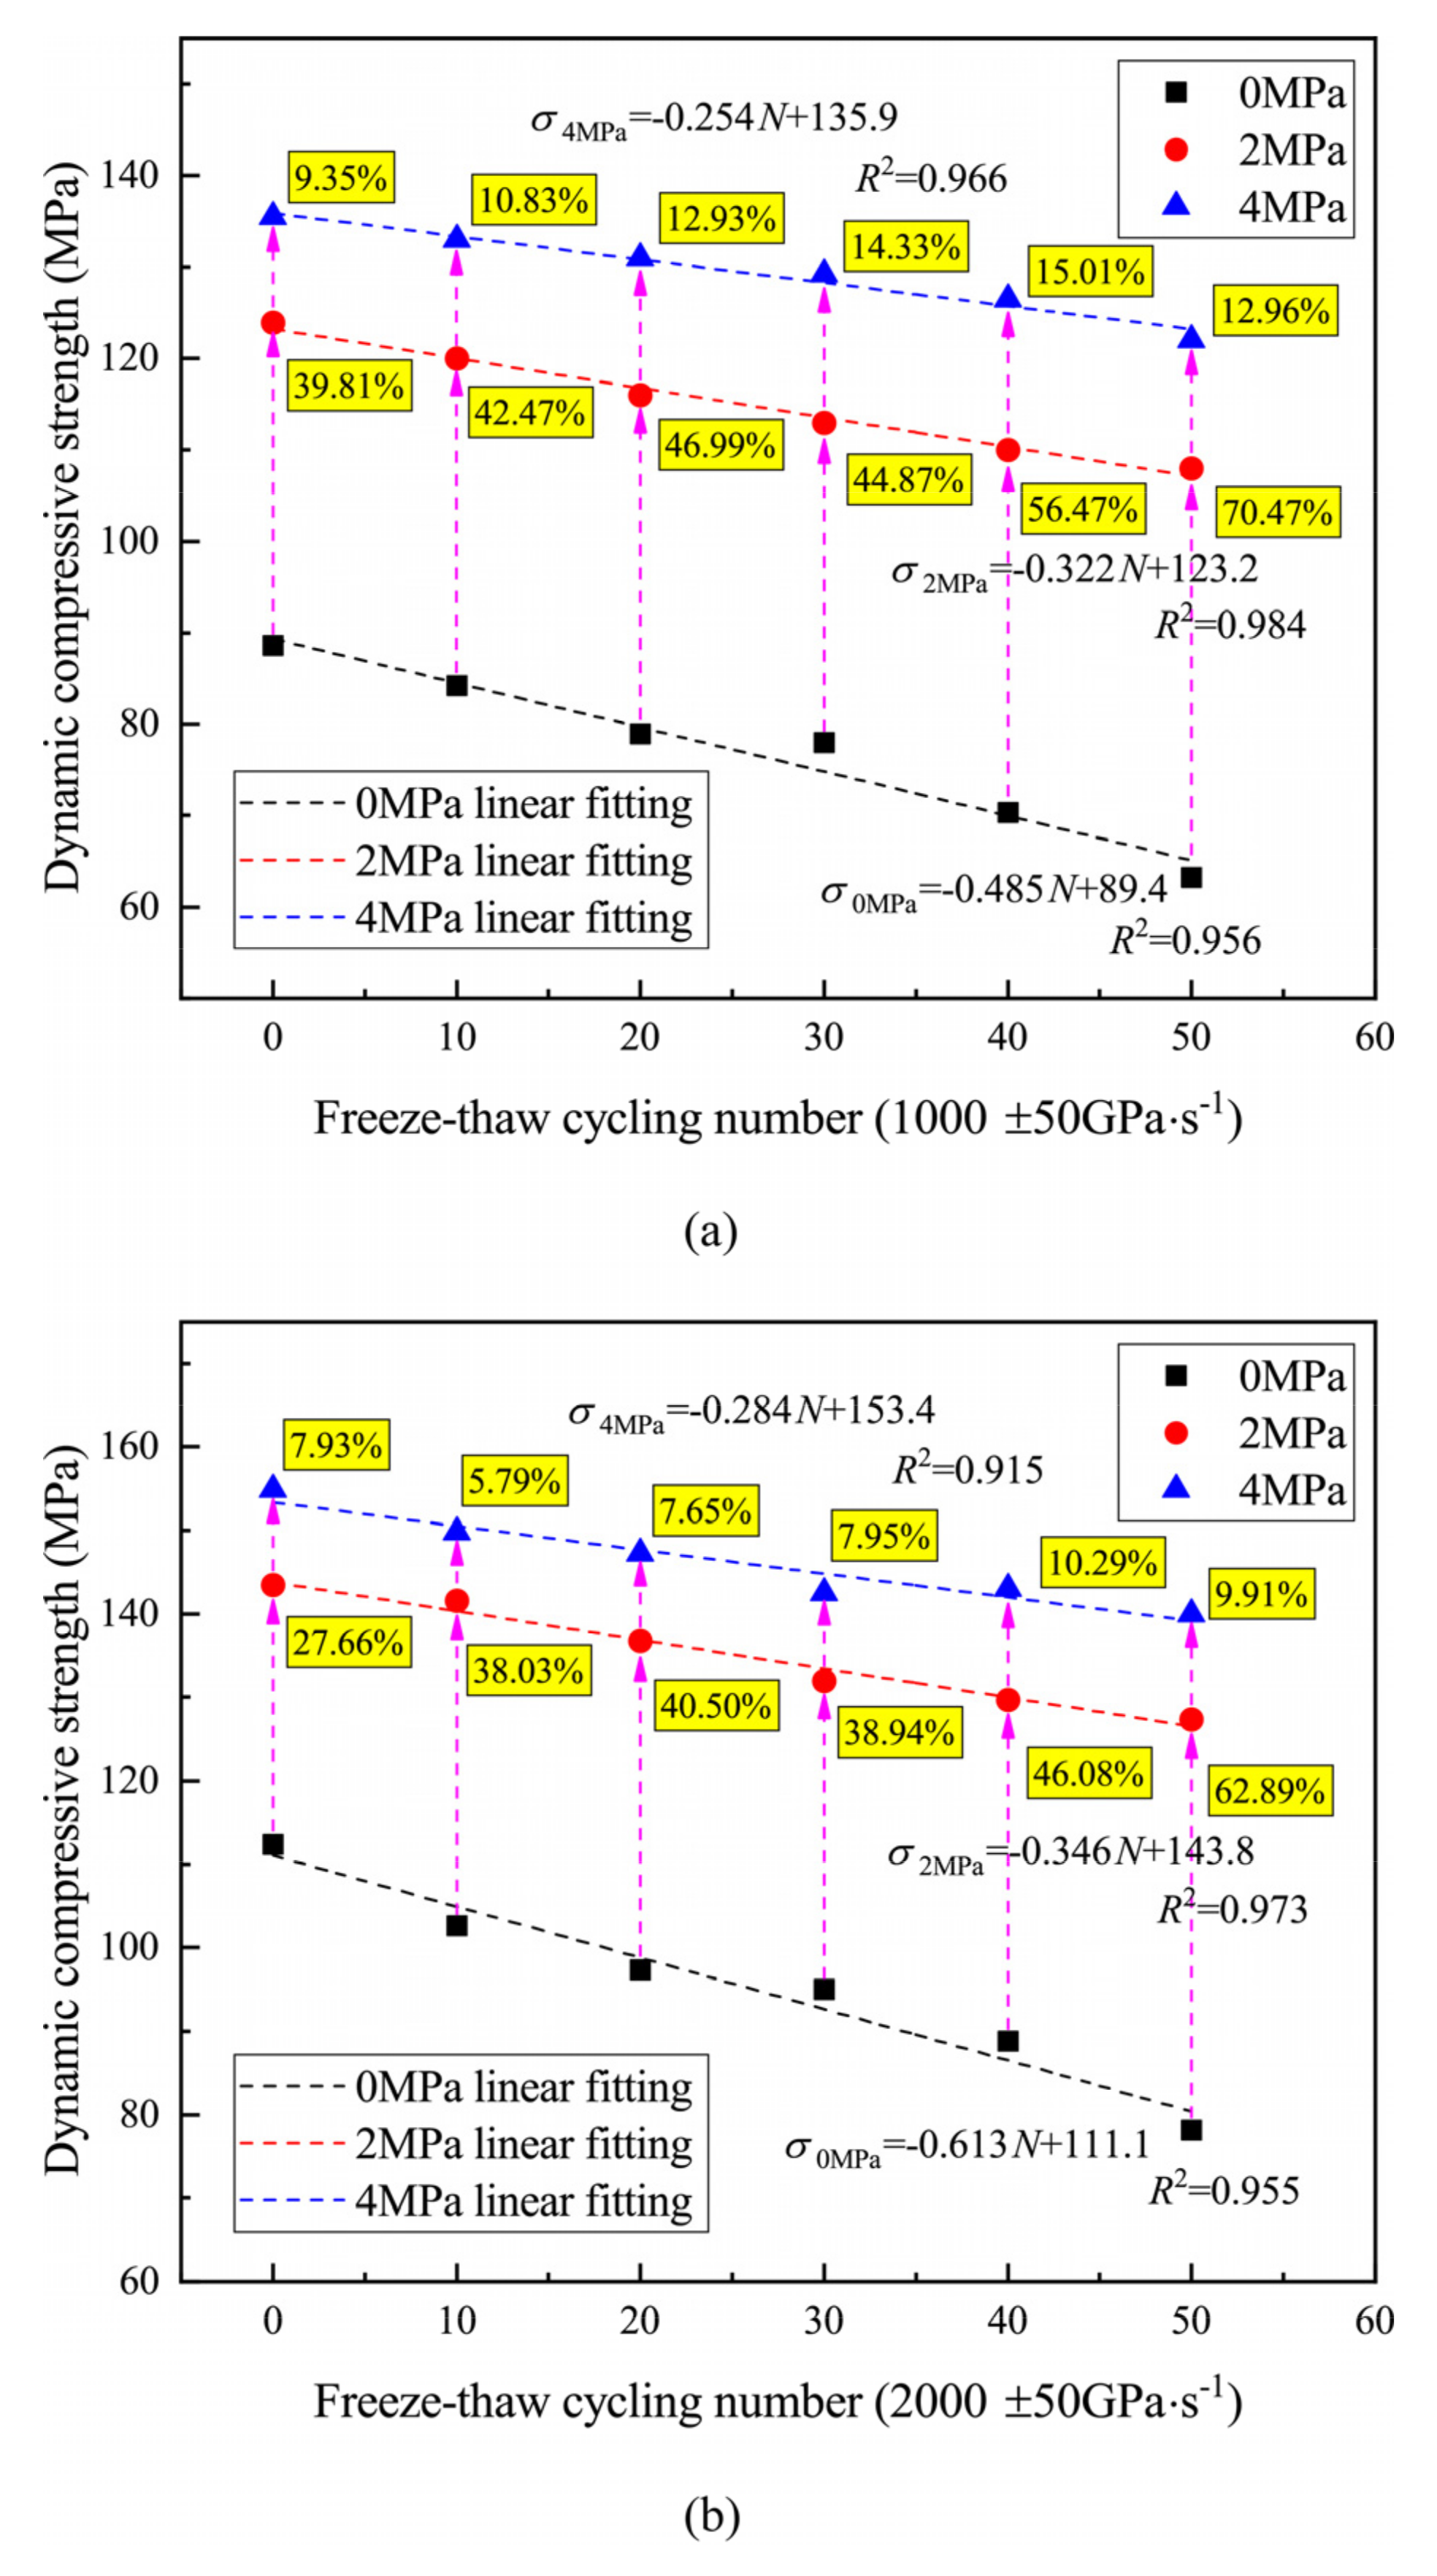
The dynamic compression strength of rock increased linearly with the increase in the loading rate and decreased with the increase in FTCs. Under the same conditions of loading rate and FTC, the hydrostatic pressure could enhance dynamic compression strength, and this enhancement effect increased with the increase in the number of FTCs;
(3)
The dissipated energy of sandstone specimens was affected significantly by FTC, hydrostatic pressure, and loading rate. The dissipated energy of sandstone specimens was negatively related to the number of FTCs, positively related to hydrostatic pressure, and positively related to the loading rate. An empirical equation of dissipated energy with freeze–thaw cycling, hydrostatic pressure, and loading rate was proposed, and the fitting parameters were provided. After 40 FT cycles, the internal damage of the specimens reached a larger value, which desensitized the energy required for specimens to reach breakage to the loading rate, but the sensitivity did not decrease under the effect of hydrostatic pressure. Freeze–thaw weathering reduced the effect of hydrostatic pressure on dissipated energy, and hydrostatic pressure enhanced the effect of FTC on the dissipated energy of the specimens;
(4)
The dissipated energy of the specimen corresponded to the dynamic compression strength according to a quadratic function, and the correspondence was almost independent of the FTCs, loading rate, and hydrostatic pressure;
(5)
The average fragment size after damage decreased with the increase in FTCs for specimens that were not subjected to hydrostatic pressure. For the specimens subjected to hydrostatic pressure, the appearance remained intact after loading, and the CT value decreased with the increase in the number of FTCs. Both phenomena indicated that FTC exacerbated the internal damage of rock. It was also found that 40 FTCs was an important number of FTCs for green sandstone whereby the internal damage reached a large value, which was consistent with the result given by the energy analysis.

Author Contributions

Methodology, B.W.; writing and experiments, L.Y.; resources, Y.M. and Y.S.; data curation, J.L. and J.S. All authors have read and agreed to the published version of the manuscript.

Funding

Natural Science Foundation of Tianjin City (No. 21JCZXJC00040).

Data Availability Statement

Data are available upon request due to privacy restrictions.

Conflicts of Interest

The authors declare no conflict of interest.

References

  1. Park, J.; Hyun, C.U.; Park, H.D. Changes in microstructure and physical properties of rocks caused by artificial freeze-thaw action. Bull. Eng. Geol. Environ. 2015, 74, 555–565. [Google Scholar] [CrossRef]
  2. Deprez, M.; De Kock, T.; De Schutter, G.; Cnudde, V. A review on freeze-thaw action and weathering of rocks. Earth-Sci. Rev. 2020, 203, 103143. [Google Scholar] [CrossRef]
  3. Eppes, M.C.; Keanini, R. Mechanical weathering and rock erosion by climate-dependent subcritical cracking. Rev. Geophys. 2017, 55, 470–508. [Google Scholar] [CrossRef]
  4. Liu, W.W.; Feng, Q.; Wang, C.X.; Lu, C.K.; Xu, Z.Z.; Li, W.T. Analytical solution for three-dimensional radial heat transfer in a cold-region tunnel. Cold Reg. Sci. Technol. 2019, 164, 102787. [Google Scholar] [CrossRef]
  5. Luo, X.D.; Jiang, N.; Fan, X.Y.; Mei, N.F.; Luo, H. Effects of freeze-thaw on the determination and application of parameters of slope rock mass in cold regions. Cold Reg. Sci. Technol. 2015, 110, 32–37. [Google Scholar] [CrossRef]
  6. Pudasaini, S.P.; Krautblatter, M. A two-phase mechanical model for rock-ice avalanches. J. Geophys. Res.-Earth Surf. 2014, 119, 2272–2290. [Google Scholar] [CrossRef] [Green Version]
  7. Huang, S.B.; Liu, Y.Z.; Guo, Y.L.; Zhang, Z.L.; Cai, Y.T. Strength and failure characteristics of rock-like material containing single crack under freeze-thaw and uniaxial compression. Cold Reg. Sci. Technol. 2019, 162, 1–10. [Google Scholar] [CrossRef]
  8. Khanlari, G.; Sahamieh, R.Z.; Abdilor, Y. The effect of freeze-thaw cycles on physical and mechanical properties of Upper Red Formation sandstones, central part of Iran. Arab. J. Geosci. 2015, 8, 5991–6001. [Google Scholar] [CrossRef]
  9. Walbert, C.; Eslami, J.; Beaucour, A.L.; Bourges, A.; Noumowe, A. Evolution of the mechanical behaviour of limestone subjected to freeze-thaw cycles. Environ. Earth Sci. 2015, 74, 6339–6351. [Google Scholar] [CrossRef]
  10. Yavuz, H. Effect of freeze-thaw and thermal shock weathering on the physical and mechanical properties of an andesite stone. Bull. Eng. Geol. Environ. 2011, 70, 187–192. [Google Scholar] [CrossRef]
  11. Park, C.; Synn, J.H.; Shin, H.S.; Cheon, D.S.; Lim, H.D.; Jeon, S.W. An experimental study on the thermal characteristics of rock at low temperatures. Int. J. Rock Mech. Min. Sci. 2004, 41, 367–368. [Google Scholar] [CrossRef]
  12. Thomachot, C.; Matsuoka, N. Dilation of building materials submitted to frost action. In Proceedings of the General Assembly of the European-Union-of-Geosciences, Vienna, Austria, 24–29 April 2005; p. 167. [Google Scholar]
  13. Tan, X.J.; Chen, W.Z.; Yang, J.P.; Cao, J.J. Laboratory investigations on the mechanical properties degradation of granite under freeze-thaw cycles. Cold Reg. Sci. Technol. 2011, 68, 130–138. [Google Scholar] [CrossRef]
  14. Del Rio, L.M.; Lopez, F.; Esteban, F.J.; Tejado, J.J.; Mota, M.I.; Gonzalez, I.; Ramos, A.; San Emeterio, J.L. Ultrasonic study of alteration processes in granites caused by freezing and thawing. In Proceedings of the IEEE International Ultrasonics Symposium, Rotterdam, The Netherlands, 18–21 September 2005; pp. 419–422. [Google Scholar]
  15. Martinez-Martinez, J.; Benavente, D.; Gomez-Heras, M.; Marco-Castano, L.; Garcia-del-Cura, M.A. Non-linear decay of building stones during freeze-thaw weathering processes. Constr. Build. Mater. 2013, 38, 443–454. [Google Scholar] [CrossRef]
  16. Kodama, J.; Goto, T.; Fujii, Y.; Hagan, P. The effects of water content, temperature and loading rate on strength and failure process of frozen rocks. Int. J. Rock Mech. Min. Sci. 2013, 62, 1–13. [Google Scholar] [CrossRef]
  17. Li, X.; Lu, Y.; Weng, Y. Research on Damage Model of Single Jointed Rock Masses under Coupling Action of Freeze-Thaw and Loading. Chin. J. Rock Mech. Eng. 2013, 32, 2307–2315. [Google Scholar]
  18. Nicholson, D.T.; Nicholson, F.H. Physical deterioration of sedimentary rocks subjected to experimental freeze-thaw weathering. Earth Surf. Process. Landf. 2000, 25, 1295–1307. [Google Scholar] [CrossRef]
  19. Yamabe, T.; Neaupane, K.M. Determination of some thermo-mechanical properties of Sirahama sandstone under subzero temperature condition. Int. J. Rock Mech. Min. Sci. 2001, 38, 1029–1034. [Google Scholar] [CrossRef]
  20. Jamshidi, A.; Nikudel, M.R.; Khamehchiyan, M.; Zalooli, A. Statistical Models for Predicting the Mechanical Properties of Travertine Building Stones After Freeze-Thaw Cycles. In Proceedings of the 12th International IAEG Congress, Torino, Italy, 15–19 September 2014; pp. 477–481. [Google Scholar]
  21. Wang, Y.; Song, Z.Y.; Mao, T.Q.; Zhu, C. Macro-Meso Fracture and Instability Behaviors of Hollow-Cylinder Granite Containing Fissures Subjected to Freeze-Thaw-Fatigue Loads. Rock Mech. Rock Eng. 2022, 55, 4051–4071. [Google Scholar] [CrossRef]
  22. Chen, T.C.; Yeung, M.R.; Mori, N. Effect of water saturation on deterioration of welded tuff due to freeze-thaw action. Cold Reg. Sci. Technol. 2004, 38, 127–136. [Google Scholar] [CrossRef]
  23. Bayram, F. Predicting mechanical strength loss of natural stones after freeze-thaw in cold regions. Cold Reg. Sci. Technol. 2012, 83–84, 98–102. [Google Scholar] [CrossRef]
  24. Jamshidi, A. Predicting the Strength of Granitic Stones after Freeze-Thaw Cycles: Considering the Petrographic Characteristics and a New Approach Using Petro-Mechanical Parameter. Rock Mech. Rock Eng. 2021, 54, 2829–2841. [Google Scholar] [CrossRef]
  25. Ren, J.X.; Yun, M.C.; Cao, X.T.; Zhang, K.; Liang, Y.; Chen, X. Study on the mechanical properties of saturated red sandstone under freeze-thaw conditions. Environ. Earth Sci. 2022, 81, 376. [Google Scholar] [CrossRef]
  26. Xia, K.; Yao, W. Dynamic rock tests using split Hopkinson (Kolsky) bar system—A review. J. Rock Mech. Geotech. Eng. 2015, 7, 27–59. [Google Scholar] [CrossRef] [Green Version]
  27. Zhang, Q.B.; Zhao, J. Determination of mechanical properties and full-field strain measurements of rock material under dynamic loads. Int. J. Rock Mech. Min. Sci. 2013, 60, 423–439. [Google Scholar] [CrossRef]
  28. Dai, F.; Xia, K.W. Loading Rate Dependence of Tensile Strength Anisotropy of Barre Granite. Pure Appl. Geophys. 2010, 167, 1419–1432. [Google Scholar] [CrossRef]
  29. Ma, Q.Y.; Ma, D.D.; Yao, Z.M. Influence of freeze-thaw cycles on dynamic compressive strength and energy distribution of soft rock specimen. Cold Reg. Sci. Technol. 2018, 153, 10–17. [Google Scholar] [CrossRef]
  30. Wang, P.; Xu, J.Y.; Liu, S.; Liu, S.H.; Wang, H.Y. A prediction model for the dynamic mechanical degradation of sedimentary rock after a long-term freeze-thaw weathering: Considering the strain-rate effect. Cold Reg. Sci. Technol. 2016, 131, 16–23. [Google Scholar] [CrossRef] [Green Version]
  31. Weng, L.; Wu, Z.J.; Liu, Q.S. Dynamic Mechanical Properties of Dry and Water-Saturated Siltstones Under Sub-Zero Temperatures. Rock Mech. Rock Eng. 2020, 53, 4381–4401. [Google Scholar] [CrossRef]
  32. Zhou, K.P.; Li, B.; Li, J.L.; Deng, H.W.; Bin, F. Microscopic damage and dynamic mechanical properties of rock under freeze-thaw environment. Trans. Nonferrous Met. Soc. China 2015, 25, 1254–1261. [Google Scholar] [CrossRef]
  33. Xie, H.; Ju, Y.; Li, L. Criteria for Strength and Structural Failure of Rocks Based on Energy Dissipation and Energy Release Principles. Chin. J. Rock Mech. Eng. 2005, 24, 3003–3010. [Google Scholar]
  34. Khazaei, C.; Hazzard, J.; Chalaturnyk, R. Damage quantification of intact rocks using acoustic emission energies recorded during uniaxial compression test and discrete element modeling. Comput. Geotech. 2015, 67, 94–102. [Google Scholar] [CrossRef]
  35. Wang, P.; Xu, J.Y.; Fang, X.Y.; Wang, P.X. Energy dissipation and damage evolution analyses for the dynamic compression failure process of red-sandstone after freeze-thaw cycles. Eng. Geol. 2017, 221, 104–113. [Google Scholar] [CrossRef]
  36. Feng, Q.; Jin, J.C.; Zhang, S.; Liu, W.W.; Yang, X.X.; Li, W.T. Study on a Damage Model and Uniaxial Compression Simulation Method of Frozen-Thawed Rock. Rock Mech. Rock Eng. 2022, 55, 187–211. [Google Scholar] [CrossRef]
  37. Lundberg, B. Split Hopkinson Bar Study of Energy-Absorption in Dynamic Rock Fragmentation. Int. J. Rock Mech. Min. Sci. 1976, 13, 187–197. [Google Scholar] [CrossRef]
  38. Li, X.B.; Lok, T.S.; Zhao, J. Dynamic characteristics of granite subjected to intermediate loading rate. Rock Mech. Rock Eng. 2005, 38, 21–39. [Google Scholar] [CrossRef]
  39. Deng, H.W.; Yu, S.T.; Deng, J.R.; Ke, B.; Bin, F. Experimental Investigation on Energy Mechanism of Freezing-Thawing Treated Sandstone under Uniaxial Static Compression. Ksce J. Civ. Eng. 2019, 23, 2074–2082. [Google Scholar] [CrossRef]
  40. Gong, F.Q.; Si, X.F.; Li, X.B.; Wang, S.Y. Dynamic triaxial compression tests on sandstone at high strain rates and low confining pressures with split Hopkinson pressure bar. Int. J. Rock Mech. Min. Sci. 2019, 113, 211–219. [Google Scholar] [CrossRef]
  41. Wu, B.; Xia, K. An experimental study of dynamic tensile failure of rocks subjected to hydrostatic confinement. In Proceedings of the 2nd International Conference on Rock Dynamics and Applications (RocDyn), Suzhou, China, 18–19 May 2016; pp. 197–202. [Google Scholar]
  42. Xu, Y.; Yao, W.; Xia, K.W.; Ghaffari, H.O. Experimental Study of the Dynamic Shear Response of Rocks Using a Modified Punch Shear Method. Rock Mech. Rock Eng. 2019, 52, 2523–2534. [Google Scholar] [CrossRef]
  43. Zhou, Y.X.; Xia, K.; Li, X.B.; Li, H.B.; Ma, G.W.; Zhao, J.; Zhou, Z.L.; Dai, F. Suggested methods for determining the dynamic strength parameters and mode-I fracture toughness of rock materials. Int. J. Rock Mech. Min. Sci. 2012, 49, 105–112. [Google Scholar] [CrossRef]
  44. Xu, Y.; Chen, B.Q.; Wu, B.B.; Chen, Z.; Yang, L.; Li, P.F. Influence of freeze-thaw cycling on the dynamic compressive failure of rocks subjected to hydrostatic pressure. Bull. Eng. Geol. Environ. 2022, 81, 276. [Google Scholar] [CrossRef]
  45. Song, B.; Chen, W. Loading and unloading split Hopkinson pressure bar pulse-shaping techniques for dynamic hysteretic loops. Exp. Mech. 2004, 44, 622–627. [Google Scholar] [CrossRef]
  46. Rong, C.; FangYun, L.U.; YuLiang, L.I.N.; JinGui, Q.I.N. Investigation of the Pre-fixed Gap in Single-Pulse Loading Technique of Hopkinson Pressure Bars. Chin. J. High Press. Phys. 2008, 22, 187–191. [Google Scholar]
  47. Ping, Q.; Luo, X.; Ma, Q.Y.; Yuan, P. Broken energy dissipation characteristics of sandstone specimens under impact loads. Chin. J. Rock Mech. Eng. 2015, 34, 4197–4203. (In Chinese) [Google Scholar] [CrossRef]
Figure 1. Schematic diagram of the mineral composition of green sandstone.
Minerals 12 01331 g001
Figure 2. Photograph of disc specimens.
Minerals 12 01331 g002
Figure 3. Temperature control curve of the freeze–thaw cycling process.
Minerals 12 01331 g003
Figure 4. Schematic diagram of SHPB.
Minerals 12 01331 g004
Figure 5. Stress balance verification.
Minerals 12 01331 g005
Figure 6. Calculation principle of loading rate.
Minerals 12 01331 g006
Figure 7. Schematic diagram of single-loading technology.
Minerals 12 01331 g007
Figure 8. Dynamic compressive stress–strain curves of the specimen under different working conditions: (a) 0 FTC and 0 MPa; (b) 0 FTC and 2 MPa.
Minerals 12 01331 g008
Figure 9. Schematic diagram of stress–strain curve and schematic diagrams of different macroscopic failure stages of the specimens.
Minerals 12 01331 g009
Figure 10. Dynamic compressive strength of FT cycling-treated specimens subjected to different hydrostatic pressures: (a) 0 MPa; (b) 2 MPa; and (c) 4 MPa.
Minerals 12 01331 g010
Figure 11. Dynamic compressive strength varied with freeze–thaw cycling under a certain loading rate (1000 GPa/s and 2000 GPa/s) and different hydrostatic pressures.
Minerals 12 01331 g011
Figure 12. Dissipated energy of specimen and fitting curves of FT cycling-treated specimen subjected to different hydrostatic pressures: (a) 0 MPa; (b) 2 MPa; and (c) 4 MPa.
Minerals 12 01331 g012
Figure 13. Dissipated energy varied with freeze–thaw cycling under a certain loading rate (1000 GPa/s and 2000 GPa/s) and different hydrostatic pressures.
Minerals 12 01331 g013
Figure 14. Dissipated energy vs. dynamic compression strength.
Minerals 12 01331 g014
Figure 15. Dissipated energy vs. dynamic compression strength.
Minerals 12 01331 g015
Figure 16. The CT value of specimen and decay rate of the CT value vs. different FTCs.
Minerals 12 01331 g016
Table 1. Fitting parameters (k, b) and coefficient of determination (R2).
Loading Rate
(GP/s)
Hydrostatic
Pressure (MPa)
k b R 2
1000 ± 500−0.48589.40.956
2−0.322123.20.984
4−0.254135.90.966
2000 ± 500−0.613111.10.955
2−0.346143.80.973
4−0.284153.40.915
Table 2. Fitting parameters (α, β, and μ) and coefficient of determination (R2).
Confining
Pressure (MPa)
FT Cycles α β μ R 2
000.000502.01.0060.994
100.000612.00.9370.997
200.006542.00.9660.999
300.007652.00.9950.998
400.005612.00.8350.991
500.009032.00.9220.974
200.001701.5610.9500.949
100.001691.5530.9200.956
200.001621.5600.8960.983
300.001531.5520.8810.989
400.001411.5610.8650.992
500.001241.5560.8320.994
400.002501.0291.0250.911
100.002431.0120.9750.962
200.002310.9920.9540.971
300.002340.9950.9370.977
400.002120.9820.9140.986
500.001760.9970.8830.995
Table 3. Fitting parameters (η, γ) and coefficient of determination (R2).
Loading Rate
(GP/s)
Hydrostatic Pressure (MPa) η γ R 2
1000 ± 500−0.0060.650.922
2−0.0081.970.981
4−0.0132.110.996
2000 ± 500−0.0141.390.955
2−0.0173.520.973
4−0.0193.700.915
Publisher’s Note: MDPI stays neutral with regard to jurisdictional claims in published maps and institutional affiliations.

