Abstract
Grinding plays an important role in mining, construction, metallurgy, chemical, coal and other basic industries. In terms of beneficiation, grinding is the most energy consuming operation. So, reasonable grinding conditions according to the properties of ores is the key to obtain good grinding results and reduce energy consumption and resource waste. In this paper, Tongkeng and Gaofeng polymetallic complex ores are taken as research objects, and the effects of grinding law based on single factor condition test and the grinding parameters optimization based on response surface method were studied for two kinds of ores. The results show that grinding time is a significant factor affecting the particle size composition. The suitable grinding concentration of Tongkeng ore and Gaofeng ore is 70% and 75%, respectively. The effect of mill filling ratio on Gaofeng ore is not obvious. The rotational rate has little effect on the grinding technical efficiency. The regression model equations obtained by response surface method are extremely significant, and the relative errors of prediction are all within 1%, indicating high reliability of fitting equations. The order of influencing factors of the two ores is as follows: grinding time > filling ratio > grinding concentration. For Tongkeng ore, the optimized grinding conditions are grinding time 5.4 min, grinding concentration 67% and filling ratio 35%. For Gaofeng ore, the optimized grinding conditions are grinding time 3.8 min, grinding concentration 73% and filling ratio 34%.
1. Introduction
Grinding is the process of reducing the particle size, which plays an important role in mining, construction, metallurgy, chemical, coal and other basic industries [1,2,3]. In terms of beneficiation, grinding is the most energy-consuming operation [4]. The factors affecting the grinding process mainly include ore properties and operating conditions. The hardness, density, brittleness, mud content, distribution characteristics, particle size, grinding fineness and other properties of the ore have an important effect on the production capacity of the mill [5]. When there are many kinds of minerals in the ore and mechanical properties are different, the ore components will have different grinding behaviors in the grinding process. Therefore, the reasonable grinding conditions according to the properties of different ores is the key to obtain good grinding results. Dry or wet grinding, steel ball size or shape, feed particle size, grinding concentration, grinding time, filling ratio, rotational rate and other operating conditions will also significantly affect the grinding process [6,7,8,9,10,11,12,13]. Therefore, optimizing the grinding operation, improving the grinding process efficiency and reducing the grinding cost are of great significance for the mineral resource processing industry to reduce production costs and improve resource recovery [14,15]. Take the polymetallic complex ore of Dachang deposit in Guangxi, China as an example. The ore mineral composition property is complex: more useful minerals, mainly cassiterite, iron sphalerite, pyrite, pyrrhotite, jamesonite, arsenopyrite and a small amount of gray tin, chalcopyrite, galena, sphalerite, gangue minerals are mainly quartz and calcite [16]. There are great differences in physical and chemical properties of mineral components in the ore, and large differences in crystal size and distribution characteristics, especially in physical and mechanical properties of cassiterite and other sulfide minerals, resulting in cassiterite overgrinding and sulfide ore undergrinding problems in mineral processing production. If cassiterite has been overgrinded into tin mud, in the result is a large amount of tin loss. Undergrinding of sulfide ore will also lead to poor quality of concentrate or metal loss, which seriously affect the technical and economic indicators [17]. In terms of tin mud, its beneficiation is one of the recognized problems in the world [18,19,20]. It is difficult to recover by gravity separation process and the recovery rate is very low. There are some problems such as complex separation process, high cost of beneficiation and environmental pollution when using flotation process [21,22,23]. Therefore, in the grinding production of polymetallic complex ore concentrator, while improving the grinding technical efficiency of sulfide ore, the generation of fine cassiterite should be reduced as far as possible to improve the contradiction between the overgrinding of cassiterite and the undergrinding of sulfide ore [24,25,26]. More importantly, the mineral composition of Dachang deposit in Guangxi varies greatly in different mining areas. It has been found that rich and poor ores are present. In actual production, the grinding process and separation process of rich and poor ores are completely different. Due to the need of enrichment, the beneficiation method and process flow of poor ores are more complex and changeable than rich ores, and the separation is more difficult [27]. Therefore, in view of the above problems, the rich and poor polymetallic complex ores were studied through the effects of single factor on the grinding results and the grinding parameters optimization in this paper. The research results can provide a theoretical basis for formulating a scientific and reasonable grinding process and separation technical route. It lays a foundation for the subsequent grinding optimization of rich and poor polymetallic complex ores and the effective regulation of the particle size of grinding products. Through this study, the best grinding parameters of complex polymetallic ores are obtained to reduce cassiterite overgrinding and sulfide ore undergrinding, so as to save energy consumption in the grinding process of polymetallic complex ores and make full use of ore resources.
2. Materials and Methods
2.1. Materials
The materials are taken from the polymetallic complex ores in Tongkeng and Gaofeng, Dachang, Guangxi, China. The XRF analysis technology is used to analyze the chemical composition of ores as shown in Table 1 and Table 2.

Table 1.
Chemical components of Tongkeng ore.

Table 2.
Chemical components of Gaofeng ore.
It can be seen from Table 1 that Tongkeng ore contains metallic elements such as iron, tin, lead and zinc, and non-metallic elements such as sulfur and arsenic. The total content of SiO2, CaO, Al2O3 and MgO is 78.9%, indicating that its gangue mineral content is high. From Table 2, the Gaofeng ore contains a variety of metal elements such as iron, lead, zinc, tin and antimony, and non-metallic elements such as sulfur and arsenic. The total content of SiO2, CaO, Al2O3 and MgO is 26.2%, indicating that the content of gangue minerals is low. Therefore, in terms of the content of main useful minerals, Tongkeng ore is “poor ore” and Gaofeng ore is “rich ore”. In addition, the MLA analysis results of Gaofeng ore are as follows [28]: the total mass fraction of pyrrhotite and sphalerite is about 90%. The lead mineral is mainly jamesonite. Antimony minerals are trace stibnite, native antimony and pyrite. The silver minerals are mainly silver tetrahedrite, natural silver, spirochrosite and stibnite. Tin minerals are mainly cassiterite, a small amount of trace tetrahedrite and stannite. Other metal sulfide minerals are mainly pyrite, arsenopyrite, chalcopyrite and molybdenite. Gangue minerals are mainly mica, quartz, etc.
In this test, 100 kg raw ore samples obtained are naturally washed and dried, then crushed to −1.7mm by jaw crusher and roller crusher, and finally screened into 12 particle sizes by vibrating screen. The results are shown in Table 3. Among them, the model of jaw crusher is PE-150 × 250, the model of roller crusher is 2PG-400 × 250, and the model of vibrating screen is Analysette 3. In order to ensure the uniformity of materials, each particle size fraction shall be fully mixed into 500 g/bag for subsequent grinding test.

Table 3.
Particle size distribution of two types of ores sample.
For polymetallic complex ores in Dachang, the main useful minerals are cassiterite and sulfide minerals. Cassiterite is often recovered by gravity separation due to its high density. The equipment is mostly shaking table, and the suitable feeding particle size range is 0.019~2 mm. Sulfide minerals are often recovered by flotation, and the suitable feeding particle size range is 0.038~0.15 mm. Therefore, in order to facilitate the research, the particle size of −0.15 + 0.038 mm in the grinding products of polymetallic complex ores is regarded as qualified particle size, the particle size of +0.15 mm is regarded as undergrinding particle size, and the particle size of −0.038 mm is regarded as overgrinding particle size [29,30,31].
2.2. Methods
2.2.1. Batch Grinding Test
The grinding test adopts batch grinding test method. The model of the mill is XMB-Φ200 × 240 (Φ Represents the diameter of the mill). The measurements of the mill are 200 mm × 240 mm. The diameter of the grinding ball is 25 mm. The mass of the original sample for each grinding is 500 g. The test steps are as follows: First, the steel ball is loaded into the mill according to the designed filling ratio, and the water and test ore sample are loaded into the mill according to the designed grinding concentration. Then adjust the frequency converter to make the mill reach the designed rotational rate. Then set the grinding time and start the mill. After grinding, wet screen the grinding products with 0.038 mm standard sieve, and dry the materials above and below the sieve respectively. Finally, according to the designed screening particle size, use the vibrating screen to screen the materials on the screen and weigh them to calculate the particle size distribution. The model of vibrating screen is Analysette 3.
2.2.2. Grinding Technical Efficiency
The particle size composition characteristics of grinding products under the different grinding conditions were studied. The effects of conditions on the grinding process of polymetallic complex ores were analyzed. Grinding technical efficiency based on the qualified particle size of grinding is selected as the quality evaluation index to obtain the appropriate grinding parameters. Grinding technical efficiency refers to the ratio of the yield of qualified particle size in grinding products to the yield of larger than qualified particle size in feed. Its calculation is shown in Formula (1) [32].
In Formula (1), γ is the yield of grinding products less than the upper limit of qualified particle size. γ1 is the yield less than the upper limit of qualified particle size in the feed ore. γ2 is the yield of overgrinding particle size in the feed ore. γ3 is the yield of overgrinding particle size in grinding products.
According to Table 3, for Tongkeng ore, γ1 = 22.90%, γ2 = 10.78%, and the calculation formula of grinding technical efficiency is:
For Tongkeng ore, γ1 = 15.84%, γ2 = 4.99%, and the calculation formula of grinding technical efficiency is:
3. Results and Discussion
3.1. Single Factor Grinding Test of Tongkeng Ore
3.1.1. Effect of Grinding Time
Grinding times are 2 min, 3 min, 4 min, 5 min, 6 min and 7 min, respectively. The other conditions are grinding concentration 70%, filling ratio 35% and rotational rate 75%. The results are shown in Table 4 and Figure 1.

Table 4.
Particle size composition of grinding product at different grinding times.
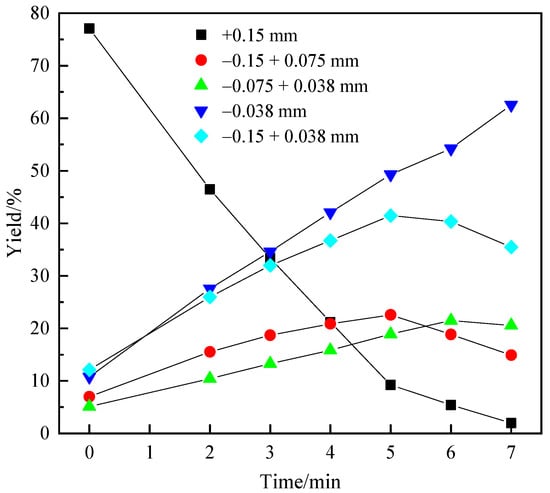
Figure 1.
Particle size of grinding product at different grinding times.
It can be seen from Table 4 and Figure 1 that with the extension of grinding time, the yield of +0.15 mm particle size decreases significantly, and the reduction speed starts to slow down at 5 min. The yield of −0.15 + 0.075 mm and −0.075 + 0.038 mm particle size increase firstly and then decrease, in which −0.15 + 0.075 mm particle size reaches the maximum at 5 min and −0.075 + 0.038 mm particle size reaches the maximum at 6 min. The yield of −0.15 + 0.038 mm particle size reaches the maximum in 5 min, indicating that the decreasing speed of −0.15 + 0.075 mm particle size is greater than that of −0.075 + 0.038 mm particle size. The yield of −0.038 mm particle size increases linearly. When the time is 5 min and 6 min, the content of −0.15 + 0.038 mm in the middle particle size is close, and the grinding technical efficiency value is also close, but the content of −0.038 mm particle size in 6 min is 4.93% more than that in 5 min. Therefore, in order to reduce the generation of overgrinding particle size (−0.038 mm), 5 min is selected as the appropriate grinding time.
3.1.2. Effect of Grinding Concentration
In wet grinding, the pulp concentration affects the rheology of the pulp. Due to the viscosity of the pulp, the surface of the grinding medium is covered with a layer of pulp, called the cover layer, which directly affects the contact between the medium, material and lining plate, resulting in the change of grinding technical efficiency. In wet grinding, there is an optimal cover layer thickness corresponding to grinding concentration. When the pulp concentration is low and the cover layer is less than this thickness, the wear of grinding medium and lining plate is more serious. With the increase of concentration, the thickness of the cover layer increases, which increases the crushing probability of the materials in the cover layer, improves the grinding technical efficiency, and reduces the wear of medium and lining plate. When the pulp concentration is high and the cover layer is greater than optimal cover layer thickness, it will buffer the crushing of the medium, reduce the probability of material crushing and reduce the grinding technical efficiency [33].
Grinding concentrations are 60%, 65%, 70%, 75% and 80%, respectively. The other conditions are grinding time 5 min, filling ratio 35% and rotational rate 75%. The results are shown in Table 5 and Figure 2.

Table 5.
Particle size composition of grinding product at different grinding concentrations.
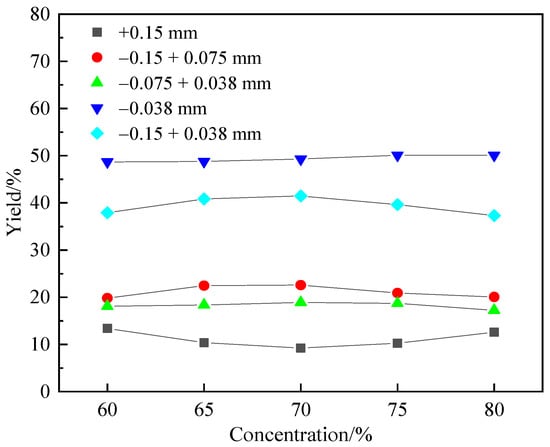
Figure 2.
Particle size of grinding product at different grinding concentrations.
It can be seen from Table 5 and Figure 2 that with the increase of grinding concentration, the yield of + 0.15 mm particle size decreases firstly and then increases, reaching the minimum value when the concentration is 70%. The yield of −0.15 + 0.075 mm and −0.075 + 0.038 mm particle size increase firstly and then decrease, reaching the maximum at the concentration of 70%. The particle size of −0.038 mm increases linearly, but the increase range is small. When the concentration is 70%, the grinding technical efficiency reaches the maximum. Therefore, the grinding concentration has little effect on the yield of overgrinding particles and great effect on the yield of undergrinding particles. Too large or too small concentration will affect the grinding technical efficiency. Therefore, 70% is selected as the appropriate grinding concentration.
3.1.3. Effect of Filling Ratio
The reduction of material particle size in the mill is completed by the impact grinding effect of the medium on the material. Proper medium filling ratio can fully dissociate the mineral monomer, ensure the grinding efficiency of the mill and reduce the grinding power consumption. The main motion state of the medium is throwing, and the grinding efficiency of the mill is mainly related to the height of the throwing point of the medium [34,35].
Filling ratios are 25%, 30%, 35%, 40% and 45%, respectively. The other conditions are grinding time 5 min, grinding concentration 70% and rotational rate 75%. The results are shown in Table 6 and Figure 3.

Table 6.
Particle size composition of grinding product at different filling ratios.
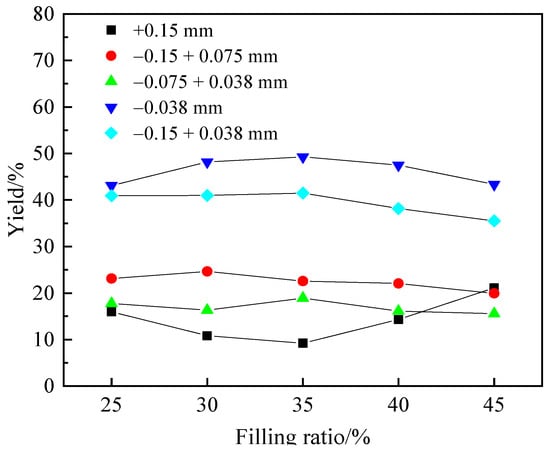
Figure 3.
Particle size of grinding product at different filling ratios.
It can be seen from Table 6 and Figure 3 that, with the increase of filling ratio, the yield of + 0.15 mm particle size decreases firstly and then increases, reaching the minimum value at 35% filling ratio. The yield of −0.15 + 0.075 mm particle size increases firstly and then decreases, reaching the maximum at 30% filling ratio. The yield of −0.075 + 0.038 mm particle size shows a trend of decreasing firstly, then increasing and then decreasing, and reaches the maximum at 35% filling ratio. The yield of −0.038 mm particle size increases firstly and then decreases, reaching the maximum at 35% filling ratio. The grinding technical efficiency is the highest at filling ratio 35%. Therefore, when filling ratio is low, the effective crushing of the medium to the materials is insufficient, the content of undergrinding materials is more, and the content of overgrinding materials is less. When filling ratio is high, the effective working volume of the mill becomes smaller, the medium near the center of the cylinder is in a peristaltic state, the grinding effect dominated by impact is weak, and the grinding effect is dominated by abrasive, resulting in an increase in the content of undergrinding and overgrinding particle size, but when it increases to a certain extent, the yield of overgrinding particle size begins to decrease. Therefore, 35% is selected as the appropriate filling ratio.
3.1.4. Effect of Rotational Rate
When filling ratio is constant, the movement state of the medium in the mill is mainly affected by rotational rate, which can be divided into three states: falling, throwing and centrifugation. According to the formula of the critical rotational rate of the medium in the mill, when the grinding medium is a steel ball and the diameter of the steel ball is 25 mm, the critical rotational rate is 101.4 r/min. The grinding test is carried out under the conditions of 5 min grinding time, 70% grinding concentration, 35% filling ratio and 65%, 70%, 75%, 80% and 85% rotational rate, respectively. The results are shown in Table 7 and Figure 4.

Table 7.
Particle size composition of grinding product at different rotational rates.
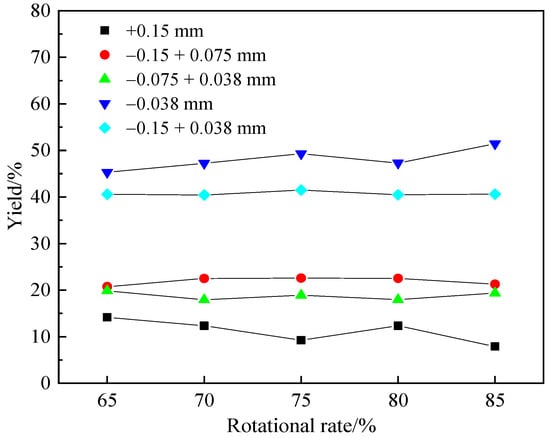
Figure 4.
Particle size of grinding product at different rotational rates.
It can be seen from Table 7 and Figure 4 that with the increase of rotational rate, +0.15 mm particle size decreases firstly, then increases and then decreases, reaching the minimum value when the rotational rate is 85%. The yield of intermediate particle size of −0.15 + 0.038 mm has little change and reaches the maximum when the rotational rate is 75%. The variation law of yield of −0.038 mm particle size is opposite to that of +0.15 mm particle size. It is the trend of increasing firstly, then decreasing and then increasing, and reaching the maximum at rotational rate 85%. The change of rotational rate has little effect on the yield of qualified grinding particles. For the yield of undergrinding and overgrinding particles, there is a law of change between one and the other. The maximum difference of grinding technical efficiency is 1.88%. Therefore, 75% is selected as the appropriate rotational rate.
3.2. Single Factor Grinding Test of Gaofeng Ore
3.2.1. Effect of Grinding Time
The grinding test is carried out under the conditions of 70% grinding concentration, 35% filling ratio, 75% rotational rate and grinding times of 2 min, 3 min, 4 min, 5 min, 6 min and 7 min, respectively. The results are shown in Table 8 and Figure 5.

Table 8.
Particle size composition of grinding product at different grinding times.
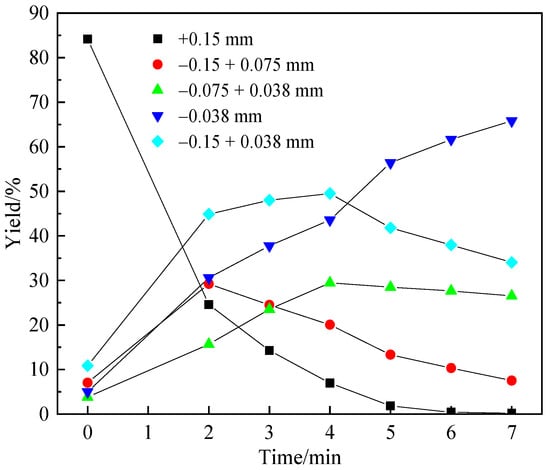
Figure 5.
Particle size of grinding product at different grinding times.
It can be seen from Table 8 and Figure 5 that with the increase of grinding time, the yield of +0.15 mm particle size has been reduced, and the reduction speed gradually slows down. The yield of −0.15 + 0.075 mm and −0.075 + 0.038 mm particle size increases firstly and then decreases. The yield of −0.15 + 0.075 mm particle size reaches the maximum at 2 min, that of −0.075 + 0.038 mm particle size reaches the maximum at 4 min, and that of −0.15 + 0.038 mm particle size reaches the maximum at 4 min. The yield of −0.038 mm particle size increases all the time, and changes greatly before and after 4 min, which basically shows a linear law. Because 4 min is the most efficient grinding technology, 4 min is selected as the appropriate grinding time.
3.2.2. Effect of Grinding Concentration
Grinding concentrations are 60%, 65%, 70%, 75% and 80%, respectively. The other conditions are grinding time 4 min, filling ratio 35% and rotational rate 75%. The results are shown in Table 9 and Figure 6.

Table 9.
Particle size composition of grinding product at different grinding concentrations.
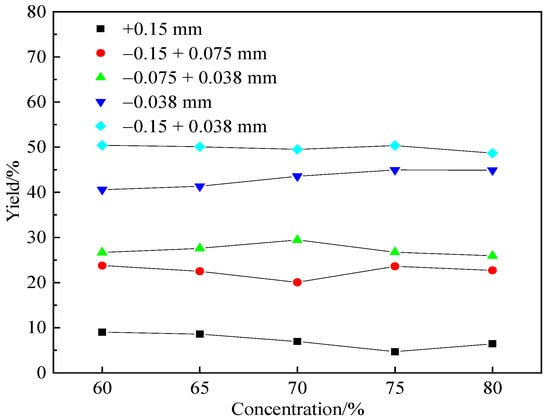
Figure 6.
Particle size of grinding product at different grinding concentrations.
It can be seen from Table 9 and Figure 6 that with the increase of grinding concentration, the yield of +0.15 mm particle size decreases firstly and then increases, reaching the minimum value at concentration 75%. The yield of −0.15 + 0.075 mm particle size shows a trend of decreasing firstly, then increasing and then decreasing, and reaching the minimum at grinding concentration 70%. The yield of −0.075 + 0.038 mm particle size increases firstly and then decreases, reaching the maximum at grinding concentration 70%. The yield of −0.038 mm particle size, as the most fine particle, increases all the time. When the grinding concentration increases to a certain extent, the change of yield is small. The grinding technical efficiency reaches the maximum when the grinding concentration is 75%. Therefore, 75% is selected as the appropriate grinding concentration.
3.2.3. Effect of Filling Ratio
Filling ratios are 25%, 30%, 35%, 40% and 45%, respectively. The other conditions are grinding time 4 min, grinding concentration 75% and rotational rate 75%. The results are shown in Table 10 and Figure 7.

Table 10.
Particle size composition of grinding product at different filling ratios.
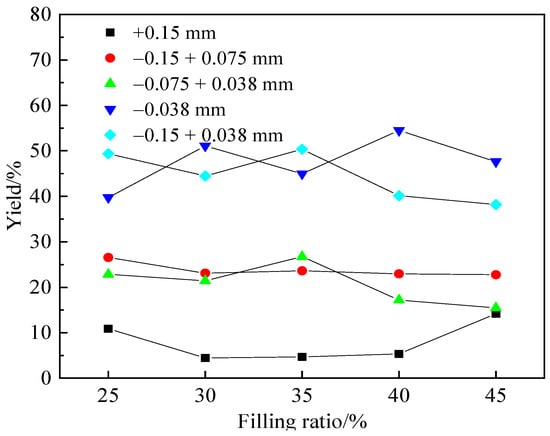
Figure 7.
Particle size of grinding product at different filling ratios.
It can be seen from Table 10 and Figure 7 that, with the increase of filling ratio, the yield of −0.15 + 0.075 mm and −0.075 + 0.038 mm particle size decreases firstly, then increases and then decreases. If the filling ratio is too high or too low, the yield of +0.15 mm particle size will increase. When filling ratio is 30%, the yield of +0.15 mm particle size will reach the minimum. The variation trend of yield of −0.038 mm particle size is basically opposite to that of −0.15 + 0.038 mm particle size, and the variation law with filling ratio is more complex. The grinding technical efficiency reaches the maximum when the filling ratio is 35%. Therefore, 35% is selected as the appropriate filling ratio.
3.2.4. Effect of Rotational Rate
The grinding test is carried out under the conditions of 4 min grinding time, 75% grinding concentration, 35% filling ratio and 65%, 70%, 75%, 80% and 85% rotational rate, respectively. The results are shown in Table 11 and Figure 8.

Table 11.
Particle size composition of grinding products at different rotational rates.
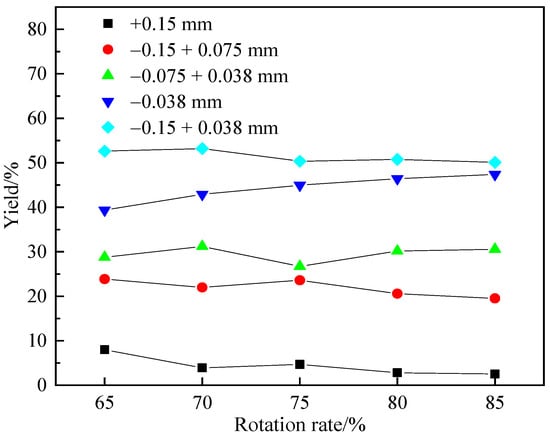
Figure 8.
Particle size of grinding product at different rotational rates.
It can be seen from Table 11 and Figure 8 that, with the increase of rotational rate, the yield of +0.15 mm particle size basically decreases, the yield of −0.038 mm particle size basically increases in a linear trend, the yield of −0.15 + 0.075 mm particle size decreases firstly, then increases and then decreases. The change trend of −0.075 + 0.038 mm particle size yield is opposite and reaches the minimum value when rotational rate is 75%. The qualified particle size is −0.15 + 0.038 mm, and the yield reaches the maximum value when rotational rate is 70%. At this time, the grinding technical efficiency reaches the maximum value of 53.42%. Therefore, 70% is selected as the appropriate rotational rate.
3.3. Grinding Parameters Optimization of Tongkeng Ore
3.3.1. Grinding Parameters Optimization
The three parameters of grinding time (X1), grinding concentration (X2) and filling ratio (X3), which have an important influence on grinding effect, are selected as the influencing factors, and the grinding technical efficiency value (Y) is taken as the response value. The test combination scheme is designed according to the Box–Behnken design method, and the results are analyzed and regressed by Design-Expert software, multiple regression fitting model, analysis of variance, response surface and contour of each factor are obtained. The test factor level design is shown in Table 12. The test design scheme and results of Tongkeng ore are shown in Table 13.

Table 12.
Design of factors and levels of response surface method.

Table 13.
Experimental design and result of response surface method.
According to the results in Table 13, the multiple quadratic regression equation is established by response surface analysis as follows:
The above regression Equation (4) is analyzed by variance, and the results are shown in Table 14.

Table 14.
Variance analysis of response surface regression equation.
It can be seen from Table 14 that the F value of the model equation is 118.50, the p value is less than 0.0001, and the correlation coefficient R2 is 99.35%, indicating that the regression model equation is very significant. The coefficient of variation (C.V.) indicates the accuracy of the test. The smaller its value, the higher the reliability of the test results. In this test, C.V. = 0.9169%, which shows that the result is credible and there is a good correlation between the predicted value and the actual value.
According to the absolute value of the coefficient of each influencing factor in the regression equation, the effect intensity of each influencing factor on the dependent variable can be seen. The greater the absolute value of the coefficient, the greater the effect. It can be seen that the order of single factor effect is grinding time > filling ratio > grinding concentration. The order of interaction effect is grinding time and filling ratio > grinding concentration and filling ratio > grinding time and grinding concentration. The second-order effect of grinding time is much greater than that of the other two factors.
The response surface diagram can intuitively see the interaction of the two factors on the dependent variable. The greater the slope, the more significant the influence on the response surface. The smaller the slope, the smaller the impact on the response surface. The contour map is the projection of the response surface map on the bottom surface. The shape of the contour line can reflect the strength of the interaction of independent variables. The ellipse indicates that the interaction between the two factors is significant, and the circle indicates that the interaction is not significant. The response surface diagram and contour map of the interaction of grinding time, grinding concentration and filling rate are shown in Figure 9, Figure 10 and Figure 11.
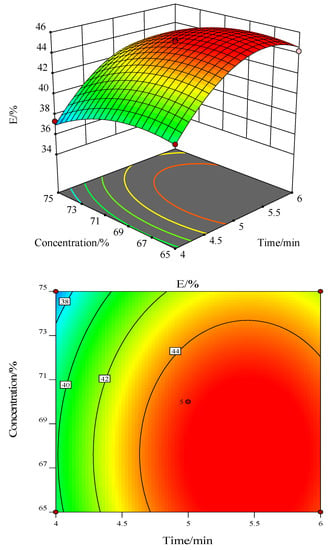
Figure 9.
Response surface diagram and contour map at the action of grinding time and grinding concentration.
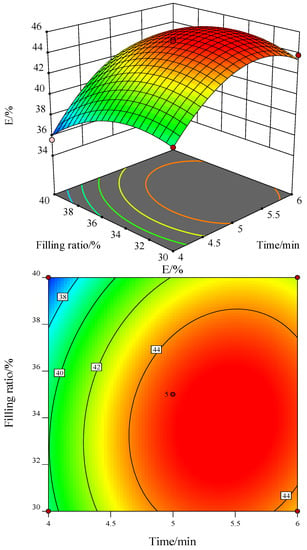
Figure 10.
Response surface diagram and contour map at the action of grinding time and filling ratio.
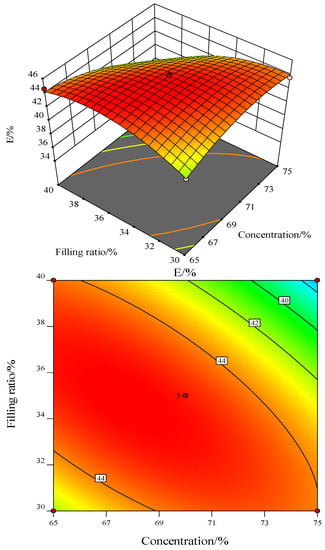
Figure 11.
Response surface diagram and contour map at the action of grinding concentration and filling ratio.
As can be seen from Figure 9, with the increase of grinding time and grinding concentration, the surface value of grinding technical efficiency increases firstly and then decreases, reaching the maximum value at grinding time 5 min and grinding concentration 70%. From the perspective of single factor effect, the effect of grinding time on grinding technical efficiency is more significant than grinding concentration. From the contour map, the interaction between grinding time and grinding concentration is not significant.
It can be seen from Figure 10 that, with the increase of grinding time and filling ratio, the curved value of grinding technical efficiency also increases firstly and then decreases, reaching the maximum value at grinding time 5 min and filling ratio 35%. From the perspective of single factor, compared with filling ratio, grinding time has a more significant influence on grinding technical efficiency. It can be seen from the contour map that the interaction between grinding time and filling ratio is significant.
It can be seen from Figure 11 that, with the increase of grinding concentration and filling ratio, the surface value of grinding technical efficiency increases firstly and then decreases, reaching the maximum value at grinding concentration 70% and filling ratio 35%. From the perspective of single factor effect, the effect of grinding concentration and filling ratio on grinding technical efficiency is close. It can be seen from the contour map that the interaction between grinding concentration and filling ratio is significant.
Therefore, grinding time is the most significant factor affecting the surface value of grinding technical efficiency of Tongkeng ore, and the effect of grinding concentration and filling ratio is close to each other. The interaction between grinding time and grinding concentration is not significant. The interaction between filling ratio and grinding time and grinding concentration is significant. The interaction between filling ratio and grinding concentration is significant. This is consistent with the results obtained from the analysis of the absolute value of each factor coefficient of the regression equation.
3.3.2. Verify Grinding Optimization Parameters
Through the accurate solution of the regression model, when the grinding technical efficiency is the best, the theoretical grinding condition parameters are grinding time 5.448 min, grinding concentration 67.242% and filling ratio 35.511%. Under these grinding condition, the predicted grinding technical efficiency is 45.896%. In order to verify the reliability of the regression equation model, two verification tests are carried out at the prediction conditions. The results are shown in Table 15.

Table 15.
Verification test results.
It can be seen from Table 15 that the test results are close to the predicted results, and the relative errors between the two test values and the predicted values are 0.86% and 0.05%, respectively. It can be seen that the regression equation model has strong reliability and can be used to predict the test results. Therefore, the optimal grinding conditions of Tongkeng ore are grinding time 5.4 min, grinding concentration 67%, filling ratio 35% and rotational rate 75%. According to the above single factor grinding test results, the suitable grinding conditions for Tongkeng ore are grinding time 5 min, grinding concentration 70% and filling ratio 35%. The grinding optimization conditions obtained in this section are consistent with the conclusions of the previous single factor grinding test. The optimal value of each factor is near the optimal value of single factor. This also shows the importance and necessity of single factor test, which can lay a foundation for determining the horizontal range of optimization factors by response surface method.
3.4. Grinding Parameters Optimization of Gaofeng Ore
3.4.1. Grinding Parameters Optimization
The design method of the test scheme is the same as that in Section 3.3.1. The level design of test factors is shown in Table 16. The design scheme and results of Gaofeng ore are shown in Table 17.

Table 16.
Design of factors and levels of response surface method.

Table 17.
Experimental design and result of response surface method.
According to the results in Table 17, the multiple quadratic regression equation is established by response surface analysis as follows:
The above regression Equation (5) is analyzed by variance, and the results are shown in Table 18.

Table 18.
Variance analysis of response surface regression equation.
It can be seen from Table 18 that the F value of the model equation is 275.20, the p value is less than 0.0001, and the correlation coefficient R2 is 99.72%, indicating that the regression model equation is very significant, and the fitting degree is good. The coefficient of variation C.V. = 0.4044%, indicating that the result is credible and there is a good correlation between the predicted value and the actual value.
According to the absolute value of each influencing factor coefficient in the regression equation, the order of single factor effect is grinding time > filling ratio > grinding concentration. The order of interaction effect is grinding time and filling ratio > grinding time and grinding concentration > grinding concentration and filling ratio. The second-order effect of grinding time is much greater than that of the other two factors.
The response surface diagram and contour map of the interaction of grinding time, grinding concentration and filling ratio are shown in Figure 12, Figure 13 and Figure 14.
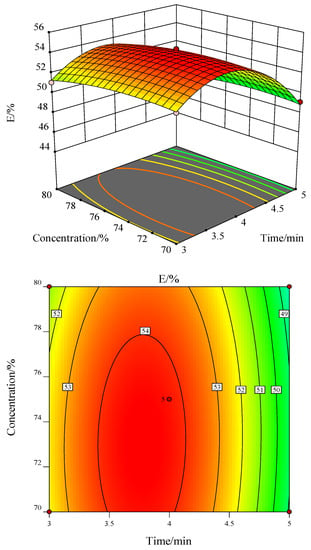
Figure 12.
Response surface diagram and contour map at the action of grinding time and grinding concentration.
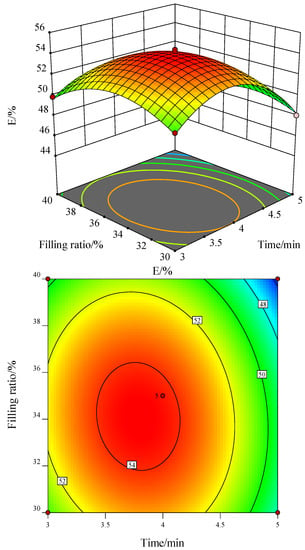
Figure 13.
Response surface diagram and contour map at the action of grinding time and filling ratio.
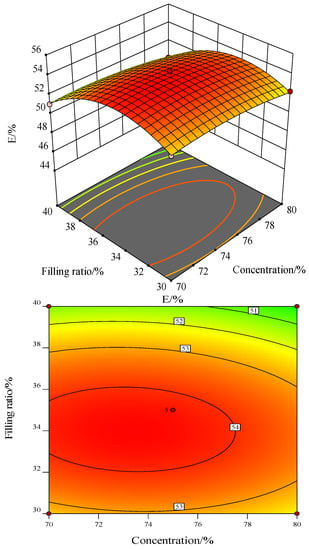
Figure 14.
Response surface diagram and contour map at the action of grinding concentration and filling ratio.
From Figure 12, Figure 13 and Figure 14, it can be seen that the single factor effect of grinding time, grinding concentration and filling ratio on the Gaofeng ore grinding technical efficiency is significant, and the interaction law of the two factors is basically similar to that of Tongkeng ore. Therefore, it can be concluded that grinding time is the most significant factor affecting the surface value of Gaofeng ore grinding technical efficiency, followed by filling ratio, and finally grinding concentration. The interaction between grinding concentration and filling ratio is not significant. The interaction between grinding time and grinding concentration and filling ratio is significant. This is consistent with the results obtained from the analysis of the absolute value of each factor coefficient of the regression equation.
3.4.2. Verify Grinding Optimization Parameters
Through the accurate solution of the regression model, when the grinding technical efficiency is the best, the theoretical grinding condition parameters are grinding time 3.782 min, grinding concentration 73.205% and filling ratio 34.181%. Under this grinding condition, the predicted grinding technical efficiency is 54.528%. In order to verify the reliability of the regression equation model, two verification tests are carried out at the prediction conditions. The test results are shown in Table 19.

Table 19.
Verification test results.
It can be seen from Table 19 that the test results are close to the predicted results, and the relative errors between the two test values and the predicted values are 0.81% and 0.73%, respectively. It can be seen that this regression equation model has strong reliability and can be used to predict the test results. Therefore, the optimal grinding conditions of Gaofeng ore are grinding time 3.8 min, concentration 73%, filling ratio 34% and rotational rate 70%. The optimal grinding conditions of Gaofeng ore are consistent with the conclusions of single factor grinding test, and the optimal value of each factor is near the optimal value of single factor.
4. Conclusions
In this paper, two different polymetallic complex ores are selected innovatively, and based on single factor test and response surface method, the grinding laws and grinding parameters optimization of the two ores are finally obtained. The following conclusions were drawn from this research:
Grinding time is a significant factor affecting the particle size composition. With the extension of grinding time, the yield of undergrinding particle size (+0.15 mm) basically decreases exponentially, the yield of overgrinding particle size (−0.038 mm) basically increases linearly, and the yield of qualified particle size (−0.15 + 0.038 mm) firstly increases and then decreases. The inflection points of significant changes in the qualified particle size yield of Tongkeng ore and Gaofeng ore are 5 min and 4 min respectively.
With the increase of grinding concentration, the undergrinding particle size yield of the two ores decreases firstly and then increases. The overgrinding particle size yield of Tongkeng ore has no obvious change, and the qualified particle size yield increases firstly and then decreases. The overgrinding particle size yield of Gaofeng ore increases linearly and slowly, while the qualified particle size yield has no obvious change. The suitable grinding concentrations of Tongkeng ore and Gaofeng ore are 70% and 75%, respectively.
The effect of mill filling ratio on Gaofeng ore is not obvious. With the increase of filling ratio, the undergrinding particle size yield of Tongkeng ore decreases firstly and then increases, while the qualified particle size yield and overgrinding particle size yield increases firstly and then decreases. The suitable mill filling ratio of Tongkeng ore and Gaofeng ore is 35%.
The rotational rate has little effect on the grinding technical efficiency. With the increase of rotational rate, the change law of the yield of undergrinding particle size and overgrindingparticle size of Tongkeng ore is basically opposite, and the yield of qualified particle size has little change. The suitable mill rotation rates for Tongkeng ore and Gaofeng ore are 75% and 70%, respectively.
The regression model equations obtained by response surface method are extremely significant, and the relative errors of prediction are all within 1%, indicating high reliability of fitting equations. The order of influencing factors of the two ores is as follows: grinding time > filling ratio > grinding concentration. For Tongkeng ore, the optimized grinding conditions are grinding time 5.4 min, grinding concentration 67% and filling ratio 35%. For Gaofeng ore, the optimized grinding conditions are grinding time 3.8 min, grinding concentration 73% and filling ratio 34%.
Author Contributions
Conceptualization, S.M. and J.Y.; Data curation, Z.S. and H.L.; Formal analysis, X.D. and W.X.; Funding acquisition, S.M.; Investigation, Z.S. and H.L.; Methodology, J.Y. and S.M.; Project administration, J.Y. and S.M.; Validation, Z.S. and H.L.; Writing—original draft, H.L. and J.Y.; Writing—review & editing, J.Y. and S.M. All authors have read and agreed to the published version of the manuscript.
Funding
This research was funded by the National Natural Science Foundation of China (No.52274258, No.51874105).
Institutional Review Board Statement
Not applicable.
Informed Consent Statement
Not applicable.
Data Availability Statement
Not applicable.
Conflicts of Interest
The authors declare no conflict of interest.
References
- Sadrai, S.; Meech, J.A.; Ghomshei, M.; Sassani, F.; Tromans, D. Influence of Impact Velocity on Fragmentation and the Energy Efficiency of Comminution. Int. J. Impact Eng. 2006, 33, 723–734. [Google Scholar] [CrossRef]
- Hashim, S.F.S.; Hussin, H. Effect of Grinding Aids in Cement Grinding. J. Phys. Conf. Ser. 2018, 1082, 012091. [Google Scholar] [CrossRef]
- Krishnaraj, L.; Ravichandran, P.T. Investigation on Grinding Impact of Fly Ash Particles and Its Characterization Analysis in Cement Mortar Composites. Ain Shams Eng. J. 2019, 10, 267–274. [Google Scholar] [CrossRef]
- Santosh, T.; Soni, R.K.; Eswaraiah, C.; Rao, D.S.; Venugopal, R. Optimization of Stirred Mill Parameters for Fine Grinding of Pge Bearing Chromite Ore. Particul. Sci. Tec. 2020, 39, 663–675. [Google Scholar]
- Valenzuela, M.A.; Castro, B. Experimental Evaluation of Power Requirements for Wet Grinding and Its Comparison to Dry Grinding. IEEE T. Ind. Appl. 2018, 99, 1. [Google Scholar]
- Huang, K.Q.; Xiao, C.H.; Wu, Q.M. Application of Accurate Ball-load-addition Method in Grinding Production of Some Tailings. Adv. Mat. Res. 2014, 962, 771–774. [Google Scholar]
- Kotake, N.; Kuboki, M.; Kiya, S.; Kanda, Y. Influence of Dry and Wet Grinding Conditions on Fineness and Shape of Particle Size Distribution of Product in a Ball Mil. Adv. Powder Technol. 2011, 22, 86–924. [Google Scholar] [CrossRef]
- Peng, Y.; Grano, S. Effect of Iron Contamination from Grinding Media on the Flotation of Sulphide Minerals of Different Particle Size. Int. J. Miner. Process. 2010, 97, 1–6. [Google Scholar] [CrossRef]
- Malyarov, P.; Dolgov, O.; Kovalev, P. Mineral Raw Material Disintegration Mechanisms in Ball Mills and Distribution of Grinding Energy between Sequential Stages. Miner. Miner. Dep. 2020, 14, 25–33. [Google Scholar] [CrossRef]
- Gupta, V.K.; Sharma, S. Analysis of Ball Mill Grinding Operation using Mill Power Specific Kinetic Parameters. Adv. Powder Technol. 2014, 25, 625–634. [Google Scholar] [CrossRef]
- Erdem, A.S.; Ergün, L. The Effect of Ball Size on Breakage Rate Parameter in a Pilot Scale Ball Mill. Miner. Eng. 2009, 22, 660–664. [Google Scholar] [CrossRef]
- Chimwani, N.; Mohale, T.M.; Bwalya, M.M. Tailoring Ball Mill Feed Size Distribution for the Production of a Size-graded Product. Miner. Eng. 2019, 141, 105891. [Google Scholar] [CrossRef]
- Gupta, V.K. Effect of Size Distribution of the Particulate Material on the Specific Breakage rate of Particles in Dry Ball Milling. Powder Technol. 2017, 305, 714–722. [Google Scholar] [CrossRef]
- Woywadt, C. Grinding Process Optimization-Featuring Case Studies and Operating Results of the Modular Vertical Roller Mill. In Proceedings of the 2017 IEEE-IAS/PCA Cement Industry Technical Conference, Calgary, AB, Canada, 21–25 May 2017. [Google Scholar]
- Hfels, C.; Dambach, R.; Kwade, A. Geometry Influence on Optimized Operation of a Dry Agitator Bead Mill. Miner. Eng. 2021, 171, 107050. [Google Scholar] [CrossRef]
- Xu, T.L. Study on Cassiterite Polymetallic Sulfide Ore Selective Grinding Behavior. Master’s Thesis, Guangxi University, Nanning, China, 2014. (In Chinese). [Google Scholar]
- Xie, H.Y.; Ye, Q.J.; Zhou, P.; Gao, L.K.; Tong, X.; Liu, J.X. Research on Bulk Floatation Discarding Tailing of Copper and Zinc Polymetallic Sulfide Ores. Adv. Mat. Res. 2014, 881–883, 1621–1625. [Google Scholar]
- Zhou, W.T.; Han, Y.X.; Li, Y.J.; Yang, J.L.; Ma, S.J.; Sun, Y.S. Research on Prediction Model of Ore Grinding Particle Size Distribution. J. Disper. Sci. Technol. 2020, 41, 537–546. [Google Scholar]
- Matveeva, T.N.; Getman, V.V.; Karkeshkina, A.Y. Flotation Extraction of Tin from Tailings of Sulfide-tin Ore Dressing Using Thermomorphic Polymer. Eurasian Min. 2021, 2, 46–49. [Google Scholar] [CrossRef]
- Yusupov, T.S.; Kondrat’ev, S.A.; Khalimova, S.R.; Novikova, S.A. Mineralogical and Technological Assessment of Tin–sulfide Mining Waste Dressability. J. Min. Sci. 2018, 54, 656–662. [Google Scholar] [CrossRef]
- Chen, Y.M.; Li, H.; Feng, D.X.; Tong, X.; Hu, S.X.; Yang, F.; Wang, G.C. A Recipe of Surfactant for the Flotation of Fine Cassiterite Particles. Miner. Eng. 2021, 160, 106658. [Google Scholar] [CrossRef]
- Tian, M.J.; Zhang, C.Y.; Han, H.S.; Liu, R.Q.; Gao, Z.Y.; Chen, P.; He, J.Y.; Hu, Y.H.; Sun, W.; Yuan, D.D. Novel Insights into Adsorption Mechanism of Benzohydroxamic Acid on Lead (II)-activated Cassiterite Surface: An Integrated Experimental and Computational Study. Miner. Eng. 2018, 122, 327–338. [Google Scholar] [CrossRef]
- Zhang, L.M.; Khoso, S.A.; Tian, M.J.; Sun, W. Cassiterite Recovery from a Sulfide Ore Flotation Tailing by Combined Gravity and Flotation Separations. Physicochem. Probl. Mi. 2020, 57, 206–215. [Google Scholar] [CrossRef]
- Angadi, S.I.; Sreenivas, T.; Jeon, H.S.; Baek, S.H.; Mishra, B.K. A Review of Cassiterite Beneficiation Fundamentals and Plant Practices. Miner. Eng. 2015, 70, 178–200. [Google Scholar] [CrossRef]
- Liu, S.Q.; Cao, Y.; Tong, X.; Li, P. Beneficiation of a Fine-sized Cassiterite-bearing Magnetite Ore. Mining Metall. Explor. 2011, 28, 88–93. [Google Scholar] [CrossRef]
- Yang, J.L.; Shuai, Z.C.; Zhou, W.T.; Ma, S.J. Grinding Optimization of Cassiterite-polymetallic Sulfide Ore. Minerals 2019, 9, 134. [Google Scholar] [CrossRef]
- Liu, J. Experimental Study on Grinding Materials of a New Medium with Two Spheres in CheHe Concentrator. Master’s Thesis, Guangxi University, Nanning, China, 2013. (In Chinese). [Google Scholar]
- Zhou, W.T.; Han, Y.X.; Li, Y.J.; Sun, Y.S.; Yang, J.L.; Ma, S.J. Process Mineralogy and Grinding Optimization of Cassiterite Polymetallic Sulphide Ore. J. Cent. South. Univ. (Sci. Tech.) 2019, 50, 1271–1277. (In Chinese) [Google Scholar]
- Sreenivas, T.; Padmanabhan, N.P.H. Surface Chemistry and Flotation of Cassiterite with Alkyl Hydroxamates. Colloids Surf. 2001, 205, 47. [Google Scholar] [CrossRef]
- Qin, W.Q.; Xu, Y.B.; Liu, H.; Ren, L.Y.; Yang, C.R. Flotation and Surface Behavior of Cassiterite with Salicylhydroxamic Acid. Ind. Eng. Chem. Res. 2011, 50, 10778. [Google Scholar] [CrossRef]
- Wu, X.Q.; Zhu, J.G. Selective Flotation of Cassiterite with Benzohydroxamic Acid. Min. Eng. 2006, 19, 1410. [Google Scholar] [CrossRef]
- Duan, X.X. Crushing and Grinding; Metallurgical Industry Press: Beijing, China, 2012; pp. 204–218. (In Chinese) [Google Scholar]
- Faria, P.M.C.; Rajamani, R.K.; Tavares, L.M. Optimization of Solids Concentration in Iron Ore Ball Milling through Modeling and Simulation. Minerals 2019, 9, 366. [Google Scholar] [CrossRef]
- Yin, Z.X.; Peng, Y.X.; Zhu, Z.C.; Yu, Z.F.; Li, T.Q.; Zhao, L.L.; Xu, J. Experimental Study of Charge Dynamics in a Laboratory-scale Ball Mill. P. I. Mech. Eng. C J. Mec. 2018, 232, 3491–3499. [Google Scholar] [CrossRef]
- Ucurum, M.; Ozdemir, A.; Teke, C.; Tekin, I. A Novel Approach to Finding Optimum Operating Conditions of Design Factors for the Grinding Experiment. Particul. Sci. Technol. 2021, 39, 204–212. [Google Scholar] [CrossRef]
Publisher’s Note: MDPI stays neutral with regard to jurisdictional claims in published maps and institutional affiliations. |
© 2022 by the authors. Licensee MDPI, Basel, Switzerland. This article is an open access article distributed under the terms and conditions of the Creative Commons Attribution (CC BY) license (https://creativecommons.org/licenses/by/4.0/).