Article

Chemical and Mineralogical Characterization of Montevive Celestine Mineral

by
Noemi Ariza-Rodríguez
1,2,
Alejandro B. Rodríguez-Navarro
3,*,
Mónica Calero de Hoces
1,
Jose Manuel Martin
4 and
Mario J. Muñoz-Batista
1,*
1
Departamento de Ingeniería Química, Universidad de Granada, 18002 Granada, Spain
2
Canteras Industriales S.L., 18110 Granada, Spain
3
Departamento de Mineralogía y Petrología, Universidad de Granada, 18002 Granada, Spain
4
Departamento de Estratigrafía y Paleontología, Universidad de Granada, 18002 Granada, Spain
*
Authors to whom correspondence should be addressed.
Minerals 2022, 12(10), 1261; https://doi.org/10.3390/min12101261
Submission received: 29 July 2022 / Revised: 29 September 2022 / Accepted: 1 October 2022 / Published: 5 October 2022
(This article belongs to the Section Mineral Exploration Methods and Applications)

Abstract

:
The Montevive celestine mineral deposit, set in the Granada Basin in a marine evaporitic uppermost Tortonian–lowermost Messinian sequence, is the largest reserve in Europe of this economically important strontium ore. Currently, the mine has a large amount of tailings resulting from the rejection of a manual dry screening of high-grade celestine mineral. This visual and density screening was carried out in the early days of mining (1954–1973). Concentrating the celestine mineral and increasing the ore recovery rate would reduce mine operation costs and the generation of new tailings, reducing the impact on the environment. In order to define more adequate concentration methods, we have used complementary analytical techniques such as optical (OM) and scanning and transmission electron microscopy (SEM and TEM), energy-dispersive X-rays (EDXs), X-ray fluorescence (XRF), and X-ray diffraction (XRD) to fully characterize the morphology, microstructure, chemistry, and mineralogy of the celestine mineral. The low-grade mineral is made of prismatic celestine crystals that are replacing a matrix of micro sparry calcite. Other minority minerals are strontianite, dolomite, quartz, and clays (kaolinite, paragonite, and illite). There is also a certain amount of iron oxides and hydroxides (mainly magnetite) associated with clays. We showed that the concentration of low-grade celestine mineral can be achieved through a low-cost and eco-friendly method based on grinding and size separation. The coarser fractions (>5 mm) have more celestine (up to 12 percent units higher than the starting unprocessed mineral) due to the selective loss of calcite and minority minerals (quartz, clays, and iron oxides) that are mainly found in the finer fraction (<1 mm). This process can make mine exploitation more sustainable, reducing the generation of residues that negatively impact the environment.

1. Introduction

Celestine (SrSO4) is the Sr-rich end-member of the (Sr, Ba) SO4 solid-solution series with barite (BaSO4) being the Ba-rich end-member [1,2,3,4,5]. Despite being nearly ideal, the (Sr, Ba) SO4 solid solution shows a marked bimodal composition close to pure or low-Ba celestine and pure or low-Sr barite, being minerals with intermediate composition rarely found in nature [6,7]. Celestine is a relatively common mineral in sedimentary environments, though large economically exploitable deposits are rare [1]. These deposits are commonly associated with coastal marine carbonate and evaporite deposits such as the one studied here in Montevive, located in the middle of the Granada depression, about 11 km SW of the city of Granada, between the towns of Las Gabias, La Malahá, and Alhendin, Spain [8,9,10,11,12,13]. These massive accumulations of celestine are thought to have formed during diagenesis due to the interaction of Sr-rich high-salinity solutions with carbonate and sulfate minerals [9,10,14,15,16,17,18].
Celestine is an economically important mineral as it is the principal source of strontium, an element recently classified as a critical raw material by the European Union [19]. Strontium is used for the production of pigments, ceramic and special glasses (X-ray safety glass), pyrotechnics, and electronics (semiconductors, permanent magnet) and in metallurgy, among many other industrial applications [20,21].
The Montevive celestine deposit is the largest reserve in Europe of this economically important strontium ore [22]. Even though the mineralogy and geology of the Montevive deposit have been studied in the past [10,16], this project aimed to study the mineralogy of the celestine mineral in more detail using state-of-the-art analytical techniques and instrumentation [23,24,25]. In particular, this study used complementary analytical techniques such as optical (OM) and scanning and transmission electron microscopy (SEM and TEM), energy-dispersive X-rays (EDXs), X-ray fluorescence (XRF), and X-ray diffraction (XRD) to fully characterize the morphology, microstructure, chemistry, and mineralogy of the celestine ore mineral. Rietveld refinement of X-ray diffraction data was used for quantitative mineral analysis and to study cationic substitution in mineral crystal structures [15,26,27,28,29,30]. Additional techniques such as thermogravimetry (TGA) were used to validate XRF and XRD data [31]. Specifically, TGA allows us to quantify the concentration of carbonate minerals in the sample. These data were used to validate carbonate mineral data obtained by XRF and XRD analysis. Finally, the combination of macroscopic and microscopic techniques allowed us to determine the chemical and mineralogical composition not only of the bulk but also of individual mineral grain [32]. Another important objective of this study was to validate a mineral concentration method based on grinding and size separation.
The mine produces over 200,000 tons of medium- high-grade minerals (80%) per year. High-grade celestine mineral has been traditionally sorted manually or by dry screening, and large amounts of uneconomical low-medium mineral (50%–65%) have been dumped in the mine tailings. To make mine operation more sustainable, it is necessary to process and concentrate this low-grade mineral [33]. In this regard, below, we demonstrate how a low-cost and simple concentration process based on grinding and size separation can improve the grade over a few percent units [34,35,36,37].

2. Materials and Methods

2.1. Celestine Ore

The ore body at Montevive consists of well-stratified, mineralized stromatolites. Single stromatolite banks (up to 50 cm thick) exhibit the following succession: (a) at the base, a finely laminated stromatolite (Figure 1A); (b) in the middle, a laminated stromatolite showing molds of small (up to 1 cm in size) prismatic and/or lenticular gypsum crystals displacing the lamination (Figure 1B); and (c) on the top, a more or less distorted stromatolite including molds of former and bigger (up to 10 cm in length) selenite gypsum crystals (Figure 1C). This succession reflects a progressive increase in the salinity of the environment.
According to Martín et al. [10], lamination in the Montevive stromatolites, originally carbonate in composition, is marked by the existence of alternating clear and dark laminae ranging in thickness from 0.05 to 1 mm (Figure 1A). A significant feature in these stromatolites is the presence of abundant, calcified “macrofilaments” (up to 0.1 mm in diameter and several millimeters in length), mostly visible in the clear laminae (Figure 1D) interpreted as cyanobacterial in origin. According to Martín et al. [10], in the Montevive deposit, two types of celestine are found. One variety consists of acicular crystals (0.15 mm long and 0.03 mm wide), largely replacing the micro sparite matrix of the clear laminae. The other variety occurs as first-generation cement (either tabular-prismatic or fibrous-radiating crystals, up to 0.6 mm long), filling in gypsum molds and synsedimentary fractures (desiccation cracks). Later, a sparry calcite cement, with crystals up to several centimeters in size, completes the void infilling. García Veigas et al. [16], however, considered the Montevive stromatolites as gypsified stromatolites, and the “macrofilaments” were thought to be fecal in origin. According to these authors, the celestine is replacing microcrystalline prismatic gypsum as pseudomorphs.
However, in the Montevive ore deposit, the degree of replacement of the former stromatolite by celestine varies from sample to sample, but in all of them, the remaining unreplaced mineral is always a carbonate (calcite and/or dolomite), not gypsum (see Figure 1D and Figure 2). Similar stromatolites have been described extending for kilometers at the margins of the Messinian basins of Sicily and Calabria [18]. They are comparable in size, detailed outcrop morphological features, and internal structure with those of Montevive except that they are not replaced by celestine. They also laterally change to gypsum and salt deposits as in the Granada Basin. They exhibit the same type of “macrofilaments” interpreted, in this study, as bacterial in origin. The Sicilian and Calabrian examples are, in all cases, carbonate stromatolites, not gypsified stromatolites. All in all, these facts suggest that the Montevive stromatolites were originally carbonate stromatolites, not gypsified stromatolites.

2.2. Mineral Samples

The material of the study was provided by the company “Canteras Industriales S.L” that exploits “Mina Aurora” in the Montevive deposit (Figures S1–S3). Representative celestine mineral samples from the Montevive deposit ranging in purity from 60% to 92% were analyzed. First, about 1000 kg of celestine mineral from selected points from the main mine (E70, E80, E90 and E92) or from the mine tailing (E60 and E69) was collected. From each sampling site, of the total volume of mineral, 1/8 was collected with a loader (L110E Volvo), homogenized, and milled until it reached a particle size of less than 10 mm. About 2 kg of mineral was used for granulometry and optical microscopy analysis. Granulometry of the three main types of samples (E60, E69, and E92) was carried out with an electric sieve shaker (Octagon 2000, Endecotts, London, England) and certified Test Sieves (2000 series, Endecotts, London, England) with 20, 50, 71, 199, 200, 315, 400, and 500 μm and 1, 2, 3.15, 5, and 10 mm sizes (Figure S4). Six fractions of the same mineral sample with different particle sizes were selected and analyzed: 1 (0.1–0.3 mm), 2 (0.3–0.5 mm), 3 (0.5–1.0 mm), 4 (1–2 mm), 5 (2–5 mm), and 6 (5–10 mm) (see Figure S5). After size separation, the fractions were grounded to a particle size of less than 100 µm using a bar mill (1.5 m × 0.25 m steel cylinders). These processed samples were used for chemical and electron microscopy analyses. X-ray fluorescence was performed on a spectrometer used for internal quality control at the mine. Microscopy, thermogravimetric analysis, and X-ray diffraction analysis were carried out with the equipment available at the Departamento de Mineralogía y Petrología and Centro de Instrumentación Científica (Universidad de Granada, Granada, Spain).

2.3. Microscopy

Double-polished thin sections (<30 μm) of the celestine mineral were prepared for optical microscopy. An LZM 1000 microscope (Nikon, Tokyo, Japan) with polarized light was used for imaging and microphotography. A ferricyanide dye was used for carbonate staining. Powdered mineral samples were analyzed by high-resolution scanning electron microscopy (SEM) and energy dispersive X-rays (EDXs) using a Quanta 400 SEM microscope (FEI, USA) operated at 10 kV. Prior to observation, samples were coated with carbon (Hitachi UHS evaporator, Japan). The same samples were also analyzed by transmission electron microscopy (TEM) using a Thermo Fisher TALOS F200X TEM microscope equipped with HAADF and EDX detectors.

2.4. Thermogravimentric Analysis

Mineral samples were analyzed by thermogravimetry (TGA) and differential scanning calorimetry (DSC). About 30 mg of the material was analyzed using a system from METTLER-TOLEDO (mod. TGA/DSC1). A heating rate of 20 °C/min in air was used for registering the TGA and DSC curves. From the TGA curves, the weight loss due to water (25–200 °C) and CO2 loss due to carbonate thermal decomposition (600–900 °C; CaCO3 >= CO2 + CaO) were determined. From the weight loss due to carbonate thermal decomposition, the percentage of carbonate minerals in the samples can be calculated [37]. These values were used to validate the carbonate mineral concentrations determined by other methods (XRF and XRD).

2.5. X-ray Fluorescence and X-ray Diffraction

The chemical composition of bulk samples was determined by X-ray fluorescence (XRF) [38,39,40,41] using an S2 Ranger Bruker energy-dispersive spectrometer (Bruker-AXS, Ettlingen, Germany) equipped with an X-ray tube with Pd anode and an EDX detector with <155 eV resolution. The system was calibrated using a Cu disk and checked with a glass BAXS-S2.
For the mineralogical and crystallographic characteristics of the mineral, the samples were analyzed by high-resolution X-ray diffraction (XRD) with an Xpert Pro X-ray powder diffractometer (Panalytical, The Netherlands). The samples were measured in reflection mode using copper radiation (from 4 to 120° with 0.017° step size and 100 s integration time per step). Identification of main mineral phases present in the samples (celestine, strontianite, barite, Mg-calcite, dolomite, quartz, kaolinite, illite, and paragonite) was carried out using XpowderX Ver. 2020.01.03 software (www.xpowder.com, accessed on 20 March 2021). Rietveld refinement analyses of XRD profiles were performed using TOPAS 5.0 software (Bruker, Germany) to determine quantitative mineral concentration and unit cell parameters to study ionic substitutions in solid solutions. For peak profile analysis, the fundamental parameters method (FPA) was used [26]. The previously identified mineral phases were defined using the TOPAS mineral database (.str files). Additionally, the clay mineral fraction was analyzed after acid leaching and centrifugation to separate the <2 µm fraction and prepare oriented aggregates to analyze clay basal reflections. Slides were solvated in ethylene glycol at 60 °C to study clay expansion.

3. Results and Discussion

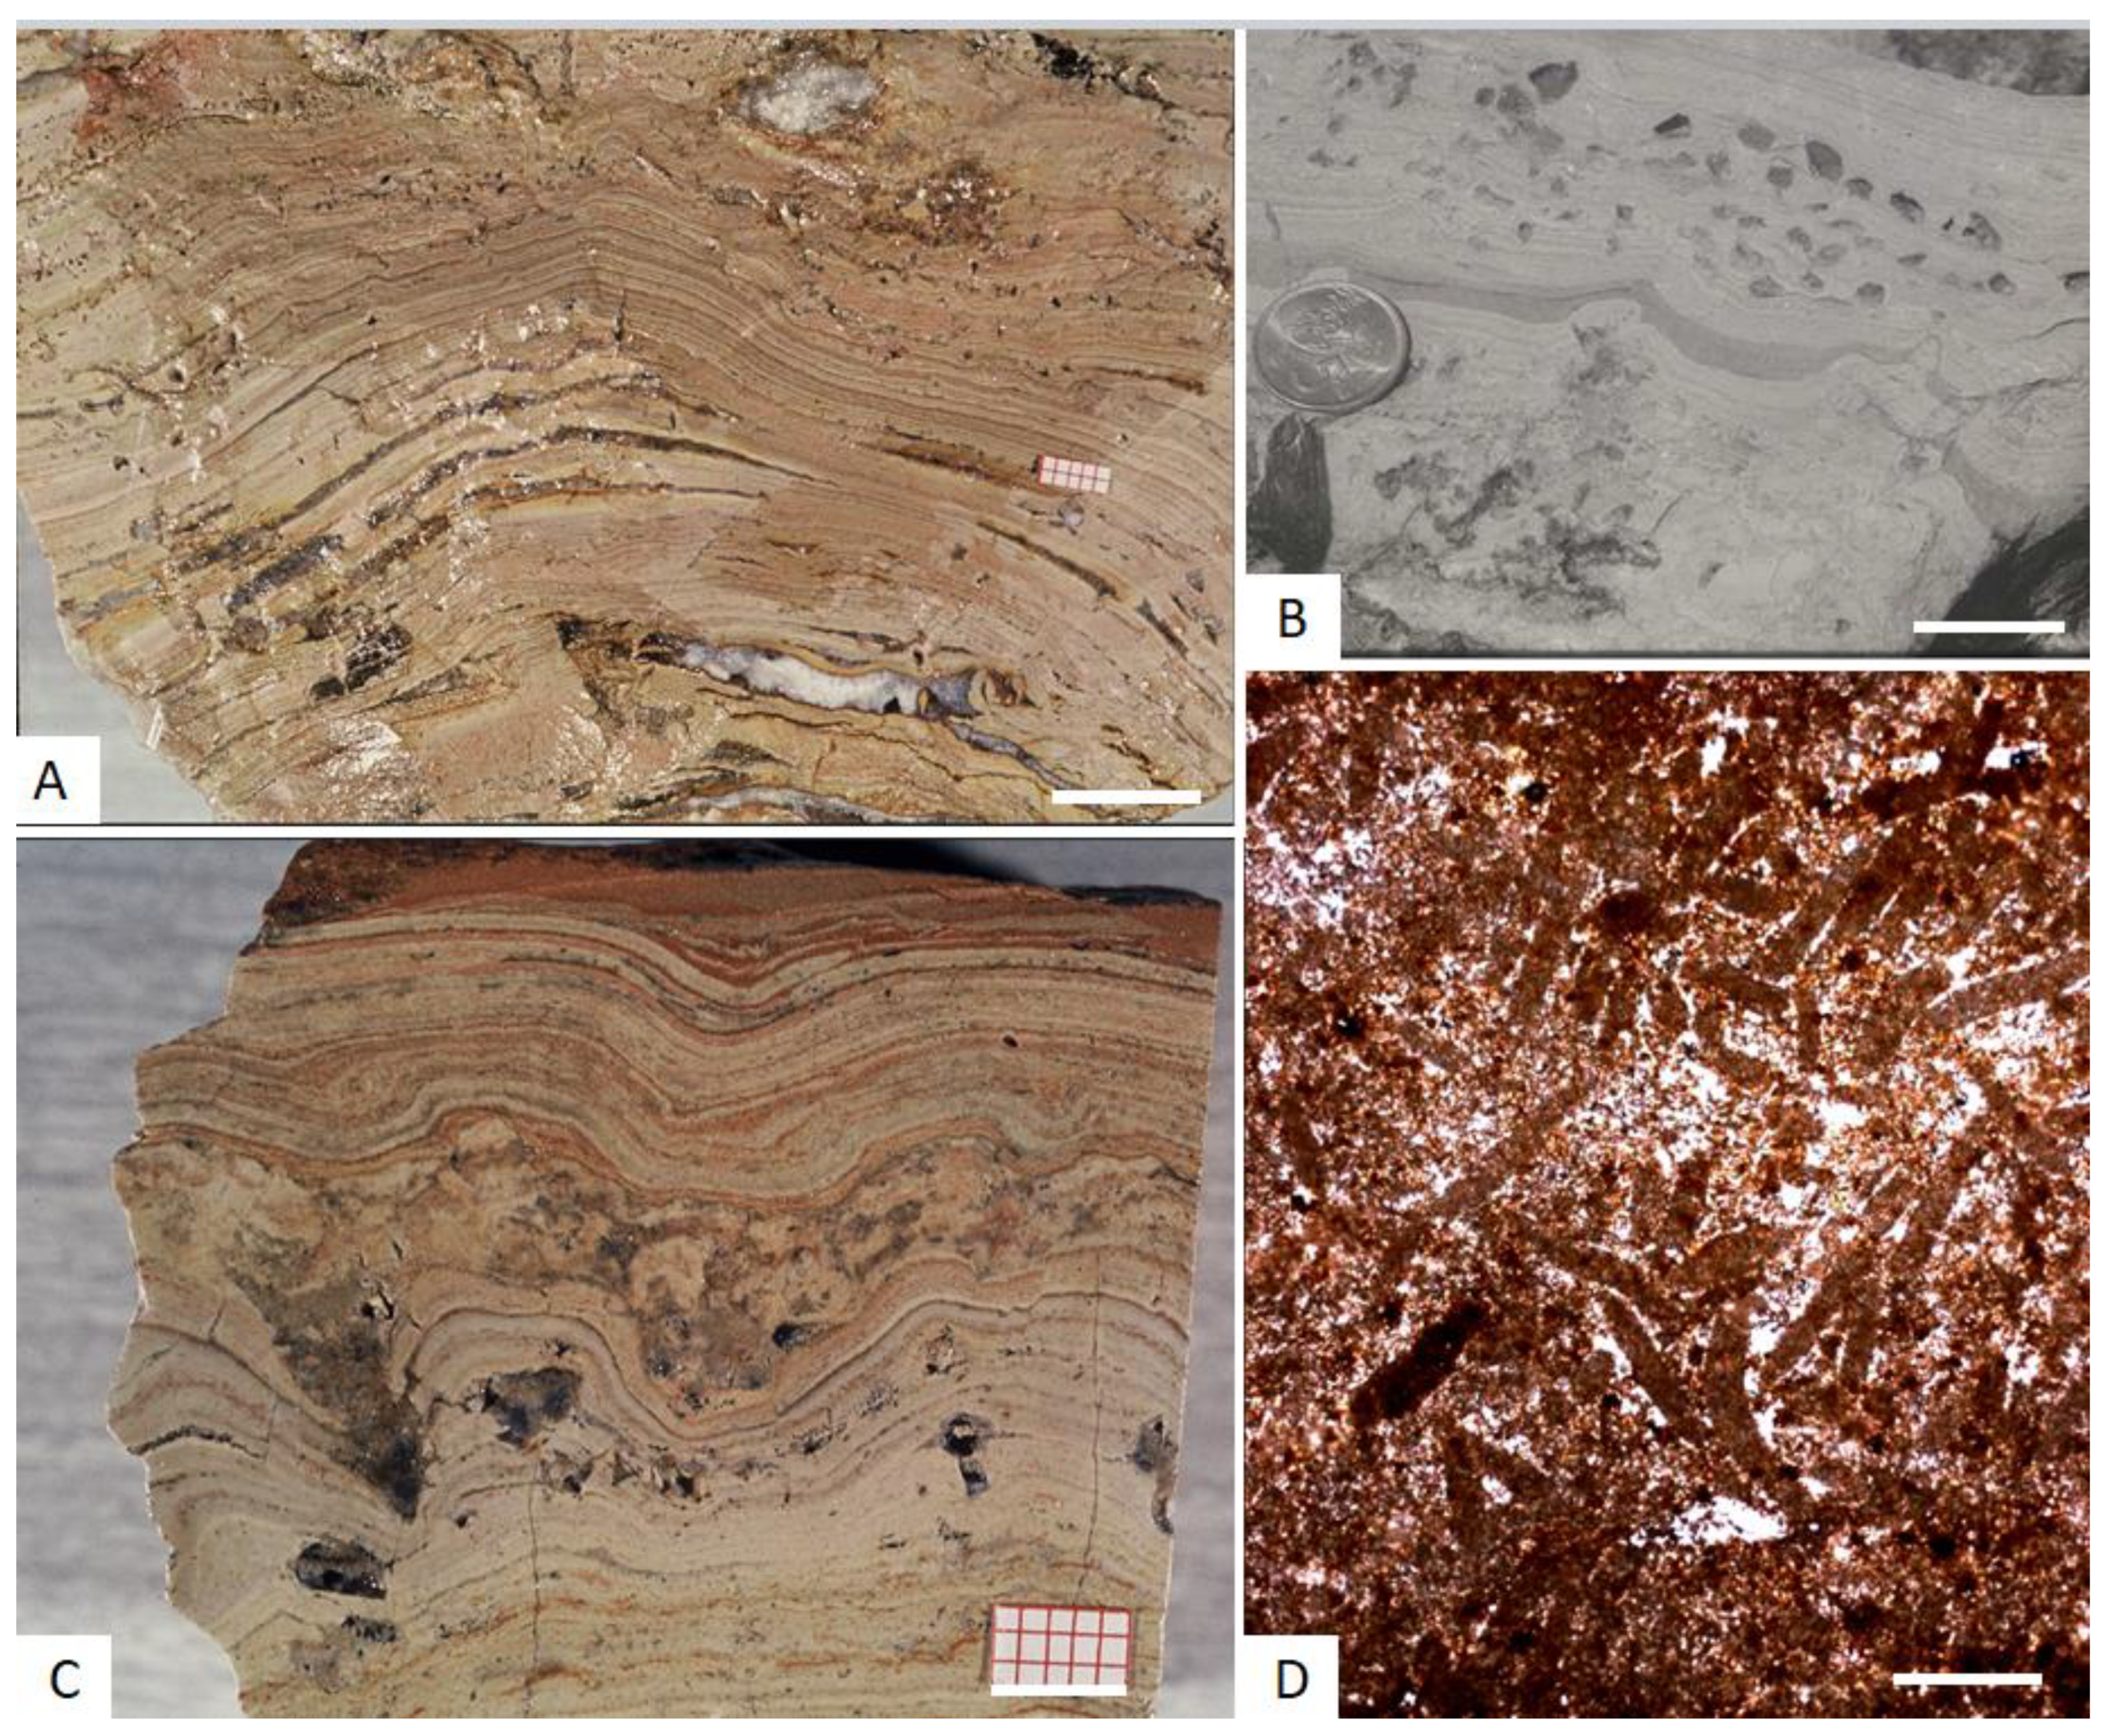
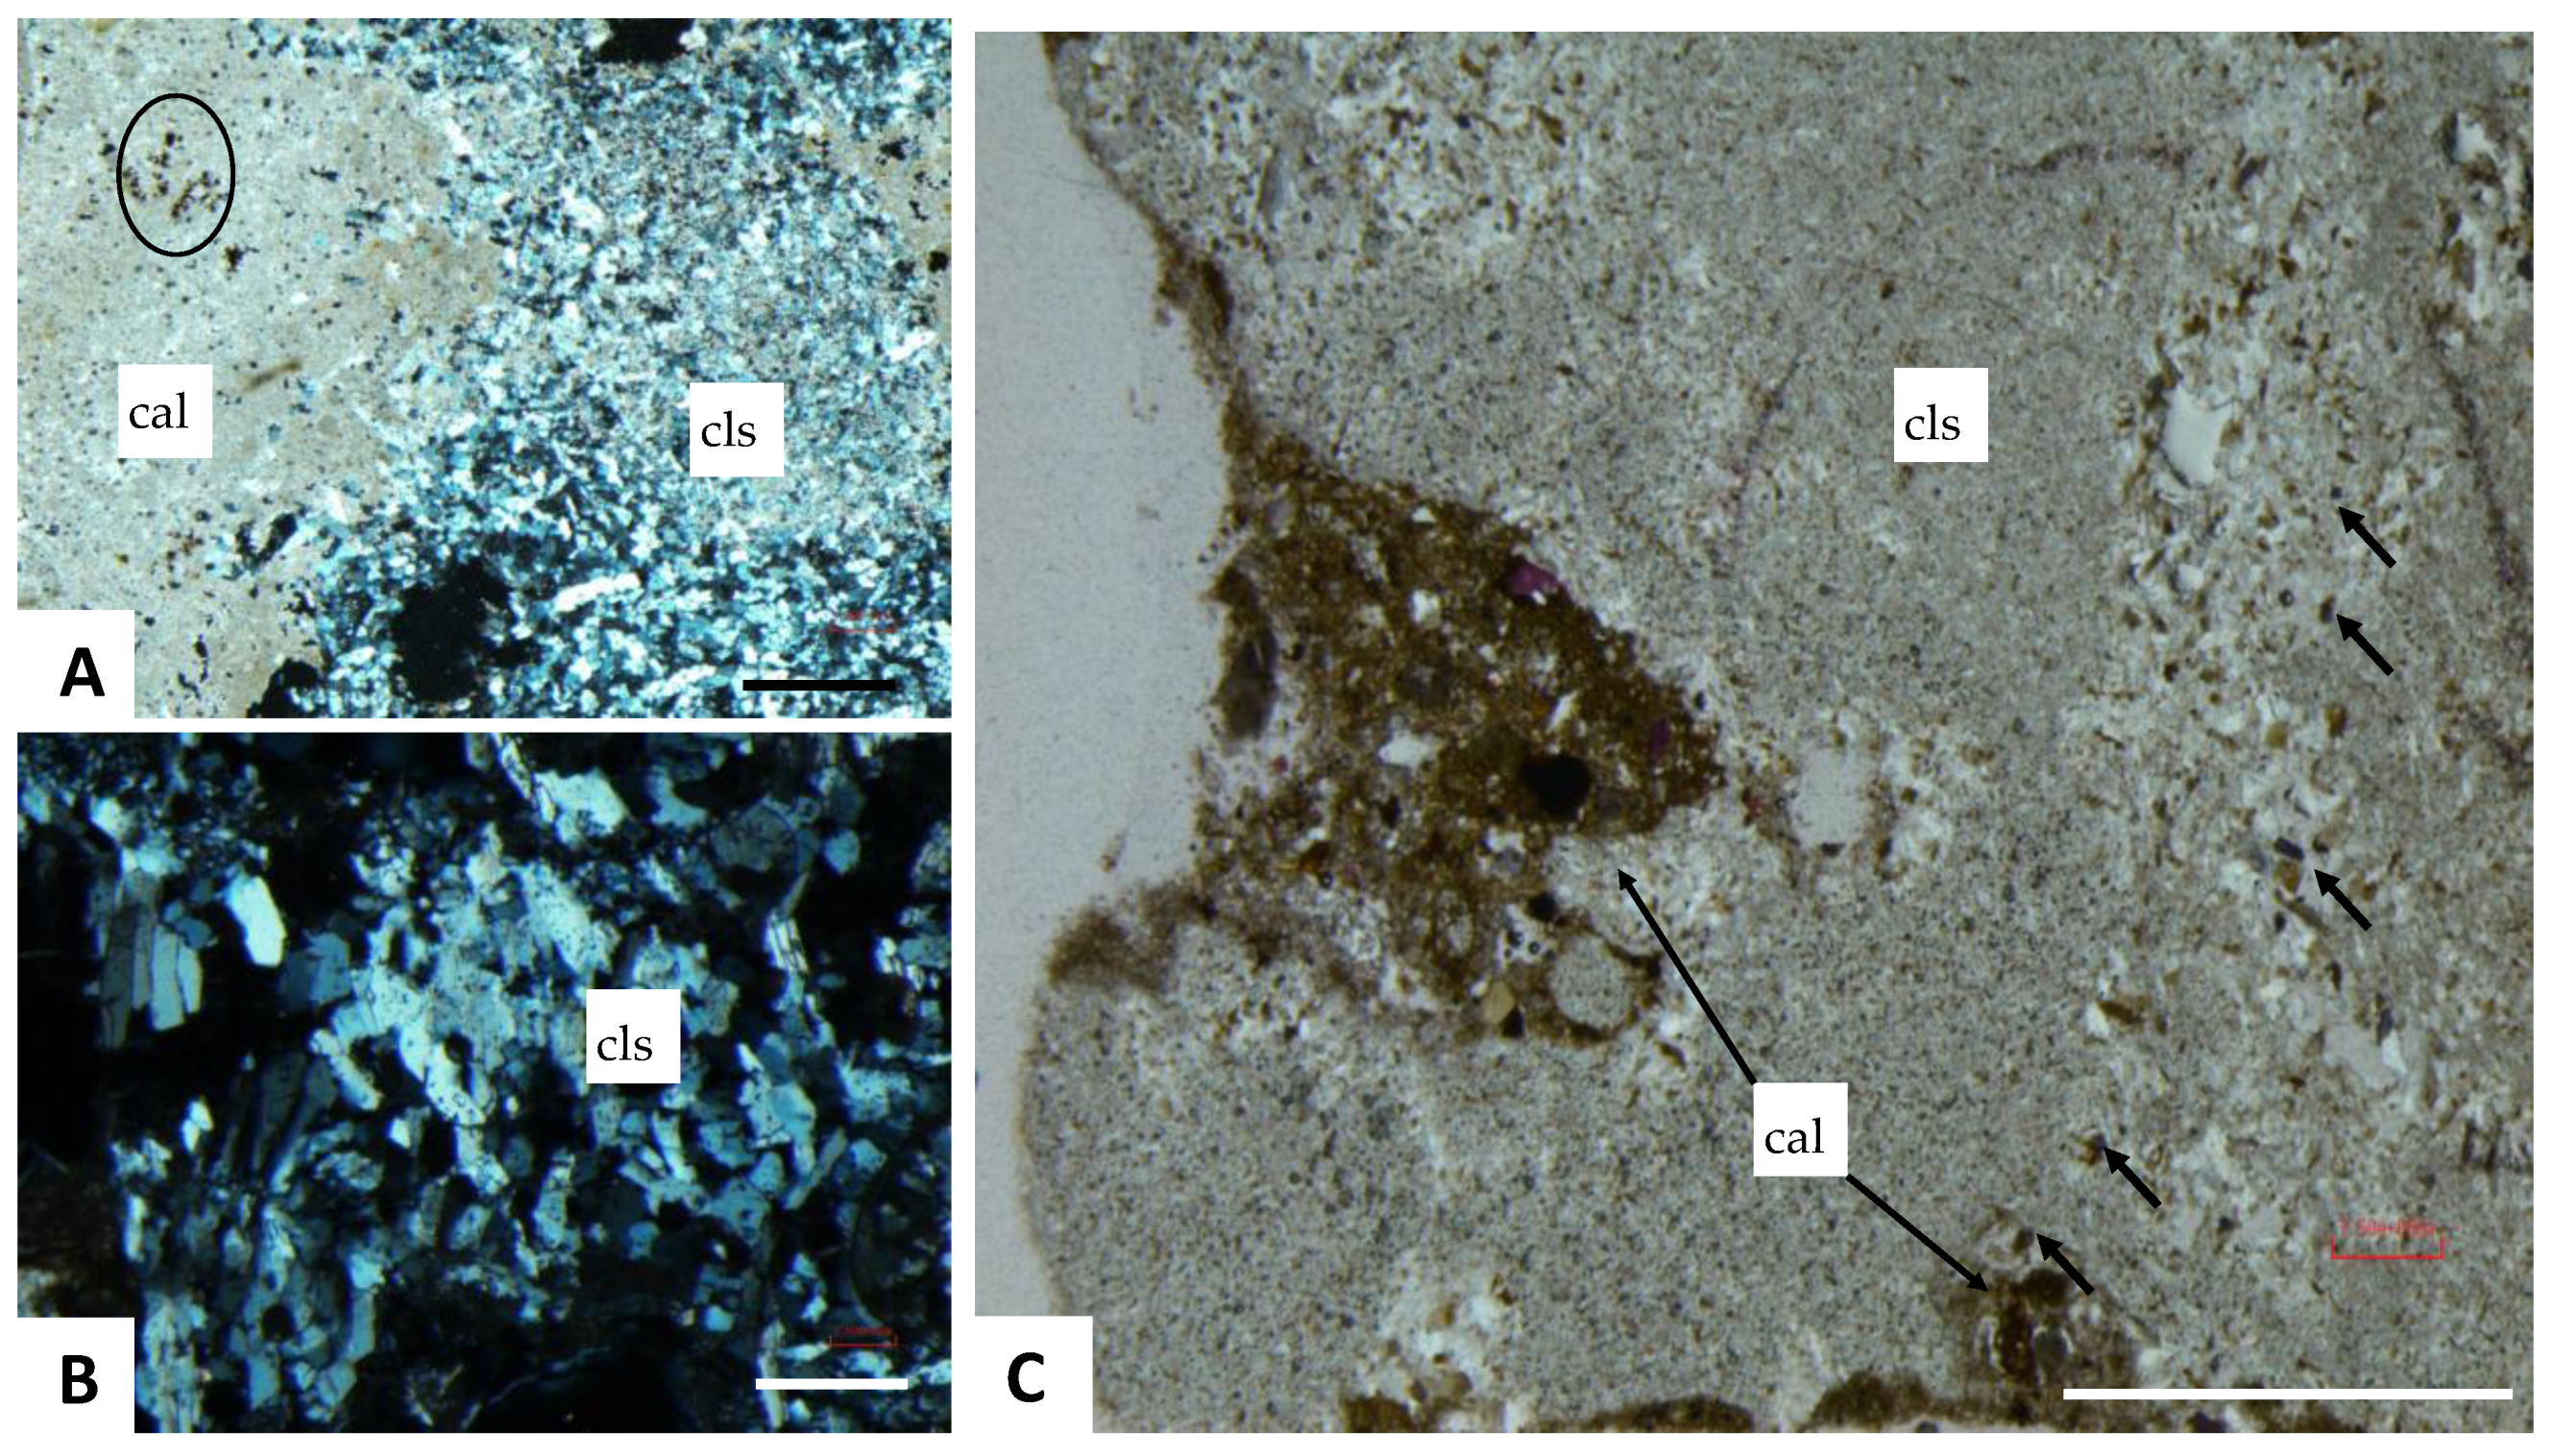
3.1. Optical Microscopy

Optical microscopy was used to analyze the distribution of mineral phases at the millimeter to micrometer scale. Figure 2A displays a view with cross-polarized light showing the calcite matrix in close contact with a massive aggregate of prismatic celestine crystals (from >100 µm to <10 µm in size) that are replacing the calcite matrix (Figure S6). Figure 2B shows the microstructure of a high-grade mineral (E92) made of a massive aggregate of prismatic celestine crystals of larger size (>200 µm). The macrocrystalline celestine corresponds to a first-generation cement, filling in cavities left by desiccation cracks or after larger (up to a few centimeters in size) selenite and/or smaller (a few millimeters in size) prismatic or lenticular gypsum crystal dissolution (Figure 1) [10]. Figure 2C shows a representative view of a thin section of a prewashed medium-grade mineral (E69 observed with plain-polarized light). It has a massive calcite microspar matrix that is stained slightly brownish-black by iron oxides and hydroxides. It has a significant amount of porosity, and there are dolomite microcrystals scattered within the higher porosity zones. Dolomite crystals are stained in blue with ferricyanide.

3.2. Granulometry Analysis

Table 1 shows the granulometry of the representative samples of unprocessed mineral (E60, E69, and E92). In sample E60, the predominant fraction is 5–10 mm in diameter, accounting for 32% of the mineral mass. In samples E69 and E92, the predominant fraction is >10 mm, accounting for 29% and 33% of the mineral mass, respectively (see Figure S8 and Table S1). After granulometry, the samples were classified in size fractions (1–6), which were then used to study the effect of grain size on mineral composition.

3.3. Scanning Electron Microscopy

Scanning electron microscopy was used to analyze the mineral at higher magnification. Figure 3 and Figure S7 show representative SEM images of a low-grade mineral (E60) sample as seen in back-scattering (BS) mode, showing celestine crystals with brighter illumination (high electron density) and carbonate and silicate minerals with lower illumination (lower electron density). There were isolated celestine crystals with a prismatic morphology as well as aggregated celestine crystals that were cemented and/or coated by calcite microcrystals (5–10 µm in size) that showed a characteristic rhombohedral morphology. Furthermore, isolated dolomite microcrystals (<5 µm in size) were found disseminated within the mineral. Kaolinite microcrystals, which demonstrate a characteristic platy shape, were also found associated with the calcite cement. Iron-rich mineral (iron oxides and hydroxides) deposits (<1 µm in size) were also scattered within the mineral (Figure 3E,F). No obvious crystalline morphology was observed for these minerals, even at high magnification. EDX maps showing the distribution of relevant chemical elements (Sr, Ca, Ba, Al, and Fe) are superimposed onto the BS-SEM images shown above (Figure 3D–F). Celestine crystals are highlighted in blue. The EDX spectra of isolated celestine crystals show that most of them have some amount of Ba (in yellow), though it is highly variable. It was also noted that Ba can be concentrated in parallel veins cutting across celestine crystals as shown in Figure 3F. This could be due to an ex-solution process of a Ba-rich phase (barite). There are regions where, because of rough sample topography, no EDX signal was collected due to shadowing, even though there were celestine and calcite crystals clearly distinguished (lower part of Figure 3A,E). Kaolinite crystals were identified by their platy shape and high Si and Al signal.

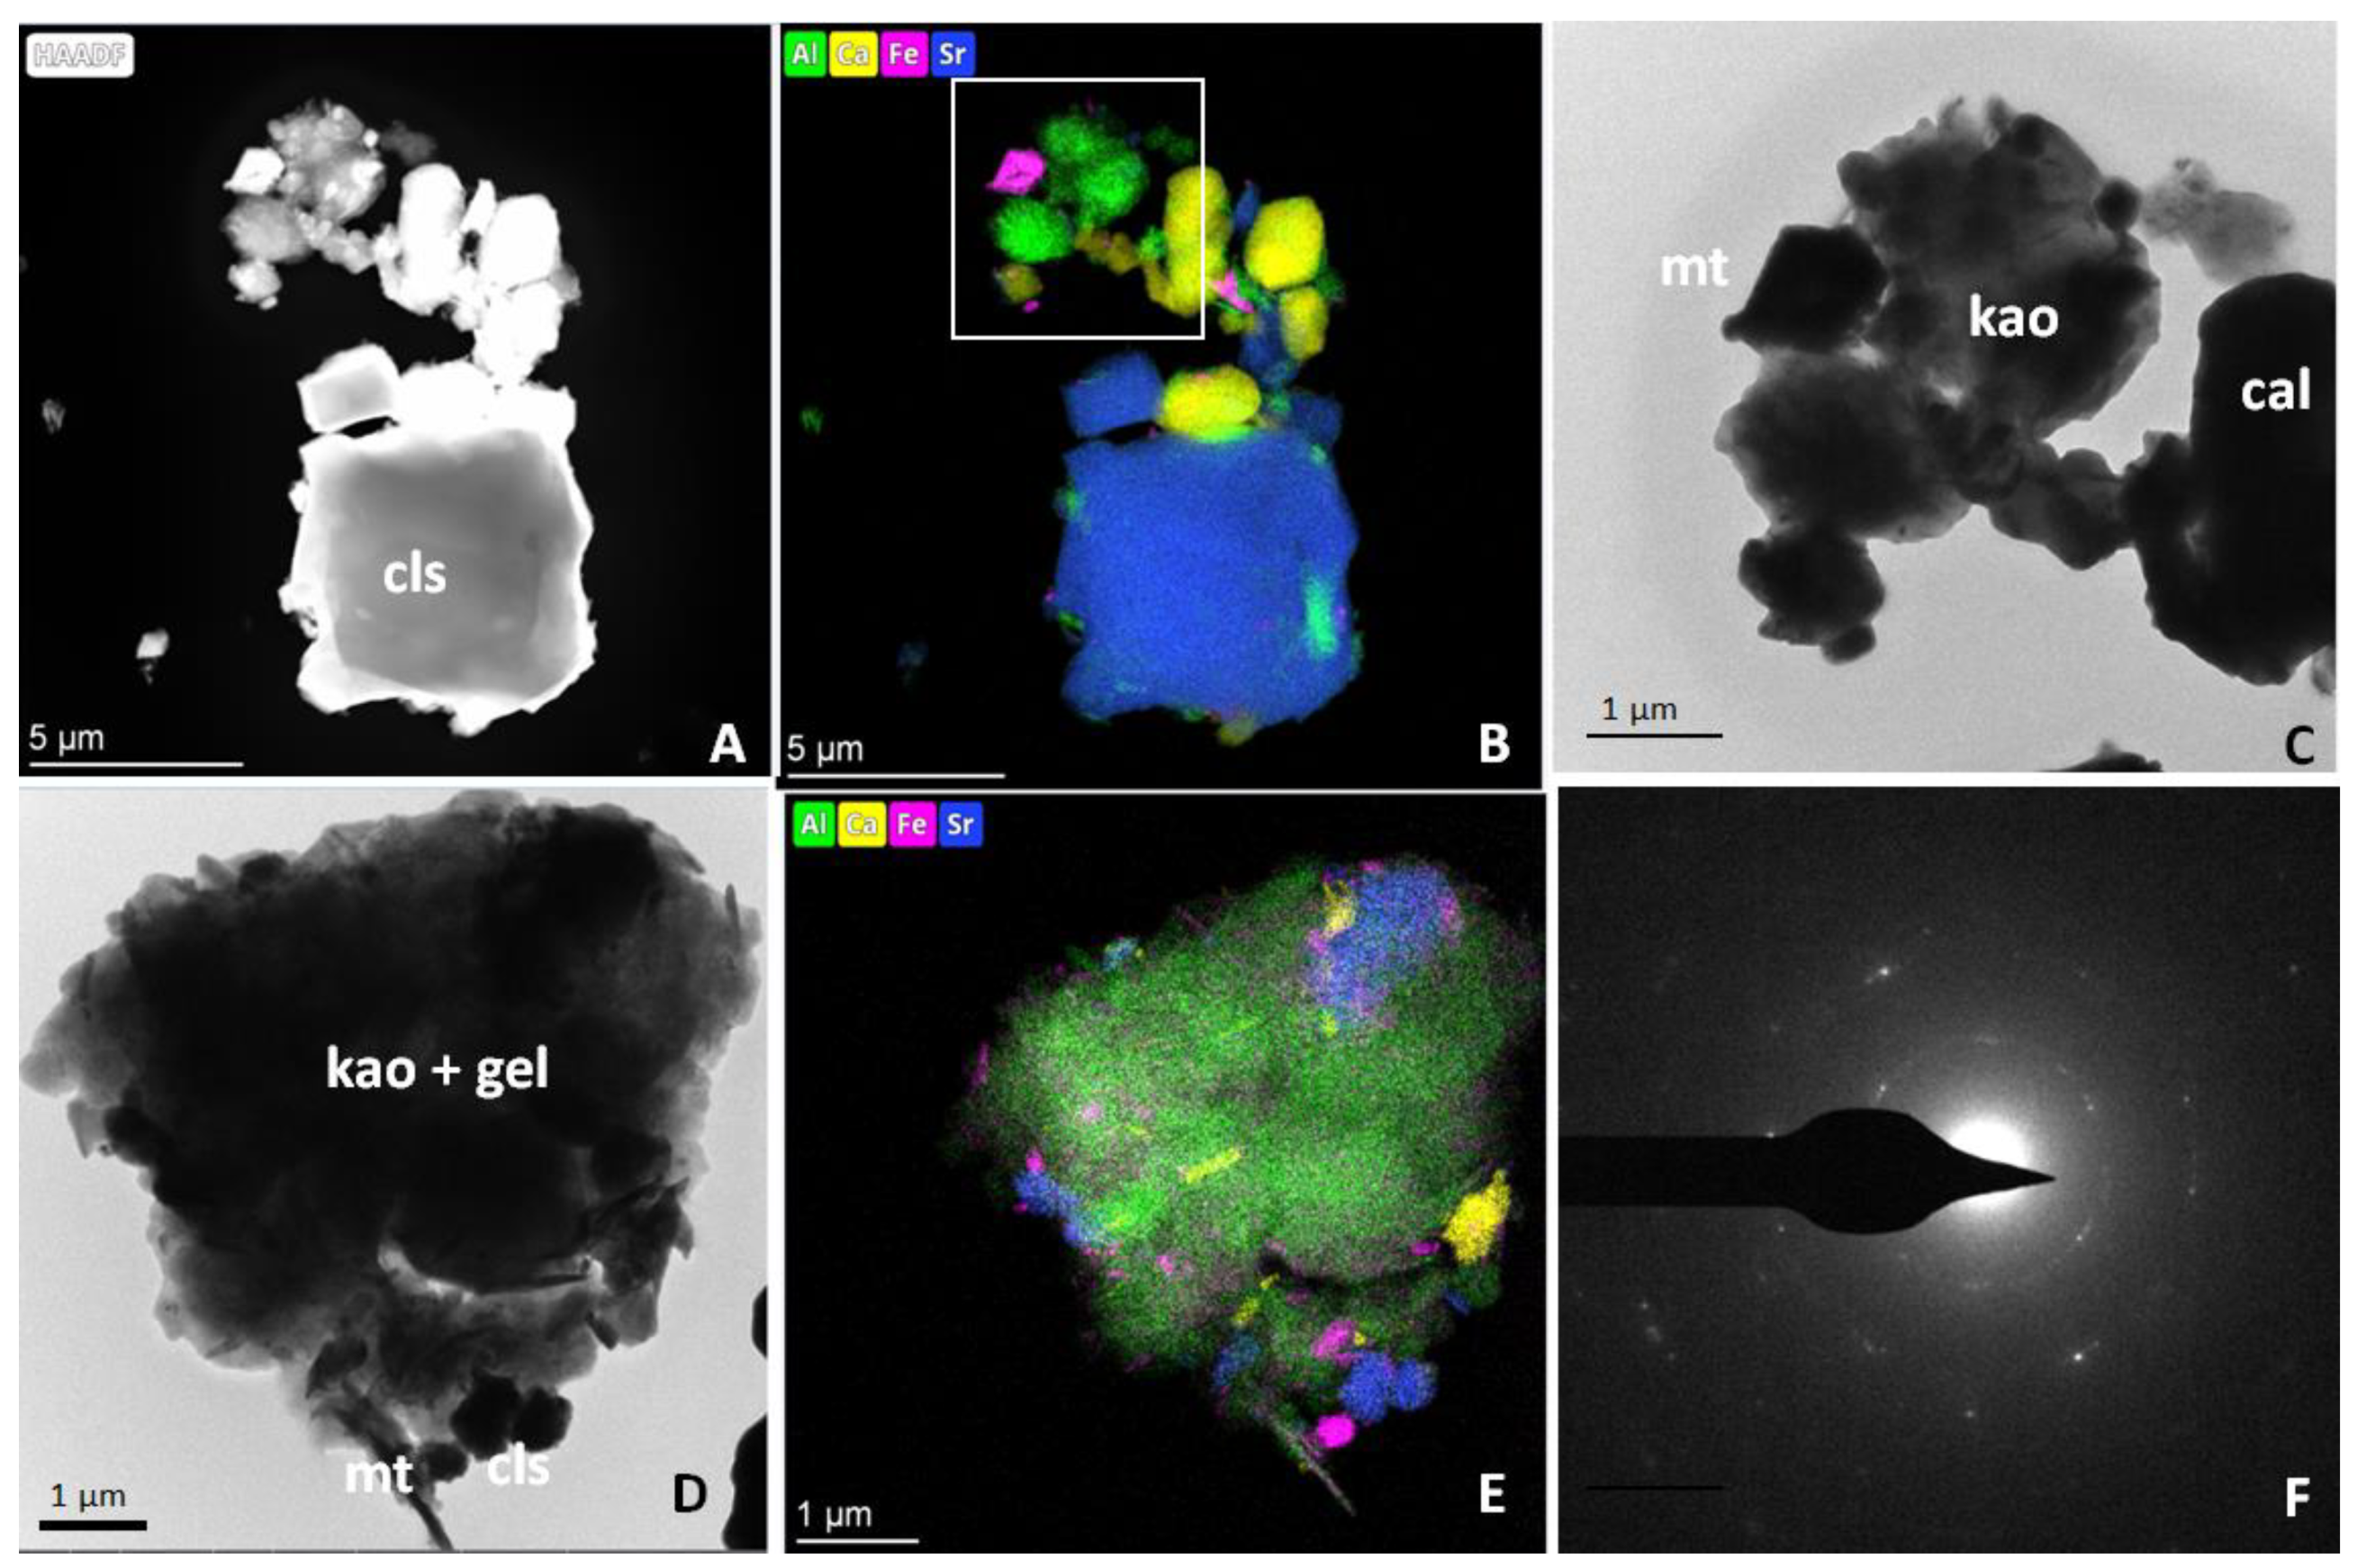
3.4. Transmission Electron Microscopy

Transmission electron microscopy was used to analyze the mineral in more detail. Figure 4 shows representative TEM images of a low-grade mineral (E60) sample with different mineral assemblages made of celestine and calcite crystals associated with clay mineral particles. EDX maps exhibit the distinct chemical composition of different mineral particles in the assemblage. The clay mineral particles were very thin platy crystals rich in Si and Al, which were identified as kaolinite (as confirmed by their characteristic d-spacings in SAED patterns). The kaolinite crystals were often embedded in a low-density gel-like material rich in Si and Al. There were also isolated iron-rich nanoparticles (<200 nm in size) in the assemblages, which demonstrated well-developed crystal faces and produced well-defined diffraction spots with d-spacings (i.e., 0.252 nm) characteristic of magnetite (Figure 4F).

3.5. X-ray Fluorescence

X-ray fluorescence analysis was used to determine the bulk chemical composition of the mineral samples and how concentration changes with grain size separation (Figure S9). It shows that the main chemical components determined by XRF are SrSO4, BaSO4, CaCO3, MgCO3, SiO2, Al2O3, and Fe2O3 as shown in Table 2 and described in more detail hereafter. The main chemical component was SrSO4, with concentrations ranging from 63% to 95%. The second most abundant was CaCO3, from 20% to 46%. SiO2 and Al2O3 accounted for 10% or less. The rest of the components were less than 5%.
On the other hand, the celestine ore was grounded and separated in six different grain size fractions, starting from 1 (0.1–0.3 mm) to 6 (5–10 mm), which all significantly differed in their chemical composition. Generally, there is a gradual increase in SrSO4 concentration with particle size. For instance, in the low- to medium-grade mineral (E60 and E69), SrSO4 increases from 60%–64% in the lowest grain size fraction (EXX_1: 0.2–0.5 mm) to 68%–72% in the coarser size fraction (EXX_6: >5 mm). The increase in SrSO4 concentration is due to the fact that the larger size fractions have a decreased amount of Fe2O3-, SiO2-, and Al2O3-rich components. However, this trend is not so evident in the high-grade mineral (E92). Overall, the results suggest that mineral classification and selection of coarser mineral particles (>5 mm), which represents over 45% of the starting mineral weight, is a low-cost and effective method to concentrate low- and medium-grade celestine ore.

Correlation Analysis

Pearson correlation analyses for the main chemical components determined by XRF are shown in Table 3. These data provide additional information regarding the chemistry of the mineral and the relationship among chemical components. For instance, there is a strong negative correlation between SrSO4 and CaCO3 (R = −0.939; p < 0.001) as celestine (SrSO4) is replacing the calcite (CaCO3) matrix. SrSO4 is positively correlated with BaSO4 as Ba is incorporated into celestine, as discussed in the XRD section. SiO2 and Al2O3 are strongly and positively correlated (R = 0.862; p <0.001) as they are the main chemical components of clay minerals (kaolinite and paragonite). When plotting SiO2 versus Al2O3, most of the points fall in a straight line except for a few points, which we assume are due to quartz (SiO2) (see Figure S10). The previous components (SiO2 and Al2O3) are also highly and positively correlated with Fe2O3 (R = 0.909; p < 0.001), indicating that iron oxides and hydroxides are associated with clays. On the other hand, MgCO3, which is part of dolomite, is also highly correlated with SiO2 and Al2O3 and not correlated with CaCO3, indicating that dolomite is associated with clays and not with calcite [42].

3.6. X-ray Diffraction

The results of the X-ray diffraction analysis show that the main mineral phases present in the celestine ore are sulfates (celestine), carbonates (calcite, dolomite, and strontianite), and silicates (quartz, kaolinite, paragonite, and illite) as shown in Table 4 and described in more detail hereafter. The concentration of each mineral was determined using Rietveld refinement of XRD data considering the previously identified mineral phases (see SI Figure S11). In addition, Rietveld analysis was used to refine unit cell parameters to study ionic substitutions in main mineral phases (celestine, calcite, and dolomite).

3.6.1. Sulfates

Celestine was the main mineral phase found in the samples, with concentrations ranging from 60% up to 92%. No other sulfate mineral (barite, gypsum, or anhydrite) was detected by XRD. However, XRF and EDX data show a significant concentration of Ba (up to 1.3% from XRF data), which seems mainly incorporated into the celestine as a solid solution. The incorporation of Ba into the celestine structure produced a significant increase in the crystal cell parameters (up to 0.1% in the a-axis). Interestingly, the lattice distortions are greater in the mineral with the highest celestine concentrations (E92), which indicates that the barium content in celestine in these samples is slightly higher. For instance, the estimated Ba content in celestine ranges from 0.4% in the samples with 60% celestine (E60) to 1.7% in the samples with 92% celestine (E92). This was estimated from the unit cell parameters (a-axis) of the Ba-celestine, considering the parameters of pure celestine and barite as end members of the solid solution. EDX maps show that Ba is only associated with celestine through its distribution in some crystals, which is not homogenous. Furthermore, some crystals contain parallel veins, which could be indicative of an ex-solution process of a barium-rich phase (Figure 3F).

3.6.2. Carbonates

Calcite was the main carbonate mineral (up to 57%) that formed part of a massive aggregate of micro sparry calcite crystals that have been partially replaced by celestine (Figure 2). Calcite also occurs as a late, second-generation cement, filling in gypsum-crystal molds, desiccation cracks, and veins, after the first-generation, coarse-crystalline celestine [10]. Subsequently, there is a strong negative correlation between the concentrations of the two mineral phases (R = −0.940; p < 0.001). It has a low Mg content (<0.8%) as estimated from the calcite unit cell parameters [37]. Dolomite was found in all samples (up to 5.5%) except in the high-grade ones (92% celestine; E92). Another minority carbonate mineral found was strontianite, which showed the highest concentration (up to 3.1%) in the lower-grade mineral (E60).

3.6.3. Silicates

Quartz was present in all mineral samples (up to 5.1%) and was associated with clay minerals (kaolinite, paragonite, and illite). Kaolinite (up to 6.0%), paragonite (up to 4.8%), and illite (<0.5%) were the main clay minerals determined by XRD analysis. Interestingly, in the minority phase, illite was the most abundant clay mineral in the high-grade mineral (92% celestine), whereas kaolinite and paragonite were the dominant phases in the lower-grade ore (60%–80%). All these minerals are commonly found in terrigenous sediments derived from the erosion of the Sierra Nevada mountain range and are transported by rivers into the Granada Basin [10]. The mineralogy of clays was confirmed by the preparation of oriented aggregates showing that paragonite and kaolinite were the main clay minerals in the celestine mineral (Figure 3).

3.6.4. Other Minerals

The results of the XRF analysis show that there was a significant amount of iron oxides (up to 4% in lower-grade mineral), though no iron oxides and hydroxides minerals were detected by XRD analysis. However, optical microscopy and SEM-EDX maps show that they are Fe-rich mineral particles, whereas the results of the TEM analysis show that they are magnetite. Terrigenous sediments in the Granada Basin typically have a significant amount of iron oxides.

3.6.5. Correlation Analysis

Correlation analyses for the main mineral phases determined by XRD are shown in Table 5. These data provide additional information about the mineralogy of the samples. For instance, there is a strong negative correlation between celestine and calcite as the calcite micritic matrix is replaced by celestine. Calcite strongly correlates with clays but not with dolomite, which indicates that these two carbonates are not associated with each other. Strontianite is strongly and positively correlated with calcite, dolomite, quartz, and clay minerals and negatively correlated with celestine. In particular, strontianite shows the strongest correlation with dolomite, suggesting a common origin. Dolomite and other minority minerals could have a microbial origin [43]. Celestine replacement of the carbonate matrix could be interpreted as a mineral dissolution replacement reaction. When a solution comes into contact with highly soluble chemically reactive minerals (i.e., calcite and gypsum), they start to dissolve, releasing ions that induce the precipitation of less soluble minerals (apatite, celestine, and barite) [6,44]. In the dissolution–replacement reaction, there is some porosity generation that facilitated its progression. In this case, the high porosity of the carbonate matrix should have facilitated the replacement.
Clays (kaolinite and paragonite) are strongly correlated among themselves. Quartz comprises all parts of the finer fraction of the mineral. Another interesting relationship is the strong and positive correlation between iron oxides and the concentration of quartz and clay minerals, particularly kaolinite (R = 0.810; p < 0.001). Figure S10 shows the relationship between % Al2O3 and % SiO2 obtained by XRF. This association is confirmed by TEM showing magnetite with kaolinite. The association of iron oxides with clay minerals (kaolinite) suggests a common detrital origin.
Overall, these results are consistent with XRF data, which show a high correlation with XRD data for the main chemical and mineral components (Figure S12). However, linear regression analysis of XRF and XRD data for some minerals shows that XRF data underestimate the concentration of certain minerals (calcite) (Figure S13) as independently confirmed by TGA (see Table S2 and Figure S14). The later data show that there is a better correlation between the calculated concentrations of carbonate minerals by quantitative XRD Rietveld analysis and TGA data than by XRF and TGA data. Moreover, XRD analysis provides complementary and more detailed information about different minority mineral phases (strontianite, dolomite, and clays) and their chemical associations, which was not possible to obtain from only XRF or EDX data. The results of the TEM analysis confirmed the occurrence of specific clay minerals (kaolinite) and the presence of magnetite nanoparticles, which were associated with clays.
On the other hand, the grinding and size separation processes produced mineral fractions with significantly different mineral compositions. In coarser fractions (e.g., E60_6), there was a gradual loss of calcite, whereas in the more fine-grained minerals (clays), there was a significant enrichment of the ore that increased the concentration of celestine up to 12 percent units (from 55.7% up to 67.9%; E60; Table 4). In high-grade minerals (E92), as also seen by XRF, there was no additional increase in the concentration of celestine, and there was only a small reduction in the amount of clays. Therefore, there is no clear benefit in applying this method to a high-grade mineral.

4. Conclusions

Montevive celestine ore is made of prismatic celestine crystals that are replacing a matrix of micro sparry calcite. Other minority minerals are strontianite, dolomite, quartz, and clays (kaolinite, paragonite, and illite). There is also a certain amount of iron oxides and hydroxides (mainly magnetite) associated with clays. This study analyzed the mineralogy of celestine using complementary analytical techniques (XRF, XRD, SEM-EDX, TEM-EDX, and TGA), which provides detailed information about mineral associations and their origin. For instance, XRD Rietveld quantitative analysis provides more detailed information about different minority mineral phases (strontianite, dolomite, and clays) and their chemical associations, which was not possible to obtain from XRF or EDX data alone. TEM analyses confirm the occurrence of specific clay minerals (kaolinite) and the presence of magnetite nanoparticles associated with clays. The combination of different techniques also allowed us to validate the results obtained from other techniques (TGA and XRD for carbonate mineral). These data show that XRD Rietveld quantitative analysis provides a better estimation of the concentration of certain minerals (e.g., calcite) than XRFThis study demonstrated that low- to medium-grade celestine mineral (about 60% celestine), which is currently uneconomical and accumulated in dumps and mine tailings, can be concentrated through a low-cost and eco-friendly method based on grinding and size separation. The coarser fractions (>5 mm) have a greater concentration of celestine (up to 12 percent units more) due to the selective loss of calcite and other minerals (quartz, clays, and iron oxides). This process cannot be applied to high-grade minerals (about 90% celestine) as there is no additional increase in the concentration of celestine. This study can help in the exploitation and enrichment of mineral deposits, reducing the economic cost of extraction while minimizing the generation of residues that negatively impact the environment. This would, in turn, make the mine operation more sustainable and eco-friendlier. In the near future, other mineral concentration methods (based on high-density media) will be analyzed.

Supplementary Materials

The following supporting information can be downloaded at: https://www.mdpi.com/article/10.3390/min12101261/s1, Figure S1: Sample E70, Figure S2: Sample E 80, Figure S3: Sample E90. Figure S4: Assembly electric vibrator, Figure S5: Gravimetry fractions, Figure S6: Optical microscopy of celestine crystals replacing carbonate, sample E69., Figure S7: Scanning electron microscopy (a) and compositional SEM map of E69 sample (b).,Figure S8: Granulometry results, % massr and fi to each diameter (mm) in E60, E69, E92 samples, Figure S9: X-ray fluorescence (representative XRF spectra of one of the samples (E69), Figure S10: Correlation Al2O3/SiO2 obtained in XRF.,Figure S11: Rietveld refinement of X-ray diffraction data used for quantitative mineral analysis, Figure S12: Linear regression model between % Sr(SO4)Ba obtained by XRF and DRX, Figure S13: Linear regression model between % CaCO3 obtained by XRF and DRX, Figure S14: % CaCO3 by TGA vs. % CaCO3 by XRF or DRX; Table S1: Granulometry results, % massr and fi to each diameter (mm) in E60, E69, E92 samples, Table S2: Comparative % CaCO3 by DXR, XRF and TGA methods.

Author Contributions

Conceptualization and methodology: A.B.R.-N., M.J.M.-B., M.C.d.H. and N.A.-R.; software, N.A.-R. and M.J.M.-B.; validation and formal analysis: A.B.R.-N. and N.A.-R.; investigation: A.B.R.-N. and N.A.-R.; writing—original draft preparation, A.B.R.-N., M.J.M.-B. and N.A.-R.; writing—review and editing: A.B.R.-N., M.J.M.-B., N.A.-R., M.C.d.H. and J.M.M.; project administration and funding acquisition: A.B.R.-N. and M.J.M.-B. All authors have read and agreed to the published version of the manuscript.

Funding

This research was funded by Programa Doctorado Industrial PP19.01, UCE PP 2016.05 (Universidad de Granada), and RNM-938 (Junta de Andalucia).

Data Availability Statement

All data is freely available and ccan be requested to the authors.

Acknowledgments

We thank Isabel Sanchez, Rocio Marquez, Cecilia de la Prada, and Miguel Angel Salas (CIC-UGR) for their help with the analyses.

Conflicts of Interest

The authors declare no conflict of interest.

References

  1. Nesse, W.D. Introduction to Mineralogy; Oxford University Press: New York, NY, USA, 2000. [Google Scholar]
  2. Butler, J.C. Selected Aspects of the Crystal Chemistry of BaSO4, SrSO4 and PbSO4 Selected Aspects of the Crystal Chemistry of BaSO4, SrSO4 and PbSO4. Ph.D. Thesis, Universidad de Ohio, Athens City, OH, USA, 1941. [Google Scholar]
  3. Chang, L.L.Y.; Howie, R.A.; Zussman, J. Rock-forming Minerals, 5B: Non Silicates, 2nd. ed.; Longman: London, UK, 1996. [Google Scholar]
  4. Colville, A.A.; Staudhammer, K. A refinement of the structure barite. Am. Mineral. 1967, 52, 1877–1880. [Google Scholar]
  5. Deer, W.A.; Howie, R.A.; Zussman, J. An Introduction to the Rock Fonning Minerals; Wiley Online Library, Ed.; EEUU: New York, NY, USA, 1967. [Google Scholar] [CrossRef] [Green Version]
  6. Forjanes, P.; Astilleros, J.M.; Fernández-Díaz, L. The formation of barite and celestine through the replacement of gypsum. Minerals 2020, 10, 189. [Google Scholar] [CrossRef] [Green Version]
  7. Hanor, J.S. Frequency distribution of compositions in the barite-celestine series. Am. Mineral. 1968, 53, 1215–1222. [Google Scholar]
  8. Cohén, Á. Minas y Mineros de Granada (Siglos XIX y XX). Granada, España: Diputación de Granada. 2002. Available online: https://dialnet.unirioja.es/servlet/libro?codigo=86054 (accessed on 4 September 2022).
  9. Hanor, J. A model for the origin of large carbonate and evaporite-hosted celestine (SrSO4) deposits. J. Sediment. Res. 2004, 74, 168–175. [Google Scholar] [CrossRef]
  10. Martin, J.M.; Ortega Huertas, M.; Torres Ruiz, J. Genesis and evolution of strontium deposits of the granada basin (southeastern spain)—Evidence of diagenetic replacement of a stromatolite belt. Sediment. Geol. 1984, 39, 281–298. [Google Scholar] [CrossRef]
  11. Taberner, C.; Marshall, J.D.; Hendry, J.P.; Pierre, C.; Thirlwall, M.F. Celestine formation, bacterial sulphate reduction and carbonate cementation of eocene reefs and basinal sediments (igualada, NE spain). Sedimentology 2002, 49, 171–190. [Google Scholar] [CrossRef]
  12. Riding, R.; Braga, J.C.; Martín, J.M.; Sánchez-Almazo, I.M. Mediterranean Messinian Salinity Crisis: Constraints from a coeval marginal basin, Sorbas, southeastern Spain. Mar. Geol. 1998, 146, 1–20. [Google Scholar] [CrossRef]
  13. Wallace, A.F. Organic interfaces enhance strontium content of marine barite. Proc. Natl. Acad. Sci. USA 2019, 116, 13161–13162. [Google Scholar] [CrossRef] [PubMed] [Green Version]
  14. Alía, J.M.; Edwards, H.G.M.; López-Andrés, S.; González-Martín, P.; García-Navarro, F.J.; Mansour, H.R. FT-raman study of three synthetic solid solutions formed by orthorhombic sulfates: Celestine-barytes, barytes-anglesite and celestine-anglesite. Spectrosc. Lett. 2000, 33, 323–336. [Google Scholar] [CrossRef]
  15. Chen, Y.; Huang, E.; Yu, S. High-pressure raman study on the BaSO4-SrSO4 series. Solid State Commun. 2009, 149, 2050–2052. [Google Scholar] [CrossRef]
  16. García-Veigas, J.; Rosell, L.; Cendón, D.I.; Gibert, L.; Martín, J.M.; Torres-Ruiz, J.; Ortí, F. Large celestine orebodies formed by early-diagenetic replacement of gypsified stromatolites (upper miocene, montevive-escúzar deposit, granada basin, spain). Ore Geol. Rev. 2015, 64, 187–199. [Google Scholar] [CrossRef]
  17. James, R.W.; Wood, W.A. The crystal structure of barytes, celestine and anglesite. Proc. R. Soc. Lond. 1925, 109, 598–620. [Google Scholar]
  18. Perri, E.; Gindre-Chanu, L.; Caruso, A.; Cefalà, M.; Scopelliti, G.; Tucker, M. Microbial-mediated pre-salt carbonate deposition during the Messinian salinity crisis (Calcare di Base fm., Southern Italy). Mar. Pet. Geol. 2017, 88, 235–250. [Google Scholar] [CrossRef]
  19. European Union. Critical Raw Materials for Strategic Technologies and Sectors in the Eua Foresight Study; Publications Office of the European Union: Luxemburg, 2020; Available online: https://ec.europa.eu/docsroom/documents/42881 (accessed on 4 September 2022). [CrossRef]
  20. Free and Open Patent and Scholary Search. Available online: http://www.lens.org (accessed on 4 September 2022).
  21. Ober, J.A. Mineral commodity summaries 2016. In Mineral Commodity Summaries; U.S. Geological Survey: Reston, VA, USA, 2016; p. 205. [Google Scholar]
  22. Jiménez-Peñalvarez, J.D. Nieve, oro, sal, Estroncio. Historia de la Minería en Granada. 2008. Available online: https://www.ugr.es/~jorgejp/InvestDoc/mineria.pdf (accessed on 4 September 2022).
  23. Melgarejo, J.C.; Proenza, J.A.; Galí, S.; Llovet, X. Técnicas de caracterización mineral y su aplicación en exploración y explotación minera. Boletín De La Soc. Geológica Mex. 2010, 62, 1–23. [Google Scholar] [CrossRef]
  24. Petruk, W. Applied Mineralogy in the Mining Industry; Elsevier Science BV: Amsterdam, The Netherlands; New York, NY, USA, 2000. [Google Scholar]
  25. Vassilev, S.V.; Tascón, J.M.D. Methods for characterization of inorganic and mineral matter in coal:  A critical overview. Energy Fuels 2003, 17, 271–281. [Google Scholar] [CrossRef]
  26. Cheary, R.W.; Coelho, A.A.; Cline, J.P. Fundamental parameters line profile fitting in laboratory diffractometers. J. Res. Natl. Inst. Stand. Technol. 2004, 109, 1–25. [Google Scholar] [CrossRef] [PubMed]
  27. Girard, A.; Stekiel, M.; Spahr, D.; Morgenroth, W.; Wehinger, B.; Milman, V.; Nguyen-Thanh, T.; Mirone, A.; Minelli, A.; Paolasin, L.; et al. Structural, elastic and vibrational properties of celestine, SrSO4, from synchrotron x-ray diffraction, thermal diffuse scattering and raman scattering. J. Phys. Condens. Matter 2019, 31, 055703. [Google Scholar] [CrossRef] [PubMed] [Green Version]
  28. Rodriguez-Navarro, A.B. XRD2DScan: New software for polycrystalline materials characterization using two-dimensional X-ray diffraction. J. Appl. Crystallogr. 2006, 39, 905–909. [Google Scholar] [CrossRef]
  29. Rodriguez-Navarro, A.B.; Alvarez-Lloret, P.; Ortega-Huertas, M.; Rodriguez-Gallego, M. Automatic crystal size determination in the micrometer range from spotty X-ray diffraction rings of powder samples. J. Am. Ceram. Soc. 2006, 89, 2232–2238. [Google Scholar] [CrossRef]
  30. Salazar, S.; Bravo, J.; Castellanos Román, M. Identificación de la Fracción Mineral del Aerosol Atmosférico, en Una Zona Urbana de la Ciudad de México Por Medio de Difracción y Fluorescencia de Rayos-X. Atmósfera 2009, 2. [Google Scholar]
  31. Conesa Ferrer, J.A. Curso Básico de Análisis Térmico; Editorial Club Universiatrio: Alicante, Spain, 2000. [Google Scholar]
  32. Manzaneda Cábala, J.R. Aplicación de Microscopía en el Procesamiento de Minerales Por Flotación. Ph.D. Thesis, University of Lima, Lima, Peru, 2010. [Google Scholar]
  33. Igathinathane, C.; Ulusoy, U.; Pordesimo, L.O. Comparison of particle size distribution of celestine mineral by machine vision ΣVolume approach and mechanical sieving. Powder Technol. 2012, 215, 137–146. [Google Scholar] [CrossRef]
  34. Ballester, A.; Verdejo, L.F.; Sancho, J. Metalurgia Extractiva (Volumen 1); Síntesis: Madrid, Spain, 2014. [Google Scholar]
  35. Calero de Hoces, M. Aprovechamiento de Recursos Geológicos Andaluces. Concentración de Celestina. Ph.D. Thesis, Universidad de Granada, Granada, Spain, 1994. [Google Scholar]
  36. Garcés de los Fayos Toruner, F. Procedimiento Para Enriquecimiento en Estroncio de Mineral de Celestina. 1986. Available online: https://www.igme.es/PanoramaMinero/Historico/2003_04/estronci03.pdf (accessed on 4 September 2022).
  37. Santos, H.; Neumann, R.; Ávila, C. Mineral Quantification with Simultaneous Refinement of Ca-Mg Carbonates Non-Stoichiometry by X-ray Diffraction, Rietveld Method. Minerals 2017, 7, 164. [Google Scholar] [CrossRef]
  38. Garske, D.; Peacor, D.R. Refinement of the strontium of celestine. Z. Krist. –Cryst. Mater. 1965, 121, 204. [Google Scholar]
  39. Ball, T.K.; Booth, S.J.; Nickless, E.F.P.; Smith, R.T. Geochemical prospecting for baryte and celestine using a portable radioisotope fluorescence analyzer. J. Geochem. Explor. 1979, 11, 277–284. [Google Scholar] [CrossRef]
  40. Li, K.; Li, G.; Zhao, G.; Lu, Y.; Shao, K. Method for Simultaneously Detecting Fluorite, Barite and Celestine, Involves Preparing Artificial Standard Material Followed by Preparing Standard Sample, Scanning Standard Sample, Establishing Standard Curve and Detecting Content. Patent CN108051468A, 18 May 2018. Available online: https://patents.google.com/patent/CN108051468A/en (accessed on 4 September 2022).
  41. Liu, C.L.; Zhang, L.; Xu, L.J.; Su, Z.M.; Xie, T.P.; Wang, Y.A. Sr speciation in producing SrCO3 with celestine. Acta Geochim. 2014, 33, 244–247. [Google Scholar] [CrossRef]
  42. López-Quirós, A.; Barbier, M.; Martín, J.M.; Puga-Bernabéu, Á.; Guichet, X. Diagenetic evolution of Tortonian temperate carbonates close to evaporites in the Granada Basin (SE Spain). Sediment. Geol. 2016, 335, 180–196. [Google Scholar] [CrossRef]
  43. García-del-Cura, M.A.; Sanz-Montero, M.E.; La Iglesia, A.; Ordóñez, S. Carbonate facies and sedimentological model of travertine-tufa quaternary deposits in the Betic Cordillera (SE Spain). In Proceedings of the 27 th IAS Meeting of Sedimentology, Alghero, Italy, 20–23 September 2009; p. 518. [Google Scholar]
  44. Roncal-Herrero, T.; Astilleros, J.M.; Bots, P.; Rodríguez-Blanco, J.D.; Prieto, M.; Benning, L.G.; Fernández-Díaz, L. Reaction pathways and textural aspects of the replacement of anhydrite by calcite at 25 °C. Am. Mineral. 2017, 120, 1270–1278. [Google Scholar] [CrossRef]
Figure 1. Representative images of Montevive stromatolites. (A) Laminated stromatolite. Coarse-crystalline, sparry calcite fills in desiccation cracks parallel to lamination. Scale bar: 1 cm. (B) Stromatolite exhibiting molds of small prismatic and lenticular gypsum. Scale bar: 2 cm. (C) Stromatolite with a clear selenite mold visible on the left. Scale bar: 5 mm. (D) “Macrofilaments” embedded in a micro sparry calcite matrix. Scale bar: 200 µm.
Minerals 12 01261 g001
Figure 2. Optical microscopy. (A) Representative image with cross-polarized illumination showing micro sparite calcite matrix (cal) and massive celestine (cls) aggregates of prismatic crystals. Circle indicates presence of iron oxides and hydroxides. (B) Image of high-grade mineral (E92) made of larger prismatic celestine crystals filling in large synsedimentary voids (desiccation cracks and evaporite molds). (C) Representative image of prewashed medium-grade mineral sample (E69) showing areas with massive calcite (cal) and celestine (cls) aggregates. Calcite matrix demonstrates a darker brown color, whereas celestine has a lighter color. There are disseminated dolomite crystals (arrows) that are stained blue with ferricyanide. Scale bar: 100 µm.
Minerals 12 01261 g002
Figure 3. Scanning electron microscopy of E60 sample. (AC) Representative images of mineral (BS mode) showing celestine crystals with brighter illumination (electron dense) and calcite and silicate minerals with lower illumination. (DF) EDX maps showing distribution of relevant chemical elements (Sr in blue, Ca in purple, Ba in yellow, Al in green, and Fe in red) superimposed onto SEM images shown above. cls: celestine; cal: calcite; kao: kaolinite; Fe: iron oxides and hydroxides.
Minerals 12 01261 g003
Figure 4. Transmission electron microscopy of E60 sample. Morphology and chemical analysis of mineral assemblages shown in (A) and (D) studied using different imaging modes: (A) STEM mode; (BE) EDX maps showing distribution of relevant chemical elements (Sr in blue, Ca in yellow, Al in green, and Fe in pink). (C,D) Bright field image of mineral assemblage detail (from B) and general view (D); (F) SAED pattern of magnetite nanoparticle. Main mineral phases identified are indicated as follows: cls, celestine; cal, calcite; kao, kaolinite; mt, magnetite. Scale bars: (A,B): 5 µm; (CE): 1 µm.
Minerals 12 01261 g004
Table 1. Granulometry analysis of selected samples (E60, E69, and E92), showing accumulated percentage mass (% mass) up to this size range and relative mass fraction (fi) (retained mass divided by total mass).
Size FractionGrain SizeMean Diameter (mm)E60E69E92
Fraction%MassFraction%MassFraction%Mass
>10 mm>100.1212.070.2929.080.3332.52
610–5 mm7.500.3243.770.2149.930.2557.18
55–3 mm3.510.2883.430.2080.520.1780.88
42–1 mm1.500.1283.430.1080.520.0780.88
31.0–0.5 mm0.750.0588.400.0787.040.0485.11
2500–315 µm0.410.0291.570.0391.580.0288.35
1315–200 µm0.200.0494.640.0494.730.0491.40
<100 µm0.050.0598.810.0598.830.0796.93
Table 2. Chemical composition of representative celestine mineral samples determined by XRF. Suffixes 1 to 6 correspond to fractions of same mineral sample with different particle sizes: 1 (0.1–0.3 mm), 2 (0.3–0.5 mm), 3 (0.5–1.0 mm), 4 (1–2 mm), 5 (2–5 mm), and 6 (5–10 mm).
SampleSrSO4BaSO4Fe2O3SiO2Al2O3CaCO3MgCO3
E6063.01.13.17.73.220.62.5
E60_160.31.14.18.63.620.62.6
E60_261.91.23.77.63.120.62.3
E60_364.31.13.66.52.720.12.1
E60_464.71.73.16.62.720.52.1
E60_564.41.02.86.42.619.52.1
E60_671.51.72.46.12.514.41.9
E6970.51.21.95.50.016.02.0
E69_164.01.22.46.42.620.63.1
E69_262.61.32.36.92.820.83.3
E69_363.31.12.26.92.820.53.3
E69_464.31.11.85.52.321.93.0
E69_568.51.21.53.91.619.52.3
E69_667.10.90.82.51.024.01.9
E7052.21.20.40.90.346.60.9
E8074.90.30.75.40.017.30.9
E9095.81.90.10.40.30.00.4
E9290.71.40.12.20.42.80.7
E92_189.81.50.82.50.53.60.9
E92_288.21.50.72.60.44.30.8
E92_388.91.50.62.40.43.40.8
E92_488.71.50.52.10.43.60.7
E92_590.41.50.52.30.43.30.6
E92_688.41.50.42.90.45.60.5
Table 3. Correlation analysis between phase determined by XRF. Significant correlations (p < 0.05) are in bold type.
SrSO4BaSO4Fe2O3SiO2Al2O3CaCO3MgCO3
SrSO41.0000.590−0.711−0.681−0.699−0.940−0.525
BaSO40.5901.000−0.294−0.451−0.198−0.595−0.226
Fe2O3−0.711−0.2941.0000.9210.9090.4540.631
SiO2−0.681−0.4510.9211.0000.8620.4130.679
Al2O3−0.699−0.1980.9090.8621.0000.4420.702
CaCO3−0.940−0.5950.4540.4130.4421.0000.287
MgCO3−0.525−0.2260.6310.6790.7020.2871.000
Table 4. Quantitative mineral composition of samples determined by X-ray diffraction Rietveld method.
CalciteCelestineStrontianiteQuartzDolomiteKaoliniteIlliteParagonite
E6024.459.11.85.10.55.80.02.4
E60_127.155.71.95.40.26.00.12.7
E60_227.355.91.54.50.66.10.02.7
E60_323.360.21.63.31.45.20.02.3
E60_423.563.01.44.00.74.30.02.4
E60_524.859.12.54.21.04.70.02.5
E60_618.367.91.84.20.74.40.01.8
E6924.258.71.85.10.66.00.02.4
E69_125.954.93.14.74.25.00.02.6
E69_224.053.92.84.45.64.60.02.4
E69_323.955.82.94.25.04.80.02.4
E69_425.959.02.24.14.43.90.02.6
E69_521.366.11.93.24.22.60.02.1
E69_623.267.10.34.23.21.40.02.3
E7057.339.30.71.20.40.20.15.7
E8028.467.30.71.01.30.20.02.8
E901.892.30.80.53.40.30.00.2
E923.991.91.10.50.02.10.00.4
E92_13.693.20.71.20.01.20.00.4
E92_22.794.60.21.90.00.20.00.3
E92_33.293.00.13.10.00.40.00.3
E92_43.892.90.11.90.00.50.60.4
E92_53.293.00.12.60.00.40.60.3
E92_64.692.40.12.0 0.40.50.5
Table 5. Correlation analysis between phase determined by XRD. Significant correlations (p < 0.05) are in bold type.
CalciteCelestineStrontianiteQuartzDolomiteKaoliniteIlliteParagonite
Calcite1.000−0.9400.4740.3840.2130.416−0.3740.805
Celestine−0.9401.000−0.711−0.623−0.374−0.6740.432−0.840
Strontianite0.474−0.7111.0000.6530.6110.810−0.4440.541
Quartz0.384−0.6230.6531.0000.2590.841−0.2110.429
Dolomite0.213−0.3740.6110.2591.0000.210−0.2570.077
Kaolinite0.416−0.6740.8100.8410.2101.000−0.3700.598
Illite−0.3740.432−0.444−0.211−0.257−0.3701.000−0.342
Paragonite0.805−0.8400.5410.4290.0770.598−0.3421.000
Publisher’s Note: MDPI stays neutral with regard to jurisdictional claims in published maps and institutional affiliations.

