1. Introduction
In a mine subsidence area, there are undesirable displacements and potential stress concentrations in stope mining, which can easily lead to huge safety hazards and potential losses, both economic and of personnel [
1,
2,
3]. As a result, the detection, simulation and visualization of stope stability and its displacement are very important issues in metal-mining operations [
4,
5,
6,
7]. For this reason, domestic and foreign scholars undertook research on stope stability in mine subsidence areas using various methods, such as laboratory experiments, physical/mathematical models and numerical simulations, which led to breakthroughs.
In engineering practice, due to the high experimental costs involved, it is generally challenging to experimentally solve various difficult problems. Currently, numerical simulation is required to predict and analyze programs using FLAC
3D software (such as Flac
3D 6.0 version, Itasca Consulting Group, Inc., Minneapolis, MN, USA); this established the seepage–damage–fracture coupling mathematical model of fractured rock mass. When it is in an unstable state, the overlying rock mass in an excavated stope is prone to collapse. Existing research mainly focused on the collapse and spalling phenomena of the roof and surrounding rock, as well as the evaluation and prediction of stope stability, which is of great significance for guiding industrial mining safety. Due to the large range and large span of stopes, the requirements of conventional indoor research conditions are relatively harsh, so mining experiments on similar materials at a reduced scale are usually used [
8,
9,
10]. In addition, to compensate for the limitations of rock mechanical experiments, researchers used FlAC
3D and other numerical computations to explore the stability of the surrounding rock and slope, the optimization of stope structure parameters and the coupling relationship between roadway and working face in an underground mine [
11,
12]. Undesirable instability is destructive and can cause the fracturing of the pore structure in porous systems, such as underground stopes and packed beds; however, it can be well understood by simulating predictions [
5,
6,
7,
13,
14]. The Barton engineering empirical formula, Pakalnis critical equations and other methods are commonly used to evaluate stope stability [
15]. However, since most of the rock masses are set as ideal homogeneous bodies, and the heterogeneity of ore body occurrence and rock mass structure are not usually considered, there are errors in the calculation results [
16,
17].
In summary, the existing coupling research on FLAC
3D and various modeling software was successfully applied in the fields of geotechnical engineering, mining engineering and other fields, and has a good application prospect in realizing numerical and transparent simulations for the mining of underground deposits [
18,
19]. However, although Flac
3D itself is an excellent numerical simulation software, it is not an excellent modeling software. It is difficult to realize the construction of complex models through its use alone. The method of combining 3Dmine–Rhino
3D with FLAC
3D in this study can better achieve the construction of a heterogeneous model for ore body occurrence and rock mass structure. We used 3Dmine software to build complex models, then used Rhino
3D software to draw meshes for the established models; finally, we used FlAC
3D software to perform grouping simulations on the software. Previous research still assumes modeling homogenization and idealization; moreover, simulation research considering real topography and ore deposit occurrence forms of mining areas is not sufficiently deep.
In view of this, and based on the stability characteristics of the three stopes 8121 (Stope A), 8122 (Stope B) and 8123 (Stope C) around the Hongling subsidence area after mining, this paper comprehensively considers the differences in the topography and ore deposit occurrence characteristics of the mining area. The 3DMine–Rhino3D–FLAC3D coupling method is innovatively adopted to conduct research from the variation in displacement stress of the side walls of the stope roof. Displacement and stress monitoring points were set up for the corresponding stopes in the model, which effectively predicted the displacement and stress changes in the three stopes after excavation.
2. Ore Deposit Topography Model Established by 3Dmine–Rhino3D–Flac3D Coupling
2.1. Real Topography Model of Hongling Subsidence Area via 3Dmine
The Hongling Lead–Zinc Mine is located in Balinzuo Banner, north of Chifeng City, Inner Mongolia Autonomous Region, and its administrative division is under the jurisdiction of Ulandaba Sumu. Its ore body and surrounding rock have good stability and the degree of development of joints and fissures is low, but local structural damage may lead to poor stability. The grade of the ore body is evenly distributed, and the boundary of the ore rock is clear. The mining method used in the past is the open-field mining method in the layout stage along the strike.
This mining method created a subsidence area in the vicinity of the mining area. In order to predict whether mining procedures would lead to further large-scale subsidence, numerical simulation analysis of the mining process of the stope was performed. The establishment of a surface model is very important for mining engineering as it can reflect the three-dimensional coordinate position relationship of geological bodies, such as ore bodies, roadways, and factory areas. To establish a surface model, as
Figure 1 shows, the topographic mine map was used as the original data, and the information required for modeling, such as terrain contours and exploration lines, and the corresponding labeling values, were retained.
This paper analyzes the geological plan of the middle sections at 755 m, 805 m, 855 m, 905 m and 955 m. The ore deposits and surface contour lines were extracted and the CAD data of the target ore deposits were obtained. The mine-site data and coordinate delineations were imported into 3Dmine to visualize the surface data and monography of the Hongling mine-site. These data were then elevated and meshed to obtain the 3D digital model. Following this, optimization and hierarchical management were carried out.
2.2. Ore Deposit Grid Acquisition and Division of Ore Deposit via Rhino3D
To drape the surface, an appropriate threshold range based on the size of the ore deposit was selected. This meshing data file was imported into Rhino, and then the drape was used to reduce its size and make it a poly-surface. Next, a cube with an extent smaller than the surface of the drape was formed in preparation for establishing the mesh. The division operation was performed based on the Boolean operation, and then the drapery surface was divided by the cube, and the redundant surfaces were deleted.
Since there is a subsidence area between the ore deposit and the surface, the range of the subsidence area on the surface must be determined according to the range of the subsidence area of the ore deposit. According to the imported exploration line, a surface was established by pointing several corners to form different surfaces. The part wrapped by this surface was the subsidence area of the ore deposit; the Boolean segmentation operation was then performed to segment the ore deposit.
2.3. Coupling Model and Parameters of Ore Deposit via FlAC3D
To better divide the ore body and surrounding rock, the ore body and surface models were imported into FlAC
3D after the initial meshing in Rhino. As
Figure 2 shows, the ore beds and surrounding rock meshing were well processed under the Gsurf and GVol comments of Rhino. The model is divided into two parts: external surrounding rock and internal ore body. The former includes ordinary surrounding rock and the subsidence area, and the latter is divided into the excavated stope and planned excavation stope; the subsidence areas in both are connected upward and downward.
It should be noted that, based on the imported exploration line, a surface was established by pointing several corners to form different surfaces, and the part wrapped by this surface is the subsidence area of the ore body. The Boolean segmentation operation was then performed to segment the ore body with this surface. In this paper, the research objects that we wanted to analyze and predict were the three stopes 8121, 8122 and 8123 that are planned to be excavated: these were named Stope A, Stope B and Stope C, respectively.
Before excavation simulation and monitoring were performed on the model, the constitutive model, material parameters, boundary conditions and initial conditions were assigned to the model. In this paper, the Mohr–Coulomb model was used. The specific material parameters of the ore and rock mass are shown in
Table 1 and divided into three parts: the ore body, the surrounding rock and the subsidence area.
3. Results and Discussion
3.1. The Stress and Ground Displacement of Excavated Stopes in Subsidence Areas
The stress and displacement color map of the three targeted stopes (A/B/C) is shown in
Figure 3, and the maximum values of displacement and stress in the stopes (A/B/C) are recorded in
Table 2, respectively. Based on
Table 2 and
Figure 3, the ground displacement phenomenon after the stope excavation in the subsidence area was analyzed: the roof displacement of Stope A in the fall area is the most significant, the maximum vertical displacement of the roofs of Stopes A, B and C being 6.7 cm, 2.6 cm and 1.1 cm, respectively. This indicates that after mining in Stope A, the roof of the roadway is more prone to rupture and deformation, and there is the certain hidden danger of instability.
Similarly, it can be seen from
Figure 3 that, comparing the maximum horizontal displacement of the left- and right-hand sides of the three stopes, the maximum horizontal displacement of the left-hand sides are all positive; that is, they are displaced in the direction close to the center of their respective stope. The two sides are displaced toward the center of the stope: the maximum horizontal displacement of the left-hand side was obtained for Stope B, and was 0.86 cm, and the maximum horizontal displacement of the right-hand side was obtained for Stope C, and was 0.45 cm. Moreover, the horizontal displacements in the three stopes are all less than 1 cm and are also lower than the roof failure tendency. In other words, the roof is more prone to vertical displacement after stope excavation, and is regarded as a roof-falling accident, commonly observed in actual metal deposit mining operations.
3.2. 2D Slice Features of the Excavated Stopes (A/B/C) in the Subsidence Areas
To simulate the actual mining operations, we first excavated each stope separately. After solving the balance, we then excavated all three stopes (A/B/C) simultaneously, and set up monitoring points to monitor the displacement and stress in the roof and side walls after excavation.
The monitor points were set up as follows: first, the initial coupled model was imported and the three stopes (A/B/C) to be excavated were cut using the orthogonal test method. Next, each stope was cut twice along the
x-axis and
y-axis, and a total of 12 slices were obtained. Each slice included three groups of monitoring points. The monitoring points were then set equidistantly at the edge of each slice for recording. The slice-processing procedure is shown in
Figure 4.
Slice 1, Slice 3, Slice 5, Slice 7, Slice 9 and Slice 11 were cut along the x-axis to monitor the displacement and stress in the z-direction of the top plate, and the displacement and stress in the x-direction of the left- and right-hand side walls, respectively. Eight monitoring points were set.
Slice 2, Slice 4, Slice 6, Slice 8, Slice 10 and Slice 12 were cut along the y-axis to monitor the displacement and stress in the z-direction of the top plate, respectively. Eight monitoring points were set at an equal distance for each group of monitoring points.
After the monitoring points were established, excavation calculations were performed on the three stopes A, B and C in the model, and the monitoring point values and displacement-stress evolution cloud map during the calculation process were output.
Among the three stopes, the left side of Stope A changes greatly, and the stress is concentrated in the upper left side of the stope near the collapse area, where the stress reaches 24.4 MPa, and the collapse area is likely to continue to collapse from this point. The stress changes in the other sides are similar. The maximum stress near the center of the side is less than 1 MPa, and the closer to the edge, the greater the stress; the maximum does not exceed 6 MPa, which is relatively safe and stable.
3.3. Displacement Features of Monitor Points in a Typical Excavated Stope
To better detect the displacement features of excavated stopes, we selected the 12 typical slices from the excavated stopes. The vertical displacement changes in the roof of Stope A (Slices 1~4) are shown in
Figure 5. It was found that for the roof slices in different directions, the displacement of the monitoring point first increased and then tended to be stable as the number of calculation steps increased. When the step size was 6000 steps, the calculation for each slice tended to be stable overall.
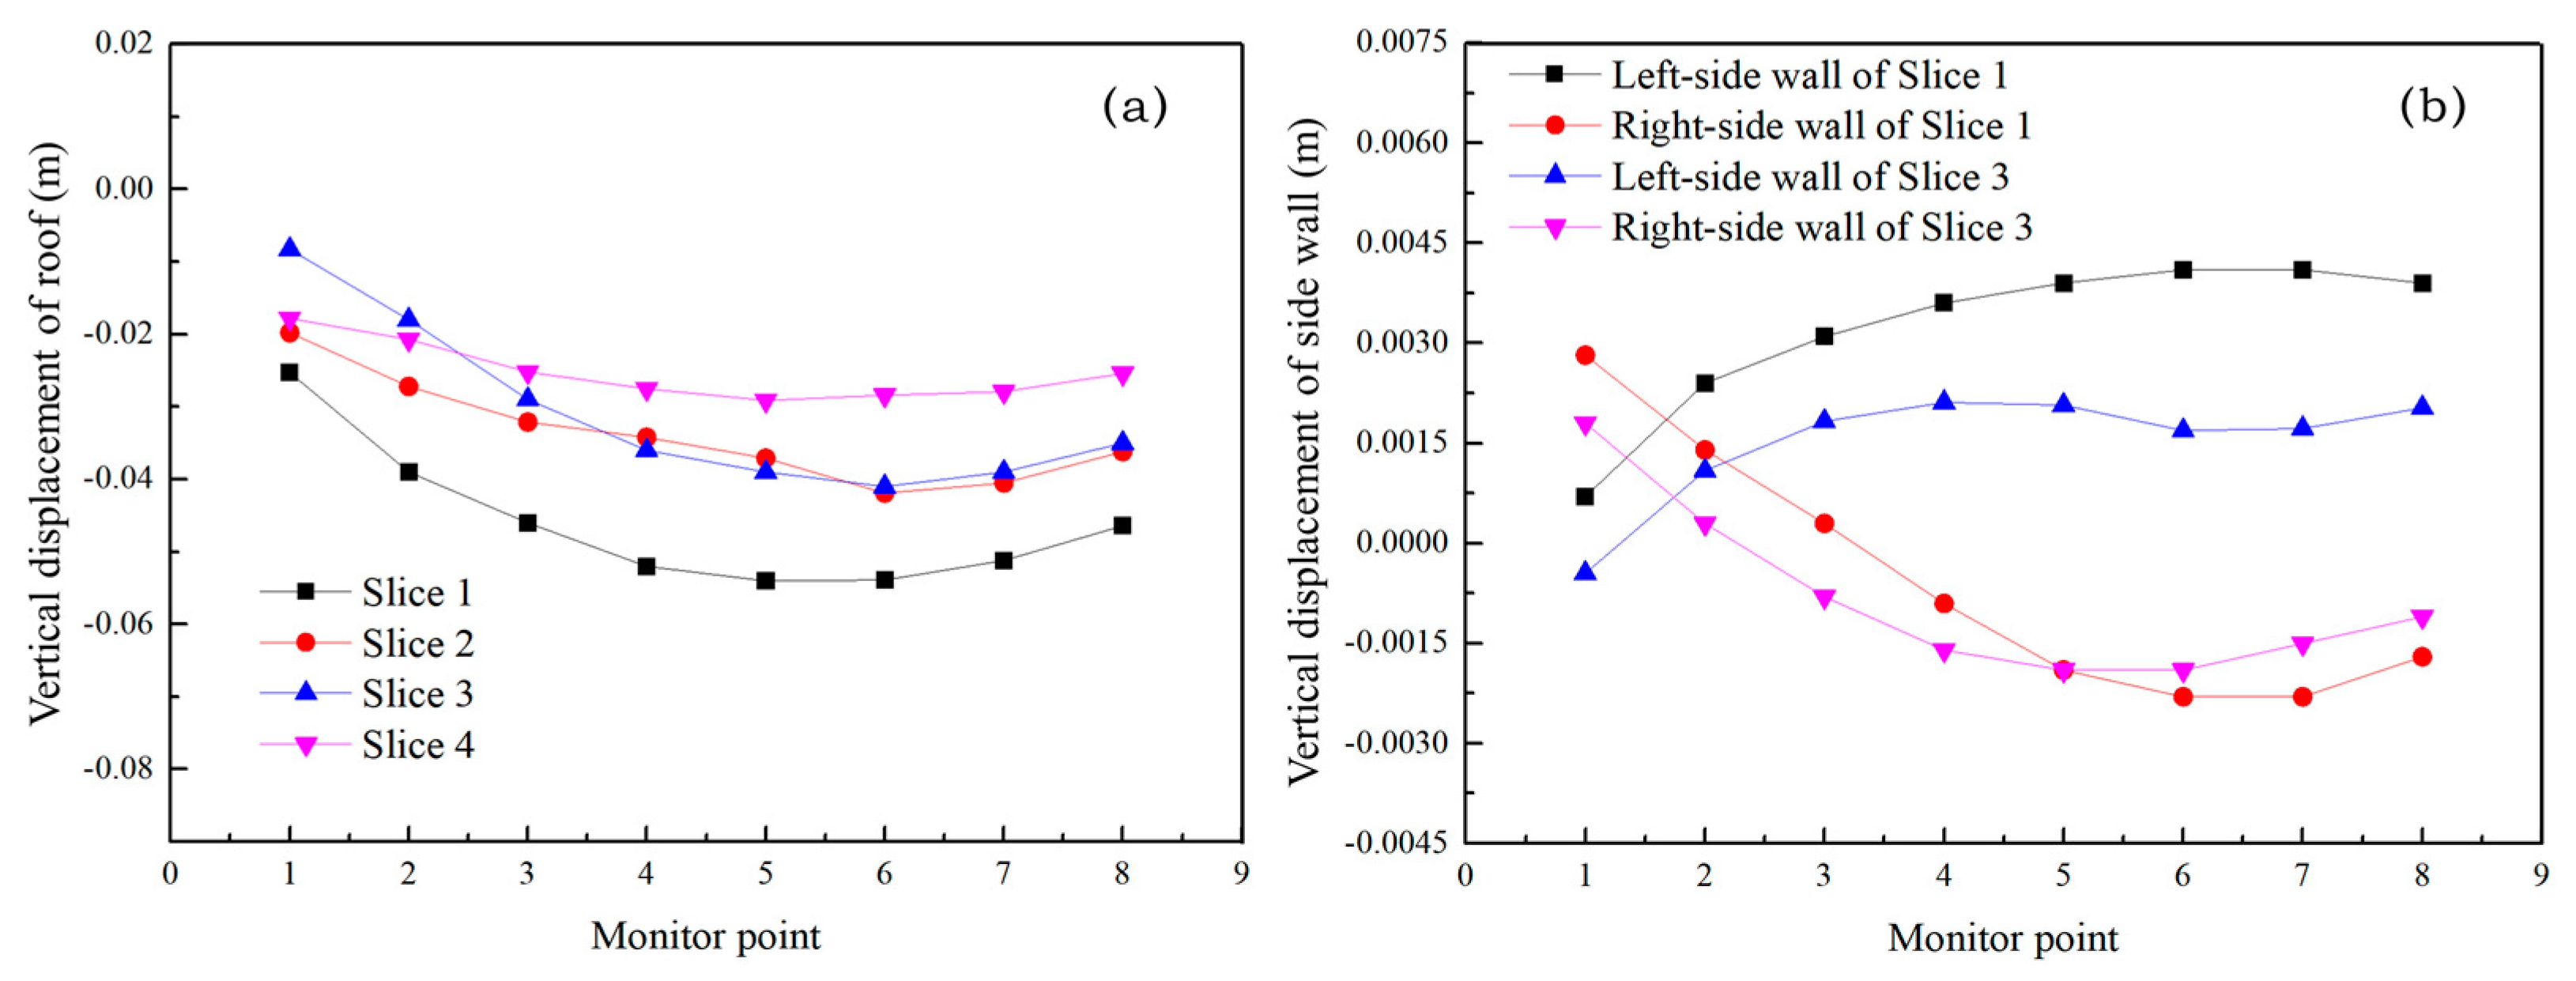
To compare and reveal the vertical displacement variation characteristics in different parts of the roof, the vertical displacement variation in the roof of Stope A was further analyzed, as shown in
Figure 6a. It is inferred that the vertical displacement of each slice is larger near the subsidence area. In other words, (1) the roof displacement is negatively correlated with the distance from the center of the roof, and the peak value of the vertical displacement is obtained at the center of the vertical displacement;(2) when a subsidence area exists, the displacement of the slices close to the collapse area is larger. Specifically, the maximum displacement is the fifth monitoring point on Slice 4, with a peak value of 5.4 cm; this slice is the closest to the subsidence area and its overall displacement is the largest relative to the other three curves. Slice 2 and Slice 4 are parallel slices in the same direction; Slice 4 is closer to the subsidence area, and its overall top-plate displacement is significantly larger than that of Slice 2.
Based on
Figure 6b, it can be seen that the horizontal displacement changes in the left- and right-hand side walls of Stope A, showing a gradually increasing trend with the unidirectional changes in the monitoring points. Specifically, the displacements of the right-hand side of Slice 1 and the right-hand side of Slice 3 undergo a change from positive to negative; that is, the monitoring points on the right-hand side shifted from top to bottom, first in the positive direction of the x-axis, and then in the negative direction of the x-axis, while the left side is uniformly displaced in the positive direction of the x-axis, and its overall displacement direction is toward the inside of the stope. The peak is 0.4 cm on the left-hand side of Slice 1. In addition, comparing
Figure 6a,b, it can be seen that the horizontal displacement in the stope is obviously smaller than the vertical displacement.
3.4. Stress Features of Monitor Points in a Typical Excavated Stope
The vertical and horizontal stress distributions of an excavated stope is an important factor affecting mining safety, especially when the excavated stope is located in the subsidence areas [
20,
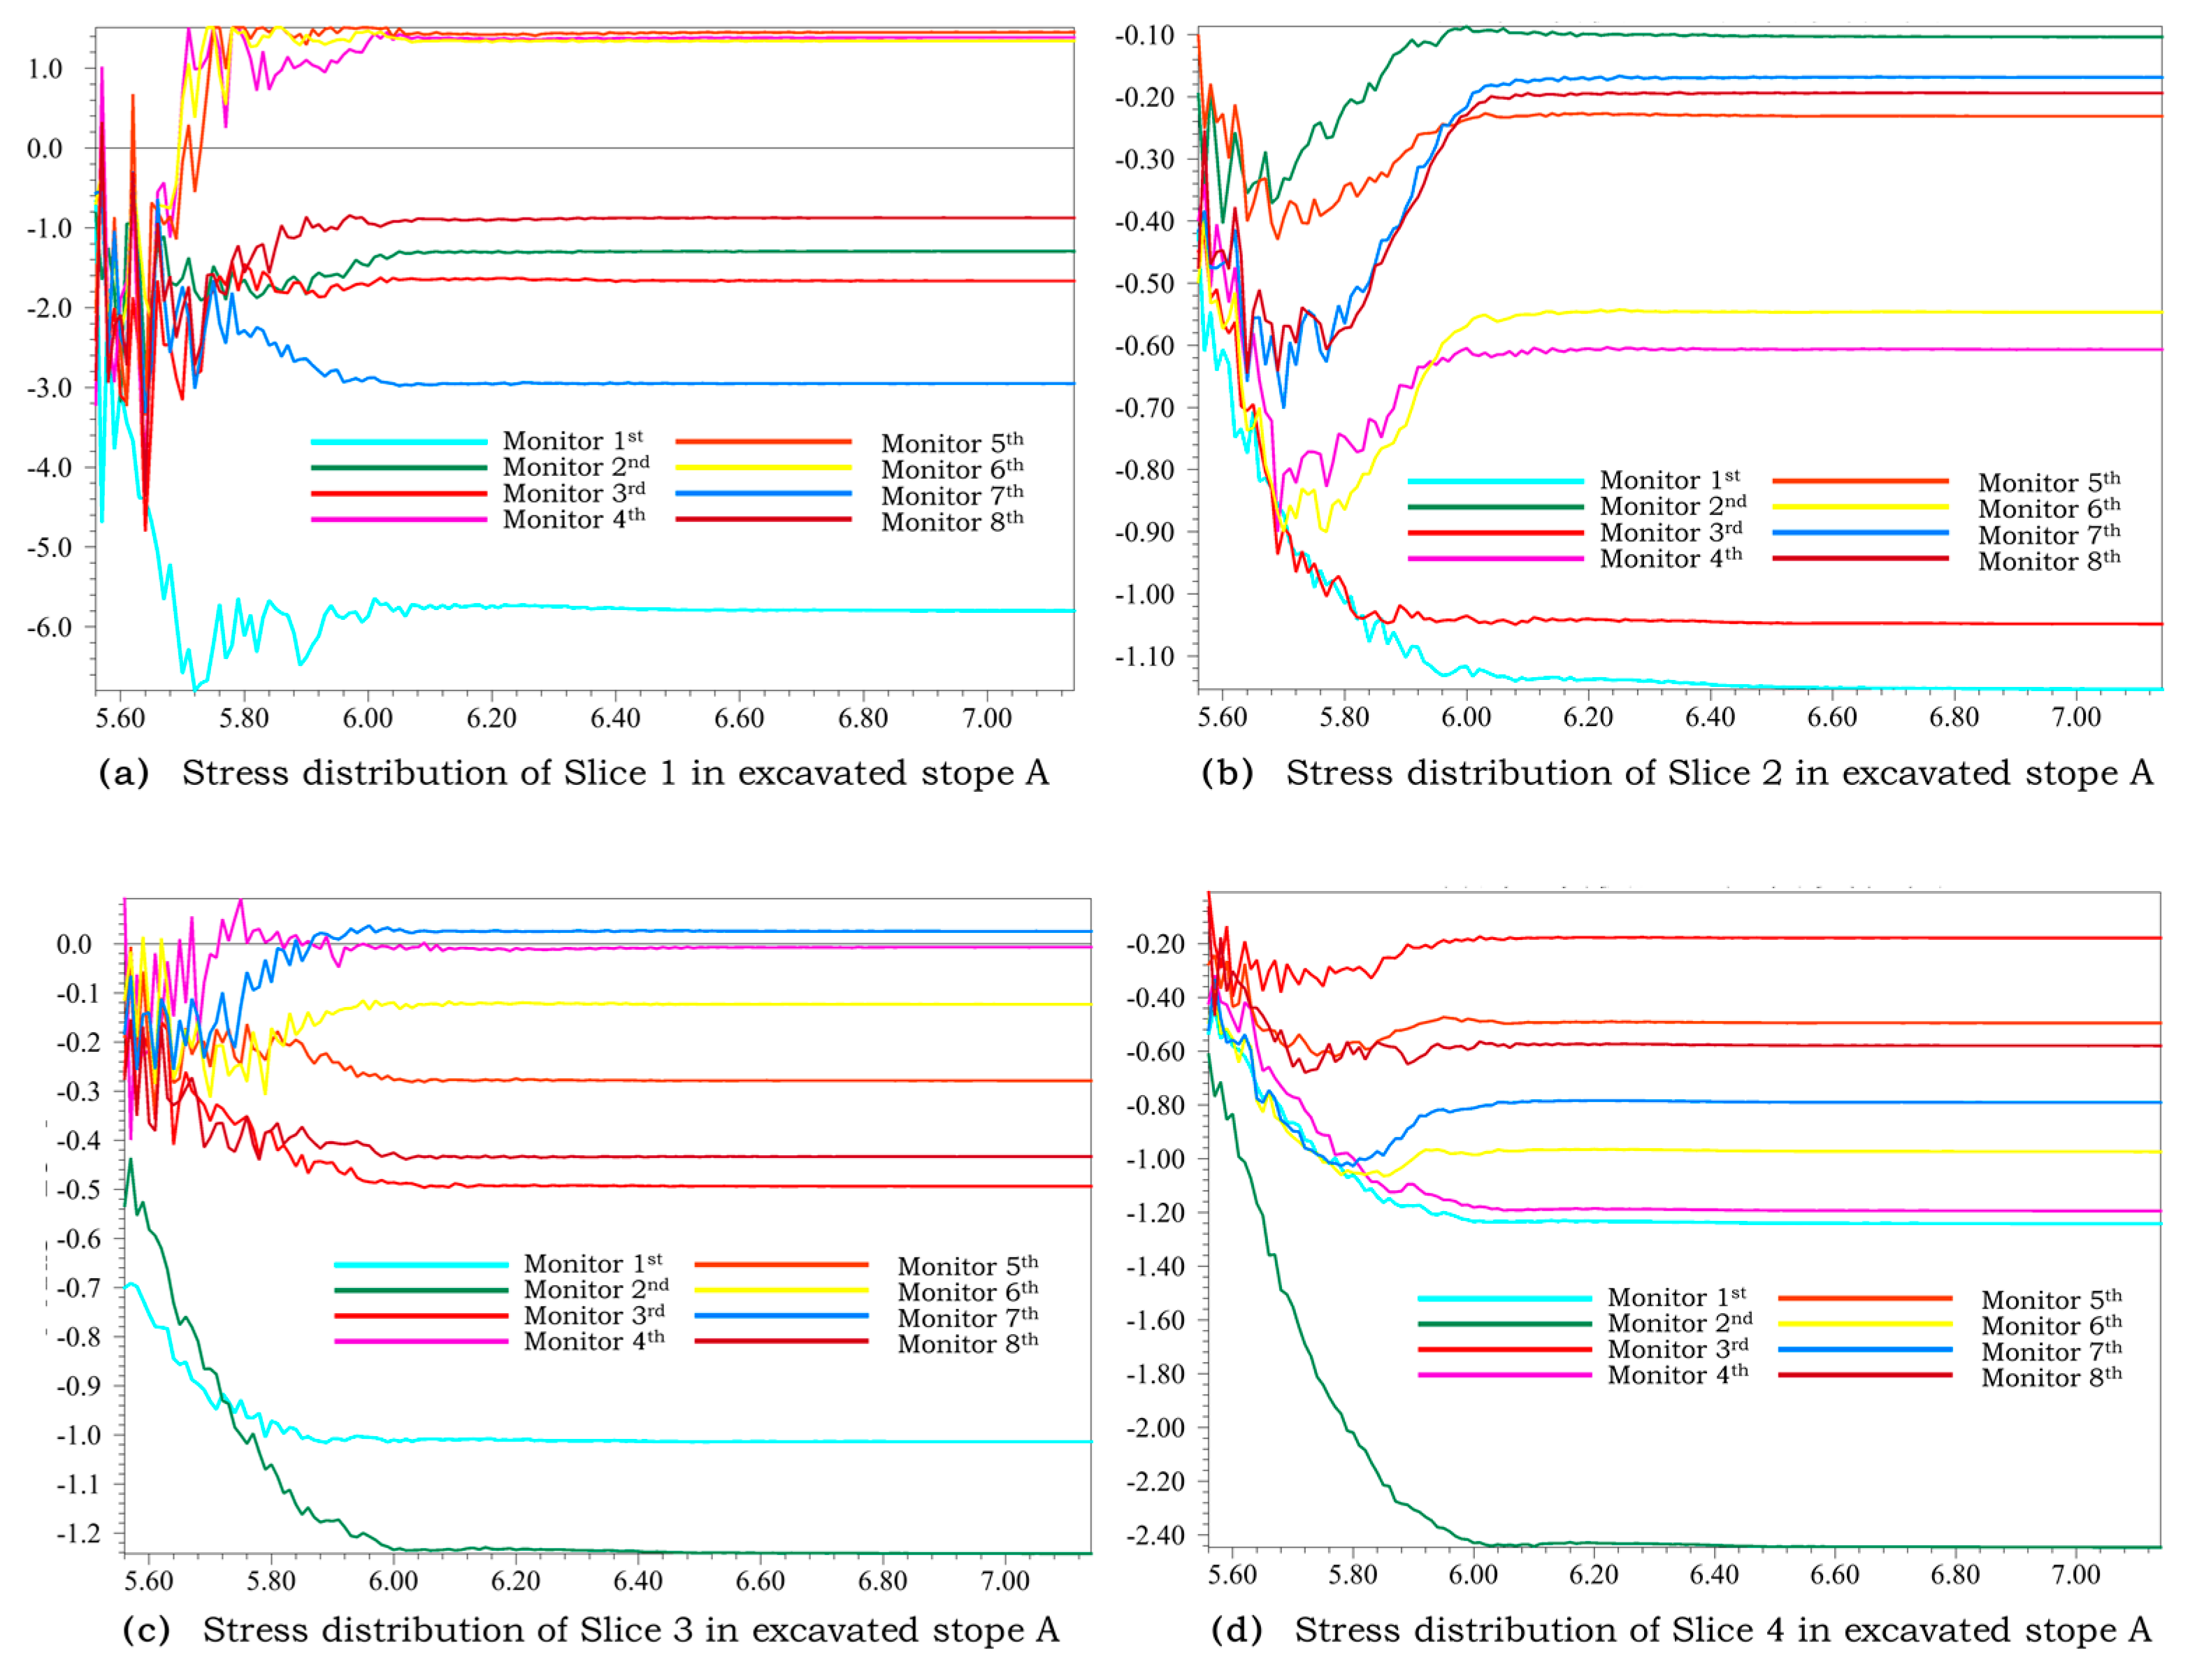
21]. To better understand the stress distribution of the roof, left-hand side walls and right-hand side walls, eight monitoring points in the excavated stope were carefully selected and the stress changes at each point were recorded, as shown in
Figure 7. This stress fluctuation is very significant in the initial stage. It tends to be stable after a step size of 6000, which is similar to the displacement of each slice. Moreover, the variations are significantly higher in Slice 1 of the excavated Stope A.
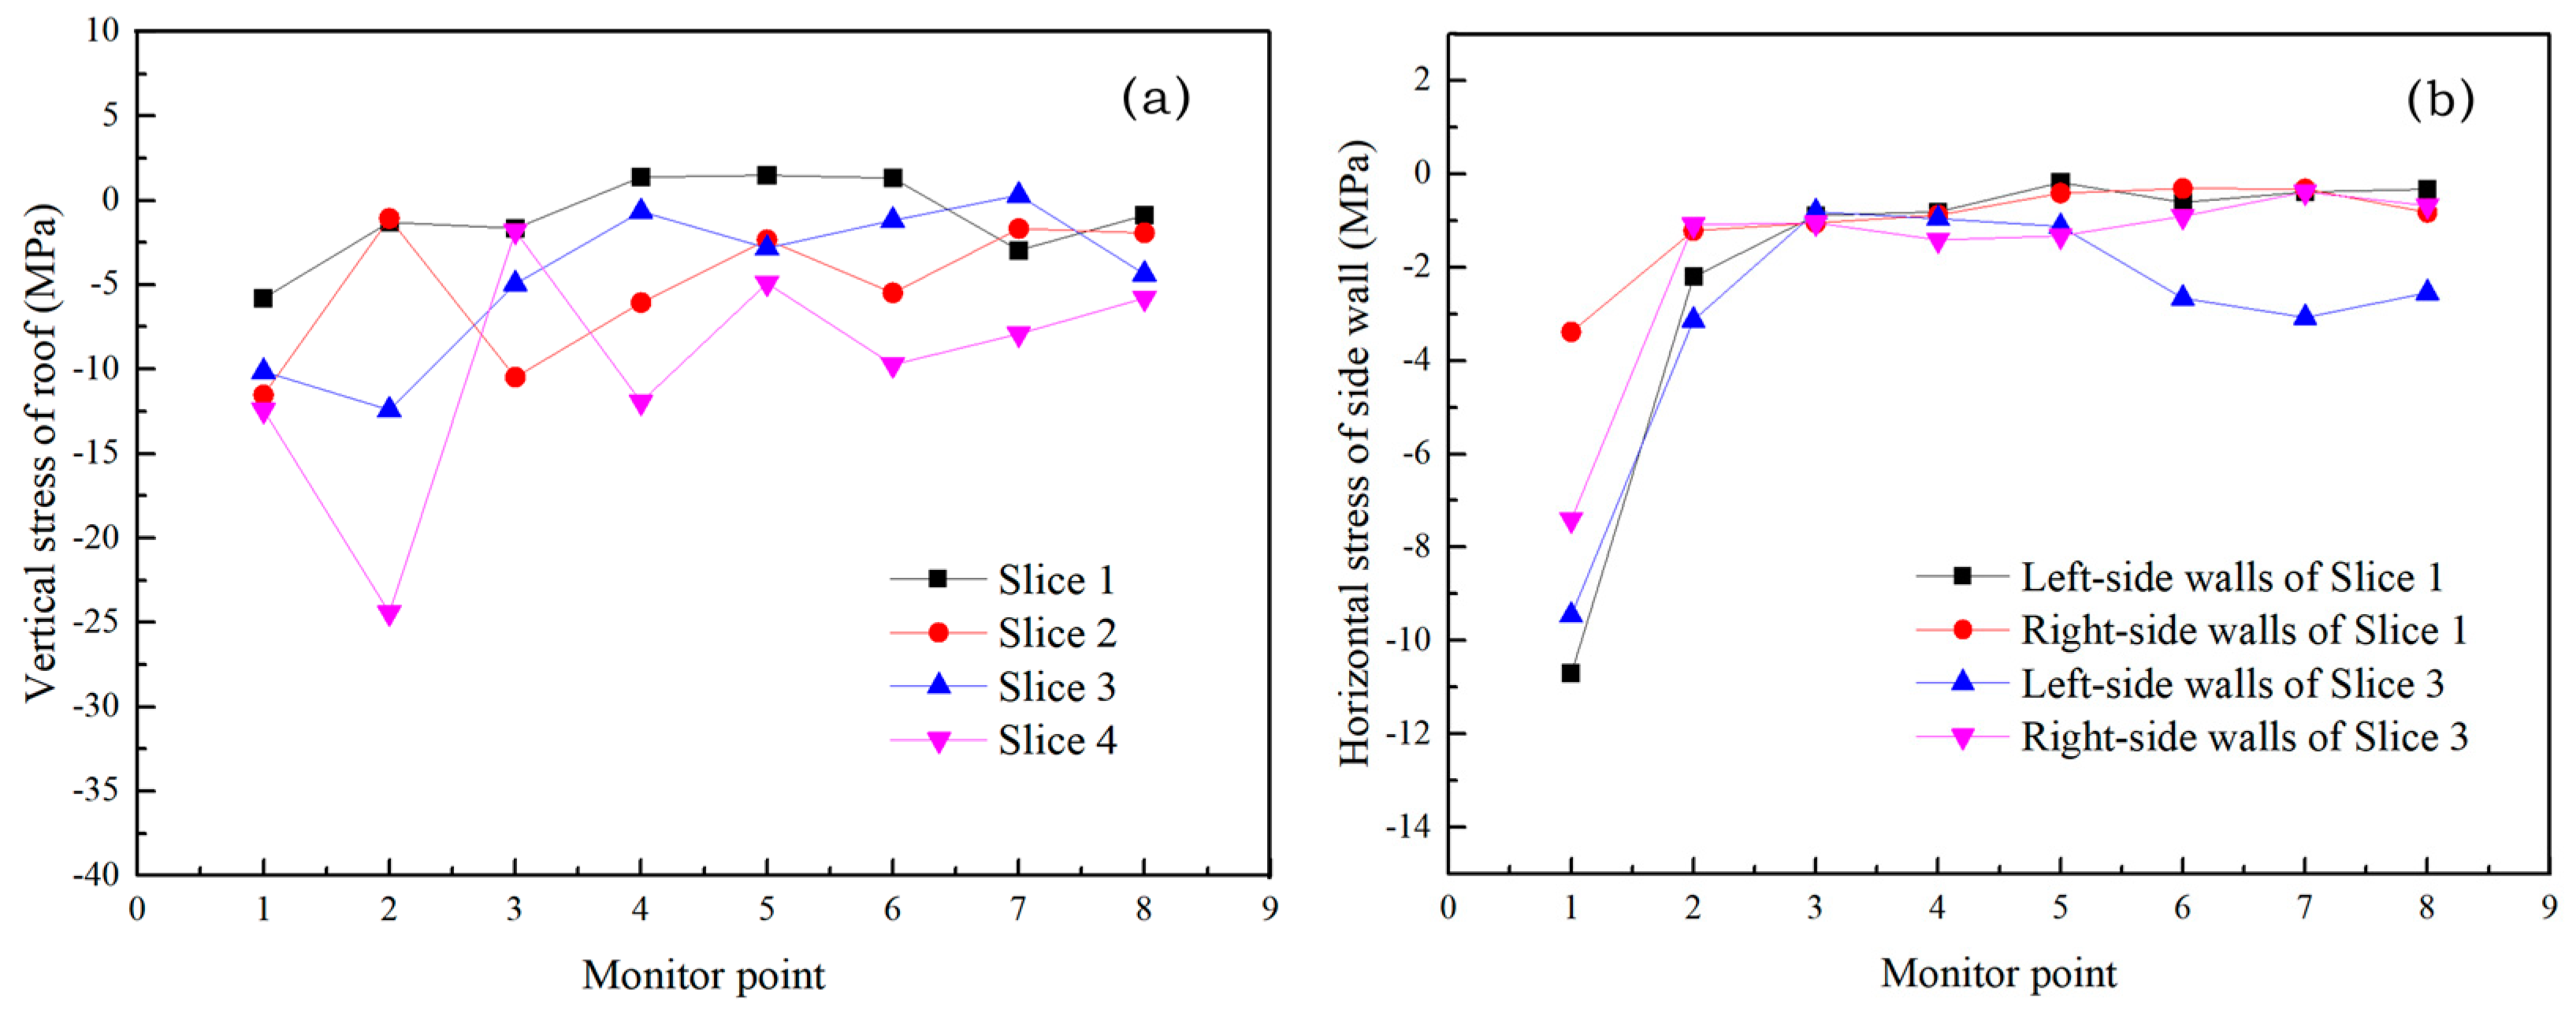
As
Figure 8a shows, the vertical stress of the roof changed greatly when Stope A was excavated. Tensile and compressive stresses co-exist in the stope side walls after excavation, especially in Slice 1. Besides, the maximum stress near the center of the roof was within 5 MPa. The tensile stress appeared near the center of Slice 1, but the maximum stress at the edge reached as high as 24.4 MPa. In addition, there is obvious stress concentration in Slice 4 near the subsidence area, and the analysis shows that the stability of the roof is already poor at this time, thus there is a danger of cracking [
22]. Further, it can be inferred that a pressure arch is formed above the roof, and the weight of the rock mass in the arch is transferred to the surrounding rock and pillars nearby, resulting in stress concentration; the pillars are gradually damaged by compression [
23,
24].
Different from the serious fracture deformation of the roof, for the horizontal stress of the left- and right-hand side walls of Stope A (
Figure 8b), the stress in the horizontal direction of the side walls is mainly concentrated in the upper part of the side walls, where it is close to the roof of the excavated stopes. There is no tensile stress for the horizonal stress of the side walls, and the maximum stress does not exceed 12 MPa, which is much lower than the stress value in the roof. This, therefore, indicates that the rock stability of excavated stopes is much better in the side walls compared with that in the roof.


 ,
, 


