
Automatic Gemstone Classification Using Computer Vision


Abstract
1. Introduction
2. Materials and Methods
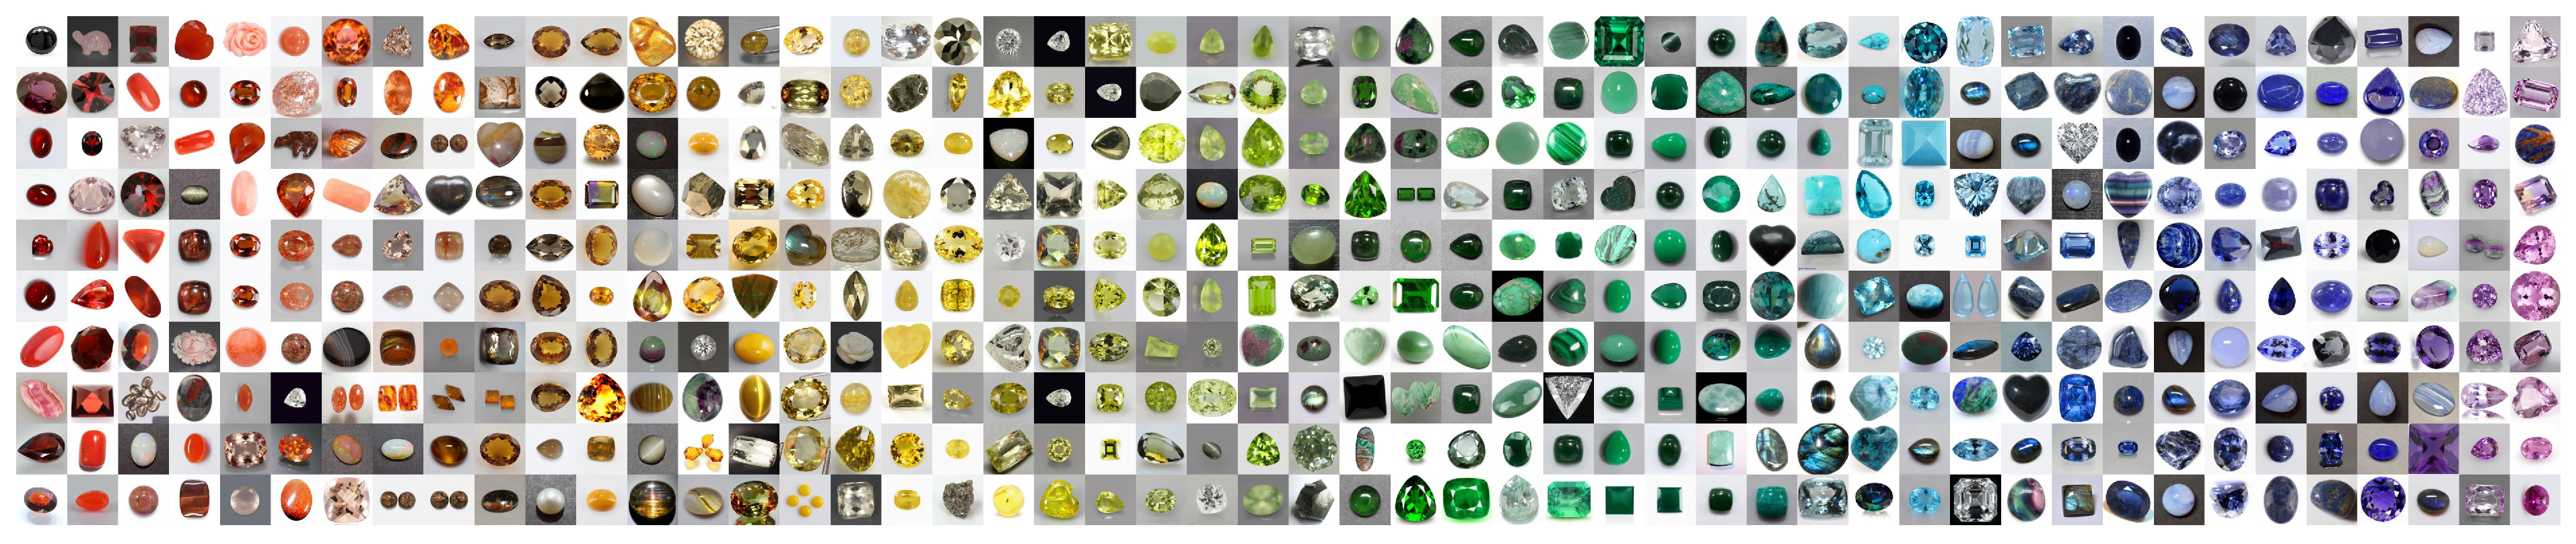
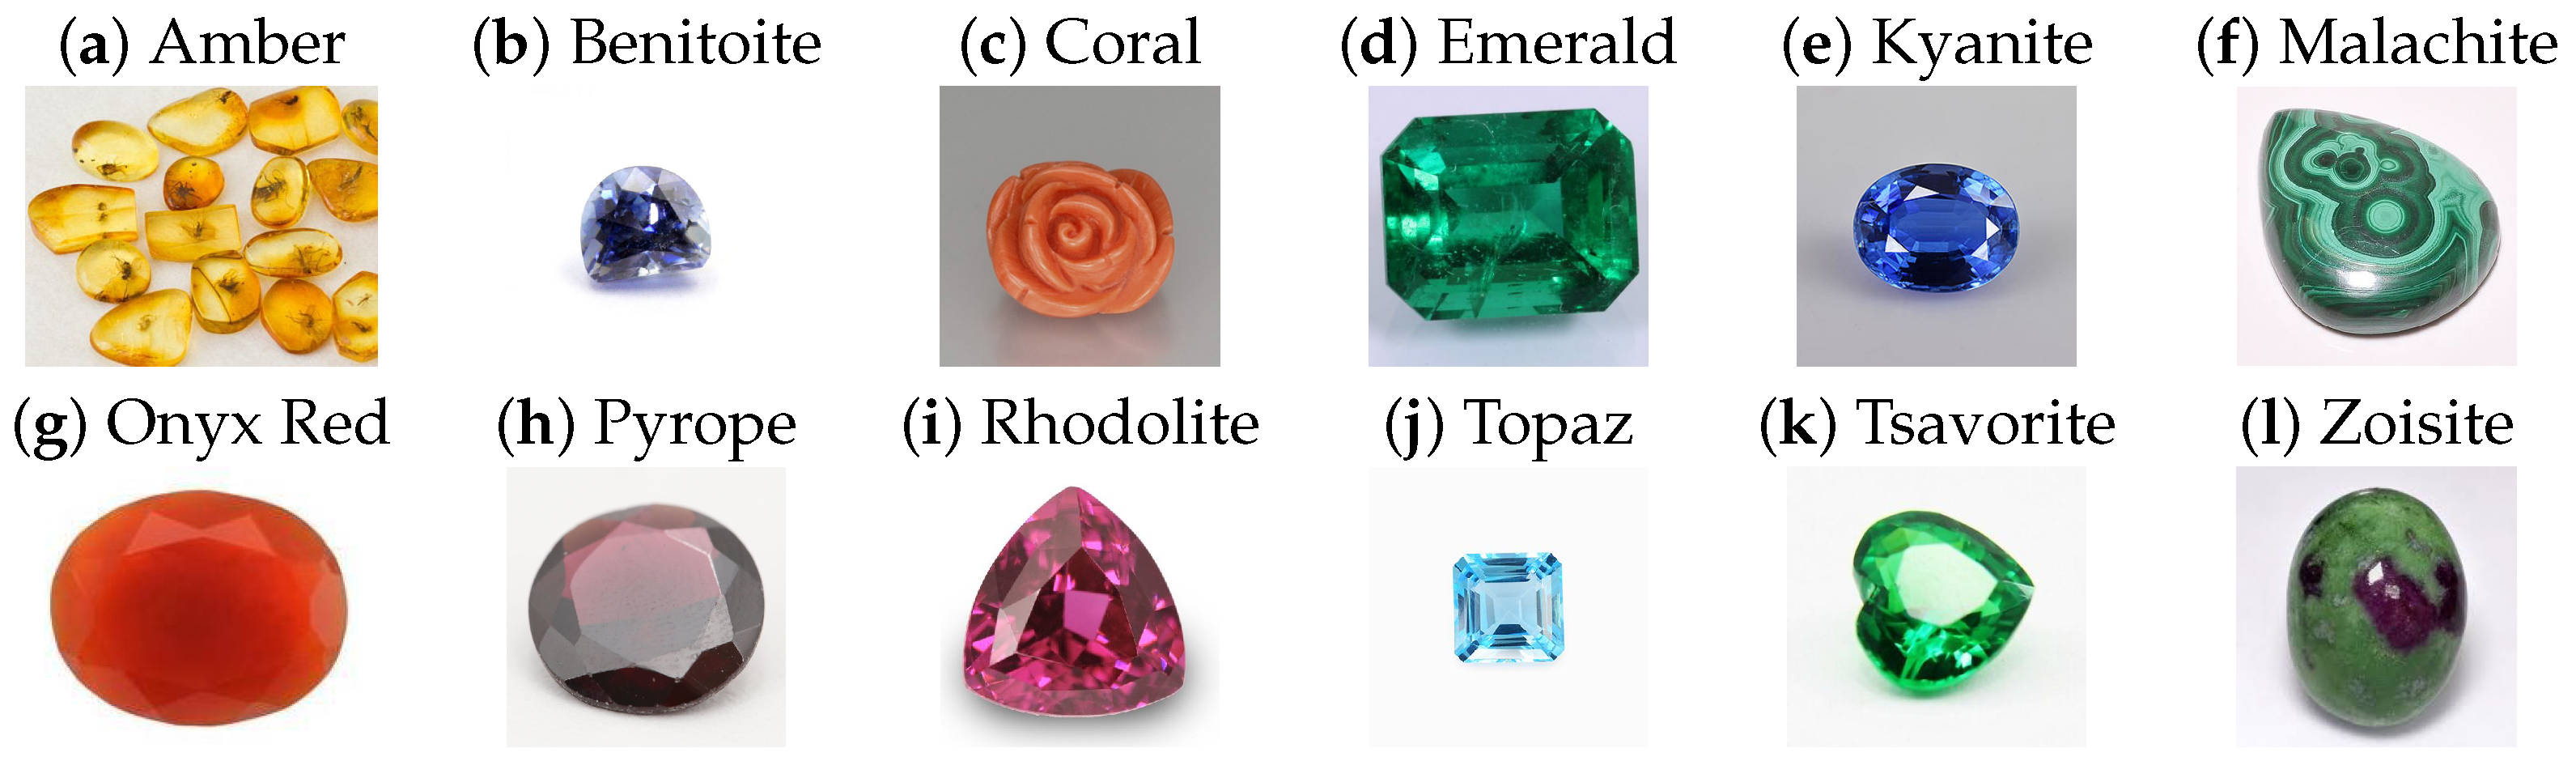
2.1. Materials
2.2. Methods
2.2.1. Background Segmentation
2.2.2. Feature Extraction
2.2.3. Machine-Learning Algorithms
Logistic Regression
Linear Discriminant Analysis
K-Nearest Neighbour
Decision Tree
Random Forest
Naive Bayes
Support Vector Machine
Parameter Optimisation
2.2.4. Convolutional Neural Networks and Transfer Learning
2.2.5. Evaluation
2.2.6. Expert Group
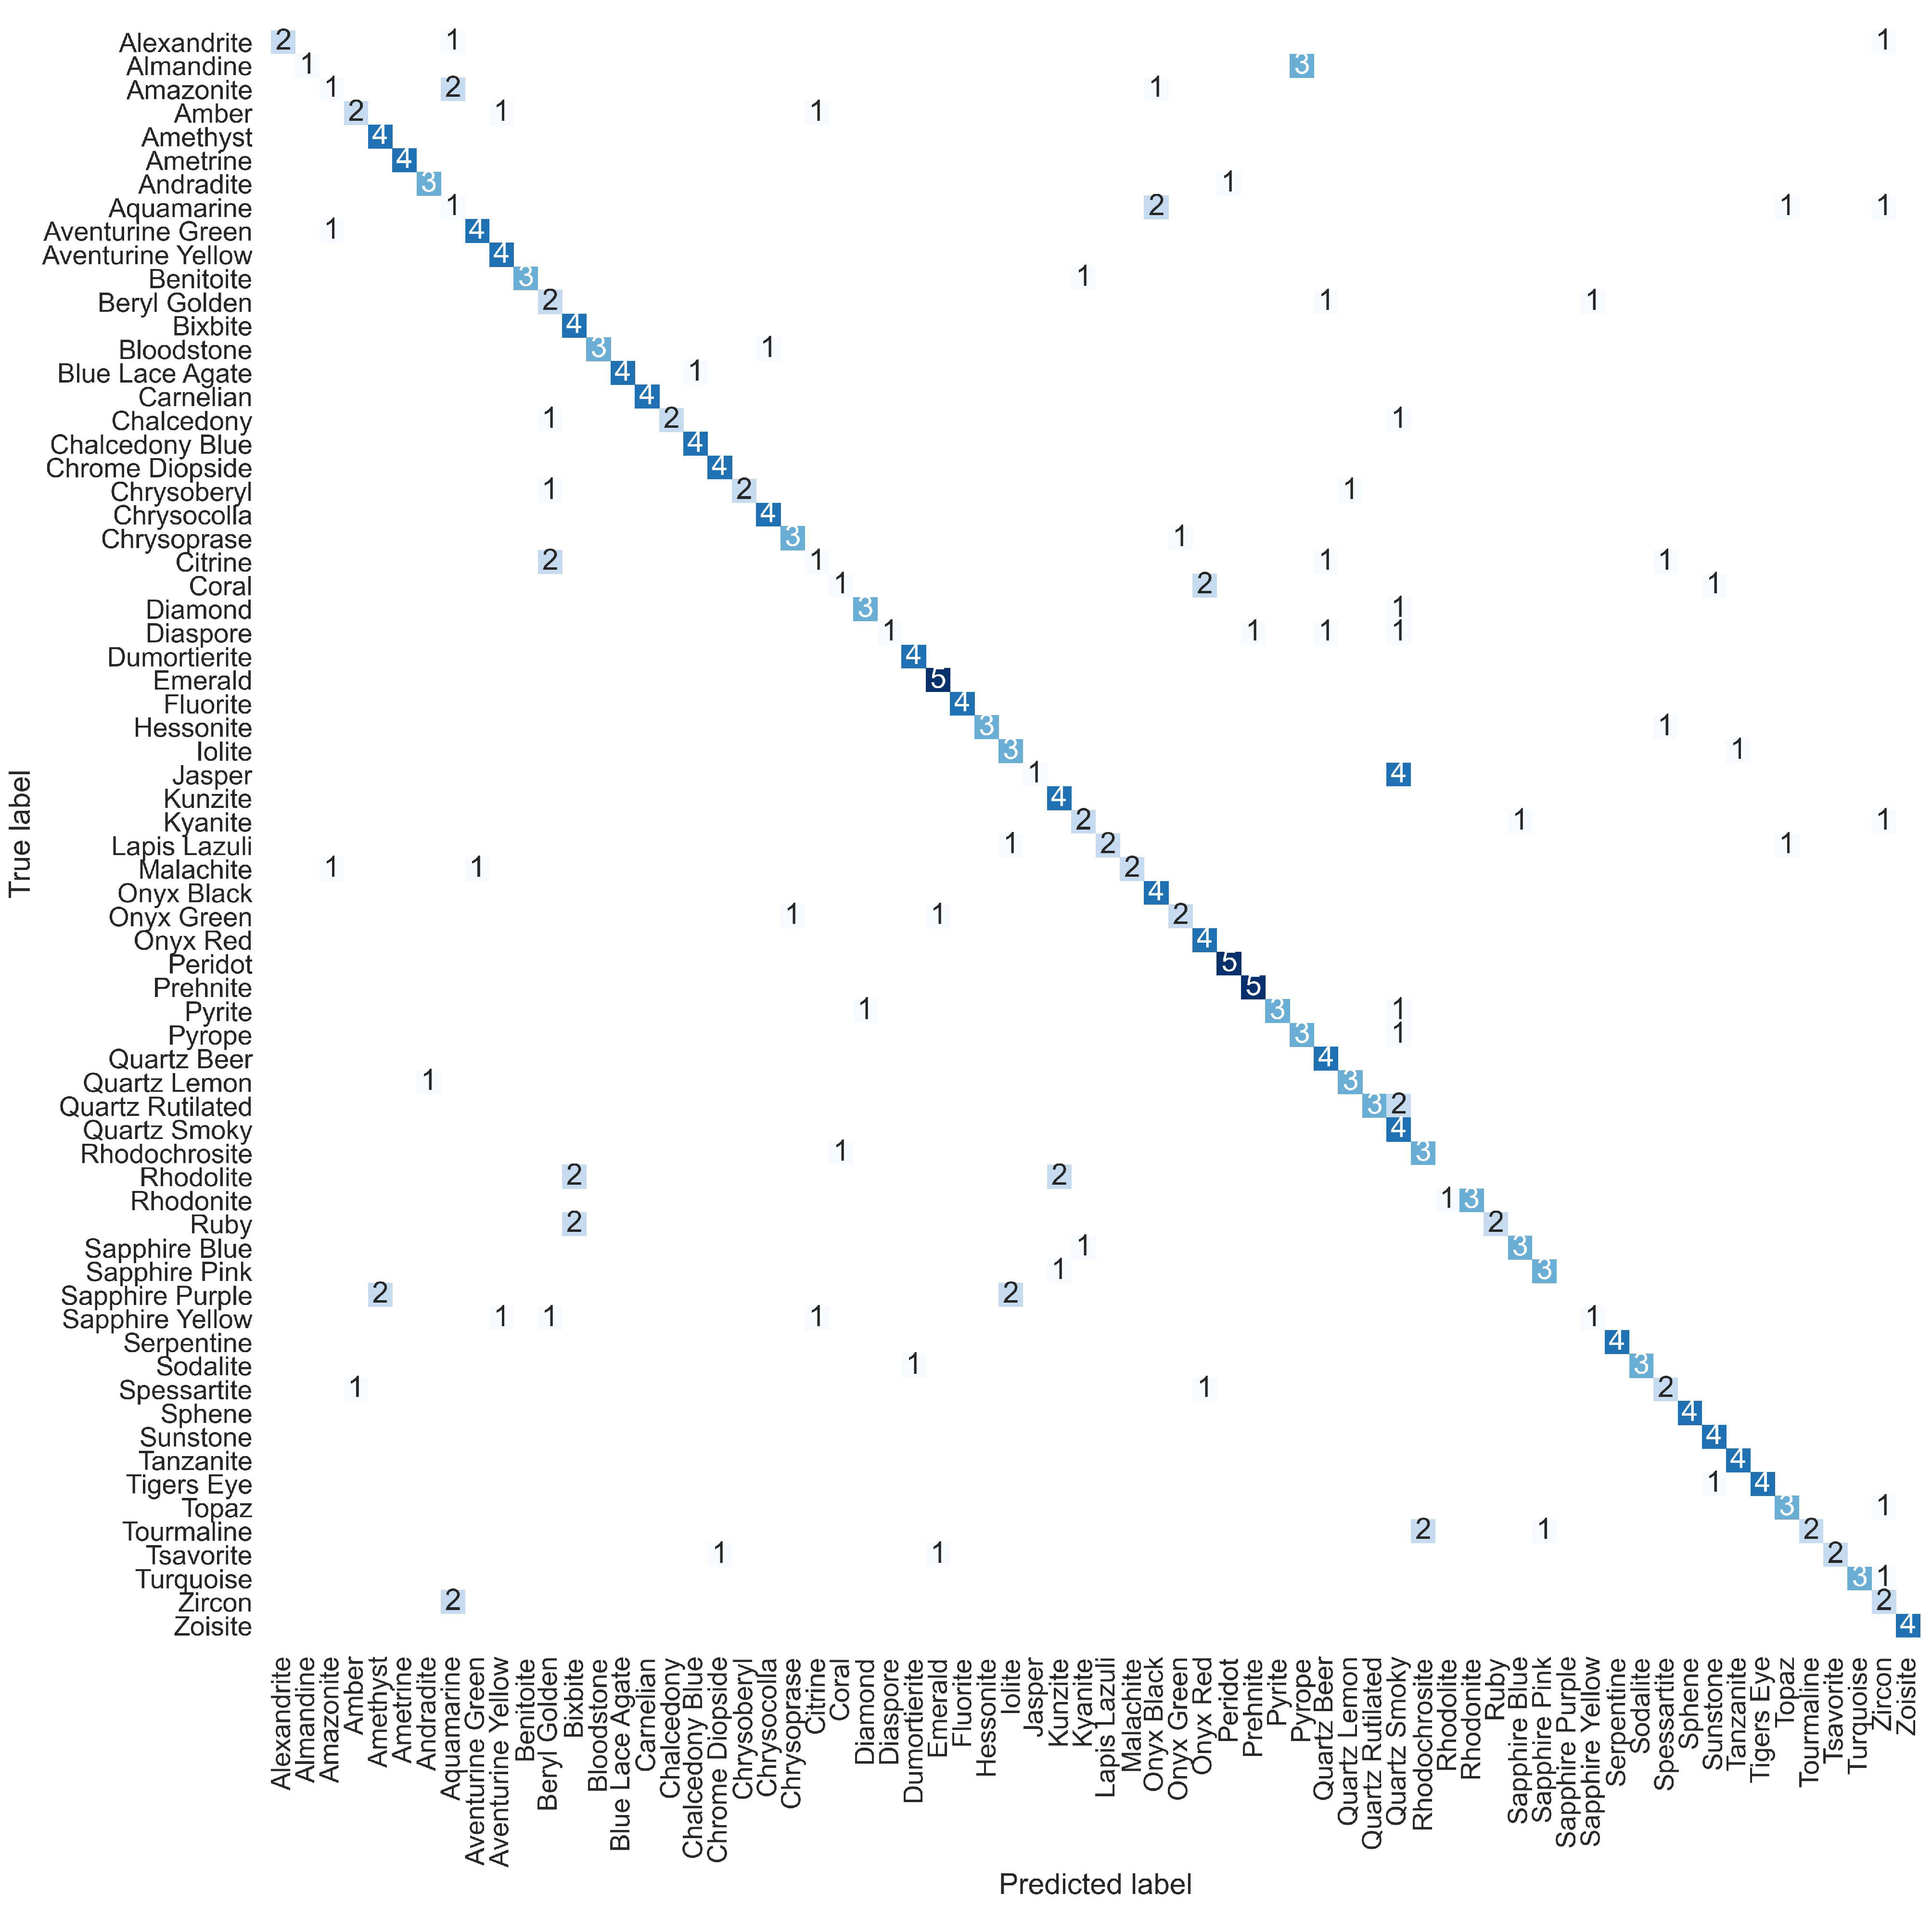
3. Results
3.1. Background Segmentation
3.2. Feature and Algorithm Comparison
4. Discussion
5. Conclusions
Author Contributions
Funding
Institutional Review Board Statement
Informed Consent Statement
Data Availability Statement
Acknowledgments
Conflicts of Interest
Abbreviations
| ASM | Angular Second Moment |
| CPU | Central Processing Unit |
| GLCM | Grey-Level Co-occurrence Matrix |
| GPU | Graphics Processing Unit |
| ILSVRC | ImageNet Large Scale Visual Recognition Challenge |
| LBP | Local Binary Pattern |
| ResNet | Microsoft’s Residual Network |
Appendix A
References
- Hurrell, K.; Johnson, M.L. Gemstones: A Complete Color Reference for Precious and Semiprecious Stones of the World; Chartwell Books: New York, NY, USA, 2016; p. 305. [Google Scholar]
- Breeding, C. Developments in Gemstone Analysis Techniques and Instrumentation During the 2000s. Gems Gemol. 2010, 46, 241–257. [Google Scholar] [CrossRef]
- Liddicoat, R.T. Developing the Powers of Observation in Gem Testing. Gems Gemol. 1962, 10, 291–319. [Google Scholar]
- Sturman, D.B. A new approach to the teaching and use of the refractometer. J. Gemmol. 2010, 32, 74–89. [Google Scholar] [CrossRef]
- Devouard, B.; Notari, F. The Identification of Faceted Gemstones: From the Naked Eye to Laboratory Techniques. Elements 2009, 5, 163–168. [Google Scholar] [CrossRef]
- Anderson, B.W.; Payne, J. The Spectroscope and Gemmology; Mitchell, R.K., Ed.; GemStone Press: Nashville, TN, USA, 1999. [Google Scholar]
- Thibault, N.W. A simple dichroscope. Am. Mineral. 1940, 25, 88–90. [Google Scholar]
- Karampelas, S.; Kiefert, L.; Bersani, D.; Vandenabeele, P. Gem Analysis. In Gems and Gemmology; Springer: Cham, Switzerland, 2020; pp. 39–66. [Google Scholar]
- Church, A.H. Notes on the Specific Gravity of Precious Stones. Geol. Mag. 1875, 2, 320–328. [Google Scholar] [CrossRef]
- Fritsch, E.; Stockton, C.M. Infrared Spectroscopy in Gem Identification. Gems Gemol. 1987, 23, 18–26. [Google Scholar] [CrossRef]
- Jenkins, A.L.; Larsen, R.A. Gemstone Identification Using Raman Spectroscopy. Spectroscopy 2004, 19, 20–25. [Google Scholar]
- Bersani, D.; Lottici, P.P. Applications of Raman spectroscopy to gemology. Anal. Bioanal. Chem. 2010, 397, 2631–2646. [Google Scholar] [CrossRef]
- Kiefert, L.; Karampelas, S. Use of the Raman spectrometer in gemmological laboratories: Review. Spectrochim. Acta Part A 2011, 80, 119–124. [Google Scholar] [CrossRef]
- He, T. The Applications of Ultraviolet Visible Absorption Spectrum Detection Technology in Gemstone Identification. In Proceedings of the 5th International Conference on Materials Engineering for Advanced Technologies (ICMEAT 2016), Quebec, QC, Canada, 5–6 August 2016; DEStech Publications: Lancaster, PA, USA, 2016; pp. 106–109. [Google Scholar]
- Ponahlo, J. Cathodoluminescence as a Tool in Gemstone Identification. In Cathodoluminescence in Geosciences; Springer: Berlin, Germany, 2000; pp. 479–500. [Google Scholar]
- Hänni, H.A. Advancements in gemmological instrumentation over the last 30 years. J. Gemmol. Assoc. Hong Kong 2009, 30, 14–16. [Google Scholar]
- Abduriyim, A.; Kitawaki, H. Applications of Laser Ablation–Inductively Coupled Plasma–Mass Spectrometry (LA-ICP-MS) To Gemology. Gems Gemol. 2006, 42, 98–118. [Google Scholar] [CrossRef]
- Tsai, T.-H.; D’Haenens-Johansson, U.F.S. Rapid gemstone screening and identification using fluorescence spectroscopy. Appl. Opt. 2021, 60, 3412–3421. [Google Scholar] [CrossRef] [PubMed]
- Thompson, S.; Fueten, F.; Bockus, D. Mineral identification using artificial neural networks and the rotating polarizer stage. Comput. Geosci. 2001, 27, 1081–1089. [Google Scholar] [CrossRef]
- Baykan, N.A.; Yilmaz, N. Mineral identification using color spaces and artificial neural networks. Comput. Geosci. 2010, 36, 91–97. [Google Scholar] [CrossRef]
- Izadi, H.; Sadri, J.; Bayati, M. An intelligent system for mineral identification in thin sections based on a cascade approach. Comput. Geosci. 2017, 99, 37–49. [Google Scholar] [CrossRef]
- Borges, H.P.; de Aguiar, M.S. Mineral Classification Using Machine Learning and Images of Microscopic Rock Thin Section. In Proceedings of the 18th Mexican Conference on Artificial Intelligence, MICAI 2019, Xalapa, Mexico, 28 October–1 November 2019; IEEE: New York, NY, USA, 2019; pp. 63–76. [Google Scholar]
- Maitre, J.; Bouchard, K.; Bédard, P. Mineral grains recognition using computer vision and machine learning. Comput. Geosci. 2019, 130, 84–93. [Google Scholar] [CrossRef]
- Zhang, Y.; Li, M.; Han, S.; Ren, Q.; Shi, J. Intelligent Identification for Rock-Mineral Microscopic Images Using Ensemble Machine Learning Algorithms. Sensors 2019, 19, 3914. [Google Scholar] [CrossRef]
- Ślipek, B.; Młynarczuk, M. Application of pattern recognition methods to automatic identification of microscopic images of rocks registered under different polarization and lighting conditions. Geol. Geophys. Environ. 2013, 39, 373–384. [Google Scholar] [CrossRef][Green Version]
- Chatterjee, S. Vision-based rock-type classification of limestone using multi-class support vector machine. Appl. Intell. 2013, 39, 14–27. [Google Scholar] [CrossRef]
- Młynarczuk, M.; Górszczyk, A.; Ślipek, B. The application of pattern recognition in the automatic classification of microscopic rock images. Comput. Geosci. 2013, 60, 126–133. [Google Scholar] [CrossRef]
- Perez, C.A.; Saravia, J.A.; Navarro, C.F.; Schulz, D.A.; Aravena, C.M.; Galdames, F.J. Rock lithological classification using multi-scale Gabor features from sub-images, and voting with rock contour information. Int. J. Miner. Process. 2015, 144, 56–64. [Google Scholar] [CrossRef]
- Xu, Z.; Ma, W.; Lin, P.; Shi, H.; Pan, D.; Liu, T. Deep learning of rock images for intelligent lithology identification. Comput. Geosci. 2021, 154, 104799. [Google Scholar] [CrossRef]
- Maula, I.; Amrizal, V.; Setianingrum, H.; Hakiem, N. Development of a Gemstone Type Identification System Based on HSV Space Colour Using an Artificial Neural Network Back Propagation Algorithm. In Advances in Intelligent Systems Research, Proceedings of the International Conference on Science and Technology (ICOSAT 2017), Jakarta, Indonesia, 10 August 2017; Atlantis Press: Dordrecht, The Netherlands, 2017; pp. 104–109. [Google Scholar]
- Ostreika, A.; Pivoras, M.; Misevičius, A.; Skersys, T.; Paulauskas, L. Classification of Objects by Shape Applied to Amber Gemstone Classification. Appl. Sci. 2021, 11, 1024. [Google Scholar] [CrossRef]
- Ostreika, A.; Pivoras, M.; Misevičius, A.; Skersys, T.; Paulauskas, L. Classification of Amber Gemstone Objects by Shape. Preprints 2020, 2020080336. [Google Scholar] [CrossRef]
- Rios, C.; Saito, R. Researching of the Deep Neural Network for Amber Gemstone Classification. Master’s Thesis, Universitat Politècnica de Catalunya, Barcelona, Spain, 2018. [Google Scholar]
- Sinkevičius, S.; Lipnickas, A.; Rimkus, K. Multiclass amber gemstones classification with various segmentation and committee strategies. In Proceedings of the 2013 IEEE 7th International Conference on Intelligent Data Acquisition and Advanced Computing Systems (IDAACS), Berlin, Germany, 12–14 September 2013; IEEE: New York, NY, USA, 2013; pp. 304–308. [Google Scholar]
- Liu, X.; Mao, J. Research on Key Technology of Diamond Particle Detection Based on Machine Vision. In Proceedings of the 2018 2nd International Conference on Electronic Information Technology and Computer Engineering (EITCE 2018), Shanghai, China, 12–14 October 2018; EDP Sciences: Les Ulis, France, 2018; Volume 232, p. 02059. [Google Scholar]
- Sinkevičius, S.; Lipnickas, A.; Rimkus, K. Amber Gemstones Sorting By Colour. Elektron. Ir Elektrotechnika 2017, 23, 10–14. [Google Scholar] [CrossRef]
- Zhang, S.; Guo, Y. Measurement of Gem Colour Using a Computer Vision System: A Case Study with Jadeite-Jade. Minerals 2021, 11, 791. [Google Scholar] [CrossRef]
- Wang, D.; Bischof, L.; Lagerstrom, R.; Hilsenstein, V.; Hornabrook, A.; Hornabrook, G. Automated Opal Grading by Imaging and Statistical Learning. IEEE Trans. Syst. Man Cybern. Syst. 2016, 46, 185–201. [Google Scholar] [CrossRef]
- Loesdau, M. Towards a Computer Vision Based Quality Assessment of Tahitian Pearls. Ph.D. Thesis, Université de la Polynésie Française, Puna’auia, French Polynesia, 2017. [Google Scholar]
- Gemstones Images. Available online: https://www.kaggle.com/lsind18/gemstones-images (accessed on 27 April 2021).
- Otsu, N. A Threshold Selection Method from Gray-Level Histograms. IEEE Trans. Syst. Man Cybern. 1979, 9, 62–66. [Google Scholar] [CrossRef]
- Nixon, M.S.; Aguado, A.S. (Eds.) Feature Extraction & Image Processing for Computer Vision, 3rd ed.; Academic Press: Oxford, UK, 2013. [Google Scholar]
- Liu, Y.; Zhou, X.; Ma, W.-Y. Extracting Texture Features from Arbitrary-Shaped Regions for Image Retrieval. In Proceedings of the 2004 IEEE International Conference on Multimedia and Expo (ICME), Taipei, Taiwan, 27–30 June 2004; Volume 3, pp. 1891–1894. [Google Scholar]
- Bianconi, F.; Fernández, A.; González, E.; Ribas, F. Texture Classification Through Combination of Sequential Colour Texture Classifiers. In Progress in Pattern Recognition, Image Analysis and Applications; Rueda, L., Mery, D., Kittler, J., Eds.; Springer: Berlin/Heidelberg, Germany, 2007; pp. 231–240. [Google Scholar]
- Belalia, A.; Belloulata, K.; Kpalma, K. Region-Based Image Retrieval Using Shape-Adaptive DCT. Int. J. Multimed. Inf. Retr. 2015, 4, 261–276. [Google Scholar] [CrossRef]
- Feizi, A. High-Level Feature Extraction for Classification and Person Re-Identification. IEEE Sens. J. 2017, 17, 7064–7073. [Google Scholar] [CrossRef]
- Kittler, J. Feature Selection and Extraction; Academic Press: New York, NY, USA, 1986; Chapter 3; pp. 59–83. [Google Scholar]
- Cheng, H.D.; Jiang, X.H.; Sun, Y.; Wang, J. Color image segmentation: Advances and prospects. Pattern Recognit. 2001, 34, 2259–2281. [Google Scholar] [CrossRef]
- Gevers, T.; Gijsenij, A.; van der Weijer, J.; Geusebroek, J.-M. Color Image Formation. In Color in Computer Vision; Kriss, M.A., MacDonald, L.W., Eds.; Wiley: Hoboken, NJ, USA, 2012; pp. 26–45. [Google Scholar]
- Gonzalez, R.C.; Woods, R.E. Digital Image Processing; Pearson Prentice Hall: Upper Saddle River, NJ, USA, 2008. [Google Scholar]
- Angulo, J. Morphological color image simplification by Saturation-controlled regional levelings. Int. J. Pattern Recognit. Artif. Intell. 2006, 20, 1207–1223. [Google Scholar] [CrossRef]
- Reyes-Aldasoro, C.C.; Björndahl, M.A.; Akerman, S.; Ibrahim, J.; Griffiths, M.K.; Tozer, G.M. Online chromatic and scale-space microvessel-tracing analysis for transmitted light optical images. Microvasc. Res. 2012, 84, 330–339. [Google Scholar] [CrossRef] [PubMed][Green Version]
- Smith, A.R. Color gamut transform pairs. ACM SIGGRAPH 1978, 12, 12–19. [Google Scholar] [CrossRef]
- Hartigan, J.A.; Wong, M.A. A K-Means Clustering Algorithm. Appl. Stat. 1979, 28, 100–108. [Google Scholar] [CrossRef]
- Funt, B.V.; Finlayson, G.D. Color Constant Color Indexing. IEEE Trans. Pattern Anal. Mach. Intell. 1995, 17, 522–529. [Google Scholar] [CrossRef]
- Reyes-Aldasoro, C.C. Biomedical Image Analysis Recipes in MATLAB: For Life Scientists and Engineers; Wiley-Blackwell: Chichester, UK, 2015. [Google Scholar]
- Haralick, R.M.; Shanmugam, K.; Dinstein, I. Textural Features for Image Classification. IEEE Trans. Syst. Man Cybern. 1973, 3, 610–621. [Google Scholar] [CrossRef]
- Bigun, J. Multidimensional Orientation Estimation with Applications to Texture Analysis and Optical Flow. IEEE Trans. Pattern Anal. Mach. Intell. 1991, 13, 775–790. [Google Scholar] [CrossRef]
- Bovik, A.C.; Clark, M.; Geisler, W.S. Multichannel Texture Analysis Using Localized Spatial Filters. IEEE Trans. Pattern Anal. Mach. Intell. 1990, 12, 55–73. [Google Scholar] [CrossRef]
- Cross, G.R.; Jain, A.K. Markov Random Field Texture Models. IEEE Trans. Pattern Anal. Mach. Intell. 1983, 5, 25–39. [Google Scholar] [CrossRef]
- Reyes-Aldasoro, C.C.; Bhalerao, A. The Bhattacharyya Space for Feature Selection and Its Application to Texture Segmentation. Pattern Recogn. 2006, 39, 812–826. [Google Scholar] [CrossRef]
- Tai, C.; Baba-Kishi, K. Microtexture Studies of PST and PZT Ceramics and PZT Thin Film by Electron Backscatter Diffraction Patterns. Textures Microstruct. 2002, 35, 71–86. [Google Scholar] [CrossRef]
- Carrillat, A.; Randen, T.; Sonneland, L.; Elvebakk, G. Seismic Stratigraphic Mapping of Carbonate Mounds using 3D Texture Attributes. In Proceedings of the 64th EAGE Conference & Exhibition, Florence, Italy, 27–30 May 2002; European Association of Geoscientists and Engineers: Houten, The Netherlands, 2002. [Google Scholar]
- Bianconi, F.; González, E.; Fernández, A.; Saetta, S.A. Automatic Classification of Granite Tiles Through Colour and Texture Features. Expert Syst. Appl. 2012, 39, 11212–11218. [Google Scholar] [CrossRef]
- Reyes Aldasoro, C.C.; Bhalerao, A. Volumetric Texture Segmentation by Discriminant Feature Selection and Multiresolution Classification. IEEE Trans. Med. Imaging 2007, 26, 1–14. [Google Scholar] [CrossRef] [PubMed]
- Kovalev, V.A.; Petrou, M.; Bondar, Y.S. Texture Anisotropy in 3D Images. IEEE Trans. Image Process. 1999, 8, 346–360. [Google Scholar] [CrossRef] [PubMed]
- Kather, J.N.; Weis, C.A.; Bianconi, F.; Melchers, S.M.; Schad, L.R.; Gaiser, T.; Marx, A.; Zollner, F. Multi-class Texture Analysis in Colorectal Cancer Histology. Sci. Rep. 2016, 6, 27988. [Google Scholar] [CrossRef] [PubMed]
- Ojala, T.; Pietikäinen, M.; Harwood, D. A comparative study of texture measures with classification based on featured distributions. Pattern Recognit. 1996, 29, 51–59. [Google Scholar] [CrossRef]
- Chawla, N.V.; Bowyer, K.W.; Hall, L.O.; Kegelmeyer, W.P. SMOTE: Synthetic Minority Over-sampling Technique. J. Artif. Intell. Res. 2002, 16, 321–357. [Google Scholar] [CrossRef]
- Bishop, C.M. Linear models for classification. In Pattern Recognition and Machine Learning; Jordan, M., Kleinberg, J., Schölkopf, B., Eds.; Springer: New York, NY, USA, 2006; pp. 179–224. [Google Scholar]
- Li, T.; Zhu, S.; Ogihara, M. Using discriminant analysis for multi-class classification: An experimental investigation. Knowl. Inf. Syst. 2006, 10, 453–472. [Google Scholar] [CrossRef]
- Cover, T.M.; Hart, P.E. Nearest Neighbor Pattern Classification. Knowl. Inf. Syst. 1967, 13, 21–27. [Google Scholar] [CrossRef]
- Breiman, L.; Friedman, J.H.; Olshen, R.A.; Stone, C.J. Review of Classification and Regression Trees. Biometrics 1984, 40, 874. [Google Scholar]
- Breiman, L. Random Forests. Mach. Learn. 2001, 45, 5–32. [Google Scholar] [CrossRef]
- Criminisi, A.; Shotton, J. Decision Forests for Computer Vision and Medical Image Analysis; Springer: Cham, Switzerland, 2013; 366p. [Google Scholar]
- Taheri, S.; Mammadov, M. Learning the Naive Bayes Classifier with Optimization Models. Rocznik 2013, 23, 787–795. [Google Scholar] [CrossRef]
- Crammer, K.; Singer, Y. On the Algorithmic Implementation of Multiclass Kernel-based Vector Machines. J. Mach. Learn. Res. 2001, 2, 265–292. [Google Scholar]
- Feurer, M.; Hutter, F. Hyperparameter Optimization. In Automated Machine Learning; Springer: Cham, Switzerland, 2019; pp. 3–33. [Google Scholar]
- Goodfellow, I.; Bengio, Y.; Courville, A. Deep Learning; MIT Press: Cambridge, MA, USA, 2016; Available online: http://www.deeplearningbook.org (accessed on 31 December 2021).
- LeCun, Y.; Bengio, Y.; Hinton, G. Deep Learning. Nature 2015, 521, 436–444. [Google Scholar] [CrossRef]
- Russakovsky, O.; Deng, J.; Su, H.; Krause, J.; Satheesh, S.; Ma, S.; Huang, Z.; Karpathy, A.; Khosla, A.; Bernstein, M.; et al. ImageNet Large Scale Visual Recognition Challenge. Int. J. Comput. Vis. 2015, 115, 211–252. [Google Scholar] [CrossRef]
- Shao, L.; Zhu, F.; Li, X. Transfer Learning for Visual Categorization: A Survey. IEEE Trans. Neural Netw. Learn. Syst. 2005, 26, 1019–1034. [Google Scholar] [CrossRef]
- Rezende, E.; Ruppert, G.; Carvalho, T.; Ramos, F.; de Geus, P. Malicious Software Classification Using Transfer Learning of ResNet-50 Deep Neural Network. In Proceedings of the 2017 16th IEEE International Conference on Machine Learning and Applications (ICMLA), Cancun, Mexico, 18–21 December 2017; IEEE: New York, NY, USA, 2017; pp. 1011–1014. [Google Scholar]
- Reddy, A.S.B.; Juliet, D.S. Transfer Learning with ResNet-50 for Malaria Cell-Image Classification. In Proceedings of the 2019 International Conference on Communication and Signal Processing (ICCSP), Chennai, India, 4–6 April 2019; IEEE: New York, NY, USA, 2019; pp. 945–949. [Google Scholar]
- Miglani, V.; Bhatia, M. Skin Lesion Classification: A Transfer Learning Approach Using EfficientNets. In Proceedings of the 2020 International Conference on Advanced Machine Learning Technologies and Applications (AMLTA), Jaipur, India, 13–15 February 2019; Springer: Singapore, 2020; pp. 315–324. [Google Scholar]
- He, K.; Zhang, X.; Ren, S.; Sun, J. Deep Residual Learning for Image Recognition. In Proceedings of the 2016 IEEE Conference on Computer Vision and Pattern Recognition (CVPR), Las Vegas, NV, USA, 30 June 2016; IEEE: New York, NY, USA, 2016; pp. 770–778. [Google Scholar]
- Hossin, M.; Sulaiman, M.N. A Review of Evaluation Metrics For Data Classification Evaluations. Int. J. Data Min. Knowl. Manag. Process 2015, 5, 1–11. [Google Scholar]
- Lapin, M.; Hein, M.; Schiele, B. Top-k Multiclass SVM. arXiv 2015, arXiv:1511.06683. [Google Scholar]
- Reif, M.; Shafait, F.; Dengel, A. Prediction of Classifier Training Time Including Parameter Optimization. In KI 2011: Advances in Artificial Intelligence; Springer: Berlin, Germany, 2011; pp. 260–271. [Google Scholar]
- Tharwat, A. Classification assessment methods. Appl. Comput. Inform. 2020, 17, 168–192. [Google Scholar] [CrossRef]
- Okazawa, A.; Takahada, T.; Harada, T. Simultaneous Transparent and Non-Transparent Object Segmentation With Multispectral Scenes. In Proceedings of the 2019 IEEE/RSJ International Conference on Intelligent Robots and Systems (IROS), Macau, China, 3–8 November 2019; IEEE: New York, NY, USA, 2019; pp. 4977–4984. [Google Scholar]
- Verma, A.; Banerji, S.; Liu, C. A New Color SIFT Descriptor and Methods for Image Category Classification. In Proceedings of the 2010 IRAST International Congress on Computer Applications and Computational Science (CACS 2010), Singapore, 4–6 December 2010; International Research Alliance for Science and Technology: Singapore, 2010; pp. 819–822. [Google Scholar]


| Algorithm | Range of Parameters |
|---|---|
| Logistic Regression | “C”: [0.001,0.01,0.1,1,10] |
| Linear Discriminant Analysis | “solver”: “lsqr”; “shrinkage”: [0,0.5,1] |
| K-Nearest Neighbour | “n_neighbors”: [3,5,7,9] |
| Decision Tree | “max_depth”: [10,None]; “max_features”: [3,5,7,9]; “min_samples_leaf”: [3,5,7,9] |
| Random Forest | “n_estimators”: [50,100]; “max_depth”: [3,5,7,9]; “min_samples_leaf”: [3,5,7,9] |
| Naive Bayes | “var_smoothing”: 1×10⁻⁹ |
| Support Vector Machine | “estimator__kernel“: [“linear”, “poly”, “rbf”, “sigmoid”]; “estimator__C”: [1,10,100]; “estimator__gamma”: [0.1,0.01] |
| ResNet | Number of layers: 18 or 50; Training images: RandomResizedCrop (224), RandomHorizontalFlip, RandomVerticalFlip and Normalize; Test images: Resize (256), CenterCrop (224) and Normalize; “batch_size”:16; “max_epochs”: 25; “criterion”: torch.nn.CrossEntropyLoss; “lr”: 0.001; “optimizer”: torch.optim.SGD; “optimizer__momentum”: 0.9; “iterator_train__num_workers”: 2; “iterator_valid__num_workers”: 2; “iterator_train__shuffle”: True; “callbacks”: LRScheduler(policy = “StepLR”, step_size = 7,gamma = 0.1), Checkpoint (monitor = “valid_acc_best”), Freezer (lambda x: not x.startswith (“model.fc”)) |
| Algorithm | Accuracy | Top-5 Accuracy | Training Time in Seconds | Test Time in Seconds |
|---|---|---|---|---|
| Random Forest | 69.4% | 94.4% | 39.81 | 0.0165 |
| Logistic Regression | 68.7% | 92.6% | 17.79 | 0.0008 |
| Support Vector Machine | 66.9% | 86.3% | 1881.36 | 0.5459 |
| ResNet50 | 63.4% | 91.5% | 449.09 | 4.5244 |
| Naive Bayes | 62.7% | 77.8% | 0.54 | 0.0281 |
| ResNet18 | 62.0% | 89.4% | 293.05 | 2.2119 |
| Linear Discriminant Analysis | 59.9% | 94.0% | 3.71 | 0.0007 |
| K-Nearest Neighbour | 54.6% | 85.9% | 1.09 | 0.0479 |
| Decision Tree | 46.5% | 73.9% | 0.56 | 0.0002 |
| Expert | Accuracy | Test Time |
|---|---|---|
| Gemmologist 1 | 66.9% | 175 min or 10,500 s |
| Gemmologist 2 | 46.8% | 97 min or 5820 s |
| Gemmologist 3 | 42.6% | 42 min or 2520 s |
| Method | Accuracy | Top-5 Accuracy | Training (s) | Test (s) |
|---|---|---|---|---|
| RGB 8-bin hist. and LBP, 8 points, radius 1 | 69.4% | 94.4% | 39.81 | 0.0165 |
| RGB 4-bin hist. and LBP, 8 points, radius 1 | 69.0% | 93.7% | 33.78 | 0.0164 |
| RGB 4/8-bin hist. and LBP, 8 points, radius 1 | 68.7% | 96.5% | 60.73 | 0.0181 |
| RGB 8-bin hist. and LBP, 16 points, radius 1 | 68.7% | 95.4% | 43.33 | 0.0168 |
| RGB 4/8-bin hist. and LBP, 8 points, radius 1 & 24 points, radius 3 | 68.7% | 92.6% | 17.79 | 0.0008 |
| RGB 8-bin hist. and GLCM correlation | 67.6% | 94.4% | 38.42 | 0.0162 |
| RGB 8-bin hist. and LBP, 8 points, radius 3 | 67.6% | 94.4% | 78.96 | 0.0176 |
| RGB 8-bin hist. and GLCM dissimilarity | 67.3% | 94.0% | 43.60 | 0.0190 |
| RGB 8-bin hist. and LBP, 24 points, radius 3 | 66.9% | 94.7% | 66.56 | 0.0169 |
| RGB 8-bin hist. and LBP, 24 points, radius 1 | 66.9% | 86.3% | 1881.36 | 0.5459 |
| RGB 8-bin hist. and GLCM energy | 66.5% | 96.1% | 37.92 | 0.0164 |
| HSV 8-bin hist. and LBP, 8 points, radius 1 | 66.5% | 93.3% | 82.35 | 0.0484 |
| RGB 8-bin hist. and GLCM ASM | 66.2% | 94.7% | 39.65 | 0.0164 |
| RGB 8-bin hist. and LBP, 16 points, radius 3 | 65.8% | 92.6% | 14.97 | 0.0008 |
| RGB 8-bin hist. and GLCM contrast | 65.5% | 96.1% | 48.90 | 0.0164 |
| RGB 4-bin hist. and Haralick texture | 65.5% | 95.1% | 77.00 | 0.0262 |
| HSV 8-bin hist. and Haralick texture | 65.5% | 93.7% | 55.76 | 0.0100 |
| RGB 8-bin hist. and Haralick texture | 65.5% | 93.7% | 69.33 | 0.0176 |
| RGB 8-bin hist. and GLCM homogen. | 65.1% | 95.1% | 38.59 | 0.0165 |
| RGB 4 and 8-bin hist. | 65.1% | 94.0% | 45.88 | 0.0163 |
| RGB 4-bin hist. | 64.8% | 95.4% | 26.42 | 0.0164 |
| HSV 4 and 8-bin hist. | 64.4% | 93.3% | 57.64 | 0.0166 |
| CIELAB 4 and 8-bin hist. | 64.1% | 94.0% | 31.49 | 0.0196 |
| CIELAB 8-bin hist. | 64.1% | 93.7% | 26.91 | 0.0165 |
| HSV 8-bin hist. | 63.4% | 95.1% | 52.25 | 0.0165 |
| ResNet50 | 63.4% | 91.5% | 449.09 | 4.5244 |
| RGB 8-bin hist. | 62.7% | 87.0% | 1387.63 | 0.4420 |
| ResNet18 | 62.0% | 89.4% | 293.05 | 2.2119 |
| HSV 4-bin hist. and LBP, 8 points, radius 1 | 60.9% | 91.2% | 46.68 | 0.0176 |
| HSV 4-bin hist. and Haralick texture | 57.7% | 87.3% | 580.56 | 0.3129 |
| HSV 4-bin hist. | 57.0% | 88.7% | 32.88 | 0.0167 |
| CIELAB 4-bin hist. | 56.7% | 91.5% | 21.12 | 0.0163 |
| CIELAB non-background K-means cluster centre | 47.9% | 87.7% | 20.95 | 0.0180 |
| RGB non-background K-means cluster centre | 44.0% | 86.3% | 0.17 | 0.0002 |
| HSV non-background K-means cluster centre | 43.0% | 81.3% | 17.57 | 0.0165 |
Publisher’s Note: MDPI stays neutral with regard to jurisdictional claims in published maps and institutional affiliations. |
© 2021 by the authors. Licensee MDPI, Basel, Switzerland. This article is an open access article distributed under the terms and conditions of the Creative Commons Attribution (CC BY) license (https://creativecommons.org/licenses/by/4.0/).
Share and Cite
Chow, B.H.Y.; Reyes-Aldasoro, C.C. Automatic Gemstone Classification Using Computer Vision. Minerals 2022, 12, 60. https://doi.org/10.3390/min12010060
Chow BHY, Reyes-Aldasoro CC. Automatic Gemstone Classification Using Computer Vision. Minerals. 2022; 12(1):60. https://doi.org/10.3390/min12010060
Chicago/Turabian StyleChow, Bona Hiu Yan, and Constantino Carlos Reyes-Aldasoro. 2022. "Automatic Gemstone Classification Using Computer Vision" Minerals 12, no. 1: 60. https://doi.org/10.3390/min12010060
APA StyleChow, B. H. Y., & Reyes-Aldasoro, C. C. (2022). Automatic Gemstone Classification Using Computer Vision. Minerals, 12(1), 60. https://doi.org/10.3390/min12010060