Article

Zoisite-(Pb), a New Orthorhombic Epidote-Related Mineral from the Jakobsberg Mine, Värmland, Sweden, and Its Relationships with Hancockite

1
Dipartimento di Scienze della Terra, Università di Pisa, Via Santa Maria 53, I-56126 Pisa, Italy
2
Museo di Storia Naturale dell’Università di Pisa, Via Roma 79, I-56011 Calci, Italy
3
Istituto di Geologia Ambientale e Geoingegneria, Consiglio Nazionale delle Ricerche, Via Mario Bianco 9, I-20131 Milan, Italy
4
Department of Applied Geological Sciences and Geophysics, University of Leoben, Peter Tunner Str. 5, A-8700 Leoben, Austria
5
Blinken 43, N-1349 Rykkinn, Norway
*
Author to whom correspondence should be addressed.
Minerals 2022, 12(1), 51; https://doi.org/10.3390/min12010051
Submission received: 1 December 2021 / Revised: 24 December 2021 / Accepted: 27 December 2021 / Published: 30 December 2021
(This article belongs to the Collection New Minerals)

Abstract

:
The new mineral zoisite-(Pb), ideally CaPbAl3(SiO4)(Si2O7)O(OH), was discovered in a sample from the Jakobsberg manganese-iron oxide deposit, Värmland, Sweden. Zoisite-(Pb) is found as pale pink subhedral prisms elongated on [010], up to 0.3 mm in size, associated with calcite, celsian, diopside, grossular, hancockite, hyalophane, native lead, phlogopite, and vesuvianite. Associated feldspars show one of the highest PbO contents (~7–8 wt%) found in nature. Electron-microprobe analysis of zoisite-(Pb) point to the empirical formula (Ca1.09Pb0.86Mn2+0.01Na0.01)∑1.97(Al2.88Fe3+0.10Mn3+0.04)∑3.02Si3.00O12(OH)1.00. The eight strongest diffraction lines [dobs, Iobs, (hkl)] are 8.63 s (101), 8.11 mw (200), 4.895 m (011), 4.210 m (211), 3.660 s (112, 311), 3.097 mw (312), 2.900 s (013), and 2.725 m (511). Zoisite-(Pb) is isostructural with zoisite and its crystal structure was refined up to R1 = 0.0213 for 2013 reflections with Fo > 4σ(Fo). Pb shows a stereochemically active lone pair leading to a lopsided distribution of its coordinating oxygens. A full chemical and Raman characterization of zoisite-(Pb) and of the Pb-bearing epidote hancockite is reported, together with an improved crystal structural model of hancockite, refined up to R1 = 0.0254 for 2041 reflections with Fo > 4σ(Fo). The effects of the incorporation of Pb in the crystal structure of zoisite-(Pb), hancockite, and related synthetic and natural phases are described and discussed.

1. Introduction

Zoisite and clinozoisite are mixed anion silicates widespread in nature, in locally rock-forming phases in low- to medium-grade metamorphic rocks. They are polymorphs, with ideal formula Ca2Al3(SiO4)(Si2O7)O(OH), with orthorhombic and monoclinic symmetry for zoisite and clinozoisite, respectively. According to literature studies [1,2], zoisite and clinozoisite can be considered as the iron-poor, high-temperature and the iron-rich, low-temperature phase, respectively. Clinozoisite belongs to the epidote supergroup [3], which includes phases with monoclinic symmetry, distributed in the allanite, clinozoisite, and dollaseite groups, together with the mineral åskagenite-(Nd). Despite its close relationships with the epidote supergroup, zoisite, given its orthorhombic symmetry, is not included in the former supergroup [3,4]. We report in the present paper the occurrence of the new mineral zoisite-(Pb), with ideal formula CaPbAl3(SiO4)(Si2O7)O(OH). The new mineral and its name were approved by the IMA-CNMMNC (IMA-2021-025). Zoisite-(Pb) is isostructural with zoisite, and its crystal chemical relationships with zoisite and with synthetic Sr and Pb zoisites [5,6] are discussed. Zoisite-(Pb) was discovered in the Jakobsberg manganese-iron oxide deposit, Filipstad district, Värmland County, Sweden. Holotype material is deposited in the mineralogical collection of the Museo di Storia Naturale, Università di Pisa, Via Roma 79, Calci (Pisa, Italy), under catalogue number 19,927. Pb is present in epidote minerals both as a trace element [7] and as a major component in hancockite ([8]) and piemontite-(Pb) [9]. In the present study, we report a full multi-technique study of coexisting zoisite-(Pb) and hancockite from Jakobsberg, including EPMA, Raman, X-ray single-crystal, and powder diffraction data obtained on the same material. Our new data are compared with literature data for hancockite, together with the related epidote supergroup minerals piemontite-(Pb) and niigataite.

2. Occurrence and Physical Properties

Zoisite-(Pb) was found in a sample collected in 2015 by one of the authors (KE) in the dumps of the Jakobsberg manganese-iron oxide deposit (latitude 59°49′40″ N, longitude 14°6′25″ E), Filipstad district, Värmland County, Sweden. Jakobsberg mine is located within the Nordmark ore field, in the Palaeoproterozoic Bergslagen ore province, together with other well-renowned mineral deposits such as Långban. The so-called “Långban-type” mineralizations [10] are Fe-Mn deposits, enriched in Pb, As, Sb, B, Be, and Ba, occurring in a metamorphosed felsic metavolcanic suite within skarns hosted in carbonate rocks [10,11,12,13]. The Jakobsberg mine is the type of locality for jacobsite [14], plumboferrite [15], svabite [16], celsian [17], hematophanite [18], morelandite [19], lindqvistite [20] tegengrenite [21], and ferri-taramite [22]. Zoisite-(Pb) is associated with calcite, celsian, diopside, grossular, hancockite, hyalophane, native lead, phlogopite, and vesuvianite. Zoisite-(Pb) occurs as pale pink subhedral prisms elongated on [010], up to 0.3 mm in size (Figure 1).
It can be easily distinguished from hancockite, which shows a distinctly deeper pink-red color. It is transparent, with a vitreous luster, white streaks, brittle, with a perfect {010} cleavage. Fluorescence was not observed. Hardness and density were not measured, due to the small size of the available crystals. A Mohs hardness of 6–7 can be estimated based on its relationship with zoisite. The calculated density, based on the empirical formula and unit-cell parameters derived through single-crystal X-ray diffraction, is 4.13 g·cm−3. Zoisite-(Pb) is biaxial (+), 2V > 60°, pleochroic from colorless to pale pink. The mean refraction index measured by the immersion method resulted in n ¯ > 1.65. The mean refractive index, obtained from Gladstone–Dale relationship [23,24], using ideal formula and calculated density, is 1.752 (1.773 ideal).

2.1. Chemical Data

Quantitative chemical analyses for zoisite-(Pb) and hancockite were carried out using a Superprobe JEOL JXA 8200 electron microprobe at the Eugen F. Stumpfl laboratory, Leoben University, Leoben, Austria. Experimental conditions were: WDS mode, accelerating voltage 20 kV, beam current 10 nA, and beam size 1 μm. Counting times were 20 s on peak and 10 s on left and right backgrounds. The ZAF correction method was used. Table 1 gives the results of the chemical analyses performed on the crystals used for single-crystal X-ray diffraction and the standards used. Fluorine, Mg, V, Cr, and Sr were sought but not detected. No direct H2O quantitative measurement was performed, owing to the scarcity of available material. Thus, the Fe2+/Fe3+ and Mn2+/Mn3+ values were calculated in agreement with the recommendations of [3], oxidizing first Fe2+, then Mn2+, in order to account for their different redox potentials. For both zoisite-(Pb) and hancockite the ratios Mn2+/Mn3+ and Fe2+/Fe3+ were calculated in order to achieve ∑(A + M + T) = 8 atoms per formula and 25 positive charges per formula unit.
The empirical formula of zoisite-(Pb) is (Ca1.09Pb0.86Mn2+0.01Na0.01)∑1.97(Al2.88Fe3+0.10Mn3+0.04)∑3.02Si3.00O12(OH)1.00. The ideal formula of zoisite-(Pb), CaPbAl3Si3O12(OH), requires (in wt%) SiO2 29.00, Al2O3 24.61, CaO 9.02, PbO 35.91, and H2O 1.45, sum 100.00. The empirical formula of hancockite is (Ca1.18Pb0.73Mn2+0.06)∑1.97(Al2.32Fe3+0.66Fe2+0.04)∑3.02Si3.01O12(OH)1.00.
It is worth noting that zoisite-(Pb) and hancockite are characterized by distinctly different Al/(Al + Fetot) atomic ratios, i.e., 0.966 and 0.768, respectively.
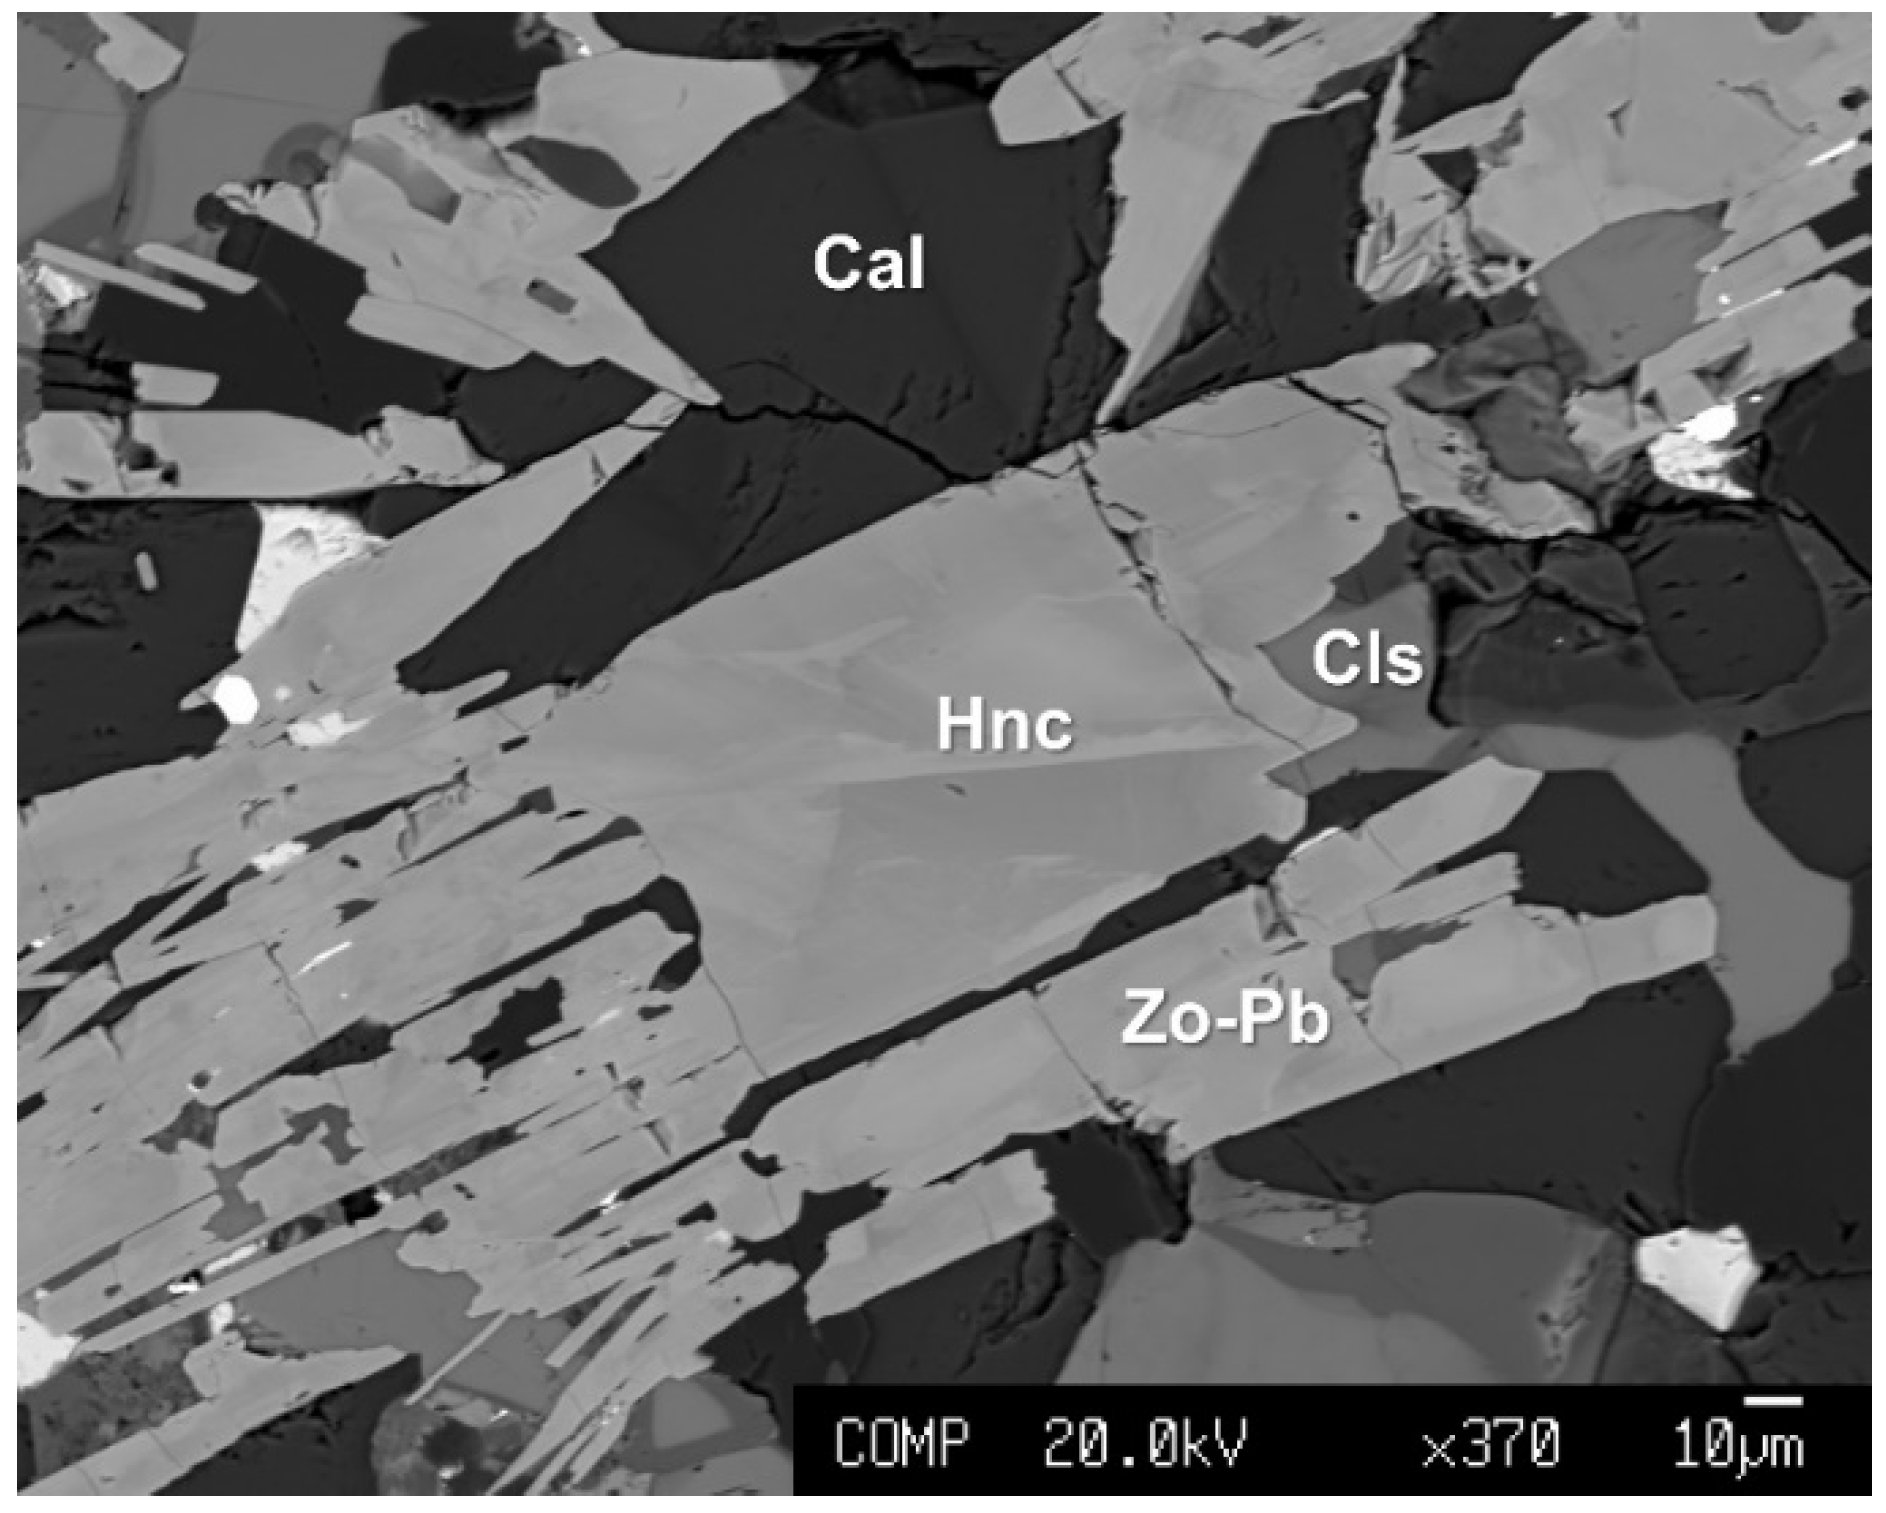
Back-scattered electron images show a patchy zoning characteristic for both zoisite-(Pb) and associated hancockite (Figure 2).
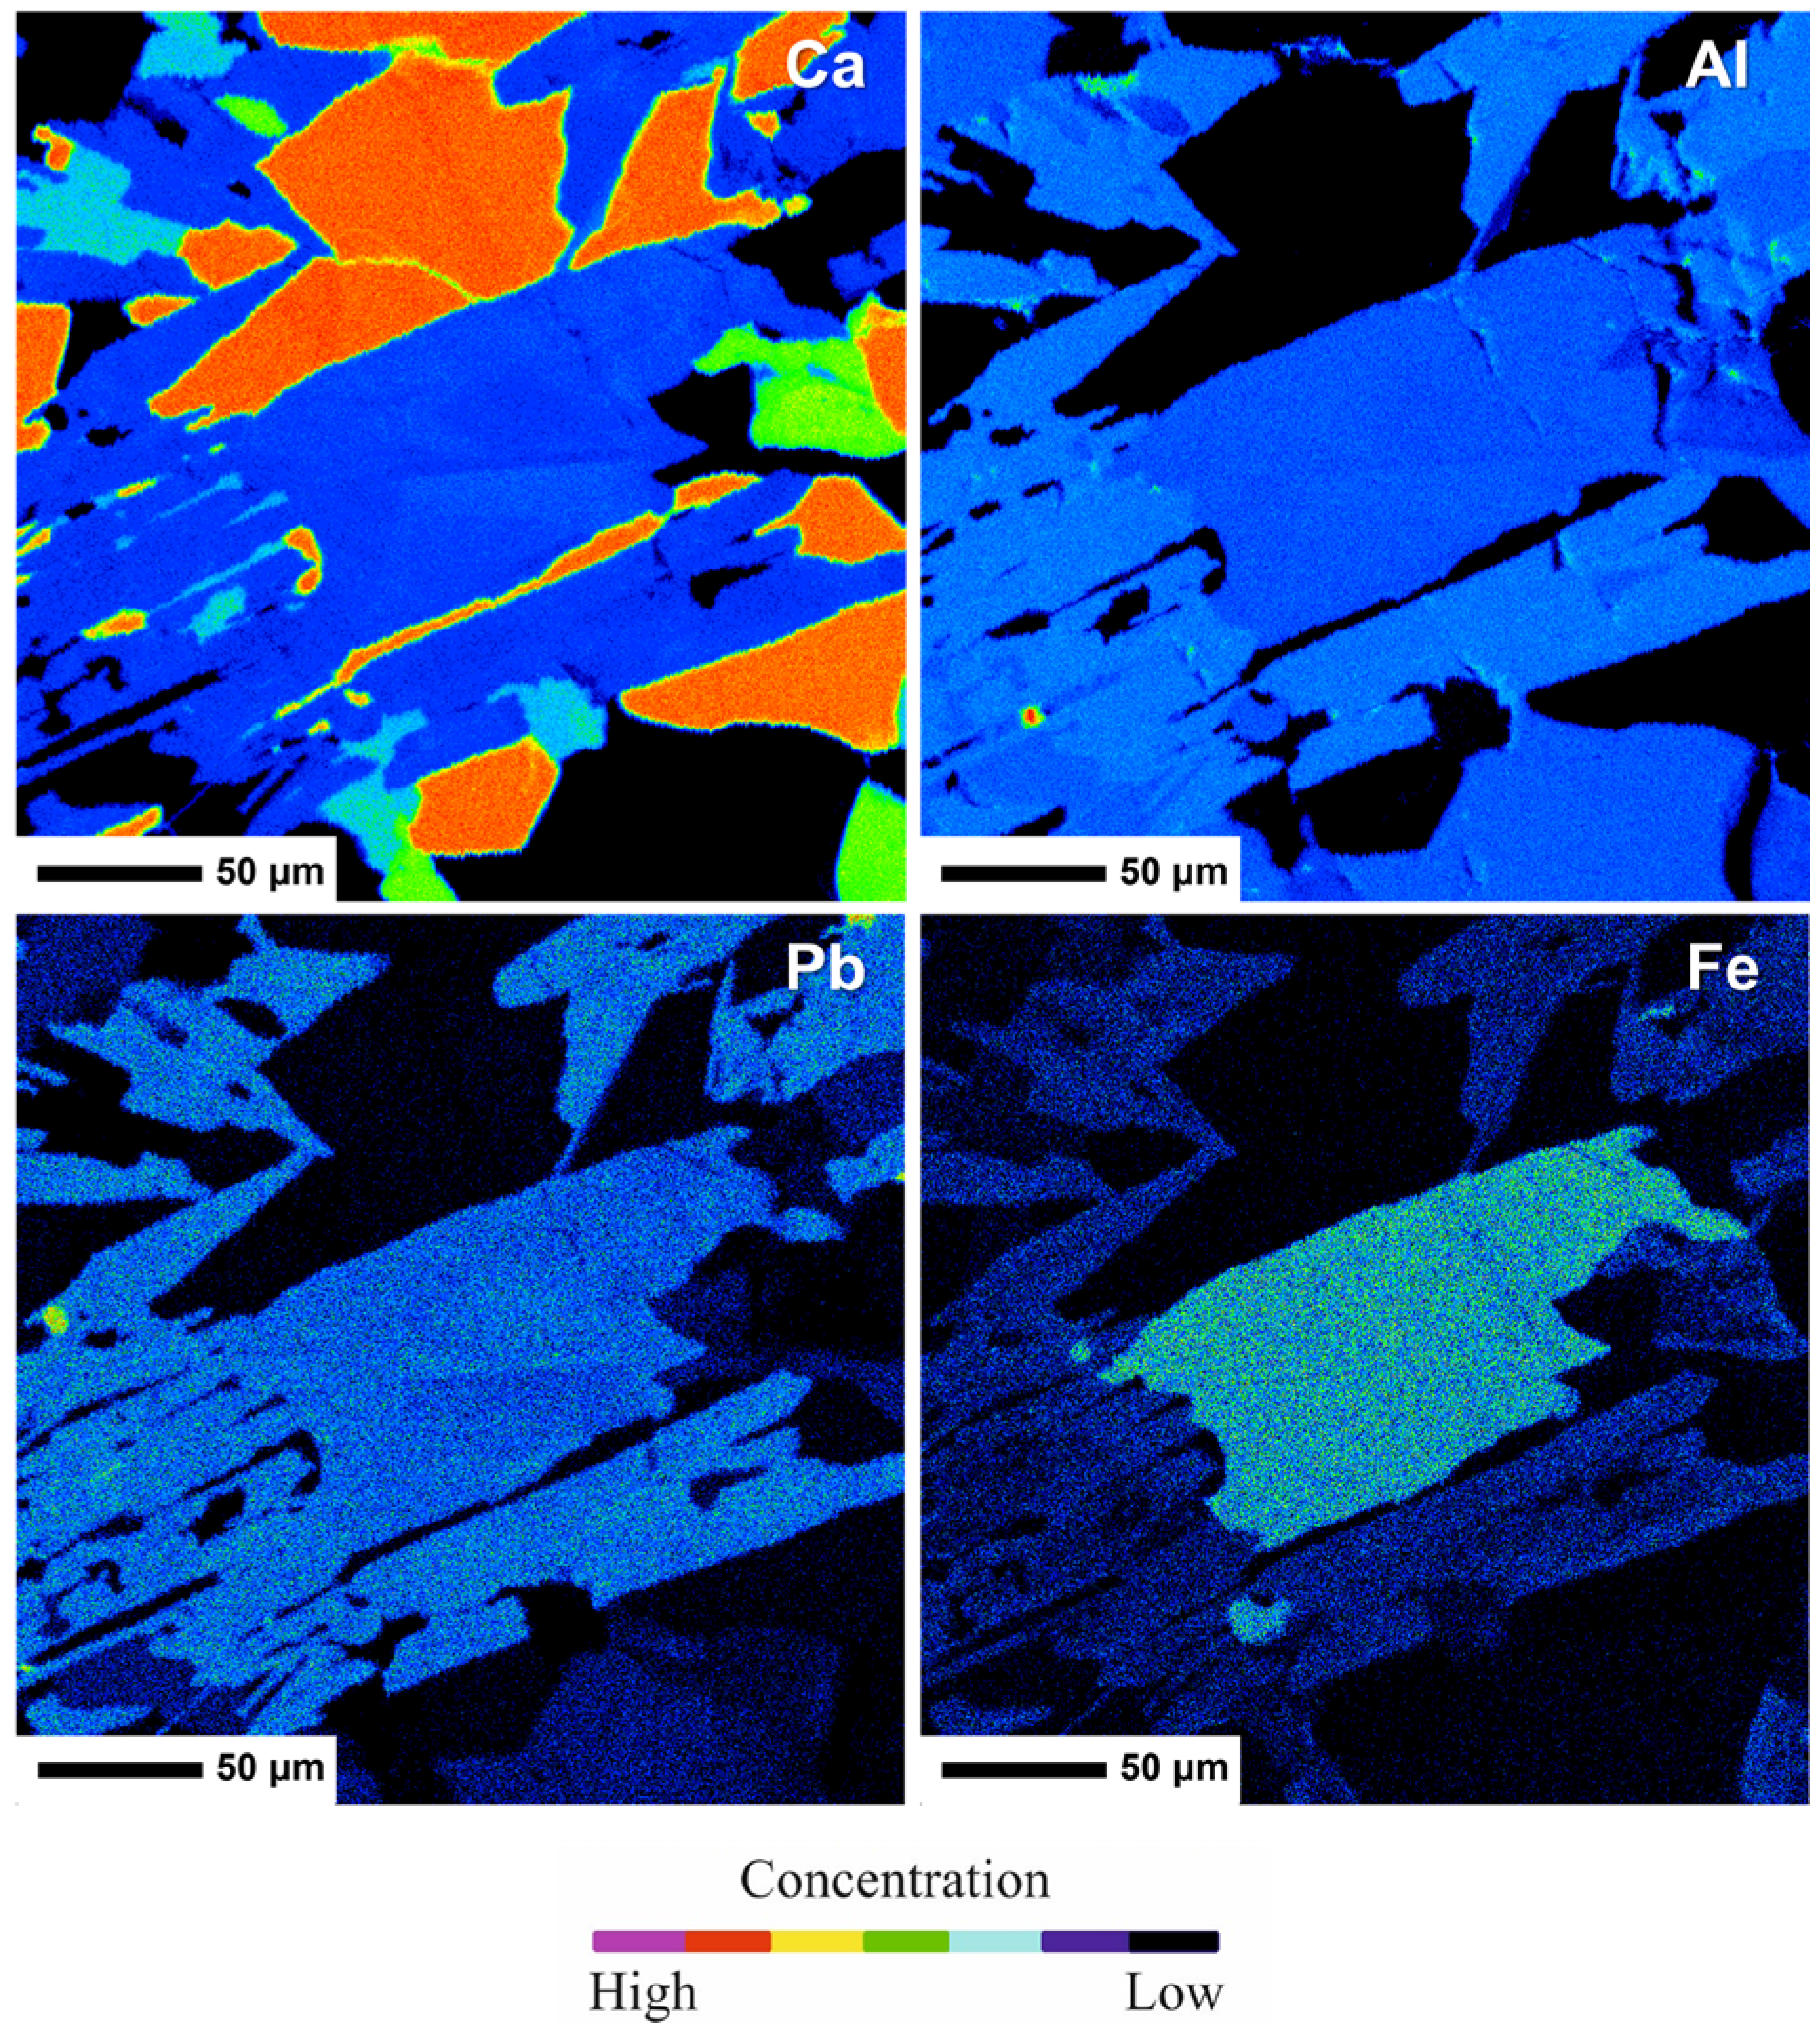
It is mainly related to different Ca/Pb atomic ratios in both zoisite-(Pb) and hancockite (Figure 3). These two phases can, in addition, be distinguished on the basis of their Al/(Al + Fetot) atomic ratio, as indicated above and confirmed by micro-Raman spectroscopy (see below).
Quantitative chemical analyses of associated phases (celsian, vesuvianite, and grossular) were carried out using a Jeol JXA-8200 Superprobe at the Department of Earth Sciences at the University of Milano (Milano MI, Italy) with an accelerating voltage of 15 kV, a beam current of 5 nA, and a beam diameter of 1 μm. Counting times of 30 s on the peak positions and 10 s on the backgrounds were used. The following minerals, pure metals, and synthetic compounds served as standards: grossular (Si, Al, Ca), fayalite (Fe), rhodonite (Mn), forsterite (Mg), sanbornite (Ba), celestine (Sr), synthetic PbO (Pb), pure metal (Cu), omphacite (Na), K-feldspar (K), and hornblende H123 (F). Results are reported in Table 2.
Celsian shows two distinct compositions, with an almost pure celsian with minor K and Na (celsian 1), and an intermediate composition with hyalophane (celsian 2). Both compositions are Pb-rich with an almost constant Pb content of 0.11–0.12 a.p.f.u. To the best of our knowledge, this is the highest Pb content found in natural celsian and hyalophane. Further structural and crystal chemical studies are currently in progress to better define the nature of such peculiar Pb-bearing feldspars. Vesuvianite shows high contents of Pb and Cu, 0.26 and 0.55 a.p.f.u., respectively. Grossular shows an intermediate composition towards andradite and, as expected, a total lack of Pb. Mineral chemistry of our associated phases is strongly related to those found by [26,27,28] on Långban phases. In the recent definition of the margarosanite group [29], the crystal chemical relationships between the lead silicate margarosanite, ideally PbCa2Si3O9, walstromite (BaCa2Si3O9), and breyite (CaCa2Si3O9) are described. The occurrence of the lead silicate walstromite in a skarn rock from Jakobsberg is reported, with a complete single-crystal, EPMA, and Raman study of the mineral. Walstromite from Jakobsberg displays a variable composition, in the range of margarosanite50–walstromite50 to ca. margarosanite70–walstromite30. Walstromite from Jakobsberg is associated with celsian, phlogopite, andradite, vesuvianite, diopside, and nasonite. In [29] it was noticed that celsian associated to walstromite lacks any Pb content, reported as below the EDS detection limit (≤0.2% PbO), in contrast to the relevant Pb contents found both in celsian from Jakobsberg (present study) and from Långban [27].

2.2. Micro-Raman Spectroscopy

Unpolarized micro-Raman spectra of both zoisite-(Pb) and hancockite were obtained on the same grains used for the X-ray powder diffraction analyses, in nearly back-scattered geometry with a Horiba Jobin-Yvon XploRA Plus apparatus, equipped with a motorized x-y stage and an Olympus BX41 microscope with a 50× objective. The 532-nm line of a solid-state laser was used. The minimum lateral and depth resolution was set to a few μm. The system was calibrated using the 520.6 cm−1 Raman band of silicon before each experimental session. Spectra were collected, in the range between 100–4000 cm−1, through multiple acquisitions (three) with single counting times of 60 s, with the laser power filtered at 50%.
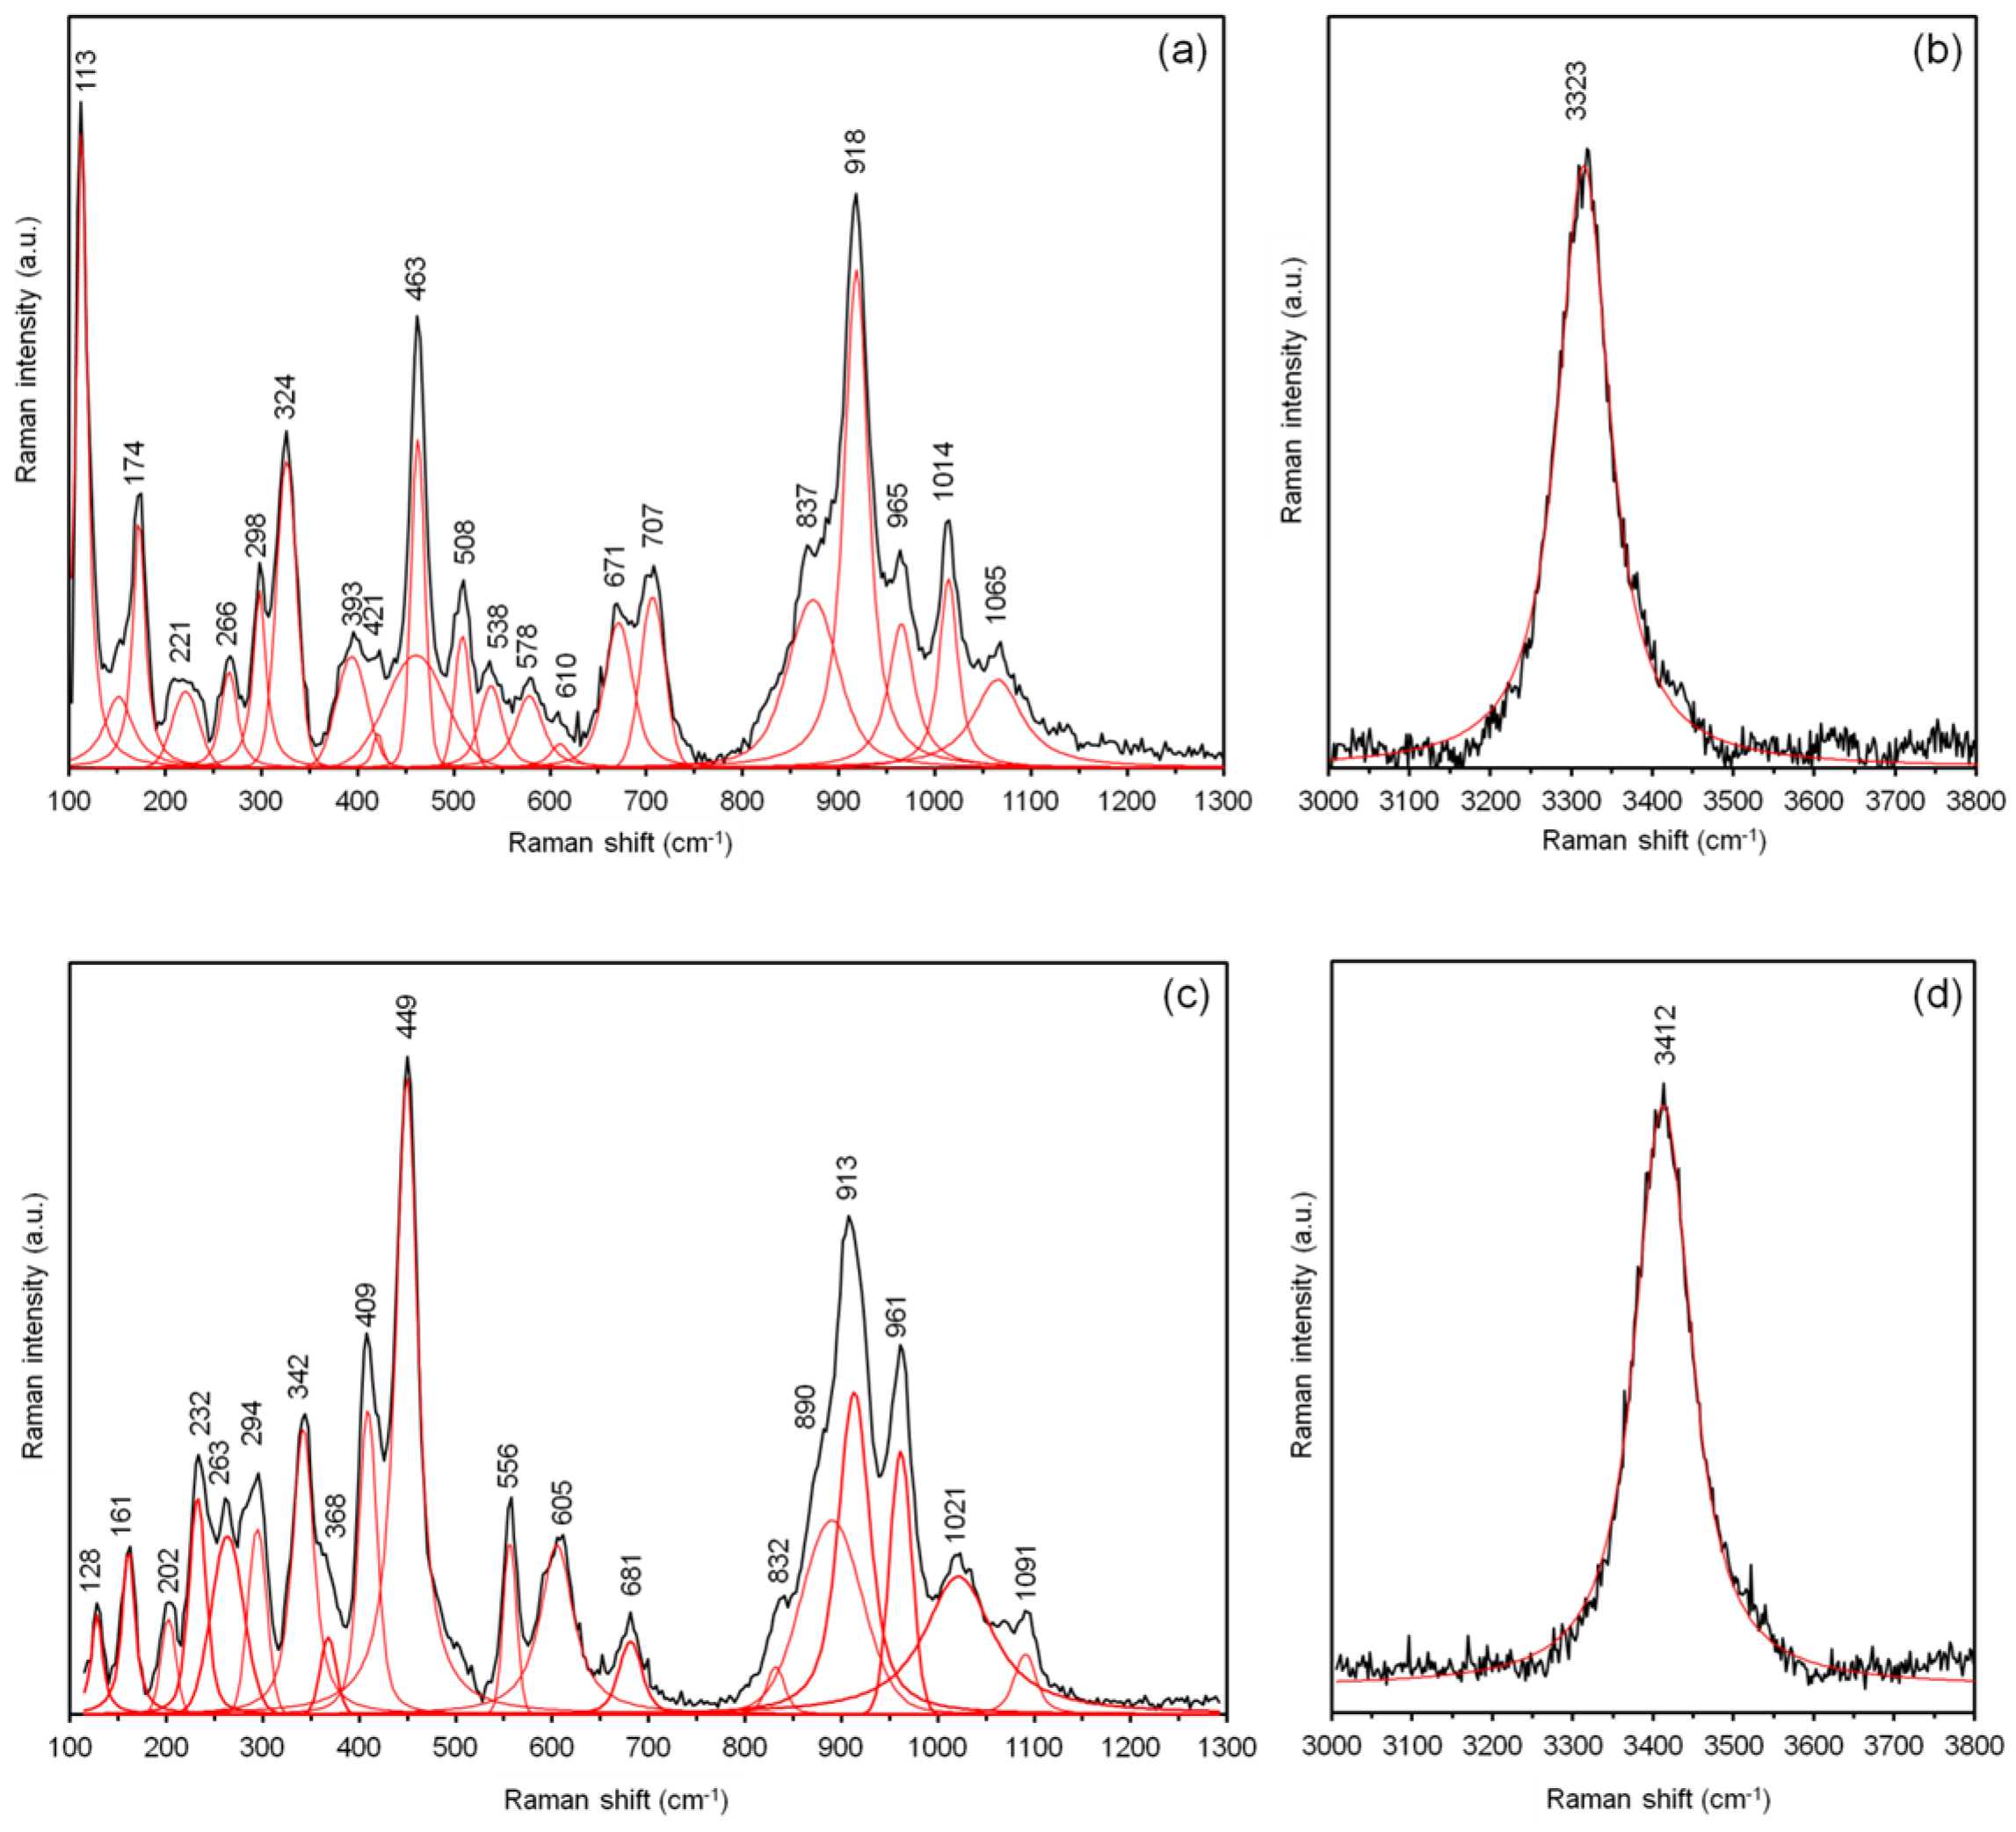
Backscattered radiation was analyzed with a 1200 gr mm−1 grating monochromator. Raman spectra were processed using Fityk [30], subtracting the background and fitting the spectra to theoretical peak shapes using Voigt functions. Experimental precision can be estimated at ± 2 cm−1. The Raman spectra of zoisite-(Pb) is compared with that of hancockite in Figure 4.
Following literature studies [31], the region between 200–1200 cm−1 can be divided into three ranges, a 200–500-cm−1 range including vibrational modes mainly related to M–O vibrations, a 500–750-cm−1 range, with bands mainly related to Si–O–Si bending modes, and a 750–1100-cm−1 range hosting symmetrical stretching of Si–O bonds from both SiO4 and Si2O7 groups. The spectra of the two minerals showed relevant differences, especially in the spectral ranges 320–540 cm−1 and 700 and 820 cm−1, in agreement with the observations reported by [32]. In the 3000–3800-cm−1 region, a relatively broad and strong band was observed in both spectra. A shift towards higher wavenumbers of O–H stretching band was observed in the Raman spectrum of hancockite, in keeping with its higher Fe3+ content, e.g., [33].

2.3. X-ray Crystallography

X-ray powder diffraction data for zoisite-(Pb) were collected using a 114.6-mm Gandolfi camera. Data (in Å, for Cu Kα) are listed in Table 3. Indexing was done based on single-crystal diffraction data action data. Single-crystal X-ray studies of zoisite-(Pb) showed it is orthorhombic, Pnma, a = 16.3978 (6) Å, b = 5.5953 (2) Å, c = 10.1953 (3) Å, V = 935.43 (1) Å3, and Z = 4. Intensity data for zoisite-(Pb) were collected using a Bruker Smart Breeze diffractometer equipped with an air-cooled CCD detector, and graphite-monochromatized MoKα radiation. The detector-to-crystal distance was 50 mm. Data were collected using ω and φ scan modes, in 0.5° slices, with an exposure time of 30 s per frame. The data were corrected for absorption, Lorentz, and polarization factors using the software package Apex2 [34]. The crystal structure was refined using Shelxl-2014 [35] starting from the atomic coordinates of zoisite given in [36]. Scattering curves for neutral atoms [37] were used, refining mixed occupancies Ca vs. Pb at A2 site and Al vs. Fe at M12 site. The anisotropic structural model converged to 0.0213 for 2013 reflections with Fo > 4σ (Fo). Details of data collection and refinement are given in Table 4.
Intensity data for hancockite were collected and reduced with the same settings as zoisite-(Pb). The crystal structure was refined using Shelxl-2014 [35] starting from the atomic coordinates of hancockite given in [38] Mixed occupancies of (Ca + Pb) and (Al + Fe) were refined for A2 and M3 sites, respectively. The anisotropic structural model converged to 0.0254 for 2041 reflections with Fo > 4σ (Fo). Details of data collection and refinement are given in Table 4.
Fractional atom coordinates, site occupancies, and equivalent isotropic displacement parameters for zoisite-(Pb) refinement are reported in Table 5, selected bond distances are reported in Table 6, and the bond-valence calculations, performed through the VESTA software [39] and the bond valence parameters dataset reported in [40], are given in Table 7. Fractional atom coordinates, site occupancies, and equivalent isotropic displacement parameters for hancockite are reported in Table 8, selected bond distances are reported in Table 9, and in in Table 10 are the bond-valence calculations, performed through the VESTA software [39] and the bond valence parameters dataset reported in [40]. CIF files of zoisite-(Pb) and hancockite are available as supplementary material of this paper.

3. Discussion

3.1. Chemical Data

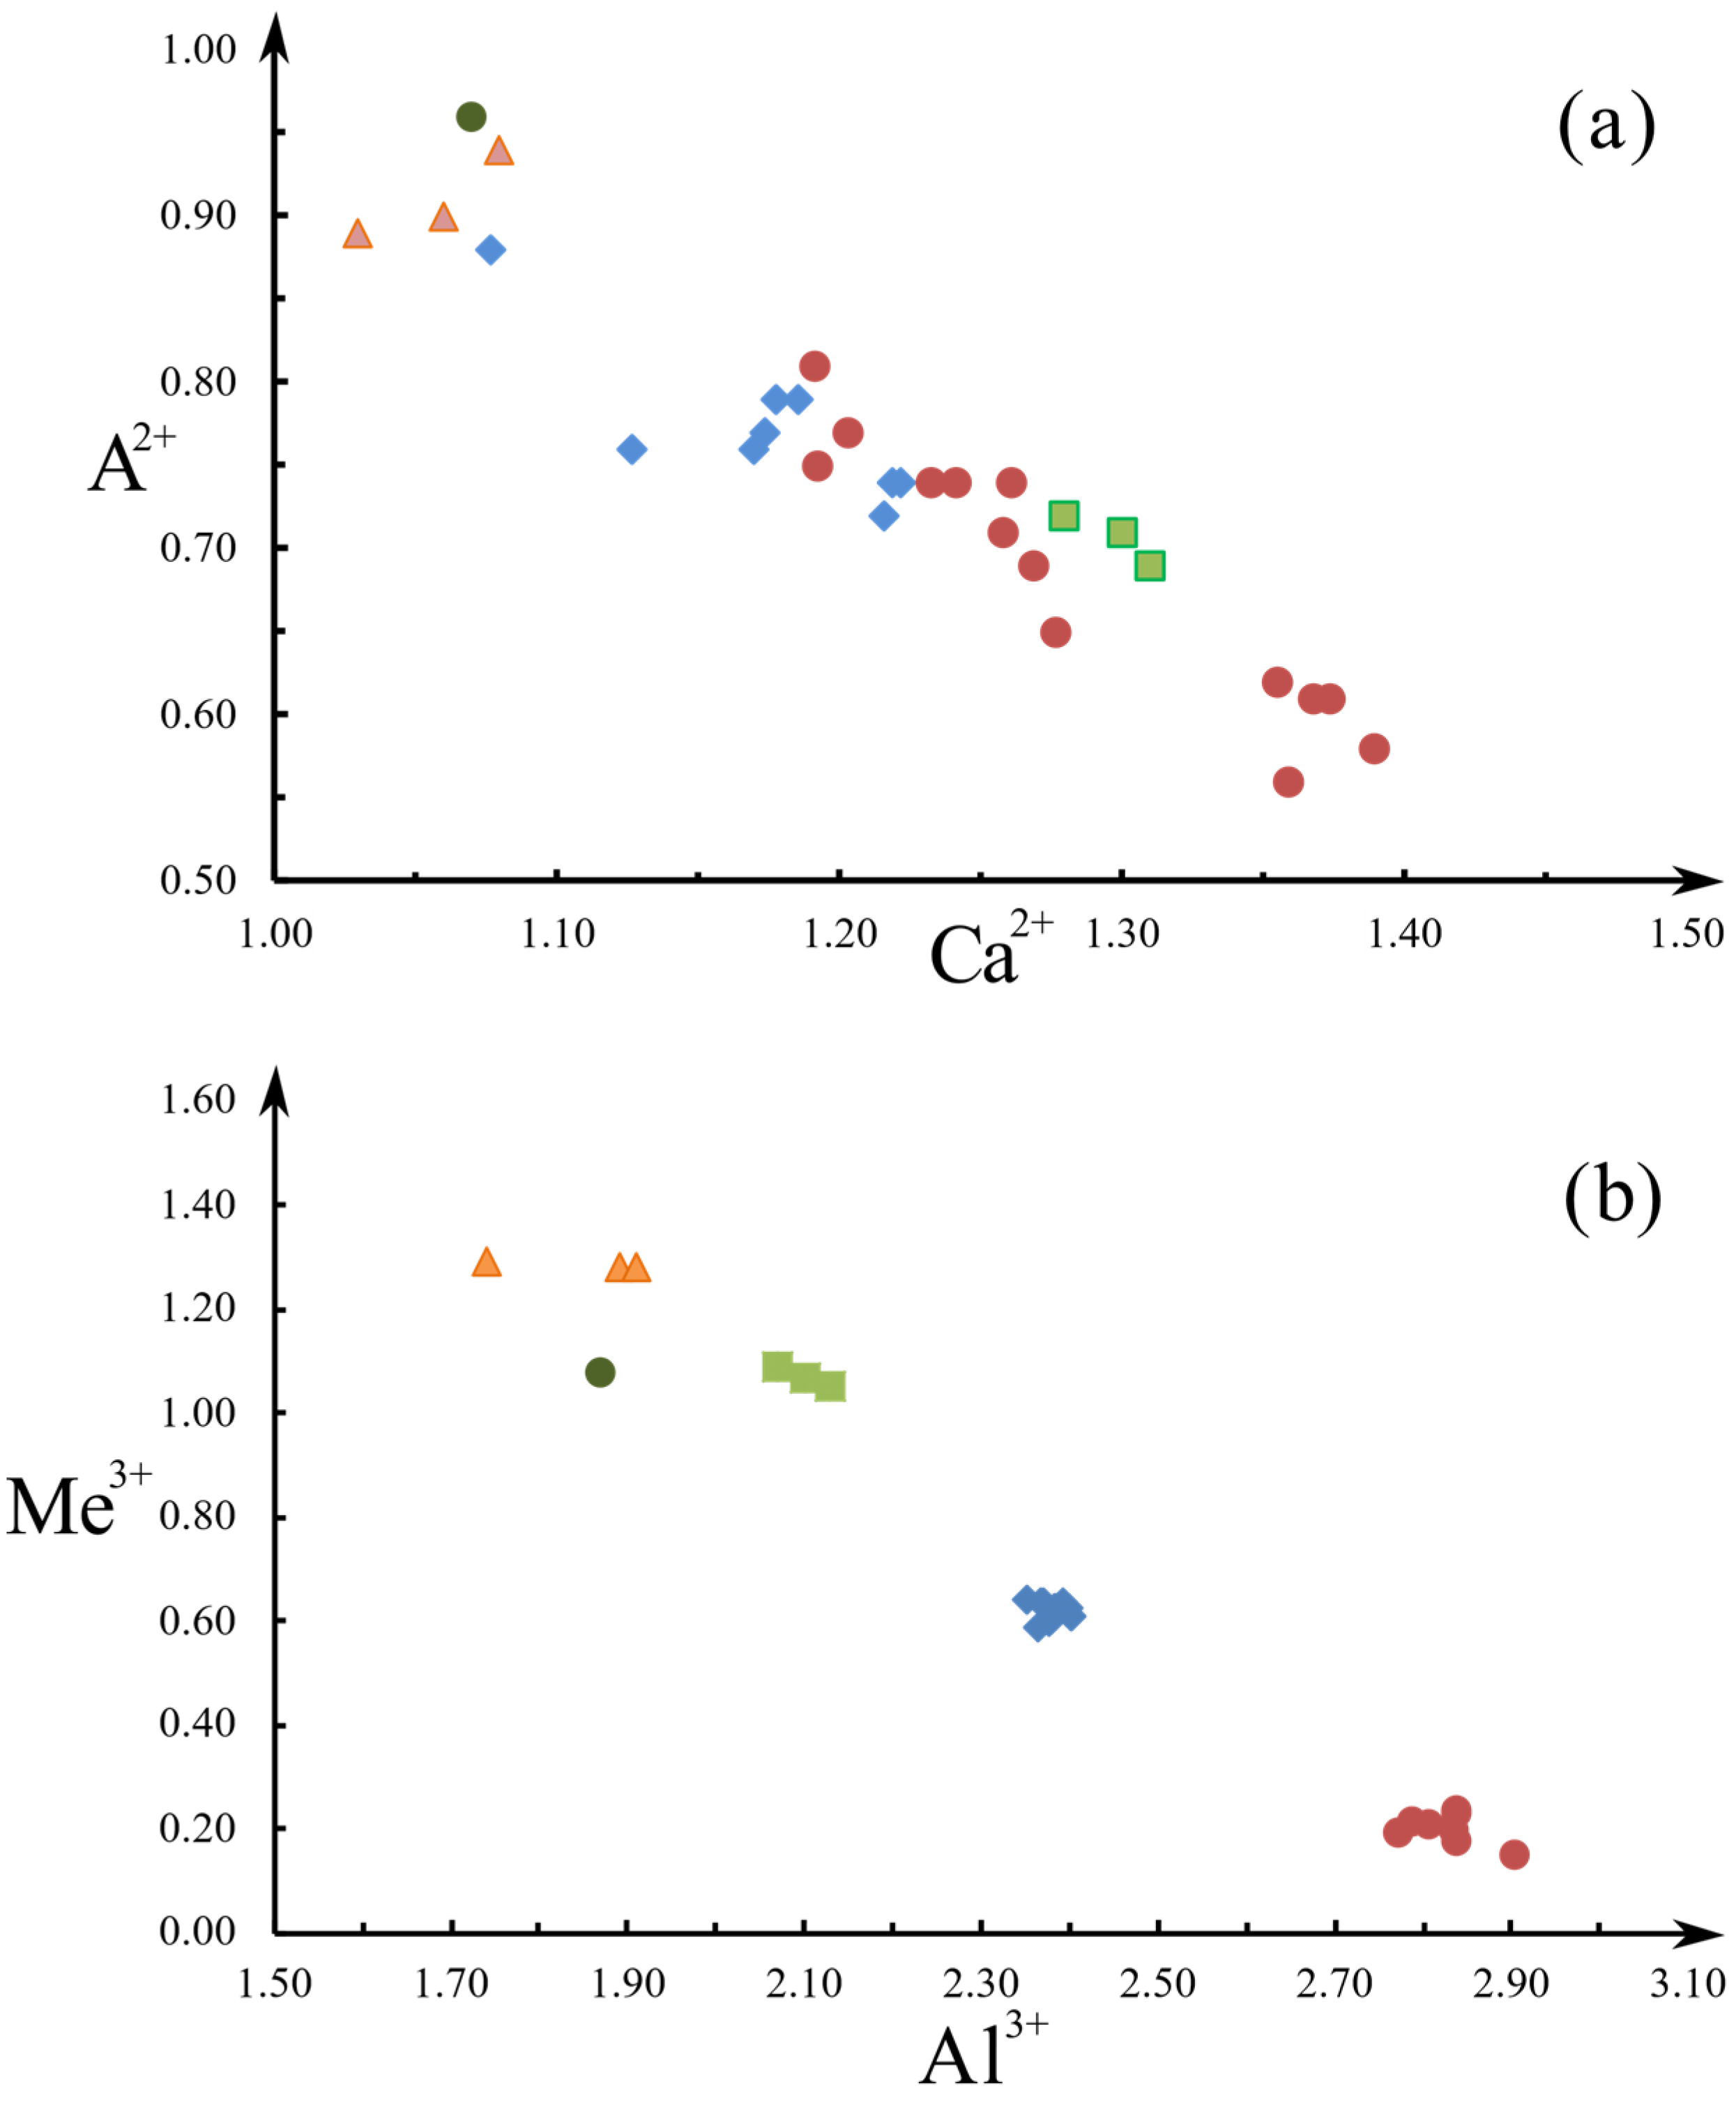
The full set of spot analyses performed on zoisite-(Pb) and hancockite crystals are reported in Table S1. The relationships between Ca and larger ionic radius cations such as (Pb2+, Sr2+, Ba2+), henceforth denoted as A2+, together with those between Al and (Fe + Mn) 3+, henceforth denoted as Me3+, are reported in Figure 5a,b, respectively. Both data from present and from literature studies (Sterling Hill, [43]; Jakobsberg, [26]; Nezilovo, [44]) were considered. Calcium and A2+ are inversely related both in zoisite-(Pb) and hancockite data, with hancockite showing (Figure 5a) a more variable A2+ content when compared with zoisite-(Pb). This pattern is directly related to the marked chemical zoning clearly visible in the BSE image in Figure 2. As regards the relationships between Al and Me3+, in agreement with X-ray maps (Figure 3), both zoisite-(Pb) and hancockite from the present study form two distinct clusters (Figure 5b), with zoisite-(Pb) significantly depleted and hancockite enriched in (Fe + Mn)3+. Both zoisite-(Pb) and hancockite datasets from the present study resulted as markedly enriched in Al when compared to hancockite data from literature studies (Figure 5b), which cluster at definitely higher contents of (Fe + Mn)3+.

3.2. Crystal Structure Description of Zoisite-(Pb) and Hancockite

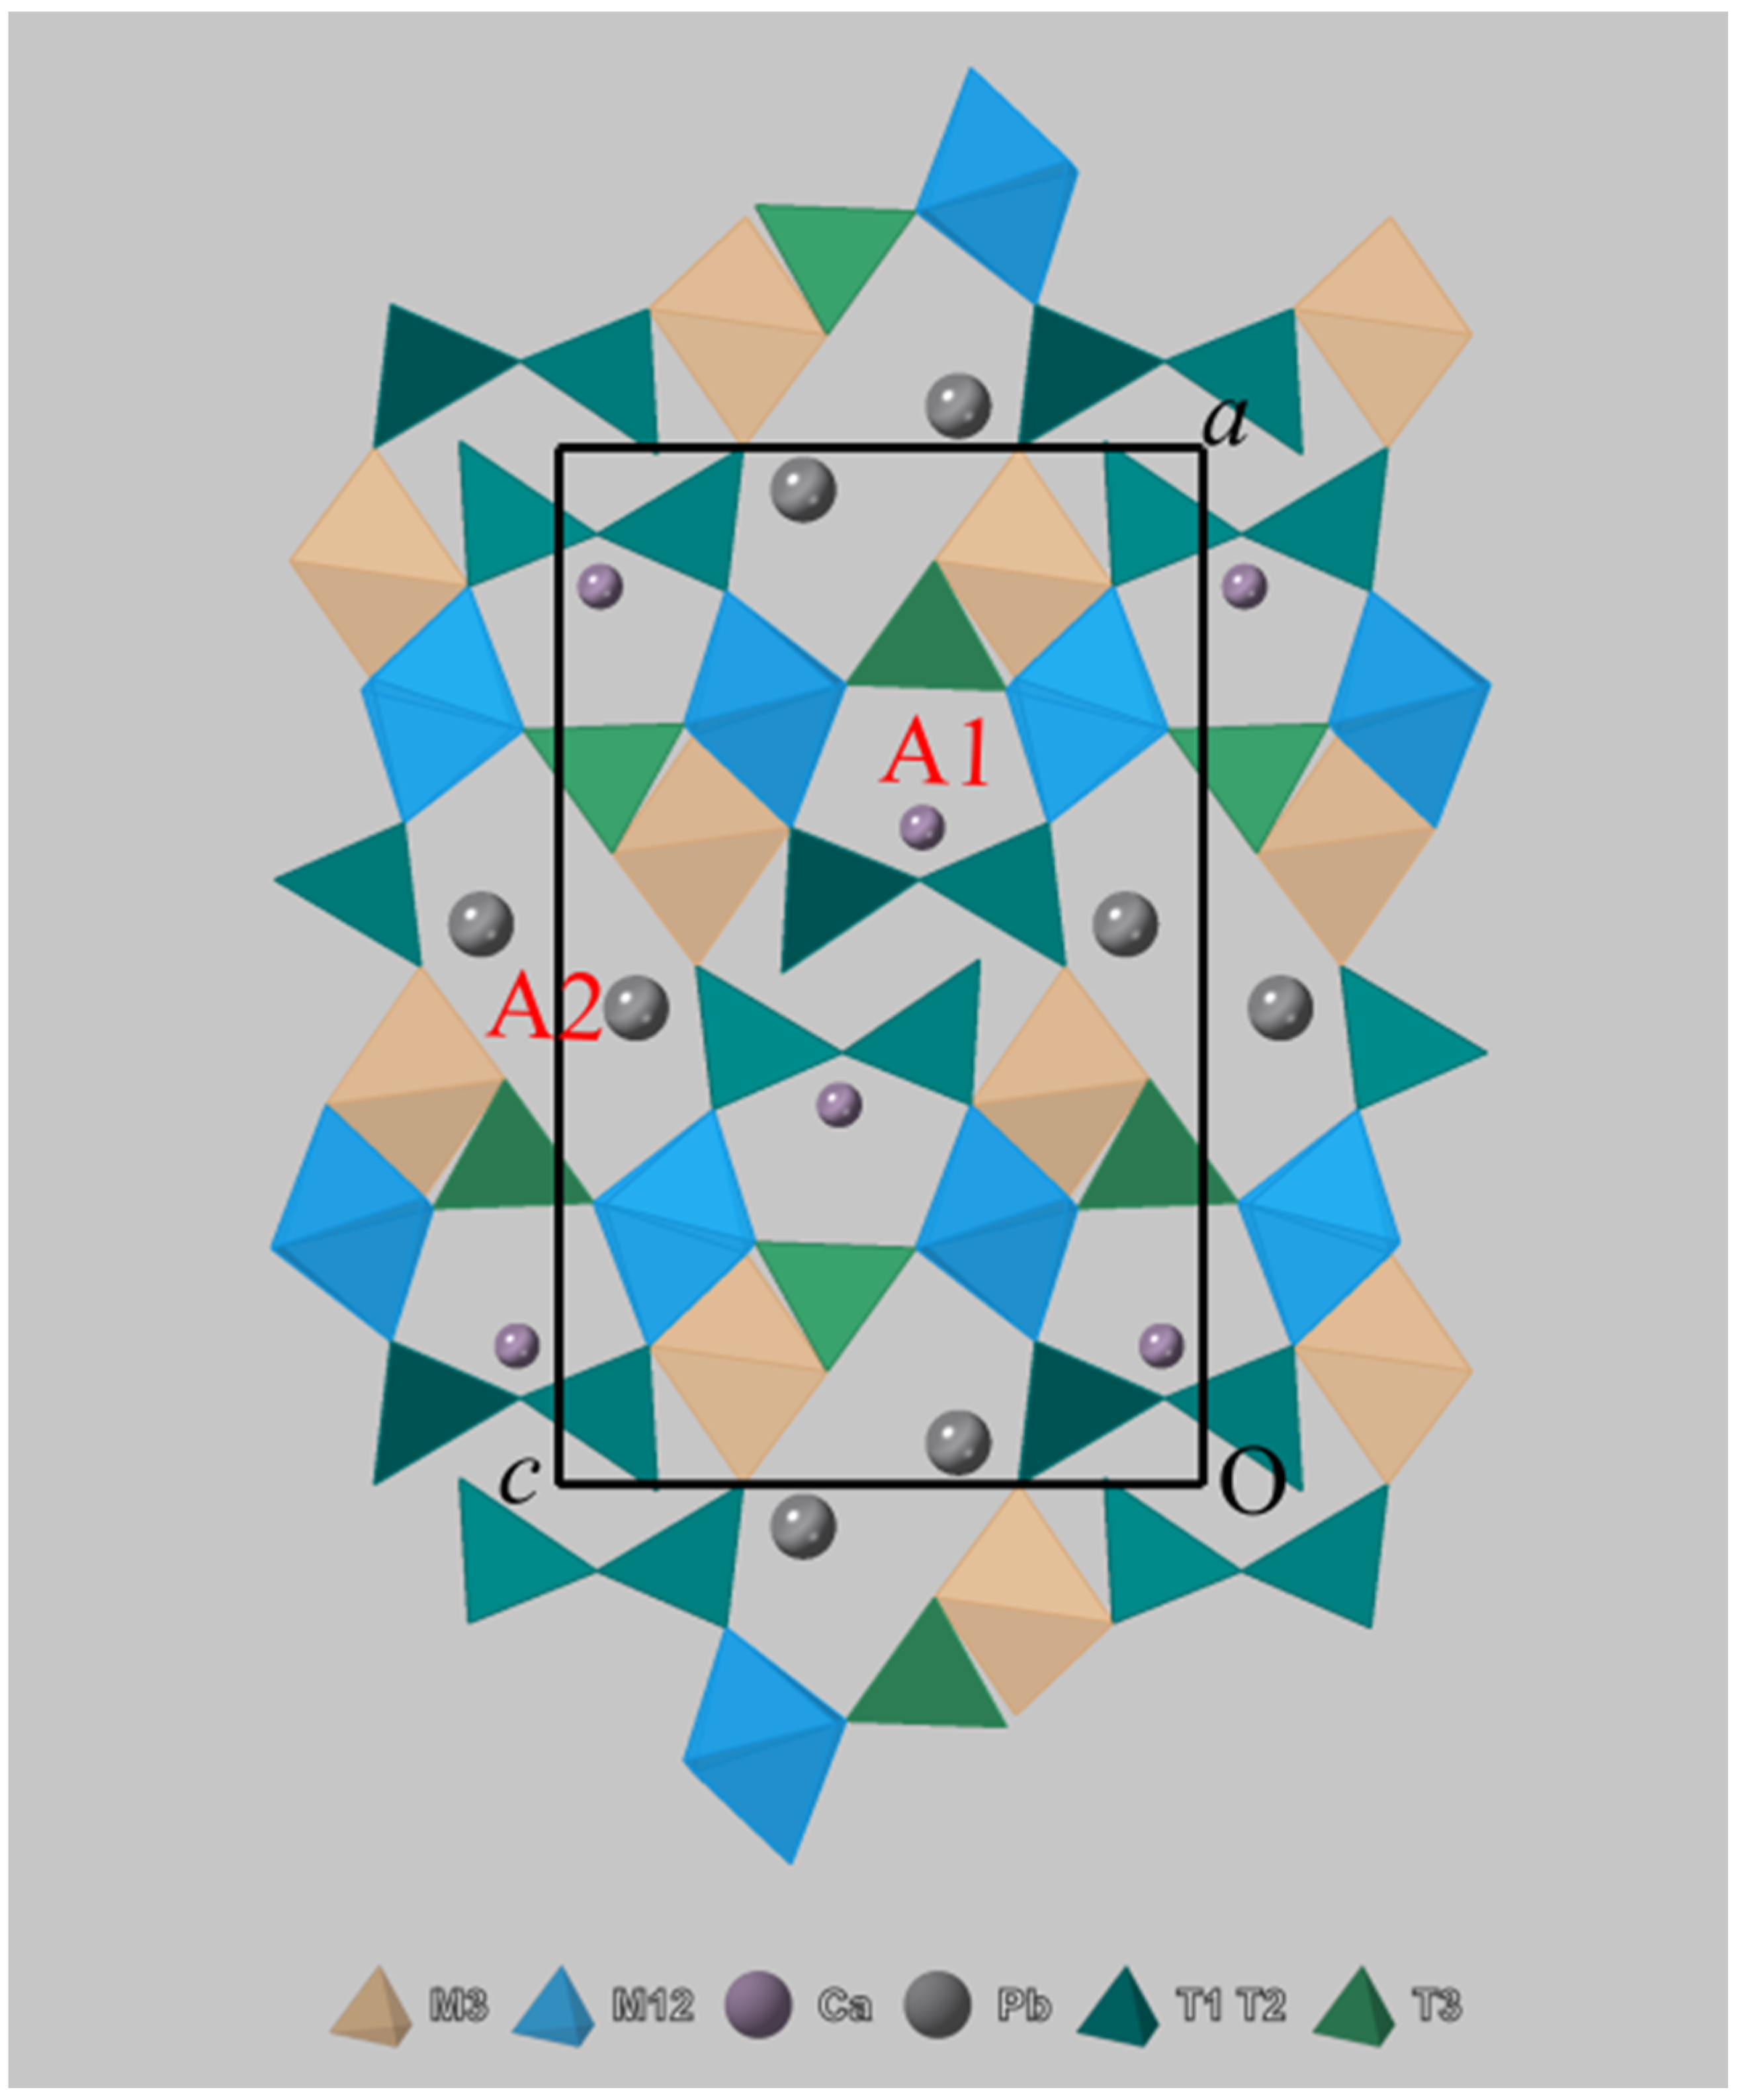
Structural features of zoisite and of the epidote group minerals were investigated in depth by several authors [3,45,46,47]. Zoisite-(Pb) is isostructural (Figure 6) with zoisite: regular M12 octahedra form by edge sharing octahedral chains, running along b, with the more distorted M3 octahedra linked on both sides of the chain. The Fe3+ content in zoisite-(Pb) is, as expected, low (0.14 a.p.f.u.) and it is accommodated in the M3 polyhedron, which is distinctly larger (Table 6) and more distorted than M12 polyhedron. M12 octahedral chains are connected along c through Si2O7 groups, and in the a direction by SiO4 groups, forming the two distinct A1 and A2 cavities (Figure 6). A1 cavity has a smaller volume, usually hosting Ca only, whereas A2 has a bigger size, more apt to host cations with an ionic radius larger than Ca (1.06 Å), such as Sr and Pb, with ionic radii of 1.21 and 1.23 Å, respectively (VII coordination) [48].
The A1 coordination polyhedron (Figure 7a, Table 6) is a regular one, with an homogeneous spatial distribution of bonds. The presence of dominant Pb2+ in the A2 coordination polyhedron reflects instead a lopsided coordination (Figure 7b, Table 6), with the polyhedral triangular face formed by O3 and O7 anions quite closer to Pb2+ compared with the polyhedral face formed by four O2 anions. The coordination of Pb2+ (Table 6) is completed by two very long bonds to O8.
This asymmetrical spatial distribution of anions around Pb2+ can be attributed to the presence of a stereochemically active lone pair of Pb2+, with the 6s2 inert electron doublet ideally located at the empty apex of a distorted pyramidal coordination hosting Pb2+. An alternative approach [49], which could be used to identify the presence of the Pb lone pair effect in crystal structures, provides the use of the Voronoi–Dirichlet polyhedra.
In Table 11 the unit cell parameters of zoisite-(Pb) are compared with those of zoisite [36], and with those of the synthetic phases Sr2Al3(SiO4)(Si2O7)O(OH) [5] and Pb2Al3(SiO4)(Si2O7)O(OH) [6]. The substitution of Ca by Pb-Sr initially involved A2 site only, as it can be seen in Table 11 by comparing the A1 and A2 polyhedral volumes in zoisite and zoisite-(Pb). With Pb-Sr contents higher than 1 a.p.f.u., both A1 and A2 polyhedra expand (Table 11). The progressive substitution of Ca by Sr-Pb in these phases caused (Table 11) an expansion of unit cell parameters, with a and c unit cell parameters showing a distinctly more pronounced increase compared with the b axis.
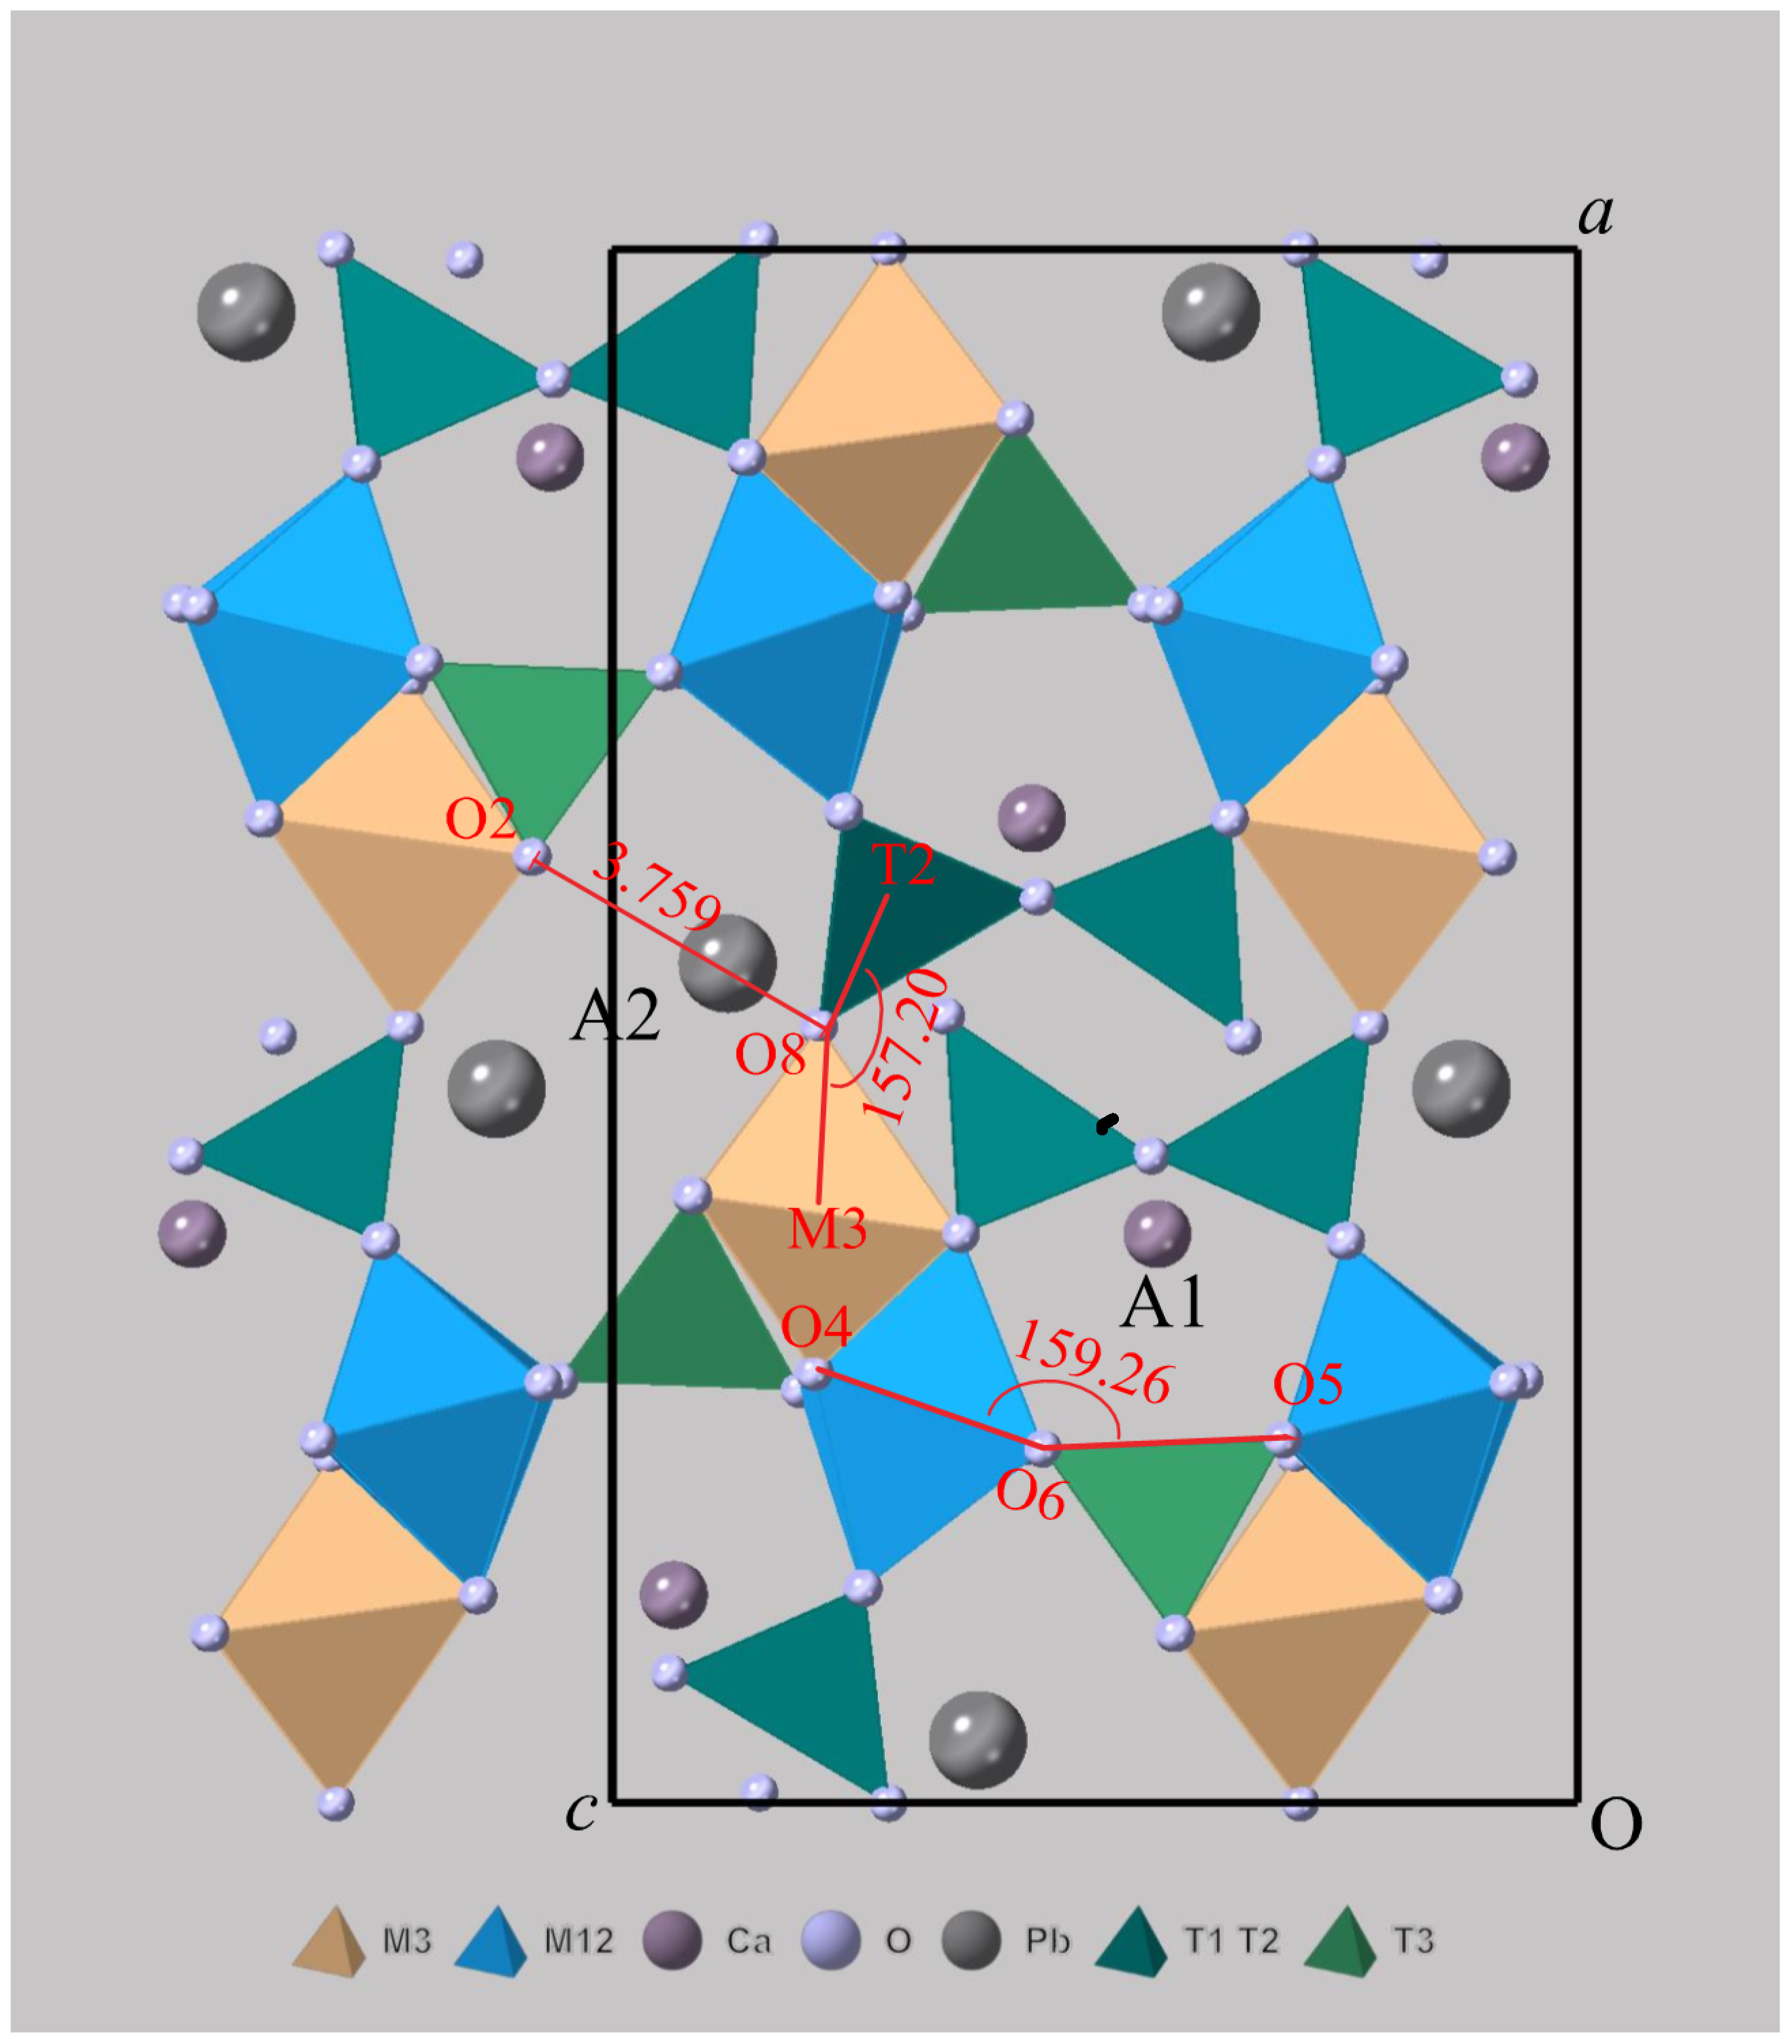
Several structural changes, including cooperative polyhedral distortions and rotations, allow the entering A2+ cations in A cavities ([5,6,47]. Changes in O4-O6-O5 and T2-O8-M3 angles (Figure 8, Table 12) highlight the influence of Pb-Sr substitution for Ca on the T3-M12 and T2-M3 couples of polyhedra, respectively. These couples are placed (Figure 8) along the edge of A1 and A2 cavities, respectively.
With the increasing substitution of Ca by A2+, O4-O6-O5 angle shows a quite limited change, moving from zoisite to zoisite-(Pb), with a more pronounced decrease when moving to synthetic Sr-zoisite and synthetic Pb-zoisite, in agreement with the expansion of A1 cavity along a axis. The T2-O8-M3 angle gradually increases, in agreement with the expansion of A2 cavity along c. Accordingly, the O2-O8 distance, involving two atoms placed on opposite sides of A2 cavity (Figure 8), progressively increases (Table 12), moving from zoisite to the Pb zoisite synthetic phase.
The quite small increase in b unit cell parameter can be explained according to [6]: Entering of Pb in A cavities in synthetic Pb zoisite-like phase (see Figure 3 in [6]) “stretches” the M12 octahedral chains along b, contemporarily “kinking” the same octahedral chains, therefore resulting in a smaller net expansion along b.
The crystal structure of hancockite was determined by [38], on material from Franklin, New Jersey, described as small, poorly formed, scarcely crystalline, and probably partially metamict. Chemical analyses [8] performed on crystals from the same locality were assumed in [38] as representative of the material. More recent EPMA chemical data on Franklin hancockite were reported by [43], on euhedral, bright-red, second-generation crystals, showing relevant differences compared with [8] chemical data.
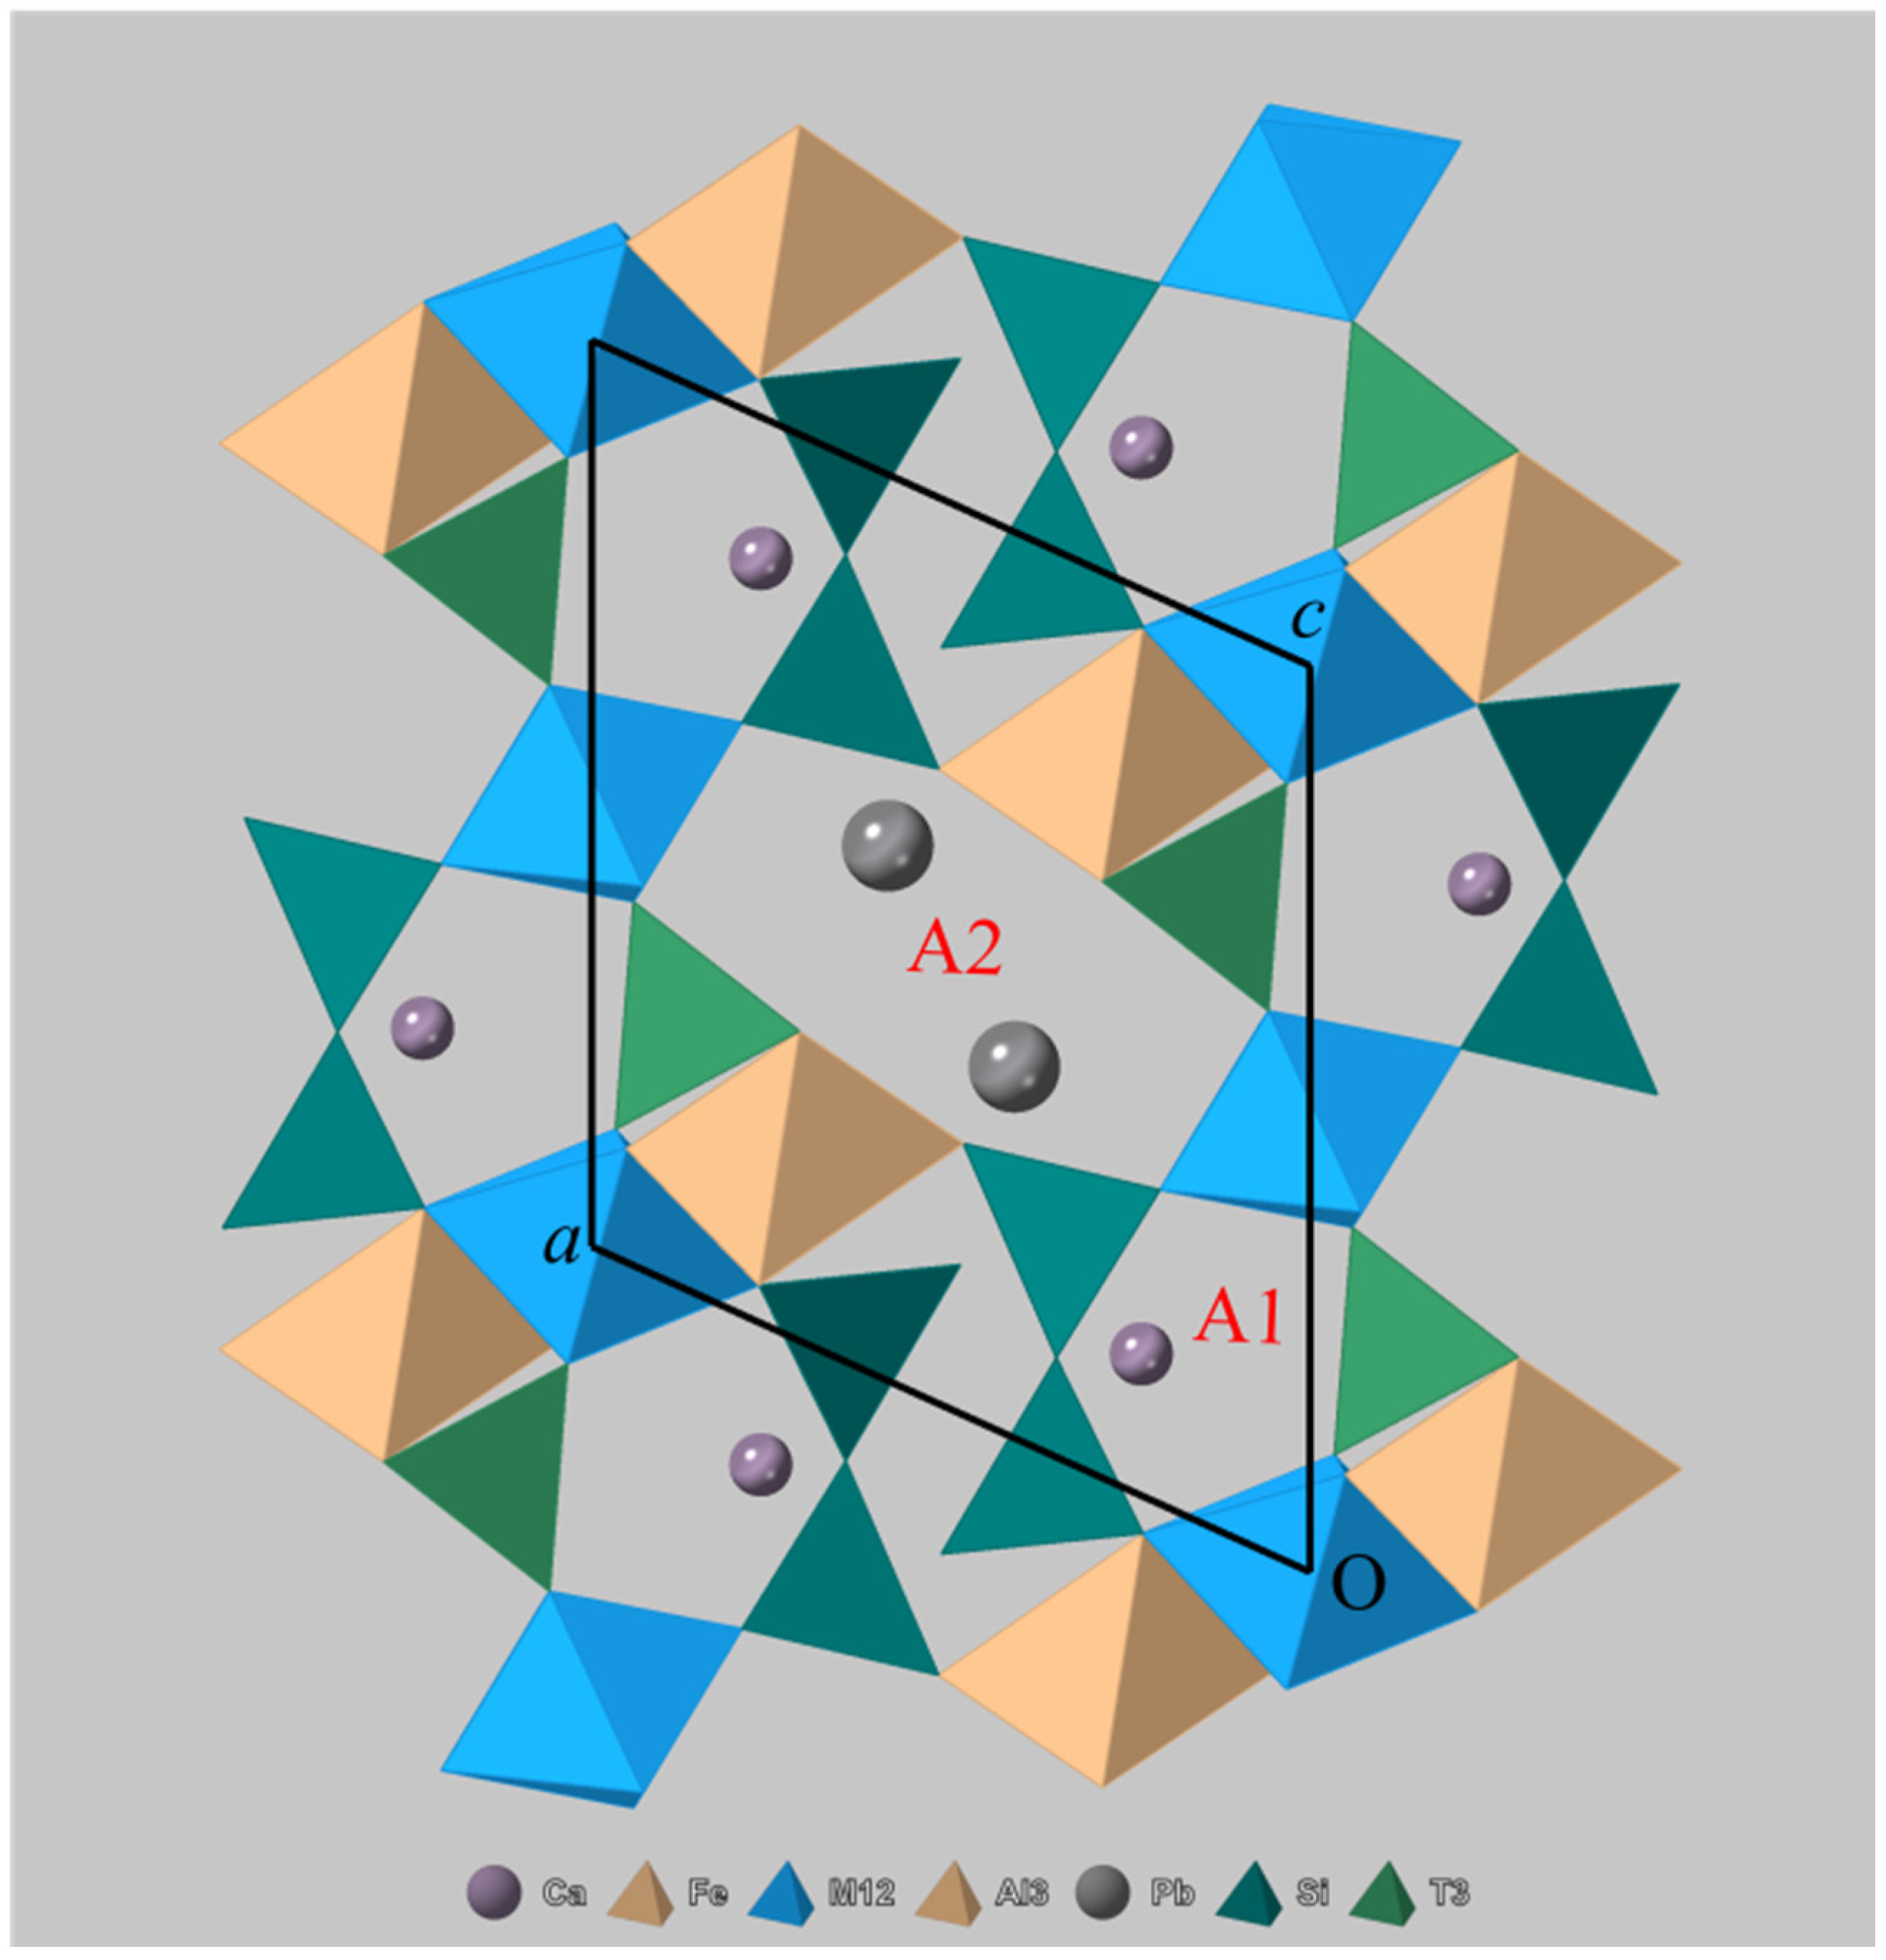
We report in the present study a more reliable multi-technique study of hancockite from Jakobsberg, including EPMA, Raman, X-ray single-crystal, and powder diffraction data obtained on the same material. Crystal structural data of Jakobsberg hancockite largely confirmed results reported in [38]. Hancockite is isotypic with epidote, and its crystal structure (Figure 9) can thus be described through two distinct octahedral chains, a first one made up by edge-sharing regular M1 octahedra, with laterally linked M3 distorted octahedra, and a second one by regular M2 octahedra.
Octahedrally coordinated cations larger than Al3+, such as Fe3+ and Mn3+, preferentially occupy the M3 site, entering in M1 only with Xep > 0.6 [47]. M2 is the smallest and most regular of the three octahedrally coordinated sites. The two M1 and M2 chains are laterally linked through SiO4 and Si2O7 groups, thus forming a smaller A1 and a larger A2 cavity (Figure 9), the former hosting Ca and the latter both Ca and larger cations such as Pb, Sr, and REE. Geometrical features of coordination polyhedra in hancockite are reported in Table 9 and Table 13.
No significative change in tetrahedral units is found with respect to the values reported for T units geometry in [47]. Concerning the octahedral units, M2 is, as expected [47], the smaller and more regular of the three polyhedra, whereas M1 shows a barely detectable degree of distortion only, if compared with the definitely larger and more distorted M3 polyhedron. Substitution of Ca2+ with Pb2+, with [7] ionic radii 1.06 Å and 1.23 Å, respectively [48], leads to a distinct increase of the A2 polyhedron size, leaving instead the largely unaffected A1 polyhedron (Figure 7). The A2 coordination polyhedron in hancockite does not show any asymmetry in the spatial distribution of bonds compatible with the presence of the Pb2+ lone pair effect.

4. Relationships with Other Natural and Synthetic Phases

Following literature data [1,2,47], zoisite-(Pb) and hancockite can be regarded as the coexisting iron-poor, high-temperature and the iron-rich, low-temperature phases, respectively. According to [3,4], zoisite-(Pb), together with zoisite, cannot be included in the epidote supergroup, which includes phases with monoclinic symmetry only. It seems, therefore, proper to assess the definition of a new zoisite group, to be properly submitted to the IMA-CNMMN. Possible new phases, apart from zoisite and zoisite-(Pb), can be predicted for this group. The Sr analogue of zoisite-(Pb), with the ideal chemical formula CaSrAl3(SiO4)(Si2O7)O(OH), seems conceivable, as well as the minerals with Sr and Pb dominant in both A1 and A2 sites, suggested by [5,6], respectively.

Supplementary Materials

The following supporting information can be downloaded at: https://www.mdpi.com/article/10.3390/min12010051/s1. Table S1: CIF files of hancockite and zoisite-(Pb).

Author Contributions

K.E. provided the studied specimens and performed preliminary analyses; N.P., D.M., P.V. and F.Z. performed the experiments; N.P., D.M., P.V. and F.Z. analyzed the chemical and crystallographic data; N.P. wrote the paper with input from all the other authors. All authors have read and agreed to the published version of the manuscript.

Funding

This research received no external funding.

Data Availability Statement

Data are available on request to the corresponfing author.

Acknowledgments

The University Centrum for Applied Geosciences (UCAG) is thanked for the access to the Eugen F. Stumpfl electron microprobe laboratory of Leoben (Austria). The comments of four anonymous reviewers helped us improve the paper.

Conflicts of Interest

The authors declare no conflict of interest.

References

  1. Prunier, A.R.; Hewitt, D.A. Experimental observations on coexisting clinozoisite and zoisite. Am. Mineral. 1985, 70, 375–378. [Google Scholar]
  2. Brunsmann, A.; Franz, G.; Heinrich, W. Experimental investigation of zoisite–clinozoisite phase equilibria in the system CaO–Fe2O3–Al2O3–SiO2–H2O. Contrib. Mineral. Petrol. 2002, 143, 115–130. [Google Scholar] [CrossRef]
  3. Armbruster, T.; Bonazzi, P.; Akasaka, M.; Bermanec, V.; Chopin, C.; Gieré, R.; Heuss-Assbichler, S.; Liebscher, A.; Menchetti, S.; Pan, Y.; et al. Recommended nomenclature of epidote-group minerals. Eur. J. Mineral. 2006, 18, 551–567. [Google Scholar] [CrossRef] [Green Version]
  4. Mills, S.J.; Hatert, F.; Nickel, E.H.; Ferraris, G. The standardisation of mineral group hierarchies: Application to recent nomenclature proposals. Eur. J. Mineral. 2009, 21, 1073–1080. [Google Scholar] [CrossRef] [Green Version]
  5. Dörsam, G.; Liebscher, A.; Wunder, B.; Franz, G.; Gottschalk, M. Crystal chemistry of synthetic Ca2Al3Si3O12OH–Sr2Al3Si3O12OH solid-solution series of zoisite and clinozoisite. Am. Mineral. 2007, 92, 1133–1147. [Google Scholar] [CrossRef]
  6. Dörsam, G.; Liebscher, A.; Wunder, B.; Franz, G.; Gottschalk, M. Synthesis of Pb-zoisite and Pb-lawsonite. N. Jb. Miner. Abh. 2011, 188, 99–110. [Google Scholar] [CrossRef]
  7. Frei, D.; Liebscher, A.; Franz, G.; Dulski, P. Trace element geochemistry of epidote minerals. Rev. Mineral. 2004, 56, 553–605. [Google Scholar] [CrossRef]
  8. Penfield, S.L.; Warren, C.H. Some new minerals from the zinc mines at Franklin, N.J., and note concerning the chemical composition of ganomalite. Am. J. Sci. 1899, 8, 339–353. [Google Scholar] [CrossRef] [Green Version]
  9. Chukanov, N.V.; Varlamov, D.A.; Nestola, F.; Belakovskiy, D.I.; Goettlicher, J.; Britvin, S.N.; Lanza, A.; Jancev, S. Piemontite-(Pb), CaPbAl2Mn3+[Si2O7][SiO4]O(OH), a new mineral species of the epidote supergroup. N. Jb. Miner. Abh. 2012, 189, 275–286. [Google Scholar] [CrossRef]
  10. Moore, P.B. Mineralogy and chemistry of Långban-type deposits in Bergslagen, Sweden. Mineral. Rec. 1970, 1, 154–172. [Google Scholar]
  11. Magnusson, N.H. Långbans malmtrakt. Sverigs Geol. Undersökning 1930, 23, 111. [Google Scholar]
  12. Nysten, P.; Holtstam, D.; Jonsson, E. The Långban minerals. In Långban, the Mines, Their Minerals, History and Explorers; Holtstam, D., Langhof, J., Eds.; Raster Förlag: Stockholm, Sweden, 1999; 215p. [Google Scholar]
  13. Holtstam, D.; Mansfeld, J. Origin of a carbonate-hosted Fe–Mn–(Ba–As–Pb–Sb–W) deposit of Långban-type in Central Sweden. Miner. Deposita 2001, 36, 641–657. [Google Scholar] [CrossRef]
  14. Nordenskiõld, A.E. Nya mineralier från Långban. Geol. Foren. Stock. For. 1877, 3, 376–384. [Google Scholar] [CrossRef] [Green Version]
  15. Igelström, L.J. Plumboferrit, ett nytt mineral från Jakobsbergs manganmalmsgrufva vid Nordmarken i Wermland. Kongl. Veten. Akad. För. 1881, 38, 27–31. [Google Scholar]
  16. Sjögren, H. Svabit, ett mineral af apatitgruppen från Harstigsgrufvan. Geol. Foren. Stock. For. 1891, 13, 789–796. [Google Scholar]
  17. Sjögren, H. Celsian, en anorthiten motsvarande bariumfältspat från Jakobsberg. Preliminärt meddelande. Geol. Foren. Stock. For. 1895, 17, 578–582. [Google Scholar] [CrossRef] [Green Version]
  18. Johansson, K. Mineralogische Mitteilungen. Z. Kristallogr. 1928, 68, 87–118. [Google Scholar] [CrossRef]
  19. Dunn, P.J.; Rouse, R.C. Morelandite, a new barium arsenate chloride member of the apatite group. Can. Mineral. 1978, 16, 601–604. [Google Scholar]
  20. Holstram, D.; Norrestam, R. Lindqvistite, Pb2MeFe16O27, a novel hexagonal ferrite mineral from Jakobsberg, Filipstad, Sweden. Am. Mineral. 1993, 78, 1304–1312. [Google Scholar]
  21. Holtstam, D.; Larsson, A. Tegengrenite, a new, rhombohedral spinel-related Sb mineral from the Jakobsberg Fe-Mn deposit, Värmland, Sweden. Am. Mineral. 2000, 85, 1315–1320. [Google Scholar] [CrossRef]
  22. Holtstam, D.; Cámara, F.; Karlsson, A.; Skogby, H.; Zack, T. Ferri-taramite, IMA 2021-046. CNMNC Newsletter 63. Mineral. Mag. 2021, 85, 910–915. [Google Scholar] [CrossRef]
  23. Mandarino, J.A. The Gladstone-Dale relationship. Part III. Some general applications. Can. Mineral. 1979, 17, 71–76. [Google Scholar]
  24. Mandarino, J.A. The Gladstone-Dale relationship. Part IV. The compatibility concept and its application. Can. Mineral. 1981, 19, 441–450. [Google Scholar]
  25. Warr, L.N. IMA-CNMNC approved mineral symbols. Mineral. Mag. 2021, 85, 291–320. [Google Scholar] [CrossRef]
  26. Holtstam, D.; Langhof, J. Hancockite from Jakobsberg, Filipstad: A second world occurrence. Mineral. Mag. 1994, 58, 172–174. [Google Scholar] [CrossRef]
  27. Christy, A.; Gatedal, K. Extremely Pb-rich rock-forming silicates including a beryllian scapolite and associated minerals in a skarn from Långban, Värmland, Sweden. Mineral. Mag. 2005, 69, 995–1018. [Google Scholar] [CrossRef]
  28. Hålenius, U.; Bosi, F.; Gatedal, K. Crystal structure and chemistry of skarn-associated bismuthian vesuvianite. Am. Mineral. 2013, 98, 566–573. [Google Scholar] [CrossRef]
  29. Holtstam, D.; Cámara, F.; Karlsson, A. Instalment of the margarosanite group, and data on walstromite–margarosanite solid solutions from the Jakobsberg Mn–Fe deposit, Värmland, Sweden. Mineral. Mag. 2021, 85, 224–232. [Google Scholar] [CrossRef]
  30. Wojdyr, M. Fityk: A general-purpose peak fitting program. J. Appl. Crystallogr. 2010, 43, 1126–1128. [Google Scholar] [CrossRef]
  31. Makreski, P.; Jovanovski, G.; Kaitner, B.; Gajović, A.; Biljan, T. Minerals from Macedonia. XVIII. Vibrational spectra of some sorosilicates. Vibr. Spectr. 2007, 44, 162–170. [Google Scholar] [CrossRef]
  32. Liebscher, A. Spectroscopy of epidote minerals. Rev. Mineral. Geochem. 2004, 56, 125–170. [Google Scholar] [CrossRef]
  33. Della Ventura, G.; Mottana, A.; Parodi, G.C.; Griffin, W.L. FTIR spectroscopy in the OH-stretching region of monoclinic epidotes from Praborna (St. Marcel, Aosta valley, Italy). Eur. J. Mineral. 1996, 8, 655–665. [Google Scholar] [CrossRef]
  34. Bruker AXS Inc. Apex3; Bruker Advanced X-ray Solutions: Madison, WI, USA, 2016. [Google Scholar]
  35. Sheldrick, G.M. Crystal structure refinement with SHELXL. Acta Crystallogr. 2015, C71, 3–8. [Google Scholar]
  36. Comodi, P.; Zanazzi, P.F. The pressure behavior of clinozoisite and zoisite: An X-ray diffraction study. Am. Mineral. 1997, 82, 61–68. [Google Scholar] [CrossRef]
  37. Wilson, A.J.C. (Ed.) International Tables for Crystallography. Volume C: Mathematical, Physical and Chemical Tables; Kluwer Academic: Dordrecth, The Netherlands, 1992. [Google Scholar]
  38. Dollase, W.A. Refinement of the crystal structures of epidote, allanite and hancockite. Am. Mineral. 1971, 56, 447–464. [Google Scholar]
  39. Momma, K.; Izumi, F. VESTA 3 for three-dimensional visualization of crystal, volumetric and morphology data. J. Appl. Crystallogr. 2011, 44, 1272–1276. [Google Scholar] [CrossRef]
  40. Brown, I.D. Bond Valence Parameters. 2016. Available online: http://www.iucr.org/data/assets/file/0007/126574/bvparm2016.cif (accessed on 22 December 2021).
  41. Ferraris, G.; Ivaldi, G. Bond valence vs. bond length in O⋯O hydrogen bonds. Acta Crystallogr. 1988, 44, 341–344. [Google Scholar] [CrossRef] [Green Version]
  42. Robinson, K.; Gibbs, G.V.; Ribbe, P.H. Quadratic elongation: A quantitative measure of distortion in coordination polyhedra. Science 1971, 172, 567–570. [Google Scholar] [CrossRef]
  43. Dunn, P.J. The lead silicates from Franklin, New Jersey: Occurrence and composition. Mineral. Mag. 1985, 49, 721–727. [Google Scholar] [CrossRef]
  44. Jancev, S.; Bermanec, V. Solid solution between epidote and hancockite from Nežilovo, Macedonia. Geol. Croat. 1998, 51, 23–26. [Google Scholar]
  45. Fesenko, E.G.; Rumanova, I.M.; Belov, N.V. The crystal structure of zoisite. Dokl. Acad. Sci. USSR 1955, 102, 275–278. [Google Scholar]
  46. Dollase, W.A. Refinement and comparison of the structure of zoisite and clinozoisite. Am. Mineral. 1968, 53, 1882–1888. [Google Scholar]
  47. Franz, G.; Liebscher, A. Physical and chemical properties of the epidote minerals—An introduction. Rev. Mineral. Geochem. 2004, 56, 1–82. [Google Scholar] [CrossRef]
  48. Shannon, R.D. Revised effective ionic radii and systematic study of interatomic distances in halides and chalcogenides. Acta Crystallogr. 1976, 32, 751–767. [Google Scholar] [CrossRef]
  49. Pushkin, D.V.; Marukhnov, A.V.; Serezhkin, V.N. Coordination polyhedra PbOn in crystal structures. Russ. J. Inorg. Chem. 2006, 51, 99–107. [Google Scholar] [CrossRef]
Figure 1. Subhedral pale pink zoisite-(Pb) associated to calcite (1), celsian (2), and vesuvianite (bluish green). Collection Museo di Storia Naturale, University of Pisa (holotype specimen, catalogue number 19,927).
Minerals 12 00051 g001
Figure 2. Backscattered electron image of zoisite-(Pb) (Zo-Pb) and associated hancockite (Hnc), with calcite (Cal) and Pb-bearing celsian (Cls). Mineral symbols after [25].
Minerals 12 00051 g002
Figure 3. X-ray maps showing the distribution of Ca, Pb, Al, and Fe in the studied sample. Scale bar = 50 μm.
Minerals 12 00051 g003
Figure 4. Raman spectra of zoisite-(Pb) (above) and hancockite (below), in the range 100–1300 cm−1 (ac) and between 3000–3800 cm−1 (bd). The fitted Raman bands, in red, as well as their Raman shift positions are shown.
Minerals 12 00051 g004
Figure 5. (a) Relationships between Ca vs. A2+ and Al vs. Me3+ (b) in zoisite-(Pb) (blue rhombus) and hancockites. Hancockite data from present study are denoted as brown circles, Sterling Hill [43] as yellow triangles, Jakobsberg [26] as dark green circle, and Nezilovo [44] as light green squares.
Minerals 12 00051 g005
Figure 6. Polyhedral representation of zoisite-(Pb) structure as seen along [010]. A2 cavities host Pb, whereas Ca is present in A1 cavities. Crystal structure representations were obtained through the CrystalMaker software (CrystalMaker Software Ltd.).
Minerals 12 00051 g006
Figure 7. Comparison of the geometry of the Ca and Pb coordination polyhedra of zoisite-(Pb) (a,b) and of hancockite (c,d). The asymmetrical distribution of bond lengths in zoisite-(Pb) Pb polyhedron (Figure 7b), with Pb cation distinctly displaced towards O3-O7-O3 polyhedral face, can be attributed to the presence of an active lone pair effect of Pb cation. Pb polyhedron in hancockite (Figure 7d) lacks instead such a lopsided distribution of anions.
Minerals 12 00051 g007
Figure 8. Progressive substitution of Ca2+ with A2+ cations within A1 and A2 cavities causes an increase of their size. The progressive decrease of O4-O6-O5 angle is linked to the entering of A2+ in A1 cavity, whereas the increase of O2-O8 distance and of T2-O8-M3 angle highlights the entering of A2+ in A2 cavity.
Minerals 12 00051 g008
Figure 9. Crystal structure of hancockite as seen along b. The mineral is isotypic with P21/m epidotes, with chains of M1 octahedra with laterally linked distorted M3 octahedra, and chains of M2 octahedra, both running along b. Octahedral chains are interconnected along a and c directions through corner sharing disilicate groups and isolated T3 tetrahedra, respectively.
Minerals 12 00051 g009
Table 1. Chemical composition (in wt%) of zoisite-(Pb) and hancockite.
ConstituentZoisite-(Pb)Hancockite
Mean
(n = 10)
Rangee.s.d. 1Mean
(n = 5)
Rangee.s.d. 1Standard
SiO230.1129.45–31.560.6430.1929.93–30.450.20Albite
Al2O324.5723.90–24.900.3019.7819.45–20.020.23Albite
Fe2O3(tot)1.321.23–1.450.079.349.11–9.460.14Magnetite
Fe2O3(calc) *1.32 8.74
FeO(calc) *- 0.54
CaO10.259.83–10.690.2611.0210.79–11.290.24Wollastonite
MnO(tot)0.590.52–0.640.030.650.62–0.710.04Rhodonite
Mn2O3(calc) *0.50
MnO(calc) *0.14
BaO0.050.01–0.100.020.070.02–0.110.03Baryte
PbO32.2331.14–33.730.7427.2026.84–27.960.47Crocoite
Na2O0.070.01–0.140.04---Albite
H2O(calc) **1.50 1.50
Total100.75 99.69
Note: 1 estimated standard deviation; * calculated in order to yield 8 (A + M + T) cations and 25 positive charges per formula unit. ** Calculated in order to yield 1 OH group per formula unit.
Table 2. EPMA representative analyses of phases associated with zoisite-(Pb).
Celsian-1Celsian-2VesuvianiteGrossular
SiO2 (wt%)35.8644.4434.7538.17
Al2O326.1323.1213.9313.75
Fe2O30.000.000.0012.10
FeO0.020.033.200.00
MnO0.000.000.321.01
CaO0.030.0132.2834.84
MgO0.000.001.980.11
BaO30.6418.030.000.00
SrO0.110.000.000.00
PbO6.948.201.830.00
CuO0.110.091.360.00
Na2O0.321.460.290.00
K2O1.284.670.000.00
F0.000.000.230.00
Sum101.44100.0590.1799.98
0.000.00−0.100.00
Total101.44100.0590.0799.98
*******
Si (a.p.f.u.)2.162.4818.543.00
Al1.851.528.761.27
Fe3+0.000.000.000.72
Fe2+0.000.001.520.00
Mn0.000.000.150.07
Ca0.000.0018.452.94
Mg0.000.001.570.01
Ba0.720.390.000.00
Sr0.000.000.000.00
Pb0.110.120.260.00
Cu0.010.000.550.00
Na0.040.160.300.00
K0.10.330.000.00
F0.000.000.380.00
Note: * a.p.f.u. on the basis of 8 oxygens; ** a.p.f.u. on the basis of 50 cations; *** a.p.f.u. on the basis of 12 oxygens.
Table 3. X-ray powder diffraction data (d in Å) for zoisite-(Pb). Intensity and dhkl were calculated using the software CrystalDiffract (CrystalMaker Software Ltd. Kidlington, UK) on the basis of the structural model given in Table 5. Only the reflections with Icalc > 10 are given, if not observed. The eight strongest reflections are given in bold. Intensities were visually estimated: s = strong; ms = medium–strong; m = medium; mw = medium–weak; w = weak; vw = very weak.
IobsdobsIcalcdcalch k lIobsdobsIcalcdcalch k l
s8.631008.6581 0 1w2.136162.1316 0 3
mw8.11388.1992 0 0vw2.12892.1297 0 2
vw6.45106.3892 0 1mw2.085192.0902 2 3
vw5.12495.0980 0 2 132.0835 2 1
m4.895404.9050 1 1w2.015172.0194 1 4
mw4.825204.8173 0 1 32.0135 0 4
w4.620134.6212 1 0w1.963281.9655 2 2
m4.210354.2092 1 1vw1.921121.9248 1 0
mw3.793263.8034 0 1vw1.91041.9114 2 3
s3.660573.6721 1 2 41.9103 0 5
523.6513 1 1vw1.86781.8711 2 4
w3.336153.3321 0 3 101.8682 1 5
w3.302193.3074 1 0vw1.835141.8362 2 4
w3.140173.1464 1 1vw1.765161.7706 1 4
mw3.097323.1023 1 2vw1.74171.7421 3 2
s2.900892.9040 1 3 51.7374 1 5
mw2.750532.7585 0 2vw1.693161.6947 2 2
m2.725672.7265 1 1vw1.652141.6555 1 5
w2.642332.6482 2 0 111.6409 1 2
142.6406 0 1vw1.635121.6360 3 3
w2.558232.5653 1 3vw1.619101.6223 0 6
132.5490 0 4 111.6181 1 6
w2.431172.4342 0 4vw1.57381.57310 1 0
vw2.35062.3502 2 2vw1.55481.5558 1 4
w2.250202.2544 2 1vw1.48531.4878 2 3
w2.235182.2383 2 2 61.4837 1 5
vw2.17572.1765 1 3
Table 4. Crystal and experimental data for zoisite-(Pb) and hancockite.
Crystal DataZoisite-(Pb)Hancockite
Crystal size (mm)0.062 × 0.033 × 0.0230.075 × 0.041 × 0.027
Cell setting, space groupOrthorhombic, PnmaMonoclinic, P21/m
a (Å)16.3978 (6)8.9496 (3)
b (Å)5.5953 (2)5.6474 (2)
c (Å)10.1953 (3)10.2724 (3)
β = 114.362 (1)°
V3)936.43 (1)472.96 (1)
Z42
Data collection and refinement
Radiation, wavelength (Å) MoKα,0.710730.71073
Temperature (K)293293
max (°)70.6071.25
Measured reflections171299184
Unique reflections21092139
Reflections with Fo > 4σ (Fo)20132041
Rint0.03400.0364
Rσ0.02060.0306
Range of h, k, l−26 ≤ h ≤ 26,
−8 ≤ k ≤ 8,
−15 ≤ l ≤ 16
−14 ≤ h ≤ 14,
−9 ≤ k ≤ 8,
−16 ≤ l ≤ 15
R [Fo > 4σ (Fo)]0.02130.0254
R (all data)0.02350.0283
wR (on Fo2)0.04090.0780
Goof1.1941.244
Number of least-squares parameters120124
Maximum and
minimum residual peak (e Å−3)
1.03 (at 1.85 Å from O9)
−1.96 (at 0.55 Å from Si3)
1.18 (at 0.51 Å from A2)
−1.18 (at 1.12 Å from Si2)
Table 5. Atom coordinates and isotropic displacement parameters (in Å2) for zoisite-(Pb). Refined occupancies for mixed sites A2 and M3 were Pb 0.856(1) + Ca 0.143(1) and Fe 0.864(2) + Al 0.136(2), respectively. * Hydrogen atom H10 was refined isotropically.
SiteOccupancyxyzUeq
A1Ca10.36622 (4)¼0.43549 (6)0.00817 (13)
A2Pb0.86Ca0.140.45965 (2)¼0.12028 (2)0.01013 (4)
M12Al1.000.25250 (4)0.99680 (12)0.18358 (7)0.00487 (13)
M3Al0.86Fe0.140.10965 (5)¾0.29542 (9)0.00503 (25)
Si1Si1.000.08471 (5)¼0.10020 (9)0.00474 (16)
Si2Si1.000.41239 (5)¾0.28124 (9)0.00489 (16)
Si3Si1.000.16555 (5)¼0.42498 (8)0.00457 (16)
O1O1.000.13368 (10)0.00207 (30)0.13943 (17)0.00752 (29)
O2O1.000.10909 (10)0.01413 (31)0.41682 (17)0.00841 (30)
O3O1.000.36182 (9)0.98858 (30)0.24009 (17)0.00734 (29)
O4O1.000.22261 (14)¾0.29060 (23)0.00569 (38)
O5O1.000.23370 (13)¼0.30518 (23)0.00496 (38)
O6O1.000.27210 (13)¾0.05404 (22)0.00471 (37)
O7O1.000.99353 (15)¼0.15323 (25)0.00935 (43)
O8O1.001.00020 (15)¾0.28603 (25)0.01052 (45)
O9O1.000.41653 (18)¾0.44046 (26)0.01829 (57)
O10O1.000.27052 (15)¼0.07163 (24)0.00829 (42)
H10H1.000.2650 (38)¼0.9836 (60)0.033 (17) *
Table 6. Selected bond distances (in Å) in zoisite-(Pb). Quadratic elongation (QE) parameter calculated, according to [28].
A1−O72.275 (3)A2–O72.375 (2)M12–O41.827 (2)M3–O81.797 (3)
–O32.473 (2) × 2 –O32.491 (2) × 2 –O101.843 (2) –O41.853 (2)
–O12.513 (2) × 2 –O22.785 (2) × 2 –O31.884 (2) –O21.928(2) × 2
–O52.547 (2) –O22.809 (2) × 2 −O51.908 (2) –O12.162 (2) × 2
–O62.570 (2) –O83.030 (1) × 2 −O61.938 (2)<M3-O> 1.970
-O92.917 (1) × 2 −O12.000 (2)QE 1.0235
<A1[7]> 2.482<A2[7]> 2.651<M12-O> 1.901
QE 1.0081
Si1–O71.590 (2)Si2–O81.595 (2)Si3–O21.614 (2) × 2
–O91.629 (3) –O91.625 (3) –O51.656 (2)
–O11.652 (2) × 2 –O31.627 (2) × 2 –O61.666 (2)
<Si1-O> 1.631<Si2-O> 1.619<Si3-O> 1.639
Table 7. Weighted bond-valence balance (v.u.) for zoisite-(Pb).
A1A2M12M3Si1Si2Si3Σav
O10.25 × 2 0.342 x → 0.18 × 20.92 × 2 1.87
O2 0.15 × 2
0.16 × 2
0.55 × 2 1.08 × 21.94
O30.28 × 20.38 × 20.52 0.97 × 2 2.15
O4 2x → 0.620.71 1.95 *
O50.22 2x → 0.48 0.932.11
O60.21 2x → 0.44 0.891.98
O70.420.49 1.15 2.06
O8 2x → 0.06× 2 0.82 1.09 2.03
O92x → 0.05 × 2 1.000.97 2.07
O10 2x → 0.59 1.18 *
Σcv2.011.992.992.993.994.003.98
Note: left and right superscripts indicate the number of equivalent bonds involving anions and cations, respectively. Bond valences have been weighted for sites with mixed occupancy in structural refinement. * Anion involved in the hydrogen bond O10–H···O4 [d (O10···O4) = 2.867 (3) Å]. A BVS of 0.16 v.u. can be calculated for this bond, according to [41], leading BVS at O4 and O10 sites to 2.11 and 1.02 v.u., respectively.
Table 8. Atom coordinates and isotropic displacement parameters (in Å2) for hancockite. Refined occupancies for mixed sites A2 and M3 were Pb 0.760 (1) + Ca 0.240 (1) and Fe 0.673 (5) + Al 0.327 (5), respectively.
SiteOccupancyxyzUeq
A1Ca10.7647 (1)¾0.1562 (1)0.01021 (20)
A2Pb0.76Ca0.240.5881 (3)¾0.4097 (3)0.01285 (8)
M1Al1.000000.00572 (26)
M2Al1.0000½0.00503 (25)
M3Fe0.67Al0.330.2876 (1)¼0.2199 (1)0.00605 (25)
Si1Si1.000.3345 (2)¾0.0412 (1)0.00630 (24)
Si2Si1.000.6845 (2)¼0.2785 (1)0.00662 (25)
Si3Si1.000.1733 (2)¾0.3099 (1)0.00655 (24)
O1O1.000.2330 (3)0.9930 (5)0.0409 (3)0.00967(45)
O2O1.000.2892 (3)0.9814 (5)0.3416 (3)0.01118 (47)
O3O1.000.7907 (3)0.0122 (5)0.3466 (3)0.01033 (46)
O4O1.000.0485 (4)¼0.1254 (4)0.00769 (59)
O5O1.000.0333 (4)¾0.1413 (4)0.00823 (61)
O6O1.000.0583 (4)¾0.4015 (4)0.00751(60)
O7O1.000.5134 (5)¾0.1644 (4)0.01114 (65)
O8O1.000.5173 (5)¼0.2994 (5)0.01587 (8)
O9O1.000.6466 (6)¼0.1096 (4)0.01840 (83)
O10O1.000.0723 (5)¼0.4235 (4)0.00894 (62)
Table 9. Selected bond distances (Å) and QE distortion parameter [42] for coordination polyhedra in hancockite.
A1–O72.285 (5)A2–O72.325 (5)M1–O41.838 (3) × 2M2–O10 × 21.857 (4) × 2
–O32.386 (4) × 2 –O32.621 (4) × 2 –O11.950 (3) × 2 –O3 × 21.887 (3) × 2
–O52.471 (5) –O22.778 (3) × 2 –O51.958 (3) × 2 –O6 × 21.931 (4) × 2
–O12.499 (4) × 2 –O22.794 (3) × 2<M1-O>1.915<M2-O>1.892
–O62.790 (4) –O102.807 (4)QE 1.0072QE 1.0054
–O92.984 (2) × 2 –O83.011 (2) × 2
<A1[7]-O>2.474<A2[8]-O>2.690 M3–O81.873 (5)
–O41.951 (4)
Si1–O71.579 (4)Si2–O81.597 (6)Si3–O21.616 (3) × 2 –O21.962 (4) × 2
–O91.626 (6) –O91.625 (5) –O61.655 (5) –O12.233 (4) × 2
–O11.645 (2) × 2 –O31.627 (3) × 2 –O51.667 (4)<M3-O> 2.036
<Si1-O>1.624<Si2-O>1.619<Si3-O>1.639QE1.0279
Table 10. Weighted bond-valence balance (v.u.) for hancockite.
A1A2M1M2M3Si1Si2Si3Σav
O10.25 × 2 0.44 × 2 0.18 × 20.92 × 2 1.79
O2 0.16 × 2
0.17 × 2
0.61 × 2 1.08 × 22.02
O30.34 × 20.28 × 2 0.50 × 2 0.97 × 2 2.09
O4 2x → 0.63 × 2 0.63 1.89 *
O50.27 2x → 0.43 × 2 0.892.02
O60.08 2x → 0.44 × 2 0.941.90
O70.420.50 1.17 2.09
O8 2x → 0.06 × 2 0.78 1.08 1.98
O92x → 0.02 0.990.98 2.02
O10 0.14 2x → 0.55 × 2 1.24 *
Σcv1.971.983.002.982.994.004.003.99
Note: left and right superscripts indicate the number of equivalent bonds involving anions and cations, respectively. Bond valences have been weighted for sites with mixed occupancy in structural refinement. * Anion involved in the hydrogen bond O10···O4 [d (O10···O4) = 2.981 (6) Å]. A BVS of 0.14 v.u. can be calculated for this bond, according to [41], leading BVS at O4 and O10 sites to 2.03 and 1.13 v.u., respectively.
Table 11. Comparison between unit cell parameters (Å) and geometrical features of A1 and A2 polyhedra of isostructural zoisite phases: (1) Zoisite [36]; (2) present study; (3) synthetic Sr-zoisite [6]; (4) synthetic Pb-zoisite [5]. As defined above, A2+ indicates (Pb + Sr + Ba)2+ a.p.f.u. for each phase.
(1)(2)(3)(4)
a16.21216.397816.354816.4529
b5.5555.59535.59855.6432
c10.03410.195310.260010.3631
V3)903.6935.43939.43962.18
<A1VII-O>2.4642.4802.5602.666
O9 × 22.9142.9172.9022.913
<A2VII-O>2.5482.6492.6502.664
O8 × 23.0073.030 3.0993.130
A2-O103.0033.1413.0383.066
A2+00.8622
Table 12. Selected interatomic bonds (Å) and angles (°) in (1) Zoisite [36]; (2) zoisite-(Pb) (this study); (3) synthetic Sr-zoisite [5]; (4) synthetic Pb-zoisite [6].
O2-O8O4-O6-O5T2-O8-M3
(1)3.428160.83148.44
(2)3.759159.26157.20
(3)3.791157.68160.71
(4)4.020153.46165.41
Table 13. Comparison of mean bond distances, polyhedral volume (A3), and distortion parameters [28] (quadratic elongation λ bond angle variance σ2) for coordination polyhedra in hancockite.
x ¯ Vλσ2
T11.6242.1861.003611.9616
T21.6192.1741.00124.7143
T31.6392.2461.003915.1322
M11.9159.2811.007219.7561
M21.8928.9541.00547.4723
M32.03610.871.027974.2204
[9]A12.58728.28
[10]A22.75441.76
Publisher’s Note: MDPI stays neutral with regard to jurisdictional claims in published maps and institutional affiliations.