The calculation method of impact load acting on the supporting structure mainly includes three parts: the amount of kinetic energy released, the size and velocity of the blasting block, and the load acting on the supporting structure. Firstly, the strain energy stored in the rock mass and the kinetic energy of the explosive block transformed from the released energy are calculated employing energy analysis. Secondly, the size and velocity of the blasting block are determined. Finally, after obtaining the two key parameters, the size and velocity of the blasting block, the load acting on the supporting structure is estimated by the structural mechanic’s method.
2.1. Surrounding Rock Strain Energy of Tunnel
According to the material mechanics and elasticity mechanics, it can be known that the strain energy of the surrounding rock in triaxial stress state can be calculated according to Equation (1), which is the calculation formula of elastic strain energy of surrounding rock per unit volume expressed by stress tensor.
where
is the strain energy density of surrounding rock,
and
are the elastic modulus and Poisson’s ratio of surrounding rock, respectively.
In the secondary stress state after tunnel excavation, the directions of the three stress spindles are, respectively, the tangent direction of the excavation contour plane, the axial direction of the tunnel and the normal direction of the contour plane, and near the contour plane.
It can be known that the strain energy formula of surrounding rock surrounding the tunnel after excavation is as follows:
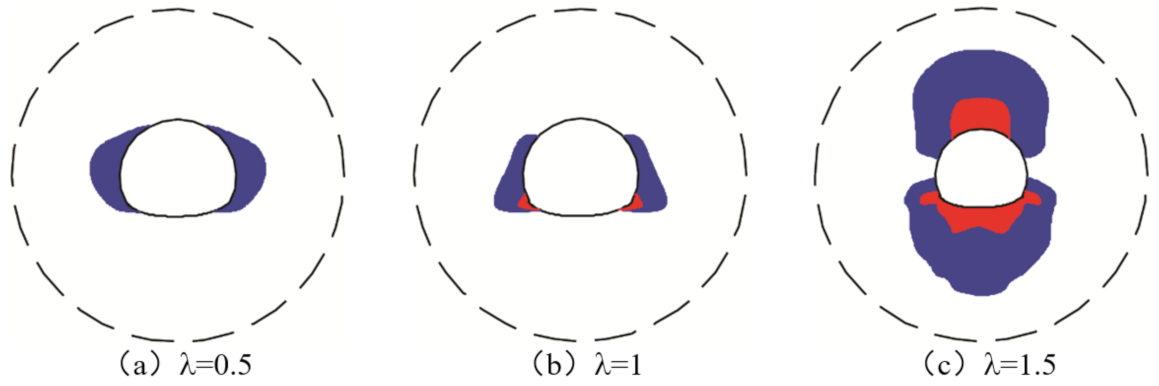
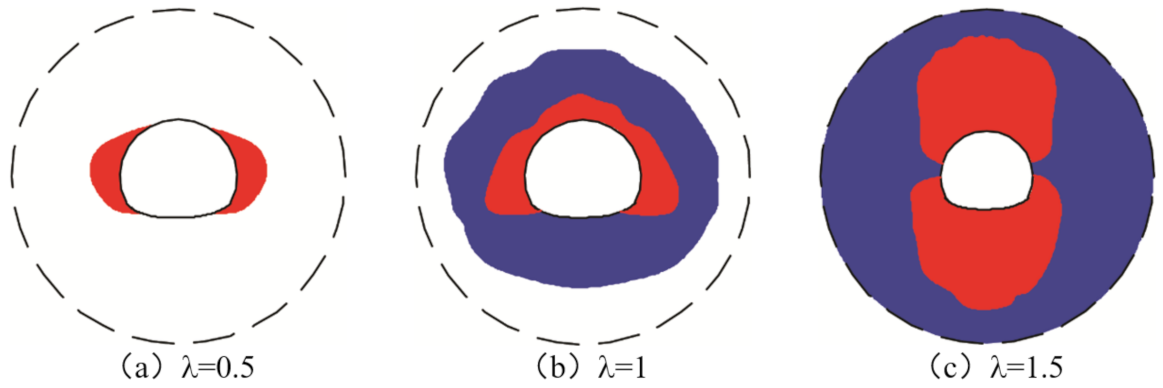
In terms of vertical initial ground stress and lateral pressure coefficient,
With different values, the formula for calculating the strain energy density contained in the vault, shoulder, waist, side wall, and inverted supply of the tunnel under different initial vertical stresses and lateral pressure coefficients can be obtained:
Vault and invert:
Arch shoulders and side walls:
2.2. Determination of Released Kinetic Energy
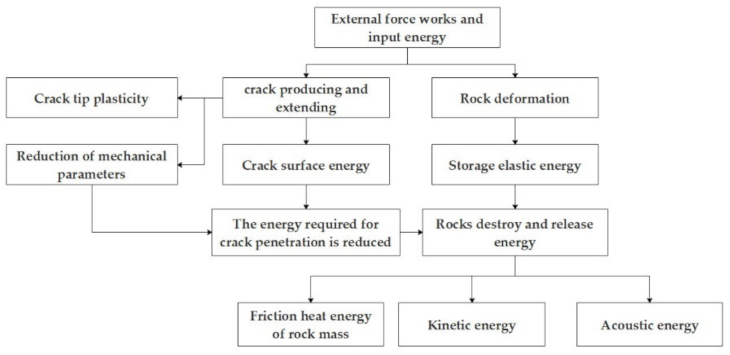
In the process of rock failure, shown in
Figure 1, energy stored in rock mass will not be completely released as kinetic energy, some will be dissipated in the form of thermal energy and surface energy. Different scholars have derived the calculation formula of dissipated energy, respectively. However, the calculation formula contains many parameters that are difficult to obtain in specific projects, and the calculation is complex. In this paper, the specific size of energy other than kinetic energy is not considered, and, instead, the focus is on how much of the strain energy stored in a rock mass can be converted into kinetic energy and released in the way of rockburst.
The calculation of the released kinetic energy involves two processes. The first process is external force doing work, and energy being accumulated in the rock mass. Here, some energy will be used to expand the cracks between degraded surrounding rocks. When the critical condition is reached, rockburst occurs and energy is released, this part of the energy will not be released. The strain energy contained in the surrounding rock includes elastic strain energy and plastic strain energy. The other process is that when rockburst occurs, a part of the energy is released in the form of acoustic energy and thermal energy, rather than all in the form of kinetic energy. The following analyzes the two processes, respectively, to determine the kinetic energy that can be released during rockburst.
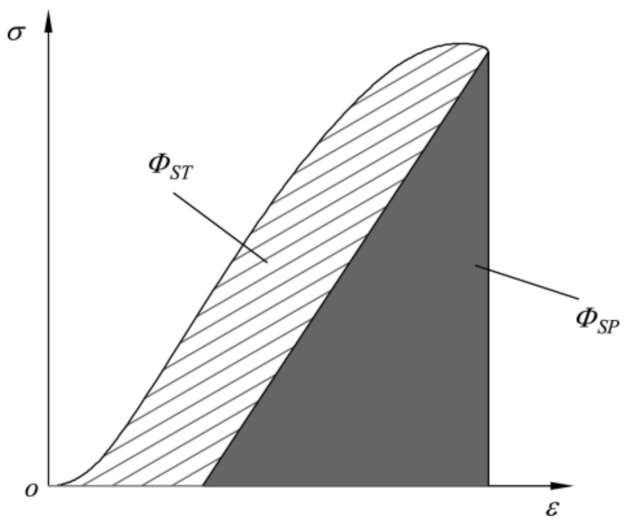
The energy release rate of the first process can be determined by experimental methods, which refer to the acquisition method of the rockburst tendency index, customarily expressed as
Wet (also known as elastic energy index in China) in the Polish national standard [
17]. In the uniaxial compressive-strength test of rock, the specimen is loaded to 70–80% of its peak strength and then unloaded 0.05 times. In the process of loading and unloading tests, the stress–strain curves of loading and unloading of rocks under uniaxial stress state can be finally obtained, to calculate the ratio between the elastic strain energy released by unloading (
ΦSP) and the strain energy consumed (
ΦST), which is known as the rockburst tendency index (
Wet):
The test curve of the rockburst tendency index is shown in
Figure 2:
According to the definition of the rockburst tendency index, the value of Wet reflects the relationship between the energy stored in rock and released during rockburst, that is, the relationship between the sum of elastic strain energy and plastic strain energy. In the same state, the higher the Wet value, the greater the energy stored in the rock, the greater the energy it can release, and there is a higher possibility of higher-grade rockburst.
According to the Polish national standard, the values of
Wet corresponding to different grades of rockburst are as follows [
18]:
Wet ≥ 5.0, Severe and extremely severe grade;
2.0 ≤ Wet < 5.0, Mild and medium grade;
Wet < 2.0, No rockburst.
In different grades of rockburst, different Wet values are selected to calculate the proportion of elastic strain energy in all strain energy contained in the rock mass. When the test conditions are available, the surrounding rock of a specific tunnel engineering site should be used for rock uniaxial compressive strength test to obtain the values of Wet. Then, the proportion of elastic strain energy is determined under the surrounding rock condition.
In case of a lack of test conditions, the recommended value can be obtained according to
Table 1 regarding Polish national standards.
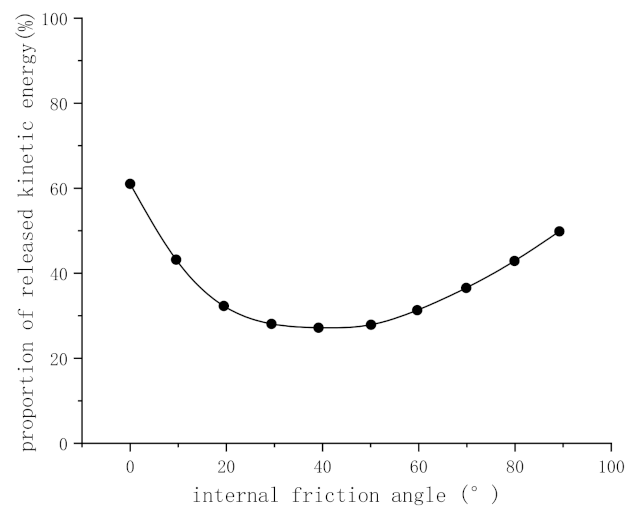
In the second process, the proportion of kinetic energy in all elastic strain energy released can refer to [
17], which shows the relationship between the proportion of kinetic energy in various energy released during rock shear failure and the internal friction angle in
Figure 3.
As shown in
Figure 3, the proportion of kinetic energy in the released energy is the smallest when the internal friction angle is 45°, accounting for only 30%. As the internal friction angle approaches 0° and 90°, the proportion of kinetic energy gradually increases until it reaches the maximum value, 60%. The internal friction angle is given, the value can be taken according to
Figure 3. In case of lack of data, it can be taken as 60% according to the most unfavorable situation.
2.3. Subsection
The characteristics of blasting blocks in different types of rockburst are given in the literature [
19]. Generally speaking, it is a conch shell or flake in exfoliation rockburst, an elongated elliptic fragment in slight-ejection rockburst, and a block in burst rockburst. The main mode of rockburst is exfoliation in mild and medium grades and ejection in extremely severe grades. Exfoliation rockburst may occur several times, so it can not completely reflect the whole process if only the characteristics of a single rockburst are counted. Meanwhile, exfoliation can also be understood as ejection with a small velocity. In addition, the blasting blocks of ejection rockburst are not complete, more than one block can be ejected from the same blasting pit at a time, and some blocks will break into several pieces after landing. It is more reasonable to comprehensively analyze and calculate the size of the blasting block from the perspective of the blasting pit.
To study the characteristics of blasting pits, 14 tunnels in different countries were investigated [
19,
20], as shown in
Table 2.
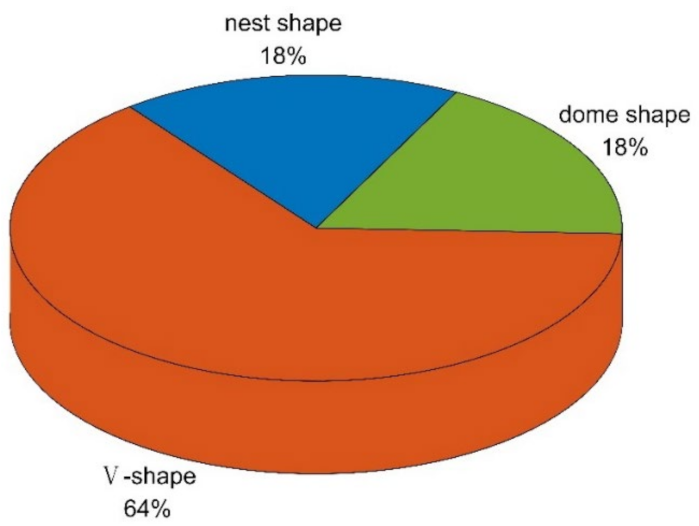
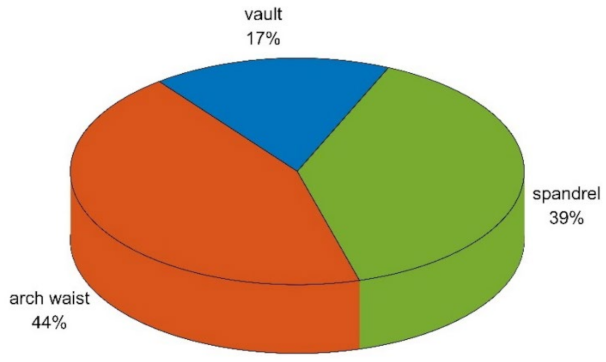
Based on
Table 2, the shape of the blasting pit can be divided into three categories: V-shape (including ladder shape, right-angle shape, and wedge shape), dome shape (including arc long groove and dome shape), and nest shape (including nest shape, honeycomb shape, and pot bottom shape). Using the tunnel as the basic unit, each tunnel contains one or two main blasting pit shapes, and the proportion of each blasting pit shape can be calculated, as illustrated in
Figure 4.
As shown in
Figure 4, the V-shaped blasting pit is the most common, accounting for 64% of all blasting pits. Therefore, in the subsequent calculation of blasting block volume, the blasting pit is considered as a V-shaped blasting pit a whereas the blasting block is considered as the corresponding cone.
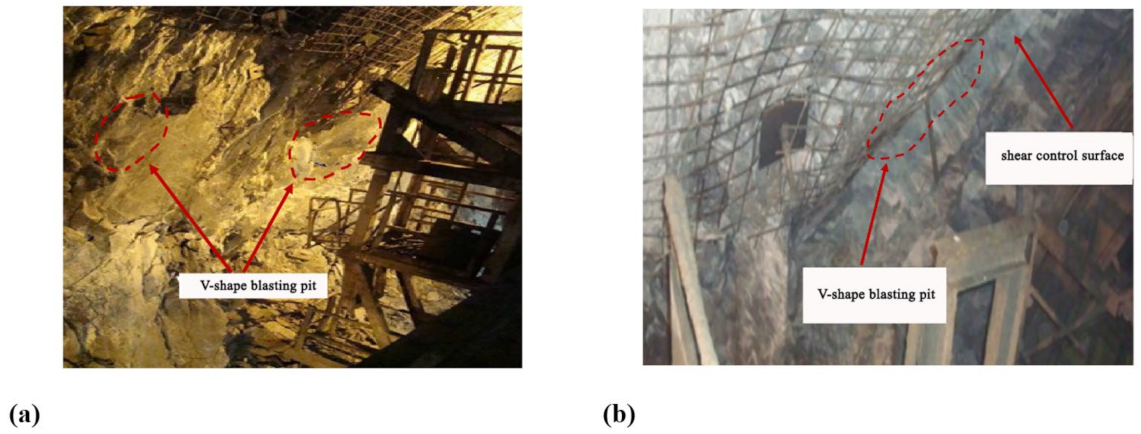
Figure 5 is a photo of a V-shaped blasting pit at the rockburst site.
It is important to note that the blasting block is not necessarily the shape of the scattered blocks we see after the rockburst. The impact of the blasting block may also form the final shape after it falls to the ground.
To study the influence depth under different grades of rockburst, 166 rockburst sections of seven tunnels such as the Futangba highway tunnel are counted [
20], and the statistical results are shown in
Table 3.
The influence depth of blasting pit under different rockburst grades is shown in
Table 4.
The influence depth of various rockburst grades is chosen, and the volume of the blasting block can be calculated using the shape of a square cone. Rockburst mainly occurs in hard rocks such as granite, limestone, marble, and gneiss. In specific projects, on-site rocks should be selected to test their density. When the test is not available on-site, it can be taken as 2.75 t/m3 because of the slight difference in density of the above rock masses. The mass of the blasting block can be obtained finally by multiplying the density by the volume.
After the released kinetic energy and the mass of the blasting block are determined, the velocity of the blasting block can be obtained by the kinetic energy formula.
The kinetic energy formula:
where
Ek—kinetic energy of the blasting block (J);
m—a mass of the blasting block (
kg);
V—velocity of blasting block (
m/s).
The velocity of the blasting block obtained by calculating shall conform to the actual situation. Therefore, the research on the velocity of the blasting block is carried out. From the perspective of energy balance, Zuo et al. [
21] studied the velocity of the blasting block by combining static loading and dynamic loading. McGarr [
22] studied the velocity of the blasting block from the buckling instability of the beam. In addition, the maximum velocity of blasting blocks observed at different sites is 10 m/s [
23,
24]. According to the extensive research into various aspects, the maximum velocity of blasting blocks can exceed 10 m/s, but only in rare cases.
2.4. Dynamic Load Factor
The blasting block acts on the supporting structure at a certain velocity to cause deformation. In this process, the change of blasting block height is the vertical component of the displacement value of the supporting structure at its action point, and the displacement value is minimal. Therefore, the change of gravitational potential energy of the blasting block is so small that it does not have to be considered. All the kinetic energy of the blasting block is transformed into the strain energy of the structure.
Kinetic energy:
; strain energy:
. They are equal:
where
F—maximum impact force (kN); ∆—maximum deflection of impact site (mm).
According to structural mechanics, when the supporting structure is considered as a linear elastic system, it can be known that
F and ∆ should meet the relationship shown in Equation (11):
where
E—Elastic modulus of supporting structure;
I—Sectional bending coefficient;
K0—Support dimension coefficient.
In the formula, support dimension coefficient
K0 is a coefficient related to support section size and support section type, reflecting the difference of load-deformation relationship between different tunnel sections. When the tunnel is circular, it can be calculated according to Equation (12):
where
R—Equivalent radius of tunnel (
m).
The simultaneous Formulas (10)–(12) can be solved as follows:
where ∆—Maximum deflection of impact site (
mm);
F—Impact load expressed in the form of concentrated load (
kN).
It can also be expressed by kinetic energy:
where
Ek—Released kinetic energy per unit volume of surrounding rock (
J);
V—Volume of surrounding rock releasing kinetic energy (
m3).
In structural dynamics, dynamic load factor
K is used to represent the action of dynamic load. The dynamic load factor represents the ratio of the deformation of the structure under dynamic load to the deformation of the structure under self-weight. Moreover, it can also be expressed as the multiple of the impact load equivalent to the self-weight.
According to Equation (15), the dynamic load factor of impact load acting on the supporting structure is related to the stiffness of the supporting structure. Therefore, the impact load on the supporting structure is different depending on the supporting parameters.
It should be noted that when the supporting structure is considered as a linear elastic system, Equations (13)–(15) are universal. They are not only applicable to circular tunnels but also railway or highway structures with sectional shapes such as three-center circles and four-center circles. Different section sizes and different section types correspond to different support size coefficients K0.
2.5. Impact Load
Increase the self-weight of blasting block to multiple of the dynamic load factor, and act on the structure in the form of uniform load, which can be equivalent to the impact load.
Alternatively, expressed in the form of kinetic energy:
where
q—Impact load (Pa);
a—length of a side of the blasting block (m).
The underlying principles of both expressions are the same. The significance of using different expressions is that the expression of Equation (16) is more concise, but it requires many assumptions. When the rockburst on site is different from the assumptions, the application of this equation will be limited. The expression of Equation (17) is more basic. In addition, when on-site parameters are different from the assumption, the relevant parameters can be directly adjusted to be more appropriate for the on-site situation, however the expression is complicated as a result.


