1. Introduction
In the last 10 years, historic surges in precious metal prices have led to abundant mining opportunities, particularly in the gold sector. This increase in production directly impacts the consumption of sodium cyanide in the metallurgical extraction of precious metals. With gold mining companies investing capital into new grassroots exploration projects, re-evaluating low-grade deposits, and prolonging activities at existing mines, there is an expected increase in market demand for sodium cyanide over the short to medium term [
1], which will likely result in increased cyanide prices. Understanding the metallurgical behaviour of ore and gangue material in plant feed is crucial to optimizing reagent consumption, process cost control, and cash flow. Increases in required reagent dosages due to the presence of cyanide-consuming elements, such as copper and iron, can cause significant increases in plant operating costs. As a result, the development of tools to predict and simulate the system response to increases in reagent consumption is critical to identify and mitigate potential risks to gold mining operations.
In Chile, there are a large number and variety of gold deposit types, including porphyry copper-gold, iron-oxide-copper-gold (IOCG), and high-grade gold and silver hydrothermal veins [
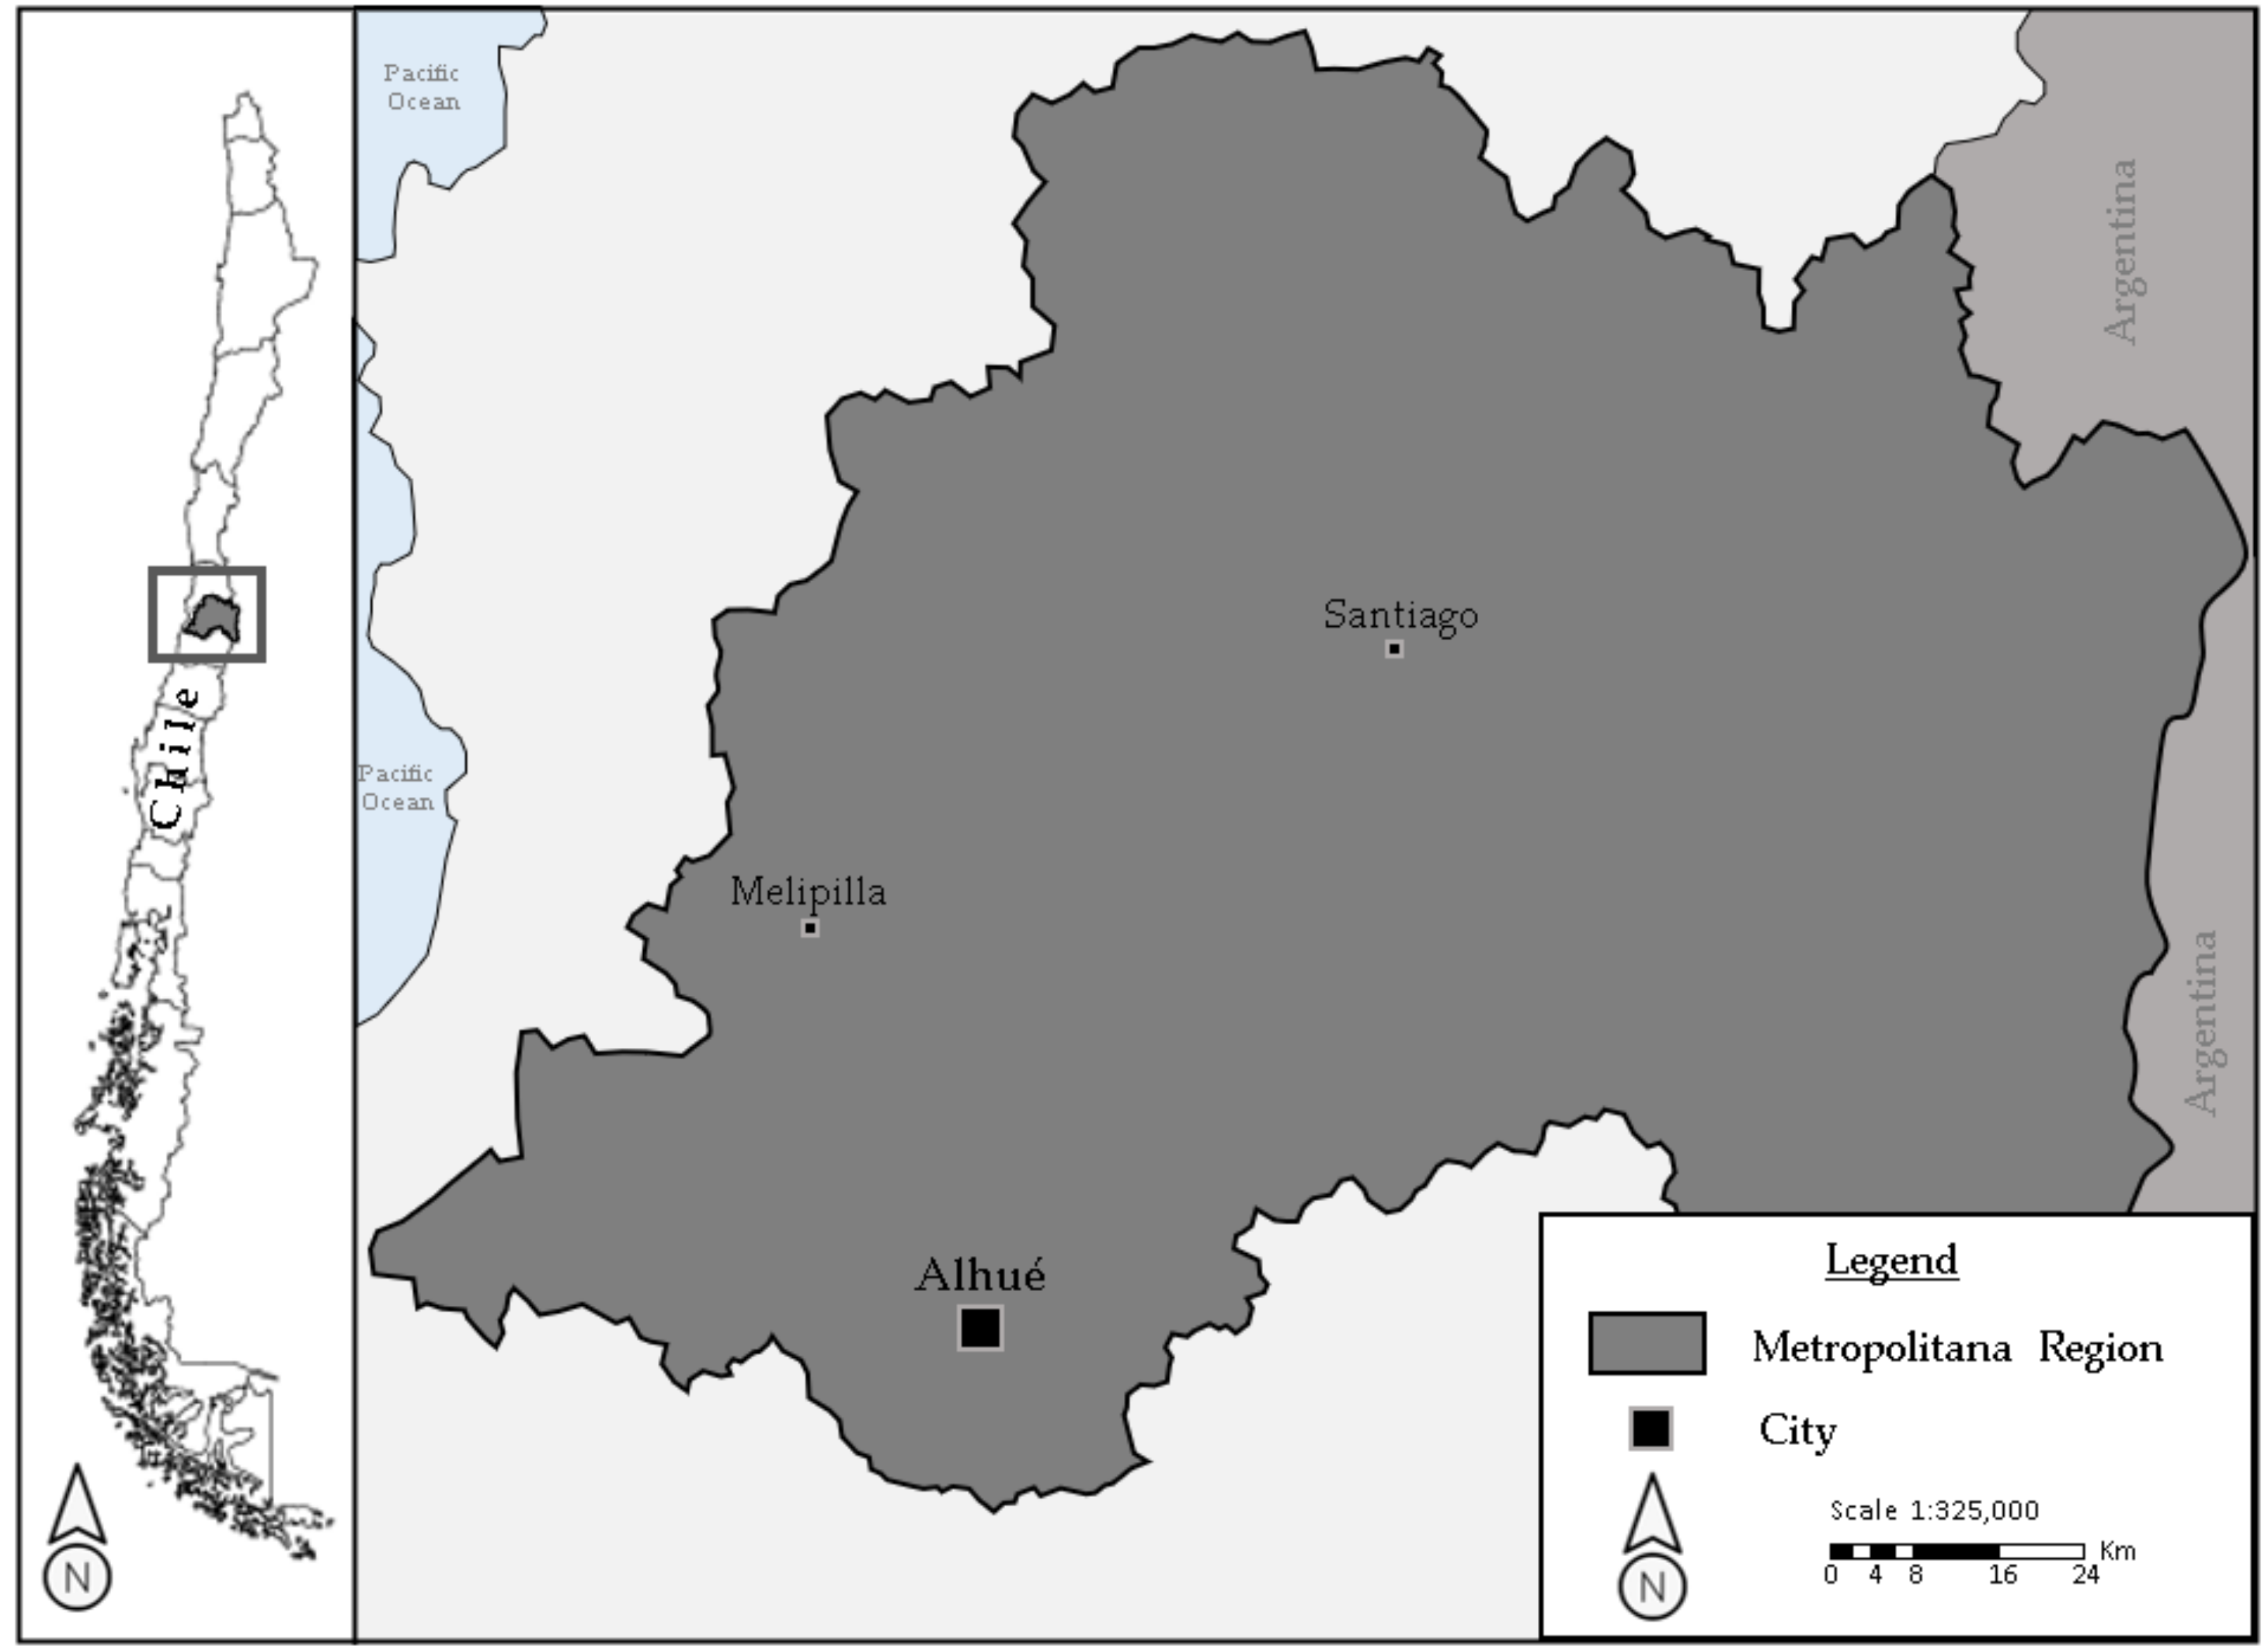
2]. The Alhué gold mining district is located near the small village of Alhué in the Costa range of central Chile, approximately 70 km to the southwest of Santiago and 40 km southeast of Melipilla (
Figure 1).
More specifically, the Florida Mine is located within the Alhué district. The quantity of copper (II) and iron (II) sulphides (CuS-FeS) entering the Florida process is difficult to predict based on the actual mineral stockpile distribution due to heterogeneities inherent to the orebody. These base minerals are considered harmful to the extraction of precious metals as they are aggressive consumers of cyanide, thereby affecting the viability of the metallurgical process. Previous classification methods were based solely on head grade, and did not consider the potential for high concentrations of impurities such as CuS and FeS. The deeper zones include varying balances of chalcopyrite and bornite, the latter of which consumes far more cyanide, as discussed in
Section 4. The subsequent analysis of
Section 5 and
Section 6 show that the geometallurgical variation and its impact on the beneficiation process can be managed by alternating between modes of operation that balance process mineralogy with strategic key performance indicators (KPIs) [
3]. These modes of operation are each governed by separate operating policies and triggered by established thresholds; they apply the necessary adjustments to effectively manage reagent addition.
The definition of appropriate geometallurgical units is paramount to properly plan and implement alternate modes of operation in response to imbalances of CuS-FeS contents in the ore feed. Furthermore, geometallurgical information should be routinely collected to complement the strategic planning of the mining process. Interpretation of this data can help define key criteria from which appropriate modes of operation and plant parameters can be established. From the experience at Florida Mine, the main factors that control copper and iron cyanide-soluble content include concentration, mineralogy, and the oxidation-reduction (redox) state of the ore upon mining. These processed data are then converted into defined programs and decision-making criteria to implement changes in the plant’s operational modes.
The current paper presents a quantitative approach to leverage the information obtained from process mineralogy to optimize cyanide consumption, in which mode changes are triggered by observed and forecasted changes in stockpile levels. The resulting operational modes provide an integrated response to the geological and geometallurgical variation; this is demonstrated through discrete event simulation (DES) following the two-mode formulation of Navarra et al. [
3].
2. Geological Setting of the Alhué District
The Alhué district is known for gold-silver vein systems [
4]. The veins are mainly hosted by volcanic rocks of the Las Chilcas Formation [
5,
6], which are intruded by a batholith of monzogranitic composition and several minor subvolcanic bodies (e.g., andesitic domes and dykes). The Las Chilcas Formation is discordant to the underlying Lo Valle Formation. The Lo Valle Formation is comprised of an alternating succession of pyroclastic (tuffs and breccias) and lava flows, emplaced in a subaerial-continental setting [
5,
6]. The composition of the volcanic rocks varies from andesitic to dacitic, with the more acidic lavas dominant in the upper member of the stratigraphic sequence. Andesitic lavas are aphanitic to feldspar-porphyritic with variably clay-altered plagioclase phenocrysts. Common alteration minerals include chlorite and epidote, as well as later vuggy and vein-controlled zeolites.
The mineralized structures typically consist of a central vein composed of multiple types of quartz (grey, grey-green, green, and lesser translucent white phases). The margins of the central vein tend to be flanked by hydrothermal breccia consisting of white to translucent-white quartz with varying proportions of silicified (±epidotized) wall-rock fragments [
2]. An abundance of gold and silver-rich quartz veins occur in the district, with a total of 76 veins identified to date. The lengths and widths of these structurally controlled mineralized veins vary throughout the region [
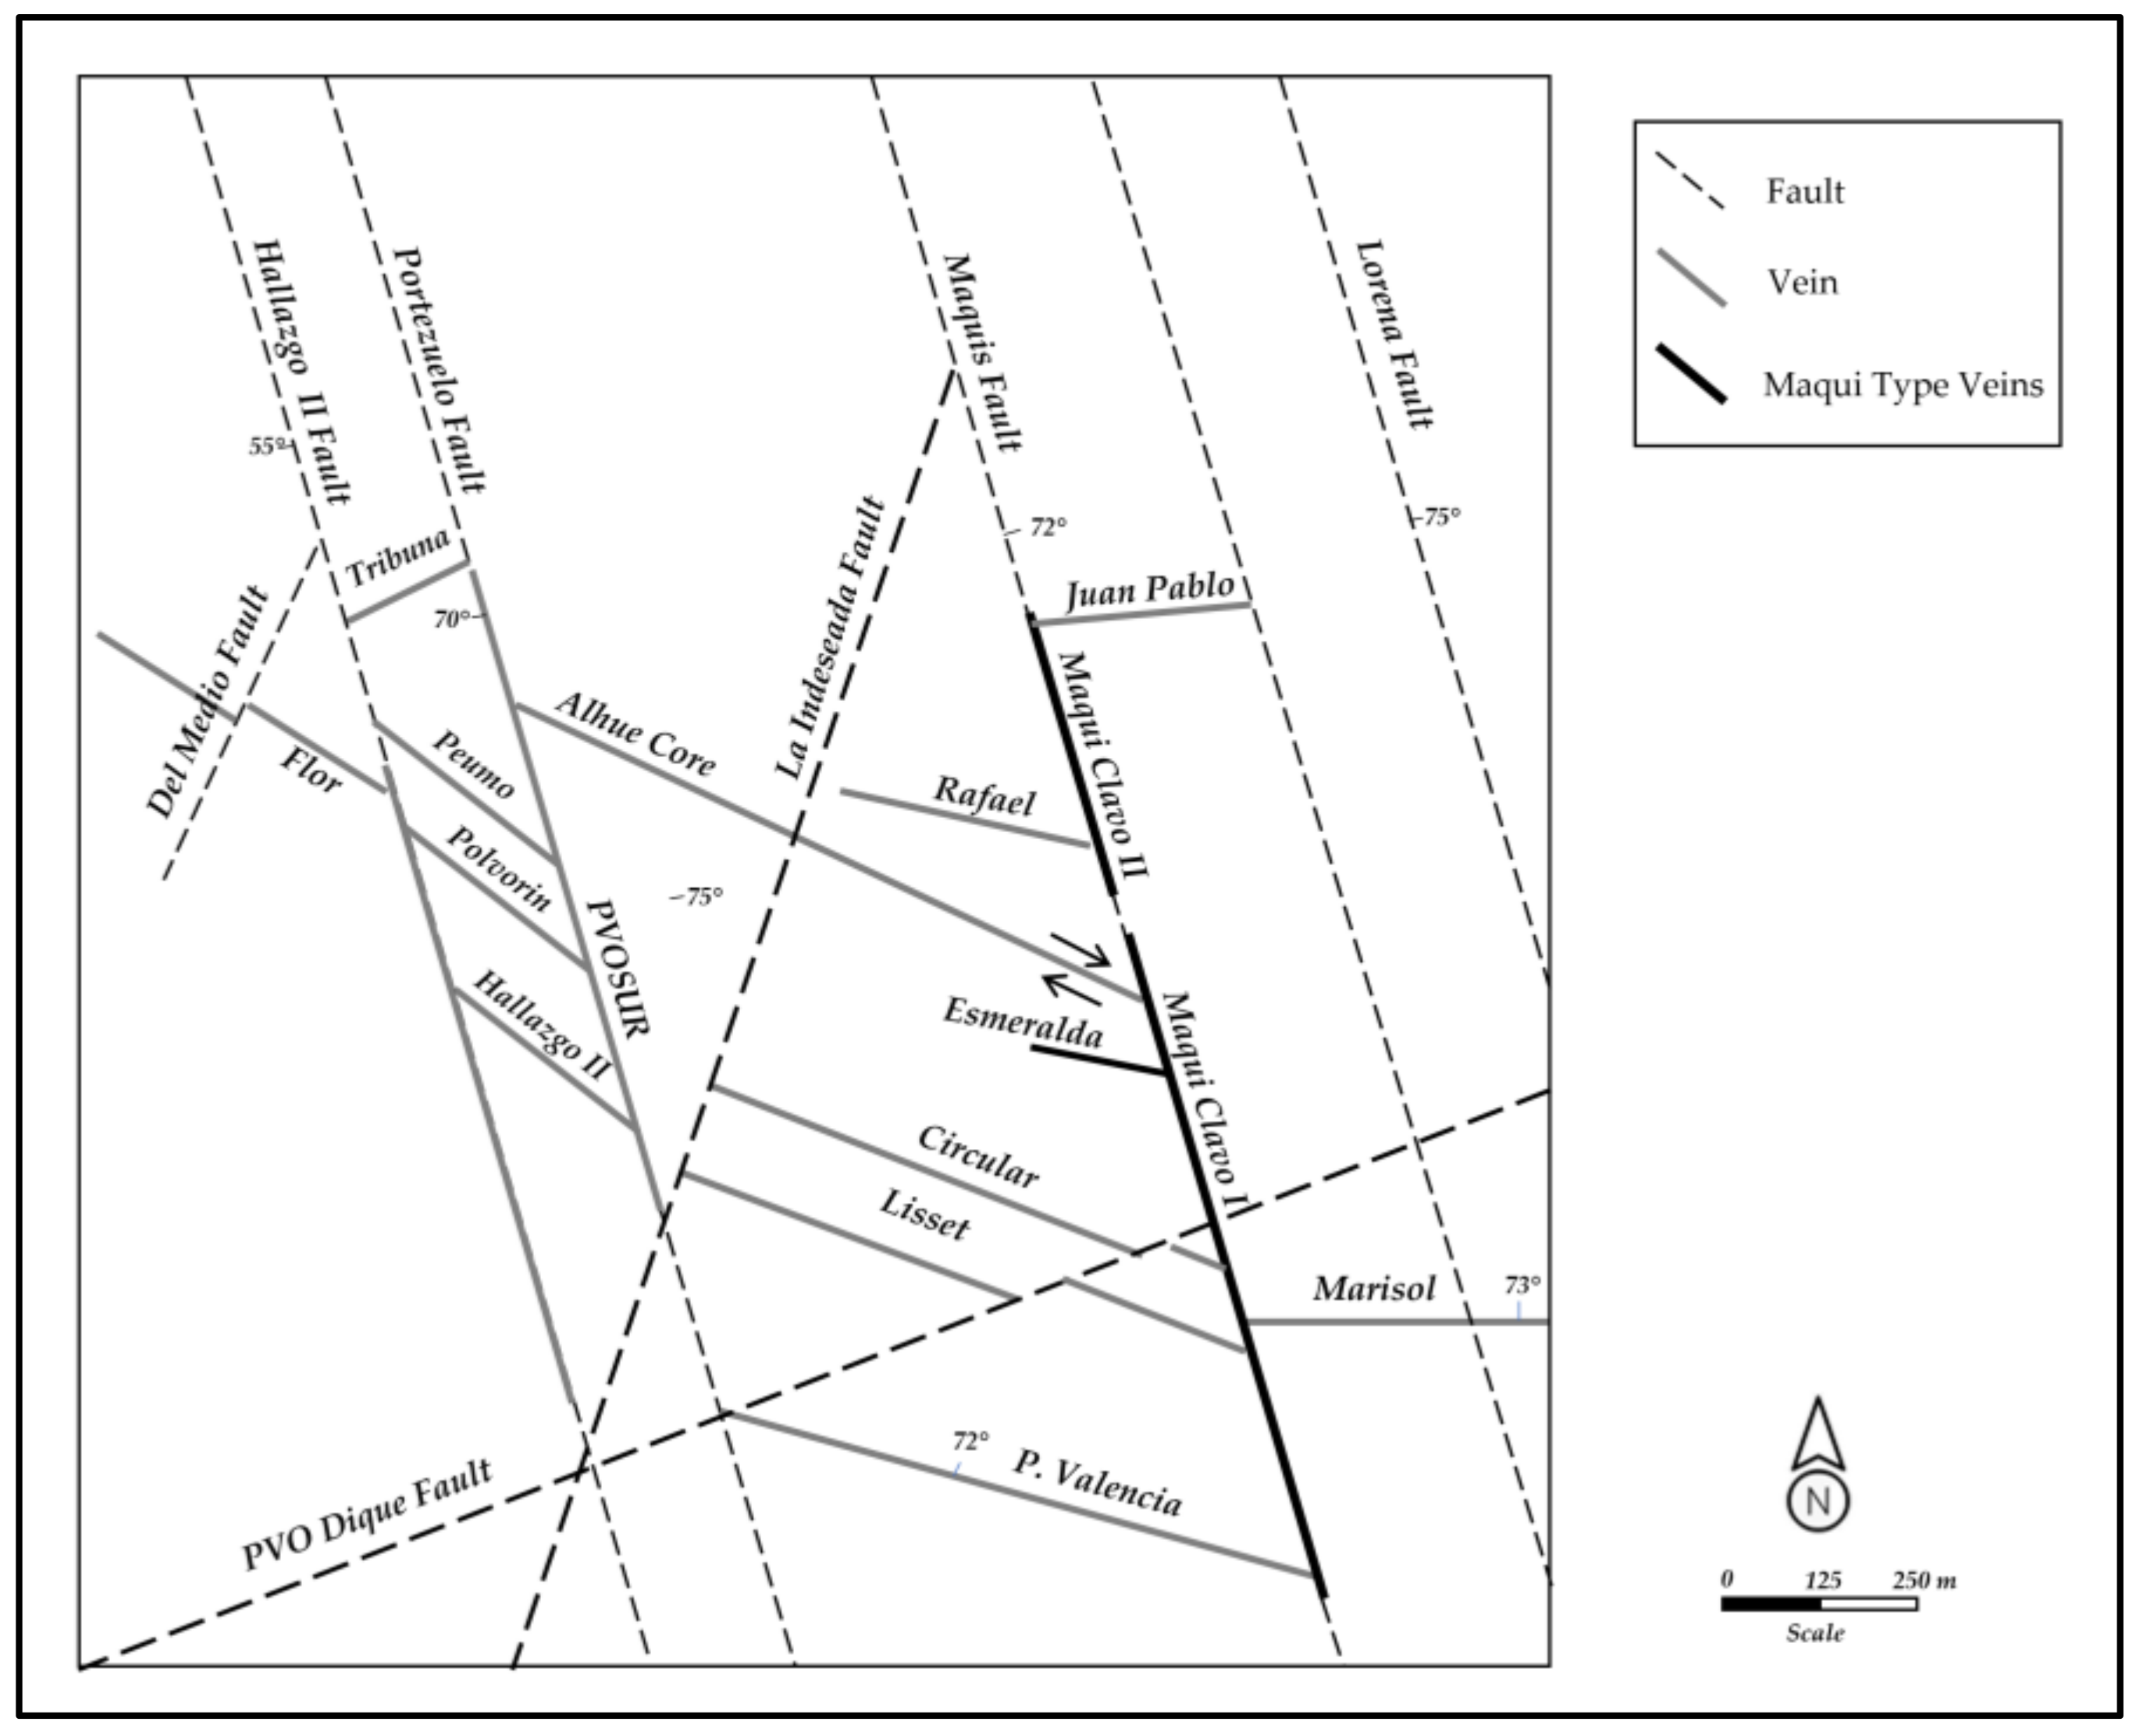
4]. The deepest levels of the hydrothermal system correspond to north–south trending structures (Maqui-type,
Figure 2), which are dominated by calc-silicate minerals, magnetite, and iron-rich sphalerite, and indicate a high-temperature deposition stage [
7].
Veins such as Pedro Valencia, Cantillana, and Circular represent earlier stages of mineralisation that occurred at slightly lower temperatures, but still within the range of epithermal deposits [
7]. Moreover, the vein-controlled gold mineralisation occurs primarily as free electrum and native gold grains in quartz or associated to sulphides. The mineralisation is commonly associated with magnetite and sulphides, including pyrite ± sphalerite-galena-chalcopyrite [
8]. The alteration assemblage in the veins mainly consists of quartz-epidote-chlorite-actinolite with lesser smectite, amphibole, and calcite-kaolinite-garnet [
9].
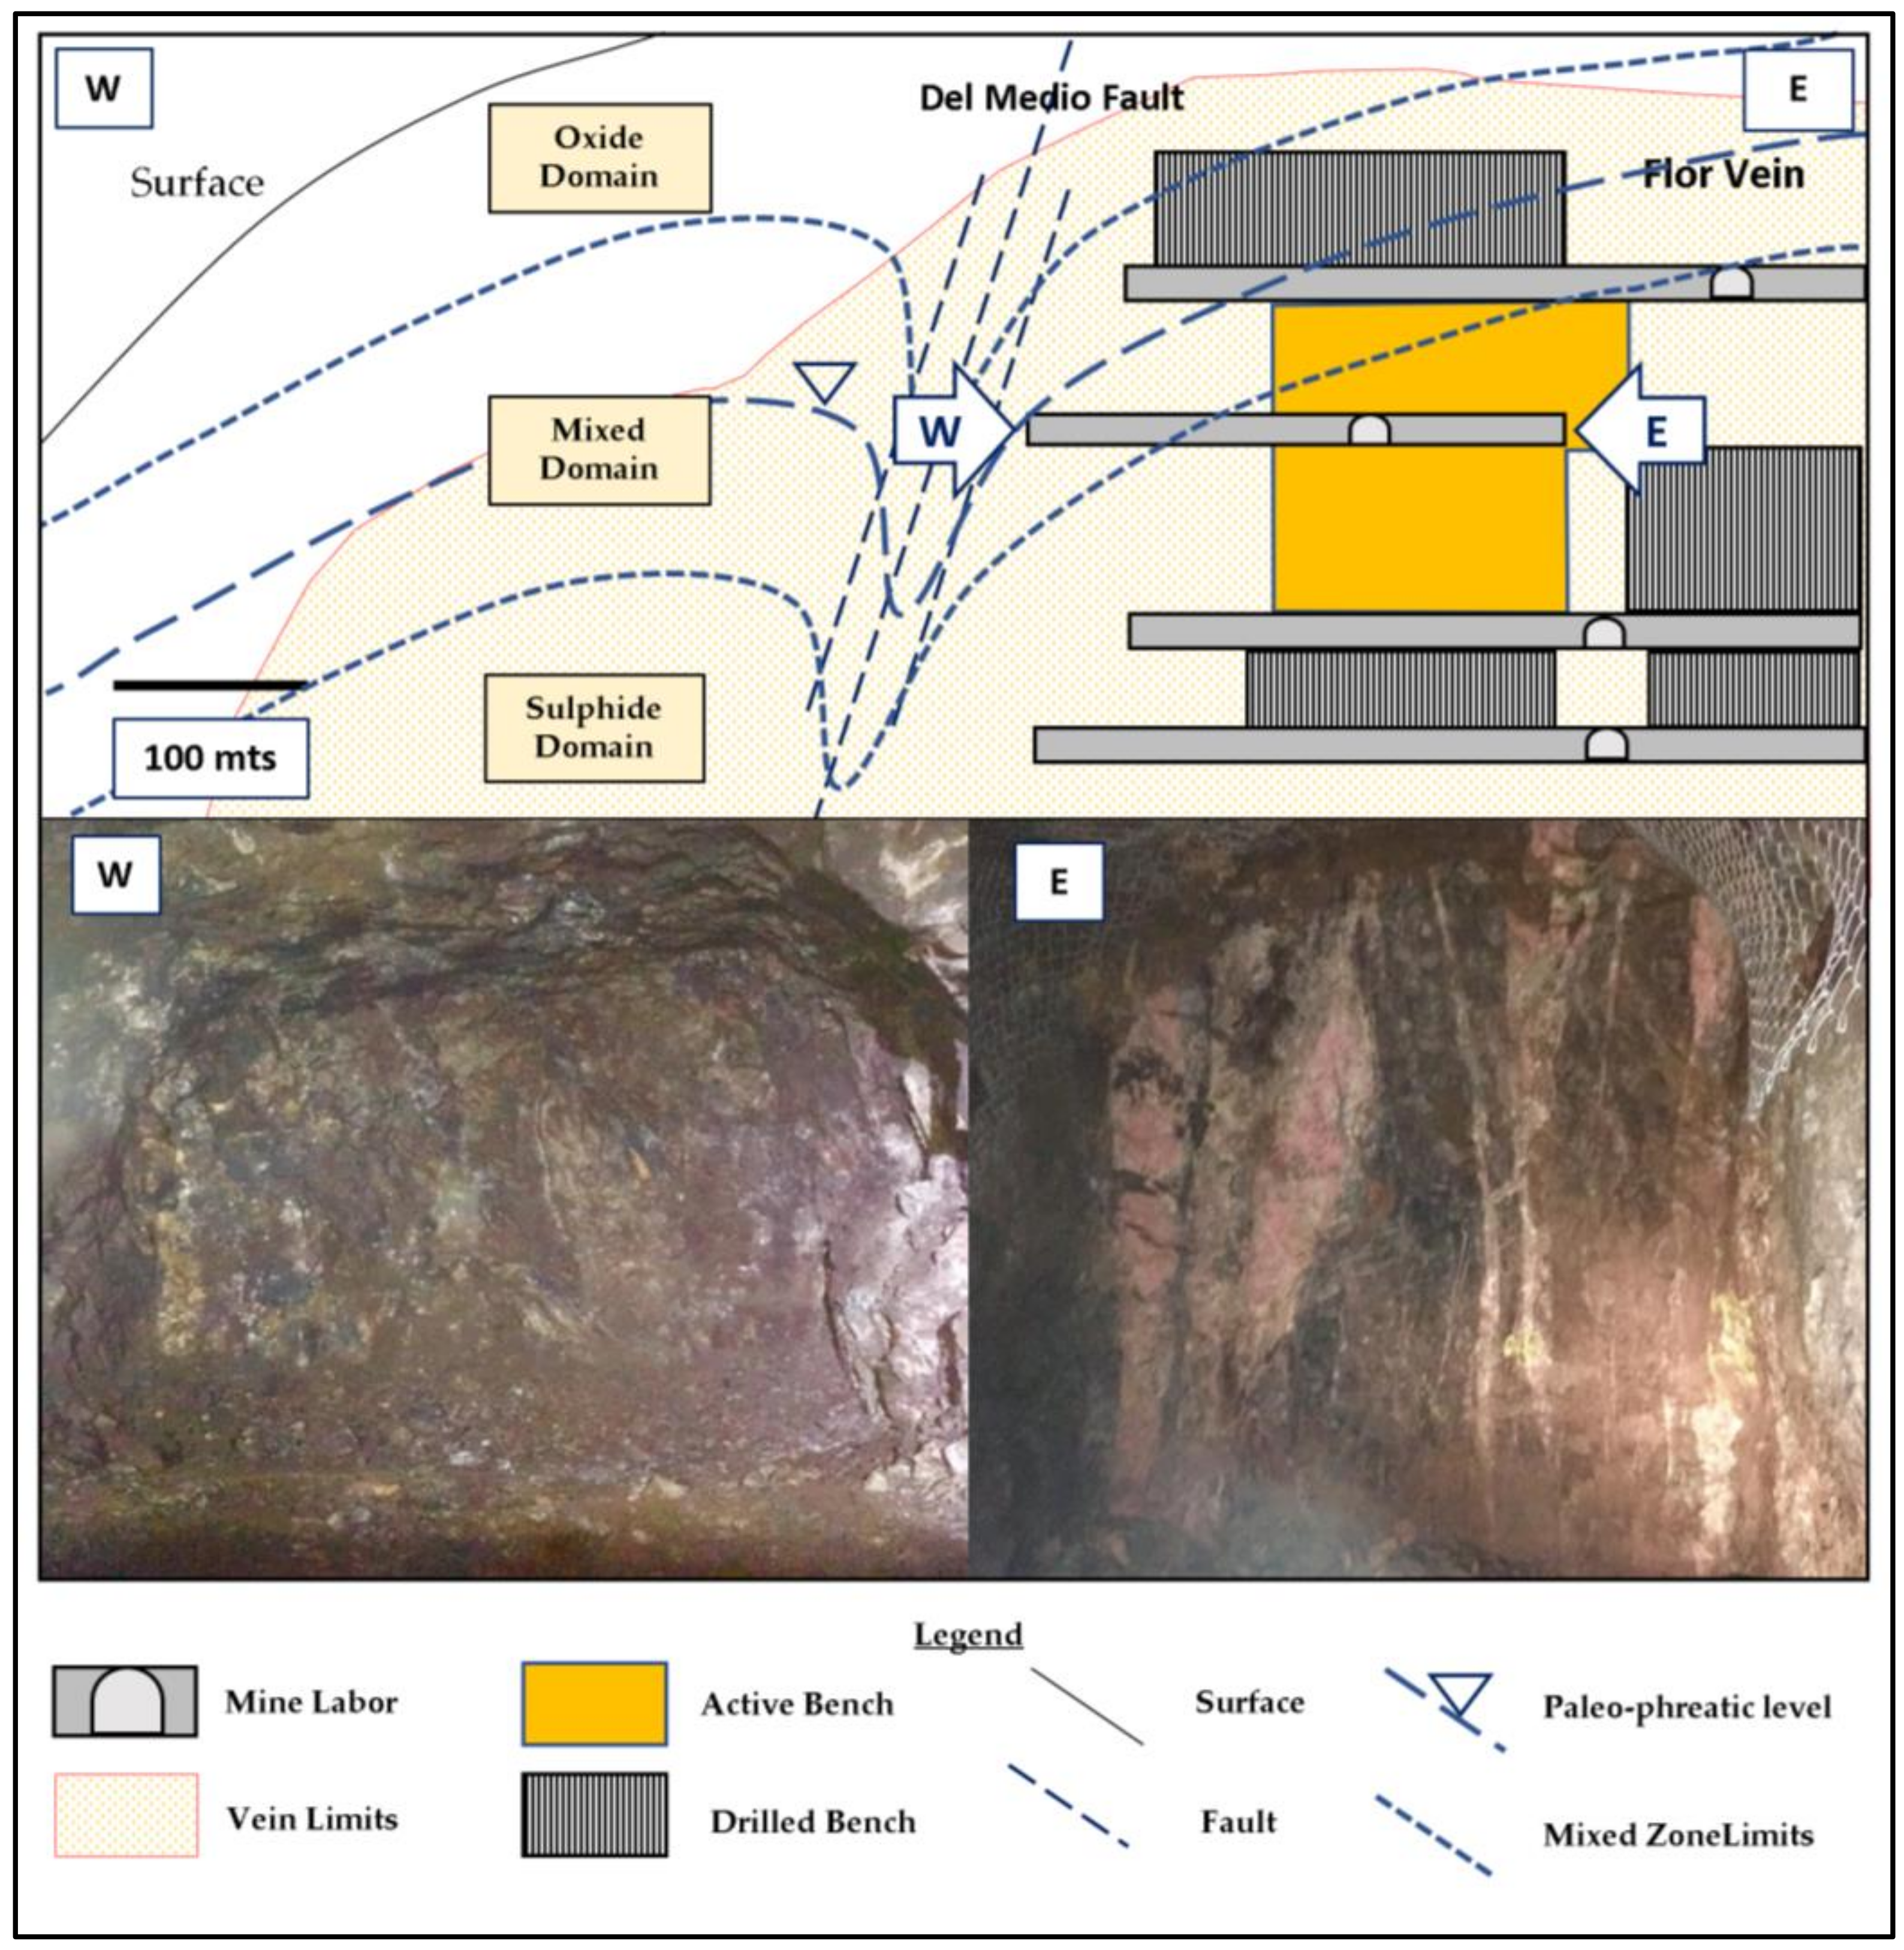
The process mineralogy can be subdivided based on redox conditions, which reflect the spatial interaction of the ore with the paleo-water table. This level indicates the depth to which oxygen affected the primary vein mineralogy by altering sulphides, leaching base metals, and transporting them to lower levels. The geometry of the paleo-phreatic level has two main controls: (1) the landscape, along which the underground water level follows the shape of the surface topography; and (2) the intersection of veins with major faults. In both cases, this level is modified by these features reaching deeper levels. An example of this mineralogical contrast due to the reshaped paleo-water table level is the Flor vein, which interacts with the Del Medio fault system (
Figure 2). Within just a few meters in the horizontal, there is a remarkable change in redox and related mineralogy due to the high permeability generated by the intersection of the vein with the fault system (
Figure 3).
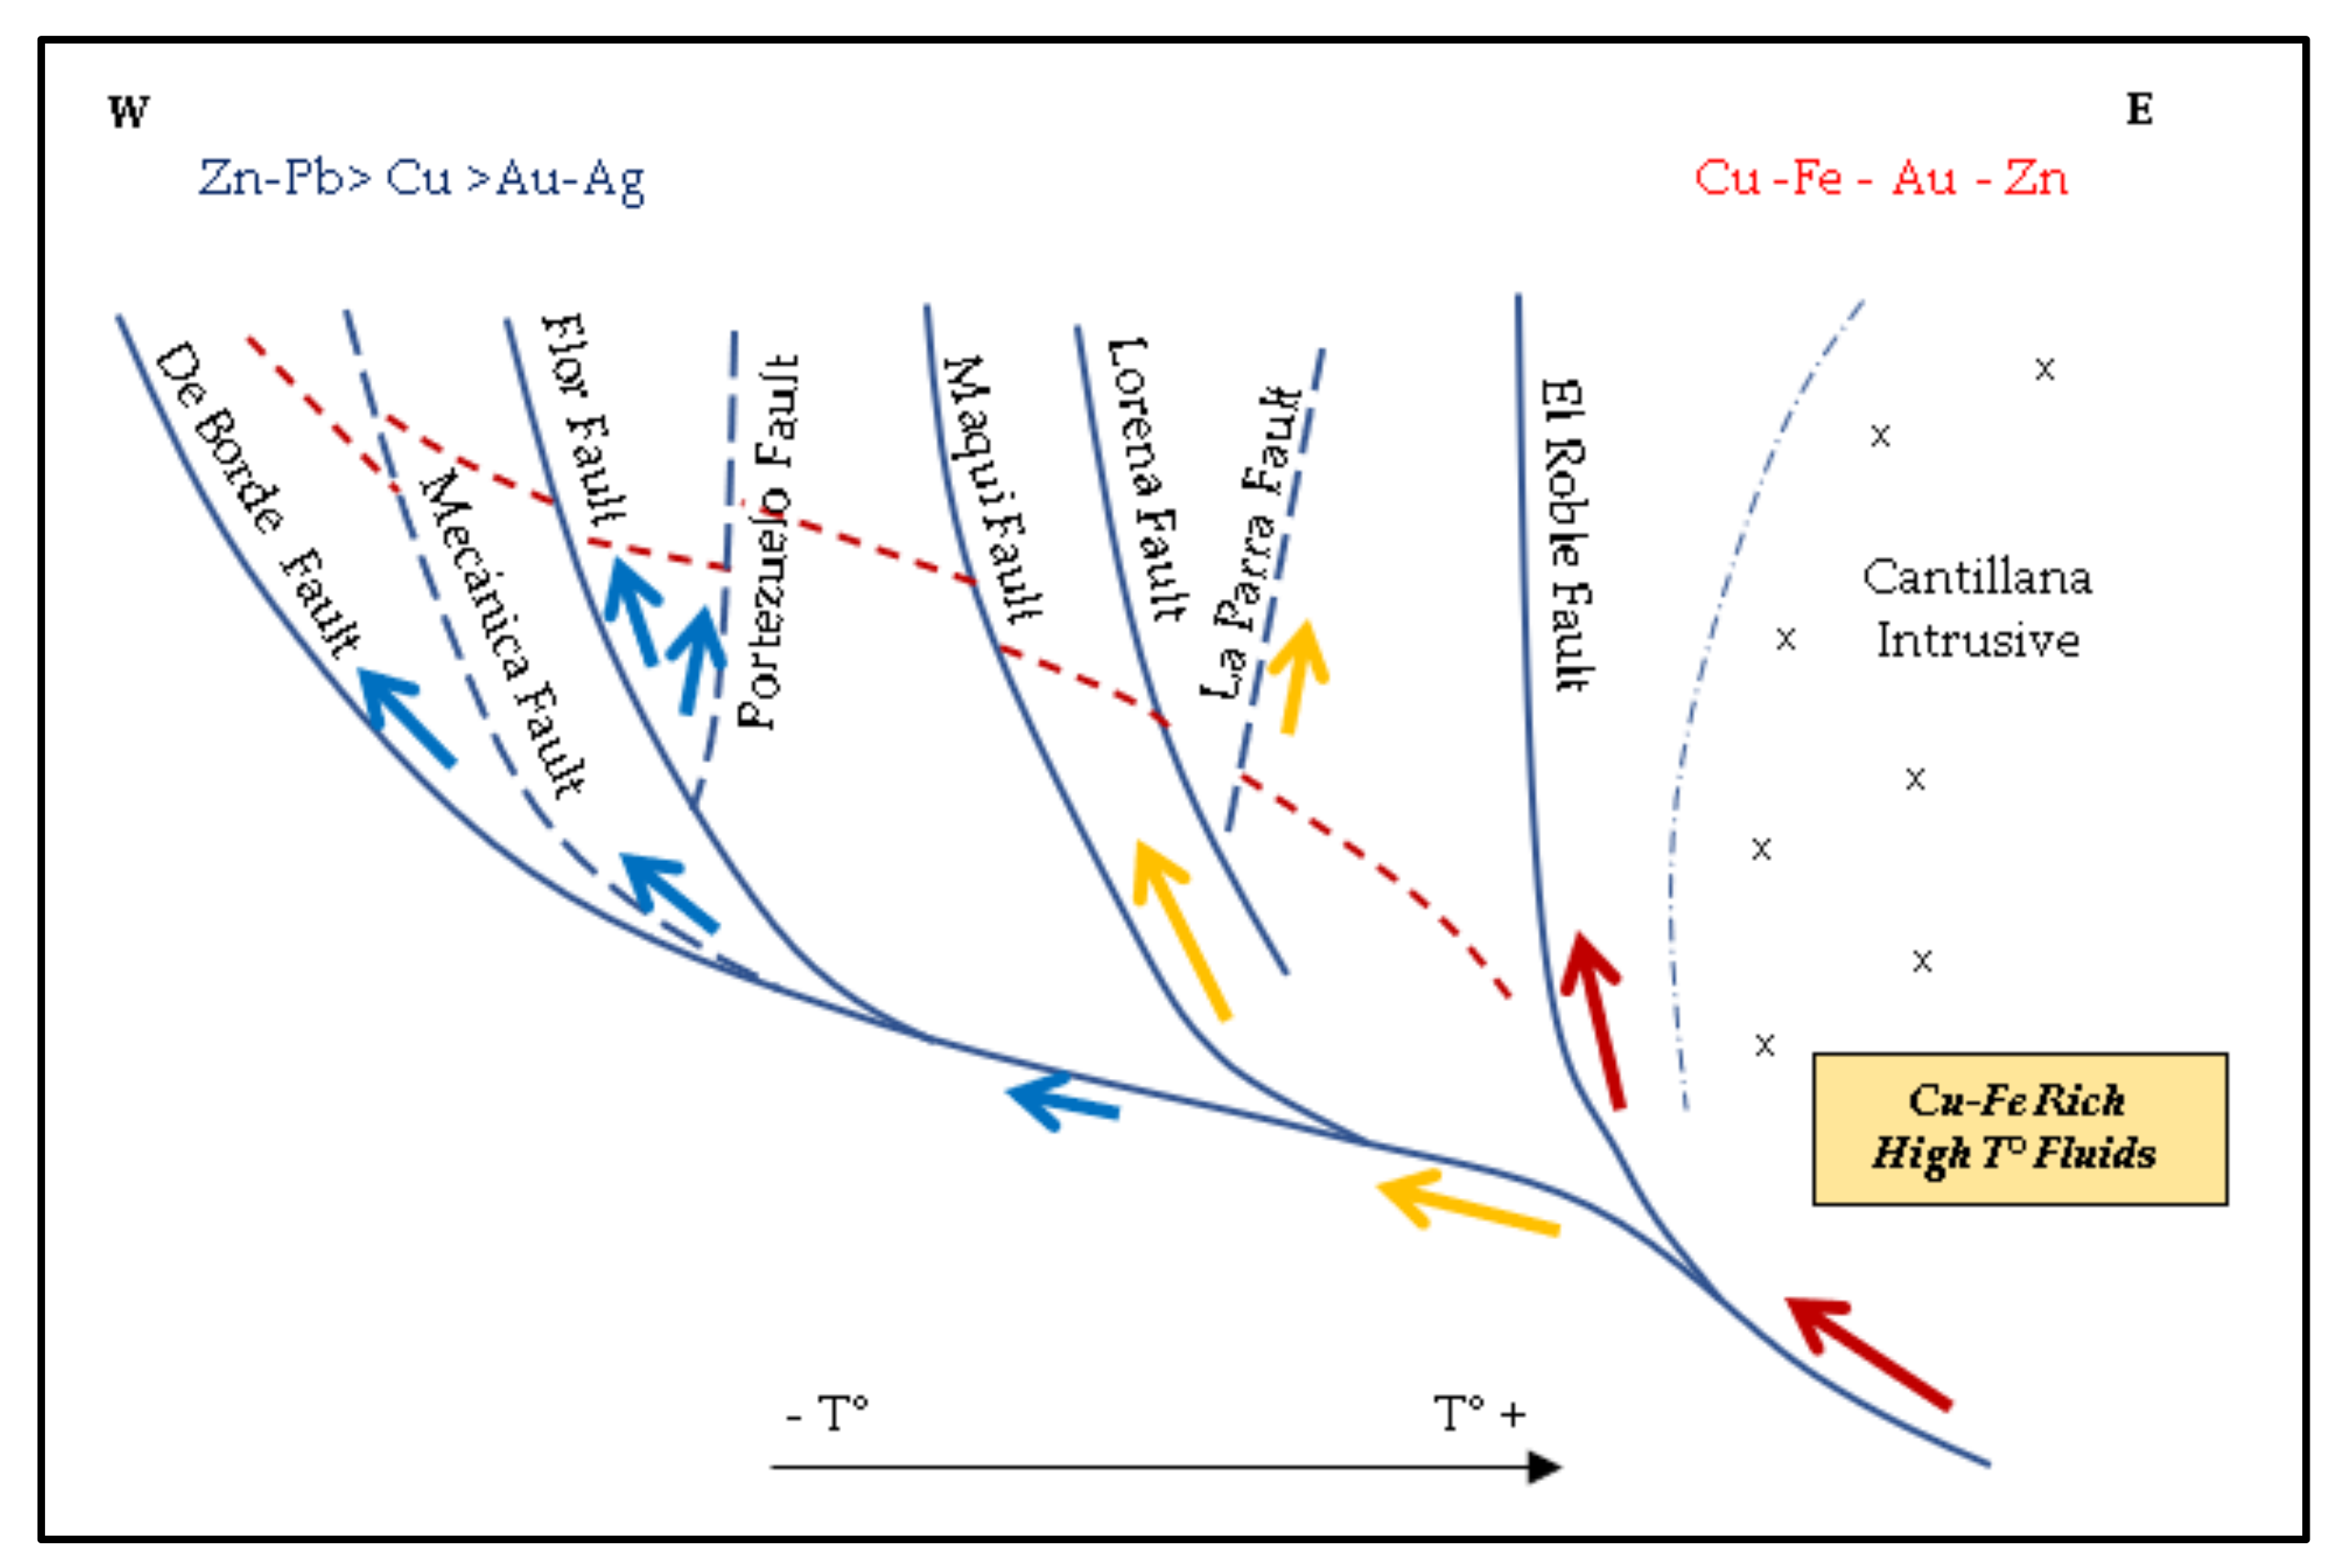
According to the regional scale deposit model proposed by Matthews [
9], base metal concentrations in the Alhué district increase at deeper levels and to the east. This increment is mainly due to a high temperature copper-iron rich fluid interpreted to have migrated through a listric fault system, acting as a feeder channel for these elements (
Figure 4). This generates two main types of mineralisation: (1) polymetallic suites in the western part of the district, characterized by the presence of Zn-Pb-Fe base metal sulfides, with Ag-Au-bearing quartz veins ± epidote-hornblende-magnetite chlorite, garnet, rhodonite, and tourmaline; and (2) Cu-Au sulfide-bearing quartz veins to the east, with magnetite, chlorite, hornblende, epidote, and zoisite.
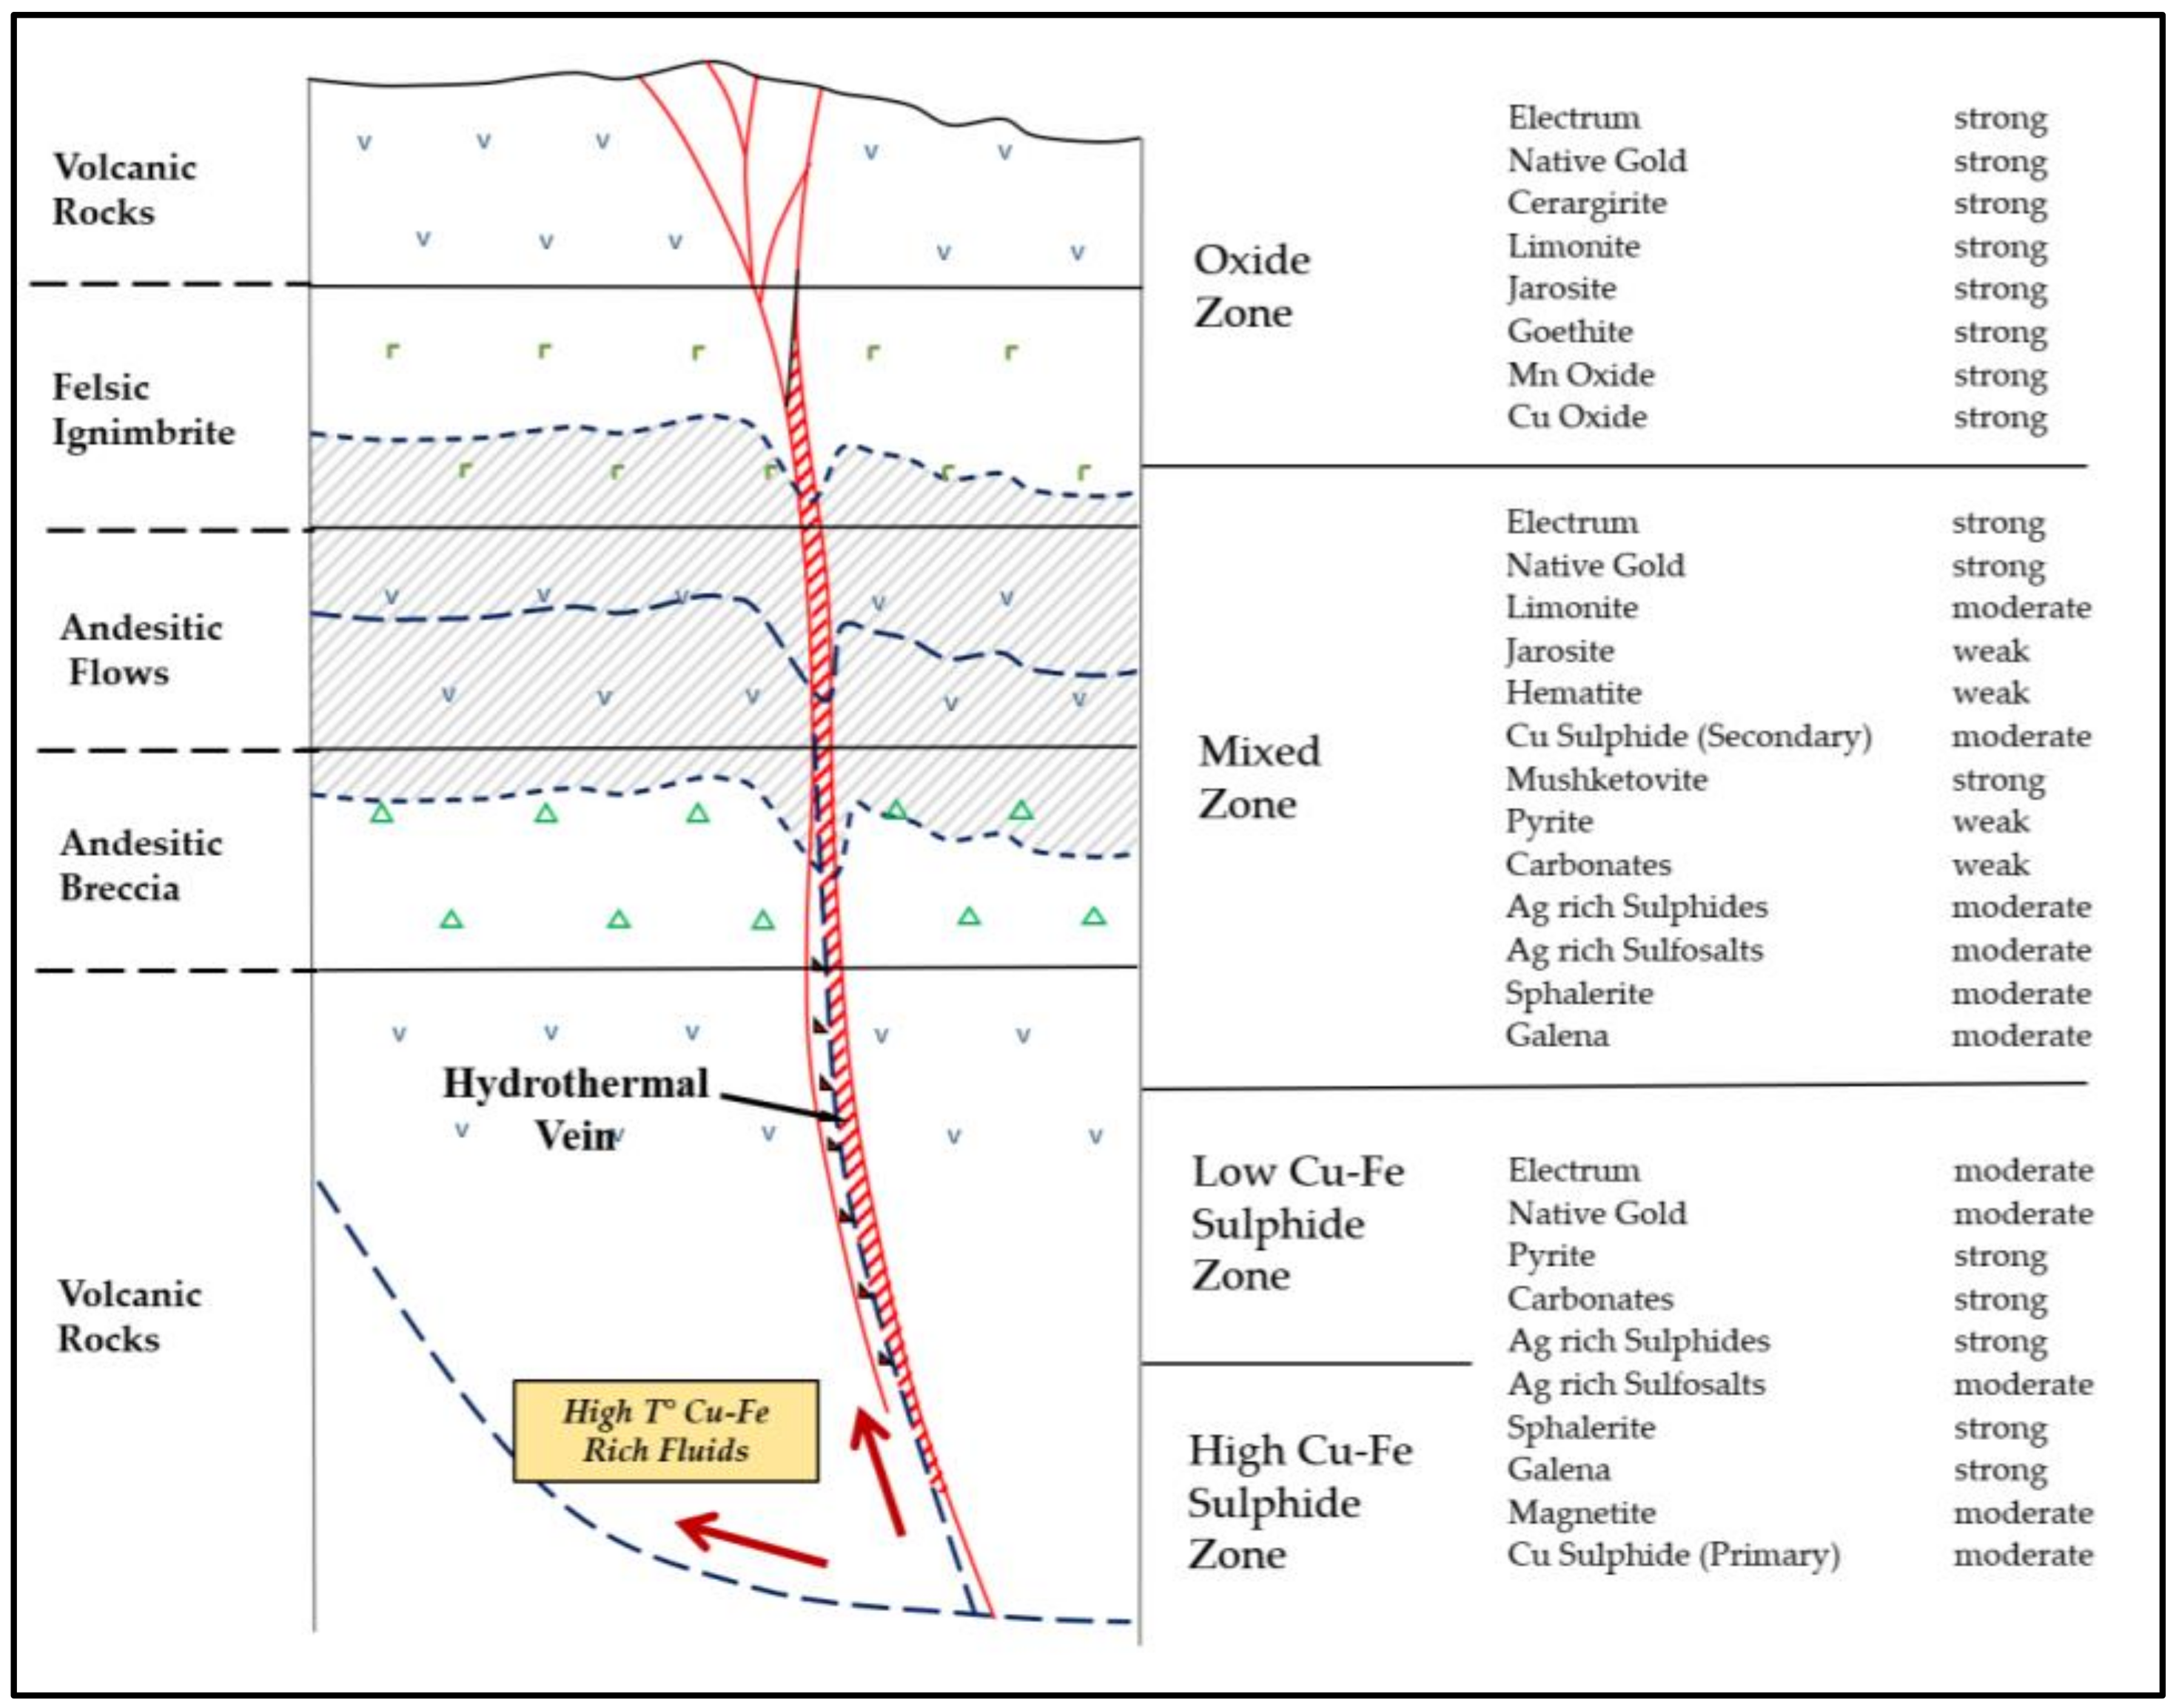
These geological controls divide the deposit into four main domains (Oxide, Mixed, Low Cu Sulphide, and High Cu Sulphide zones), each with different geometallurgical responses based on the resulting mineralogy (
Figure 5). The primary (sulphide) zone is the largest and most important domain within the Alhué district, and consists of predominantly sphalerite, galena, chalcopyrite, and pyrite mineralisation. Critical to the current study is the occurrence of bornite (which is a comparatively high consumer of cyanide), which seems to accumulate sporadically within the deeper zones under the influence of mesoscopic structural controls. Silver occurs as native silver, electrum, argentite, pyrargyrite, and polybasite, and is strongly associated with vein-controlled quartz and sulphides [
8]. Silver has also been identified as inclusions in sphalerite and hessite grains. Iron oxide can also occur locally as magnetite in this zone, but is related to primary host-rock formation and/or epigenetic hydrothermal alteration [
4]. This zone can be further subdivided into two subdomains, as a function of depth and Cu-Fe content (low vs. high).
3. Mineral Processing at the Florida Mine
The mineral processing complex at Florida Mine is composed of two plants [
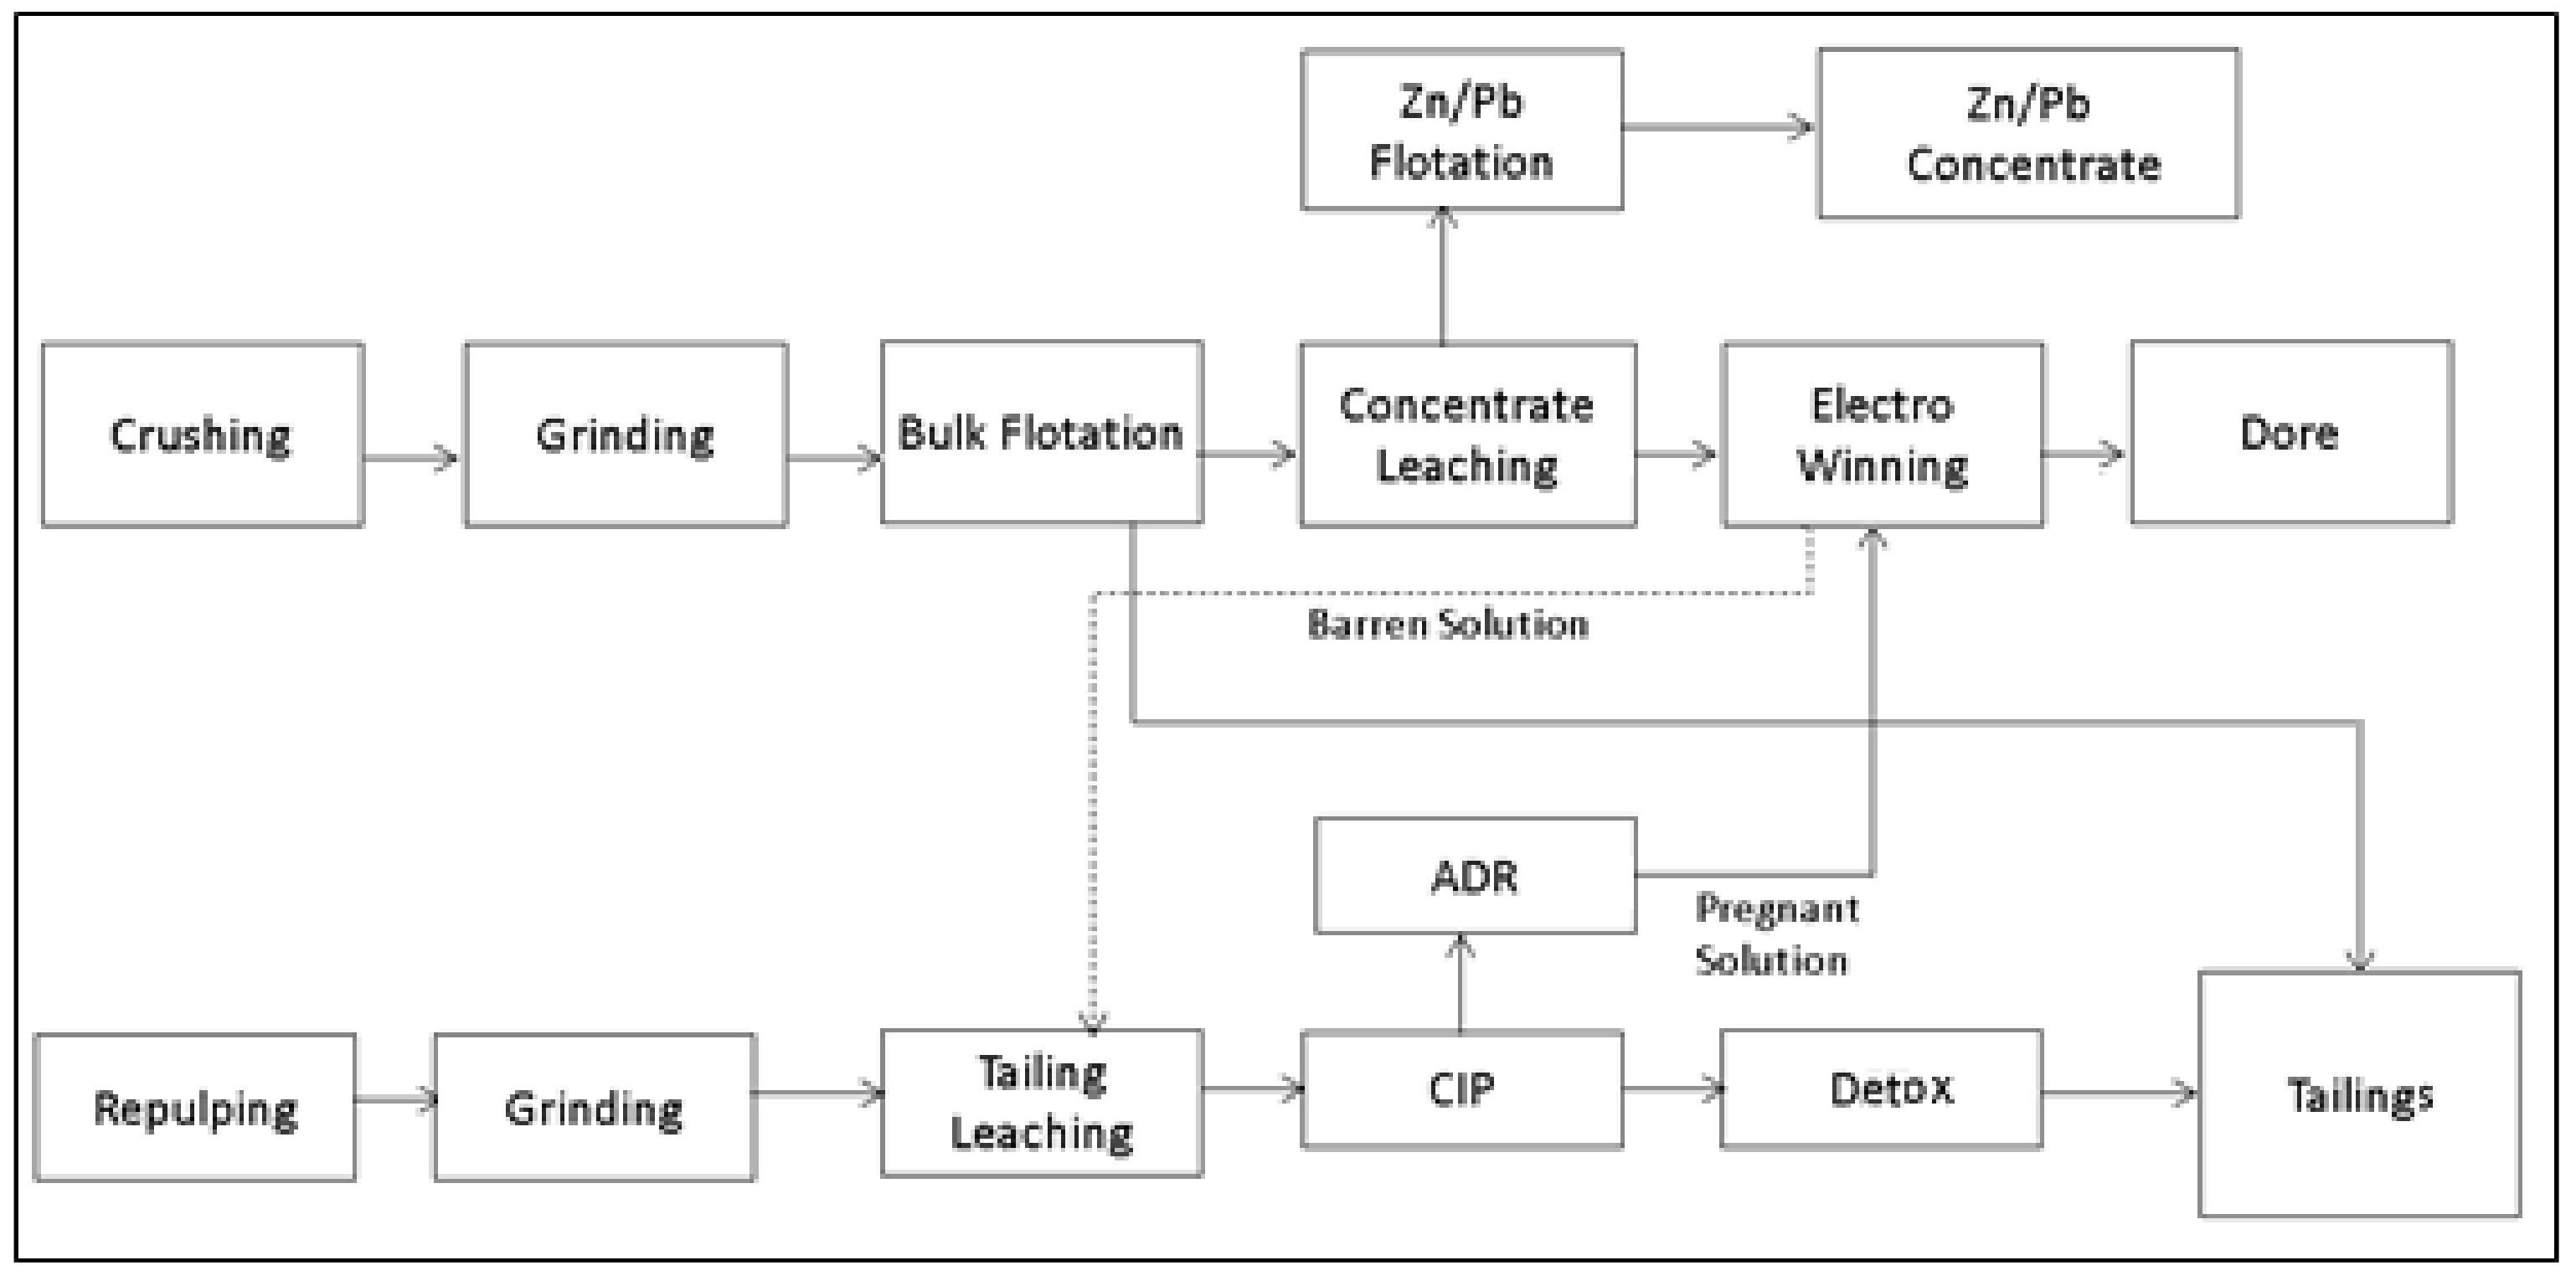
10]: the concentrator-leaching plant that occupies the upper half of
Figure 6, and the tailings treatment plant that occupies the lower half; this so-called ‘tailings treatment plant’ was initially for the reprocessing of historic tailings (fed by repulping and subsequent grinding), but since 2017 has been integrated with the main concentrator-leaching plant as depicted in
Figure 6. Indeed, the adsorption–desorption recovery (ADR) operation now feeds into the electrowinning operation, as the barren solution is sent into the so-called tailings leach process, which itself leads into the carbon-and-pulp (CIP) operation and cycles back through the ADR. This process configuration (
Figure 6) allows a communal detoxification (de-cyanidation), prior to transmission into the tailings dam.
The nominal processing capacity of the concentrator-leach plant is 2400 t/day of ore, producing variable rates of doré metal and Zn-Pb concentrate [
10]. The crusher is fed with three different size classes of run-of-mine ore: oversize (5–20 inches), middle size (1–4 inches), and small size (less than 1 inch); each of these streams is treated according to predetermined regimens within a series of primary, secondary, and tertiary crushing, resulting in fragments that are 100% below 0.39 inches, which form the feed stockpiles for subsequent grinding and bulk flotation. The grinding circuit is composed of three mills which can collectively exceed the nominal throughput by 25%; this provides operational flexibility to control recirculating loads, such that the bulk flotation feed has a P80 size of 120 microns. The bulk flotation consists of 15 cells, producing (1) a gold-rich concentrate that is subject to cyanidation leaching in tanks, and (2) a non-cyanided tailings stream that is send to the tailings dam. Following the concentrate leaching and subsequent electrowinning, the precious metals are precipitated as cathodic mud, which is then filtered and dried prior to smelting and final conversion into doré metal bars.
Subordinately, the underflow of the concentrate-leaching thickener is filter-pressed to produce a 10% humidity cake, and is subsequently fed into the zinc-lead flotation plant to produce a sulphide concentrate that is 40% Zn and 8% Pb. Moreover, the reprocessing of barren solution within the so-called tailings leaching has resulted in a 60% recovery of combined gold and silver value, which contributes to an overall recovery at the Florida Mine that exceeds 90% [
10].
4. Copper and Iron Minerals in Cyanide Solution
Cyanide can leach different metals, with the resulting ions grouped into several categories depending on the type and strength of the bond [
11]. This interaction defines its stability in a solution, wherein iron and gold have a high affinity with the CN ion, generating a strong bond. On the other hand, copper can have different stability bond levels, from weak to medium intensity.
The majority of the copper minerals are highly soluble in cyanide solution (
Table 1) except for chalcopyrite, which has limited solubility [
12]. Copper is indeed one of the major cyanide consumers because it forms various cyanocomplexes [
11]. As a result, the dissolution of copper is generally undesirable during gold and silver leaching extraction processes. This can cause higher cyanide consumption, slow the dissolution rate of gold and silver, interfere with subsequent recovery processes from the pregnant solution, and ultimately contaminate the final product. In addition, some copper minerals (e.g., chalcopyrite) are capable of removing gold from solution by reduction at the mineral surface, exhibiting reversible preg-borrowing characteristics in cyanide-deficient solutions [
11]. Chalcopyrite is the least soluble sulphide mineral that is commonly found in gold and silver deposits. Chalcocite, bornite, enargite, and covellite have medium to high solubilities, and copper oxides and carbonates are all highly soluble. In addition to copper cyanide complexes, the copper sulphide minerals (e.g., chalcocite) react with cyanide to form soluble sulphide ions (S
2−). These ions may react with cyanide to form thiocyanate ions or form protective coatings on particle surfaces and thus hinder the cyanidation process [
11]. The deeper zones encountered at the Alhué deposit are problematic when they have a high bornite-to-chalcopyrite ratio, e.g., exceeding 1:5 as opposed to typical values of 1:20.
On the other hand, iron-bearing sulphides that are commonly associated with gold mineralisation include pyrite, marcasite, and pyrrhotite. Weathering and oxygen action can result in the formation of different iron oxides, hematite and jarosite being the most common. Oxidized iron minerals—such as hematite, magnetite, and goethite—as well as the Fe-rich carbonate mineral siderite, are considered refractory to a cyanide solution. However, complex iron carbonates such as ankerite decompose to some extent in weakly alkaline (<10 pH) cyanide solutions, and form ferrocyanides [
11]. Therefore, hematite, magnetite, goethite, siderite, and iron silicates are virtually insoluble in alkaline cyanide solutions [
11]. Though some Fe-rich and other complex carbonates decompose in low-alkalinity solutions, they are mostly unreactive at the higher pH values usually applied for leaching [
13].
Iron sulphides, such as marcasite and pyrrhotite, are more reactive than pyrite in a cyanide solution. Though pyrite is the most common sulphide mineral occurring in gold ore, it thankfully interferes less with the cyanidation process [
14]. Marcasite and pyrrhotite will react with cyanide and form iron cyanocomplexes, soluble sulphide ions (S
2−), and thiocyanate ions as major undesirable products. Although Florida has not observed pyrrhotite and marcasite as being major contributors to increased cyanide consumption, it has nonetheless been reported that ferrocyanide ions do have an inhibiting effect on gold cyanidation [
15]. This can be explained by the additional consumption of oxygen and cyanide required for the formation of ferrocyanide ions. In general, however, soluble sulphide ions at very low concentrations can retard gold dissolution almost completely [
16].
Increased cyanide (CN) consumption related to ores containing elevated concentrations of copper and iron minerals has been a primary concern for process engineers at the Florida Mine in recent years. This has led to a restructuring of geometallurgical units to better predict consumption rates through an assessment of incoming ore feed attributes. These new geometallurgical units are (1) in alignment with the four geological domains illustrated in
Figure 5—namely, the Oxide, Mixed, Low Cu Sulphide, and High Cu Sulphide domains; and (2) are further grouped by a combination of metallurgical behaviour, field-observed copper, and iron mineralogy coupled with interpreted redox states and process impurities including CuS and FeS, all of which relate to sodium cyanide consumption. The sporadic presence of bornite Cu
5FeS
4 has been difficult to predict, but is directly related to spikes in cyanide consumption. In practice within the Florida process, it has been especially challenging to optimize plant operations when feeds are coming in simultaneously from two different geometallurgical units. Such circumstances are confronted, for example, as the Flor Vein intersects with the Peumo Fault (
Figure 4), causing discontinuities in the redox state and an extreme increase in cyanide consumption. This has caused a rethinking of the approach to stockpile management, so that the plant can be fed only by blends that are well understood by the operators. Following the approach of Navarra et al. [
3], these stabilized feed blends have been linked to system-wide operational modes.
5. Deterministic Analysis of Operational Modes
The mineralogical variation confronted by mines within the Alhué district may be managed by alternating between modes of operation. These modes provide an integrated response to changes in feed mineralogy and other operational conditions within the mineral value chain. Processing plants are generally designed to maximize profits while respecting technological limitations, environmental norms, and tactical constraints that align operational objectives with long-term strategic goals. The decision to alternate between modes depends on current and forecasted stockpile levels. Interestingly, the selection of thresholds that would trigger a mode change is related to the classic reorder-quantity (RQ) problem from inventory theory [
17], as described in [
3]. Most importantly, operational modes are conceived with respect to system-wide performance rather than local metrics that only consider isolated unit operations.
Even within relatively short timeframes, it is uncertain whether the decreasing feedstocks will be replenished by the incoming mined material; unexpected changes in ore feed characteristics can occur abruptly and lead to shortages of a particular ore type from a particular geometallurgical unit. For an underground mine, this variation in stockpile levels is typically intensified due to a variety of factors, including: (1) a large number of concurrent active workfaces (ore type variability); (2) ore grade-driven mine planning that does not consider geometallurgical inputs; and (3) the uncertainty caused by complex extraction methods, which rely on the coordination of many variables (e.g., ventilation, drainage, equipment availability) to meet planned production.
Specifically at the Florida Mine, the most significant risk to the metallurgical process is the variability in cyanide consumption related to a production imbalance from sectors with varying concentrations of impurities; the deeper zones in particular may have local accumulations of bornite which is a relatively high cyanide consumer in comparison to chalcopyrite (
Table 1). The risk of stockout of a feed class is mitigated through the alternation of operational modes; that is, when a stockpile falls below a critical level, the system changes to a different (possibly less productive) mode so that the stockpile may be replenished, prior to resuming the original mode. The approach of Navarra et al. [
3] is to use discrete event simulation (DES) as a dynamic representation of feed stockpiles that are continually fed by mining operations, while also being continually drawn upon by the plant. The DES framework is capable of simulating extended operating periods in order to optimize the trigger points that would induce a change in operational mode, as described in the following section. Within the current context, the objective of the framework is to maximize throughput while avoiding spikes in cyanide consumption. This is in agreement with the experiences at the Florida Mine, in which a moderate decrease in throughput can be justified, if it reduces the risk of surges in cyanide consumption.
Moreover, the current sample computations consider geometallurgical units characterized as “sulphide with high CN consumption” and “sulphide with low CN consumption”, which shall be referred to as ores 1 and 2, respectively. These tend be observed within the deeper intrusive-influenced zones of the Alhué district (
Figure 5); however, the actual classifications of the Florida Mine consider additional attributes including the prevalence of the different copper-bearing minerals listed in
Table 1.
For the deterministic analysis of operational modes, Navarra et al. developed the following equation to describe the expected mass balance [
3]. It considers two modes of operation, A and B, and computes the anticipated portion of time that the system should spend in under each of the modes
in which,
tA = duration of time devoted to mode A;
tB = duration of time devoted to mode B;
rA = ore processing rate under mode A;
rB = ore processing rate under mode B;
w1A = weight fraction of high CN (Ore 1) consuming ore within the feed of mode A;
w2A = weight fraction of low CN (Ore 2) consuming ore within the feed of mode A;
w1B = weight fraction of high CN (Ore 1) consuming ore within the feed of mode B;
w2B = weight fraction of low CN (Ore 2) consuming ore within the feed of mode B;
w1D = weight fraction of high CN (Ore 1) consuming ore that is expected from the deposit;
w2D = weight fraction of low CN (Ore 2) consuming ore that is expected from the deposit.
Indeed, the alternation between modes A and B provides the mining system with a degree of freedom to accommodate the balance of ore that is coming from deposit—i.e., the deposit (w1D, w2D) is balanced by a combination of (w1A, w2A) and (w1B, w2B).
The overall throughput is determined by time-averaging,
which, upon substitution with Equation (1), can be expressed as
Table 2 contains data that is typical of the Florida Mine in confronting the boundaries between typical high and low CN consuming ores, which we take to be ore types 1 and 2, respectively. Based on these parameters (
Table 2), Equation (1) gives
tA/
tB = 1.8 from which it can be determined that the system will, on average, be in Mode A for 64% of the time (taken asymptotically over an infinite time horizon), and Mode B for 36% of the time. Moreover, Equation (2) indicates an average throughput of 2.6 kt/d.
In practice, attaining a throughput of 2.6 kt/day would require stockpiles that act as a buffer against geological variation, and to maintain stable feeds, especially avoiding feed shortages. Intuitively, larger stockpiles provide a greater protection against the risk of stockout. However, larger stockpiles also require larger storage pads and handling equipment, as well as increased operating costs to manage the lifting and moving of material [
18]. Furthermore, a deterministic analysis cannot determine the tradeoff between stockpile sizes and the risk of shortages of the different ore types.
From the data in
Table 2, it can be observed that Mode A draws upon the low CN consuming feed (Ore 2) at a faster rate than is replenished by the deposit on average (i.e., 45% > 40%). In case there is a stockout of Ore 2 while the system is configured for Mode A, then a contingency mode is applied. Specifically, the system runs with only the high CN consuming ore (Ore 1), which allows the Ore 2 to be replenished, before reverting to the regular balance of 45% Ore 1 and 55% Ore 2. However, the contingency mode can only process 2.4 kt/day which equates to 85% of the regular mode capacity, and causes an undesirable 30% spike in per-ton cyanide consumption. Conversely, Mode B presents a risk of stockout of the high CN consuming ore, which coincides with a 30% decrease in cyanide consumption; however, the throughput is reduced to 50% so as not to ‘waste’ the low CN consuming ore.
The data in
Table 2 demonstrate the conflicting objectives of maintaining a high throughput (close to 2.6 kt/day), while mitigating the risk of cyanide consumption spikes. Although Mode A is more productive under regular operation, it presents risks of significant spikes in cyanide consumption in case of Ore 2 shortages. Ideally, with sufficiently large and appropriately managed stockpiles, the contingency modes would never be applied, and the deterministically balanced value of 2.6 kt/day can be attained. Indeed, the tradeoff between the two objectives is more pronounced with smaller stockpile levels, as demonstrated in the following section, and becomes increasingly sensitive to the triggering condition of Mode B.
6. DES Computations
The main mine, as well as other mines in the Alhué district, must consider the possibility of expanding into new areas that have greater mineralogical variability, and which are increasingly dominated by ores with high contents of cyanicidal impurities [
9,
12], particularly copper. Thus, the current computations consider the low cyanide consuming ore (Ore 2) to be in shorter supply; we suppose that this ore is geostatistically less likely to have localized accumulations of bornite possibly due to structural controls, i.e., with bornite-to-chalcopyrite ratios that are consistently below 1:20. The current framework considers a forecasted average of 40% type 2, and there would in fact be variation surrounding this average, hence the need to manage stockpiles and alternate between operating modes, as described in the previous section. Over a longer timeframe, as new depths are reached, the portion of Ore 2 may continue to decrease, as suggested by
Figure 5, causing Mode B to be increasingly favored over Mode A. For demonstrative purposes, the current simulations consider a sufficiently short timeframe such that the average of 40% Ore 2 is regarded as stationary (although it would be possible to test different values, e.g., 35%, 30%, etc., or to implement a declining trend). In particular, the 40% average should result in a 2.6 kt/day throughput as predicted by Equation (2), but only if the stockpile levels are sufficiently high to absorb the geological variation, and if there is an appropriately tuned trigger point to decide when to apply Mode B.
In adapting the DES framework of Navarra et al. [
3], geological variation is represented as follows:
At any moment in time, the stockpiles of Ore 1 and Ore 2 are being fed from rockfaces that are collectively called a “parcel”.
Within each parcel, a fixed portion of the ore is Ore 1, and the remaining ore is Ore 2.
Each parcel contains a total of between 10 and 40 kt of ore, following a uniform distribution.
When the excavation of a parcel is completed, a subsequent parcel is randomly generated, considering a 40% chance that the new parcel is a continuation of the same lithofacies and a 40% chance that the parcel is of a new lithofacies.
If the new parcel is a continuation of the previous lithofacies, then it contains a portion of Ore 2 that is only slightly deviated from the previous parcel; this deviation is randomly generated according to a Gaussian distribution with mean 0 and standard deviation of 5.
If the new parcel corresponds to a new lithofacies, then it contains a portion of Ore 2 that is randomly generated according to a Gaussian distribution with mean 0 and standard deviation 1.
The framework supports more elaborate representations of geological variations, including the confluence of geostatistical simulations and mine planning [
17], which is beyond the scope of the current paper.
The completion of a parcel is itself a discrete event. Additional discrete events occur within the framework, including the shutdowns which are simulated to occur every thirty days, and last for one entire day. In actuality, the shutdowns at the Florida Mine can last for longer than one day, and the campaign cycles are not always regular. The DES framework can represent random variation in the cycling of shutdowns and production campaigns, including equipment breakdown. For simplicity however, the current computations consider a regular cyclic schedule of 29 days of production followed by a one-day shutdown.
At the moment of shutdown, a decision is made as to whether the system should be configured for Mode A or for Mode B, which is then maintained for the entirety of the subsequent production campaign. If the level of Ore 2 (i.e., the low CN consuming ore) is sufficiently low so as to present a stockout risk, then Mode B is selected; otherwise, the more productive Mode A is chosen. As indicated by
Table 2, a campaign of Mode A is at risk of stockout because it consumes Ore 2 faster than the (expected) replenishment rate; similarly, a campaign of Mode B is at risk of stockout because it consumes Ore 1 faster than the (expected) replenishment rate. If the actual replenishment rates are lower than anticipated, resulting in shortages of either ore type, then the contingency modes are applied, as illustrated in
Figure 7.
Following the approach of Navarra et al. [
3], there are two operational policy parameters, a.k.a. control variables, that characterize the decision-making:
The target stockpile level, computed as the sum of the available ore types (i.e., the levels of SHCN and SLCN). More elaborate operational modes are supported by the framework, including mid-campaign decisions to hasten or postpone the shutdown. However, the original two-parameter formulation of Navarra et al. [
3] is sufficient for demonstrative purposes.
Table 3 is the result of simulating 5.5 kt of excavated ore, or roughly 2000 days, under various combinations of X and Y values; each case shows the average value of 100 replicas, ± one standard deviation. For all cases, it is observed that deterministically optimal throughput of 2.6 kt/day is attained, given sufficiently large Y values, as predicted in the previous section using Equation (3). The approach toward 2.6 kt/day is better illustrated in
Figure 8, which includes additional simulations.
As for cyanide consumption, the simulation results show that it is possible to stabilize this process parameter by applying the policies of operating modes, where in most cases, the system achieves an average consumption of approximately 2.04 kg/t (
Table 3).
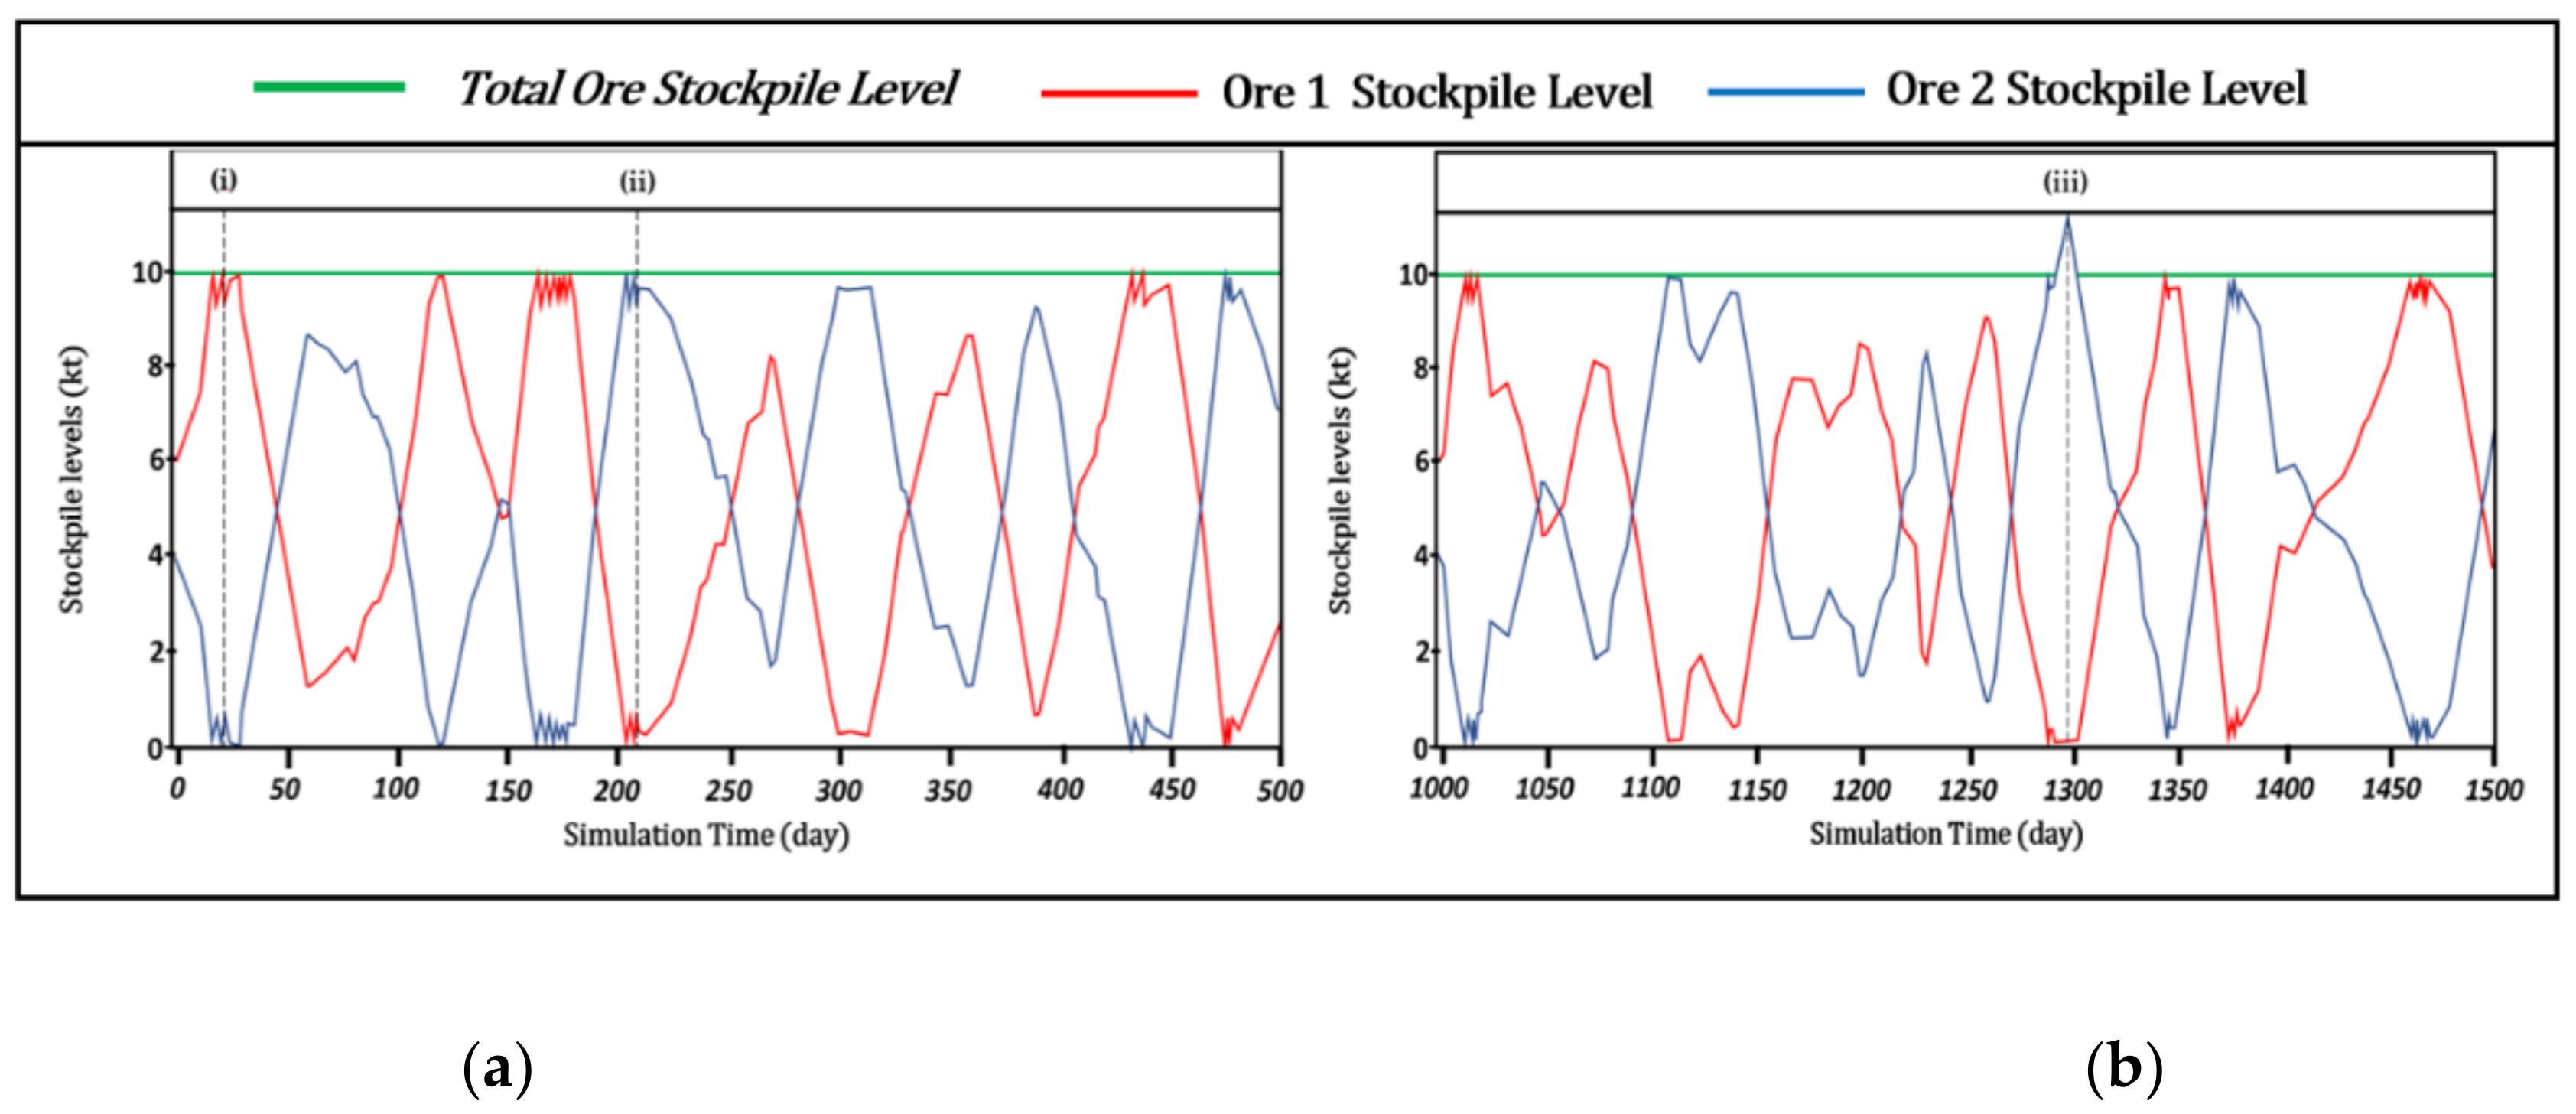
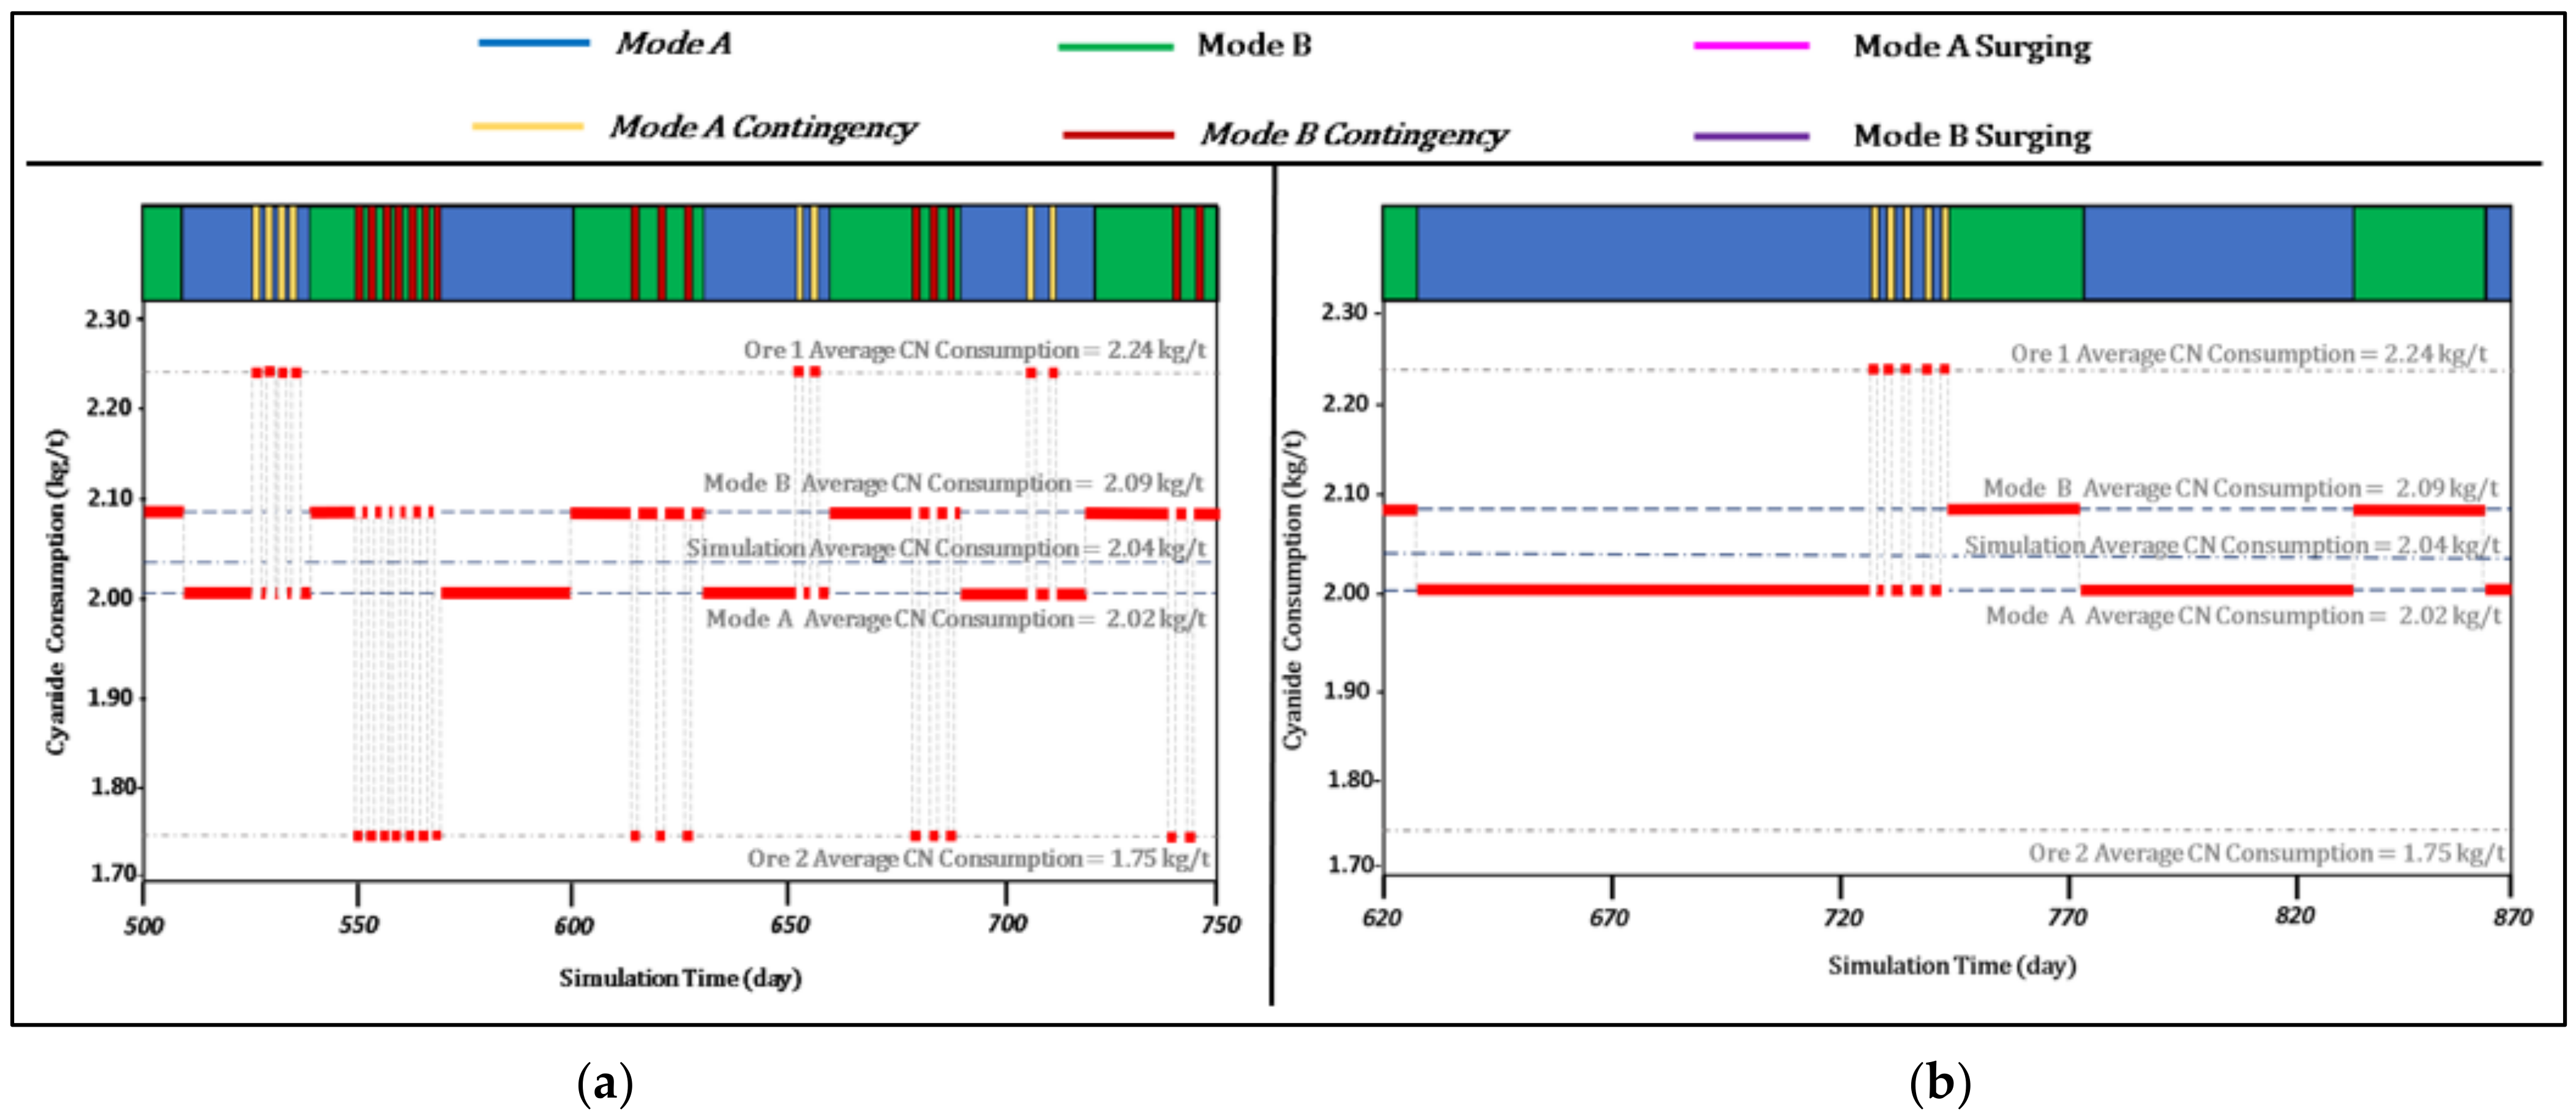
With a low target ore stockpile level, the system is forced to constantly change its operational mode, which means that the cyanide dose must be adjusted frequently over short periods (
Figure 9a) to handle the varying ore type proportions and related cyanide requirements (recall
Table 2). The system achieves higher stability by maximizing the time spent in Mode A. With the exception of a few events requiring higher CN consumption due to a shortage of ore 2, this scenario allows for a stable cyanide dose over more extended periods (
Figure 9b).
7. Conclusions
For the Alhué mining district, the distribution of metallurgical domains is influenced by (1) the topography of the area where the structure is located, and (2) the permeability of the host rock as a function of the major fault systems that interact with the veins. Both of these factors affect the location of the paleo-water table, which conditions the nature of mineral–groundwater interactions, and thus, the in situ oxidation-reduction state of the minerals. Most importantly for the Florida Mine, transitioning into high CuS-FeS areas can lead to spikes in cyanide consumption, but this can be mitigated through blending in coordination with pre-established operational modes. Furthermore, a continually successful operation may require the periodic revision of geometallurgical units and reconfiguration of the operational modes, thus integrating updated geological interpretations into system-wide quantitative analyses.
In particular, this study demonstrates the use of DES trials to optimize the balance of incoming high and low cyanide-consuming ores at the Alhué mining district and provide better insight into cyanide consumption dynamics within the mining system. Using blending and stockpiling practices as control measures to mitigate potential operational risks, two control variables (target total stockpile and critical levels of low CN consuming ore) were adjusted to stabilize the mass balancing of incoming plant ore feed. The logical decision would normally be to increase the target total stockpile level, particularly with respect to the critical ore level; this typically allows the system to reach higher throughputs that approach the deterministic value, thereby increasing the revenue potential and overall efficiency by optimal use of the milling plant capacity. Nevertheless, it is also possible to achieve the deterministic throughput by the opposite approach of decreasing both control variables, with the potential benefit of reduced operational costs related to stockpile storage and handling.
The target total ore stockpile parameter is vital as an operational buffer to mitigate the risk of ore shortages under geological uncertainty, which can have a direct impact on reagent consumption for mining systems subject to heterogeneous ore feeds in this stabilizing the cyanide consumption, avoiding extreme variability in this parameter. By stabilizing plant feed and target ore blends, the system benefits from extended periods of operation under the most productive set of operating policies (i.e., Mode A), and longer time frames without adjusting the cyanide dose. This has a positive influence on plant operations by steadying process parameters and avoiding constant modifications to reagent dosages caused by rapid changes in ore feed blends. This highlights the importance of stockpile management with a strict but balanced critical stockpile threshold, towards attaining optimal throughput for the system, minimizing the likelihood of potential ore shortages, maximizing mill productivity, and improving overall reagent consumption.


