Abstract
As the fourth-largest industry waste residue, after iron slag, steel slag, and red mud, in China, the comprehensive utilization of nickel slag is imminent. Coal-based reduction combined with magnetic separation was considered an efficient method to extract iron from nickel slag. During the coal-based reduction of Jinchuan ferronickel slag, the growth characteristics and kinetics of metallic iron were investigated in this paper. The metallisation rate and metal iron grain size gradually increased with the reduction temperature or the reaction time, and the coal-based reduction process was divided into the rapid formation period and the aggregation growth period of the metallic phase. The granularity distribution of metallic iron obeyed the Doseresp sigmoidal function, and the activation energy of grain growth at different stages were 52.482 ± 4.448 kJ·mol−1 and 26.426 ± 3.295 kJ·mol−1, respectively. Meanwhile, a mathematical growth model of the metallic iron grains was also established.
1. Introduction
Since the economy and the smelting industry developed rapidly, the quantity of smelter slag has been increasing for a long time in China. Common smelting furnace slag includes steel smelting slag, red mud, copper smelting slag, lead slag, ferronickel slag, and sulfuric acid slag, etc. Approximately 30 million tons of ferronickel slag are emitted each year, accounting for more than a fifth of the global production [1,2,3]. The large stockpiles of nickel slag not only occupy land and pollute the environment, but also bring about severe challenges to the sustainable development of the nickel smelting industry [4,5]. Moreover, abundant metal resources are lost in the smelter slag, which is detrimental for the rational development and utilisation of resources. In addition, some non-ferrous metal slag usually contains lead, arsenic, cadmium, mercury, and other harmful substances, which pose a serious threat to the health and survival of residents [6,7,8]. At present, the vast majority of ferronickel slag in China is produced by humus laterite ore in the process of reduction smelting ferronickel in electric furnaces. The composition of ferronickel smelting slag in electric furnaces in different regions is similar. Its main components are FeO, MgO, and SiO2, which belong to the FeO-MgO-SiO2 ternary slag system. Its main mineral components are 2FeO·SiO2, FeO·SiO2, and MgO·SiO2. Therefore, this study has important reference significance for the development and utilization of pyrometallurgical nickel slag at home and abroad. Consequently, it is essential to develop and utilise smelter slag through environmental-friendly technologies [9,10]. However, owing to its complex mineral characteristics, smelter slag is extremely difficult to recycle via the traditional flotation and magnetic separation technology [11,12,13]. Coal-based reduction is a practical technology for utilising complex refractory ore and is different from direct reduction and fusion reduction [14]. The raw materials used for direct reduction and fusion reduction are generally high-grade lump ore, iron concentration, and oxidised pellets.
The iron minerals are reduced to metallic iron with coal powder as the reductant in the coal-based reduction [15]. Metallic iron aggregates to iron particles in the coal-based reduction [16,17,18]. Accordingly, the metallic iron particles and slag are separated via the magnetic separation operation. In recent years, the coal-based reduction process and the growth behaviour of iron granules have been studied by several researchers. For instance, the oolitic structure of oolitic iron ore is destroyed from the oolite edge to the inside of the ore in the coal-based reduction. The iron minerals of the oolitic ore are reduced into metallic iron as the chemical reaction sequence: Fe2O3→Fe3O4→Fe2O3 (Fe2SiO4, FeAl2O4)→Fe. Meanwhile, slag phase is generated as the reaction process of Fe-Al-Si-O→Fe-Ca-Al-Si-O→Ca-Al-Si-O [13,18]. The coal-based reduction results were obtained using the optical image analysis to measure the metallic iron granularity of the reduction products [14,19]. The average iron size increased with the reduction time and reduction temperature [16,20,21]. The distribution of metallic iron grain followed the exponential decay function (frequency distribution) and the Rosin–Rammler equation (cumulative distribution), respectively [17,22].
Characterisation of the metallic iron granularity is significant to ascertain the growth mechanism of the metallic phase and regulate the reduction process. In the present paper, the metallisation rate was adopted to evaluate the metallisation process. The apparent morphology and aggregation growth law of iron grain were investigated via the scanning electron microscopy (SEM) and energy dispersive spectrometry (EDS). The effects of coal-based reduction temperature and reduction time on the growth characteristic were ascertained via the characterisation of iron grain. Ultimately, the growth kinetics models of the metallic iron grain were established to describe the growth characteristic of metallic iron in detail.
2. Materials and Experimental
2.1. Materials
The ferronickel slag was collected from Jinchang, Gansu province, China. The 2FeO·SiO2 (fayalite) was the main iron mineral in the ferronickel slag. The chemical composition analysis of the ferronickel slag is listed in Table 1, which shows the main metallic elements are Fe (45.40%), Ni (0.15%), Co (0.13%), and Cu (0.24%). The primary gangue mineral is SiO2 (33.50%). Moreover, the contents of CaO and MgO are 0.92% and 4.80%, respectively. Table 2 is the industrial analysis and chemical composition of anthracite collected from Jilin, indicating that coal is a superior reductant for the coal-based reduction experiment owing to the low amount of coal ash, high content of fixed carbon and volatile matter, and the low amount of harmful element sulphur. The microstructure of ferronickel slag is shown in Figure 1.

Table 1.
Chemical composition of ferronickel slag (wt%).
Table 2.
Industrial analysis of coal (wt%).
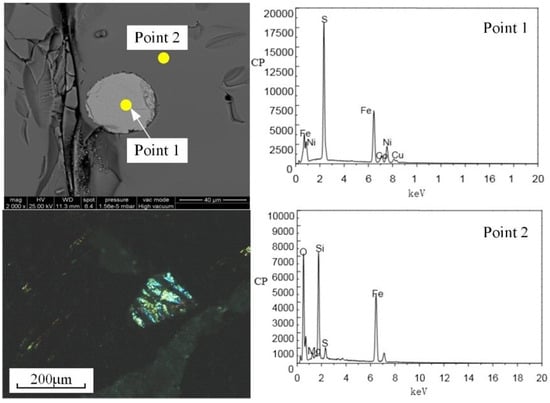
Figure 1.
Microstructure of ferronickel slag.
2.2. Experimental Approach
Ferronickel slag and pulverized coal (mass ratio 1:2) were well mixed and placed into a 100 mL crucible. When the temperature in the furnace chamber reached the target temperature, the crucible containing well-mixed ferronickel slag and coal was placed in the resistance furnace. As the temperature reached the given reaction temperature, timing was started, and the temperature was kept constant until the end of the reaction. The reduction products were cooled to 20 °C in water after coal-based reduction. The cooling products were dried, broken, and ground to −0.074 mm accounting for 80%. The reduction products, the SpecoFix resin, and the SpecoFix-20 curing agent were put into a special sampler for 24 h to solidify. The samples were polished to meet the requirements of the image analysis.
2.3. Analysis Method
2.3.1. Metallisation Rate of Coal-Based Reduction
The metallisation rate is the specific value of metal iron (MFe) content and total iron (TFe) content, and it is used to characterise the reduction degree of iron oxide, as shown in Equation (1). The content of MFe and TFe were determined through titration three times to decrease the errors.
where M represents the metallisation rate of the coal-based reduction; w(MFe) represents the mass fraction of metallic iron (%); w(TFe) is the mass fraction of total iron (%).
2.3.2. Scanning Electron Microscopy Analysis
In this study, scanning electron microscopy (SEM) (SSX-550, Shimadzu, Japan) was used to observe the apparent morphology of the coal-based reduction products at an acceleration voltage of 15 kV. An EDS (Inca, Oxford, UK) was used to analyse the differences between the various components before and after the coal-based reduction.
2.3.3. Size Measurement of Metal Particles
Due to the metallic iron and the slag being closely integrated in the reduction sample and the particle size being diverse, it is difficult to separate the metallic iron and slag phase without destroying the shape and size of the metallic phase. In recent years, with the rapid development of image processing technology and computer vision technology, image analysis technology is widely used for the detection of particle size [23,24]. The optical microscopy (BX51, OLYMPUS, Shinjuku, Tokyo, Japan) image analysis technology was used to measure the granularity of metallic iron. The image was divided equally into 177 areas, and was collected from the middle of each grid to ensure the representativeness of the image, as shown in Figure 2. Figure 3 demonstrates the image processing. More than 5000 metal particles were counted using the metallographic image analysis system OLYCIA M3 in each coal-based reduction product. The image was analyzed by the OLYCIA M3 metallographic image analysis system. The image (Figure 3a) was collected and reversed to obtain the negative image of the original image (Figure 3b). The particles were extracted from the image through the binarization process (Figure 3c). The particle profiles were automatically recognised and marked in order to count and screen the particle numbers (Figure 3d). In order to ensure representativeness of the measured data, the statistical numbers of metallic particle size in the reduced sample at each test point were more than 5000.
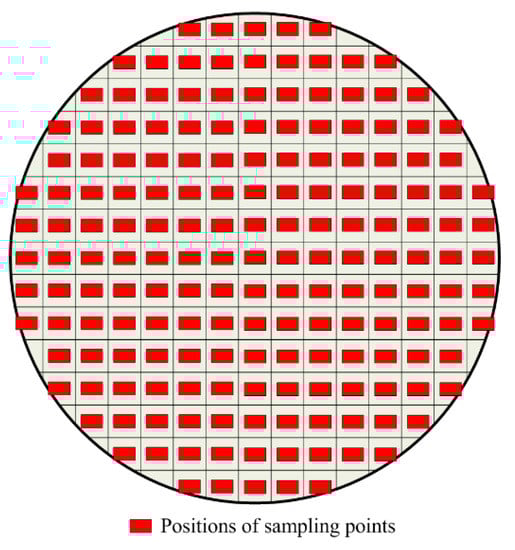
Figure 2.
Positions of the 177 sampling points in the specimen of the briquette.
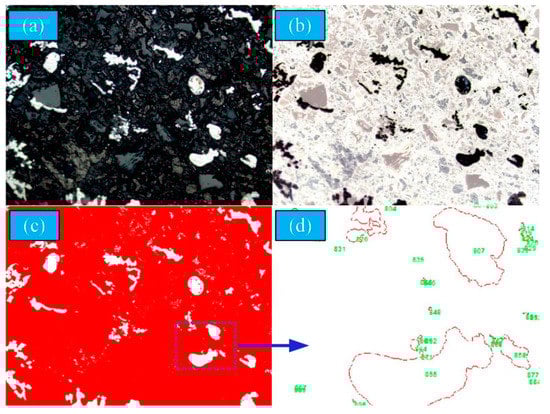
Figure 3.
Image processing for the captured image. (a) Original image (b) Grey value image (c) Binary image (d) Count image.
2.3.4. Characterisation of Metal Particle Size
The diameter and roundness of the equal-area circle were the vital parameters for characterising the size of the metal particles in this study. The metal particles were divided into several size intervals, such as 0–5.0 μm, 5.0–10.0 μm, 10.0–15.0 μm, ongoing in similar intervals, and 145.0–150.0 μm.
The frequency distribution and cumulative distribution of particle numbers were adopted to characterise the test data, as shown in Equations (2) and (3).
where f(Di) represented the frequency distribution of size interval Di (%). ni was the number of particles in the size interval Di. N represented the total number of particles.
where Q(d) represented the cumulative frequency of particle number (%). n(d < di) was the number of particles size smaller than di. di was the size interval boundary. N represented the total number of particles.
3. Results and Discussion
3.1. Formation and Microstructure of Metal Phase
3.1.1. Metallisation Process
Figure 4 demonstrates the metallisation rate of the coal-based reduction for different reduction times and temperatures, which shows that the metallisation rate of the reduction samples at different reduction temperatures exhibits the same tendency. The metallisation rate increased rapidly and then slowly until it stabilised with the reduction time. For example, when the reduction temperature was 1473 K, the metallisation rate increased rapidly from 18.47% to 61.23% as the reduction time was extended from 10 min to 40 min. Nevertheless, the metallisation rate increased slowly from 61.23% to 73.2% with the reduction time extending from 40 min to 100 min. Consequently, the metallisation process of the reduction products was divided into two stages: the rapid formation of the metallic phase and the relatively stable content of the metallic phase.
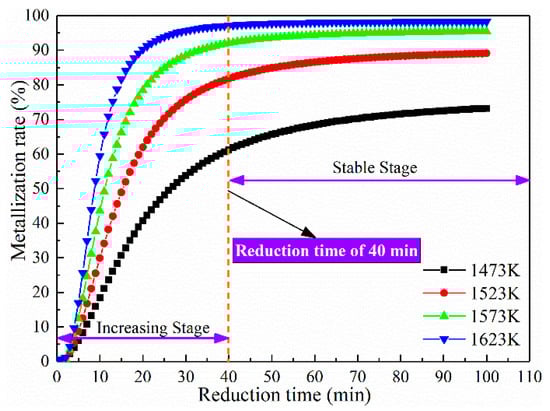
Figure 4.
Metallisation rate of coal-based reduction samples.
According to the TG weight-loss curve of ore sample (Figure 5), the sample quality basically did not change with the increase in temperature, indicating that there was no obvious weight-loss process. It could be seen from the DSC curve that with the increase in temperature, the DSC curve gradually increased without obvious peaks and troughs, i.e., there were no obvious endothermic and exothermic peaks, but the slope of the curve changes at about 1100 °C (1373 K). The change of slope was completed in the temperature range from 1050~1150 °C. There was no obvious slope change point, indicating that the slag was a melt rather than a crystal, and there was no fixed melting point; additionally, the phase transition occurred in the temperature range from 1050~1150 °C. It was solid before 1050 °C and liquid after 1150 °C. The results of thermogravimetric and differential thermal analysis showed that the composition of the slag was relatively single, there was basically no weight loss, and the melting temperature of the ore was about 1373 K.
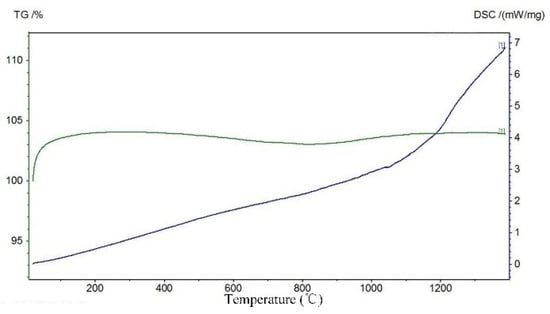
Figure 5.
TG-DSC curves of slag.
Figure 4 indicates that the reduction temperature significantly influenced the metallisation process of the ferronickel slag. The metallisation rate gradually rose with the rise of temperature. As the coal-based reduction reached a certain extent, the gradient of the metallisation rate decreased with the reduction time. At the reduction time of 20 min, the metallisation rate increased from 59.76% to 89.08% as the reduction temperature rose from 1523 K to 1623 K, whereas the metallisation rate merely improved from 81.79% to 97.16% for the reduction time 40 min. Meanwhile, the time for the metallisation rate to reach the stable stage shortened as the reduction temperature elevated.
3.1.2. Microstructure of Metal Phase
The metal phase microstructure of the coal-based reduction was analysed using SEM. Figure 6 and Figure 7 show the SEM images and EDS spectra of the reduction samples, respectively. Figure 8 shows the SEM image of the coal-based reduction samples for the reduction temperature of 1523 K, CaO content of 15%, and reduction times of 10, 20, 40, and 60 min, respectively.
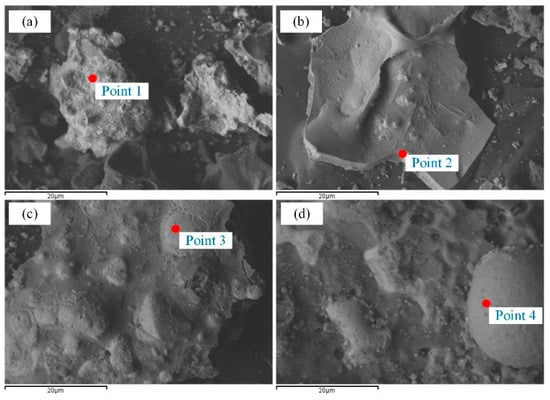
Figure 6.
SEM images of coal-based reduction samples for the reduction time of 60min. (a) 1473 K (b) 1523 K (c) 1573 K (d) 1623 K.
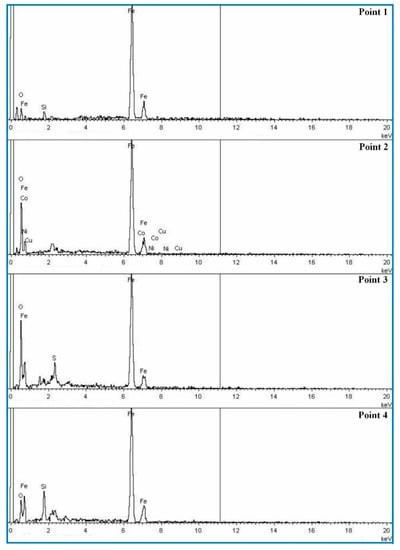
Figure 7.
EDS spectra of coal-based reduction samples for the reduction time of 60 min.
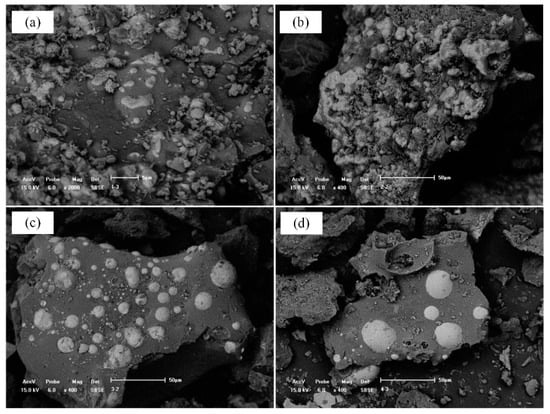
Figure 8.
SEM images of coal-based reduction samples at 1573 K. (a) 10 min (b) 20 min (c) 40 min (d) 60 min.
As shown in Figure 6, the metallic iron granularity gradually increased as the time and reduction temperature increased, which promoted the growth of the metallic iron. The prolongation of the reduction time accelerated the reduction of iron minerals when the reduction time was less than 40 min, and supplied sufficient time for the aggregation of metallic phase. The distinct boundary between the metallic particles and the slag matrix were generated owing to the addition of CaO, which was also beneficial for the formation of the metallic particles.
3.2. Grain Size Distribution of Metallic Iron
3.2.1. Effect of Reduction Conditions on Particle Size Distribution
Figure 9 demonstrates the cumulative distribution of metallic grain under different reduction times and temperatures. Figure 9 indicates that the largest frequency distribution appears in the 5–10 μm size range in each curve, and the frequency distribution of the 0–5 μm size range is somewhat less than that of 5–10 μm. The frequency distribution of each size range decreased rapidly with particle diameter. The reduction temperature and time significantly influenced the metallisation process of the ferronickel slag. The percentage content of the larger-sized particles increased with increasing reduction time. At reduction temperature 1473 K, the frequency of 5–10 μm particles decreased from 36.06% to 28.26% with the reduction time extending from 20 min to 100 min, while the frequency of 15–20 μm particles increased from 7.94% to 10.21%. Figure 9 also suggests that the cumulative curve of metallic iron grain gradually moved to the right with the prolongation of the reduction time. Owing to the increase in the reduction time, the ferronickel slag was reduced more thoroughly to promote the growth of the metallic phase. The distribution frequency of smaller iron grain decreased as the temperature increased, while the distribution frequency of the coarse iron grain enlarged gradually.
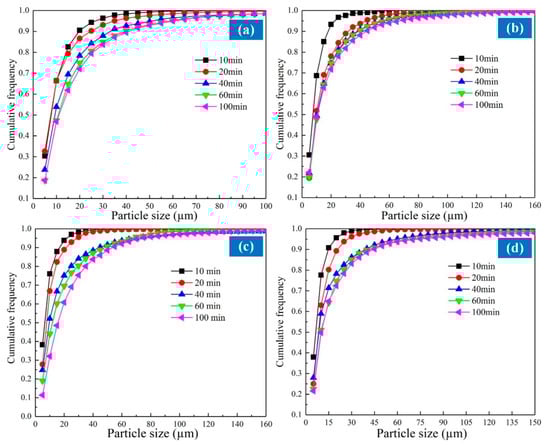
Figure 9.
Cumulative size distribution of iron grain at different reduction temperature. (a)1473 K (b) 1523 K (c) 1573 K (d) 1623 K.
Figure 10a,b indicate the average diameter of the equal-area circle and the roundness of the iron grain at different reduction temperatures and reduction times. Figure 10 indicates that the granularity increased with the reduction temperature. At the reduction time of 40 min, the average diameter of the equal-area circle of the metallic particles increased from 14.17 μm to 19.88 μm with the reduction temperature varying from 1473 K to 1623 K; meanwhile, the roundness enlarged from 0.57 to 0.68. Consequently, the granularity of metallic iron improved gradually with the reduction temperature. In addition, the appearance of the metallic particles verged toward a spherical shape. The diffusion rate of the metallic iron accelerated due to the increase of temperature, which promoted the diffusion migration of the metallic iron. Meanwhile, the viscosity and the interfacial tension of the ferronickel slag declined with the reduction temperature. Therefore, the metallic iron particles aggregated more easily to acquire the spherical appearance on account of the interfacial energy effect.
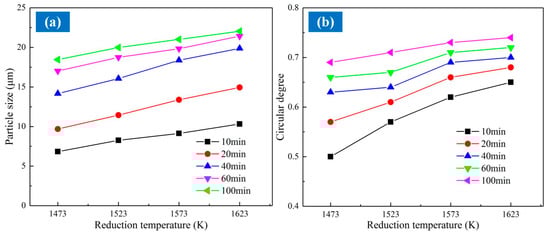
Figure 10.
Representative grain size parameters of coal-based reduction products. (a) The average equal-area circle diameter of particle; (b) The average roundness of particle.
3.2.2. Granularity Distribution Function of Iron Grain
To characterise the granularity distribution of the iron grain, four frequency distribution functions were adopted: Gaussian distribution, Langevin exponential function, Doseresp sigmoidal function, and Power function, as shown in Equations (4)–(8).
where f(x) represented the distribution frequency (%) for particle size x (μm). μ represented the geometric average particle size (μm). σ was the geometric standard deviation.
Origin Pro 8.0 software was used to ascertain the relationship between the four functions and the granularity distribution of the iron grain. The determinate coefficient R2 with the value range [0, 1] was used to evaluate the goodness of fit. R2 close to 1 indicates a more precise degree of fit. Conversely, R2 close to 0 indicates a worse degree of fit. The fitting results of the size distribution of iron grain were listed in Table 3, which shows that the R2 of the Doseresp sigmoidal function was closest to 1.0, thus identifying the Doseresp sigmoidal function as the optimal functional model for characterising the distribution of iron grain granularity.
Table 3.
Fitting results of the distributions of iron granularity.
3.3. Growth Kinetics of Metal Particles
3.3.1. Effect of Temperature and Time on the Growth of Iron Particles
Increasing the temperature and prolonging the time could promote the growth of metallic iron grain. To further clarify the growth process of the iron grain and describe the growth characteristics of the metallic iron quantitatively, the average size of the metallic particles under different reduction conditions was calculated according to the image analysis datas. Equation (9) shows the calculation equation for the average particle size.
where represents the average size of the metallic iron (μm). N was the total number of measured grain. dj represents the diameter of the metallic grain (μm). mj was the number of metallic iron with the diameter dj.
Figure 11 shows that the time and reduction temperature significantly affected the average granularity of the iron grain. The average size of the metallic iron grain increased evidently with the temperature and time. At the reduction time 40 min, the average size of the iron grain improved from 14.17 μm to 19.88 μm when the temperature rose from 1473 K to 1623 K. With the reduction time varying from 10 min to 100 min, the average size of the metallic grain improved from 10.33 μm to 22.03 μm at the reduction temperature 1573 K. At the reduction temperature of 1523 K, the average granularity of the iron particles improved from 11.45 μm to 16.07 μm as the time was extended from 20 min to 40 min. While the reduction time was extended from 40 min to 100 min, the average granularity enlarged from 16.07 μm to 18.47 μm. The increments in the average size for the two stages were 4.62 μm and 2.67 μm, thus indicating that the mechanism and growth rate of the iron grain were diverse in different coal-based reduction stages.
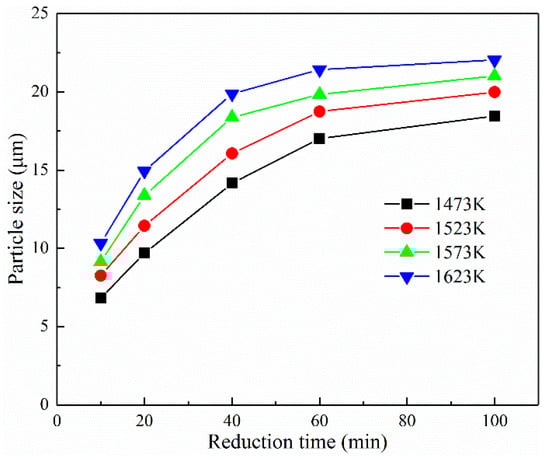
Figure 11.
Effect of temperature and time on the average particle size of iron grain.
3.3.2. Establishment of Iron Particle Growth Kinetics Model
The classical kinetic equation of particle growth was used to clarify the growth mechanism of the particles [25], as shown in Equation (10).
where Dt and D0 represents the particle size at time t (μm) and time t = 0 (μm), respectively. n represents the particle growth index. K0 is the growth rate constant of the particle. t represents the growth time of the particle (min). Q represents the activation energy of particle growth (kJ·mol−1). T and R are the thermodynamic temperature (K) and gas constant (J·mol−1·K−1), respectively.
Based on the classical kinetic equation of particle growth, the growth behaviour of the iron grain was investigated in detail in this study. As there was no metallic phase generated at the reduction time t = 0, Equations (11) and (12) were obtained. From Equation (12), the slope of ln(Dt) and ln(t) was used to calculate the particle growth index n. The slope of ln(Dt) and 1/T represents the activation energy of particle growth Q. K0 was obtained according to the particle growth index n and activation energy of particle growth Q.
According to Figure 4, the coal-based reduction process of ferronickel slag is divided into two stages, the rapid rise period of 0–40 min and the stable period of 40–100 min. Therefore, linear fitting was carried out for the two stages respectively, as shown in Figure 12. According to the results of the linear regression, the two stages of the coal-based reduction exhibited a close linear relationship. Based on the slope of the regression line, indices, denoted by n, were 2.016 ± 0.076 and 5.960 ± 2.060 at the two stages of the coal-based reduction.
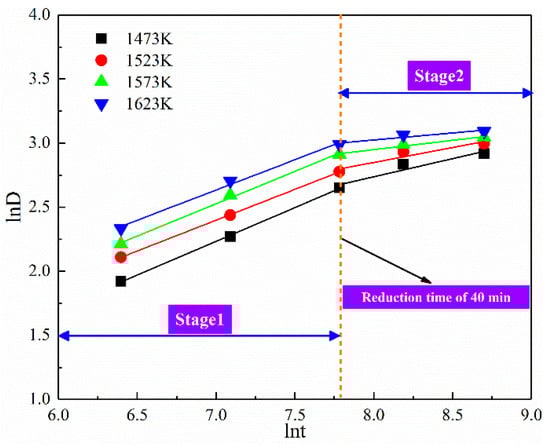
Figure 12.
The relationship between ln(Dt) and ln(t).
As shown in Figure 13, the values of the activation energy of particle growth Q were 52.482 ± 4.448 kJ·mol−1 and 26.426 ± 3.295 kJ·mol−1. The calculated results of activation energy indicated that the activation energy of iron particles growth at the reduction time t ≤ 40 min was higher than that for the reduction time t > 40 min. The high surface energy generated owing to the small particle size promoted the formation of a stronger driving force of grain growth and a faster growth rate. Moreover, the growth rate constants, denoted by K0, for the two stages were 30.33 ± 1.92 and 21.30 ± 1.45, respectively. Consequently, the growth kinetics model of the iron grain is expressed in Equations (13) and (14).
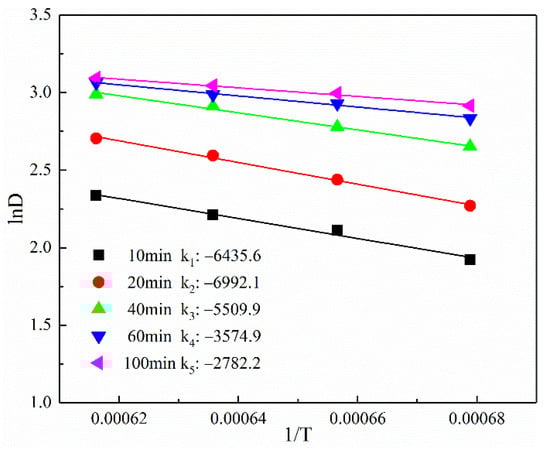
Figure 13.
The relationship between ln(Dt) and 1/T.
Figure 14 shows the predicted value and experimental values of the iron grain. From Figure 14, all model prediction values were evenly distributed near the line y = x, indicating that the predicted value was consistent with the experimentally measured value. Therefore, the accuracy of the growth kinetics model of the iron particles was verified via Figure 14.
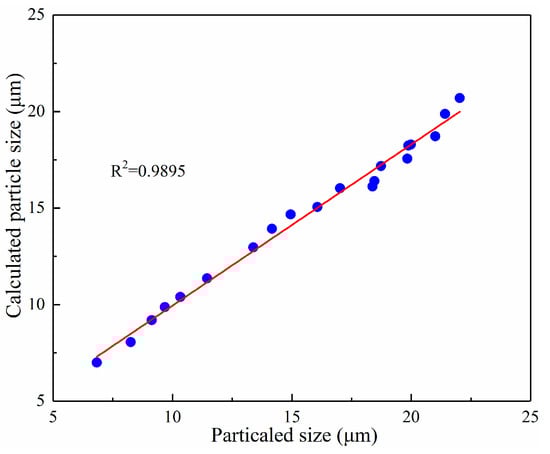
Figure 14.
Comparison of calculated and experimental data of iron grain granularity.
3.3.3. Metallic Phase Growth Process and Description of Limiting Links
The ferronickel slag existed in a liquid state at the reduction temperature range of 1473–1623 K, and CO was the reductant during the coal-based reduction. Therefore, the coal-based reduction first occurred at the interface between the liquid state and gaseous states. The metallic iron appeared on the liquid surface of the ferronickel slag and aggregated to generate the metallic particles assisted by the collision and diffusion effects. Considering the influence of gravity, the metallic iron particles separated from the reaction interface with the increase in the particle size. As the viscosity has a great influence on the falling speed of particles, the Stokes equation Equation (15) was adopted to ascertain the average falling speed of the iron particles.
where ν was the average falling speed of the metallic iron particles (m·s−1). r represented the radius of the metallic iron (m). ηS was the viscosity of the slag (Pa·s). ρM and ρS represented the bulk densities of the metal and slag, respectively (kg·m−3). g was the gravitational acceleration (m·s−2).
Figure 15 shows that the viscosity values of the slag were diverse at different metallisation rates. The viscosity of the slag increased to 1900 Pa·s owing to the high mass fraction of SiO2 at the metallisation rate of 80%. Figure 15 suggests that the metallic iron particles generated in the initial stage were separated from the reaction interface to produce small metallic particles due to the surface tension and lower viscosity (Figure 16). Meanwhile, the 2FeO·SiO2 in the slag diffused to the reaction interface and reduced to metallic iron particles [25]. In the intermediate stage, the concentration of 2FeO·SiO2 in the slag and the reaction interface decreased. Consequently, the number of metallic iron atoms in the reaction interface and the probability of producing larger particles declined. Nevertheless, the falling speed of the metallic iron particles decreased because the viscosity increased with the metallisation rate [19,26]. The residence time of the iron grain at the reaction interface and the probability of producing larger iron granules increased. In the later stage, the concentration of 2FeO·SiO2 diffused to the reaction interface further decreased, resulting in a smaller particle size of metallic iron at the reaction interface [18,21,27]. Moreover, many small iron granules appeared on the surface of the slag at the end of the reduction reaction owing to the increase of the slag viscosity and the slower falling speed.
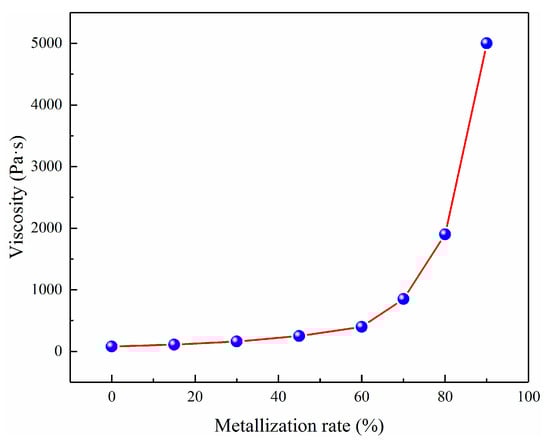
Figure 15.
The viscosity of metallic particles in different metallisation rates at the temperature of 1573 K.
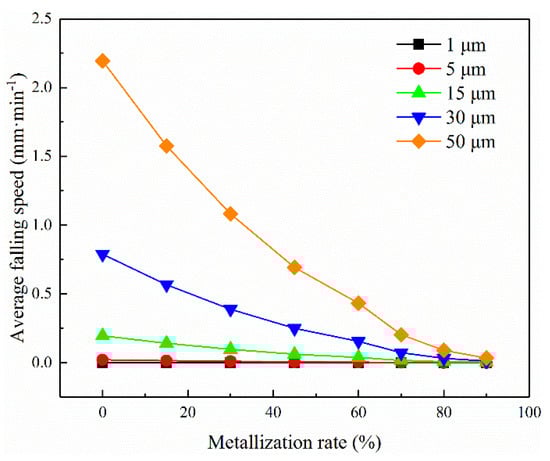
Figure 16.
The average falling speed of metal particles in different metallisation rates at the temperature of 1573 K.
In the initial stage, more iron grains appeared in the reaction interface. Nevertheless, the metallic iron particles were separated from the reaction interface on account of the short reaction time and lower viscosity of the slag, which indicated the formation of larger iron grain was difficult. In the intermediate stage, the granularity remained within a certain range owing to the influence of the 2FeO·SiO2 concentration and slag viscosity (Figure 17).
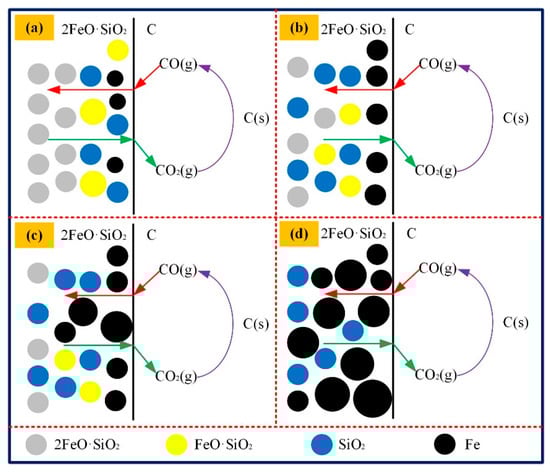
Figure 17.
Schematic diagram of metallic iron growth during the coal-based reduction. (a) The diffusion of CO; (b) Initial stage of iron particle formation; (c) Middle stage of iron particle formation; (d) Last stage of iron particle formation.
According to the description of the growth process and theoretical calculation, the distribution characteristics of the metallic particles were highly consistent with the measured ones. Consequently, the sizes of most of the particles varied approximately from 10–15 μm, and most of the metal particles were less than 50 μm.
The reduction product with an iron grade of 29.43% and metallisation rate of 98.22% was obtained at carbon addition coefficient 2.0, reduction temperature 1573 K, reduction time 60 min, the particle size of coal and ferronickel slag −2.0 mm, and CaO content 15%. The reduction products were ground and separated to obtain concentrate products, and the analysis of main chemical elements is shown in Table 4.
Table 4.
The main chemical composition of magnetic concentrate/%.
4. Conclusions
- (1)
- The reduction time and reduction temperature have prominent effects on the coal-based reduction of ferronickel slag. The metallisation process includes two stages, i.e., the rapid formation and aggregate growth of the metallic phase. The time required for the metallisation rate to reach the stable stage decreases with the reduction temperature.
- (2)
- With the increase of temperature or reaction time, the metallisation rate increases, and the average size of the spherical iron grain grows. The reduction time and temperature significantly influence the frequency distribution of thec iron granules. The frequency distribution of the iron granules follows the Doseresp sigmoidal function.
- (3)
- The growth kinetic models of the iron grain in the coal-based reduction of ferronickel slag are established according to the classical kinetic equation of particle growth.
The growth characteristic and mechanism of iron grain during the coal-based reduction are complex. A faster growth rate and stronger growth driving force of metallic iron particles are generated owing to the smaller particle size and larger surface energy at the initial stage. The coal-based reduction rate decreases as the reduction time exceeds 40 min, and the growth of the iron grain is restricted to the interfacial chemical reaction.
Author Contributions
Conceptualization, J.Y. and P.G.; methodology, S.M.; software, Y.Q.; data curation, S.M.; writing—original draft preparation, Y.Q.; writing—review and editing, Y.S.; visualization, P.G.; supervision, Y.S.; project administration, J.Y. All authors have read and agreed to the published version of the manuscript.
Funding
This research was funded by Liaoning Doctoral Research Start-up Fund Project, grant number 2020-BS-050 and Basic Scientific Research Business Expenses of Central Universities, grant number N2001030.
Data Availability Statement
Not applicable.
Conflicts of Interest
The authors declare no conflict of interests.
References
- Ashish, K.S.; Khan, M.N.N.; Prabir, K.S. Value added utilization of by-product electric furnace ferronickel slag as construction materials: A review. Resour. Conserv. Recycl. 2018, 134, 10–24. [Google Scholar]
- Yuan, S.; Liu, X.; Gao, P.; Han, Y.X. A semi-industrial experiment of suspension magnetization roasting technology for separation of iron minerals from red mud. J. Hazard. Mater. 2020, 394, 122579. [Google Scholar] [CrossRef]
- Wu, Q.; Chen, Q.; Huang, Z.; Gu, B.; Zhu, H.; Tian, L. Preparation and characterization of porous ceramics from nickel smelter slag and metakaolin. Ceram. Int. 2020, 46, 4581–4586. [Google Scholar] [CrossRef]
- Xi, B.; Li, R.; Zhao, X.; Dang, Q.; Zhang, D.; Tan, W. Constraints and opportunities for the recycling of growing ferronickel slag in China. Resour. Conserv. Recycl. 2018, 139, 15–16. [Google Scholar] [CrossRef]
- Pan, J.; Zheng, G.; Zhu, D.; Zhou, X. Utilization of nickel slag using selective reduction followed by magnetic separation. Trans. Nonferrous Met. Soc. China 2013, 23, 3421–3427. [Google Scholar] [CrossRef]
- Young, C.C.; Seongcheol, C. Alkali–silica reactivity of cementitious materials using ferro-nickel slag fine aggregates produced in different cooling conditions. Constr. Build. Mater. 2015, 99, 279–287. [Google Scholar]
- Muravyov, M.I.; Bulaev, A.G.; Kondrat’eva, T.F. Complex treatment of mining and metallurgical wastes for recovery of base metals. Miner. Eng. 2014, 64, 63–66. [Google Scholar] [CrossRef]
- Yuan, S.; Zhou, W.T.; Li, Y.J.; Han, Y.X. Efficient enrichment of nickel and iron in laterite nickel ore by deep reduction and magnetic separation. Trans. Nonferrous Met. Soc. China 2020, 30, 812–822. [Google Scholar] [CrossRef]
- Liu, X.; Feng, Y.; Li, H.; Yang, Z.; Cai, Z. Recovery of valuable metals from a low-grade nickel ore using an ammonium sulfate roasting-leaching process. Int. J. Miner. Metall. Mater. 2012, 19, 377–383. [Google Scholar] [CrossRef]
- Yang, H.; Jing, L.; Zhang, B. Recovery of iron from vanadium tailings with coal-based direct reduction followed by magnetic separation. J. Hazard. Mater. 2011, 185, 1405–1411. [Google Scholar] [CrossRef]
- Li, Y.; Papangelakis, V.G.; Perededy, I. High pressure oxidative acid leaching of nickel smelter slag: Characterization of feed and residue. Hydrometallurgy 2009, 97, 185–193. [Google Scholar] [CrossRef]
- Li, B.; Wang, H.; Wei, Y. The reduction of nickel from low-grade nickel laterite ore using a solid-state deoxidisation method. Miner. Eng. 2011, 24, 1556–1562. [Google Scholar] [CrossRef]
- Li, X.; Wen, Z.; Li, Y.; Yang, H.; Xing, X. Improvement of carbothermic reduction of nickel slag by addition of CaCO3. Trans. Nonferrous Met. Soc. China 2019, 29, 2658–2666. [Google Scholar] [CrossRef]
- Sun, Y.S.; Gao, P.; Han, Y.X.; Ren, D.Z. Reaction behavior of iron minerals and metallic iron particles growth in coal-based reduction of an oolitic iron ore. Ind. Eng. Chem. Res. 2013, 52, 2323–2329. [Google Scholar] [CrossRef]
- Zhang, L.; Chen, H.; Deng, R.D.; Zuo, W.R.; Guo, B.; Ku, J.G. Growth behavior of iron grains during deep reduction of copper slag. Powder Technol. 2020, 367, 157–162. [Google Scholar] [CrossRef]
- Han, Y.X.; Sun, Y.S.; Gao, P.; Li, Y.J.; Mu, Y.F. Particle size distribution of metallic iron during coal-based reduction of an oolitic iron ore. Miner. Metall. Process. 2014, 31, 169–173. [Google Scholar] [CrossRef]
- Sun, Y.S.; Han, Y.X.; Gao, P.; Mu, Y.F. Particle size measurement of metallic iron in reduced materials based on optical image analysis. Chem. Eng. Technol. 2014, 37, 2030–2036. [Google Scholar] [CrossRef]
- Sun, Y.S.; Han, Y.X.; Gao, P.; Yu, J.W. Size distribution behavior of metallic iron particles in coal-based reduction products of an oolitic iron ore. Miner. Process. Extr. Metall. Rev. 2015, 36, 249–257. [Google Scholar] [CrossRef]
- Gao, P.; Sun, Y.S.; Ren, D.Z.; Han, Y.X. Growth of metallic iron particles during coal-based reduction of a rare earths-bearing iron ore. Miner. Metall. Process. 2013, 30, 74–78. [Google Scholar] [CrossRef]
- Li, X.; Li, Y.; Zhang, X.; Wen, Z.; Xing, X. Growth characteristics of metallic iron particles in the direct reduction of nickel slag. Metall. Mater. Trans. B 2020, 51, 925–936. [Google Scholar] [CrossRef]
- Zhang, X.; Li, G.; Rao, M.; Mi, H.; Liang, B.; You, J.; Peng, Z.; Jiang, T. Growth of metallic iron particles during reductive roasting of boron-bearing magnetite concentrate. J. Cent. South. Univ. 2020, 27, 1484–1494. [Google Scholar] [CrossRef]
- Gonzalez-Tello, P.; Camacho, F.; Vicaria, J.M.; Gonzalez, P.A. A modified Nukiyama-Tanasawa distribution function and a Rosin-Rammler model for the particle-size-distribution analysis. Powder Technol. 2008, 18, 278–281. [Google Scholar] [CrossRef]
- Al-Thyabat, S.; Miles, N.J. An improved estimation of size distribution from particle profile measurements. Powder Technol. 2006, 166, 152–160. [Google Scholar] [CrossRef]
- Vaezi, M.; Pandey, V.; Kumar, A.; Bhattacharyya, S. Lignocellulosic biomass particle shape and size distribution analysis using digital image processing for pipeline hydro-transportation. Biosyst. Eng. 2013, 114, 97–112. [Google Scholar] [CrossRef]
- Mahabubur, C.; Veruscha, F.; Girish, K. Growth kinetics evaluation of hydrothermally synthesized β-FeOOH nanorods. J. Cryst. Growth 2014, 387, 57–65. [Google Scholar]
- Yang, G.; Sun, X.; Yong, Q.; Li, Z.; Li, X. Austenite grain refinement and isothermal growth behavior in a low carbon vanadium microalloyed steel. J. Iron Steel Res. Int. 2014, 21, 757–764. [Google Scholar] [CrossRef]
- Bahgat, M.; Halim, K.S.A.; El-Kelesh, H.A.; Nasr, M.I. Metallic iron whisker formation and growth during iron oxide reduction: K2O effect. Ironmak. Steelmak. 2009, 36, 379–387. [Google Scholar] [CrossRef]
Publisher’s Note: MDPI stays neutral with regard to jurisdictional claims in published maps and institutional affiliations. |
© 2021 by the authors. Licensee MDPI, Basel, Switzerland. This article is an open access article distributed under the terms and conditions of the Creative Commons Attribution (CC BY) license (https://creativecommons.org/licenses/by/4.0/).