Article

Experiences of Bio-Coal Applications in the Blast Furnace Process—Opportunities and Limitations

by
Lena Sundqvist Ökvist
1,2,* and
Maria Lundgren
1
1
Swerim AB, Box 812, 971 25 Luleå, Sweden
2
MiMeR, Luleå University of Technology, 971 87 Luleå, Sweden
*
Author to whom correspondence should be addressed.
Minerals 2021, 11(8), 863; https://doi.org/10.3390/min11080863
Submission received: 1 June 2021 / Revised: 22 July 2021 / Accepted: 7 August 2021 / Published: 10 August 2021
(This article belongs to the Special Issue Bio-Coal for Metallurgical Processes)

Abstract

:
Metal production, and especially iron ore-based steel production, is characterized by high fossil CO2 emissions due of the use of coal and coke in the blast furnace. Steel companies around the world are striving to reduce the CO2 emissions in different ways, e.g., by use of hydrogen in the blast furnace or by production of iron via direct reduction. To partially replace fossil coal and coke with climate neutral bio-coal products that are adapted for use in the metal industry, e.g., at the blast furnace, is a real and important opportunity to significantly lower the climate impact in a short-term perspective. Top-charging of bio-coal directly to the blast furnace is difficult due to its low strength but can be facilitated if bio-coal is added as an ingredient in coke or to the mix when producing residue briquettes. Bio-coal can also be injected into the lower part of the blast furnace and thereby replace a substantial part of the injected pulverized coal. Based on research work within Swerim, where the authors have been involved, this paper will describe the opportunities and limitations of using bio-coal as a replacement for fossil coal as part of coke, as a constituent in residue briquettes, or as replacement of part of the injected pulverized coal. Results from several projects studying these opportunities via technical scale, as well as pilot and industrial scale experiments and modelling will be presented.

1. Introduction

The steel industry faces great challenges adapting to changed raw material quality and the need to lower the CO2 emissions, which is especially important for coal- and coke-based production of hot metal via the blast furnace (BF) route that still dominates in steelmaking. On average, 1.9 tons of CO2 is released for every ton of produced steel [1]. According to the International Energy Agency, the iron and steel industry accounts for around 6.7% of total world CO2 emissions.
The EU 2030 Energy Strategy targets to reduce greenhouse gas (GHG) emissions by 40% and the EU 2050 energy roadmap states a long-term goal of reducing GHG emissions by 80–95% by 2050, both relative to 1990 levels [2]. Steel companies around the world are striving to reduce CO2 emissions in different ways, e.g., by use of hydrogen in the BF as in the Japanese Course 50 project [3], or in direct reduction production of iron, the latter as in Sweden in the HYBRIT process [4] or H2 Green Steel [5].
To partially replace fossil coal and coke with climate neutral pre-treated biomass products that are adapted for use in the metal industry, e.g., at the BF, is a real and important opportunity to significantly lower the climate impact. The most suitable biomass for use in metallurgical processes is wood-based; however, raw woody biomass is not feasible to use [6,7,8]. The carbon content and heating value is low, and the oxygen, volatile matter (VM) and moisture contents are high compared to in coking or injection coals, and therefore it is necessary to upgrade the raw biomass before use [6,7,8,9]. Woody biomass can be upgraded into bio-coal via thermochemical slow pyrolysis in the absence of oxygen, as in torrefaction or pyrolysis processes [6,7,8,9,10,11]. Torrefaction is performed at temperatures around 200 to 300 °C, and pyrolysis at temperatures from 300 to 600 °C, or even higher. Charcoal (CC) has lower H/C and O/C ratios and a higher HHV (higher heating value) compared to torrefied products. CC has properties that resemble those of fossil coals. Biomass may have low ash content relative to its pre-treatment degree if originating from woody biomass, but the ash content and its composition may differ due to raw biomass origin [6,11]. Forest residue, bark and biomass from agriculture has higher ash content than stem wood, and higher amounts of undesired elements such as phosphorus and alkali-metal oxides compared to stem wood and used coal and coke [6]. Differences in physical properties are lower bulk density, higher porosity and surface area, and different grinding ability in comparison to coal [6,7,8].
Bio-coal can be added via injection [6,7,8,9], as a component in carbon composite agglomerates (CCA) [6,7,8], or in coal blends for coke making [12]. Top-charging and injection of charcoal has been practiced at small-sized BFs in Brazil, but due to the low strength of CC, disintegration with a negative effect on permeability and dust formation may occur at medium- to large-sized BFs. Injection of CC was conducted at the Arcelor Mittal BF A in Monlevado, with a production rate of roughly 3000 tons of hot metal (tHM)/day [13]. CC and injection coal was ground in separate plants due to significant difference in Hardgrove grindability index (HGI). Natural gas was injected together with CC fines and pulverized coal (PC), and the total injection rate was up to 165 kg/tHM. In recent successful operational trials conducted within a national project at SSAB in Oxelösund in Sweden, co-grinding and co-injection was shown to be possible with at least up to 10% addition of CC to the injection coal, and no impact could be seen on the process or the PC injection plant. A replacement ratio of 1:1 against carbon in coke and PC was found, and the low impact on process conditions is explained by used CC having quite similar chemical and thermal properties as the PC. Despite significant difference in HGI and bulk density, grinding and injection was feasible with 10% CC addition [14]. Higher added amounts need to be further investigated as significant difference in HGI and bulk density have impact on grinding, segregation and conveying. Bio-coals with higher VM and oxygen content, and lower HHV, could also be an option, but the impact on combustion conditions can be expected to be larger, and the replacement ratio of bio-coal against coke and PC is lower. However, from studies related to PC, it is known that some addition of carbonaceous material with high content of VM may contribute to early ignition and high combustion efficiency [15].
The coke quality in terms of mechanical strength, coke reactivity index (CRI) and coke strength after reaction (CSR) are reported to be negatively affected by adding any type of raw biomass or bio-coal to the coking coal blend [6,7,8,16,17], and therefore, the use of bio-coal in coke-making is a challenge. CSR and CRI are correlated in such a way that if CRI increases, CSR is correspondingly decreased. Dilatation and fluidity are decreased with addition of bio-coal to the coking coal blend [6,7,8,16,18], which may be an indication of negative effects on the coke quality. Addition of smaller CC particles lowered the mechanical strength of coke in ASTM drum tests and CSR less compared to larger particle sizes [16]. On the other hand, the CRI increased more with finer CC particles; this was explained by the fact that the catalytic compounds, such as Ca, were more evenly spread in the coke when using finer particles. In a later study, ref. [17] using three different bio-coals and one particle size, the effect was different. Furthermore, in these trials, when adding 5% bio-coal, the CRI increased and the CSR decreased, but the reduction in coke quality was similar for bio-coals with different VM and ash contents in this study. The catalytic effect was not evident, and the chemical composition of the bio-coal ash was ascribed to play a minor role; the effect on CRI was concluded to be due to the highly reactive carbon structure from bio-coal distributed throughout the coke matrix. However, as the carbonization is influenced simultaneously by several properties of the bio-coal and coking coals, it may be difficult to clearly identify one factor.
Densification of bio-coal may countermeasure lowering of the bulk density of the coking coal blend. The effect of densification was studied by the briquetting of raw biomass [19] and a bio-coal with low VM [17]. Montiano et al. [19] concluded that use of biomass before compaction reduces the bulk density of the coking coal blend, which was not seen with briquetted biomass. In tests with densified briquettes, a larger added amount was possible without declined mechanical strength and reactivity of the coke; further, the porosity was lower when using densified briquettes. Ng et al. [17] noted that the increase in CRI via briquetting of bio-coal was not followed by an equivalent decrease in CSR, which suggests that, with densification of bio-coal, a coke with higher reactivity but relatively high CSR can be produced, and the bio-coal addition to the coking coal blend can be increased to 10%.
Using a reactive coke with sufficient CSR is positive for the BF process, as the thermal reserve zone temperature (TRZT) is lowered due to a lower threshold temperature for the start of the gasification for carbon in coke [20]. This improves the reduction efficiency, as indirect reduction of FeO to Fe can be achieved at a lower CO/CO2 ratio, and the direct reduction is decreased, which saves reducing agents. Further, with higher CRI, remaining coke fines in the tuyere level after combustion will most likely be consumed more easily.
TRZT can be lowered by using highly reactive bio-coal in CCA. As BFs in Sweden operate on 100% pellets, recycling of residues from the steel mill is conducted via top-charging of cold-bonded residue briquettes containing carbonaceous materials and iron oxide. The briquettes are charged into the BF together with pellets, and an important quality parameter is sufficient mechanical strength. The effect of bio-coal on the mechanical strength of briquettes was studied in technical scale [21,22,23] and in industrial scale trials by Mousa et al. [24]. Bio-briquettes were produced in an industrial briquetting plant with the addition of 1.8% of torrefied and pelletized sawdust to the briquette mix with a cement addition of 12%. BF trials with 37% or 55% of charged briquettes being bio-briquettes, which corresponded to 38.7 kg/tHM and 64.2 kg/tHM, respectively, were performed at BF No. 4 at SSAB in Oxelösund. Operation with bio-briquettes resulted in improved gas utilization, and evaluation using a heat and mass balance model indicated lowering of the TRZT by 45 °C compared to normal operation. The modelled total carbon consumption was reduced by 9–11 kg/tHM.
Reported research and experience so far at Swerim indicate that bio-coal can be feasibly ground and injected into the BF, and top-charged as constituent in cold-bonded BF briquettes or metallurgical coke. With existing equipment at the steel-plants and present knowledge, there are upper limits for the amounts possible to introduce via each of the methods without equipment modifications and further technical developments. However, by combining these options, a significant effect on CO2 emissions can be reached. Further, ongoing and recent studies on bio-coke [25] and bio-briquettes [26] aim to push these limits and increase the potential reduction of fossil CO2 emissions. In this paper, some research results, obtained within several European Union (EU) and national projects, and related to each of the methods for BF input, are presented and discussed, and the potential impact on BF CO2 emissions is analyzed, as well as the need for further knowledge to push possible use further.

2. Materials and Methods

2.1. Bio-Coals and PC

Bio-coal produced from woody biomass, derived from stemwood by pre-treatment with different methods and temperatures have been used in the studies. Research using bio-coals have been performed by the authors in several EU, as well as national, projects. The bio-coals and their abbreviations used in this paper, as well as the references to papers reporting results from some of these projects, are presented in Table 1, and in Table 2 the chemical data of PC and bio-coals are shown. The exact chemical composition of one type of bio-coal may vary between batches used in different studies. Two similar types of PC were used in injection trials, the first one with co-injection of torrefied wood with a higher torrefaction degree [27] than the torrefied sawdust (TSD) used in the second trial [28,29].

2.2. Bio-Coal Top-Charged into the Blast Furnace as Bio-Coke or Bio-Briquettes

2.2.1. Bio-Coke in Technical and Semi-Industrial Scale

The effect of using different types of bio-coals in coke-making was investigated using a technical scale coking retort in tests with 2.5 to 5% addition, and in a semi-industrial scale with 2 to 3% addition; all carbonization tests were made at DMT [33]. The retort is charged with 11 kg of coking coal blend, and after carbonization, the coke is tested for CSR/CRI according to the standard method. The mechanical strength, Micum, is determined by tumbling 5 kg in the ISO drum and correlating the results to the standard method through a previously deduced relationship. Micum 40 (M40) correspond to the breakage of coke (% > 40 mm), and Micum 10 (M10) to the abrasion (% < 10 mm). The coking coals consisted of a mixture of prime low, medium, and high volatile coking coals supplied by SSAB. Set points for carbonization tests were 9% moisture, wet bulk density 800 kg/m3, and particle size distribution (PSD) of 18–20% > 3.15 mm and 30–34% < 0.5 mm.
The first carbonization trials [30] were performed in a technical scale with 5% addition of charcoal (CC), and two types of torrefied wood, which had been torrefied at higher temperatures (TWM2 and TWH), see Table 1. In the second carbonization trials in technical scale 2.5 and 5% of torrefied sawdust (TSD), pyrolyzed wood chips (PWC) or highly torrefied pellets (HTT) were added to the coking coal blend [21]. The latter was denser than other bio-coals as white pellets were torrefied. HTT was also added with two different particle sizes, in which one was slightly coarser (HTTc).
Tests on the semi-industrial scale with similar coking coal blends were also carbonized in a semi-industrial scale with the addition of 3% CC, and later, in the 2nd trial, tests with the addition of 3% CC, as well as 2 % and 3% of TWM2, were conducted.
The PSD of bio-coals is shown in Table 3. Compared to the set point for particle distribution, TSD has a lower amount of the coarse fraction. The recipe for the reference (Ref) coking coal blend without bio-coal addition is similar in both studies, but in the first trial the LV coking coal is kept constant, whereas in the second trial, the reduction of coking coals when adding bio-coal is distributed evenly.

2.2.2. Bio-Briquettes

Residues from the integrated steel plant supplied by SSAB Merox were used for technical scale briquette production. Two standard recipes based on the briquette-making at SSAB Oxelösund and SSAB Luleå sites were used. In Oxelösund, the briquetting blend consists of steel mill residues and 8% cement as binder, while at the Luleå site, 11% cement is added as the briquette blend contains a larger part of fine particles. The briquetting blend at both sites is constituted of, e.g., BF dust, basic oxygen furnace dust, filter dust, briquette fines, and fines of steel and de-sulfurization scrap; in Oxelösund, pellet fines are also recycled via the briquettes [23].
The briquettes were produced in a vibro-press machine Teksam VU600/6, according to a procedure described elsewhere [22,23]. The mechanical strength was initially evaluated by drop test, and based on the results, briquettes were tested for tumbler index (TI) according to Swedish standard SS-ISO 3271:2007, but with screening on 6.0 mm instead of 6.3 mm mesh size. The recipes of the SSAB Oxelösund and SSAB Luleå site mixes and bio-coal use are shown in Table 4 and Table 5, respectively.

2.3. Injection of Bio-Coal into Blast Furnace Tuyeres

Injection of bio-coal into the BF, separately or mixed with PC, is a feasible method for the supply of bio-coal; however, some limitations are foreseen. Therefore, the possibility to inject bio-coal into the BF has been studied in several projects, for example:
-
Computational fluid dynamics (CFD) modelling supported by kinetic parameters for occurring chemical reactions of carbonaceous materials determined in the laboratory [27,28,29];
-
Pilot scale tests at an experimental BF, injecting a mix of PC and torrefied biomass (TWM1) [27];
-
One-tuyere tests injecting a mix of torrefied bio-coal (TSD) and PC at SSAB BF No.4 in Oxelösund, Sweden [28,29];
-
Heat and mass balance modelling using a model that is calibrated to determine BF characteristic parameters before use for modelling of bio-coal cases [27,28,29].

2.3.1. CFD Modelling

A three-dimensional, multiphase numerical model of pulverized material injection and combustion was used to explore the raceway conditions in terms of combustion efficiency, gas composition and temperature distribution when injecting bio-coals. Raceway models were developed for an experimental BF, BF No. 4 at SSAB in Oxelösund and BF No. 3 at SSAB in Luleå. Kinetic reaction parameters for devolatilization, combustion and gasification used in the CFD model are deduced from tests with the thermogravimetric analyzer (TGA), whereas parameters connected to homogenous reactions (volumetric) and diffusion are deduced from literature and software. Validation of modelling results is done with data from raceway monitoring, e.g., thermovision camera, high-speed camera, and continuous temperature measurements with optical fiber connected to a spectrometer.
For one-tuyere tests conducted at SSAB in Oxelösund [28,29], the reference case and cases with 20%, 30% and 40% of TSD mixed with PC was modelled using the software ANSYS FLUENT, release 16.2, and the boundary conditions for the fluid flow modelling stated in [34]. The chemical composition of PC and TSD are found in Table 2 and their PSD are shown in Figure 1, together with the PSD used in the model. The largest particles are 2.8 mm for TSD and 0.180 mm for PC; TSD has a low ratio of small particles compared to PC.
The reactions and the kinetic data for those considered in the model calculations are stated in Table 6. Devolatilization is assumed to be a 1st order reaction depending on remaining amounts of volatiles in the particle. The reaction between the gas and particle surface follows the kinetic/diffusion surface reaction model, which assumes that the surface reaction rate is determined either by kinetics or by a diffusion rate; both Arrhenius and eddy dissipation reaction rates are calculated, and the net reaction rate is taken as the minimum of these two rates. In practice, the Arrhenius rate acts as a kinetic switch, preventing reaction before the flame. Once the flame is ignited, the eddy dissipation rate is generally smaller than the Arrhenius rate, and reactions are limid by mixed regime [34].

2.3.2. Pilot Scale Tests in an Experimental BF

Injection of a mix of PC and TWM1 was conducted in trials in an experimental BF [27]. The experimental BF is equipped quite similarly as an industrial BF, but with additional possibilities to collect burden material and measure temperature and gas profiles during operation; the equipment is described in more detail in [27,30]. Operational data related to charging, blast parameters, tapping, heat losses, gas efficiency, stability etc., were collected during the trials and used for evaluation of the experiment in a heat and mass balance model. During the trial, PC and pulverized TWM1 were mixed when the PC silo was filled up, aiming for 20% TWM1 in the injection blend.

2.3.3. One-Tuyere Test at SSAB in Oxelösund

A one-tuyere test with different ratios of TSD mixed with PC was conducted at SSAB in Oxelösund, Sweden. TSD and PC were screened to avoid particles with shapes and sizes that could create a potential risk for plugging, and pre-injection tests were carried out. In the one-tuyere tests, 100% PC injection was conducted through the oxy-coal lance and the blend of PC and TSD was distributed via the coal injection system.
The injection materials were pre-mixed, with ratios % TSD/% PC of 20/80, 30/70 and 40/60. The characteristics of pure materials and some blends of these can be seen in Table 2. Material blends were filled into vessels, which were pressurized to transfer the material into the injection vessel before the start of each test. The material blends were conveyed through a hose and injected via the bio-coal lance using N2 as carrier gas. To be able to achieve the desired mass flow of bio-coal blends, the inner diameter of the lance was 25 mm; this was still the limiting factor for maximum achievable mass flow. The injection rate was adjusted to correspond to an approximately similar mass injection rate of ~600 kg/h used for PC at the other tuyeres, and each injection test was ~2.5 h. In-between tests, PC was supplied to maintain the energy input.
During one-tuyere tests, monitoring of raceway conditions was performed using a high-speed camera, thermovision camera and an optical fiber guiding light from the raceway to a spectrometer, for evaluation of temperature. Collected data was used for evaluation of the trials and validation of CFD modelling results.

2.3.4. Heat and Mass Balance Modelling

After calibration with operational data to deduce BF characteristic parameters, the heat and mass balance model MASMOD, which is a reliable tool for theoretical simulation of alternative operational conditions, e.g., the introduction of bio-coal into the BF, was used for experimental planning and for evaluation of BF trials. Calculations in MASMOD were done iteratively in Microsoft Excel© and more details on the model are reported in [35,36]. MASMOD was initially developed by SSAB Luleå, Sweden and has been further modified in different projects by Swerim.
The results and conditions for the heat and mass balance modelling for evaluation of bio-coal injection trials in the experimental BF are presented in Section 3.2.2, and in Section 3.3, the effect on fossil CO2 emissions with bio-coal input (compositions are stated in Table 2) via bio-briquettes, bio-coke and injection are presented. The concepts are analyzed individually, as well as for a combination of two or three methods.

3. Results

3.1. Bio-Coal Top-Charged into the Blast Furnace as Bio-Coke or Bio-Briquettes

3.1.1. Bio-Coke

The dilatation and fluidity of the coking blends, as well as quality data such as CRI, CSR and Micum of the resulting cokes, are presented in Table 7. The different Ref cokes show different results, but bio-cokes produced during each test run are compared to a corresponding reference. In general, adding bio-coals to the coking coal blend lowered the dilatation and fluidity. Coking coal blends with bio-coals with higher pyrolysis degrees, such as CC, HTT and PWC, show lower dilatation with increasing amounts, except for the coking coal blend containing PWC, and lower fluidity, except for the 3% coking coal blend with CC2. Addition of TSD revealed the lowest dilatation and fluidity compared to the reference coke, and generally these parameters are lowered with increasing amounts of any bio-coal added.
In general, adding bio-coal to the coking coal blend impairs the coke quality in terms of higher CRI and M10, and lower CSR and M40 for bio-coke, in comparison to the corresponding reference coke. Mechanical strength, M40, decreases, and the abrasion M10 increases, with higher added amounts of bio-coals. The exception is for 2% TWM in semi-industrial scale tests, which have similar Micum as Ref 2. The mechanical strength for bio-coke containing HTTc is lower than for the bio-coke containing HTT of finer particle size. The pyrolysis degree of added bio-coal does not correlate with the strength given as Micum, e.g., the torrefied sawdust, TSD, has higher M40 than PWC and HTT.
In general, CRI increases, and CSR decreases, with higher addition of bio-coals compared to each reference coke (see Table 7 and Figure 2). The negative effect is less in bio-cokes containing bio-coals of a higher pyrolysis degree, e.g., CC compared to TWH and TWM2. However, the results for bio-coke containing PWC is similar to those containing TSD. Both coke with 2.5% HTTc and 2.5% HTT (see Figure 2) have slightly higher CSR compared to the corresponding Ref in 2nd technical scale trials, although CRI is higher. In addition, bio-coke containing 5% HTTc and 5% HTT shows similar CSR values but has higher CRI than the reference coke.

3.1.2. Bio-Briquettes

The mechanical strength represented by the tumbler index, TI, as well as the cement addition for residue briquettes produced in technical scale, are shown in Figure 3. Reference briquette with Oxelösund site mix had 8% cement addition, but with the addition of bio-coals the cement content was raised to 10%. After one week of curing, the TI for bio-briquettes with 5% CC addition showed similar strength to the reference briquettes. TI was reduced when adding torrefied material, especially TSD. The mechanical strength was lowered less when adding TSDP and when lower amounts were added. With the Luleå mix, the reference briquette contained 1% cement, and the 5% PWC bio-briquette showed almost as high TI as the reference after four weeks of curing and a similar percentage of cement added. Lowering the bio-coal to 3% PWC resulted in higher TI than for the reference briquette. The cement amount was raised to 12% when adding 3% HTT and 3% TSD; however, also in this case, TSD addition lowered the TI, and bio-briquettes with 3% HTT showed the highest TI.

3.2. Injection of Bio-Coal into Blast Furnace Tuyeres

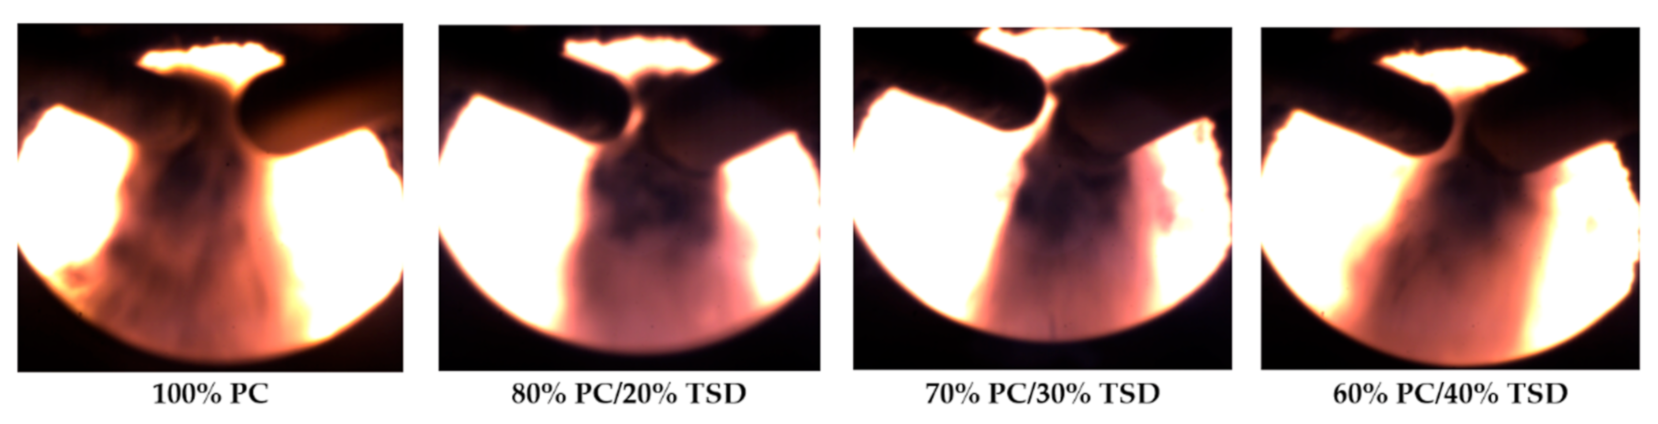
3.2.1. CFD Modelling

As can be seen from Table 8, the highest average temperature reached differs only by 30 °C between the reference case and the case with mixed injection of PC and 40% TSD. By comparing the temperatures deduced from spectrometer measurements during the one-tuyere test, it was found that the temperature difference was less significant compared to the CFD model. This might be explained by the position of the measurement, which was somewhere close to the tuyere exit, while the model temperature is deduced at the position of raceway outlet, where the coke combustion also contributes to the temperature.
For the case with mixed injection of PC and TSD, more coke is combusted (conversion of Ccoke char) when less carbon in the injected auxiliary reductants is combusted (see Table 8), which might explain the small temperature difference for the CFD model at the outlet. When looking into the maximum temperature values in the region of tuyere outlet for the CFD model, the difference was higher. For Reference (100% PC), the maximum temperature was 2633 °C, and for 40% TSD this value was 2442 °C. The difference in maximum temperature is 8%, i.e., in the same range as for the measurements, even though the magnitude differs. It was found that the earlier release of VM and ignition improved the overall combustion efficiency of carbonaceous material. Incomplete devolatilization of TSD is explained by coarser PSD, which significantly influences the behavior of the injected blend of PC and TSD, due to slower heating and less efficient heat transfer for larger particles. If TSD and PC particles are of a similar size, TSD particles are devolatilized earlier.

3.2.2. Pilot Scale Tests in an Experimental BF

Injection of a mix of PC and TWM1 was conducted with up to approximately 24% or 34 kg/tHM of the 144 kg/tHM of the injected blend consisting of TWM1. The data was evaluated using the heat and mass balance model MASMOD. When analyzing the data, it was taken into consideration that the heat losses per hour in general are similar throughout a whole experimental campaign. The total amount of reducing agents used was 560–565 kg/tHM during the reference periods, and 561 kg/tHM during the test period with TWM1 (see Figure 4). As the heat level of hot metal (HM) was lower during the Ref 2 period, it was normalized before comparison of the results. As seen in Figure 5, the gas efficiency was somewhat higher during the test period with TWM1, therefore a lower total input of reducing agents was required. In comparison to the reference periods, the fossil CO2 emissions could be reduced compared with an average of approximately 8% in the two reference periods.

3.2.3. One-Tuyere Test at SSAB in Oxelösund

As a first step in the industrial scale, one-tuyere injection of bio-coal through the raceway was evaluated [28,29]. During the tests, similar heat input via the injected material was aimed for, which was possible up to 40% TSD; above that it was, due to the volume of feed restrictions, not possible to reach the required injection rate with the used injection system due to the low bulk density of TSD.
Lower bulk density and higher VM with increased ratio of TSD in the blend resulted in a larger volume of cold material being introduced in front of the tuyere and a larger amount of VM being volatilized, and the measured temperature was decreased with increased %TSD from roughly 1800 °C to 1750 °C, and further to 1700 °C and 1650 °C in the order 100% PC, 80% PC/20% TSD, 70% PC/30% TSD and 60% PC/40% TSD, respectively. Turbulent movements due to high contents of VM were also noted and, as the TSD was relatively coarse, small wooden sticks could also be seen in the images from the high-speed camera recordings. High volatile content causes energy consuming cracking which also can affect the temperature in front of the tuyere. Examples of collected images are found in Figure 6.

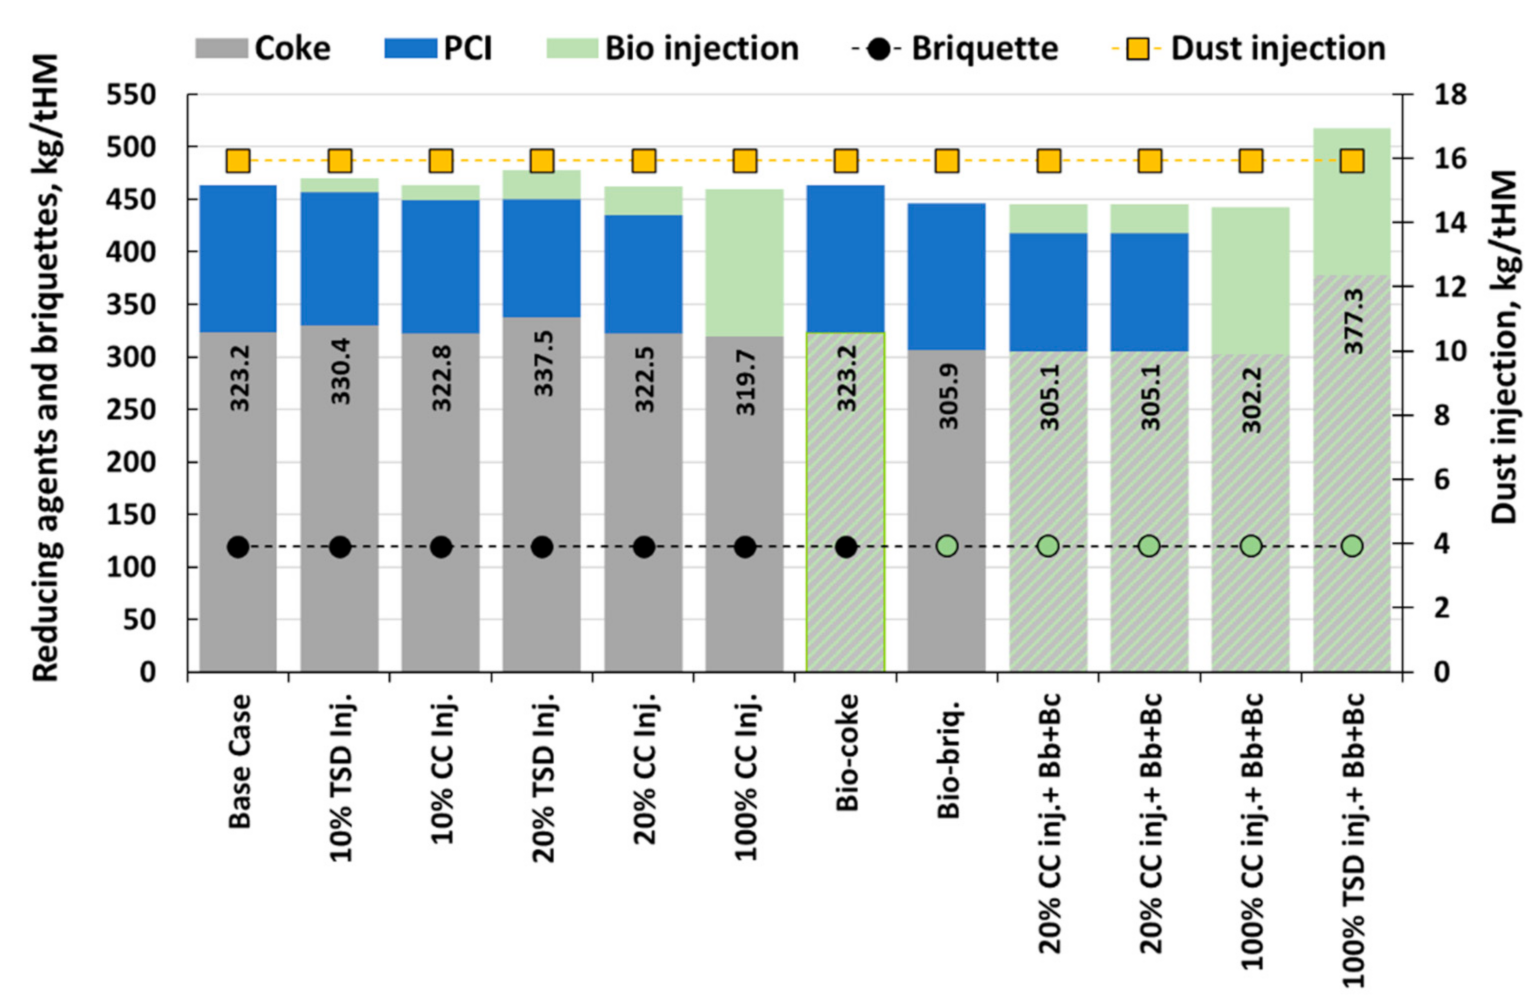
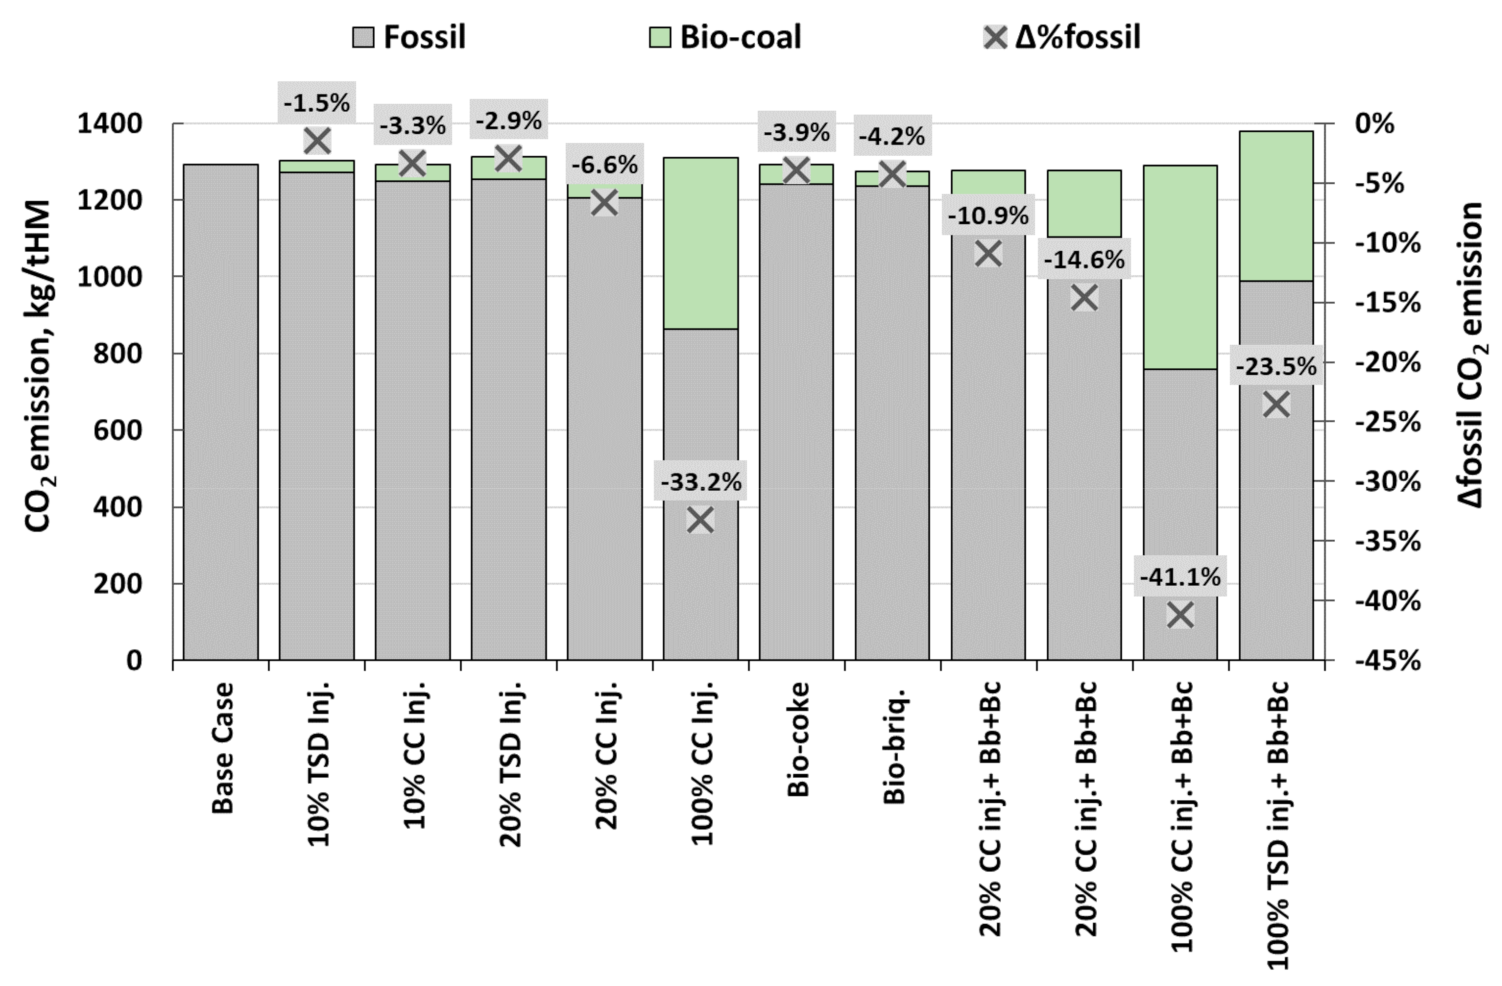
3.3. Effect of Bio-Coal Introduction on BF Conditions and Fossil CO2 Emissions—Modelling Results

The possible effect on the BF conditions and fossil CO2 emissions was estimated by heat and mass balance modelling in MASMOD. A base case was prepared from a calibrated BF model; the data used for calibration included 100% pellet operation, PC injection, dust injection and charging of cold-bonded residue briquettes. BF characteristic parameters, e.g., shaft efficiency, heat losses, and hot metal properties, were kept constant. The effect from bio-coal injection, as well as bio-coke or bio-briquette charging, was analyzed. Settings for different modelled cases from the base case are shown in Table 9. When assuming charging of bio-briquettes, the TRZT was assumed to be lowered with 30 °C, based on experience from BF tests. All modelled cases correspond to feasible operational conditions, e.g., the top gas temperature (TGT) varies between 121–146 °C, and the raceway adiabatic temperature (RAFT) is, in general, within the commonly accepted temperature range of 2000 °C to 2300 °C (calculation results 2072–2112° C). However, for the case with 100% TSD injected in combination with bio-coke and bio-agglomerate charging, the estimated RAFT is 1933 °C, due to higher VM and lower HHV. However, the TGT is 133 °C and it is possible to reach ~50 °C higher RAFT through higher O2 enrichment if TGT is allowed to drop to a few degrees above 100 °C.
The input of reducing agents and bio-coal via different routes in each of the modelled cases presented in Table 9 are shown in Figure 7. The total reductant rate is increased when TSD is injected; as the injection rate is constant, the need for reducing agents is balanced by increased coke rate. CC injection lowers the total need for reducing agents as the content of Cfix and HHV is higher in CC than in PC. Further, low ash content and basic ash of CC also lowers the slag rate and need for limestone, which have some positive impact on the reductant rate. Using bio-briquettes lowers the rate of reducing agents as it contains more carbon than the residue briquettes without bio-coal addition; additionally, lowering of TRZT contributes to higher gas efficiency and thereby lowers the reductant rate.
Impact on the need for reducing agents containing fossil carbon has influenced the fossil CO2 emissions, as can be seen from Figure 8. With similar injection rates of TSD and CC, the latter lowers the fossil CO2 emissions 2.3 times more. If all PC is replaced by bio-coal, it is advantageous to use CC as it will have a minor impact on TGT and RAFT. The highest effect in lowering fossil CO2 emissions is achieved by a combination of bio-briquettes and bio-coke with 100% injection of CC which results in 41% lower fossil CO2 emissions. With 100% injection of CC the fossil CO2 emissions are lowered by 33%. The use of either bio-coke or bio-briquette lowers the fossil CO2 emissions by roughly 4%.

4. Discussion

Each of the methods for introducing bio-coal into the BF, bio-coke, bio-briquettes and bio-coal injection, may include some restrictions in the amounts possible to supply; however, by combining these methods, significant lowering of CO2 emissions can be achieved. The possible impact on CO2 emissions was theoretically analyzed using the BF model MASMOD, assuming the use of bio-coke containing 5% highly torrefied bio-coal (HTT), bio-briquettes with 10% addition of CC and 100% bio-coal injection of TSD or CC, respectively. It was found that lowering fossil CO2 emissions by up to 23% or 41% is possible for TSD and CC injection, respectively, when combining the injection with bio-coke and bio-briquettes. For the CC injection case, carbon present as CO and CO2 in the top gas corresponds to 531 kg carbon neutral CO2/tHM. As a result, electricity and hot water for district heating will be partly CO2 neutral as well. If applying CCUS on the off-gas, it is possible to capture more CO2 than the amount corresponding to the fossil one, and thereby achieving negative fossil CO2 emissions. With 20% CC in the injected blend combined with bio-coke and bio-briquette charging, the savings are ~15%.
The largest uncertainty is the use of bio-coal in coke, as industrial studies so far are not available. As mechanical strength, CSR and CRI of the coarse coke is crucial for BF process stability and permeability, bio-coke quality must be close to the quality of metallurgical coke without bio-coal. Adding bio-coal to the coking coal blend lowers the resultant bio-coke’s mechanical (M40) and hot strength (CSR), with an increase in coke reactivity (CRI) and fines generation (M10) compared to reference coke. Different types of biomasses, depending on their origin and properties after pre-treatment, seem to affect the dilatation and fluidity of the coking coal blend and the bio-coke properties. Pyrolyzed woody biomass generally has a less negative effect than torrefied biomass. The exception is for PWC; a quite low density, porous material of pyrolyzed wood chips and bio-coke containing this bio-coal shows almost as high CRI as bio-coke containing TSD. The results from adding any of these two bio-coals may be an effect of adding larger amounts of inert bio-coal by volume to the coking coal blend. HTT is denser as it is produced by high temperature torrefaction of white pellets, and bio-coke containing HTT shows almost as high CSR as the reference coke also at 5% addition. This is in line with reported results of briquetting of bio-coal [17]. CRI was increased, but it is not necessarily negative for the BF process, as using a higher reactive carbon-material lowers the TRZT and enhances the reduction of iron oxide into metallic iron, which lowers the consumption of reducing agents. Further, higher reactivity of unburnt coke fines at the tuyere level enhances their consumption, which is beneficial for the permeability.
Partly substituting coking coals with bio-coals, even at a low amount, can result in substantial effects on CO2 emissions. Mathieson et al. [37] reported that replacing 2–10% of coking coals with charcoal will give 0.02–0.11 tonnes of carbon neutral CO2/t crude steel, or 5–10%, for a coke usage of 300–350 kg-coke/tHM. Experimental results show that the addition of 5% HTT to the coking coal blend gives the possibility of achieving sufficient CSR. Heat and mass balance modelling shows that charging bio-coke containing 5% HTT to the BF will reduce the fossil CO2 emissions by 4%, and CO and CO2 in the BF top gas correspond to 51 kg carbon neutral CO2/tHM.
Adding bio-coal to the cold-bonded residue briquette shows that sufficient mechanical strength for the BF top-charging can be achieved. With 5% addition of pyrolyzed bio-coals, such as CC and PWC, the mechanical strength of the briquette without bio-coal addition could be maintained. When using torrefied bio-coals, the amount must be decreased, or the cement addition increased to get sufficient strength. Densifying the TSD as pellets is beneficial for the strength, as well as torrefying at a higher temperature, i.e., decreasing the VM. In the case of combining them, using white pellets for torrefaction at a higher temperature, the mechanical strength is improved, but not as much as by using pyrolyzed bio-coal. On-going studies with higher additions of pyrolyzed bio-coals to the cold-bonded residue briquette show promising results using up to 10% [26]. This reduces the fossil CO2 emissions by approximately 4%.
The injection of bio-coal can be done separately or in a mix with PC; the latter has the benefits of controlled moisture and PSD of bio-coal when co-grinded. During outdoor storage, bio-coals tend to adsorb moisture, and thereby consume more energy and result in lower RAFT. Further, coarse particles will result in delayed heating and devolatilization. Additions of 10% CC to the injection coal was shown feasible, but higher additions or use of a torrefied material needs further investigation to secure the operation of the PC injection plant. As similar types of grinding facilities can be used for CC, it is likely possible to adjust the parameters for grinding of 100% CC. It is unknown whether other ratios of CC in blend with injection coal can be co-grinded, which is important if varying the mix over time, e.g., due to availability of CC.
The benefit of CC is high Cfix and HHV, and low oxygen content, which makes it thermally exchangeable to PC, and most likely, variation of the ratios of PC and CC under such prerequisites will not be notable in the process. Varying content of, e.g., TSD, in the blend for injection will contribute to variations in RAFT and TGT, but also vary the need for coke if the total amount of injected blend is kept constant. This can contribute to undesired process variations. Torrefied bio-coals with high VM content have the benefit of enhancing the combustion efficiency but will give lower replacement ratios towards coke and PC. CFD modelling shows a higher total combustion efficiency of bio-coal, PC and coke with TSD, which is beneficial for the BF permeability. Experimental and modelling results indicate that CC injection is feasible from process perspectives, and CC with high Cfix content can contribute to lowering the reductant rate. The fossil CO2 emissions related to BF ironmaking can be lowered by up to 33% when injecting 140 kg CC/tHM. Part of these CO2 savings are related to less need for limestone as bio-coal ash is basic, and also related to a lower slag rate due to lower input of ash oxides, as CC is low in ash content. A torrefied material with high VM and oxygen content is less efficient when it comes to replacing coke and coal, and the impact on the process is significant. Nevertheless, it could still be possible to lower the fossil CO2 emissions by ~15%.

5. Conclusions

The assessment on introducing bio-coal into the blast furnace via bio-coke, bio-briquettes and bio-coal injection shows that these addition methods are possible. Industrial results verify that injection of up to 10% of bio-coal mixed with coal or addition of some percentages of bio-coal to residue briquettes can be applied in the short term and reduce the fossil CO2 emissions if enough bio-coal is available.
Theoretically, 5% high temperature torrefied white pellets added to the coking coal blend, or 10% charcoal added to the residue briquettes, can each reduce the fossil CO2 emissions by roughly 4%, whereas 100% charcoal or torrefied sawdust injection with 140 kg/tHM can reduce it by 33% or 15%, respectively. The effect from applying combined methods can be roughly estimated by calculating the sum of individual effects.
Replacing injection coal with pyrolyzed or highly torrefied biomass, with fixed carbon and a higher heating value close to the one of injection coal, causes the least impact to the blast furnace conditions. Variation in the added percentage of bio-coal to the injection coal will not be noticeable and can be allowed to vary with availability and deviations in blend.
Added percentage of torrefied high volatile containing bio-coal to the injection coal must be closely monitored to avoid variation in heat level, but it has the advantage of contributing to higher total combustion efficiency at the tuyere level.

Author Contributions

L.S.Ö. and M.L. have contributed equally to the studies and preparation of the manuscript, as well as to the acquirement of funding. All authors have read and agreed to the published version of the manuscript.

Funding

This research received no external funding and is based on several research studies funded by the Swedish Energy Agency, Research Fund for Coal and Steel, and the Centre of Advanced Mining and Metallurgy at Luleå University of Technology.

Data Availability Statement

Not applicable.

Acknowledgments

Support from SSAB in the industrial trials at their BF and by providing raw material for experiments is highly appreciated. The authors are grateful to LKAB for making it possible to make experiments in the experimental BF, and to the efforts of bio-coal producers providing bio-coal for experiments.

Conflicts of Interest

The authors declare no conflict of interest. The funders had no role in the design of the study; in the collection, analyses, or interpretation of data; in the writing of the manuscript; or in the decision to publish the results.

Abbrevations

BFBlast furnace
CCCharcoal
CCACarbon composite agglomerates
CFD Computational fluid dynamics
CRICoke reactivity index
CSRCoke strength after reaction
EUEuropean Union
GHGGreenhouse gas
HGIHardgrove grindability index
HHVHigher heating value
HMHot metal
HTTHighly torrefied white pellets produced from sawdust
HTTcHighly torrefied white pellets produced from sawdust, coarser fraction
M10Micum 10
M40Micum 40
PCPulverized coal
PSDParticle size distribution
PWCPyrolyzed wood chips
RAFTRaceway adiabatic temperature
RefReference
TGAThermogravimetric analyzer
tHMton of hot metal
TGT Top gas temperature
TITumbler index
TRZTThermal reserve zone temperature
TSDTorrefied sawdust
TRDPTorrefied and pelletized sawdust
TWH Torrefied/pyrolysed wood at even higher temperature
TWM1 and TWM2Torrefied wood at higher temperature
VMVolatile matter

References

  1. Steel’s Contribution to A Low Carbon Future and Climate Resilient Societies—World Steel Position Paper, World Steel Association. 2020. Available online: https://www.worldsteel.org/en/dam/jcr:7ec64bc1-c51c-439b-84b8-94496686b8c6/Position_paper_climate_2020_final.pdf (accessed on 20 December 2020).
  2. European Commission Energy 2030 Strategy and the 2050 Energy Roadmap. Available online: https://ec.europa.eu/energy/taxonomy/energy-strategy_en (accessed on 20 December 2020).
  3. Watakabe, S.; Miyagawa, K.; Matsuzaki, S.; Inada, T.; Tomita, Y.; Saito., K.; Osame, M.; Sikström, P.; Sundqvist Ökvist, L.; Wikström, J.-O. Operation Trial of Hydrogenous Gas Injection of COURSE50 Project at an Experimental Blast Furnace. ISIJ Int. 2013, 53, 2065–2071. [Google Scholar] [CrossRef] [Green Version]
  4. HYBRIT. Available online: https://www.hybritdevelopment.com/ (accessed on 20 December 2020).
  5. H2 Green Steel. Available online: https://www.h2greensteel.com/ (accessed on 28 May 2021).
  6. Suopajäarvi, H.; Umeki, K.; Mousa, E.; Hedayati, A.; Romard, H.; Kemppainen, A.; Wang, C.; Phounglamcheik, A.; Tuomikoski, S.; Norberg, N.; et al. Use of biomass in integrated steelmaking—Status quo, future needs and comparison to other low-CO2 steel production technologies. Appl. Energy 2018, 213, 384–407. [Google Scholar] [CrossRef] [Green Version]
  7. Mousa, E.; Wang, C.; Riesbeck, J.; Larsson, M. Biomass applications in iron and steel industry: An overview of challenges and opportunities. Renew. Sustain. Energ. Rev. 2016, 65, 1247–1266. [Google Scholar] [CrossRef]
  8. Suopajäarvi, H.; Kemppainen, A.; Haapakangas, J.; Fabritius, T. Extensive review of the opportunities to use biomass-based fuels in iron and steelmaking processes. J. Clean. Prod. 2017, 148, 709–734. [Google Scholar] [CrossRef]
  9. Wei, W.; Mellin, P.; Yang, W.; Wang, C.; Hultgren, A.; Salman, H. Utilization of Biomass for Blast Furnace in Sweden—Report I: Biomass Availability and Upgrading Technologies; KTH: Stockholm, Sweden, 2013; ISBN 978-91-7501-989-5. [Google Scholar]
  10. Åberg, K. Biomass Conversion through Syngas-Based Biorefineries: Thermochemical Process Integration Opportunities. Ph.D. Thesis, Department of Applied Physics and Electronics, Umeå University, Umeå, Sweden, 2017. [Google Scholar]
  11. Phanphanich, M.; Mani, S. Impact of torrefaction on the grindability and fuel characteristics of forest biomass. Bioresour. Technol. 2011, 102, 1246–1253. [Google Scholar] [CrossRef] [PubMed]
  12. Mathieson, J.G.; Somerville, M.; Deev, A.; Jahanshahi, S. Chapter 19 Utilization of biomass as an alternative fuel in ironmaking. In Iron Ore: Mineralogy, Processing and Environmental Sustainability, 1st ed.; Lu, L., Ed.; Woodhead Publ. Elsevier Ltd.: Cambridge, UK; Waltham, MA, USA, 2015; pp. 581–609. [Google Scholar] [CrossRef]
  13. Bittencourt Marques, M.; Rodrigues Assis, A.; Benício Dias, S.M.; Harley Araújo, F.; Junqueira dos Santos, R. Co-injeção de gás natural moinha de carvão vegetal e carvão mineral no alto-forno “A” da Arcelormittal monlevade. In Proceedings of the 41 Seminário de Redução de Minério de Ferro e Matérias-Primas Conference, Vila Vehla, Brazil, 12–16 September 2011. [Google Scholar]
  14. Swedish Energy Agency. Bio-Coal for Lowering Fossil Greenhouse Gas Emissions from the Blast Furnace (BIO4BF); 44676–1 Final Report, (1 September 2017 to 30 April 2021); Swedish Energy Agency: Eskilstuna, Sweden, 2021. [Google Scholar]
  15. Kamijou, T.; Shimizu, M. Chapter 4 PC combustion in blast furnace. In Advanced Pulverized Coal Injection Technology and Blast Furnace Operation, 1st ed.; Ishii, K., Ed.; Pergamon Elsevier Science Ltd.: Oxford, UK, 2000; pp. 72–73. ISBN 978008043651/9780080546353. [Google Scholar]
  16. Ng, K.W.; Giroux, L.; MacPhee, T.; Todoschuk, T. Incorporation of Charcoal in Coking Coal Blend—A Study of the Effects on Carbonization Conditions and Coke Quality. In Proceedings of the AISTech Iron & Steel Technology Conference and Exposition, Atlanta, GA, USA, 7–10 May 2012. [Google Scholar]
  17. Ng, K.W.; Huang, X.; Giroux, L. Incorporation of Biocarbon in Cokemaking via Partial Briquetting. In Proceedings of the AISTech Iron & Steel Technology Conference and Exposition, Pittsburgh, PA, USA, 6–9 May 2019. [Google Scholar] [CrossRef]
  18. Guerrero, A.; Diez, M.A.; Borrego, A.G. Influence of charcoal fines on the thermoplastic properties of coking coals and the optical properties of the semicoke. Int. J. Coal Geol. 2015, 147, 105–114. [Google Scholar] [CrossRef] [Green Version]
  19. Montiano, M.G.; Díaz-Faes, E.; Barriocanal, C. Partial Briquetting vs Direct Addition of Biomass in Coking Blends. Fuel 2014, 137, 313–320. [Google Scholar] [CrossRef] [Green Version]
  20. Biswas, A.K. Chapter 3.6 The Fe-O-C System. In Principles of Blast Furnace Ironmaking: Theory and Practice; Cootha Publishing House: Brisbane, Australia, 1981; pp. 72–76. ISBN 0949917087/9780949917089. [Google Scholar]
  21. Bio Reducing Agents for Metallurgical Processes (Bio4Metals) (1 January 2016 to 30 April 2019), Funded Mainly by European Commission in the European Regional Development Fund., by the Counties of Norrbotten and Västerbotten and Participating Partners.
  22. Swedish Energy Agency. Improved Energy Efficiency of Blast Furnace Process by Using Bio-Agglomerate (Bio-Agglomerate); 39150-1 Final Report, (1 January 2015 to 30 June 2018); Swedish Energy Agency: Eskilstuna, Sweden, 2015. [Google Scholar]
  23. Muosa, E.; Lundgren, M.; Sundqvist Ökvist, L.; Wedholm, A.; Söderström, D. Potential of briquetting in residues recirculation and biomass implementation in ironmaking. In Proceedings of the METEC & 4th ESTAD Conference, Düsseldorf, Germany, 24–28 June 2019. [Google Scholar]
  24. Mousa, E.; Lundgren, M.; Sundqvist Ökvist, L.; From, L.-E.; Robles, A.; Hällsten, S.; Sundelin, B.; Friberg, H.; El-Tawil, A. Reduced Carbon Consumption and CO2 Emission at the Blast Furnace by Use of Briquettes Containing Torrefied Sawdust. J. Sustain. Met. 2019, 5, 391–401. [Google Scholar] [CrossRef] [Green Version]
  25. Bio-Coal as Raw Material in Coke for Lower CO2-Emission in Metal Production, FORMAS FR-2018/0010, 1 January 2019 to 31 December 2021.
  26. Swedish Energy Agency. Reduced CO2 Emission through Designed Bio-Coal in the Residue Briquette for the Blast Furnace (MICO); 48843-1, (1 July 2019 to 30 June 2022); Swedish Energy Agency: Eskilstuna, Sweden, 2019. [Google Scholar]
  27. Sundqvist Ökvist, L.; Hu, X.; From, L.-E.; Sandström, D.; Ölund, M.; Hirsch, A.; Mittelstädt, M.; Bolle, M.; Hensmann, M.; Möhring, S.; et al. Improved Coal Combustion under Variable Blast Furnace Conditions (IMPCO), Final Report EUR 29519 EN; Publications Office of the European Union: Luxembourg, 2018; ISBN 978-92-79-98296-5. [Google Scholar]
  28. Sundqvist Ökvist, L.; From, L.-E.; Ölund, M.; Orre, J.; Sundelin, B.; Ahmed, H. Lowering of CO2 Emissions at the BF by Using Bio-coal—Theoretical and Practical Possibilities and Limitations. In Proceedings of Association for Iron and Steel AISTech 2018 Conference, Philadelphia, PA, USA, 7–10 May 2018.
  29. Swedish Energy Agency. Lowered CO2 Emission by Using Hydrogen-Rich and Renewable Reducing Agents (RedCO2withH2); 41036-1 Final Report, (11 October 2015 to 3 October 2018); Swedish Energy Agency: Eskilstuna, Sweden, 2018. [Google Scholar]
  30. Lundgren, M.; Sundqvist Ökvist, L.; Brum, J.; Hirsch, A.; Hedkvist, D.; Svensson, T.; Sundkvist, P.; Pein, K.; Lagerwall, P.; Hagemalm, P.; et al. Flexible Production of Coke Using Alternative Coals—Effects on Coke Properties under Blast Furnace conditions (FLEXCOKE), Final Report EUR 29541 EN; Publications Office of the European Union: Luxembourg, Germany, 2019; ISBN 978-92-79-98346-7. [Google Scholar]
  31. El-Tawil, A.A.; Ahmed, M.H.; Sundqvist Ökvist, L.; Björkman, B. Devolitalization Kinetics of Different Types of Bio-Coals Using Thermogravimetric Analysis. Metals 2019, 9, 168. [Google Scholar] [CrossRef] [Green Version]
  32. El-Tawil, A.A.; Ahmed, M.H.; Sundqvist Ökvist, L.; Björkman, B. Self-Reduction Behavior of Bio-Coal Containing Iron Ore composites. Metals 2020, 10, 133. [Google Scholar] [CrossRef] [Green Version]
  33. Gajic, D.; Kaiser, M. New Findings from the DMT Small-Scale Coking Test Retort Regarding Coke Quality and Coke Oven Wall Safety. In Proceedings of the AISTech Iron & Steel Technology Conference and Exposition, Atlanta, GA, USA, 7–10 May 2012; pp. 237–246. [Google Scholar]
  34. ANSYS FLUENT Theory Guide, Release 14.5; ANSYS, Inc.: Canonsburg, PA, USA, 2012.
  35. Hooey, P.L.; Bodén, A.; Wang, C.; Grip, C.-E.; Jansson, B. Design and Application of a Spreadsheet-based Model of the Blast Furnace Factory. ISIJ Int. 2010, 50, 924–930. [Google Scholar] [CrossRef]
  36. Sundqvist Ökvist, L.; Lagerwall, P.; Sundelin, B.; Orre, J.; Brämming, M.; Lundgren, M. Low CO2 ironmaking in the blast furnace: Roheisenerzeugung im Hochofen mit niedrigen CO2 Emissionen. Stahl Eisen 2017, 137, 29–37. [Google Scholar]
  37. Mathieson, J.; Rogers, H.; Somerville, M.; Ridgeway, P.; Jahanshahi, S. Use of Biomass in the Iron and Steel Industry-An Australian Perspective. In Proceedings of the METEC and of 6th European Coke and Ironmaking Conference, Düsseldorf, Germany, 27 June–1 July 2011. [Google Scholar]
Figure 1. Particle size distribution (PSD) and mathematical representation by a Rosin–Rammler distribution (RRD), modified from [28,29].
Minerals 11 00863 g001
Figure 2. CRI, CSR correlation between coking coal blends containing different bio-coals, after [21,30].
Minerals 11 00863 g002
Figure 3. Tumbler index, TI, and cement content in residue briquettes produced in technical scale. For briquettes based on Oxelösund and Luleå site mix, TI was determined after one week and four weeks of curing, respectively.
Minerals 11 00863 g003
Figure 4. Use of coke, PC and TWM1 during a reference operation and when injecting a mix of PC and TWM1.
Minerals 11 00863 g004
Figure 5. Gas efficiency during reference periods and test period with PC and TWM1.
Minerals 11 00863 g005
Figure 6. Typical image snapshots from high-speed camera recordings from each of the trial cases.
Minerals 11 00863 g006
Figure 7. Input of reducing agents and information on bio-coal related input; bio-coke is indicated by green/gray and coke with gray color of staples. Coke rate is indicated. Bb = Bio-briquette, Bc = Bio-coke. PCI = PC injection.
Minerals 11 00863 g007
Figure 8. Effect on CO2 emissions by introducing bio-coal via injection, via coke or as part of a bio-briquettes or a combination of the above. Bb = Bio-briquette, Bc = Bio-coke.
Minerals 11 00863 g008
Table 1. Bio-coals used in different studies conducted at Swerim and the abbreviations used in this paper.
Bio-CoalAbbreviation
Torrefied sawdust & torrefied and pelletized sawdust [21,22,23,24,28,29]TSD & TSDP
Torrefied wood at higher temperature, IMPCO [27]TWM1
Torrefied wood at higher temperature, FLEXCOKE [30] TWM2
Torrefied/pyrolyzed wood at even higher temperature [30]TWH
Pyrolyzed charcoal of barbecue type [22,23,30,31,32]CC
Highly torrefied white pellets produced from sawdust [21]HTT
Pyrolyzed wood chips [21]PWC
Table 2. Material characteristics of pulverized coal (PC) and bio-coals, all data except HHV (MJ/kg) are given in weight percent (wt.%).
PC [27]PC [28,29]TSD, TSDPTWM1 TWM2TWHHTTCCPWC
C79.181.757.0–57.570.4--79.087.0 87.2
H4.14.15.5–5.95.1--4.03.4 2.3
O4.43.936.4–36.723.5--15.58.36.1
VM18.419.873.5–75.650.339.618.029.212.1 12.0
Ash10.88.40.40–0.450.90.60.91.30.9 3.9
S0.290.280.010.010.010.010.010.01 0.01
P 0.030.020.010.010.010.010.010.0030.03
C fix 170.871.824.0–26.148.8 59.881.169.587.1 84.1
CaO 0.660.650.160.240.270.430.32 0.25 0.51
K2O0.180.140.07–0.110.110.060.070.140.08 0.20
Fe2O30.840.870.02–0.070.020.0040.0050.090.04 0.97
SiO25.123.840.030.080.050.070.260.17 0.97
MgO0.280.240.020.050.070.110.060.07 0.12
Al2O32.431.920.010.010.010.020.020.08 0.20
HHV 231.332.523.028.1--30.332.7 32.9
1 Calculated Cfix = 100-VM-ash, 2 MJ/kg.
Table 3. Particle size distribution of bio-coals used in DMT retort tests [21].
wt.%TSDPWCHTTHTTc
>2.8 mm142142100
2.8–0.5 mm545347
<0.5 mm322632
Table 4. Reference and bio-briquette recipes with SSAB Oxelösund residue mix [22,23].
RecipeSteel Mill Residue Mix, wt.%Cement, wt.%Bio-Coal, wt.%Bio-Coal Type
R09280-
R885105TSD
R985105Crushed TSDP
R1085105TSDP
R1187103TSDP
R1285105CC
Table 5. Reference and bio-briquette recipes with SSAB Luleå residue mix [21].
RecipeSteel Mill Residue Mix, wt.%Cement, wt.%Bio-Coal, wt.%Bio-Coal Type
R089110-
R1a84115PWC
R786113PWC
R885123HTT
R985123TSD
Table 6. Chemical reactions and kinetic parameters used in the CFD model calculations.
DevolatilizationArrhenius RateEddy Dissipation Rate
Raw coalVolatile Matter (VM)
Char (s) + Residue (Ash)
APC 3.68 × 10⁹
EPC 1.02 × 10⁸
ABio 3.68 × 10⁹
EBio 1.11 × 10⁸
Homogenous Reactions
VM PC + 3.37 O2 → 1.62 CO + 0.47 CO2 + 4.74 H2O + 0.17 N2 + 0.02 SO2A 2.12 × 10¹¹
E 2.03 × 10⁸
AEDM 4.00
BEDM 0.500
VM Bio + 1.43 O2 → 1.65 CO + 0.48 CO2 + 1.58 H2O + 0.002 N2 + 0 SO2
CO + 0.5 O2→ CO2A 1.00 × 10¹⁵
E 1.00 × 10⁸
H2 + 0.5 O2→ H2O
CO + H2O→ CO2 + H2
CO2 + H2 → CO + H2O
Heterogeneous Reactions
C (s) + 0.75 O2 → 0.5 CO + 0.5 CO2 APC 234
ABio 2.98 × 10⁵
Acoke 234
EPC 1.03 × 10⁸
EBio 1.14 × 10⁸
Ecoke 9.00 × 10⁷
C 5.00 × 10⁻¹¹
C (s) + CO2 → 2 COAPC 11
ABio 260
Acoke 11
EPC 1.83 × 10⁸
EBio 1.76 × 10⁸
Ecoke 2.40 × 10⁸
C (s) + H2O → CO + H2APC 1.5
ABio 1.5
Acoke -
EPC 1.50 × 10⁸
EBio 1.50 × 10⁸
Ecoke -
Table 7. Dilatation, maximum fluidity, CRI, CSR and Micum values for different tests at DMT.
DMTSampleDilatation, %Max. Fluidity, DDPMCRI, %CSR, %M40, %M10, %
1st Technical
Scale test [30]
Ref 6324521.168.278.88.1
5% CC 4013927.562.974.69.1
5% TWM2254031.159.275.98.8
5% TWH3814331.260.076.98.6
2nd Technical
Scale test [21]
Ref 4826328.657.680.77.0
2.5% TSD3416831.056.479.97.4
5% TSD−109836.546.676.47.7
2.5% PWC3524732.453.677.57.4
5% PWC3514435.044.975.58.4
2.5% HTT4220730.357.277.87.1
5% HTT4110831.857.878.57.8
2.5% HTTc4819429.958.576.78.0
5% HTTc4311431.657.577.07.9
Semi-
industrial scale test [21]
Ref 1 8019122.267.884.36.4
3% CC15722123.964.180.27.5
Ref 26728620.868.879.08.4
3% CC2397623.162.577.59.8
3% TWM2408025.361.077.411.1
2% TWM24212223.762.880.18.5
Table 8. Combustion characteristics as deduced from the CFD model, data from [29].
Reference40TSD/60PC30TSD/70PC20TSD/80PC
PCTSDPCTSDPCTSDPC
Degree of devolatilization of PC & Bio10064.110063.510062.0100%
Conversion of CPC/Bio VM 15.613.711.010.012.36.713.7g/s
Conversion of CPC/Bio char 61.50.439.70.350.90.250.9g/s
Conversion of CPC & Bio converted 77.164.867.871.5g/s
Conversion of Ccoke char57.961.359.761.3g/s
Total conversion of C 135.0126.1127.5132.8g/s
Burn out of VM in PC & Bio82.743.193.542.189.842.388.2%
Burn out of CPC/Bio char 49.03.752.73.751.43.750.6%
Burn out of CPC/Bio total53.450.351.152.2%
Burn out of CPC/Bio/coke total 25.0%24.0%24.124.9%
Start of combustion, position from lance tip 74616569mm
Highest average temp.2065203520462050°C
Table 9. Theoretically evaluated cases regarding effect on operational conditions and on CO2 emissions.
Inj. Rate, kg/tHM%Bio-Coal%PCBio-Briquette, kg/tHMBriquettes, kg/tHMCoke 1Bio-Coke 1
Base case140-100-120x
Inj. of 10% TSD1401090-120x
Inj. of 10% CC1401090-120x
Inj. of 20% TSD1402080-120x
Inj. of 20% CC1402080-120x
Inj. of 100% CC140100--120x
Bio-coke with 5% HTT140-100-120 x
Bio-briquettes with 10% CC140-100120-x
Bio-briquettes with 10% CC + Inj. of 20% CC1402080120-x
Bio-briquettes with 10% CC + Inj. of 20% CC + bio-coke with 5% HTT1402080120--x
Bio-briquettes with 10% CC + Inj. of 100% CC + bio-coke with 5% HTT140100-120--x
Bio-briquettes with 10% CC + Inj. of 100% TSD + bio-coke with 5% HTT140100-120--x
1 The coke rate is estimated in the model calculation.
Publisher’s Note: MDPI stays neutral with regard to jurisdictional claims in published maps and institutional affiliations.

