
Selective Disintegration Justification Based on the Mineralogical and Technological Features of the Polymetallic Ores

 ,
, 
 ,
,  and
and
Abstract
:1. Introduction
- selective destruction of materials by separative characteristics (e.g., selective opening of ore minerals from host rocks);
- selective destruction by shape (obtaining products of a given geometric shape);
- size-selective destruction (to obtain the maximum yield of the product of a given size).
2. Materials and Methods
3. Results
4. Conclusions
Author Contributions
Funding
Data Availability Statement
Conflicts of Interest
References
- Litvinenko, V.S. Russian state policy in the field of mineral resources and legislative support for mining relations. J. Min. Inst. 2005, 166, 8–10. [Google Scholar]
- Litvinenko, V.S. Digital economy as a factor in the technological development of the mineral sector. Nat. Resour. Res. 2020, 29, 1521–1541. [Google Scholar] [CrossRef]
- Chanturiya, V.A.; Vaysberg, L.A.; Kozlov, A.P. Promising trends in investigations aimed at all round utilization of mineral raw materials. Obogashchenie Rud 2014, 2, 3–9. [Google Scholar] [CrossRef]
- Nevskaya, M.; Cherepovitsyn, A. Justification of an approach to an economic assessment of projects development of technogenic mineral objects. IOP Conf. Ser. Earth Environ. Sci. 2019, 302, 1–6. [Google Scholar] [CrossRef]
- Kruk, M.N.; Guryleva, N.S.; Cherepovitsyn, A.E.; Nikulina, A.Y. Opportunities for improving the corporate social responsibility programs for metallurgical companies in the arctic. Non-Ferr. Met. 2018, 44, 3–6. [Google Scholar] [CrossRef]
- Vaisberg, L.A.; Kononov, O.V.; Ustinov, I.D. Fundamentals of Geometallurgy; Russian Collection: St. Petersburg, Russia, 2020; p. 376. [Google Scholar]
- Alexandrova, T.N.; O’Connor, C. Processing of platinum group metals ores in Russia and South Africa: Current state and prospects. Journal of Mining Institute. 2020, 244, 462–473. [Google Scholar] [CrossRef]
- Romashev, A.O. Use of additive technologies to optimize design of classifying devices. IOP Conf. Ser. Mater. Sci. Eng. 2019, 665, 012009. Available online: https://iopscience.iop.org/article/10.1088/1757-899X/665/1/012009/pdf (accessed on 10 June 2021). [CrossRef]
- Mariano, R.A.; Evans, C.L.; Manlapig, E. Definition of random and non-random breakage in mineral liberation—A review. Miner. Eng. 2016, 94, 51–60. [Google Scholar] [CrossRef]
- Vizcarra, T.G.; Wightman, E.M.; Johnson, N.W.; Manlapig, E.V. The effect of breakage mechanism on the mineral liberation properties of sulphide ores. Miner. Eng. 2010, 23, 374–382. [Google Scholar] [CrossRef]
- Lois-Morales, P.; Evans, C.; Weatherley, D. Characterising tensile strength and elastic moduli of altered igneous rocks at comminution scale using the short impact load cell. Powder Technol. 2021, 388, 343–356. [Google Scholar] [CrossRef]
- Wang, Y. Numerical modelling of heterogeneous rock breakage behaviour based on texture images. Miner. Eng. 2015, 74, 130–141. [Google Scholar] [CrossRef]
- Hopunov, E.A. Selective Destruction of Mineral and Anthropogenic Raw Materials. In Beneficiation and Metallurgy; UIPC LLC: Ekaterinburg, Russia, 2013; p. 429. [Google Scholar]
- Morrell, S. A method for predicting the specific energy requirement of comminution circuits and assessing their energy utilisation efficiency. Miner. Eng. 2008, 21, 3. [Google Scholar] [CrossRef]
- Hesse, M.; Popov, O.; Lieberwirth, H. Increasing efficiency by selective comminution. Miner. Eng. 2017, 103–104, 112–126. [Google Scholar] [CrossRef]
- Lieberwirth, H.; Kühnel, L. Particle size effects on selectivity in confined bed comminution. Minerals 2021, 11, 342. [Google Scholar] [CrossRef]
- Lvov, V.; Sishchuk, J.; Chitalov, L. Intensification of bond ball mill work index test through various methods. In Proceedings of the International Multidisciplinary Scientific GeoConference Surveying Geology and Mining Ecology Management, SGEM, Albena, Bulgaria, 29 June–5 July 2017; Volume 17, pp. 857–864. [Google Scholar]
- Hopunov, E.A. The role of structure and strength characteristics of minerals in ore fracture and opening. Obogashchenie Rud 2011, 1, 25–31. [Google Scholar]
- Khopunov, E.A. The role of loading factors in formation of selective destruction of ores. Obogashchenie Rud 2011, 2, 24–30. [Google Scholar]
- Ramdor, P. Ore Minerals and Their Intergrowths; Mir: Moscow, Russia, 1962; 1132p. [Google Scholar]
- Vorontsova, N.I.; Duryagina, A.M.; Talovina, I.V. Ore field structures of the Uralian supergene Nickel deposits/Innovation-Based Development of the Mineral Resources Sector: Challenges and Prospects. In Proceedings of the 11th Russian-German Raw Materials Conference, Potsdam, Germany, 7–8 November 2018; pp. 147–153, ISBN 978-036707726-6. [Google Scholar]
- Petrov, G.V.; Boduen, A.J.; Mardari, I.I.; Ivanov, B.S.; Boginskaya, A.S. Resources of noble metals in technogenic objects of mining and metallurgical complex of Russia. Adv. Mod. Nat. Sci. 2013, 3, 145–148. [Google Scholar]
- Petruk, W. Applied Mineralogy in the Mining Industry; Elsevier: Amsterdam, The Netherlands, 2000; 267p. [Google Scholar]
- Greg, S.; Sing, K. Adsorption, Specific Surface, Porosity; Mir: Moscow, Russia, 1984; p. 310. [Google Scholar]
- Sulimova, M.A.; Litvinova, T.E. Metallurgical production waste treatment efficiency increase. In Proceedings of the International Multidisciplinary Scientific GeoConference: SGEM, Albena, Bulgaria, 30 June–6 July 2016; Volume 2, pp. 569–575. [Google Scholar]
- Nikandrov, S.N. Harmonized system of classifications of the main groups of rock-forming minerals (amphiboles, pyroxenes, mica) as matrix models. In Geology and Mineralogy of the Ilmenogorsky Complex: Situation and Problems; Ilmen State Reserve Ural Branch RAS: Miass, Russia, 2006; pp. 131–160. [Google Scholar]
- Izuitko, V.M. Technological Mineralogy and Ore Evaluation; Nauka: Saint Petersburg, Russia, 1997; 532p. [Google Scholar]
- Tong, L.; Klein, B.; Zanin, M.; Quast, K.; Skinner, W.; Addai-Mensah, J.; Robinson, D. Stirred milling kinetics of siliceous goethitic nickel laterite for selective comminution. Miner. Eng. 2013, 49, 109–115. [Google Scholar] [CrossRef]
- Mwang, A.; Parian, M.; Lamberg, P.; Rosenkranz, J. Comminution modeling using mineralogical properties of iron ores. Miner. Eng. 2017, 111, 182–197. [Google Scholar] [CrossRef]
- Huang, W.; Shi, F. Improving high voltage pulse selective breakage for ore pre-concentration using a multiple-particle treatment method. Miner. Eng. 2018, 128, 195–201. [Google Scholar] [CrossRef]
- Hesse, M. Selective comminution for dry pre-concentration and energy saving. Innovation-Based Development of the Mineral Resources Sector: Challenges and Prospects. In Proceedings of the 11th Russian-German Raw Materials Conference, Potsdam, Germany, 7–8 November 2018; CRC Press: Boca Raton, FL, USA, 2018; p. 167. [Google Scholar]
- Tataurov, S.B. Improvement of geotechnologies of heap leaching of gold using cryogenic disintegration of ores. Notes Min. Inst. 2011, 190, 126. [Google Scholar]
- Litvinenko VS, Sergeev IB Innovative development of the mineral resource sector. Probl. Forecast. 2019, 6, 177.
- Litvinenko, V.S.; Vaisberg, L.A. Address of the Chairman of the Congress Leonid Weisberg and the Rector of the Mining University Vladimir Litvinenko. Coal 2016, 6, 6. [Google Scholar]
- Pronin, E.M.; Vasiliev, V.E.; Yu, T.V. Factors that determine the sustainable development of enterprises of the mineral resource complex, and their impact on the assessment of the results of the activities of enterprises. Zap. Gorn. Inst. 2011, 191, 176. [Google Scholar]
- Veasey, T.J.; Wills, B.A. Review of methods of improving mineral liberation. Miner. Eng. 1991, 4, 747–752. [Google Scholar] [CrossRef]
- Stepanov, V.A.; Strikha, V.E.; Cheremisin, A.A.; Shmuraeva, L.Y.; Danilov, A.A.; Kotov, N.V.; Poritskaya, L.G.; Poritsky, M.S.; Sokolov, S.V. Bamskoe Gold Deposit. In Geology, Mineralogy, Geochemistry; Dalnauka: Vladivostok, Russia, 1998; p. 203. [Google Scholar]
- Zolotukhina, L.V.; Nosova, O.V.; Narbekova, T.N. Behavior of noble metals when enriching Noril’sk ore. Sci. Bull. Norilsk. Ind. Inst. 2014, 14, 42–52. [Google Scholar]
- OOO Tiksomet. Step-by-Step Guide Thixomet PRO_MET; OOO Tiksomet: Saint Petersburg, Russia, 2016; pp. 179–193. [Google Scholar]
- Evans, C.L.; Wightman, E.M.; Yuan, X. Quantifying mineral grain size distributions for process modelling using X-ray micro-tomography. Miner. Eng. 2015, 82, 78–83. [Google Scholar] [CrossRef]
- Willson, C.W.; Lu, N.; Likos, W.J. Quantification of grain, pore and fluid microstructure of unsaturated sand from X-Ray CT images. Geotech. Test. J. 2012, 35, 6. [Google Scholar] [CrossRef] [Green Version]
- Popov, O.; Talovina, I.; Lieberwirth, H.; Duryagina, A. Quantitative microstructural analysis and x-ray computed tomography of ores and rocks—Comparison of results. Mineral 2020, 10, 129. [Google Scholar] [CrossRef] [Green Version]
- Bond, F.C. Crushing and Grinding Calculations Parts I and II. Br. Chem. Eng. 1961, 6, 6–8. [Google Scholar]
- Bond, F.C. Crushing Tests by Pressure and Impact. Trans. AIME 1947, 169, 58–66. [Google Scholar]
- Levin, J. Observation on the bond standard grindability test, and a proposal for a standard grindability test for fine materials. SAIMM 1989, 89, 13–21. [Google Scholar]
- Gupta, A.; Yan, D.S. Mineral Processing Design and Operations: An Introduction; Elsevier: Amsterdam, The Netherlands, 2008. [Google Scholar]
- Mular, A.L.; Halbe, D.N.; Barratt, D.J. (Eds.) Mineral Processing Plant Design, Practice, and Control; Society for Mining, Metallurgy, and Exploration, Inc.: Englewood, CO, USA, 2002; Volume 1. [Google Scholar]


| Element | Content, % | Element | Content, % | Element | Content, % |
|---|---|---|---|---|---|
| Si | 26.39 ± 1.32 | Ca | 24.57 ± 1.23 | Ag | 0.0726 ± 0.0036 |
| S | 3.98 ± 0.20 | Zn | 0.67 ± 0.03 | Au | 0.0225 ± 0.0011 |
| Fe | 12.36 ± 0.62 | Ti | 0.088 ± 0.004 | Al | 3.29 ± 0.16 |
| K | 22.19 ± 1.11 | Mn | 2.35 ± 0.12 | Ni | 0.050 ± 0.002 |
| Element | Content, % | Element | Content, % | Element | Content, % |
|---|---|---|---|---|---|
| Si | 25.24 ± 1.26 | Ti | 1.68 ± 0.08 | Cr | 0.352 ± 0.018 |
| Fe | 34.72 ± 1.74 | K | 1.91 ± 0.10 | V | 0.070 ± 0.004 |
| Ca | 12.47 ± 0.62 | Cu | 1.333 ± 0.067 | Sr | 0.088 ± 0.004 |
| Al | 5.07 ± 0.25 | Ni | 0.940 ± 0.047 | Zn | 0.092 ± 0.005 |
| S | 2.64 ± 0.13 | Mn | 0.42 ± 0.02 | Zr | 0.043 ± 0.002 |
| Parameters | Value |
|---|---|
| Accelerating voltage, kV | 125 |
| Current strength, mA | 61 |
| Resolution, mic | 32.32 |
| Filter, mm | Brass 0.25 |
| Rotation step, degrees | 0.100 |
| № | Parameter | Value | |
|---|---|---|---|
| CNO | BDO | ||
| 1. | Area, μm2 | 357.357 ± 17.868 | 16.197 ± 0.810 |
| 2. | Perimeter, μm | 2935 ± 147 | 531 ± 27 |
| 3. | Form Factor F1 | 0.47 ± 0.02 | 0.6 ± 0.03 |
| 4. | Form Factor F2 | 0.61 ± 0.03 | 0.59 ± 0.03 |
| 5. | Continuity | 0.75 ± 0.04 | 0.81 ± 0.04 |
| 6. | Oblongness, L\B | 4.76 ± 0.24 | 2.96 ± 0.15 |
| 7. | Edge roughness | 1.22 ± 0.06 | 1.1 ± 0.06 |
| 8. | Average distance between grains, μm | 1165 ± 58 | 300 ± 15 |
| Ore Sample | Isolated Porosity Volume, mm3 | Isolated Porosity Area, mm2 | Isolated Porosity, % | Effective Porosity Volume, mm3 | Effective Porosity, % | Total Porosity, % | Sphericity, % |
|---|---|---|---|---|---|---|---|
| BDO | 1.58377 | 88.12997 | 0.27502 | 0.48812 | 0.08469 | 0.35948 | 0.72353 |
| CNO | 4.90869 | 91.32154 | 0.61283 | 2.31945 | 0.28874 | 0.89980 | 0.82912 |
| Ore Sample | BDO | CNO |
|---|---|---|
| JK Drop Weight test results | ||
| Parameter A | 70.80 ± 3.54 | 99.90 ± 4.95 |
| Parameter b | 0.53 ± 0.021 | 0.30 ± 0.0015 |
| Multiplication A × b | 37.5 ± 0.39 | 30.00 ± 0.64 |
| Abrasive parameter ta | 0.49 ± 0.05 | 0.30 ± 0.06 |
| Parameter SCSE * (kWh/t) | 11.07 ± 0.34 | 11.90 ± 0.21 |
| F. Bonds’ indexes determination | ||
| Ball mill work index BWI, kWh/t | 17.56 ± 0.87 | 11.96 ± 0.54 |
| Crushing work index CWI, kWh/t | 5.31 ± 0.266 | 21.82 ± 1.09 |
| Allis Chalmers’ abrasive tests | ||
| Abrasiveness index AI, g | 0.2638 ± 0.013 | 0.1653 ± 0.008 |
| Density determination | ||
| Bulk density (with tamping), t/m3 | 2.08 ± 0.07 | 2.01 ± 0.09 |
| Sieve Class. mm | Si Distribution. % | Au Distribution. % | ||||
|---|---|---|---|---|---|---|
| Roll Crusher | Impact Crusher | Jaw Crusher | Roll Crusher | Impact Crusher | Jaw Crusher | |
| −4 + 3.2 | 52.881 | 76.171 | 65.702 | 0.000 | 0.000 | 0.000 |
| −3.2 + 1.6 | 28.749 | 8.544 | 16.660 | 0.000 | 0.000 | 0.000 |
| −1.6 + 0.8 | 7.833 | 5.530 | 7.583 | 63.148 | 80.191 | 68.005 |
| −0.8 + 0.4 | 3.371 | 2.516 | 3.595 | 16.839 | 0.000 | 11.622 |
| −0.4 + 0.2 | 3.646 | 2.722 | 3.123 | 0.,000 | 0.000 | 0.000 |
| −0.2 + 0.1 | 3.341 | 2.883 | 2.359 | 0.000 | 10.591 | 7.144 |
| −0.1 + 0 | 0.179 | 1.635 | 0.978 | 20.013 | 9.218 | 13.230 |
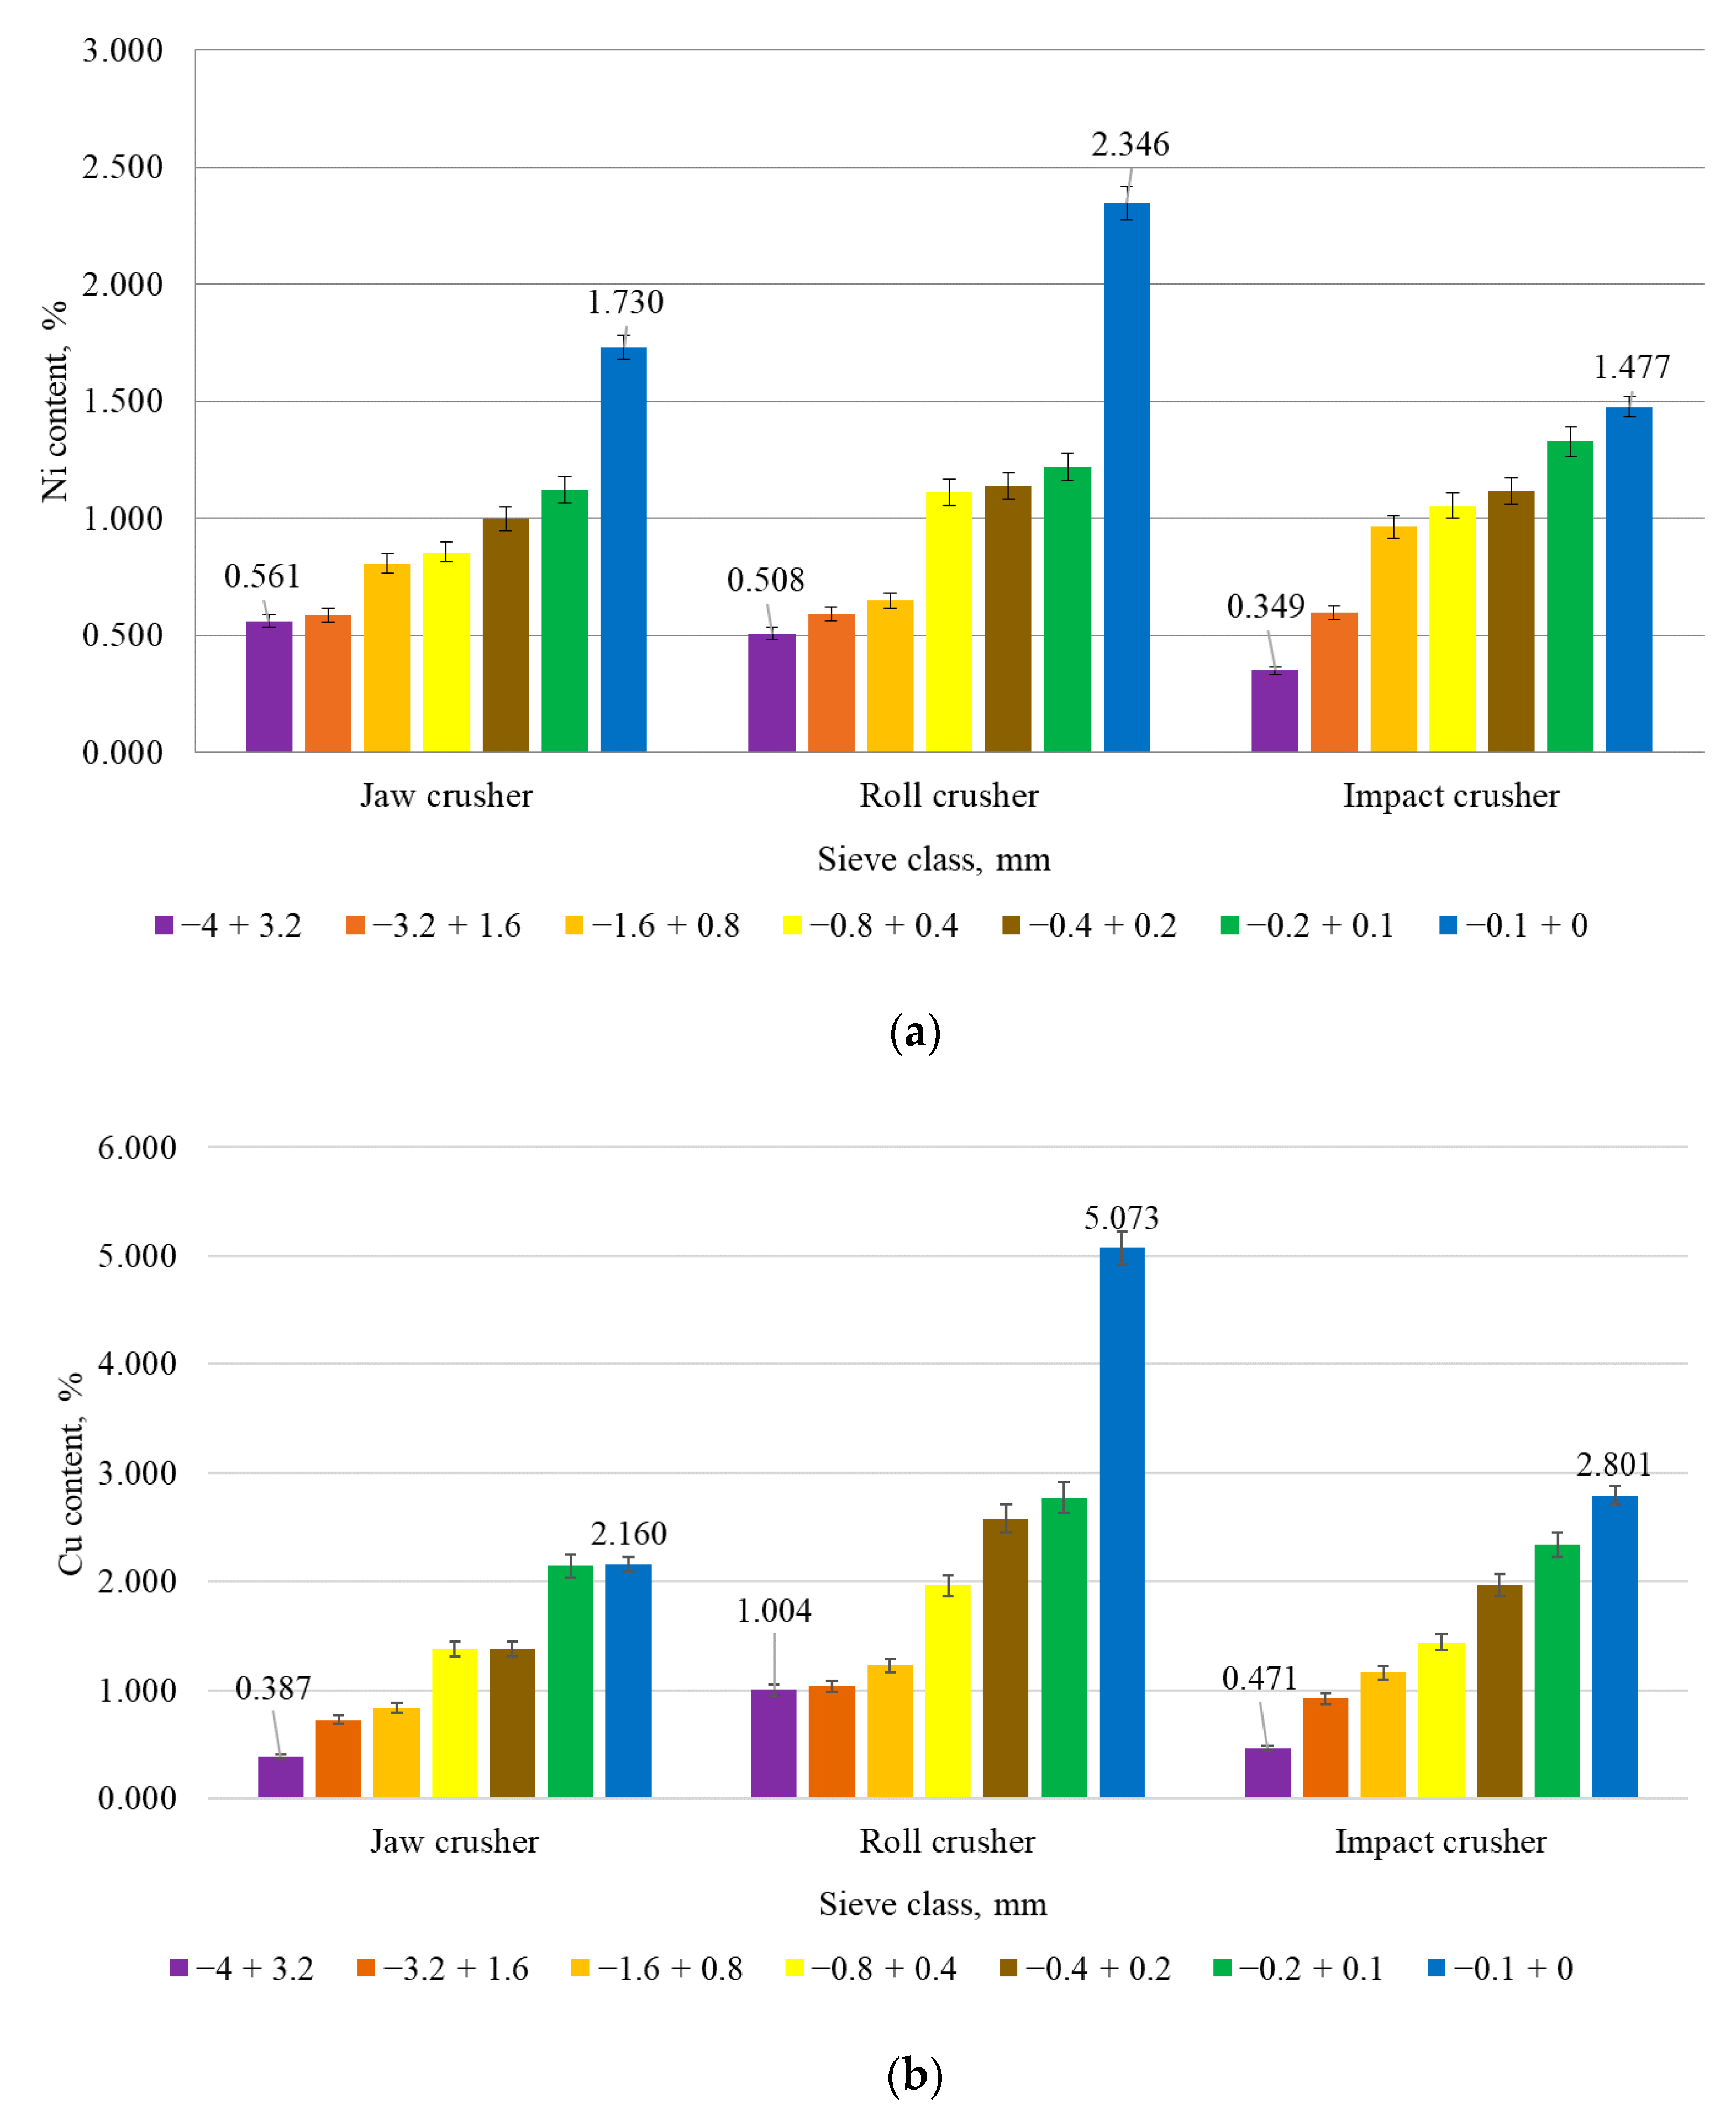
| Sieve Class, mm | Cu Distribution, % | Ni Distribution, % | ||||
|---|---|---|---|---|---|---|
| Jaw Crusher | Roll Crusher | Impact Crusher | Jaw Crusher | Roll Crusher | Impact Crusher | |
| −4 + 3.2 | 43.42 | 25.28 | 31.64 | 59.47 | 24.91 | 34.49 |
| −3.2 + 1.6 | 14.69 | 24.98 | 14.05 | 11.06 | 27.70 | 13.34 |
| −1.6 + 0.8 | 10.57 | 11.75 | 13.11 | 9.62 | 12.06 | 16.02 |
| −0.8 + 0.4 | 8.77 | 9.11 | 9.63 | 5.13 | 10.01 | 10.35 |
| −0.4 + 0.2 | 6.50 | 8.50 | 11.55 | 4.43 | 7.28 | 9.62 |
| −0.2 + 0.1 | 7.06 | 7.08 | 11.32 | 3.49 | 6.06 | 9.43 |
| −0.1 + 0 | 8.99 | 13.28 | 8.70 | 6.80 | 11.98 | 6.75 |
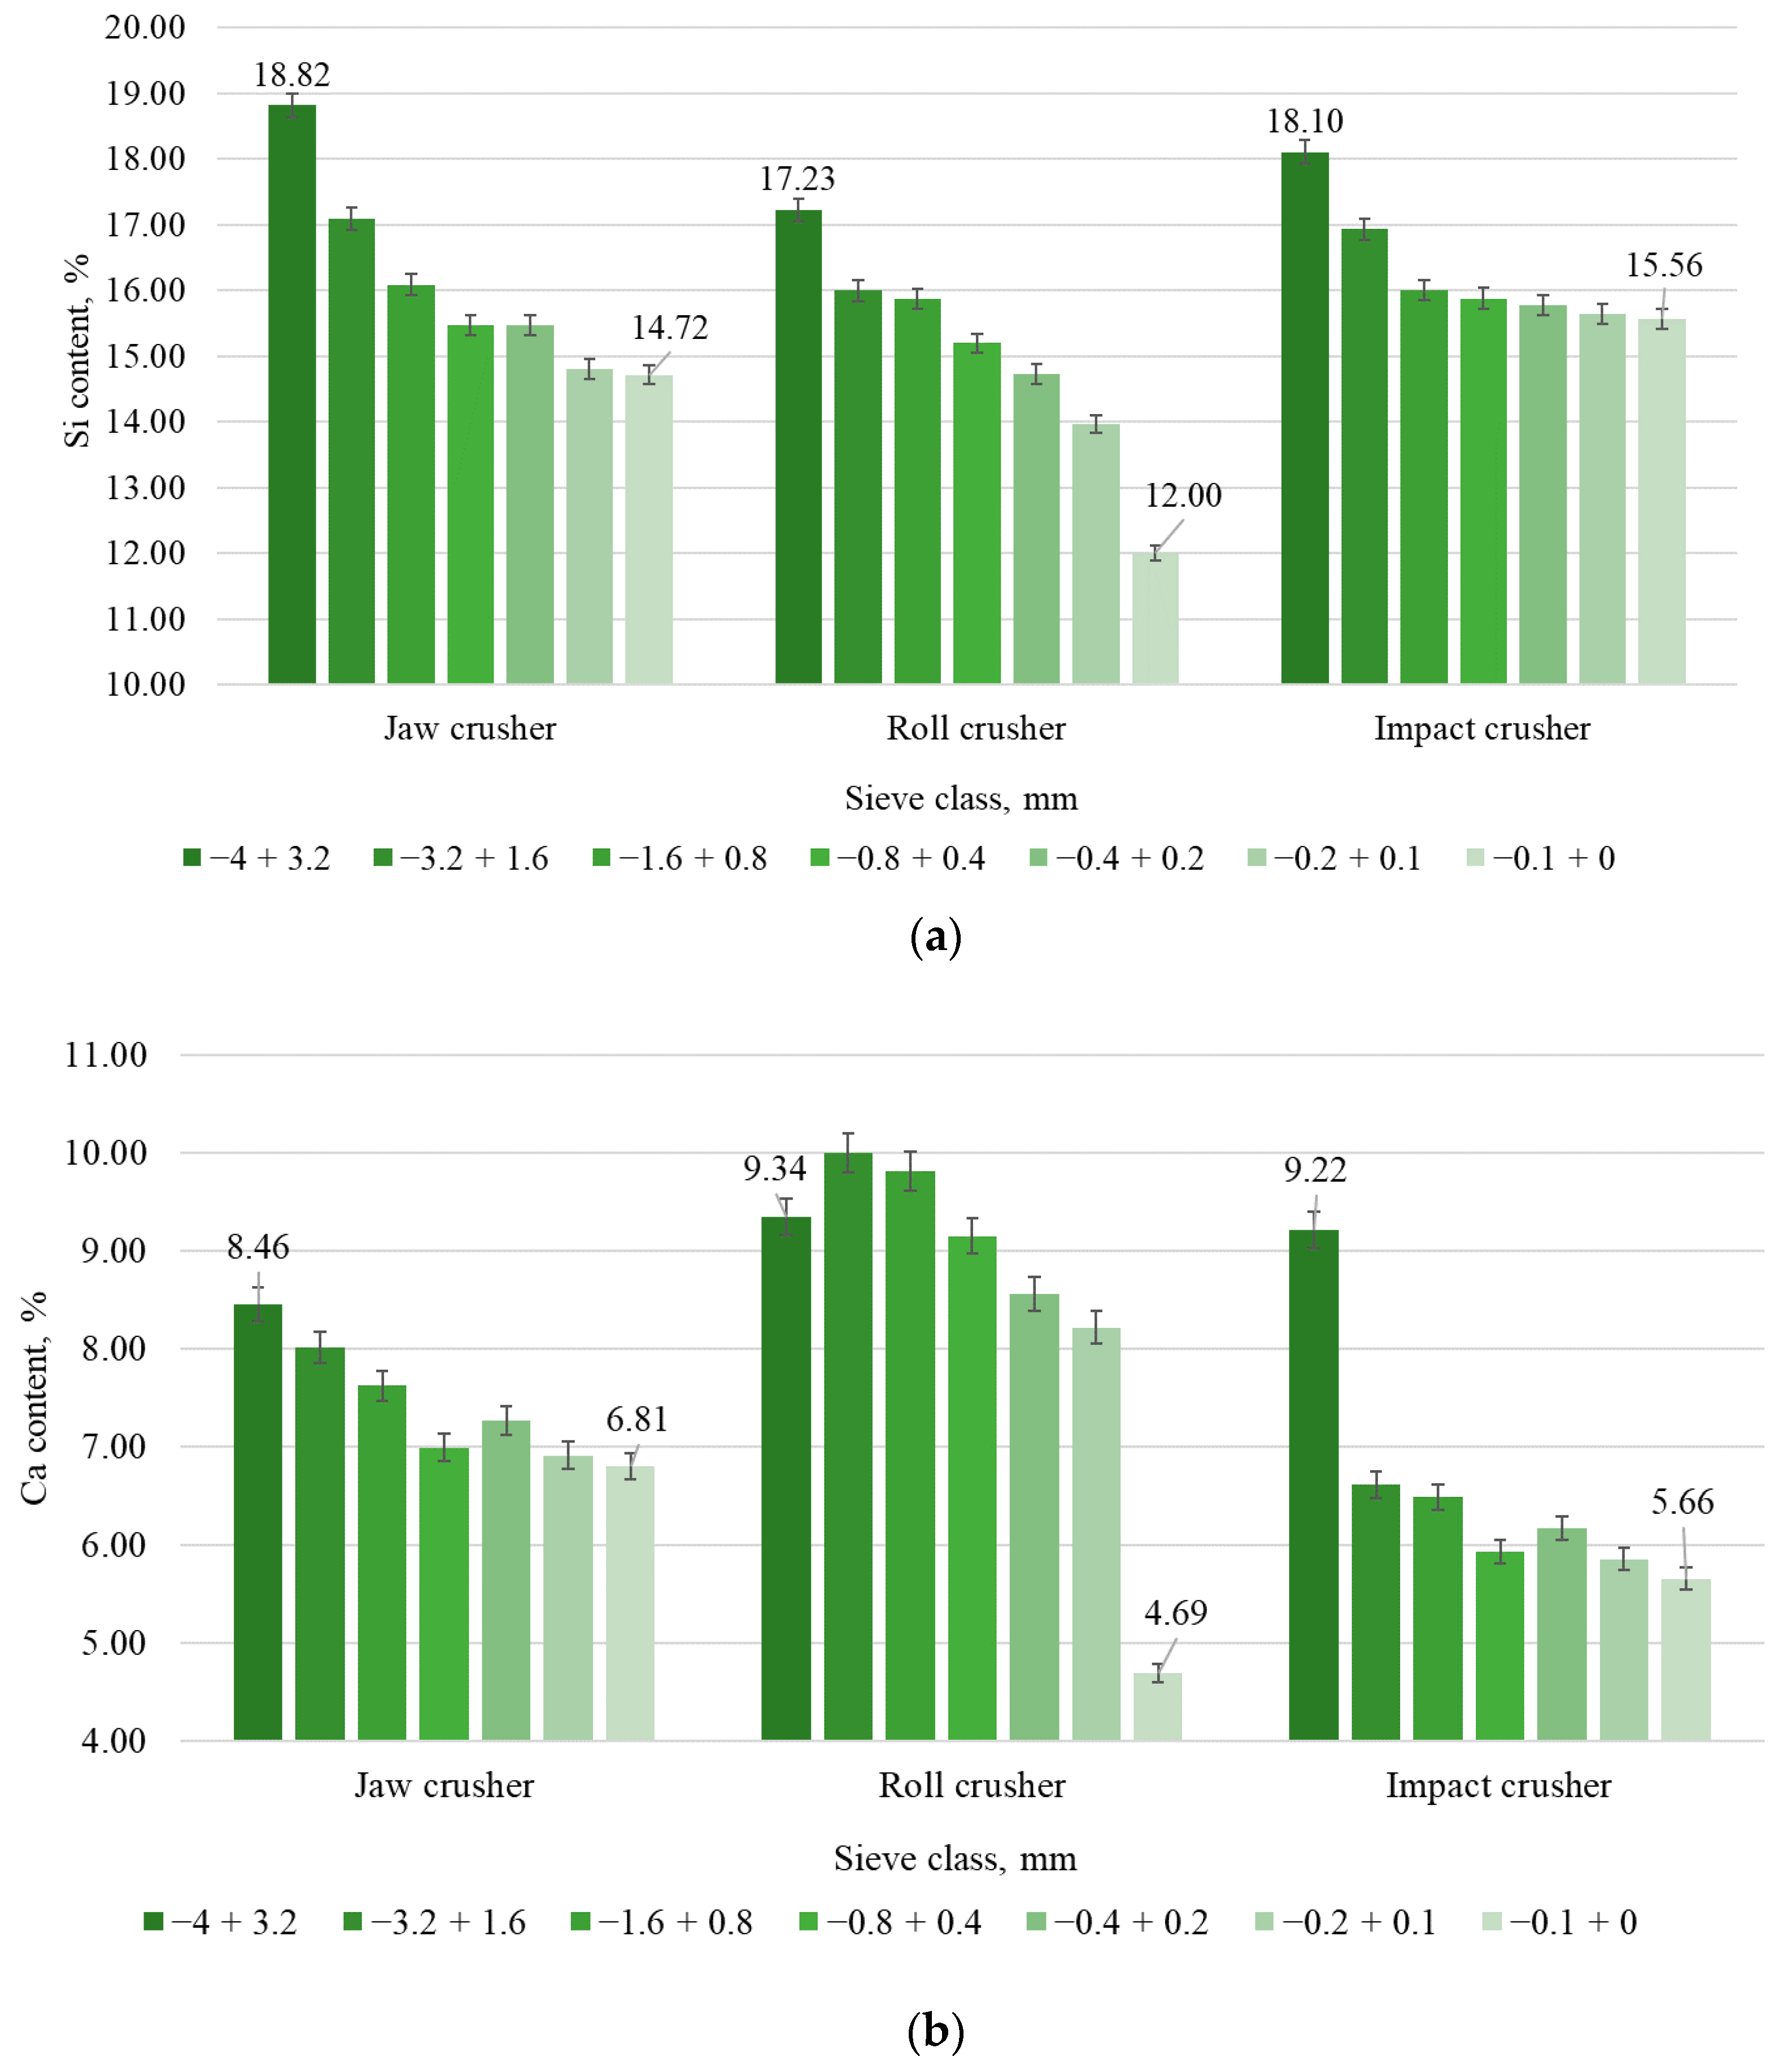
| Sieve Class, mm | Si Distribution, % | Ca Distribution, % | ||||
|---|---|---|---|---|---|---|
| Jaw Crusher | Roll Crusher | Impact Crusher | Jaw Crusher | Roll Crusher | Impact Crusher | |
| −4 + 3.2 | 71.86 | 37.53 | 61.54 | 71.06 | 34.94 | 67.70 |
| −3.2 + 1.6 | 11.66 | 33.29 | 13.01 | 12.03 | 35.71 | 10.98 |
| −1.6 + 0.8 | 6.90 | 13.10 | 9.13 | 7.20 | 13.91 | 8.00 |
| −0.8 + 0.4 | 3.35 | 6.09 | 5.36 | 3.33 | 6.30 | 4.34 |
| −0.4 + 0.2 | 2.48 | 4.19 | 4.68 | 2.56 | 4.19 | 3.96 |
| −0.2 + 0.1 | 1.66 | 3.08 | 3.83 | 1.70 | 3.12 | 3.10 |
| −0.1 + 0 | 2.09 | 2.72 | 2.45 | 2.12 | 1.83 | 1.92 |
Publisher’s Note: MDPI stays neutral with regard to jurisdictional claims in published maps and institutional affiliations. |
© 2021 by the authors. Licensee MDPI, Basel, Switzerland. This article is an open access article distributed under the terms and conditions of the Creative Commons Attribution (CC BY) license (https://creativecommons.org/licenses/by/4.0/).
Share and Cite
Aleksandrova, T.; Nikolaeva, N.; Afanasova, A.; Romashev, A.; Kuznetsov, V. Selective Disintegration Justification Based on the Mineralogical and Technological Features of the Polymetallic Ores. Minerals 2021, 11, 851. https://doi.org/10.3390/min11080851
Aleksandrova T, Nikolaeva N, Afanasova A, Romashev A, Kuznetsov V. Selective Disintegration Justification Based on the Mineralogical and Technological Features of the Polymetallic Ores. Minerals. 2021; 11(8):851. https://doi.org/10.3390/min11080851
Chicago/Turabian StyleAleksandrova, Tatiana, Nadezhda Nikolaeva, Anastasia Afanasova, Artyem Romashev, and Valentin Kuznetsov. 2021. "Selective Disintegration Justification Based on the Mineralogical and Technological Features of the Polymetallic Ores" Minerals 11, no. 8: 851. https://doi.org/10.3390/min11080851
APA StyleAleksandrova, T., Nikolaeva, N., Afanasova, A., Romashev, A., & Kuznetsov, V. (2021). Selective Disintegration Justification Based on the Mineralogical and Technological Features of the Polymetallic Ores. Minerals, 11(8), 851. https://doi.org/10.3390/min11080851