Article

Carbon Mineralization with North American PGM Mine Tailings—Characterization and Reactivity Analysis

1
Department of Chemical Engineering, Worcester Polytechnical Institute, Worcester, MA 01609, USA
2
CarbMinLab, Department of Earth, Ocean, and Atmospheric Sciences, University of British Columbia, Vancouver, BC V6T 1Z4, Canada
3
Kleinman Center for Energy Policy, Department of Chemical and Biomolecular Engineering, School of Engineering and Applied Science, University of Pennsylvania, Philadelphia, PA 19104, USA
*
Author to whom correspondence should be addressed.
Minerals 2021, 11(8), 844; https://doi.org/10.3390/min11080844
Submission received: 7 July 2021 / Revised: 29 July 2021 / Accepted: 4 August 2021 / Published: 5 August 2021
(This article belongs to the Special Issue CO2 Sequestration by Mineral Carbonation, Volume II)

Abstract

:
Global efforts to combat climate change call for methods to capture and store CO2. Meanwhile, the global transition away from fossil energy will result in increased production of tailings (i.e., wastes) from the mining of nickel and platinum group metals (PGMs). Through carbon mineralization, CO2 can be permanently stored in calcium- and magnesium-bearing mine tailings. The Stillwater mine in Nye, Montana produces copper, nickel, and PGMs, along with 1 Mt of tailings each year. Stillwater tailings samples have been characterized, revealing that they contain a variety of mineral phases, most notably Ca-bearing plagioclase feldspar. Increases in inorganic carbon in the tailings and ion concentration in the tailings storage facilities suggest carbonation has taken place at ambient conditions over time within the tailings storage facilities. Two experiments were performed to simulate carbon mineralization at ambient temperature and pressure with elevated CO2 concentration (10% with N2), revealing that less than 1% of the silicate-bound calcium within the tailings is labile, or easily released from silicate structures at low-cost ambient conditions. The Stillwater tailings could be useful for developing strategies of waste management as production of nickel and PGM minerals increases during the global transition away from fossil energy, but further work is needed to develop a process that can realize their full carbon storage potential.

1. Introduction

Climate mitigation efforts are accelerating to avoid 2 °C warming by 2100. Considerable progress has been made in decarbonizing the power sector, where US renewable electricity generation has doubled from 2008 to 2018 [1]. However, the potential climate impact of a global energy transition is currently limited for multiple reasons. Carbon-free power does not address “hard-to-avoid” emissions in the industrial and transportation sectors. Furthermore, the global energy transition will require increases in mineral production by up to 900% in the electric sector, coupled with sharp increases in the production of mine wastes [2].
To address the problem of “hard-to-avoid” emissions, technologies are being developed and deployed that can capture CO2 from industrial flue gases [3] or remove CO2 directly from the air [4]. Both of these technologies require a method of safe and reliable storage to prevent the CO2 from being re-emitted. Carbon mineralization is a process that reacts CO2 with alkaline material to produce solid carbonate minerals, satisfying the need for safe CO2 storage [5] that is permanent unless in low pH conditions.
Sources of alkalinity for carbon mineralization feedstock are composed of magnesium or calcium silicates, of which the availability in Earth’s crust is estimated to be in the order of 108 to 1011 metric tons of rock [6]. Among the most reactive minerals are wollastonite, olivine, and brucite, along with fibrous serpentines like asbestiform chrysotile [6]. Another potential source is alkaline wastes produced by industrial processes (e.g., coal fly ash, iron and steel slag) and mining processes (e.g., diamond, nickel, and platinum group metal (PGM) mines) [7]. These wastes are produced on an annual basis in the order of hundreds of millions of metric tons per year. Furthermore, their particle size is typically in the order of 10–100 microns, which presents sufficient reactive surface area to avoid energy-intensive size reduction. In fact, some wastes containing more reactive minerals are sufficiently reactive to passively draw down CO2 from the ambient air, as evidenced by mine tailings [8,9] and demolition wastes [10].
Sibanye-Stillwater’s US PGM operations, located in the Beartooth Mountains of Nye, Montana, consist of two mines (Stillwater and East Boulder) that produce high volumes of copper and nickel, in addition to its most valuable products, palladium and platinum. The Stillwater mine generates about 1 million metric tons (megatons, Mt) of tailings per year. Based on previous work with tailings at nickel mines [11,12] and PGM mines [13,14], the Stillwater tailings could present another viable source of feedstock for carbon mineralization.
Tailings from PGM mines like Stillwater will be very relevant in the years to come. Although the global production of nickel and PGMs is currently less than 3 Mt and 500 metric tons (0.5 kilotons, kt) per year, respectively [15], forecasts project these values to increase to 25 Mt and 5 kt per year by 2100, which would result in the co-production of up to 3.5 Gt/year of ultrabasic mine tailings [16]. Hence, studying carbon mineralization of the Stillwater tailings could help develop mineralization processes for billions of metric tons of tailings by the end of this century.
Despite the potential prominence of PGM mine tailings, they have received relatively little focus in the carbon mineralization literature. Vogeli et al. assessed South African PGM tailings samples and developed a preliminary ranking scheme to evaluate the tailings’ potential for mineralization, concluding that the most favorable tailings are those that are finer-grained, olivine-rich, and plagioclase-poor [13]. Meyer et al. used a pH swing process for ex situ carbon mineralization with PGM tailings, resulting in relatively low extents of cation dissolution, particularly for the pyroxene-hosted Mg [14]. Ncongwane et al. assessed the potential carbon footprint of several ex-situ mineralization processes with PGM tailings, and found that all processes evaluated (including pH swing) emitted more CO2 than they sequestered, primarily due to energy or chemical use [17]. Based on the literature, it is clear that further studies of carbon mineralization with PGM tailings must balance efficient CO2 sequestration with minimizing additional emissions due to energy or material use. This could be realized by using low-cost, ambient temperature and pressure conditions with elevated CO2 concentration (10%). This method has had success at the lab [18,19,20] and field scale [21] with brucite-rich alkaline feedstock, but has not yet been used for PGM mine tailings.
In this study, we aim to assess the suitability of the Stillwater tailings for carbon mineralization in low-cost, ambient conditions. This was done through characterization tests, observation of tailings storage facility conditions, and two mineralization experiments. Several characterization tests were performed to determine physical and chemical traits of the tailings, including laser diffraction particle size analysis, reactive surface area analysis, quantitative powder X-ray diffraction (QXRD), total carbon analysis (TCA), whole rock analysis, inductively coupled plasma optical emission spectroscopy (ICP-OES), and ion chromatography (IC). Additionally, two experiments were conducted to directly assess the tailings’ reactivity for carbon mineralization in low-cost, ambient conditions: flow-through dissolution and disk carbonation. Unless otherwise noted, all experiments were performed at the University of British Columbia, Vancouver, BC, Canada.

2. Materials and Methods

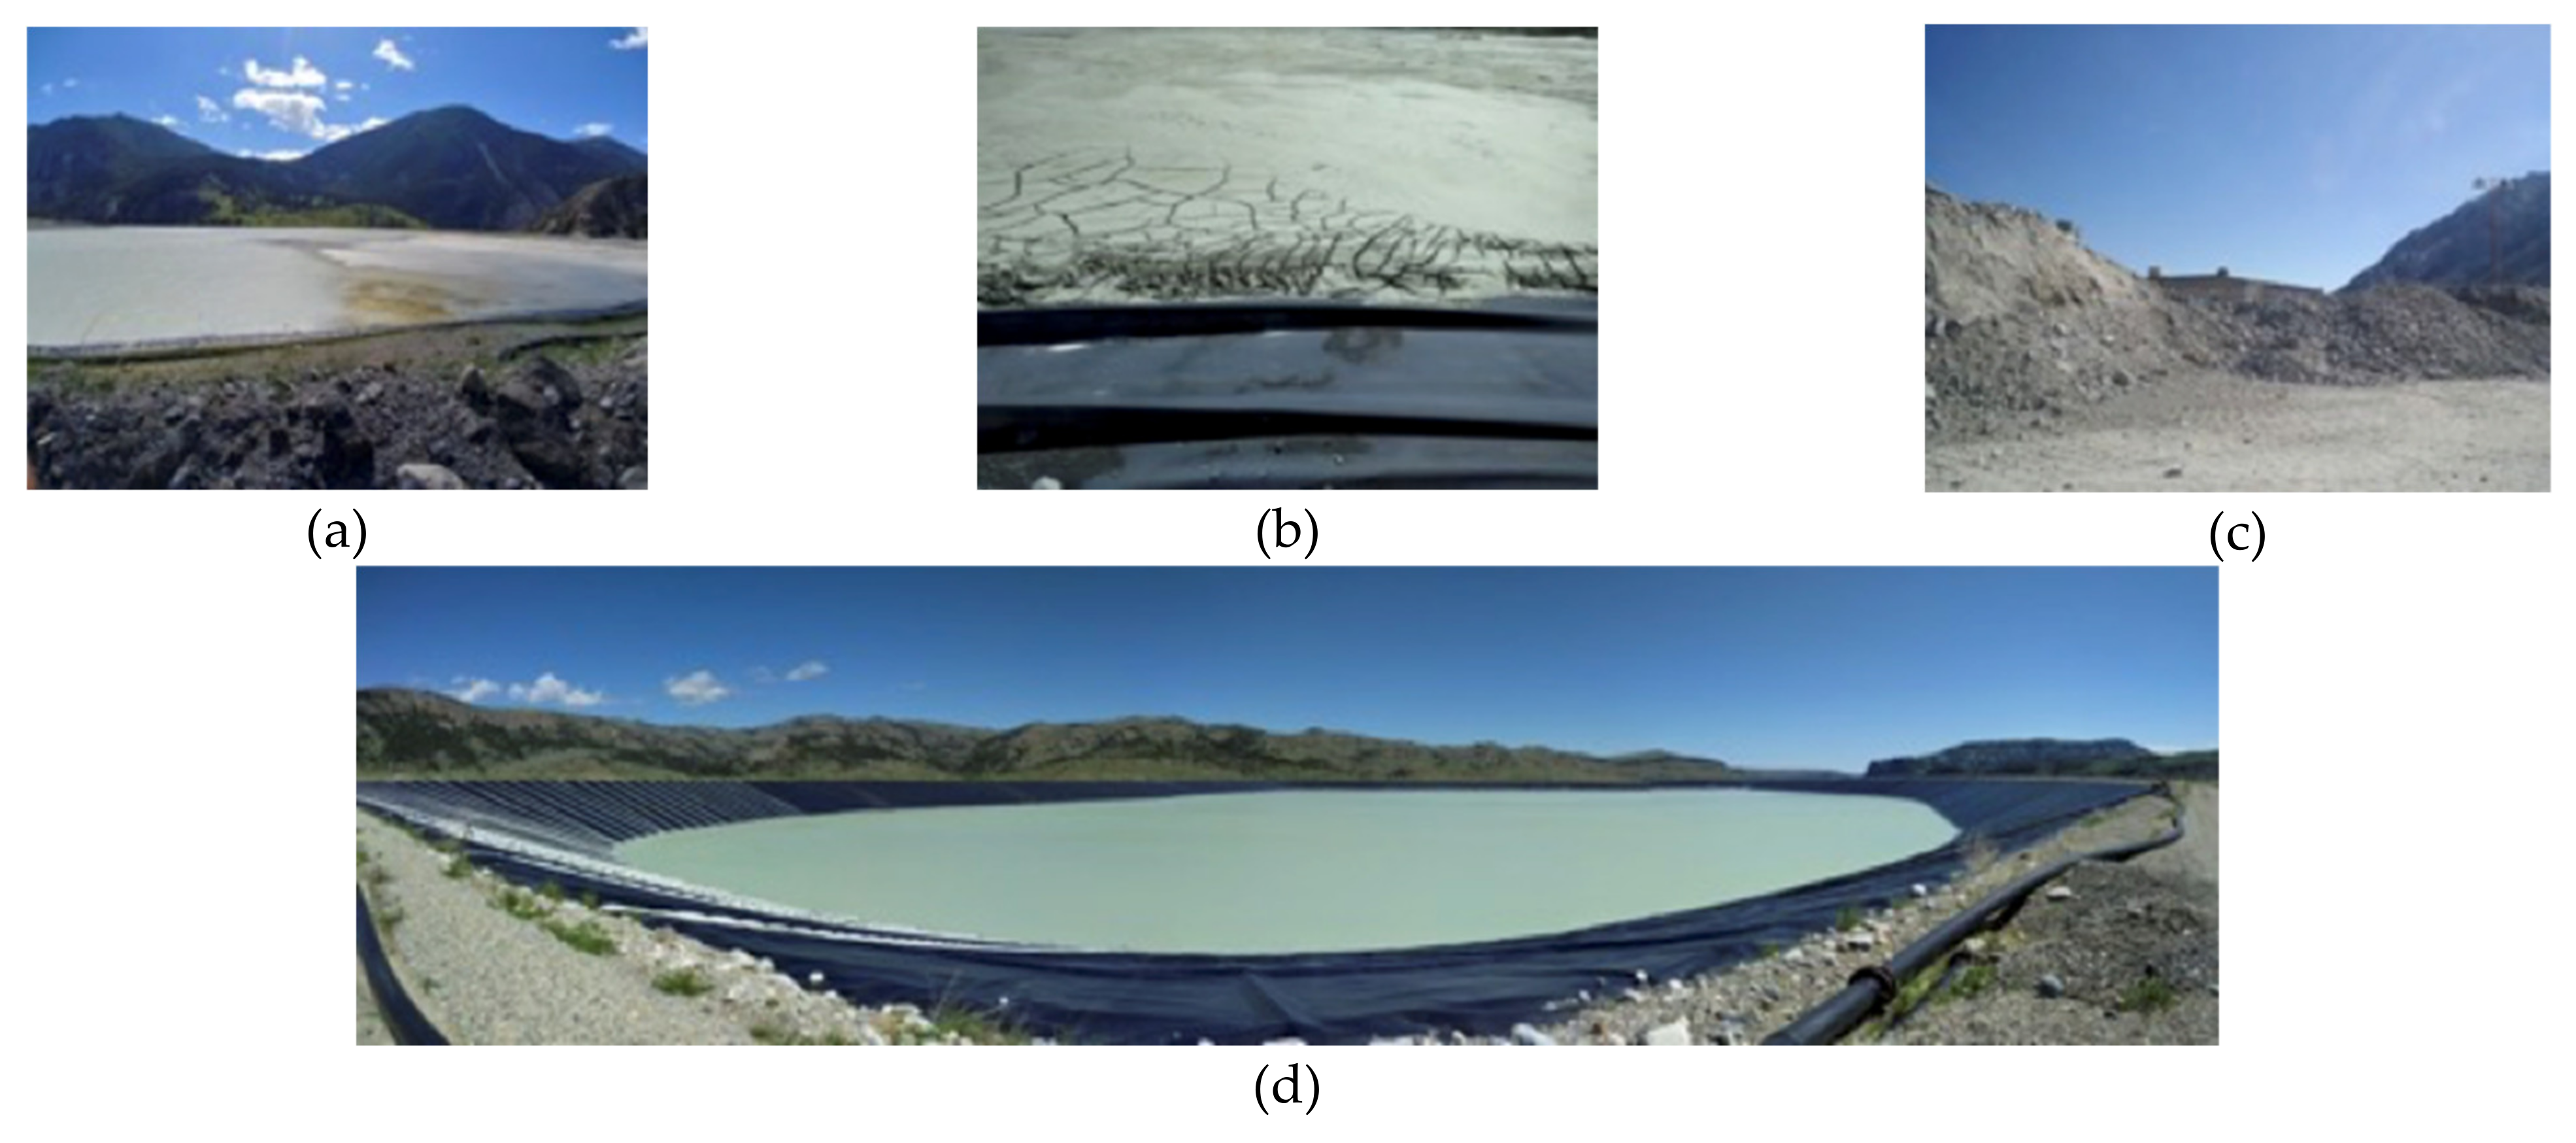
2.1. The Stillwater Mine

The Stillwater mine is located in the Beartooth Mountains of Nye, Montana, and extracts PGM ore from the J-M Reef. The J-M Reef is the only recorded significant PGM source in the US, and is the highest-grade PGM deposit known in the world [22]. The reef is actively mined from the Stillwater mine in the east and the East Boulder mine in the west [23].
According to 30-year normal climatological data from the Billings, MT weather station (the station nearest to the Stillwater mine) reported by the National Oceanic and Atmospheric Administration [24], the area has normal daily minimum and maximum temperatures of 2.61 °C and 15.22 °C, respectively. Furthermore, the normal annual precipitation is 346.96 mm, the normal annual snowfall is 1397 mm, and the mean wind speed is 17.22 km/h. Annual climatological reports from 2002 to 2018 report an average annual pan evaporation of 1062.48 mm.
The Stillwater mine has been in operation since 1986, producing high-value products of palladium and platinum, along with large volumes of copper and nickel. The mine also produces two types of non-hazardous solid wastes: tailings and waste rock. About 1 Mt of tailings are generated per year, and about 58% are returned underground as backfill [25]. The remainder of the tailings have been stored at two different tailings storage facilities (Figure 1). The Nye Tailings Storage Facility (referred to here as “Pond 1”) (WGS84 coordinates: 45.3878, −109.8742) was idled circa 2002, and contains about 4 Mt of tailings. Now, tailings are actively being placed about seven miles north of the main facility in the Hertzler Tailings Storage Facility (referred to here as “Pond 2”) (WGS84 coordinates: 45.4534, −109.7873), which is 5–6 times larger than Pond 1, occupying about 65 ha [26]. It currently contains approximately 15 Mt of tailings, with the capacity for 24 Mt. Additionally, the mine produces about 1 Mt per year of waste rock that has highly variable composition and is stored both underground as backfill and above ground in designated areas [25].
Three tailings samples were taken from the mine and used for characterization and reactivity analysis in this study. The first sample, “Tail 1”, was collected within the top 2 m of the edge of Pond 1 in June 2019. Tail 1 is used to represent a best case for ambient carbonation of the tailings, as they have been present in Pond 1 for nearly two decades. The second sample, “Tail 2a”, was collected directly from the pipe that leads the tailings to Pond 2 from the mine, and most closely represents the tailings currently being produced. “Tail 2b” is a dehydrated sample of the “slimes” (i.e., the finest fraction of the tailings) that are produced as part of the mine’s waste-handling operations [25], and was received in June 2017. When Tail 2a was received in August 2018, it was suspended in water and was immediately filtered. After filtration (Whatman No 1450 110, pore size ~3 µm), a small fraction (<5 volume % of bucket) of solid remained in slurry form in the filter. This was allowed to dry, and was kept as a separate sample (“Tail 2c”) to represent the finest fraction of the tailings. In the interim period between sample reception and experimentation, samples were kept in the laboratory in room temperature conditions.
To ensure representative samples were used for each experiment, bulk samples were homogenized and distributed according to the mass necessary for each experiment. For QXRD and TCA analysis, samples were micronized with ethanol using a McCrone® micronizing mill and agate grinding elements. Micronized samples were dried overnight and homogenized with an agate mortar and pestle.

2.2. Characterization Experiments

A Malvern® Mastersizer 2000 laser-diffraction particle-size analyzer was used to determine the particle-size distribution of each of the tailings samples. To minimize particle agglomeration, each sample was suspended in deionized water, stirred prior to analysis, and sonicated during analysis. Multiple measurements were taken for each sample to ensure precise results.
The reactive surface area was measured for all samples via multipoint Brunauer-Emmett-Teller (BET) analysis with N2 gas adsorption using a Quantachrome® Autosorb-1 Automated Gas Sorption System. Representative samples were taken and put into a sample cell for each tailings sample.
Quantitative powder X-ray diffraction (QXRD) was performed with a Bruker D8 Focus. To achieve quantitative results, corundum (Al2O3) was added in exactly 20% by weight to each solid tailings sample. Following, the samples were micronized and then placed in back-mount sample holders. Qualitative phase identification was performed with DIFFRACplus Eva 14 software [27] informed by the International Centre for Diffraction Data PDF-4+ 2010 database. The identified phases were quantified via Rietveld refinement using Topas Version 5 software.
Total carbon analysis (TCA) was performed to measure the total inorganic carbon (TIC) content of the mine tailings samples. This provided an indication of the amount of CO2 preexisting in the samples as carbonate. A CM5130 acidification module was used, in which the tailings sample is acidified and inorganic carbon (i.e., present as carbonate) is released. The amount of released carbon was detected with a Model CM5014 Carbon Dioxide Coulometer from UIC Inc. The CO2 Coulometer detection range is <1–10,000 µg carbon.
Whole rock analysis by fusion was performed on each sample using X-ray fluorescence spectroscopy (XRF) to determine major element oxide compositions of the tailings samples. This analysis was completed externally at ALS Global Laboratories, North Vancouver, British Columbia.
As Tail 1 and Tail 2a were received wet, the liquid from each tailings sample was analyzed to determine chemical and ionic composition. The chemical composition was measured using a Varian 725-ES inductively coupled plasma optical emission spectrometer (ICP-OES). The instrument’s detection limit for each of the elements measured is 0.1 ppm. A Dionex ICS 2000 ion chromatograph [28] was used to measure the major cations (Al3+, Ca2+, Fe3+, K+, Mg2+, Na+, Si4+) and anions (Cl, SO42−, NO3) in the liquids from both tailings storage facilities.

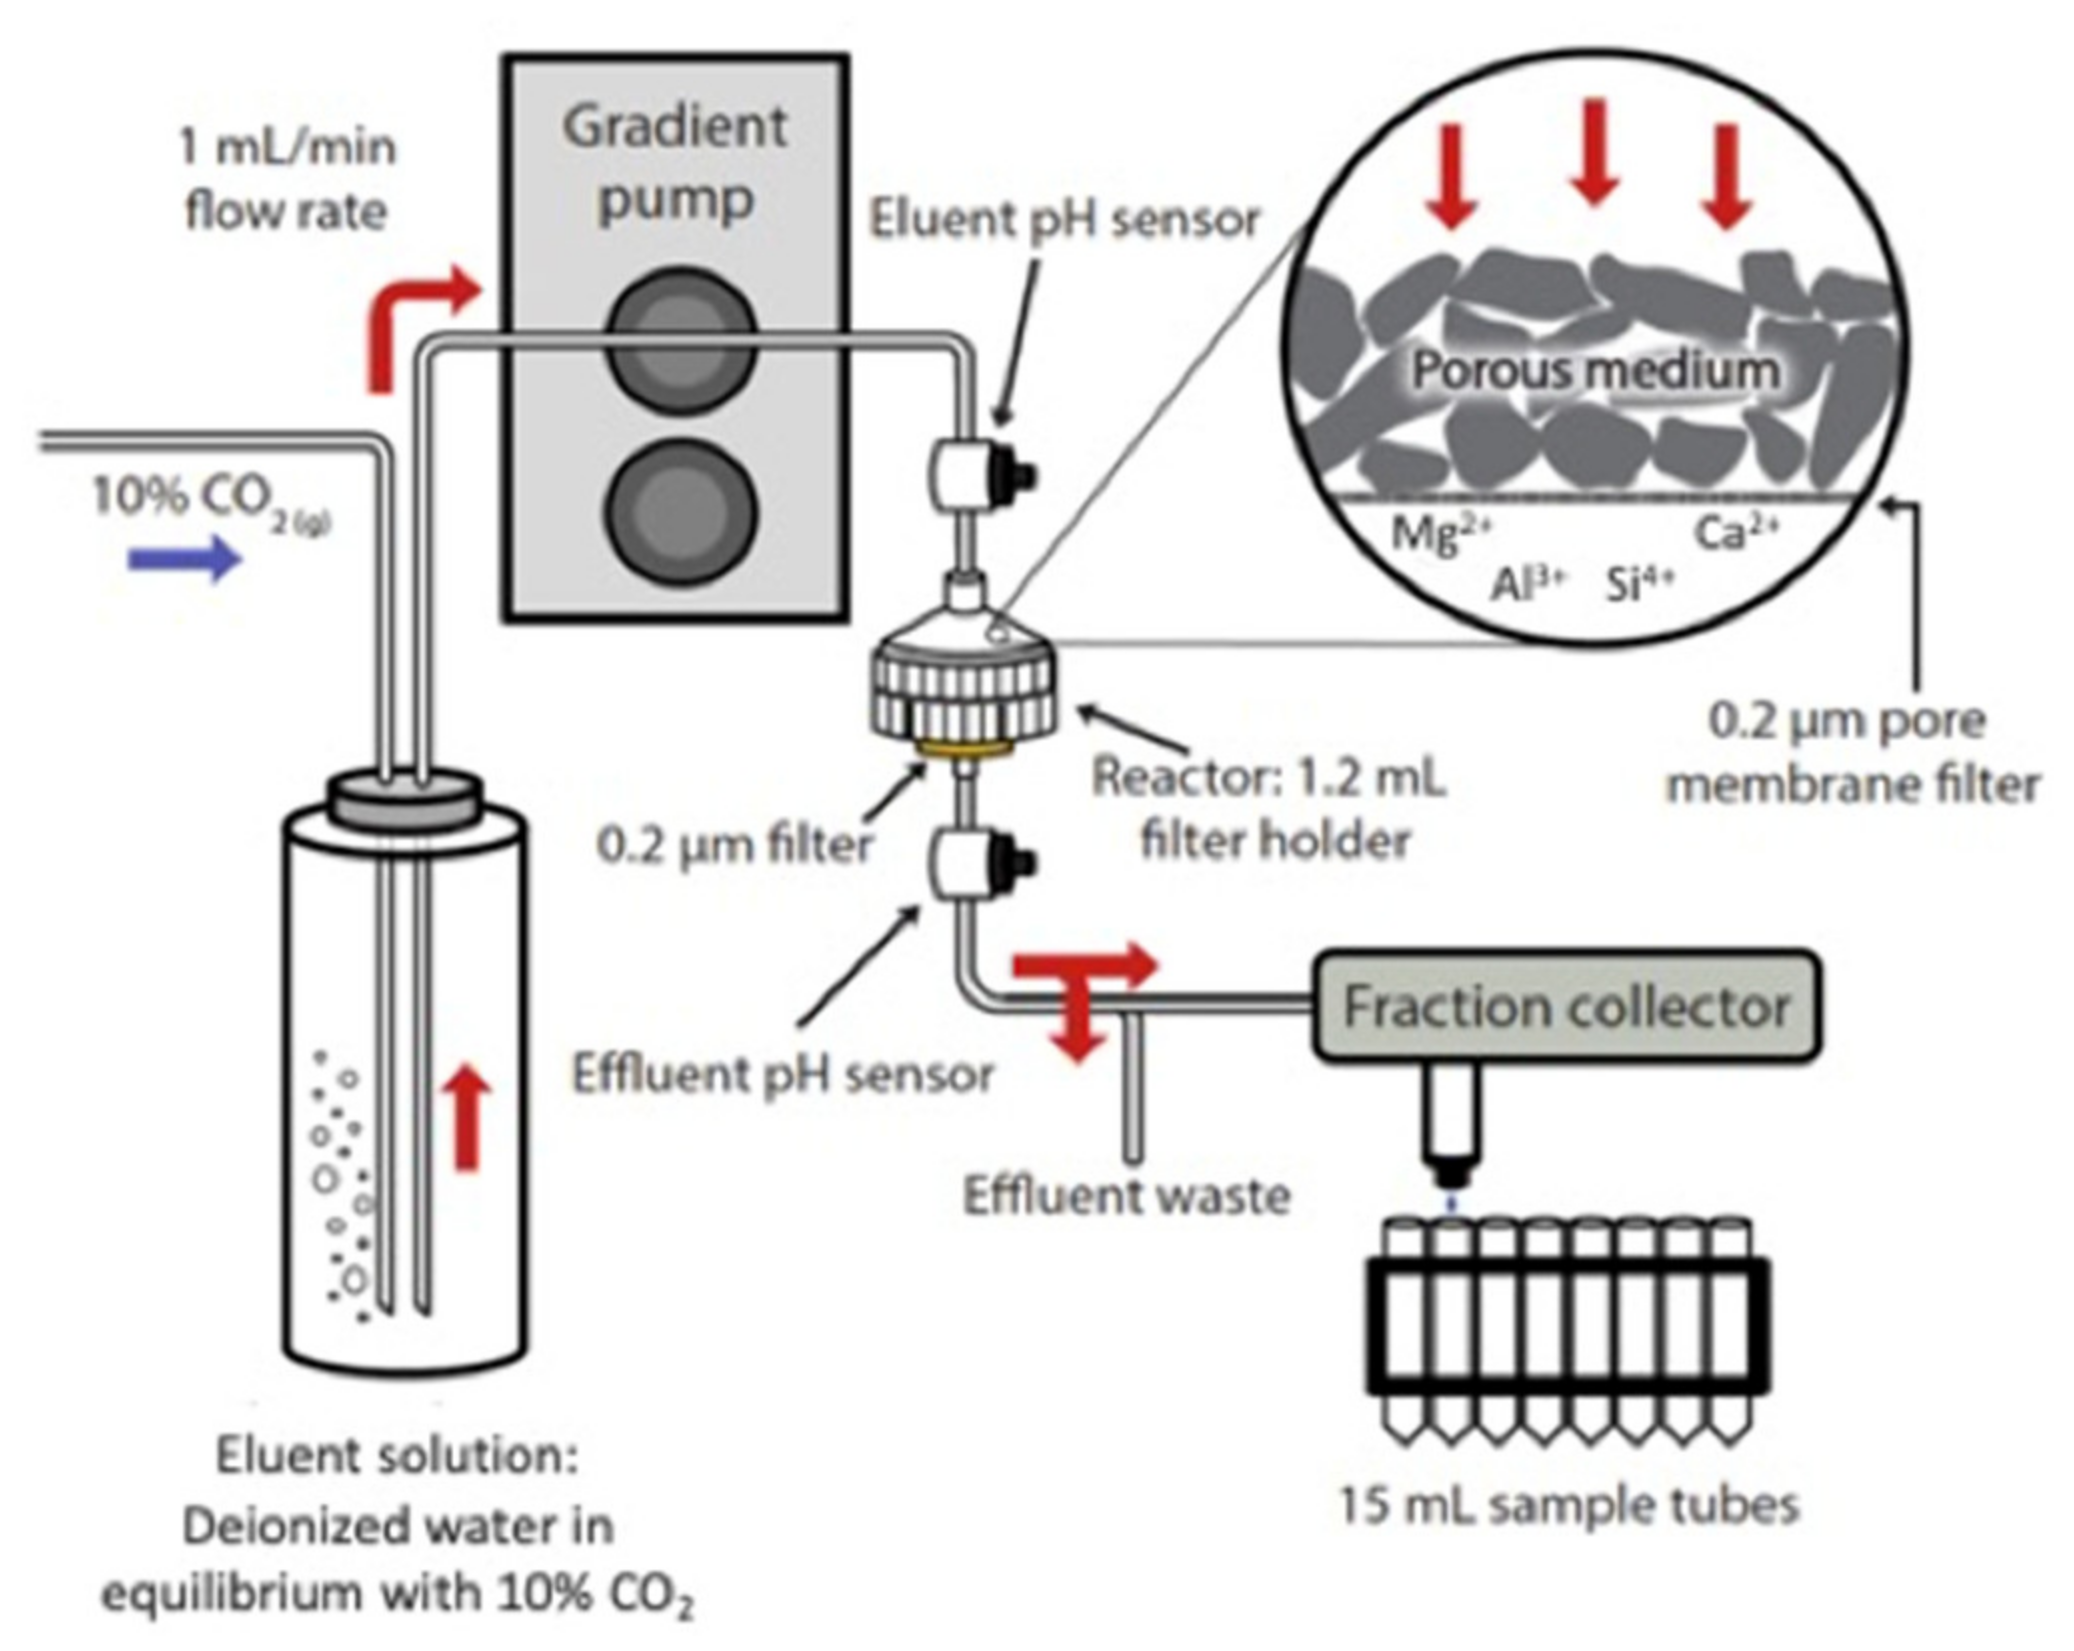
2.3. Flow-Through Dissolution

To determine the labile calcium and magnesium cations present in the Stillwater tailings, a flow-through dissolution experiment was performed on Tail 2a using an apparatus shown in Figure 2 and described previously [29,30]. Prior to the experiment, 10% CO2 (Praxair, balance N2) was equilibrated with deionized water overnight to reach a pH of 4.41. Over a 60-h period, a Dionex ICS-3000 dual-gradient pump constantly pumped carbonated water at 1 mL min−1 through a 1.2 mL reaction chamber containing 500 mg of Tail 2a atop a 0.2 µm polycarbonate membrane filter. The experiment was performed at room temperature and pressure (22 °C, 1.013 bar). A polypropylene Swinnex filter holder was used as the reaction chamber. The weighed sample was loaded into the chamber and shaken to ensure even distribution. The threading of the reaction chamber was wrapped with polytetrafluoroethylene (PTFE) sealant tape to prevent leakage due to increased pressure. The chamber was mounted vertically between two solenoid valves and above a 0.2 µm syringe filter, which provided secondary filtration to prevent fine particulates from entering entirely metal-free polyetheretherketone (PEEK) flow tubes.
Upon exiting the reaction chamber, the effluent flowed through a pH sensor and subsequently into a Foxy®R1 fraction collector connected with PEEK tubes. The pH sensor measured the effluent pH every second. The fraction collector intermittently collected 13 mL samples over 13-min periods at 30-min to 2-h intervals, and stored the samples in 15 mL polypropylene tubes. After samples were collected, they were acidified with 15 mol L−1 ultra-pure HNO3 and stored at ~4 °C prior to analysis. The samples were analyzed for concentrations of Al, Ca, Fe, K, Mg, Na, and Si with ICP-OES.
The dissolution rate of Tail 2a was calculated using Equation (1) (adapted from [31]):
R M m o l   M   m 2 s 1 = r f Δ M η M A B E T m 0
where “M” represents the metal cation being leached, rf is the carbonated water flow rate (L s−1), ∆[M] is the difference in the effluent and eluent concentration of M (mol L−1), ηM is the mineral stoichiometric coefficient of M, ABET is the BET reactive surface area of Tail 2a (m2 g−1), and m0 is the initial mass of Tail 2a (g). The results were used to quantify the number of labile cations present in the Stillwater tailings—that is, the number of cations that are loosely bound and can be quickly released in low-cost, ambient conditions [29]. The dissolution rates and accumulation of dissolved cations in solution was monitored and compared to the dissolution of various minerals, including anorthite, lizardite, diopside, and calcite, as shown in Equations (2)–(5).
CaAl2Si2O8 + 8H+ → Ca2+ + 2Al3+ + 2SiO2 + 4H2O
2Mg3Si2O5(OH)4 + 6H+ → 6Mg2+ + 4SiO2 + 10H2O
CaMgSi2O6 + 4H+ → Ca2+ + Mg2+ + 2SiO2 + 2H2O
CaCO3 + 2H+ → Ca2+ + CO2 + H2O

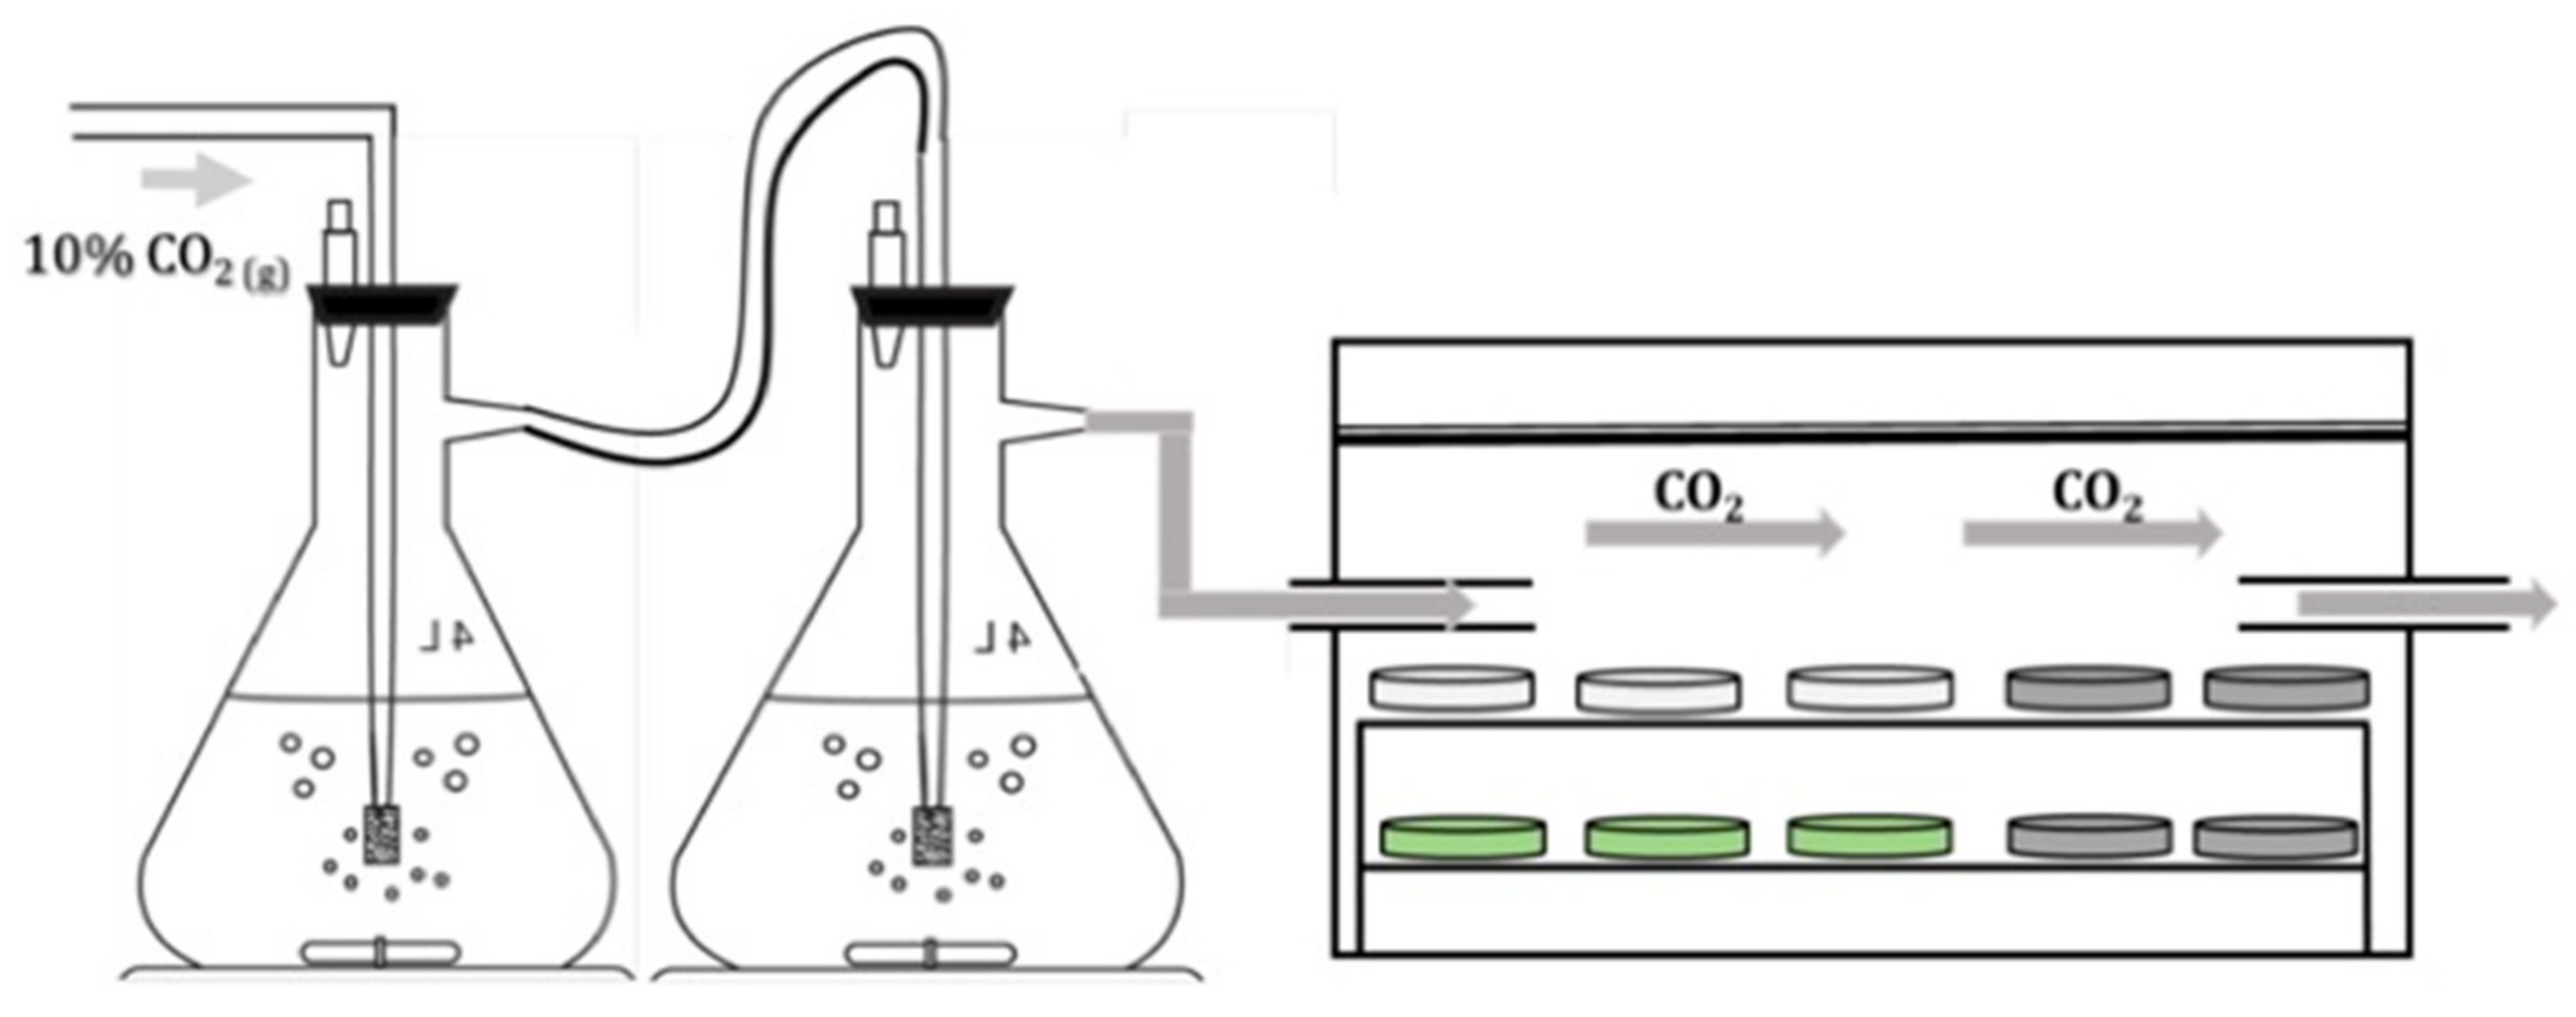
2.4. Disk Carbonation

Although flow-through dissolution is an effective method to measure the mineral dissolution rate and determine the number of labile cations that can be quickly released from the Stillwater tailings in ambient conditions, it does not directly measure the tailings’ change in carbon uptake over time. Alternatively, disk carbonation is a simpler method that can be used as a preliminary approach to evaluate whether the tailings can be carbonated under ambient temperature and pressure conditions. This experiment has been described previously [29]. Several small disks were fabricated for each tailings sample.
The disks were composed of dry mine waste sample mixed with water in the amount of 15–16 weight % of the sample mass, targeting the ideal range of 30–60% pore water saturation, as proposed previously [32]. The viscous slurry was mixed in a beaker and subsequently placed in a premade Perspex glass mount with a 17.9 mm radius and 1.8 mm thickness. When the mount was filled with the sample slurry, a premade Perspex glass piston press was used to push the sample out of the mount and into a weigh boat, creating a disk. Five to ten disks were made for each tailings sample, depending on the total amount of sample available. All disk masses were measured within the weigh boat before the 16-day testing period.
Once fabricated, the disks were placed in a 60 L polycarbonate reaction chamber, as depicted in Figure 3. A cylinder of compressed CO2 (10%, balance N2) was attached to the chamber using Tygon R 3606 tubing, which directed the gas at ~200 mL min−1 through two 4-L interconnected conical flasks containing distilled water, and subsequently into a small water bath within the reaction chamber. Sponges were placed within in the chamber to help maintain a relative humidity above 90%, minimizing evaporative water loss from disks in the reaction chamber. The chamber temperature was maintained at atmospheric conditions (~22 °C). The chamber temperature and humidity were monitored using a portable HUMICAP® humidity and temperature probe HMP110 from VAISALA. Over a 16-day period, the disks were intermittently removed from the chamber for mass measurements, for which the frequency was dependent on the number of disks fabricated for each sample.
After completion of the 16-day period, every disk was homogenized with a corundum mortar and pestle, and subsequently analyzed for total inorganic carbon content. The relative change in carbon content served as a preliminary approach to measure the carbon uptake of the various tailings samples within the reaction chamber.

3. Results

3.1. Characterization Experiments

3.1.1. Characteristics of Mine Tailings

The results from the QXRD, TIC, particle size analysis, and BET reactive surface area are detailed in Table 1. Total inorganic carbon is presented as % C (g C/g sample).
As shown in Table 1, all samples had d(0.9) less than 100 μm, which is generally considered to be optimal for carbon mineralization processes [33], presenting sufficient reactive surface area so that further energy-intensive size reduction is not necessary.
As is typical of mine tailings, the mineralogical composition was heterogeneous, with a wide variety of mineral structures. The most abundant mineral in all samples was anorthite, an aluminosilicate in the plagioclase feldspar mineral group. Although this mineral group is not typically viewed as ideal for carbon mineralization due to its low reactivity [34,35], its high abundance (comprising 39% of Earth’s crust [36]) might still present volumes large enough for climate relevance.
The relative abundance of each mineral phase varied across the different tailings samples. Inosilicates (amphiboles and pyroxenes) remained relatively unchanged across all samples. The minerals that had significant differences in abundance among the samples were tectosilicates and phyllosilicates.
Comparison of the mineralogy in Tail 1 and Tail 2a can give insight into what might naturally occur when the Stillwater tailings are undisturbed in the tailings pond and interact with atmospheric CO2. The talc and lizardite compositions were practically reversed among Tail 1 and Tail 2a; this could be evidence of incongruent lizardite dissolution in alkaline pond water, where some of the leached Mg2+ was able to form carbonates, whereas the remaining lizardite structure was modified to talc, like in Equation (6) [37]:
2Mg3Si2O5(OH)4 + 6H+ → Mg3Si4O10(OH)2 + 3Mg2+ + 6H2O
Further evidence of ambient dissolution of tailings in Pond 1 is given by a notable decrease in the anorthite concentration of Tail 1 relative to Tail 2a. This decreased anorthite concentration was coupled with an increased TIC content and presence of calcite in Tail 1. This could be evidence of ambient dissolution of anorthite in Pond 1, where the dissolved Ca2+ may react with dissolved CO2 to produce calcite. Although there was no detection of carbonates in Tail 2a or Tail 2b via XRD, the TIC values indicate that a small degree of carbonation took place in Pond 2. The discrepancy between XRD and TIC is because the detection of low-abundance carbonate-bearing minerals through XRD has been reported to suffer large relative error values [38].
In Tail 2c, there was also a decrease in anorthite concentration relative to Tail 2a. This could be explained by the fact that Tail 2c was the finer fraction of Tail 2a, and tectosilicate minerals are bulkier structures that may be present in larger particles. Similarly, bulk chemical analysis results show that there was less CaO in Tail 2c relative to Tail 2a (Table 2).
The composition of Tail 2b can give more insight into the representative composition of the Stillwater tailings. As noted in Section 2.1, Tail 2b was a dehydrated fraction of Tail 2a, which is corroborated by the practically identical mineralogy (Table 1) and chemistry (Table 2) of these two samples. The primary difference among these two samples was the decreased LOI in Tail 2b, likely due to it being dehydrated. Thus, the Tail 2a anorthite concentration is likely close to the true Stillwater tailings composition.

3.1.2. Composition of Tailings Storage Facilities

As indicated in Section 2.1, tailings from Pond 1 and Pond 2 were received wet. After the tailings were filtered and centrifuged, the resultant liquids were analyzed for their chemical compositions, and the results are shown in Table 3. The results yielded very different concentrations of Al, Ca, Fe, and Mg within the two liquids, as indicated by the ratio of Pond 1 to Pond 2. A comparison of Pond 1 and Pond 2 can give further insight into how the Stillwater tailings have interacted with the pond water over the nearly two decades that Pond 1 has been idled.
One plausible explanation for the vast increase in cation concentration in Pond 1 relative to Pond 2 is evapoconcentration. This phenomenon describes water evaporating from Pond 1 over time, leaving behind the leached cations and effectively increasing their concentration by decreasing the liquid volume. Evapoconcentration would be evidenced by a similar ratio of Pond 1 to Pond 2 in the concentrations of all elements. However, the degree of increase among different cations was inconsistent. For Ca and Mg, there was about a five-fold increase, but for Fe and Al the increase was much larger. Therefore, although evapoconcentration might partially explain the difference in concentration, it cannot be the only explanation.
Another possible explanation of the different pond water concentrations is that mineral dissolution occurred in Pond 1, followed by carbonation of Ca and Mg. This theory is evidenced by the smaller Pond 1:2 ratio of Ca and Mg relative to Al and Fe, as Ca and Mg are more likely to form carbonates. This is also evidenced by comparing the relative amounts of elements in each pond. The Pond 1 composition was in general agreement with the order of element dissolution in silicate minerals (Ca > Na > Mg > K > Fe > Al) [39], whereas Ca and Mg deviated from this order in Pond 2, potentially due to loss of dissolved cations via carbonation.
The presence of dissolved CO2 in the tailings ponds would further indicate that ambient mineral dissolution and carbonation is taking place. The ion chromatography (IC) results (Table 4) were used to perform a charge balance on the two tailings liquids, as shown in Table 5. The charge balance detailed in Table 5 indicates that there was a significant increase in undetected ion concentration in Pond 1 relative to Pond 2. To identify the phases undetected by IC, a geochemical model was generated by inputting the IC results in PHREEQC Version 3, which is a software designed to perform various aqueous geochemical calculations [40]. As illustrated in Table 6, the PHREEQC model revealed that both ponds contain alkalinity. The presence of alkalinity and multiple dissolved CO2 phases suggest that dissolved CO2 provided a favorable environment for dissolution and carbonation of the Stillwater tailings.

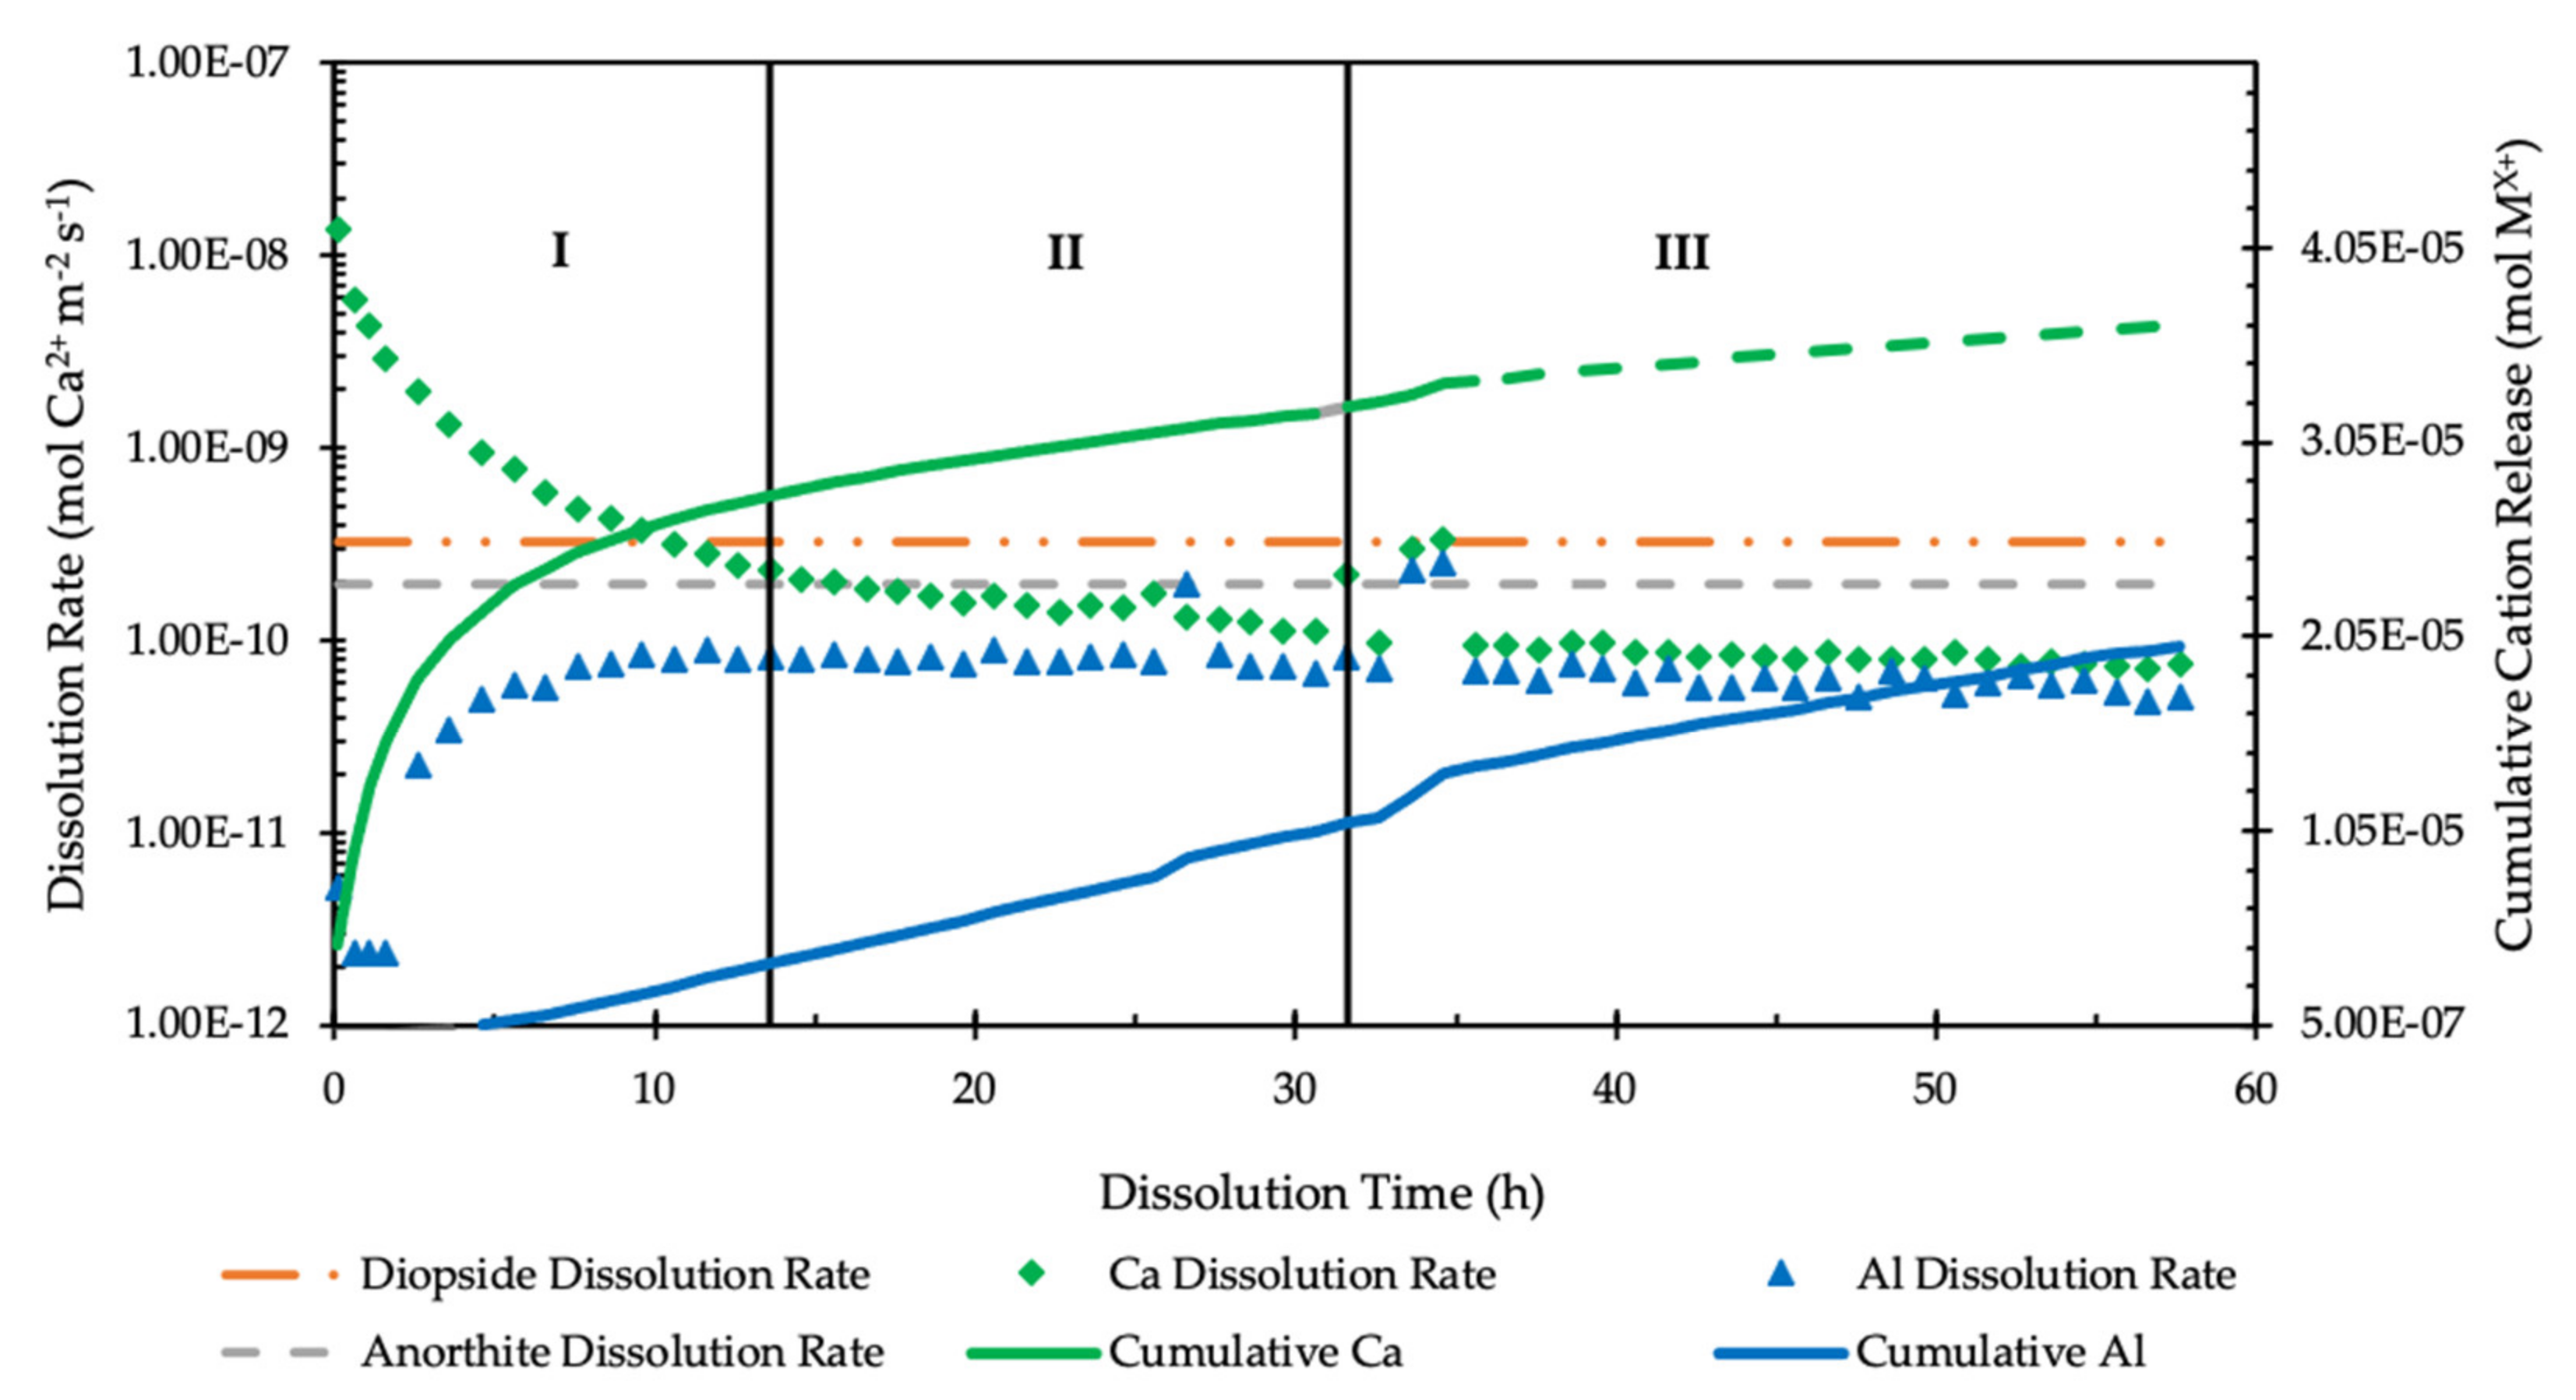
3.2. Flow-Through Dissolution

The use of the flow-through dissolution experiment allowed for quantification of the labile cations present in the Stillwater tailings (i.e., the number of cations that can be readily dissolved at ambient conditions). Tail 2a was most representative of the tailings being currently produced at the Stillwater mine. Additionally, Tail 2a had a lower TIC content than Tail 1, indicating that it had a higher capacity for carbonation. For these reasons, Tail 2a was chosen for the flow-through dissolution experiments.
Dissolution rates for both Ca2+ and Al3+ in Tail 2a were calculated using Equation (1). The mineral stoichiometric coefficients were estimated using a weighted average of the respective stoichiometric coefficients of each mineral phase detected in Tail 2a.
The evolution of the measured dissolution rates of Ca2+ and Al3+ in Tail 2a over time is displayed with the accumulation of Ca2+ and Al3+ in solution in Figure 4. The measured Tail 2a dissolution rates are directly compared to published geochemical reaction path modeled dissolution rates of anorthite and diopside [41], representing the most likely Ca-bearing mineral phases of Tail 2a to react. The majority of measurements for all cations except Ca2+ and Al3+ were below the ICP-OES detection limit, indicating limited dissolution of Tail 2a in the 60-h experiment. All measurements are plotted for Ca2+ and Al3+, where a solid accumulation curve indicates measurements above the ICP detection limit, whereas a dashed accumulation curve indicates measurements below the ICP detection limit. Measurements for Mg2+ were above the detection limit only during the first 60 min of the experiment, amounting to a cumulative release of 0.03 mg Mg2+. Although this is not visible in Figure 4, it will be briefly discussed below.
There are three distinct regions on the plots (separated by vertical lines), which may represent the dissolution of different minerals over the duration of the experiment. Region I involves the rapid accumulation of Ca2+, which could be explained by calcite dissolution. As discussed earlier, the detection of low-abundance carbonate-bearing minerals through XRD has been reported to suffer large relative error values [38]. Consequently, the small amount of TIC in Tail 2a indicates that some carbonate was likely present despite no detection of calcite through XRD. Assuming all of the 0.07% TIC measured in Tail 2a was in the form of calcite, there would have been 2.77 mg of calcite in the reaction chamber. Dissolution of all the calcite would have produced 1.11 mg of Ca2+. This value of dissolved Ca2+ was accumulated after 13 h, marked by Region I. Seeing as the Ca2+ dissolution rate in Figure 4 steadied before this point, it is possible that not all of the TIC was present as calcite, and could in fact also have been present as a hydrated magnesium carbonate like hydromagnesite. In this case, the 0.03 mg of Mg2+ released in the first hour of the experiment (not displayed) would equate to 0.112 mg of hydromagnesite, or 0.012 mg of carbon.
In Region II, the Ca2+ dissolution rate was nearly the same as the published dissolution rate for anorthite. Here, the steady accumulation of Ca2+ was coupled with a steady accumulation of Al3+, as would be expected for the dissolution of anorthite in Equation (2). Furthermore, a linear regression of Ca2+ and Al3+ accumulation in Region II reveals the slope for Al3+ was double that of Ca2+, also indicative of anorthite dissolution. Although the accumulation of Ca2+ and Al3+ in Region II was stoichiometric with respect to each other, the lack of measurable Si4+ indicates incongruent dissolution of anorthite.
At the beginning of Region III, a sudden “jump” occurred in the accumulation of Ca2+, Al3+, and most notably, a few measurable points of Si4+ were released, which are not displayed. As is illustrated in Table 7, the silicon ratios decreased and approached their stoichiometric values. After this “jump”, the cation ratios returned to their original values before the “jump”. This too is indicative of incongruent anorthite dissolution. Incongruent dissolution has been reported to occur in feldspars to a varying degree, directly proportional to anorthite content [42,43,44]. Incongruent dissolution would leave behind a siliceous layer, but in the case of high-anorthite-content feldspars, there is not enough silicon to form a stable structure, resulting in increased Si4+ dissolution [44]. This could perhaps explain this momentary “jump” in Si4+ accumulation, where a weak siliceous layer, formed from Ca- and Al-depletion, broke down and released the left-behind Si4+.
Limited dissolution of Mg2+ occurred, where the dissolution did not correspond with published lizardite values to the order of 10−11 [45]. Phyllosilicates like lizardite are reported to react more slowly compared to anhydrous silicates such as olivine due to the abundance of tetrahedra containing Si-O bonds, which are stronger than Mg-O bonds [31,46]. In [29], less than 5% of serpentine-bound Mg2+ was found to be labile in similar reaction conditions. In the Stillwater tailings sample used here, 4% of lizardite-bound Mg2+ equated to only about 0.4 mg, which was still more than the 0.03 mg accumulation of Mg2+ observed in this experiment. The apparent lack of dissolution for the low-abundant lizardite in Tail 2a might also have been due to transport limitations through the remaining bulk sample, and might be improved with use of stirring and reaction times longer than 60 h.
Over the 60-h dissolution period, effluent concentration measurements above the ICP detection limit accumulated to about 1.35 mg of Ca2+ and 0.03 mg of Mg2+. After correcting for the Ca2+ and Mg2+ likely released from calcite and hydromagnesite, results indicate that about 0.59% of the total Ca2+ and none of the Mg2+ available in the 501.6 mg sample were labile from silicate structures. This is displayed in Table 8.

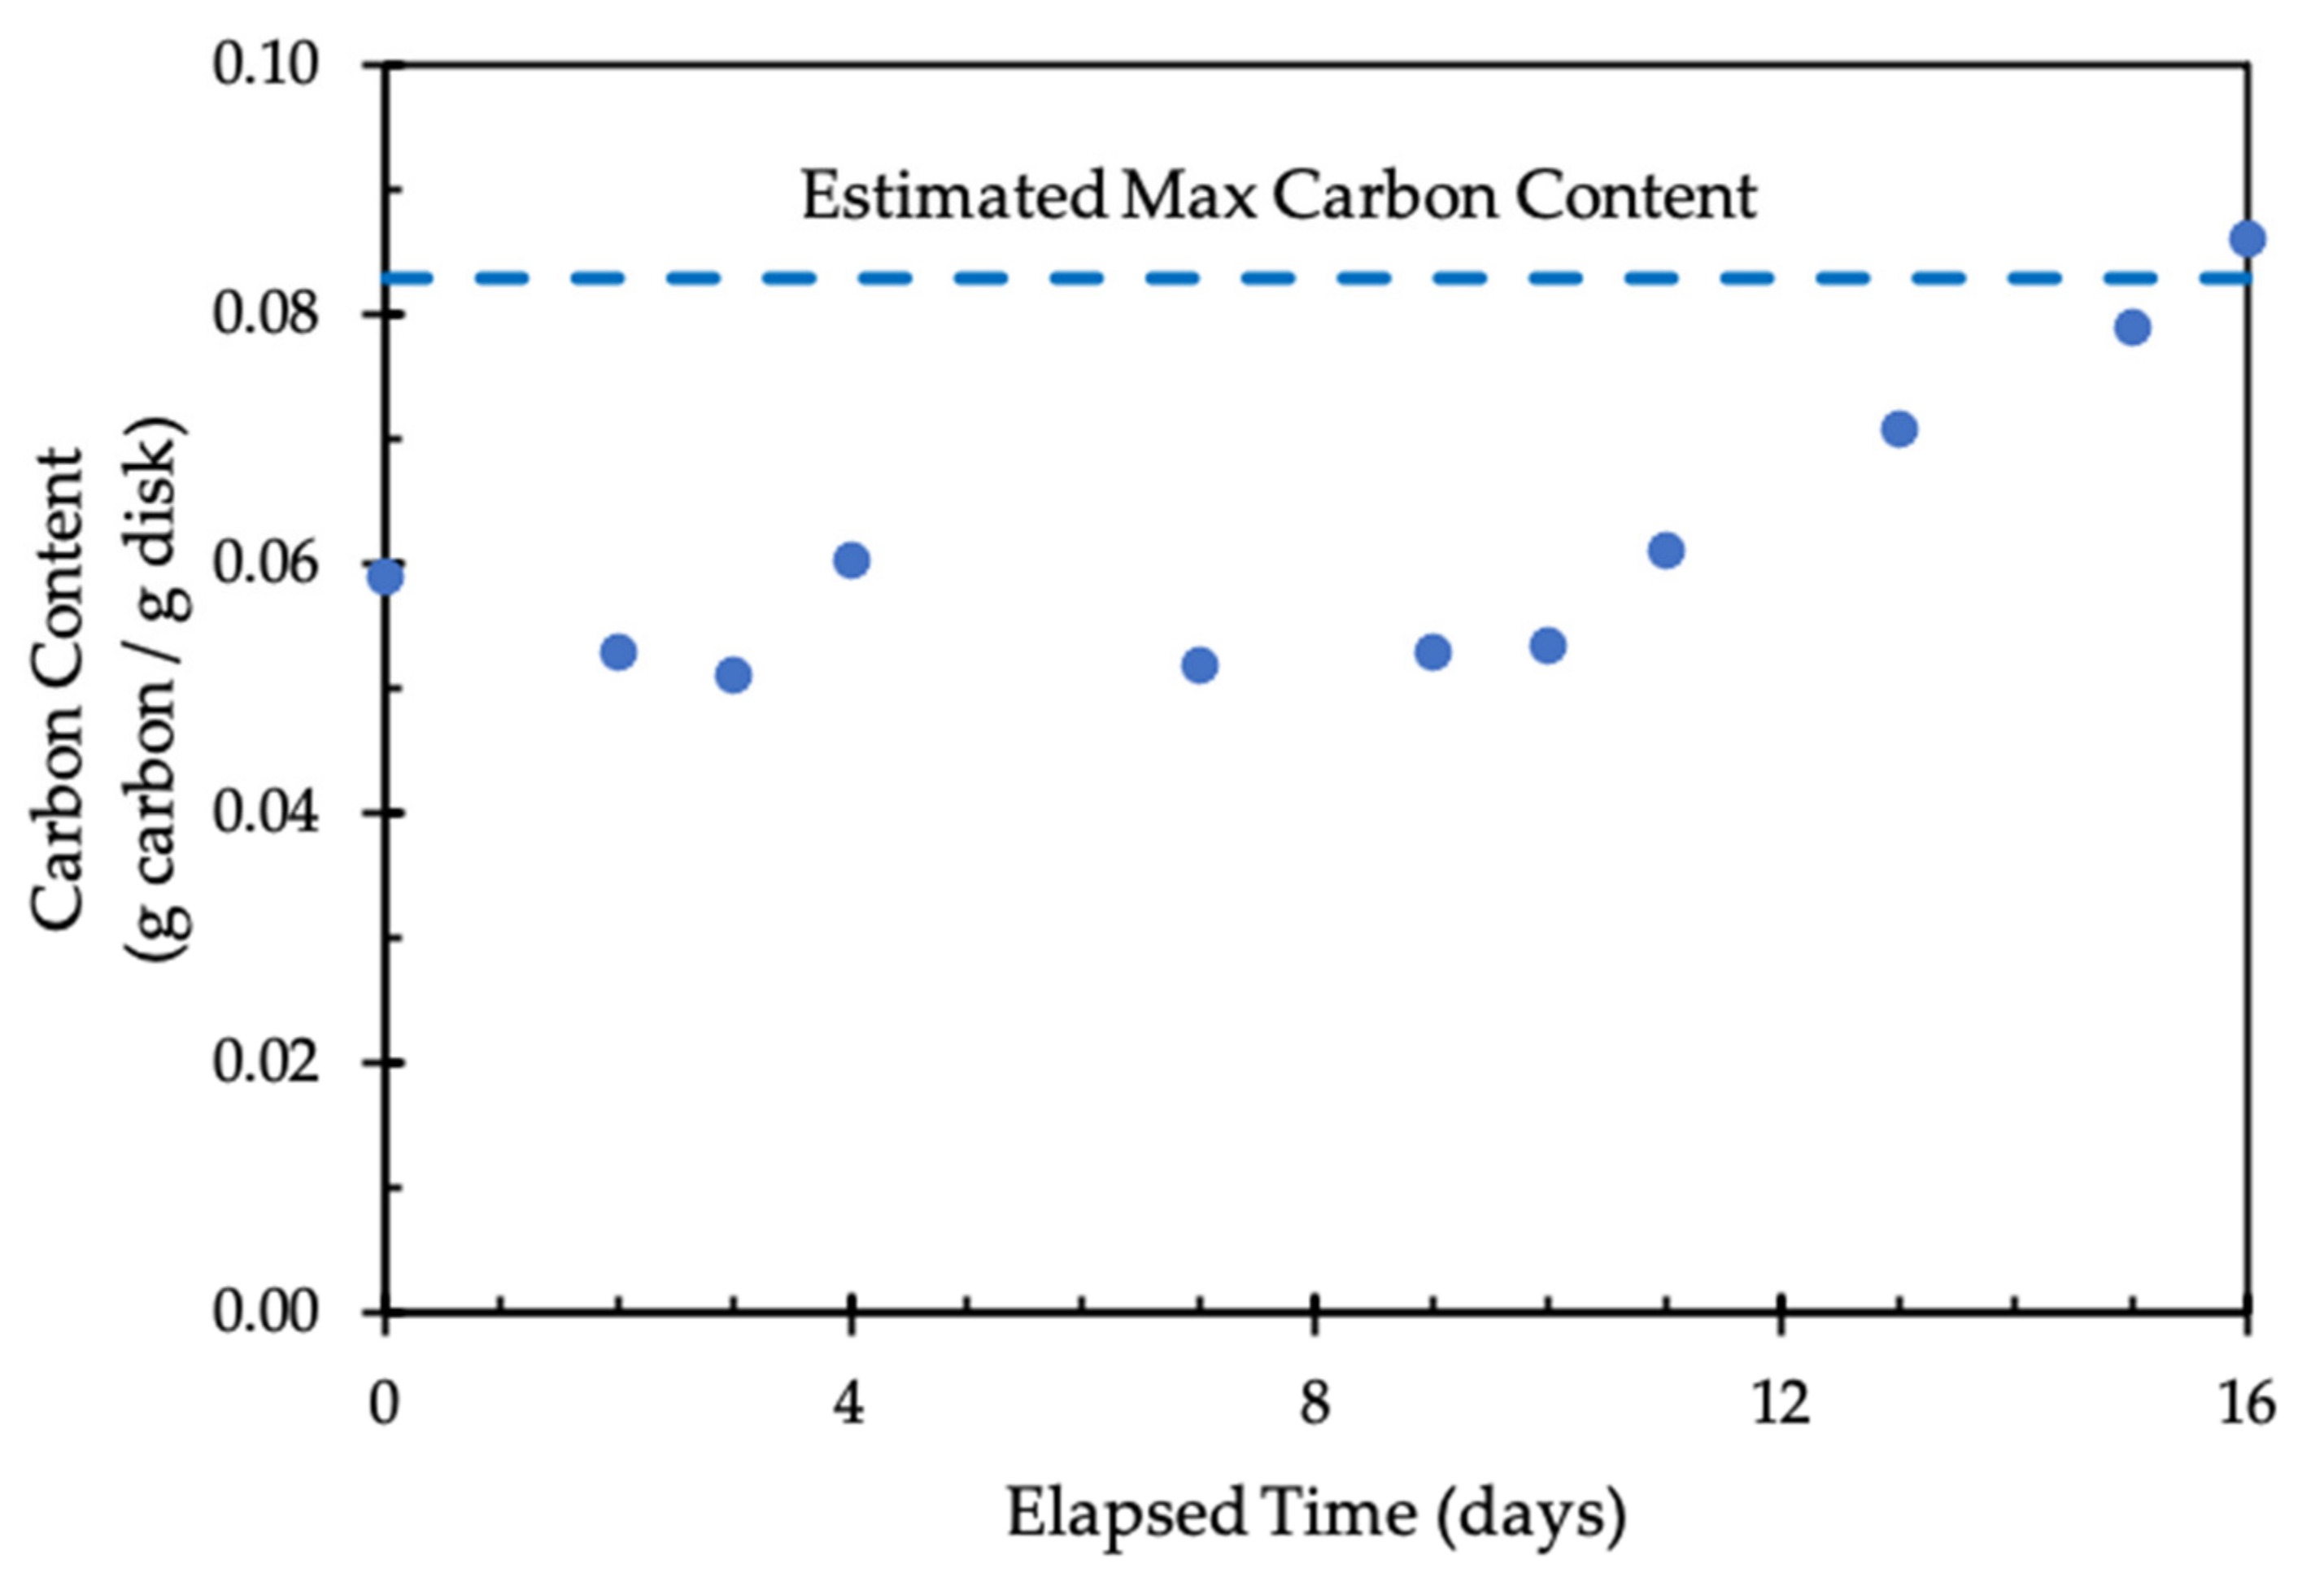
3.3. Disk Carbonation

The analysis of carbon uptake through disk carbonation is based on the changes in TIC measured in each disk. Although the mass of each disk was recorded as an estimate of carbonation, evaporative mass loss caused the analysis to be too difficult, as is common in this sort of experiment [32], so mass measurements are not reported. The carbon uptake among all of the disks is displayed in Table 9.
The results in Table 9 indicate that three of the four samples exhibited an overall net increase in carbon content over the 16-day period. The only sample that did not exhibit an increase in carbon content was Tail 2b. This might be explained by more closely examining the carbonation of the Tail 2a disks, as Tail 2a and Tail 2b had similar mineralogy. Using the labile magnesium and calcium of Tail 2a measured in the flow-through dissolution experiment (Table 9), a maximum carbon content value was estimated for the disk carbonation experiment by assuming magnesium and calcium would carbonate to form hydromagnesite and calcite, respectively. This value is plotted with the carbon content of Tail 2a in Figure 5, indicating that all of the measured labile cations were carbonated.
Before the estimated maximum carbon content was reached, Tail 2a disks actually had a net decrease in carbon content, similar to the behavior of Tail 2b during the full 16-day period. This initial decrease in Tail 2a corresponded to the initial CO2 release from the carbonate dissolution examined in Region I of the flow-through dissolution experiment. The carbonate already present in the tailings would have first dissolved before being reformed via carbonation. Because Tail 2b had half the reactive surface area of Tail 2a, the carbonation reaction may have been delayed. Therefore, longer reaction times might be necessary for carbon uptake to have occurred in Tail 2b.

4. Discussion

4.1. Significance of Results

In this study, the reactivity for carbon mineralization of Stillwater mine tailings was indirectly assessed through characterization experiments, and directly assessed via flow-through dissolution and disk carbonation experiments. The results presented varying degrees of potential for carbon storage via carbon mineralization.
Based on the observation of liquids from the two tailings storage facilities, it is clear that the Stillwater tailings are capable of dissolving and releasing alkaline cations that can react with dissolved CO2 at ambient conditions. However, even after interacting with the atmosphere for nearly two decades (Tail 1), there remains a considerable amount of alkalinity in the tailings, which could be used to store more CO2. Additionally, the small particle size and large surface area presented by the Stillwater tailings provides favorable conditions for reaction. Evidently, these conditions are not favorable enough to maximize CO2 storage for a number of reasons.
The mineralogy across all tailings samples was heterogeneous, composed of several mineral phases with varying silicate structures and reactivity. Similarly, the chemistry of the tailings samples was diverse, with nearly equimolar concentrations of calcium and magnesium. This heterogeneity presented some difficulty for targeting conditions of dissolution and carbonation. For example, although the flow-through dissolution experiment was able to release some Ca2+ (likely from anorthite), it was unable to release Mg2+.
Low reactivity of serpentine in mine tailings through flow-through dissolution has been previously reported [29]. In Lu’s study, two samples composed of 43% and 77% serpentine were measured to have labile Mg2+ contents of 5% and 21%. These values of labile Mg2+ are far higher than the 0.3% measured here. However, the tailings also benefited from brucite content, which is far more reactive than serpentine [31]. Because Tail 2a was composed of only about 8% lizardite, with no brucite, leaching of lizardite-related Mg might have suffered from transport limitations through the remainder of the tailings sample. This could be improved with stirring and longer reaction times.
The most prominent mineral phase in the Stillwater tailings, anorthite, can achieve dissolution rates of >10−8 mol m−2 s−1 at 25 °C and >10−7 mol m−2 s−1 at 180 °C, on par with dissolution rates of wollastonite and brucite at low temperatures and faster than records of olivine added to soil [35]. However, in the flow-through dissolution experiment presented here, the dissolution rate was in the order of 10−10 mol m−2 s−1. This may be a consequence of the tailings’ heterogeneity, and could represent a more realistic rate for PGM tailings.
Despite the fact that the dissolution rates measured here are rather slow, Figure 5 confirms that the flow-through dissolution experiment accurately depicted the number of labile cations in the Stillwater tailings. Although there was a notable amount of alkalinity available in the tailings, the majority of the alkaline cations were not labile at ambient conditions. Elevated conditions may be necessary to realize the full mineralization potential—meaning longer reaction times, higher temperature, higher pressure, stirring, or use of reagents to manipulate pH. Of course, the implementation of such conditions would have to be weighed against the environmental impact they impose, as they run the risk of emitting more CO2 than is actually sequestered [17]
As an example of elevated reaction conditions, the Stillwater tailings characterized here were similar in mineralogy and composition to anorthosite and basalt rocks described elsewhere [47]. In this study, carbonation was tested with conditions mimicking geologic storage sites (185 °C, 139 atm, 1 M NaCl + 0.64 M NaHCO3) with particle size d(0.9) = 11.94 and 7.81 µm, respectively. Here, carbonation extents of 19% and 9% were achieved for anorthosite and basalt, respectively, where the extent is the amount of CO2 stored as solid carbonate relative to the theoretical storage capacity. These values are considerably higher than the approximately 1% of calcium carbonated in this study.

4.2. Opportunity for Climate Impact

As the 21st century unfolds, efforts will continue to accelerate to minimize the impacts of climate change due to excess carbon emissions. This will be realized in part through transformations in the electric sector, which is projected to see a 900% increase in mineral production [2]. In parallel, up to 3.5 Gt/year of ultrabasic mine wastes will be generated at nickel and PGM mines like Stillwater [16]. As the motivation of this electric sector transformation is increased sustainability, it is imperative that sustainable practices of tailings handling and storage be developed and maintained.
In this study, it was found that although about 15% of Tail 2a mass was made up of Ca2+ and Mg2+ cations, only less than 1% of the Ca2+ and 0% of the Mg2+ were readily released from silicate structures to easily produce carbonates. If this labile Ca2+ and Mg2+ were to be carbonated as calcite and hydromagnesite, respectively, about 1.79 kg CO2 could be stored in a metric ton of Stillwater tailings. If this same carbonation process were applied to the 1 Mt of tailings produced per year at Stillwater, it would result in about 1.8 kt CO2 stored per year. Furthermore, if this process were applied to the 3.5 Gt of tailings projected to be produced across the world, it would result in 6 Mt CO2 stored per year. The potential to store additional CO2 increases further if employing an improved process like [47]. Additional estimations are displayed in Table 10. These global estimates assume that all tailings possess the same mineralogy as the Stillwater tailings characterized in this study, and should be taken as a rough estimate.

5. Conclusions

Carbon mineralization is a climate mitigation pathway that permanently stores CO2 in the form of carbonate minerals when maintained above an acidic pH. In this study, tailings from the Stillwater mine, which produces copper, nickel, and PGMs, were characterized and assessed for their ability to serve as a carbon mineralization feedstock. The tailings were found to have favorable characteristics for carbon mineralization (small particle size, large surface area, calcium and magnesium contents), and observation of the liquid from the tailings storage facilities indicated that the tailings have leached alkaline cations at ambient conditions. However, in a flow-through dissolution experiment to assess the number of labile cations that can be released in low-cost, ambient conditions, less than 1% of the silicate-bound calcium was released.
The potential increases in CO2 storage from improved mineralization processes—where an optimistic 50% carbonation extent could store more than 300 Mt CO2 per year in the 3.5 Gt of tailings from nickel and PGM mines (as shown in Table 10)—should serve as motivation to expand on this work. Future work should involve investigating new ways to extract and carbonate the calcium and magnesium from heterogeneous PGM tailings like those of Stillwater, as well as assess and characterize other tailings sources in locations where mining practices are expected to increase the most.

Author Contributions

Conceptualization, G.D. and J.W.; methodology, C.M.W., X.L. and G.D.; validation, X.L. and G.D.; formal analysis, C.M.W.; investigation, C.M.W. and X.L.; resources, G.D. and J.W.; data curation, C.M.W.; writing—original draft preparation, C.M.W.; writing—review and editing, C.M.W. and X.L.; visualization, C.M.W.; supervision, G.D. and J.W.; project administration, G.D. and J.W.; funding acquisition, J.W. All authors have read and agreed to the published version of the manuscript.

Funding

This research was funded by Community Energy, Inc.

Data Availability Statement

The data presented in this study are available on request from the corresponding author.

Conflicts of Interest

The authors declare no conflict of interest.

References

  1. Marcy, C. U.S. Renewable Electricity Generation Has Doubled since 2008 March 2019. Available online: https://www.eia.gov/todayinenergy/detail.php?id=38752 (accessed on 4 August 2021).
  2. Watari, T.; McLellan, B.C.; Giurco, D.; Dominish, E.; Yamasue, E.; Nansai, K. Total material requirement for the global energy transition to 2050: A focus on transport and electricity. Resour. Conserv. Recycl. 2019, 148, 91–103. [Google Scholar] [CrossRef]
  3. Pilorgé, H.; McQueen, N.; Maynard, D.; Psarras, P.; He, J.; Rufael, T.; Wilcox, J. Cost Analysis of Carbon Capture and Sequestration of Process Emissions from the U.S. Industrial Sector. Environ. Sci. Technol. 2020, 54, 7524–7532. [Google Scholar] [CrossRef]
  4. McQueen, N.; Psarras, P.; Pilorgé, H.; Liguori, S.; He, J.; Yuan, M.; Wilcox, J. Cost Analysis of Direct Air Capture and Sequestration Coupled to Low-Carbon Thermal Energy in the United States. Environ. Sci. Technol. 2020, 54, 7542–7551. [Google Scholar] [CrossRef] [PubMed]
  5. Woodall, C.M.; Piccione, I.; Benazzi, M.; Wilcox, J. Capturing and Reusing CO2 by Converting it to Rocks. Front. Young Minds 2021, 8, 592018. [Google Scholar] [CrossRef]
  6. Negative Emissions Technologies and Reliable Sequestration: A Research Agenda; The National Academies Press: Washington, DC, USA, 2019.
  7. Woodall, C.M.; McQueen, N.; Pilorgé, H.; Wilcox, J. Utilization of Mineral Carbonation Products: Current State and Potential. Greenh. Gases Sci. Technol. 2019, 9, 1096–1113. [Google Scholar] [CrossRef]
  8. Wilson, S.A.; Dipple, G.M.; Power, I.M.; Thom, J.M.; Anderson, R.G.; Raudsepp, M.; Southam, G. Carbon dioxide fixation within mine wastes of ultramafic-hosted ore deposits: Examples from the Clinton Creek and Cassiar Chrysotile deposits, Canada. Econ. Geol. 2009, 104, 95–112. [Google Scholar] [CrossRef]
  9. Wilson, S.A.; Harrison, A.L.; Dipple, G.M.; Power, I.M.; Barker, S.L.; Mayer, K.U.; Southam, G. Offsetting of CO2 emissions by air capture in mine tailings at the Mount Keith Nickel Mine, Western Australia: Rates, controls and prospects for carbon neutral mining. Int. J. Greenh. Gas Control 2014, 25, 121–140. [Google Scholar] [CrossRef]
  10. Washbourne, C.-L.; Lopez-Capel, E.; Renforth, P.; Ascough, P.L.; Manning, D.A.C. Rapid Removal of Atmospheric CO2 by Urban Soils. Environ. Sci. Technol. 2015, 49, 5434–5440. [Google Scholar] [CrossRef]
  11. Power, I.M.; Dipple, G.M.; Bradshaw, P.M.D.; Harrison, A.L. Prospects for CO2 mineralization and enhanced weathering of ultramafic mine tailings from the Baptiste nickel deposit in British Columbia, Canada. Int. J. Greenh. Gas. Control 2020, 94, 102895. [Google Scholar] [CrossRef]
  12. Gras, A.; Beaudoin, G.; Molson, J.; Plante, B.; Bussière, B.; Lemieux, J.M.; Dupont, P.P. Isotopic evidence of passive mineral carbonation in mine wastes from the Dumont Nickel Project (Abitibi, Quebec). Int. J. Greenh. Gas. Control 2017, 60, 10–23. [Google Scholar] [CrossRef]
  13. Vogeli, J.; Reid, D.L.; Becker, M.; Broadhurst, J.; Franzidis, J.P. Investigation of the potential for mineral carbonation of PGM tailings in South Africa. Miner. Eng. 2011, 24, 1348–1356. [Google Scholar] [CrossRef]
  14. Meyer, N.A.; Vögeli, J.U.; Becker, M.; Broadhurst, J.L.; Reid, D.L.; Franzidis, J.-P. Mineral carbonation of PGM mine tailings for CO2 storage in South Africa: A case study. Miner. Eng. 2014, 59, 45–51. [Google Scholar] [CrossRef]
  15. Mineral Commodity Summaries 2020; U.S. Geological Survey: Reston, VA, USA, 2020.
  16. Renforth, P. The negative emission potential of alkaline materials. Nat. Commun. 2019, 10, 1401. [Google Scholar] [CrossRef] [Green Version]
  17. Ncongwane, M.S.; Broadhurst, J.L.; Petersen, J. Assessment of the potential carbon footprint of engineered processes for the mineral carbonation of PGM tailings. Int. J. Greenh. Gas. Control 2018, 77, 70–81. [Google Scholar] [CrossRef] [Green Version]
  18. Harrison, A.L.; Dipple, G.M.; Power, I.M.; Mayer, K.U. The impact of evolving mineral-water-gas interfacial areas on mineral-fluid reaction rates in unsaturated porous media. Chem. Geol. 2016, 421, 65–80. [Google Scholar] [CrossRef]
  19. Zarandi, A.E.; Larachi, F.; Beaudoin, G.; Plante, B.; Sciortino, M. Ambient mineral carbonation of different lithologies of mafic to ultramafic mining wastes/tailings—A comparative study. Int. J. Greenh. Gas. Control 2017, 63, 392–400. [Google Scholar] [CrossRef]
  20. Assima, G.P.; Larachi, F.; Beaudoin, G.; Molson, J. Dynamics of carbon dioxide uptake in chrysotile mining residues—Effect of mineralogy and liquid saturation. Int. J. Greenh. Gas. Control 2013, 12, 124–135. [Google Scholar] [CrossRef]
  21. Hamilton, J.L.; Wilson, S.A.; Morgan, B.; Harrison, A.L.; Turvey, C.C.; Paterson, D.J.; Southam, G. Accelerating Mineral Carbonation in Ultramafic Mine Tailings via Direct CO2 Reaction and Heap Leaching with Potential for Base Metal Enrichment and Recovery. Econ. Geol. 2020, 115, 303–323. [Google Scholar] [CrossRef]
  22. Sibanye-Stillwater. Stillwater & East Boulder. 2021. Available online: https://www.sibanyestillwater.com/business/americas/pgm-operations-americas/stillwater-east-boulder/ (accessed on 4 August 2021).
  23. Jenkins, M.C.; Mungall, J.E.; Zientek, M.L.; Holick, P.; Butak, K. The nature and composition of the J-M reef, Stillwater Complex, Montana, USA. Econ. Geol. 2020, 115, 1799–1826. [Google Scholar] [CrossRef]
  24. NOAA. Local Climatological Data Annual Summary with Comparative Data; NOAA: Billings, MT, USA, 2019. [Google Scholar]
  25. Montana Department of Environmental Quality and US Department of Agriculture. Stillwater Mining Company’s Revised Water Management Plans and Boe Ranch LAD; Montana Department of Environmental Quality and US Department of Agriculture: Helena, MT, USA, 2012. [Google Scholar]
  26. Montana Deparment of Environmental Quality; USFS. Final Environmental Impact Statement for the Stillwater Mine Revised Waste Management Plan and Hertzler Tailings Impoundment; Montana Deparment of Environmental Quality: Helena, MT, USA, 1998. [Google Scholar]
  27. Bruker AXS. DIFFRACplus EVA 14 [Computer Software]. 2008. Available online: https://www.bruker.com/en/products-and-solutions/diffractometers-and-scattering-systems/x-ray-diffractometers/diffrac-suite-software/diffrac-eva.html (accessed on 4 August 2021).
  28. Dionex. ICS-2000 Ion. Chromatography System Operator’s Manual. 2006. Available online: https://assets.thermofisher.com/TFS-Assets/CMD/manuals/Man-031857-ICS-2000-Ion-Chromatography-Man031857-EN.pdf (accessed on 4 August 2021).
  29. Lu, X. Characterization of Ultramafic Mine Tailings Reactivity for Carbon Capture and Storage. Master’s Thesis, The University of British Columbia, Vancouver, BC, Canada, 2020. [Google Scholar]
  30. De Baere, B.; François, R.; Mayer, K.U. Measuring mineral dissolution kinetics using on-line flow-through time resolved analysis (FT-TRA): An exploratory study with forsterite. Chem. Geol. 2015, 413, 107–118. [Google Scholar] [CrossRef] [Green Version]
  31. Daval, D.; Hellmann, R.; Martinez, I.; Gangloff, S.; Guyot, F. Lizardite serpentine dissolution kinetics as a function of pH and temperature, including effects of elevated pCO2. Chem. Geol. 2013, 351, 245–256. [Google Scholar] [CrossRef]
  32. Harrison, A.L.; Dipple, G.M.; Power, I.M.; Mayer, K.U. Influence of surface passivation and water content on mineral reactions in unsaturated porous media: Implications for brucite carbonation and CO2 sequestration. Geochim. Cosmochim. Acta 2015, 148, 477–495. [Google Scholar] [CrossRef]
  33. Sanna, A.; Steel, L.; Maroto-Valer, M.M. Carbon dioxide sequestration using NaHSO4 and NaOH: A dissolution and carbonation optimisation study. J. Environ. Manag. 2017, 189, 84–97. [Google Scholar] [CrossRef] [PubMed]
  34. Lavikko, S.; Eklund, O. The role of the Silicate Groups in the Extraction of Mg with the ÅA route method. J. CO2 Util. 2016, 16, 466–473. [Google Scholar] [CrossRef]
  35. Kelemen, P.B.; McQueen, N.; Wilcox, J.; Renforth, P.; Dipple, G.; Vankeuren, A.P. Engineered carbon mineralization in ultramafic rocks for CO2 removal from air: Review and new insights. Chem. Geol. 2020, 550, 119628. [Google Scholar] [CrossRef]
  36. Sepp, S. Composition of the Earth’s Crust. Sandatlas. 2012. Available online: https://www.sandatlas.org/composition-of-the-earths-crust/ (accessed on 7 January 2021).
  37. Yalçin, H.; Bozkaya, Ö. Mineralogy and geochemistry of Paleocene ultramafic- and sedimentary-hosted talc deposits in the southern part of the Sivas Basin, Turkey. Clays Clay Miner. 2006, 54, 333–350. [Google Scholar] [CrossRef]
  38. Turvey, C.C.; Hamilton, J.L.; Wilson, S.A. Comparison of Rietveld-compatible structureless fitting analysis methods for accurate quantification of carbon dioxide fixation in ultramafic mine tailings. Am. Mineral. 2018, 103, 1649–1662. [Google Scholar] [CrossRef]
  39. Casas, C.C.; Schaschke, C.J.; Akunna, J.C.; Jorat, M.E. Dissolution experiments on dolerite quarry fines at low liquid to solid ratio: A source of calcium for microbial- induced calcite precipitation. Environ. Geotech. 2019, 1–9, accepted manuscript. [Google Scholar] [CrossRef]
  40. Parkhurst, D.L.; Appelo, C.A.J. Description of Input and Examples for PHREEQC Version 3—A Computer Program for Speciation, Batch-Reaction, One-Dimensional Transport, and Inverse Geochemical Calculations. In U.S. Geological Survey Techniques and Methods, Book 6, Chapter A43; U.S. Geologic Survey: Denver, CO, USA, 2013; pp. 6–43A. [Google Scholar]
  41. Palandri, J.L.; Kharaka, Y.K. A Compilation of Rate Parameters of Water-Mineral. Interaction Kinetics for Application to Geochemical Modeling; U.S. Geologic Survey: Denver, CO, USA, 2004. [Google Scholar]
  42. Murakami, T.; Kogure, T.; Kadohara, H.; Ohnuki, T. Formation of secondary minerals and its effect on anorthite dissolution. Am. Mineral. 1998, 83, 1209–1219. [Google Scholar] [CrossRef]
  43. Stillings, L.L.; Brantley, S.L. Feldspar dissolution at 25 °C and pH 3: Reaction stoichiometry and the effect of cations. Geochim. Cosmochim. Acta 1995, 59, 1483–1496. [Google Scholar] [CrossRef]
  44. Shotyk, W.; Nesbitt, H.W. Incongruent and congruent dissolution of plagioclase feldspar: Effect of feldspar composition and ligand complexation. Geoderma 1992, 55, 55–78. [Google Scholar] [CrossRef]
  45. Thom, J.G.M.; Dipple, G.M.; Power, I.M.; Harrison, A.L. Chrysotile dissolution rates: Implications for carbon sequestration. Appl. Geochem. 2013, 35, 244–254. [Google Scholar] [CrossRef]
  46. Crundwell, F.K. The mechanism of dissolution of minerals in acidic and alkaline solutions: Part II Application of a new theory to silicates, aluminosilicates and quartz. Hydrometallurgy 2014, 149, 265–275. [Google Scholar] [CrossRef]
  47. Gadikota, G.; Matter, J.; Kelemen, P.; Brady, P.V.; Park, A.H.A. Elucidating the differences in the carbon mineralization behaviors of calcium and magnesium bearing alumino-silicates and magnesium silicates for CO2 storage. Fuel 2020, 277, 117900. [Google Scholar] [CrossRef]
Figure 1. Photos of tailings storage facilities at the Stillwater mine, photographed by Noah McQueen in 2019: (a) Pond 1, idled; (b) closer photo of Pond 1, showing signs of crust at the pond surface; (c) waste rock pile; and (d) Pond 2, which has a large remaining capacity for additional tailings.
Minerals 11 00844 g001
Figure 2. Process flow diagram of lab-scale flow-through dissolution apparatus. Adapted with permission from [29].
Minerals 11 00844 g002
Figure 3. Schematic of the disk carbonation reaction chamber. Colored disks represent the various solid tailings samples molded into disks. Figure adapted with permission from [29].
Minerals 11 00844 g003
Figure 4. Evolution of Ca2+ and Al3+ dissolution rate in Tail 2a (left axis) paired with Ca2+ and Al3+ accumulation in solution (right axis). Published dissolution rates of diopside and anorthite are displayed for comparison [41]. The solid accumulation curve indicates values above the ICP detection limit, whereas the dashed curve indicates values below the ICP detection limit. Vertical lines separate distinct regions in the 60-h dissolution process, discussed in the text.
Minerals 11 00844 g004
Figure 5. Change in the carbon content in the disks of Tail 2a. The maximum carbon content is estimated based on all of the labile calcium and magnesium measured in the flow-through dissolution experiment being converted to calcite and magnesite, respectively.
Minerals 11 00844 g005
Table 1. Characteristics of Stillwater mine tailings: d(0.9) indicates that 90% of the sample analyzed is below the given particle size. Mineral abundances are given in weight %.
Silicate GroupMineral TypeMineralTail 1Tail 2aTail 2bTail 2c
Tecto-
(3-D framework)
Plagioclase FeldsparAnorthite—CaAl2Si2O836.754.354.335.9
Albite—NaAlSi3O83.23.93.75.6
Ino-
(chain)
PyroxeneEnstatite—(Mg,Fe)Si2O610.111.914.74.5
Diopside—CaMgSi2O611.59.79.36.5
AmphiboleTremolite—Ca2Mg5(Si8O22)(OH)23.02.22.62.4
Cummingtonite—Mg7(Si8O22)(OH)20.41.31.31.1
Phyllo-
(sheet)
SerpentineLizardite—Mg3Si2O5(OH)42.28.46.512.3
ClayTalc—Mg3Si4O10(OH)28.12.32.88.9
MicaClinochlore—(Mg,Fe)5Al2Si3O10(OH)21.76.04.920.6
N/ACarbonateCalcite—CaCO32.9---
Hydromagnesite—Mg5(CO3)4(OH)2-4H2O---2.1
TIC (% C)0.250.070.060.13
d(0.9) (µm)20.7951.1760.719.75
BET Reactive Surface Area (m2/g)3.81.290.6911.15
Table 2. Bulk chemical analysis results, measured via XRF and shown in weight %.
SampleSiO2Al2O3Fe2O3CaOMgONa2OK2OLOI
Tail 145.0718.345.9311.5011.401.070.145.95
Tail 2a45.5822.985.1413.308.551.300.082.29
Tail 2b46.4422.915.1213.558.431.290.061.90
Tail 2c43.5219.006.789.2713.901.120.115.76
SampleBaOCr2O3MnOP2O5SO3SrOTiO2Total
Tail 10.020.160.100.010.140.010.1299.96
Tail 2a0.010.090.08<0.010.090.010.0999.59
Tail 2b0.010.120.08<0.010.070.010.09100.08
Tail 2c0.010.090.100.020.140.010.0899.91
Table 3. Chemical composition of tailings storage facilities, measured via ICP-OES.
Tailings SampleTailings PondComposition (ppm)
AlCaFeKMgNaSi
Tail 110.65156.470.447.0453.58189.2011.20
Tail 2a20.0233.580.007.4110.05151.505.90
~Ratio Pond 1:23151131512
Table 4. Results of ion chromatography analysis of the tailings liquids.
Tailings SampleTailings PondAnions (mmol/L)Cations (mmol/L)
Cl SO42−NO3Al3+Ca2+Fe3+K+Mg2+Na+Si4+
Tail 1110.618.221.552.064.800.4290.463.7716.451.67
Tail 2a23.563.783.460.010.870.0015.860.4112.100.19
~Ratio Pond 1:232016763656919
Table 5. Charge balance for the Stillwater tailings storage facilities.
Tailings SampleTailings PondCharge Balance (meq/L)
AnionCationDifference
Tail 1Pond 128.60138.27109.67
Tail 2aPond 214.5731.3316.76
~Ratio Pond 1:2247
Table 6. Remaining charge balance via PHREEQC analysis.
Tailings SampleTailings PondpH Alkalinity (meq/L)
TotalOHHCO3CO32−
Tail 119.6896.910.0637.0235.59
Tail 2a28.704.060.013.540.26
Table 7. Ratios of cation accumulation during flow-through dissolution. Data generated through linear regression of the slopes in Figure 4.
Cation RatioStoichiometric RatioRegion IIRegion III, JumpRegion III,
Post-Jump
(14–32 h)(33–36 h)(37–58 h)
Ca2+/Al3+0.50.61.10.5
Ca2+/Si4+0.51.40.71.3
Al3+/Si4+12.30.72.9
Table 8. Final cation leaching results from the flow-through dissolution experiment of Tail 2a.
CationTail 2a Composition (Weight %)Mass in Sample (mg)Leached from Sample
(mg)
Leached from Carbonate *
(mg)
Leached from Silicate
(mg)
Labile (Total) +
(Weight %)
Labile
(Silicate) ++ (Weight %)
Calcium9.5047.651.351.070.282.830.59
Magnesium5.1625.860.030.030.000.110.00
* Estimated conversion of Tail 2a TIC to calcite and hydromagnesite. + Refers to cations easily released from Tail 2a. ++ Refers to cations easily released from silicate structures.
Table 9. Summary of change in TIC in disks of the Stillwater tailings.
SampleInitial TIC (Weight %)Final TIC (Weight %)Carbon Uptake (ΔTIC, Weight %)Carbon Uptake
(% Difference)
Tail 10.2110.3340.12358
Tail 2a0.0590.0860.02746
Tail 2b0.0510.047−0.004−7
Tail 2c0.1100.1630.05348
Table 10. CO2 storage potential for mineralization of PGM tailings.
Efficiency AchievedCarbonation Extent (%)kg-CO2 per
t-Tailings
Total t CO2/Year
StillwaterWorld *
(1 Mt Tailings/Yr)(3.5 Gt Tailings/Yr)
This work1.01.791792 6,273,599
Ref. [47]9.016.1316,132 56,462,389
Ref. [47]19.034.0634,057 119,198,377
Potential target50.089.6289,623 313,679,938
* Assumes all tailings have the same composition as the Stillwater tailings analyzed in this study.
Publisher’s Note: MDPI stays neutral with regard to jurisdictional claims in published maps and institutional affiliations.

