Article

Geochemical Considerations from the Carboniferous Unconventional Petroleum System of SW Iberia

by
Gabriel A. Barberes
1,2,*,
Rui Pena dos Reis
1,
Nuno L. Pimentel
3,
André L. D. Spigolon
4,
Paulo E. Fonseca
3,
Przemysław Karcz
5,
Marco C. Azevedo
6 and
Maria Teresa Barata
2
1
Center of Geoscience, Department of Earth Science, Faculty of Science and Technology, University of Coimbra, 3000-272 Coimbra, Portugal
2
Instituto de Astrofísica e Ciências do Espaço, Universidade de Coimbra, 3040-004 Coimbra, Portugal
3
Instituto Dom Luiz (IDL), Faculdade de Ciências, Universidade de Lisboa, 1749-016 Lisboa, Portugal
4
Petrobras/CENPES, Geochemistry Division, Rio de Janeiro 21941-915, Brazil
5
Polish Geological Institute—National Research Institute Lower Silesian Branch in Wrocław, 53122 Wrocław, Poland
6
3D Seismic Lab, School of Earth and Ocean Sciences, Cardiff University, Cardiff CF10 3AT, UK
*
Author to whom correspondence should be addressed.
Minerals 2021, 11(8), 811; https://doi.org/10.3390/min11080811
Submission received: 15 June 2021 / Revised: 23 July 2021 / Accepted: 23 July 2021 / Published: 27 July 2021
(This article belongs to the Special Issue Mineralogy and Geochemistry of Oil Shale)

Abstract

:
The Baixo Alentejo Flysch Group (BAFG) is an important stratigraphic unit that covers over half of the South Portuguese Zone (SPZ) depositional area, and it is composed by three main tectono-stratigraphic units: the Mértola, Mira, and Brejeira formations. All of these formations contain significant thicknesses of black shales and have several wide areas with 0.81 wt.%, 0.91 wt.%, and 0.72 wt.% average total organic carbon (TOC) (respectively) and thermal maturation values within gas zones (overmature). This paper is considering new data from classical methods of organic geochemistry characterization, such as TOC, Rock–Eval pyrolysis, and organic petrography, to evaluate the unconventional petroleum system from the SPZ. A total of 53 samples were collected. From the stratigraphical point of view, TOC values seem to have a random distribution. The Rock–Eval parameters point out high thermal maturation compatible with gas window (overmature zone). The samples are dominated by gas-prone extremely hydrogen-depleted type III/IV kerogen, which no longer has the potential to generate and expel hydrocarbons. The petrographic analyses positioned the thermal evolution of these samples into the end of catagenesis to metagenesis (wet to dry gas zone), with values predominantly higher than 2 %Ro (dry gas zone). The presence of thermogenic hydrocarbon fluids characterized by previous papers indicate that the BAFG from SPZ represents a senile unconventional petroleum system, working nowadays basically as a gas reservoir.

1. Introduction

Shale deposits with considerable organic carbon content (and some potential for hydrocarbon production) are frequently referred as both unconventional reservoirs and source rocks [1]. However, globally, there are different perceptions of the definition about an unconventional petroleum resource.
According to Law and Curtis [2], aside from economic parameters, there is a fundamentally important geological distinction between conventional and unconventional systems: conventional hydrocarbon resources are buoyancy-driven deposits, occurring as accumulations in classical structural and/or stratigraphic traps, whereas unconventional hydrocarbon resources are generally not buoyancy-driven accumulations. Alternatively, unconventional plays cover a large area and are generally not restricted to geological structures, unlike conventional plays [1].
On the other hand, it is also ordinary to say that unconventional gas reservoirs contain low to ultra-low permeability and produce mainly dry gas. Reservoirs with permeability greater than 0.1 mD (millidarcy) are considered conventional, and those with permeability below 0.1 mD are classified as unconventional, although there is no scientific basis for this designation [1].
From the engineering point of view, the US National Petroleum Council (NPC) considers unconventional gas reservoirs those that can be operated and produced without significant fluid flow, neither in economically viable amounts, unless the wells are stimulated by some technique as hydraulic fracturing, accessed by a horizontal or multilateral wellbore that gives more flow from the reservoir to the well [3]. This definition includes tight gas sands and carbonates, as well as resource plays as coal and shales [4]. The term unconventional resource play refers to rocks that work as both source and reservoir of hydrocarbons.
This paper aims to evaluate the unconventional petroleum system from the South Portuguese Zone (SPZ) considering new data from classical methods of organic geochemistry characterization: total organic carbon (TOC), Rock–Eval pyrolysis, and organic petrography (vitrinite reflectance).
The focus area is situated in a wide region along Setúbal, Beja, and Faro districts (south of Portugal), which include the Baixo Alentejo Flysch Group (BAFG) [5], the mostly turbidite sequence of SPZ prograding to the southwest (SW) with more than 3 km in thickness (some sectors reach more than 5 km; Figure 1) [6].

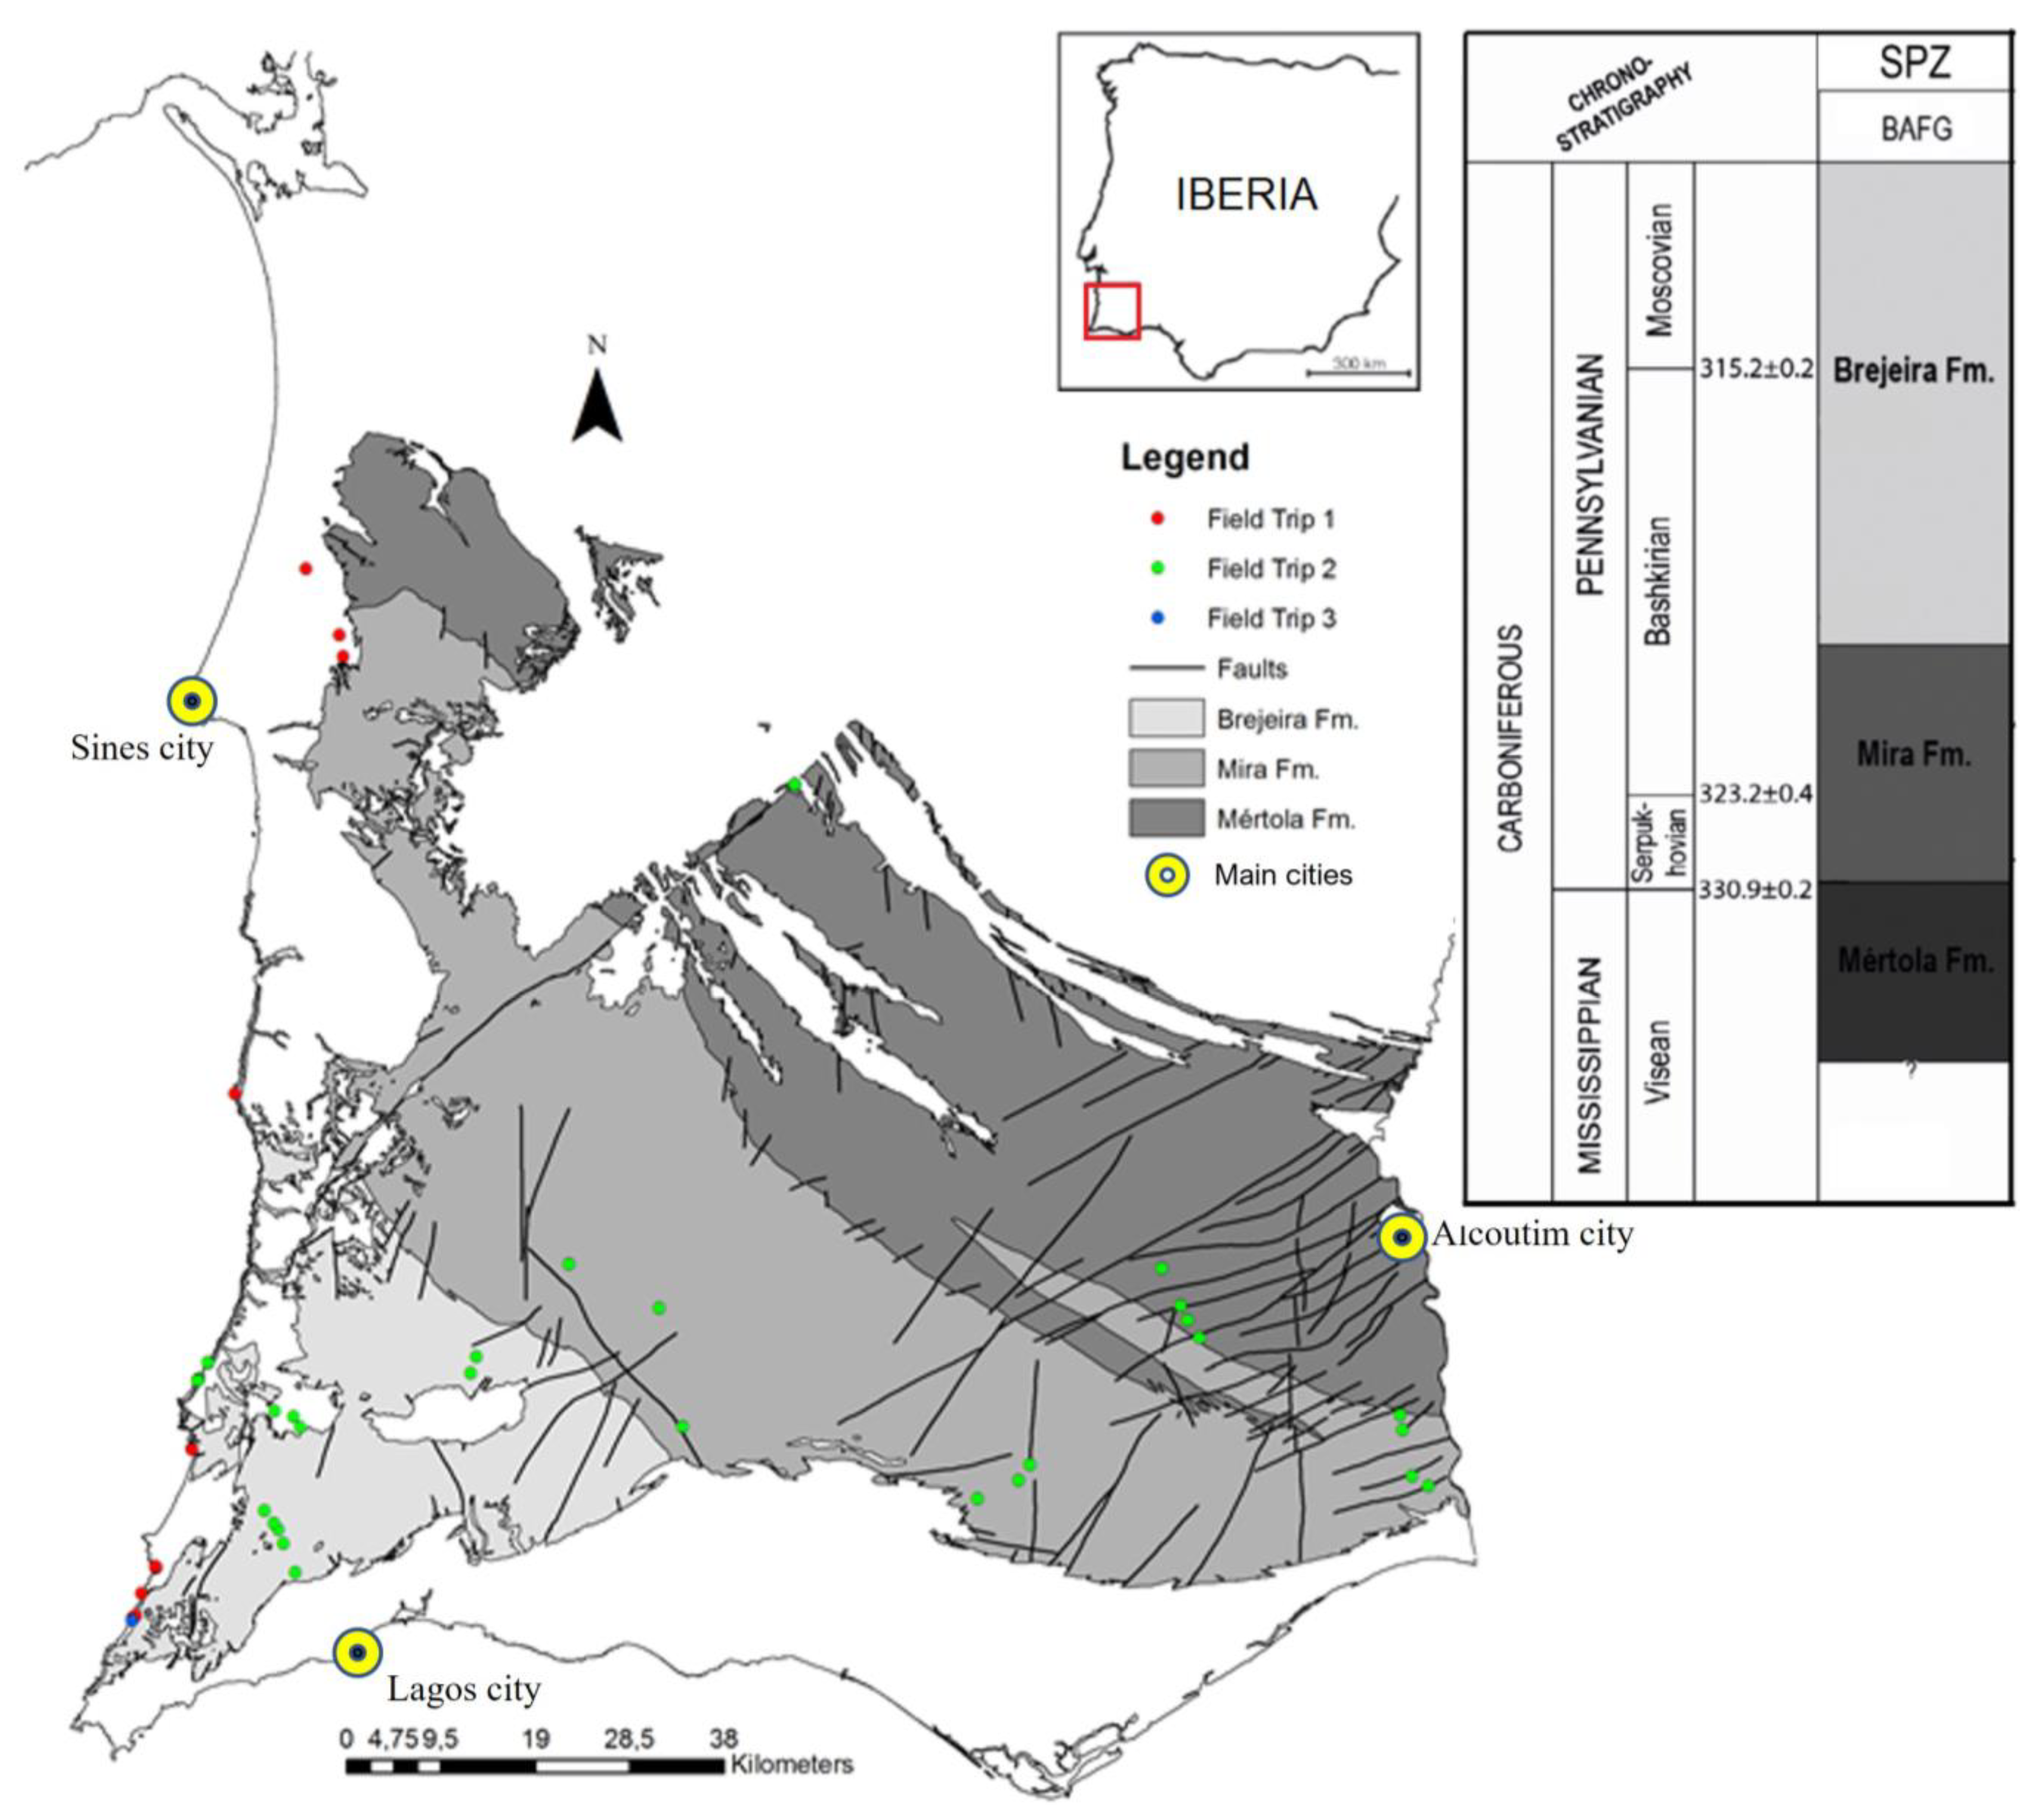
Geological Framework

BAFG is an important stratigraphic unit that covers, in some places by unconformity, more than half of the SPZ depositional area and is composed by three main tectono-stratigraphic units (from the base to the top): the Mértola, Mira, and Brejeira formations [7].
All these formations contain significant thicknesses of black shales, mainly the southernmost formation Brejeira (Figure 2). SPZ has several wide areas with 0.81 wt.%, 0.91 wt.%, and 0.72 wt.% (respectively) average organic carbon content and thermal maturation values within hydrocarbons generation zones [8,9,10].
The SPZ has been described for many publications since the 1970s, which provided an interpretation synthesis of the geological environment based on sedimentary processes, volcanism, and synsedimentary tectonism [7]. According to Fonseca and Ribeiro [11], the SPZ includes Late Devonian–Late Carboniferous sediments and volcanics deposited in an intra-continental transtensional setting. This tectono-stratigraphic sequence was deformed in a transpressional regime during the Upper Carboniferous, with vergence towards the southwest (Figure 1), in a typical thin-skinned thrust belt being constituted by Upper Paleozoic low- to very low-grade metamorphic rocks [8,12].

2. Materials and Methods

The outcrops were selected based on the existing bibliography about organic geochemistry data related to the thermal maturation and TOC of the studied formations [9,10], from which some interpolated (statistical relationships among the measured points) maps were created to choose preferably the non-overmature areas for analyses. For each studied outcrop, we gave priority to the darkest levels where grey, dark grey semi-black, and black fine-grained rocks occurred. On the first field campaign, 8 samples were collected from the Brejeira Fm. On the second campaign, 30 samples were collected, between Mértola Fm. (4 samples), Mira Fm. (10 samples), and Brejeira Fm. (16 samples). On the third campaign, 15 samples were collected, all from Brejeira Fm. (Figure 1). Therefore, a total of 53 samples were collected for this project.
TOC, Rock–Eval, and petrographic analyses from 1st and 2nd campaign were performed by Weatherford Laboratories (Houston, TX, USA). For the 3rd campaign, the samples were analyzed by the Polish Geological Institute (PGI-Warsaw, Poland). The analyses were kindly financed by Repsol E&P (Madrid, Spain), Partex Oil&Gas (Lisbon, Portugal), and Polish Geological Institute.

2.1. TOC and Rock–Eval Pyrolysis

A total of 31 samples were collected for Rock–Eval pyrolysis (22 from Brejeira Formation, 3 from Mira Formation, and 1 from Mértola Formation). The Rock–Eval measurements were performed at the PGI and Weatherford using the Rock–Eval 6 apparatus [13] in the Bulk Rock operating “mode”, i.e., a basic mode intended for fundamental pyrolytic characterization of rock samples. The rock was crushed to fine particle size (0.125–0.25 mm), and 100 mg samples were loaded into pyrolysis crucibles [14]. The samples were pyrolyzed under helium as a carrier gas at 300 °C for 3–4 min, followed by heating at 25 °C/min to 550 °C. Free hydrocarbons (S1 peak), petroleum potential (S2 peak), maximum temperature at S2 peak, and the amount of carbon dioxide (S3 peak) were measured in mg/g rock over time. Each analysis required about 20 min.
The Bulk Rock pyrolytic operating mode involves pyrolysis and oxidation cycles in temperature ranges of 300–650 °C and 300–850 °C, respectively. The method is used for basic screening of all types of rock samples and allows for the determination of the full set of the Rock–Eval parameters necessary to distinguish between poor and excellent source rocks. The mode provides geochemical parameters, such as content of S1-free hydrocarbons released at temperatures below 300 °C, S2-hydrocarbons released from kerogen at temperatures between 300 and 650 °C, Tmax—maximum temperature measured in the highest point of the S2 curve, HI—hydrogen index, OI—oxygen index, PI—productive index, TOC—total organic carbon content, RC—residual (non-pyrolyzable) organic carbon content, and PC—pyrolyzable (productive) carbon content.

2.2. Vitrinite Reflectance Analysis (VR)

Samples were prepared for petrographic analyses according to ASTM D2797 [15], where the rock particles were mounted in a plastic briquette then ground and polished with successively finer abrasives until a 0.05 mm finishing stage. Petrographic analyses were performed at the Weatherford Laboratories using ASTM D7708 [16] for %Ro (reflectance in oil) in shale. Selected vitrinite particles were positioned under the microscope crosshairs at 500× magnification, their reflectance under incident white light was measured at a detector, and then, compared with measured light reflected from a calibration standard. At least 20 individual measurements of %Ro were determined for each shale sample, and 50–100 measurements were determined for %Ro in coal.

3. Results

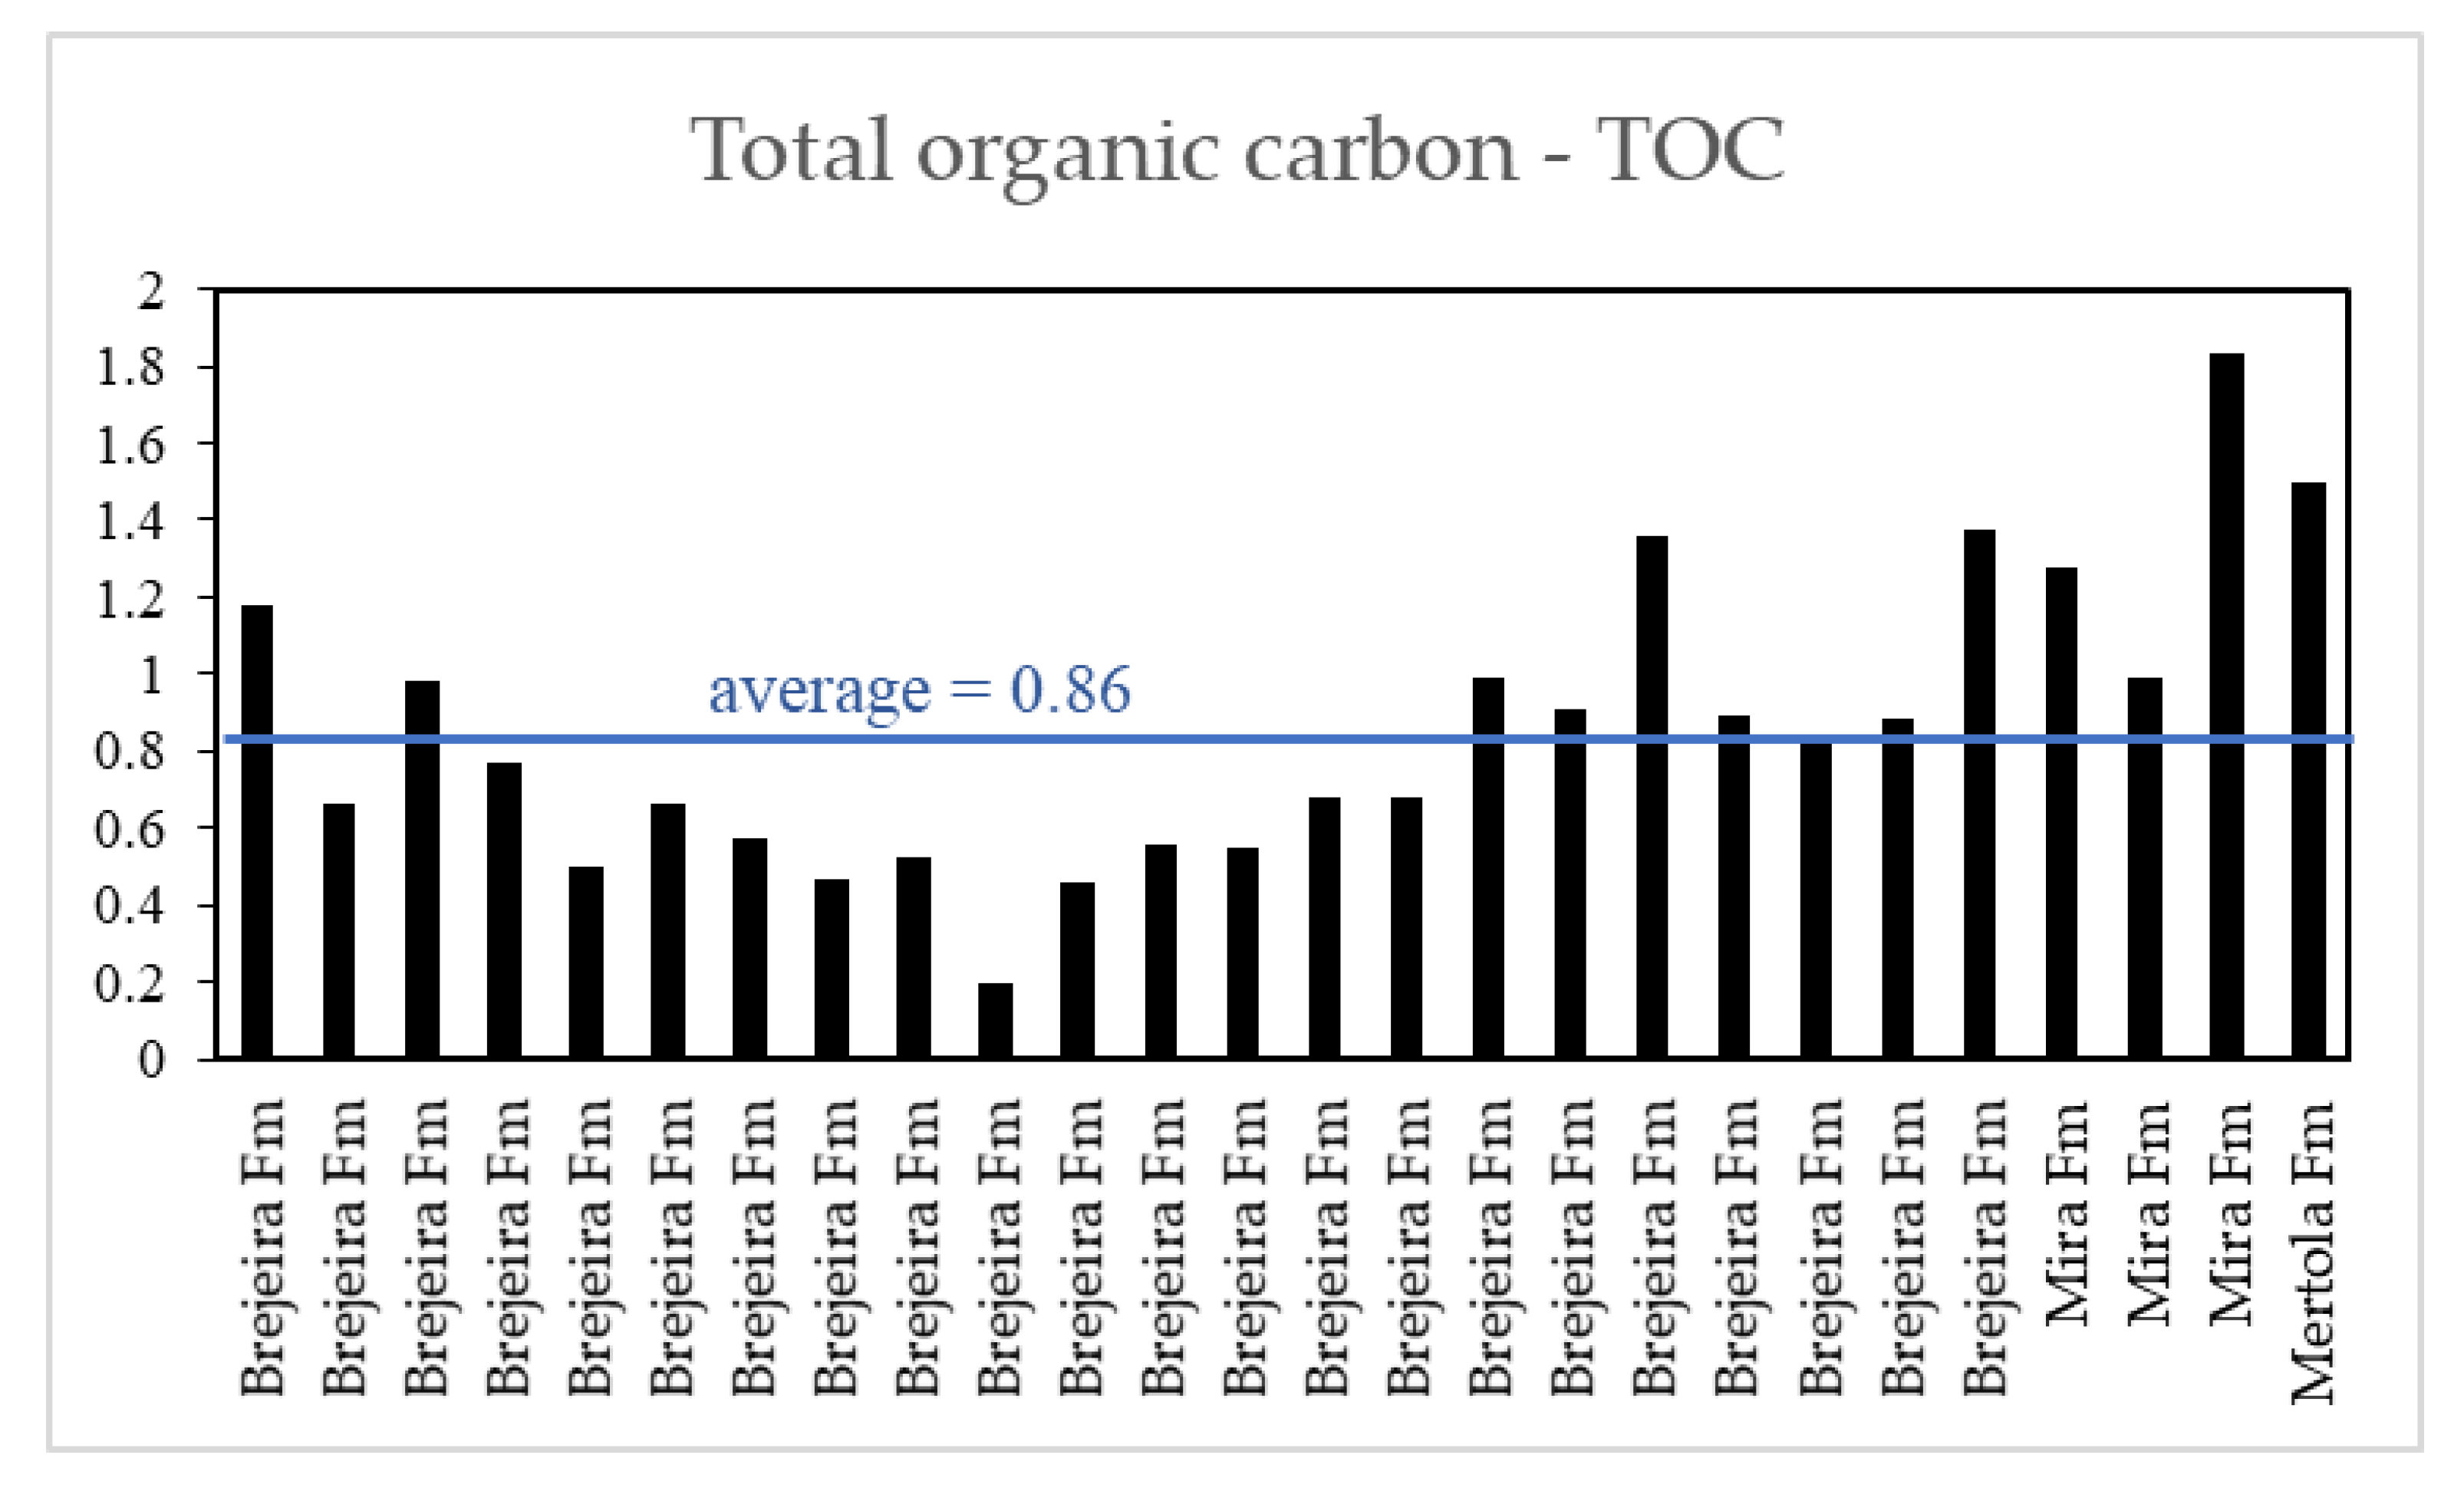
3.1. Total Organic Carbon

The TOC values vary between 0.20 wt.% and 1.84 wt.%, with a mean value of 0.81 wt.%, 0.91 wt.%, and 0.72 wt.% for the Mértola, Mira, and Brejeira formations, respectively (Table 1). Most of the samples (74%) had values between 0.5 wt.% and 1.0 wt.%, indicating a poor organic carbon content for the source rocks evaluated. Figure 3 shows the variability of the organic content in the studied samples.
Stratigraphically, the TOC values seem to have a random distribution. However, the obvious sampling concentration in Brejeira Formation complicates the interpretation. Therefore, future systematic analyses are required to confirm this conclusion.

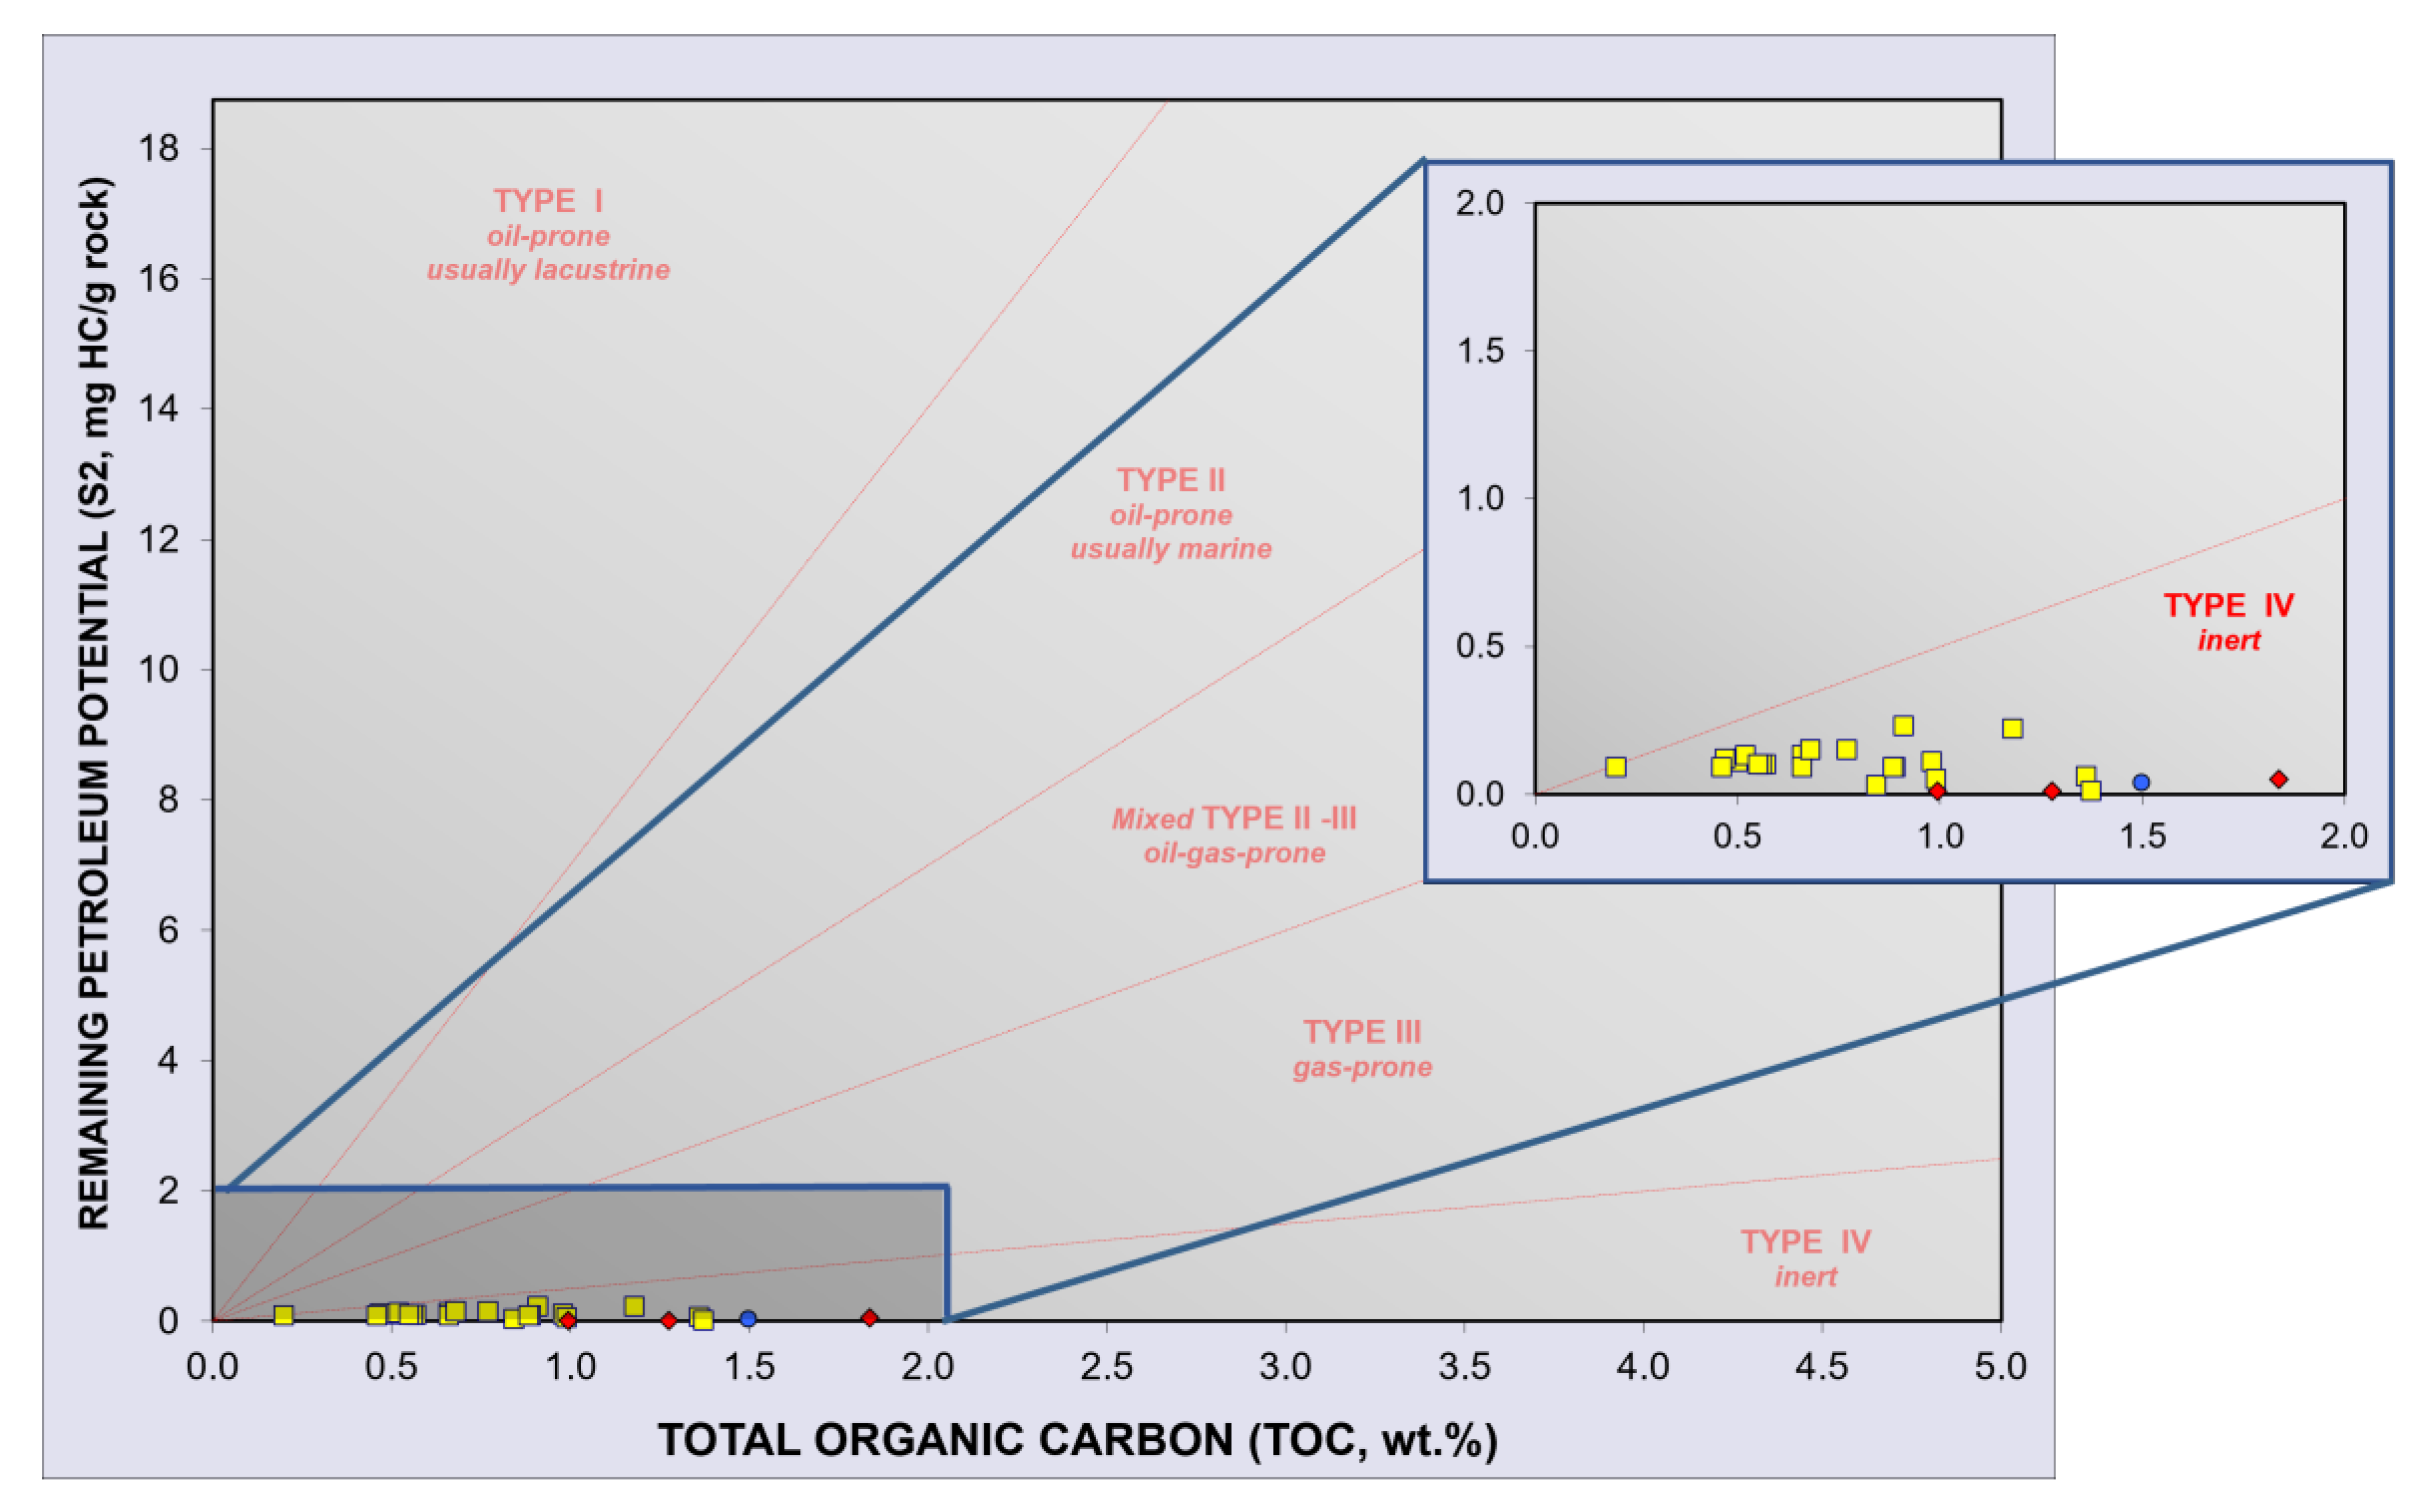
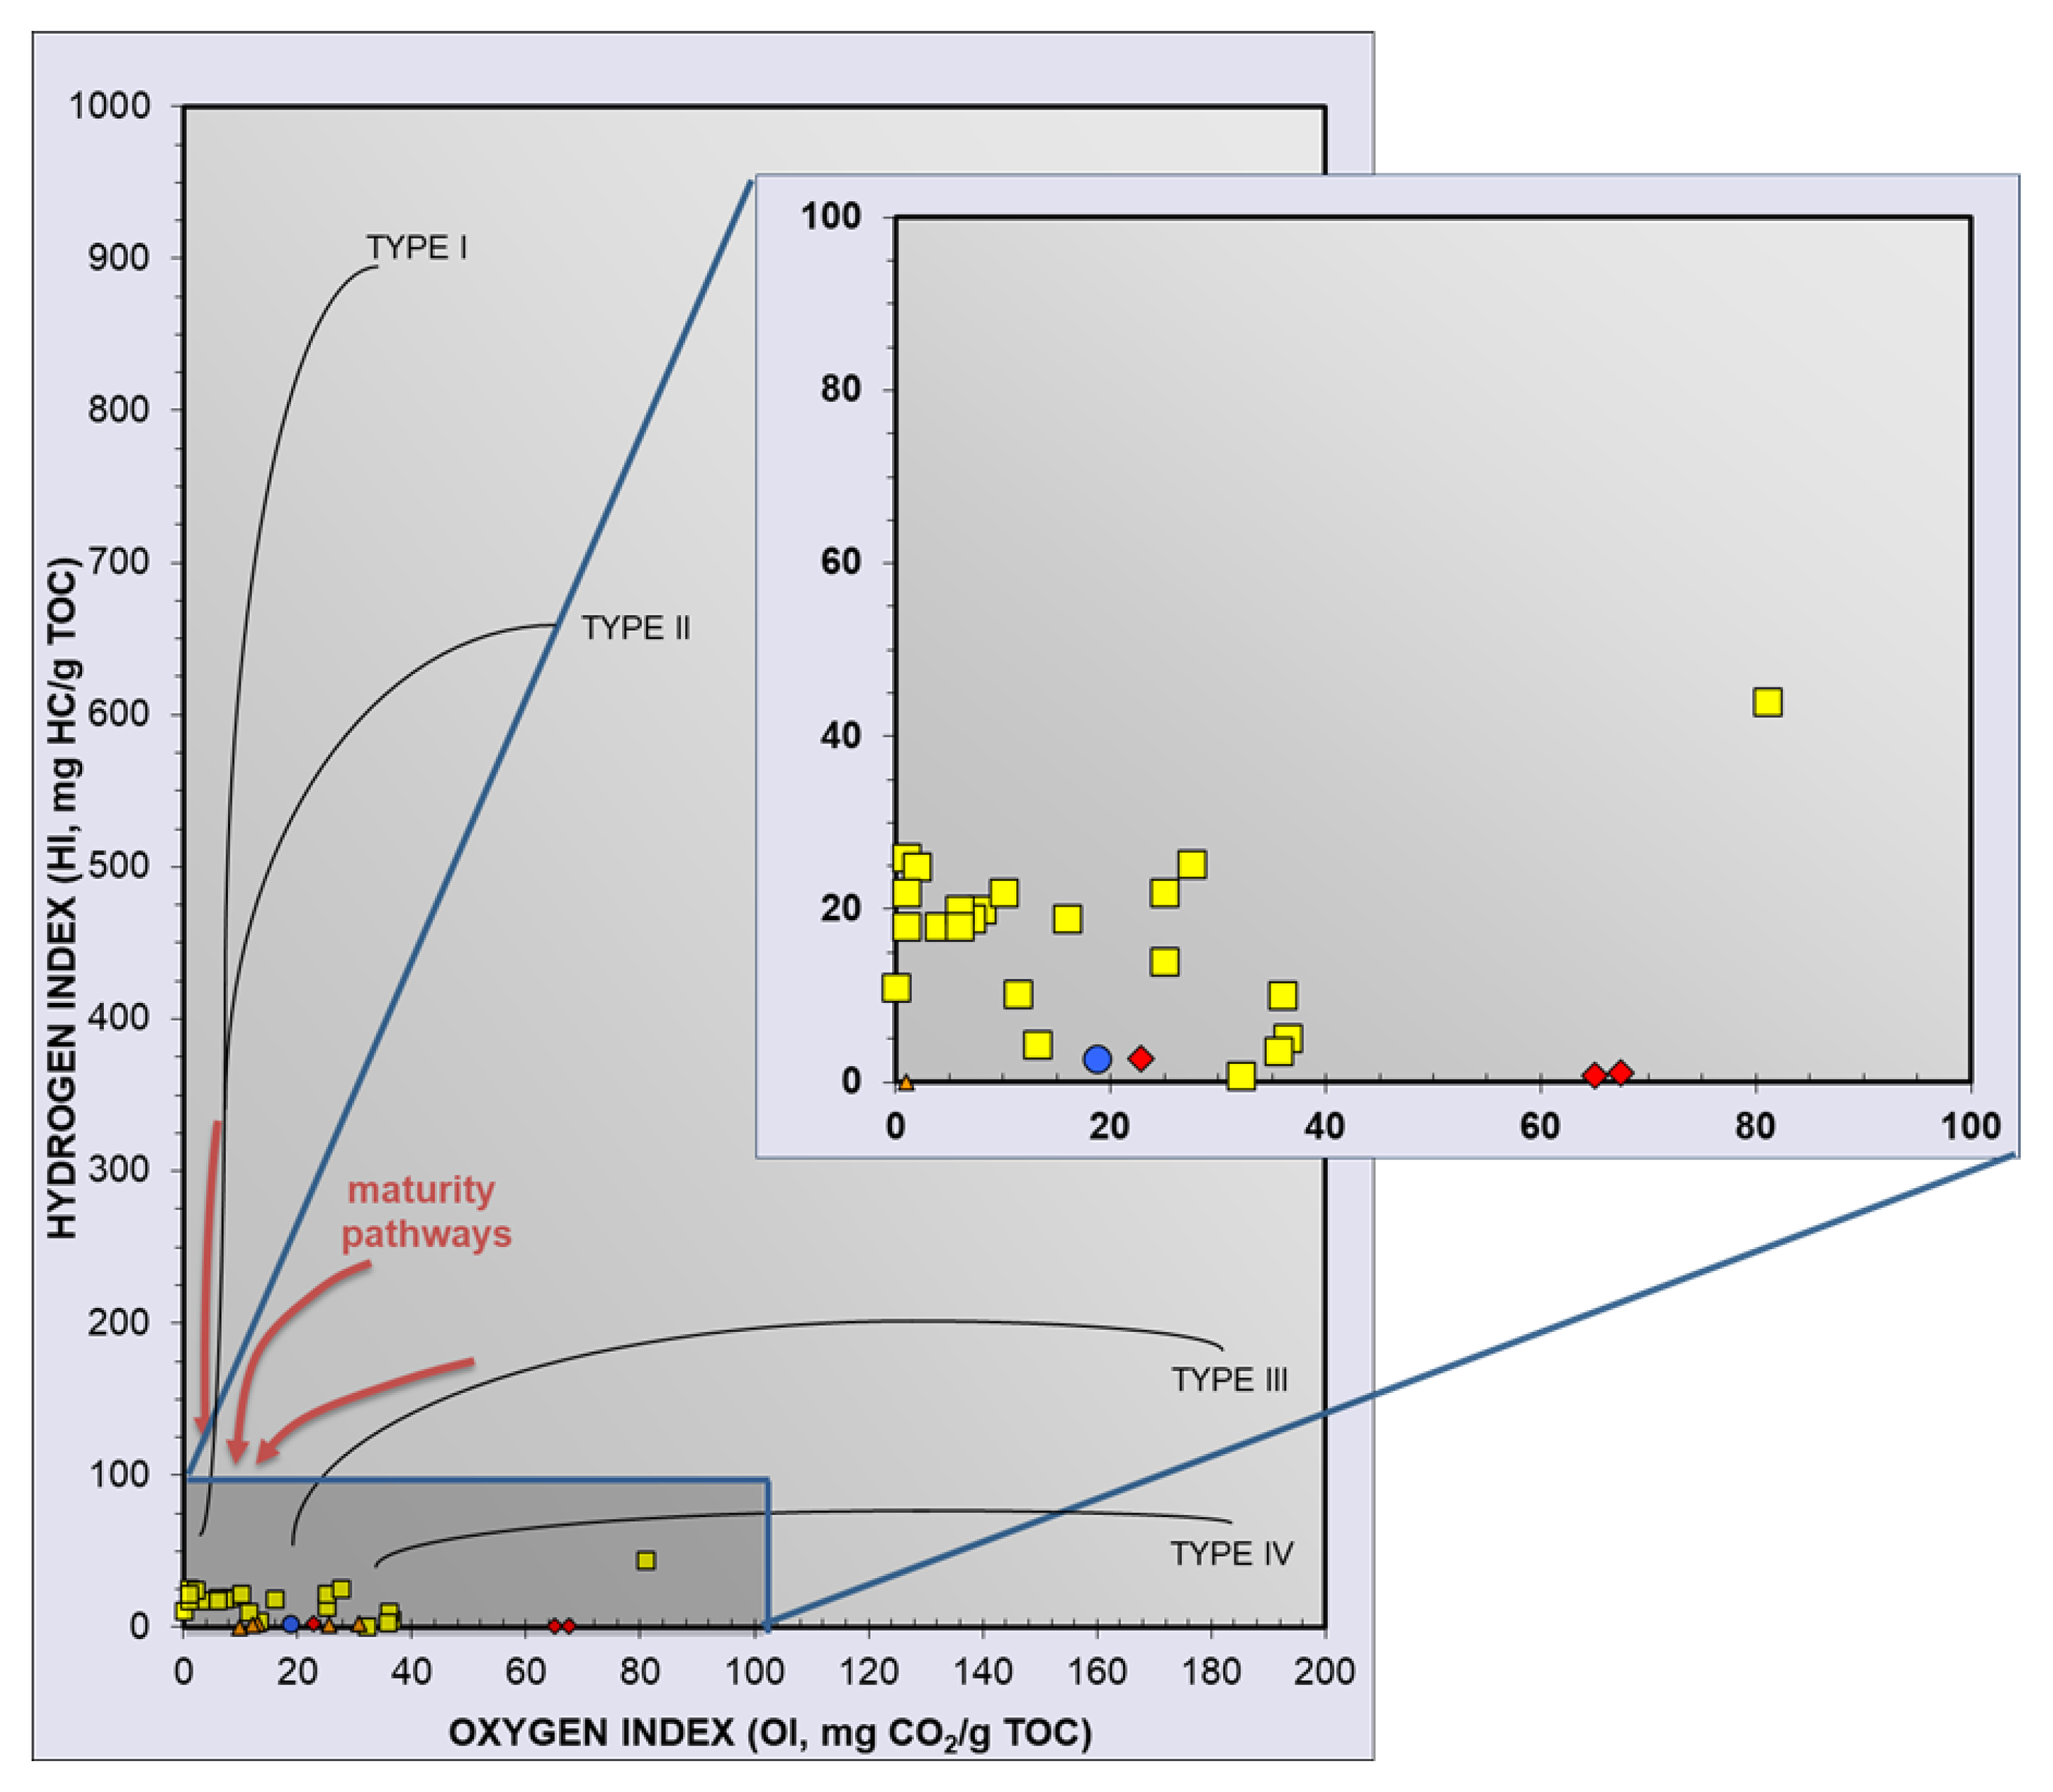
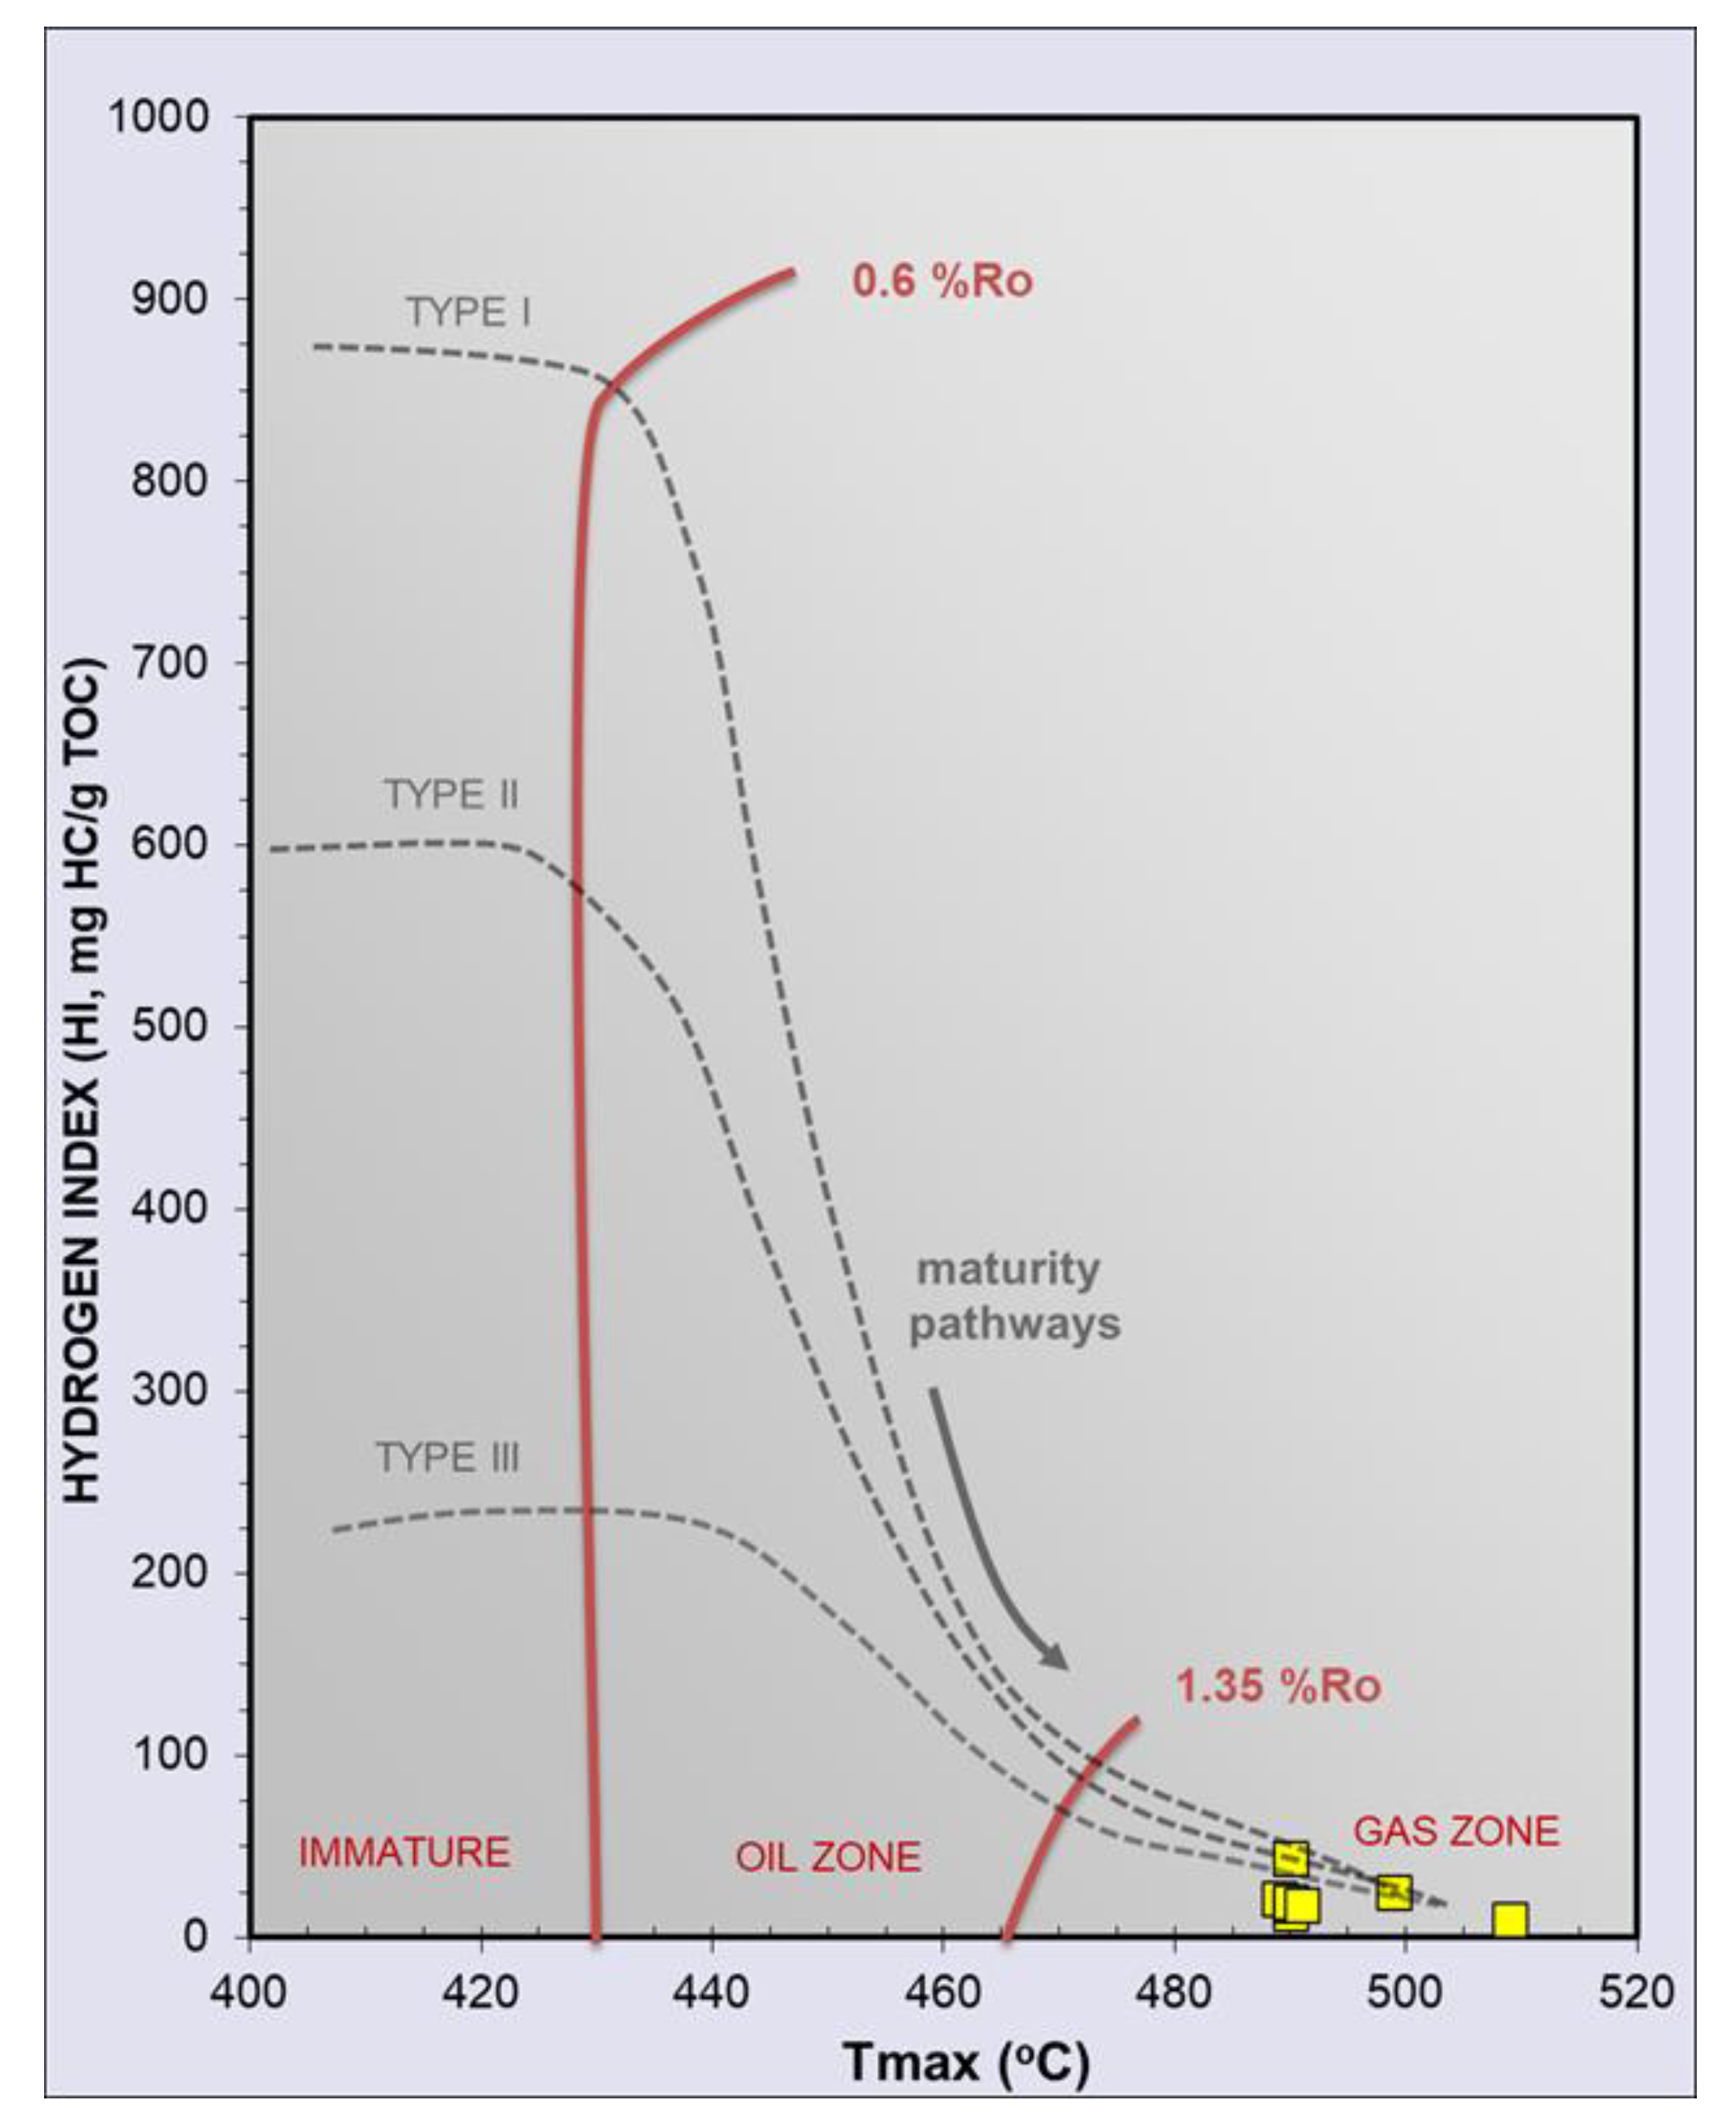
3.2. Rock–Eval Pyrolysis Parameters

All examined samples of the SPZ formation, presented in Table 1, show a very high degree of similarity in terms of chemical composition and kerogen type as well as its degree of thermal maturity. The hydrocarbon potential of the examined samples, based on the hydrogen index (HI), are very low in a narrow range of values between 0.36 and 44 mg HC/g TOC. The thermal maturity parameter as maximum temperature at S2 peak (Tmax) is characterized by a very wide range of values between 312 and 610 °C. The average Tmax value around 490 °C and the generation potential expressed as S2 parameter falls in the range between 0.01 and 0.23 mg HC/g rock (Figure 4, Figure 5 and Figure 6).

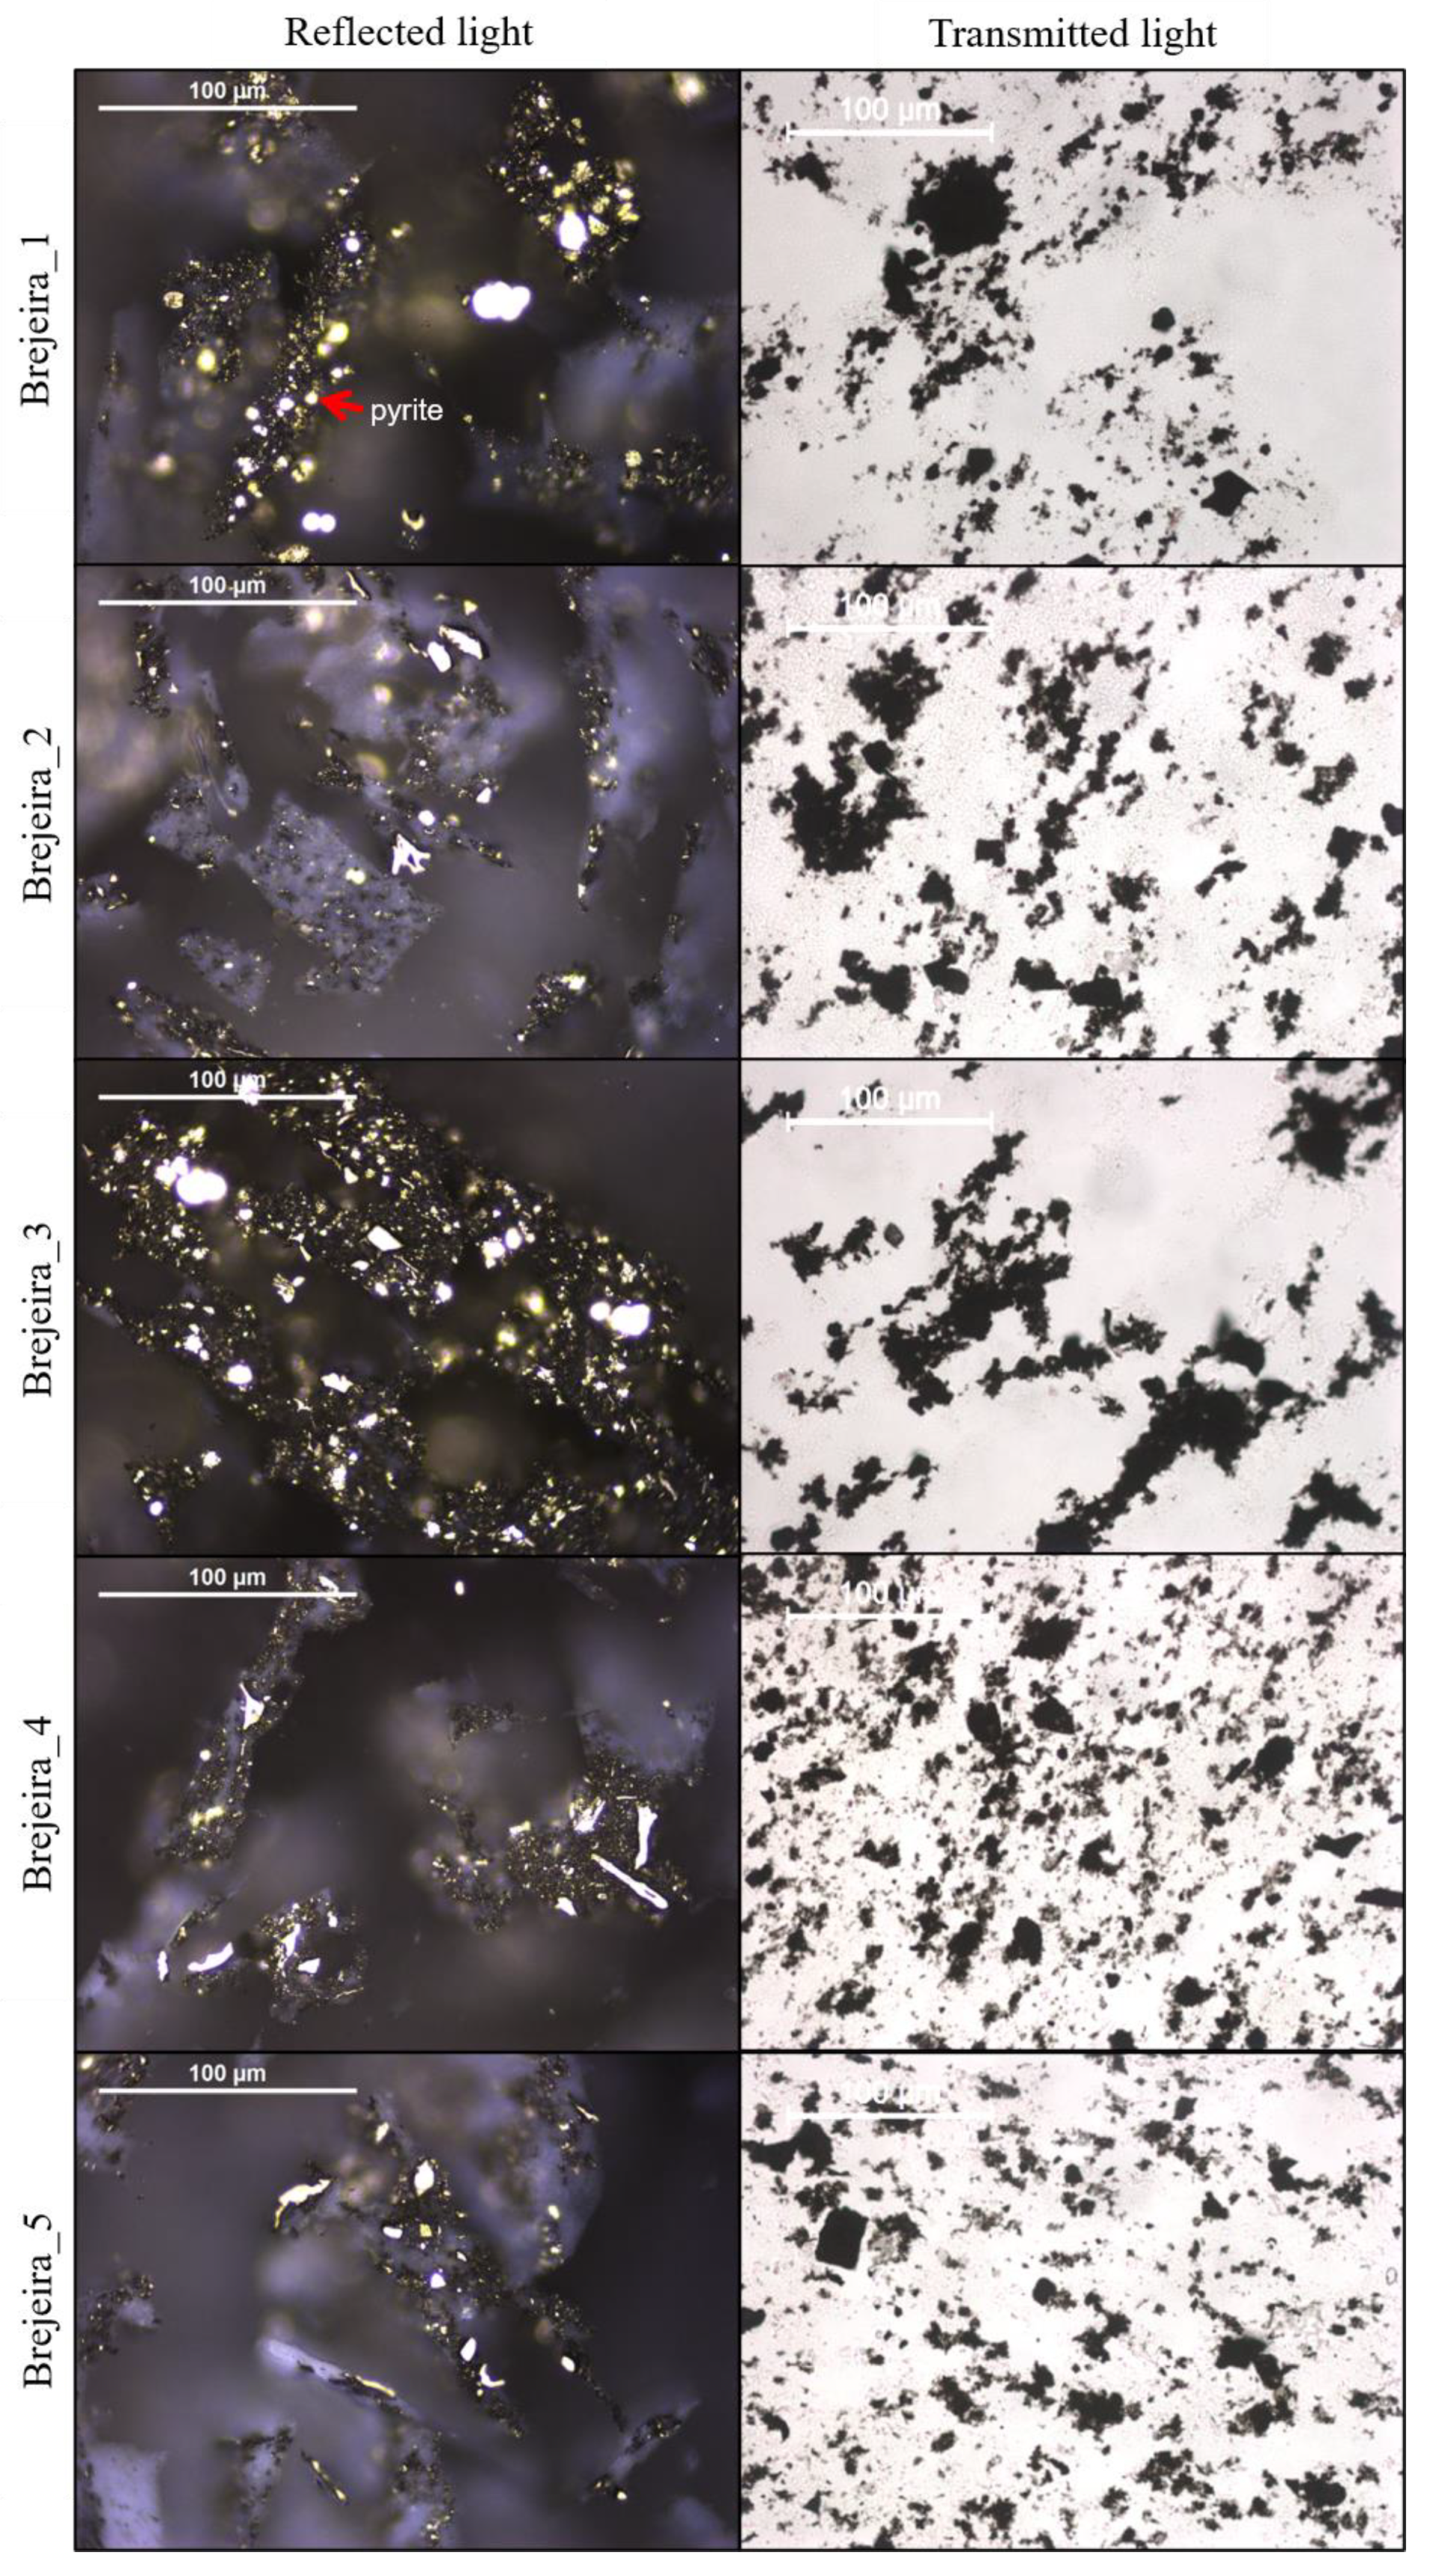
3.3. Organic Petrographic Analysis

All samples have small amounts of organic matter suitable for reflectance measurements. Therefore, the number of measurements was limited. Non-fluorescent granular amorphous organic matter (amorphinite) appears to be the dominant organic matter type in these samples (Table 2). There are also small particles difficult to identify; they could be solid bitumen, inertinite, or vitrinite. They were classified as pyrobitumen. There is abundant pyrite (Figure 7). The mean Ro value for pyrobitumen (%) ranges between 1.63% and 2.29%, corroborating with the high maturity level found for the studied samples as indicated by Rock–Eval parameters. The equation proposed by Schoenherr et al. [20] translates the values above into vitrinite reflectance equivalent to 1.78%, 2.12%, 2.38%, 2.11%, and 2.42% for five analyzed samples (Table 3). Brownish black pollen and spores were found in just one sample. In transmitted light, structureless organic matter is almost black with brown tint remaining, suggesting a thermal alteration index (TAI) 3.7 for all samples (Table 2). These reflectance values, TAI, and absence of fluorescence all suggest that the organic matter is post-mature (overmature; Table 2).

4. Discussion

4.1. Organic Carbon Loss

The mature source rock is usually characterized by lower TOC values than its immature equivalent, before burial and petroleum generation [21,22]. Therefore, some of its original TOC preserved in the sediments during the diagenesis was converted to oil and/or gas at the subsurface along catagenesis and metagenesis [21]. Although the gas is preserved in the subsurface, inside the source rock, it is expected a lower TOC value compared to the initial one, since the amount converted to hydrocarbon cannot be measured as organic carbon anymore. For this reason, if the rock is mature, it will have a general lower TOC value. The reduction in TOC can be explained by the conversion of convertible carbon present in the kerogen (original or remaining potential) to extractable organic matter carbon (free hydrocarbons) associated with the expulsion of gaseous and liquid hydrocarbons from the source rock with increasing maturation [23]. During this process of petroleum generation and expulsion, some authors consider a maximum carbon loss around 70–80% in relation to initial TOC [23,24,25]. Under overmature conditions, the kerogen is basically composed of a carbon-rich residue (relatively high carbon and low hydrogen) so there is no more potential to generate oil [26,27,28].
However, if the thermal maturity is high, there is always some TOC that remains as inertinite or pyrobitumen. Consequently, to compare the TOC from mature/overmature and immature formations, it is essential to make assumptions about organic carbon spent and then recalculate them all to the “initial TOC” values.
Therefore, all measured values at BAFG were recalculated to estimate the original ones, considering the hypothesis of 50–60% loss of the initial TOC (the loss of carbon during petroleum generation and expulsion [28,29]).
The recalculated original organic carbon for the samples presented here (Table 1) vary between 0.65 wt.% and 4.59 wt.%, having a mean of 2.02 wt.%, 2.28 wt.%, and 1.80 wt.% for the Mértola, the Mira, and the Brejeira formations, respectively. Therefore, these rocks can be classified in terms of source rock organic richness as “Good/Very Good”. Weathering seems not to be a key factor in the low observed TOC.

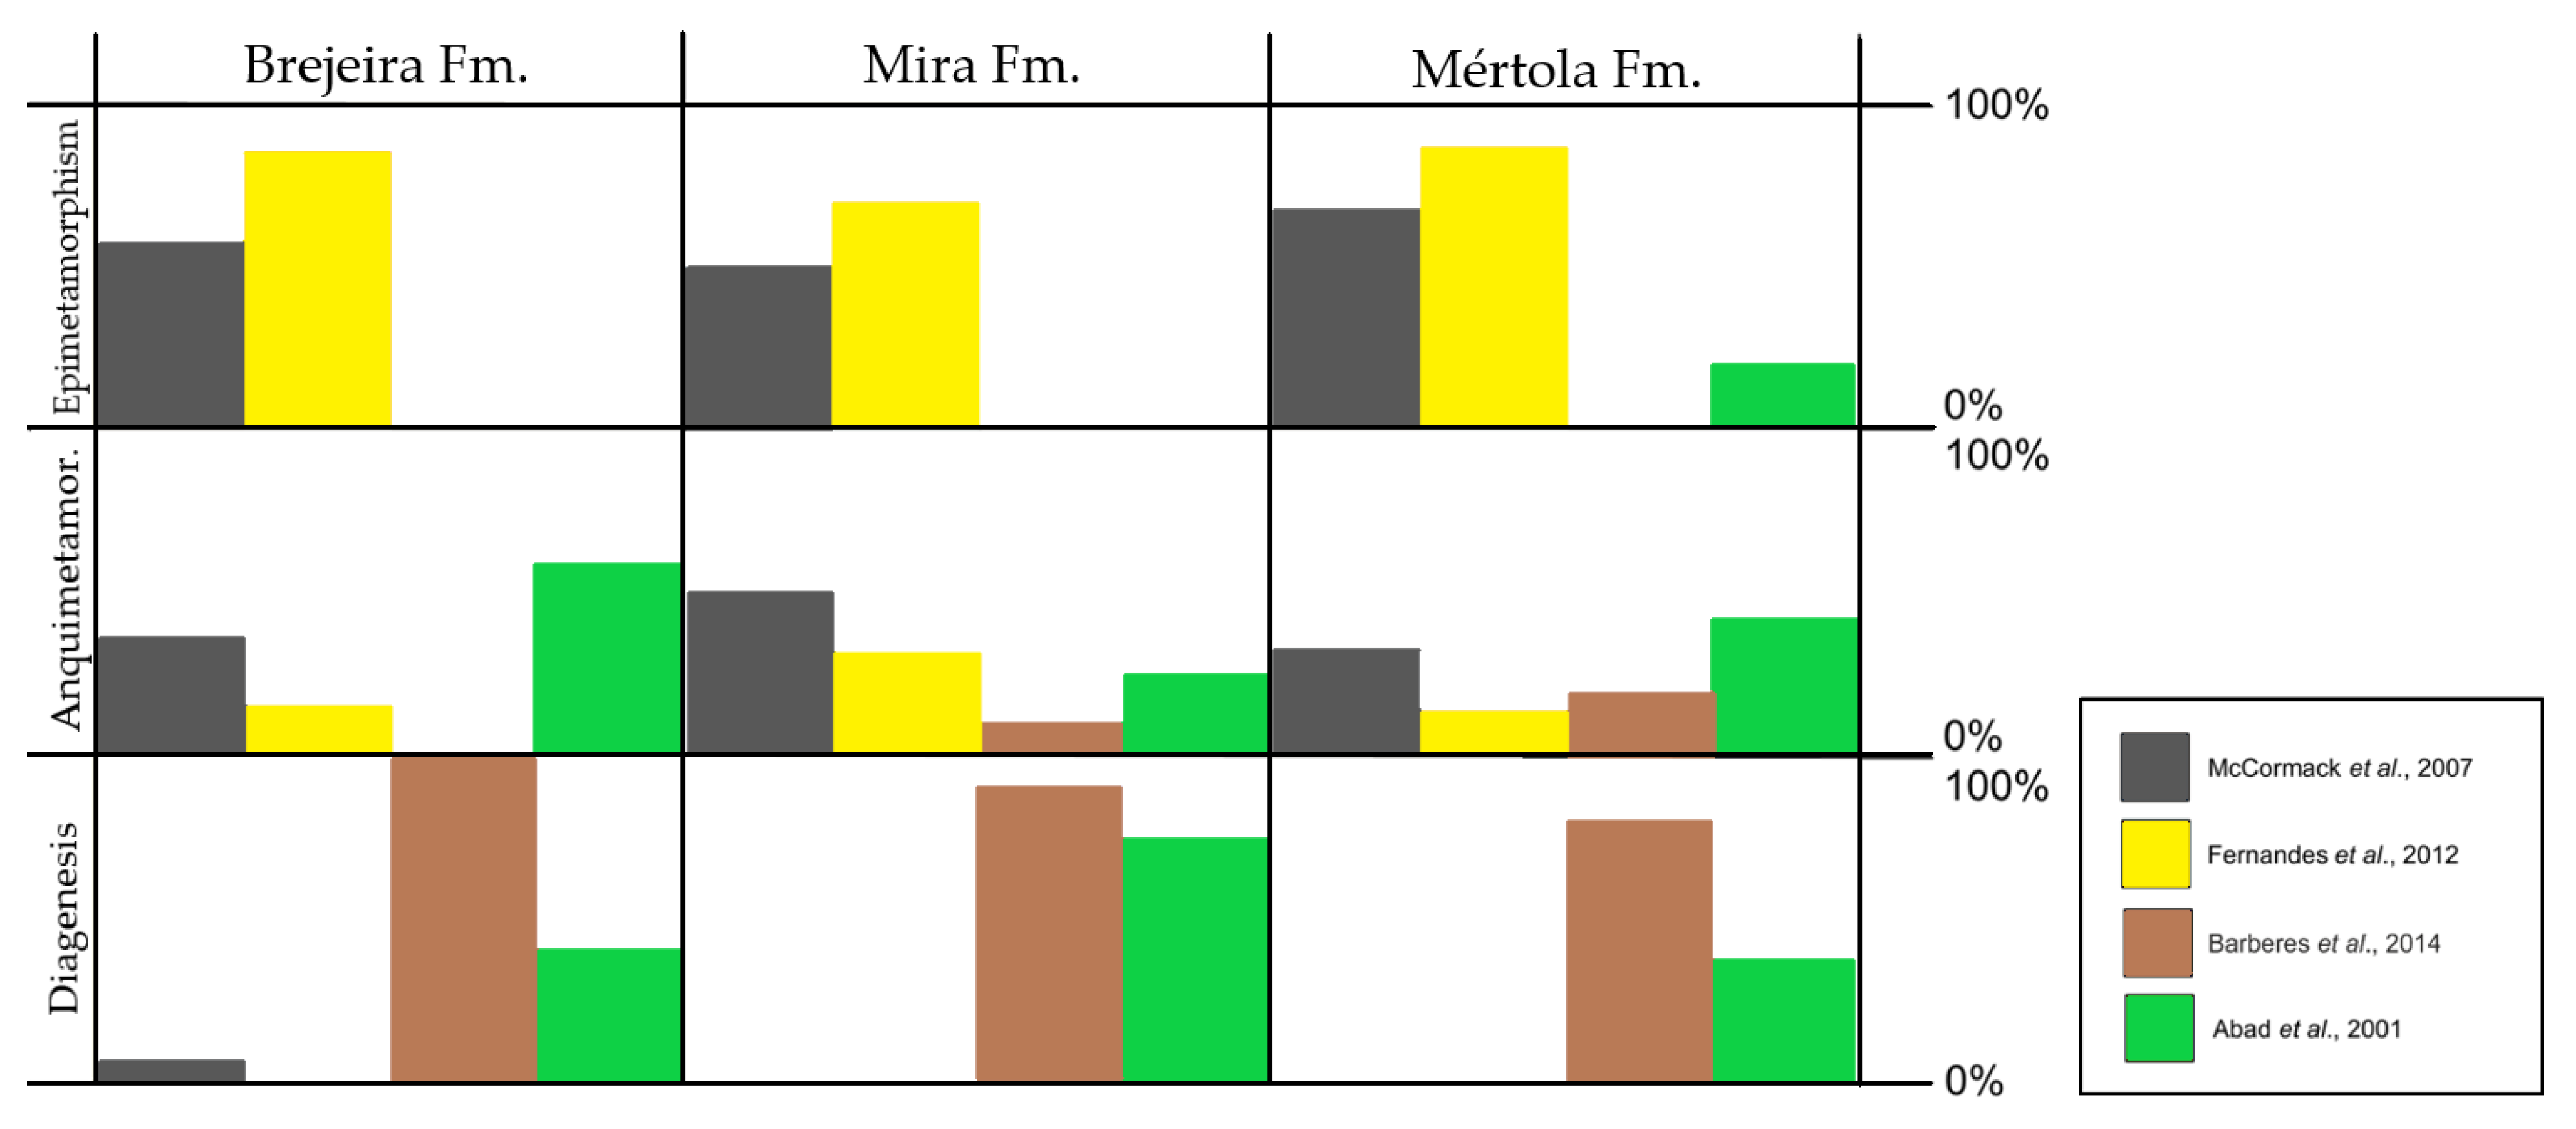
4.2. Thermal Maturation and Low-Grade Metamorphic Zones

It is important to highlight that the very low values of S2 are below the detection limit of the equipment and can affect Tmax measurements [19]. This can explain partially the wide range obtained for the studied samples (312 to 610 °C). The most trustable results range from 489 to 509 °C (Figure 6). The major contribution of TOC is dead residual carbon (average 98%), which together with very low hydrogen potential and higher Tmax values around 490 °C suggests that the examined samples point to high thermal maturity compatible with gas window (overmature zone). The samples are predominated by gas-prone (Table 2) extremely hydrogen-depleted-type III/IV kerogen, which no longer has the potential to generate and expel liquid hydrocarbons (Figure 5 and Figure 6).
The petrographic analyses results position the thermal evolution of these samples (Table 3) into the end of catagenesis to metagenesis (wet to dry gas zone), with values predominantly higher than 2 %Ro (dry gas zone [21]).
According to Fernandes et al. [10], the thermal organic maturation of southwestern Portugal’s Upper Paleozoic rocks (SPZ) is too high, corresponding to the coal rank of high meta-anthracite. This study detected areas with no increase in the VR values until 1 km of depth, which is not compatible with the natural heat transfer. Therefore, it was interpreted by the authors as a result of syn- to post-orogenic heating.
Analyses of the VR made by McCormack et al. [9] suggest that the Paleozoic rocks of the SPZ (SW of Portugal) are strongly overmature with an average VR of 4.28%. The results from thin levels of Carboniferous coal are very similar to the ones from the associated mudrocks. This means that the results from the regional mudrocks are not significantly influenced by the presence of reworked vitrinite. According to the authors, this is a very important fact, as the existence of reworked vitrinite could lead to an over-estimation of the vitrinite values, as the increase in tectonic stress during the coal formation could change its negative biaxial anisotrophy to positive, in case of high tectonic stress [30,31]. Same authors argue that any potential source rock, preserved in the Upper Paleozoic sequence, is now overmature and any potentially generated hydrocarbons would have been lost during the Hercynian deformation or the post-Hercynian uplift and erosion.
Based on the relation suggested by Fertl [32], Barberes et al. [33] projected the organic thermal maturation from gamma radiation data for the SPZ. The result was an apparent inversed relationship between Th/K ratio and VR, allowing an estimation of maturation degree.
Kisch [34] proposed a comparison scale between VR values, low-grade metamorphic zones (diagenesis, anquimetamorphism, and epimetamorphism), coal rank, and the different windows of hydrocarbon generation. The limits established by Abad et al. [8] for the SPZ and for each of the low-grade metamorphic zones were inserted on Kisch’s table, in order to compare the bibliographic organic maturation data (from [9,10]), the illite’s crystallinity (from [8]) and the maturation values estimated by Barberes et al. [33] (Figure 8). Based on this table comparing the distribution, in percentage, of the bibliographic available data for the different formations and for each metamorphic zone, it has been possible to distinguish two different scenarios: (1) according to the Fernandes et al. [10] and McCormack et al. [9], the studied formations are mainly overmature in terms of hydrocarbon potential; (2) according to Abad et al. [8] and the values estimated by Barberes et al. [33], the BAFG formations are mainly between wet and dry gas and the beginning of the overmature zone.
It is important to mention that Branco and Pimentel [35] analyzed 32 samples at BAFG, being 26 from the Mira Fm. and six from the base of the Brejeira Fm., to determine their maturation thermal degree (illite crystallinity) and the organic geochemical parameters (Rock–Eval pyrolysis), being posteriorly compared with previously existing data. The authors’ data indicated all samples from Brejeira Fm. in diagenesis zone and most part of Mira Fm. in anquimetamorphism zone. These data are not presented in Figure 8 because the authors did not analyze any samples in Mértola Fm.
Different methodologies produce slightly different data and maturation appraisals. Despite the possible methodological differences that may have caused the variations in the results of maturation from the different authors, one conclusion can be stated: although a significant amount of organic matter has been consumed in the generation of hydrocarbons, there is no more potential for generation at the analyzed samples. However, the fact that the rocks are not working as a source anymore does not indicate that they cannot work as a reservoir (after all, it is an unconventional system), for trapping the thermogenic hydrocarbons that are known to exist in this area [36,37].

4.3. Hydrocarbon Fluids

Barberes et al. (2018) [36] detected some gasoline hydrocarbons (mainly toluene) in the soil/water system of Mira and Brejeira formations, linked to the presence of 2-methylpentane in all soil samples. The presented results showed that 93.5% of water samples ranged between 1000 and 6000 μg/L of toluene concentration, with 55% higher than 3000 μg/L. These values are much higher than those usually found in other places, being only comparable with values from severe industrial contamination. According to the authors, natural occurrence of a subsurface petroleum system is probably the responsible for this hydrocarbon release [36].
According to a recent study [37] about molar and isotopic compositions of the surface seeps of light hydrocarbons (C1–C5) from the Mira and Brejeira formations, there is a confirmation of the presence of an unconventional petroleum system, with possible interbedded levels of source rocks with different maturation degrees (leading to a mixture of thermogenic gases). From a geological prospection point of view, the presence of hydrocarbons in the SPZ formations (BAFG units) is clear and evident. These fluids are present in soil and water in significantly high levels, especially in the fault/fracture zones, with light hydrocarbon values reaching more than 1500 mg/L in soil samples (Figure 9).

5. Conclusions

In this paper, the unconventional petroleum system of the South Portuguese Zone (SPZ) was evaluated, considering new total organic carbon, Rock–Eval pyrolysis, and organic petrography data, from 53 outcrop samples distributed among the Mértola, Mira, and Brejeira formations (SW Iberia).
The integrated analysis of all these geochemical data corroborated that the potential for petroleum generation has already been exhausted for the Mértola, Mira, and Brejeira formations. The thermal maturity parameters (Tmax and %Ro) indicated overmature stage of petroleum generation (dry gas zone). This information agrees with the most recent bibliography from the same area.
However, once the system’s generation capacity has been reached, its functionality is mostly dedicated to trapping the thermogenic fluids (mainly light and gasoline hydrocarbons) produced by the same rocks (after all, it is an unconventional system), and they were already detected in this area. Therefore, the Baixo Alentejo Flysch Group from SPZ represents a senile unconventional petroleum system.
For a more in-depth assessment of this system’s generation and storage capacity, a large investment would be needed to drill wells.

Author Contributions

Conceptualization, G.A.B., R.P.d.R., N.L.P., P.E.F. and M.C.A.; methodology, G.A.B., R.P.d.R., N.L.P. and P.E.F.; validation, A.L.D.S. and P.K.; resources, G.A.B., R.P.d.R., N.L.P. and P.K.; writing—original draft preparation, G.A.B. and A.L.D.S.; writing—review and editing, R.P.d.R., N.L.P., P.E.F., P.K., M.C.A. and M.T.B.; supervision, R.P.d.R., N.L.P., A.L.D.S., P.E.F. and M.T.B.; All authors have read and agreed to the published version of the manuscript.

Funding

This study was financed by CNPq (Brazil), Equinor (Norway–Brazil), and FCT (Portugal).

Data Availability Statement

Not Applicable.

Acknowledgments

The authors would like to thank Repsol E&P (Spain), Partex Oil&Gas (Portugal), Polish Geological Institute (Poland), and Weatherford Laboratories (USA) for all analytical support. Special thanks to reviewers for the valuable contributions. Special thanks to Delano Ibanez and Giuliana Gigliotti for the important contribution.

Conflicts of Interest

The authors declare no conflict of interest.

References

  1. Boyer, C.; Clark, B.; Jochen, V.; Lewis, R.; Miller, C.K. Shale Gas: A Global Resource. OilField Rev. 2011, 23, 28–39. [Google Scholar]
  2. Law, B.E.; Curtis, J.B. Introduction to Unconventional Petroleum Systems. Am. Assoc. Pet. Geol. Bull. 2002, 86, 1851–1852. [Google Scholar] [CrossRef]
  3. Holditch, S.; Perry, K.; Lee, J. Unconventional Gas Reservoirs: Tight Gas, Coal Seams, and Shales; Technical report for the NPC Global Oil and Gas Study: Washington, DC, USA, July 2007; p. 14. [Google Scholar]
  4. Ground Water Protection Council and All Consulting. Modern Shale Gas Development in the United States: A Primer. Washington, DC, US Department of Energy Office and Fossil Energy and National Energy Technology Laboratory. 2009. Available online: https://www.energy.gov/fe/downloads/modern-shale-gas-development-united-states-primer (accessed on 25 June 2020).
  5. Carvalho, D.; Correia, H.; Inverno, C. Contribuição para o conhecimento geológico do Grupo de Ferreira-Ficalho. Suas relações com a Faixa Piritosa e o Grupo do Pulo do Lobo. Mem. Not. Coimbra 1976, 82, 145–169. (In Portuguese) [Google Scholar]
  6. Fonseca, P.E.; Pimentel, N.; Pena dos Reis, R.; Barberes, G.A. Carboniferous Black-Sahles and Shale-Gas Potential in Southwestern Portugal. Post-Conference Field-trip. In Proceedings of the AAPG—Europe Region Annual Conference & Exhibition, Lisbon, Portugal, 20–21 May 2015. [Google Scholar]
  7. Oliveira, J.T. The marine Carboniferous of South Portugal: A stratigraphic and sedimentological approach. In The Carboniferous of Portugal; Lemos de Sousa, M.J., Oliveira, J.T., Eds.; Mem. Serv. Geol.: Lisbon, Portugal, 1983; Volume 29, pp. 3–37. [Google Scholar]
  8. Abad, I.; Mata, M.P.; Nieto, F.; Velilla, N. The Phyllosilicates in diagenetic-metamorphic rocks of the South Portuguese Zone, southwestern Portugal. Can. Mineral. 2001, 39, 1571–1589. [Google Scholar] [CrossRef] [Green Version]
  9. McCormack, N.; Clayton, G.; Fernandes, P. The thermal history of the Upper Palaeozoic rocks of southern Portugal. Mar. Pet. Geol. 2007, 24, 145–150. [Google Scholar] [CrossRef]
  10. Fernandes, P.; Musgrave, J.A.; Clayton, G.; Pereira, Z.; Oliveira, J.T.; Goodhue, R.; Rodrigues, B. New evidence concerning the thermal history of Devonian and Carboniferous rocks in the South Portuguese Zone. J. Geol. Soc. Lond. 2012, 169, 647–654. [Google Scholar] [CrossRef] [Green Version]
  11. Fonseca, P.; Ribeiro, A. Tectonics of Beja-Acebuches Ophiolite: A major suture in the Iberian Variscan Foldbelt. Geol. Rundsch. Springer 1993, 82, 440–447. [Google Scholar] [CrossRef]
  12. Simancas, J.F. Zona Sudportuguesa. In Geología de España; Vera, J.A., Ed.; SGE-IGME: Madrid, Spain, 2004; pp. 201–204. (In Spanish) [Google Scholar]
  13. Behar, F.; Beaumont, V.; Penteado, H.L.B. Rock-Eval 6 technology: Performances and developments. Oil Gas Sci. Technol. Rev. de l’Institut Français du Pétrole 2001, 56, 111–134. [Google Scholar] [CrossRef]
  14. Peters, K.E.; Cassa, M.R. Applied Source Rock Geochemistry. In The Petroleum System-from Source to Trap; Magoon, L.B., Dow, W.G., Eds.; AAPG Memoir: Tulsa, OK, USA, 1994; pp. 93–120. [Google Scholar] [CrossRef]
  15. ASTM International. ASTM D2797/D2797M-11a: Standard Practice for Preparing Coal Samples for Microscopical Analysis by Reflected Light; ASTM International: West Conshohocken, PA, USA, 2015. [Google Scholar] [CrossRef]
  16. ASTM International. ASTM D7708-14: Standard Test Method for Microscopical Determination of the Reflectance of Vitrinite dispersed in Sedimentary Rocks; ASTM International: West Conshohocken, PA, USA, 2015. [Google Scholar] [CrossRef]
  17. Langford, F.F.; Blanc-Valleron, M.M. Interpreting Rock-Eval Pyrolysis Data Using Graphs of Pyrolizable Hydrocarbons vs. Total Organic Carbon. Am. Assoc. Pet. Geol. Bull. 1990, 74, 799–804. [Google Scholar] [CrossRef]
  18. Espitalié, J.; Deroo, G.; Marquis, F. La pyrolyse Rock-Eval et ses applications-deuxième partie. Rev. de l’Institut Français du Pet. 1985, 40, 755–784. (In French) [Google Scholar] [CrossRef]
  19. Espitalié, J. Use of Tmax as a maturation index for different types of organic matter. Comparison with vitrinite reflectance. In Thermal Modelling in Sedimentary Basins; Burrus, J., Ed.; Éditions Technip: Paris, France, 1986; pp. 475–496. [Google Scholar]
  20. Schoenherr, J.; Littke, R.; Urai, J.L.; Kukla, P.A.; Rawahi, Z. Polyphase thermal evolution in the infra-Cambrian Ara Graoup (South Oman Salt Basin) as deduced by maturity of solid reservoir bitumen. Org. Geochem. 2007, 38, 1293–1318. [Google Scholar] [CrossRef]
  21. Tissot, B.P.; Welte, D.H. Petroleum Formation and Occurrence; Springer Science + Business Media: Berlin, Germany, 1984. [Google Scholar]
  22. Gonçalves, F.T.T.; Araújo, C.V.; Penteado, H.L.B.; Hamsi, G.P.; Frota, E.S.T.; Soldan, A.L. Séries Naturais: Aplicação no estudo da geração e expulsão do petróleo e no mapeamento de oil-kitchens. Bol. de Geociências da Petrobras 1997, 11, 116–131, (In Portuguese with English abstract). [Google Scholar]
  23. Jarvie, D.M. Total organic carbon (TOC) analysis: Chapter 11: Geochemical Methods and Exploration. In Treatise of Petroleum geology: Handbook of Petroleum Geology, Source and Migration Processes and Evaluation Techniques; Merrill, R.K., Ed.; American Association of Petroleum Geologists: Tulsa, OK, USA, 1991; pp. 113–118. [Google Scholar]
  24. Bordenave, M.L.; Espitalié, J.; LePlat, P.; Oudin, J.L.; Vandenbroucke, M. Screening techniques for source rock evaluation. In Applied Petroleum Geochemistry; Bordenave, M.L., Ed.; Editions Technip: Paris, France, 1993; pp. 217–278. [Google Scholar]
  25. Baskin, D.K. Atomic H/C ratio of kerogen as an Estimate of Thermal Maturity and Organic Matter conversion. Am. Assoc. Pet. Geol. Bull. 1997, 81, 1437–1450. [Google Scholar] [CrossRef]
  26. Lewan, M.D.; Comer, J.B.; Hamilton-Smith, T.; Hausenmuller, N.R.; Guthrie, J.M.; Hatch, J.R.; Gautier, D.L.; Frankie, W.T. Feasibility Study on Material-Balance Assessment of Petroleum from the New Albany Shale in the Illinois Basin; Bulletin 2137; U.S. Geological Survey Bulletin: Denver, CO, USA, 1995; pp. 1–40.
  27. Muscio, G.P.A.; Horsfield, B. Neoformation of inert carbon during the natural maturation of a marine source rock; Bakken Shale, Williston Basin. Energy Fuel 1996, 10, 10–18. [Google Scholar] [CrossRef]
  28. Spigolon, A.L.D.; Lewan, M.D.; Penteado, H.L.B.; Coutinho, L.F.C.; Mendonça Filho, J.G. Evaluation of the petroleum composition and quality with increasing thermal maturity as simulated by hydrous pyrolysis: A case study using a Brazilian source rock with Type I kerogen. Org. Geochem. 2015, 83, 27–53. [Google Scholar] [CrossRef]
  29. Verweij, J.M. Developments in Petroleum Science 35. In Hydrocarbon Migration System Analysis; Elsevier: Amsterdam, The Netherlands, 1993. [Google Scholar]
  30. Levine, J.R.; Davis, A. The relationship of coal optical fabrics to the Alleghanian tectonic deformation in the central Appalachian foldand- thrust belt, Pennsylvania. Geol. Soc. Am. Bull. 1989, 101, 1333–1347. [Google Scholar] [CrossRef]
  31. Taylor, G.H.; Teichmuller, M.; Davis, A.; Diessel, C.F.K.; Littke, R.; Robert, P. Organic Petrology; Gebruder Borntraeger: Berlin, Germany, 1998. [Google Scholar]
  32. Fertl, W.H. Gamma ray spectral data assists in complex formation evaluation. Soc. Petrophysicists Well-Log Anal. 1979, 20, 3–37. [Google Scholar]
  33. Barberes, G.A.; Fonseca, P.E.; Pena dos Reis, R.; Pimentel, N.; Azevedo, M. 2014. Preliminary assessment of potential for Shale Gas in South Portuguese Zone carboniferous units. Comun. Geológicas 2014, 101, 737–741, (In Portuguese with English abstract). [Google Scholar]
  34. Kisch, H.J. Correlation between indicators of very low-grade metamorphism. In Low-Temperature Metamorphism; Frey, M., Ed.; Blackie and Son: London, UK, 1987; pp. 227–300. [Google Scholar]
  35. Branco, P.; Pimentel, N. Potential for Shale Gas Plays of the Mira Formation (Carboniferous, Southern Portugal)—Potencial para “Plays” de “Shale Gas” da Formação de Mira (Carbónico, Sul de Portugal). In Proceedings of the IV Congresso Jovens Investigadores em Geociências, LEG, Livro de Actas, Estremoz, Portugal, 11–12 October 2014. [Google Scholar]
  36. Barberes, G.A.; Pena dos Reis, R.; Spigolon, A.L.D.; Fonseca, P.E.; Bandeira de Mello, C.; Barata, M.T. Groundwater Natural Contamination by Toluene in Beja and Faro Districts, Portugal. Geosciences 2018, 8, 9. [Google Scholar] [CrossRef] [Green Version]
  37. Barberes, G.A.; Spigolon, A.L.D.; Reis, R.P.; Permanyer, A.; Barata, M.T. Hydrocarbon seeps from the unconventional petroleum system of the South Portuguese Zone, Portugal. J. Iber. Geol. 2020, 46, 1–19. [Google Scholar] [CrossRef]
Figure 1. The SPZ geological map and stratigraphy, including location of the samples from field trips 1, 2, and 3. All samples from the 3rd field trip were collected in the same outcrop, thus being in the same location. The red square in the subfigure (Iberia map) represents the location of the SPZ.
Minerals 11 00811 g001
Figure 2. Outcrop of Brejeira Formation, highlighting the black shale sequence and high deformation.
Minerals 11 00811 g002
Figure 3. Distribution and average of TOC in the studied samples. For this graph, only samples also analyzed by Rock–Eval were taken in consideration. The blue line represents the average TOC.
Minerals 11 00811 g003
Figure 4. Relationship between petroleum potential and TOC (based on Langford and Blanc-Valleron [17]). Yellow squares representing Brejeira Fm., red diamonds Mira Fm., and blue circle Mértola Fm.
Minerals 11 00811 g004
Figure 5. Van Krevelen-type diagram showing the relationship between the hydrogen index (HI) and oxygen index (OI) of the studied samples. Yellow squares representing Brejeira Fm., red diamonds Mira Fm., and blue circle Mértola Fm.
Minerals 11 00811 g005
Figure 6. Hydrogen index (HI) vs. Tmax (maximum temperature in °C at S2 peak of Rock–Eval pyrolysis) diagram (based on Espitalié et al. [18] and Espitalié [19]). For this graph, samples with Tmax between 489 and 509 °C (see Section 4.2) are projected (all of them from Brejeira Fm.).
Minerals 11 00811 g006
Figure 7. Pyrite and amorphinite under reflected light in the microscope from 5 samples (Brejeira 1, 2, 3, 4, and 5), analyzed by Weatherford Laboratories. Scale Bars: 100 μm.
Minerals 11 00811 g007
Figure 8. Comparative graph of VR values from Fernandes et al. [10], McCormack et al. [9], illite crystallinity [8], and the estimated maturation by Barberes et al. [33]. The data are divided according to the percentage of occurrence samples for each low-grade metamorphic zone in the three formations. This graph was built based on Kisch [34] proposal for comparison between the VR values, the low-grade metamorphic zones (diagenesis, anquimetamorphism, and epimetamorphism); adapted from Barberes et al. [33].
Minerals 11 00811 g008
Figure 9. Map showing the location of sampling points (grey circles) and the anomalies of hydrocarbons (red zone), represented by the most abundant one (methane); adapted from Barberes et al. [37].
Minerals 11 00811 g009
Table 1. Geochemical parameters (TOC and Rock–Eval pyrolysis), from the Mértola, Mira and Brejeira formation. Weatherford selected samples with TOC higher than 0.99 wt.% to pyrolyze. Polish Geological Institute (PGI) analyzed all of them.
LithostratigraphyTOCS1S2S3TmaxHIOIPerformer
wt%mgHC/gRockmgCO2/gRock°CngHC/gTOCmgCO2/gTOC
Brejeira Fm0.660.020.090.174901425PGI
Brejeira Fm1.180.040.220.196101916PGI
Brejeira Fm0.660.030.130.05351208PGI
Brejeira Fm0.980.030.110362110PGI
Brejeira Fm0.770.030.150.05317197PGI
Brejeira Fm0.50.030.110.054892210PGI
Brejeira Fm0.570.020.10.02490184PGI
Brejeira Fm0.470.030.120330261PGI
Brejeira Fm0.520.020.130.01386252PGI
Brejeira Fm0.20.020.090.174904481PGI
Brejeira Fm0.460.020.090.03490206PGI
Brejeira Fm0.560.020.10.03491186PGI
Brejeira Fm0.550.020.10.01335181PGI
Brejeira Fm0.680.030.150.173902225PGI
Brejeira Fm0.680.030.150.01364221PGI
Brejeira Fm0.44------Weatherford
Brejeira Fm0.72------Weatherford
Brejeira Fm0.75------Weatherford
Brejeira Fm0.32------Weatherford
Brejeira Fm0.39------Weatherford
Brejeira Fm0.68------Weatherford
Brejeira Fm0.7------Weatherford
Brejeira Fm0.75------Weatherford
Brejeira Fm0.81------Weatherford
Brejeira Fm0.79------Weatherford
Brejeira Fm0.46------Weatherford
Brejeira Fm0.67------Weatherford
Brejeira Fm0.45------Weatherford
Brejeira Fm0.9------Weatherford
Brejeira Fm0.52------Weatherford
Brejeira Fm0.58------Weatherford
Brejeira Fm0.26------Weatherford
Brejeira Fm0.9890.040.050.363835.0636.40Weatherford
Brejeira Fm0.910.040.230.2549925.2727.47Weatherford
Brejeira Fm1.3610.110.060.184384.4113.26Weatherford
Brejeira Fm0.8890.120.090.3244410.1236.00Weatherford
Brejeira Fm0.8420.060.030.34263.5635.63Weatherford
Brejeira Fm0.8840.060.090.150910.1811.31Weatherford
Brejeira Fm1.3730.040.010.444240.7332.05Weatherford
Mira Fm1.2760.020.010.834240.7865.05Weatherford
Mira Fm0.23------Weatherford
Mira Fm0.79------Weatherford
Mira Fm0.95------Weatherford
Mira Fm0.79------Weatherford
Mira Fm0.52------Weatherford
Mira Fm0.85------Weatherford
Mira Fm0.9930.010.010.673121.0067.47Weatherford
Mira Fm0.9------Weatherford
Mira Fm1.8360.020.050.423572.7222.88Weatherford
Mertola Fm0.66------Weatherford
Mertola Fm1.4960.080.040.283472.6718.72Weatherford
Mertola Fm0.73------Weatherford
Mertola Fm0.78------Weatherford
Note: TOC (total organic carbon); S1 (the amount of free hydrocarbons in the sample); S2 (the amount of hydrocarbons generated through thermal cracking of nonvolatile organic matter); S3 (the amount of CO2 (in milligrams CO2 per gram of rock) produced during pyrolysis of kerogen); Tmax (maximum pyrolysis temperature); HI (hydrogen index); OI (oxygen index).
Table 2. Results of organic petrography from 5 samples (Brejeira 1, 2, 3, 4, and 5), analyzed by Weatherford Laboratories.
SampleLiptinite (%)VitriniteInertiniteSolid
Bitumen
Liptinite
Fluores.
Oil ProneGas PronePollen/
Spores
TAI
Alginite (%)AOM (%)Other (%)(%)
Fluomes.Non Fluores.
Brejeira_10080000200080absent3.7
Brejeira_200750trace15100075absent3.7
Brejeira_300700trace15150070absent3.7
Brejeira_400800trace5150080sporadic3.7
Brejeira_500750010150075absent3.7
Note: AOM (amorphous organic matter); Fluores. (fluorescence); TAI (thermal alteration index).
Table 3. Results of organic matter maturation based on vitrinite reflectance analysis from 5 samples (Brejeira 1, 2, 3, 4, and 5).
SamplesBrejeira_1Brejeira_2Brejeira_3Brejeira_4Brejeira_5
Minimum Ro (%)1.51.51.891.782.07
Maximum Ro (%)1.782.5132.322.59
Number of points1025755
Standard deviation0.0950.2490.380.2160.192
Mean Ro value of pyrobitumen (%)1.631.982.261.972.29
VRE value (%) Schoenherr et al. (2007) [20]1.782.122.382.112.42
Publisher’s Note: MDPI stays neutral with regard to jurisdictional claims in published maps and institutional affiliations.

