
Phosphorus-Rich Ash from Poultry Manure Combustion in a Fluidized Bed Reactor


Abstract
:1. Introduction
2. Materials and Methods
2.1. Poultry Manure
2.2. Starter Bed
2.3. Poultry Manure Combustion Process
2.4. Analysis of Raw and Burnt Poultry Manure
3. Results
3.1. Characteristics of Poultry Manure
3.2. Characteristics of Ashes from the Combustion of Poultry Manure in Laboratory Fluidized Bed Furnace
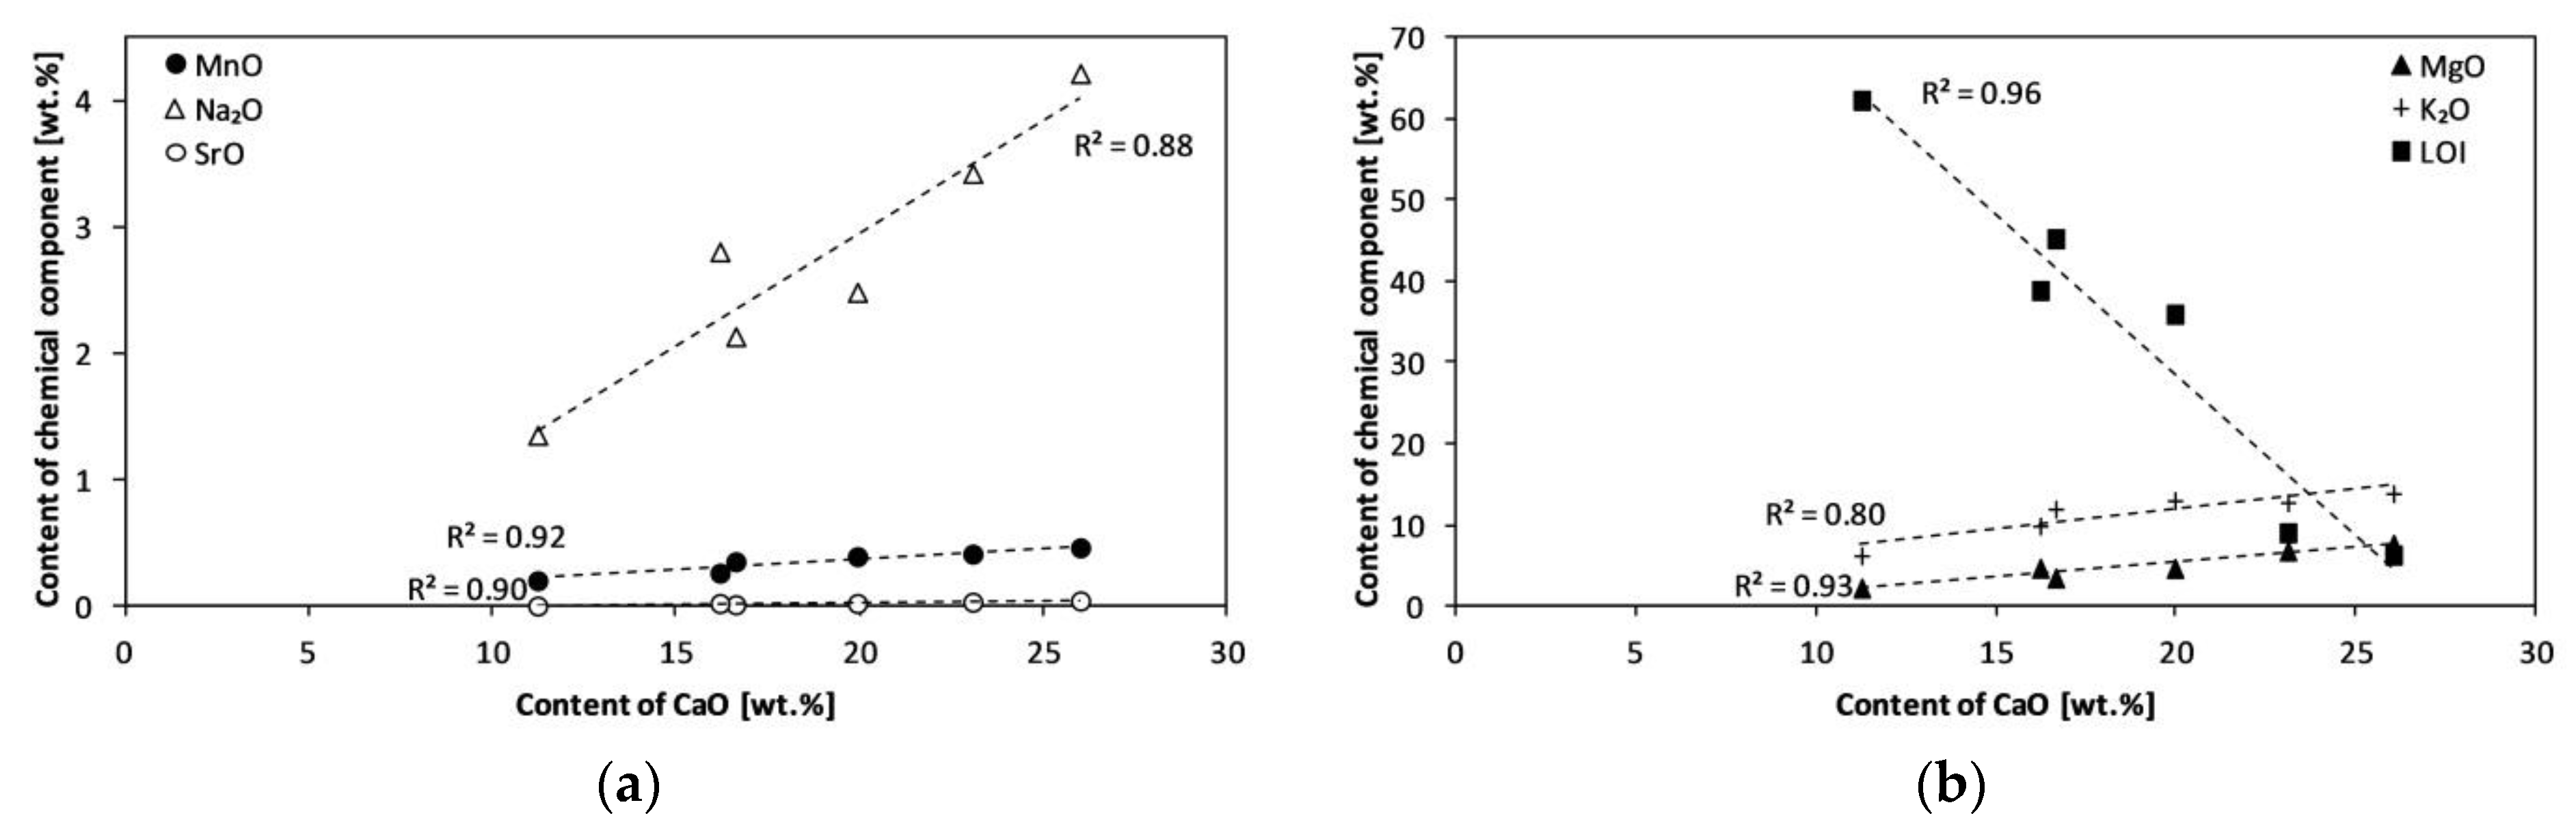
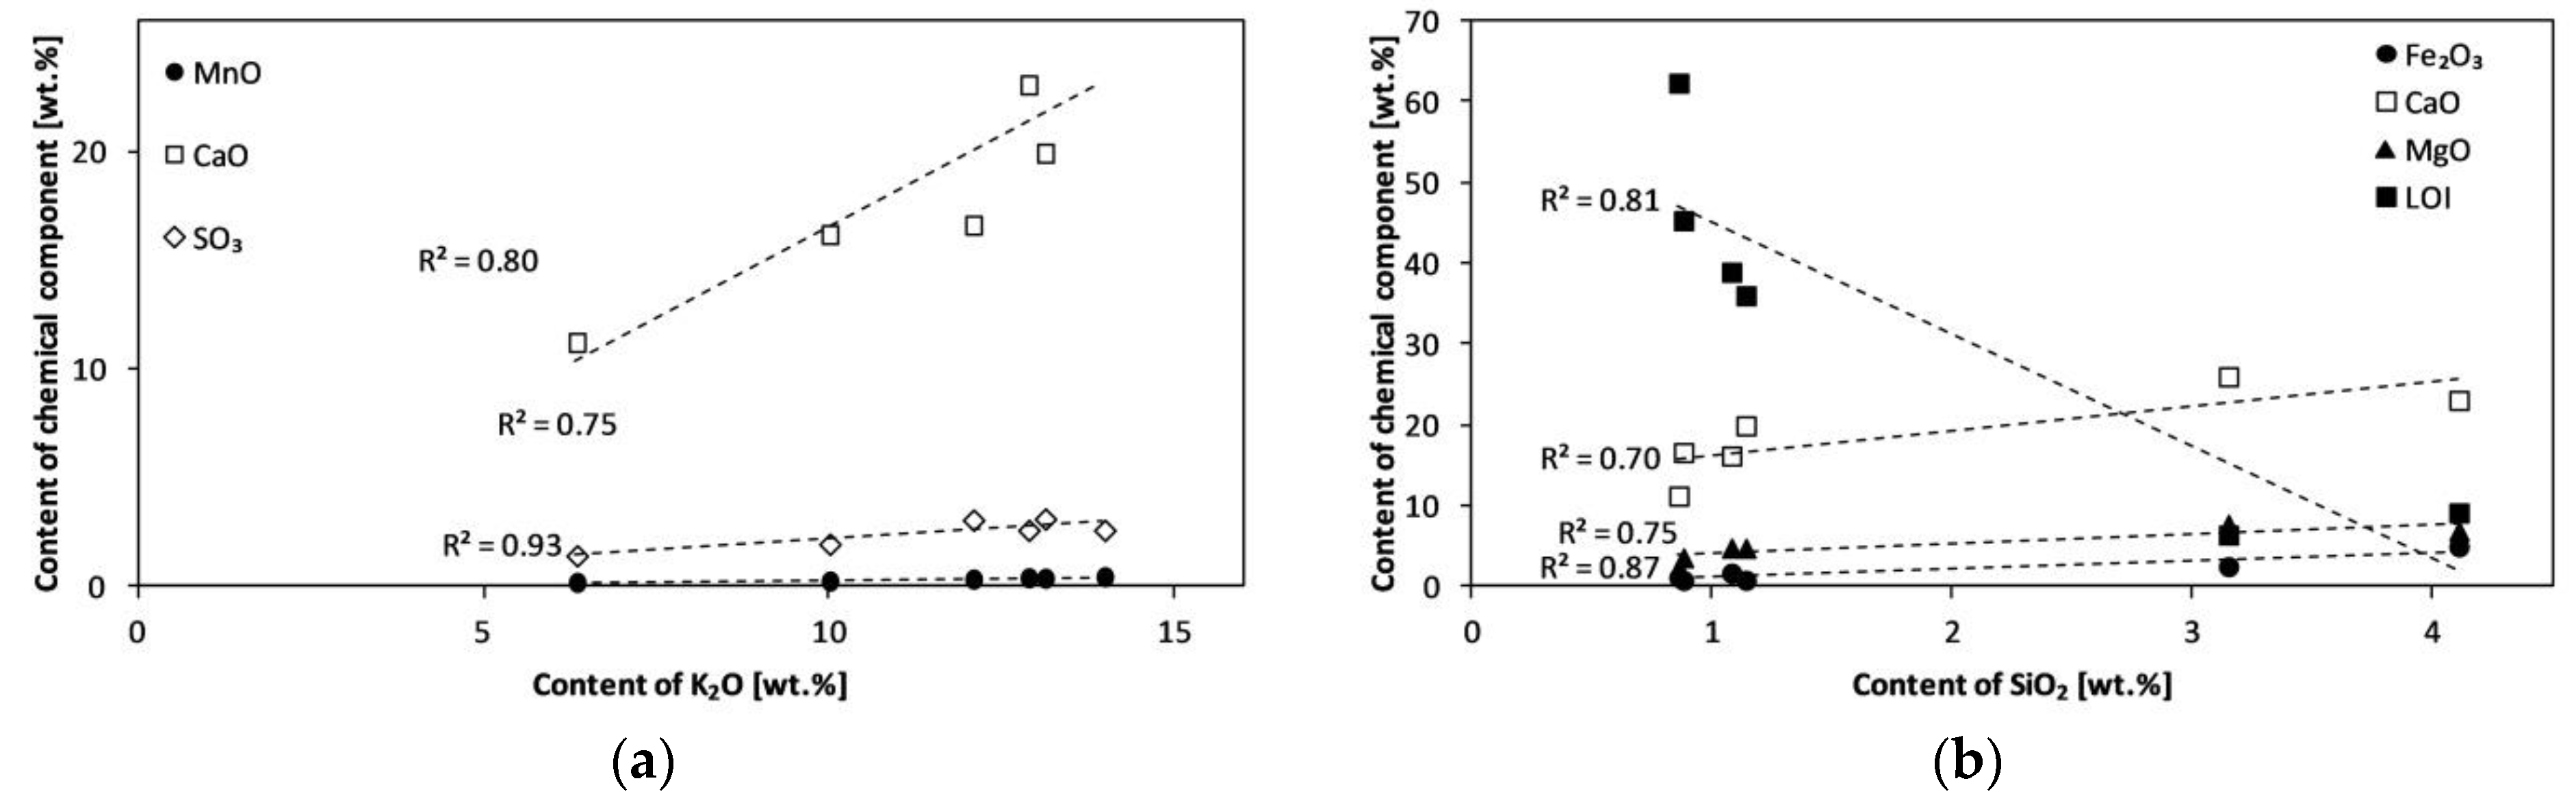
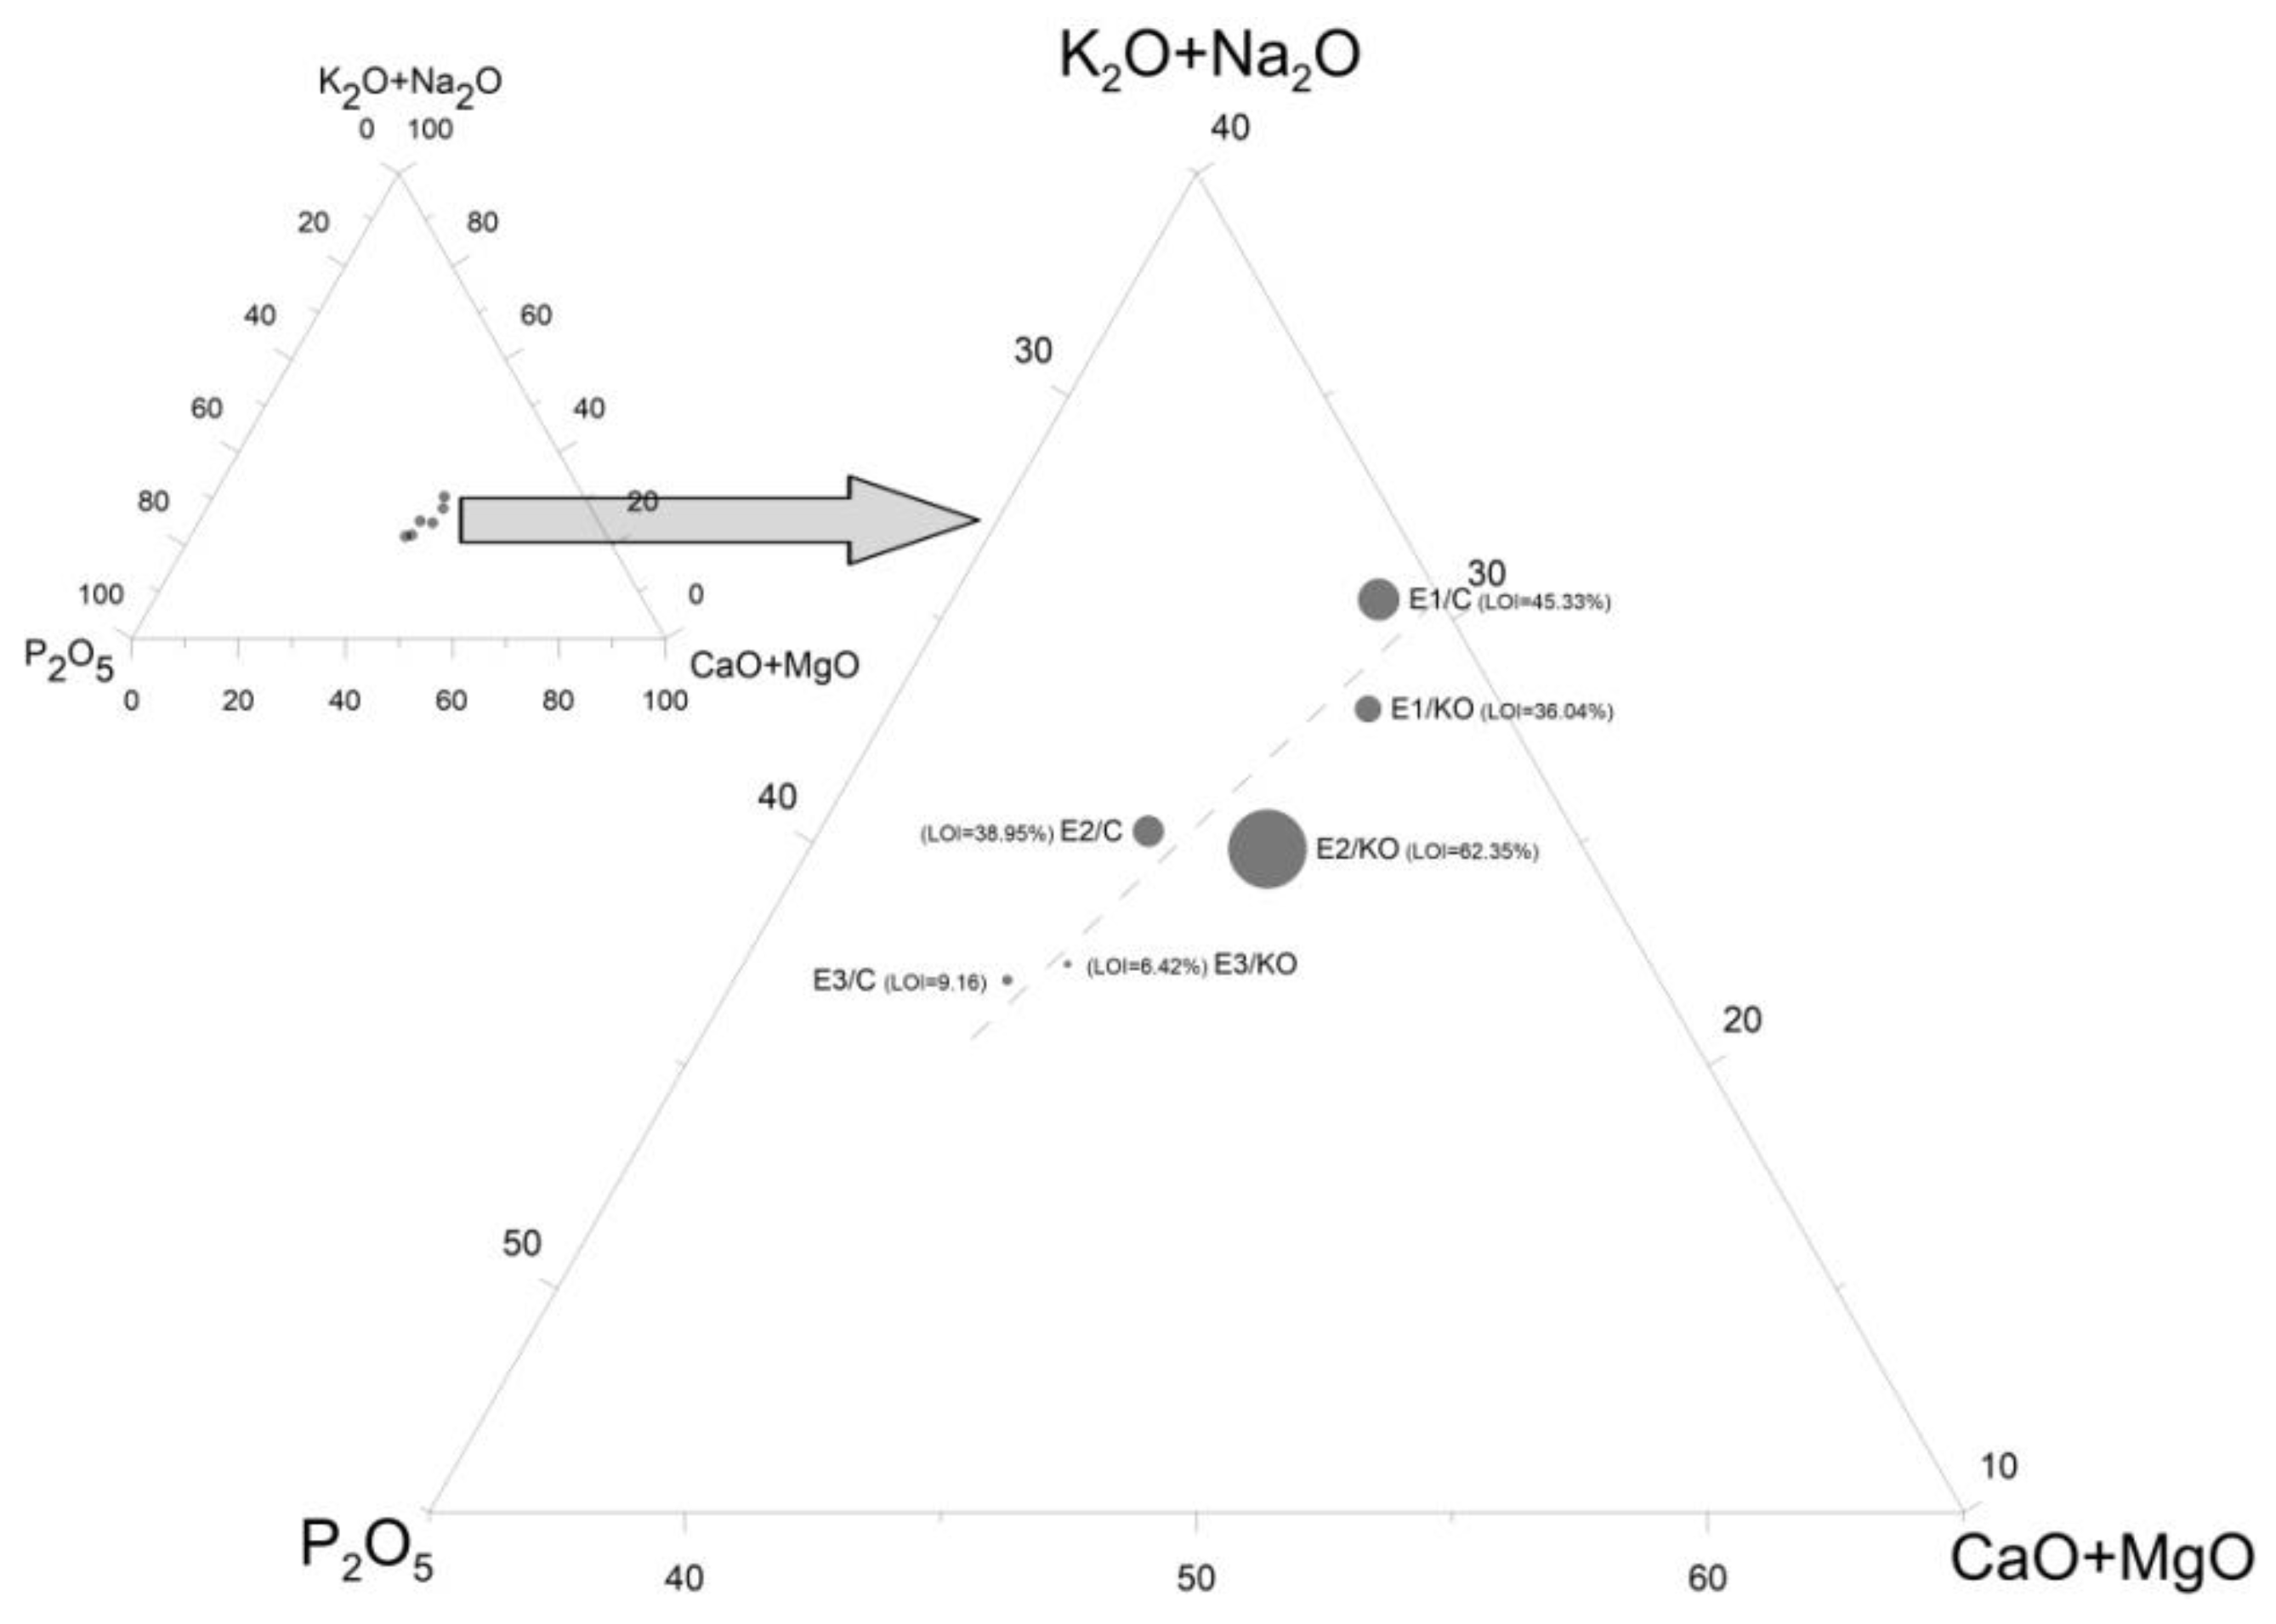
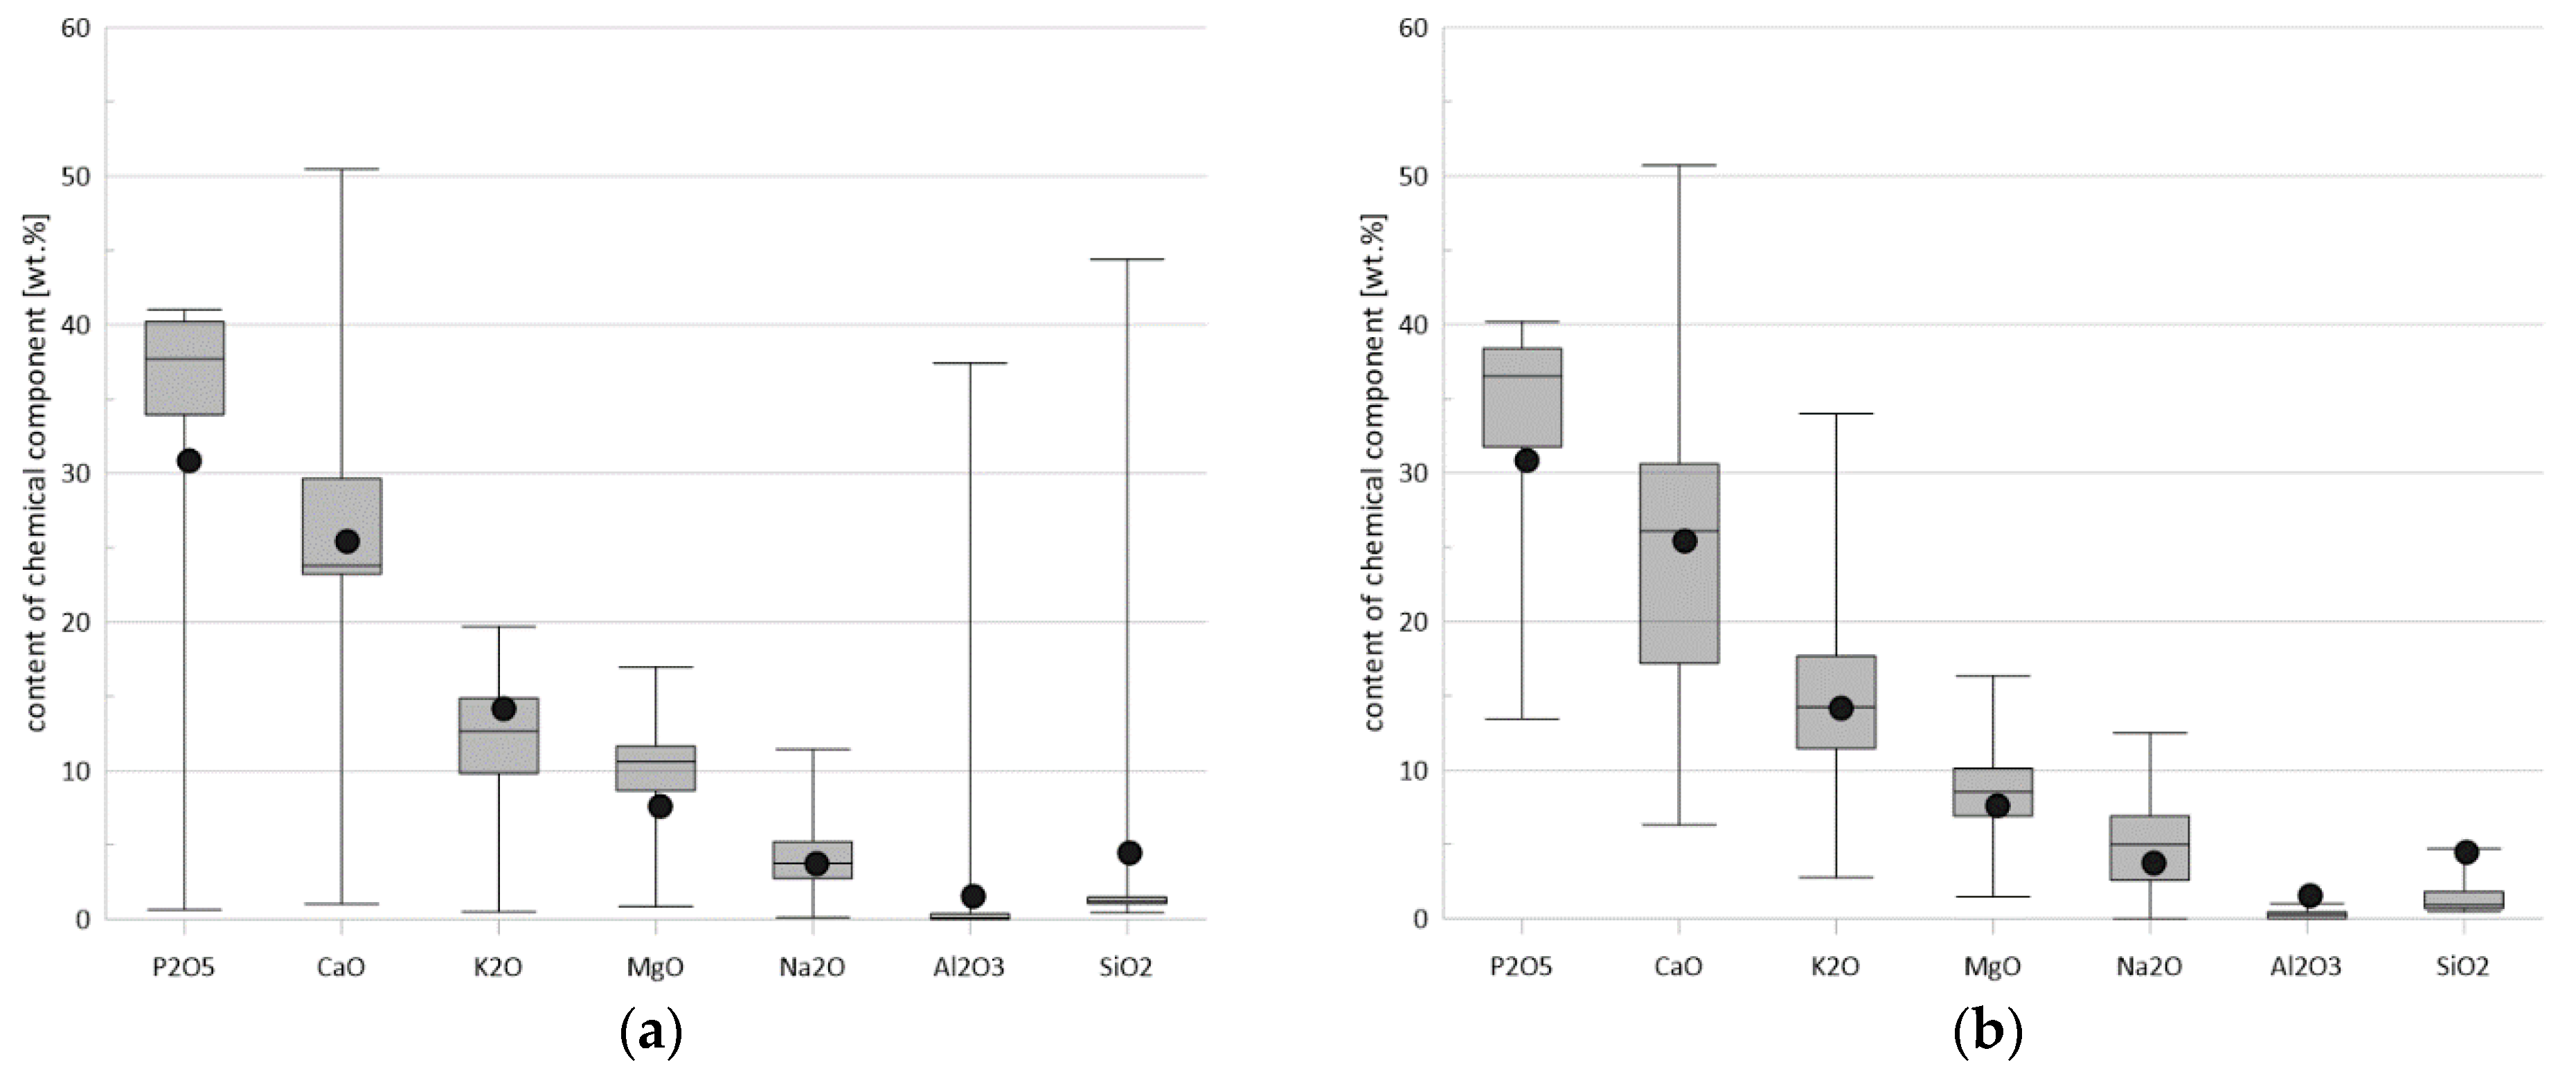
3.2.1. Chemical Composition of Ash and Grain Morphology
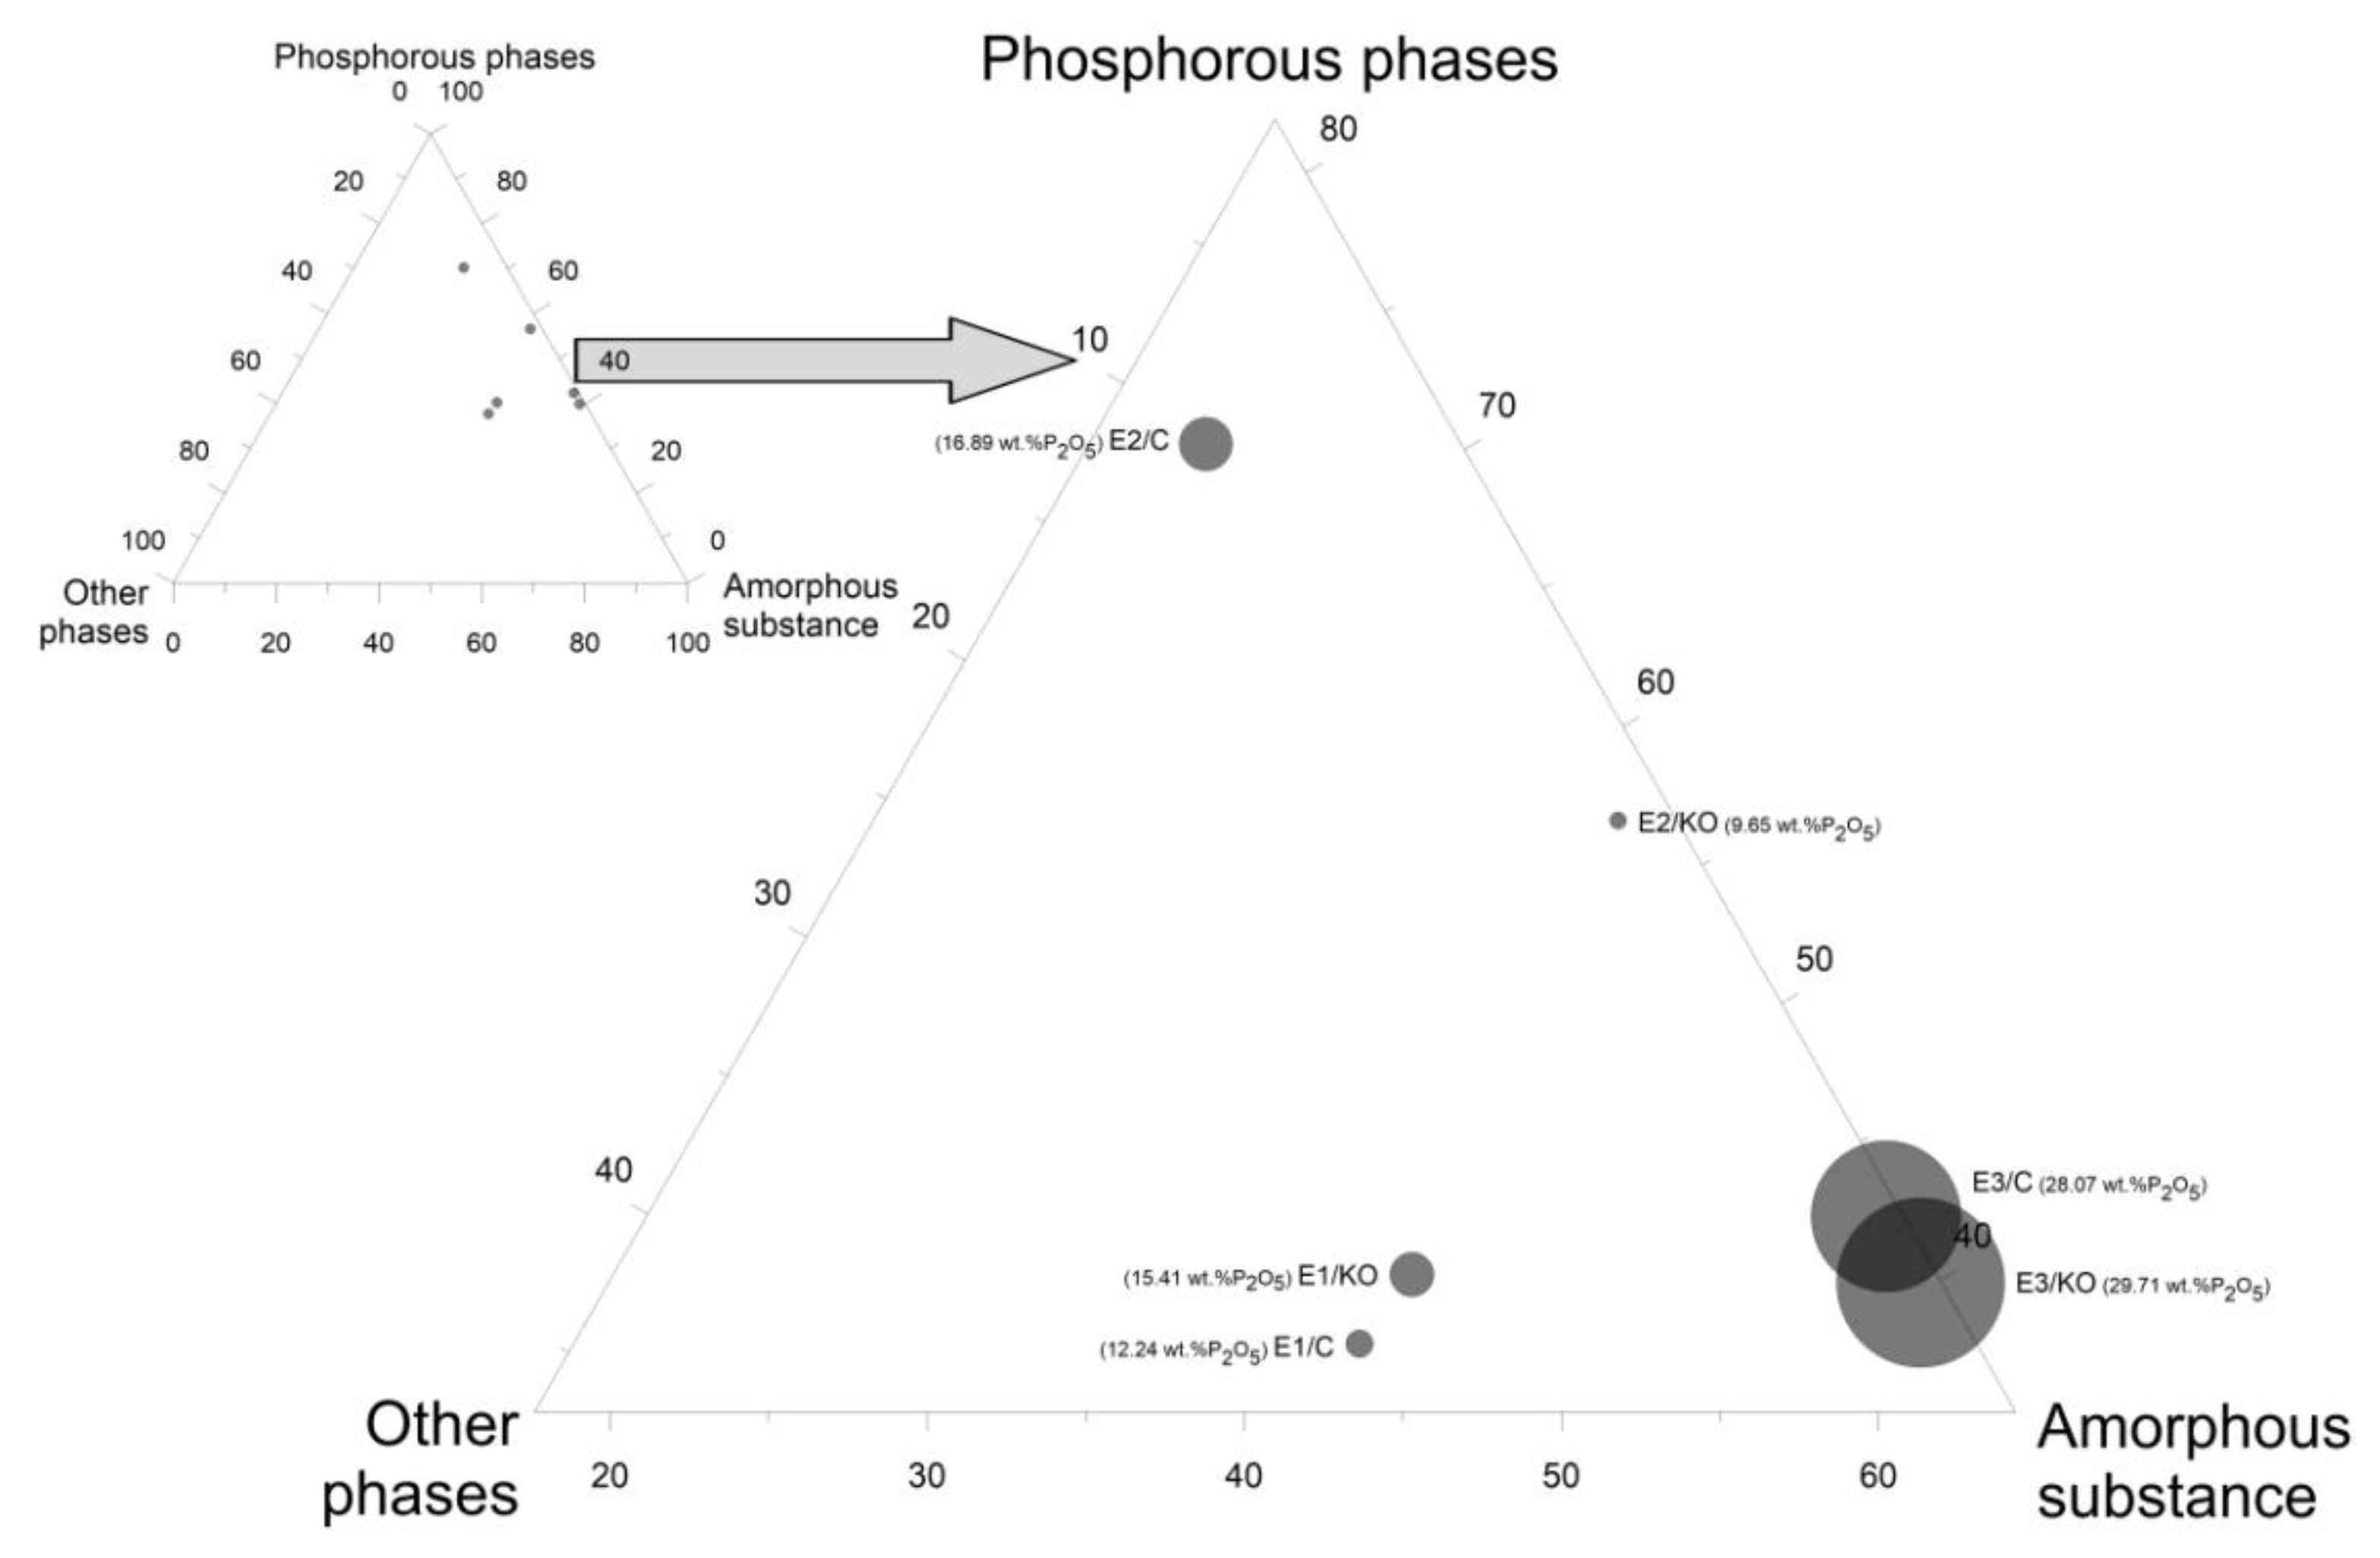
3.2.2. Phase Composition of Ash
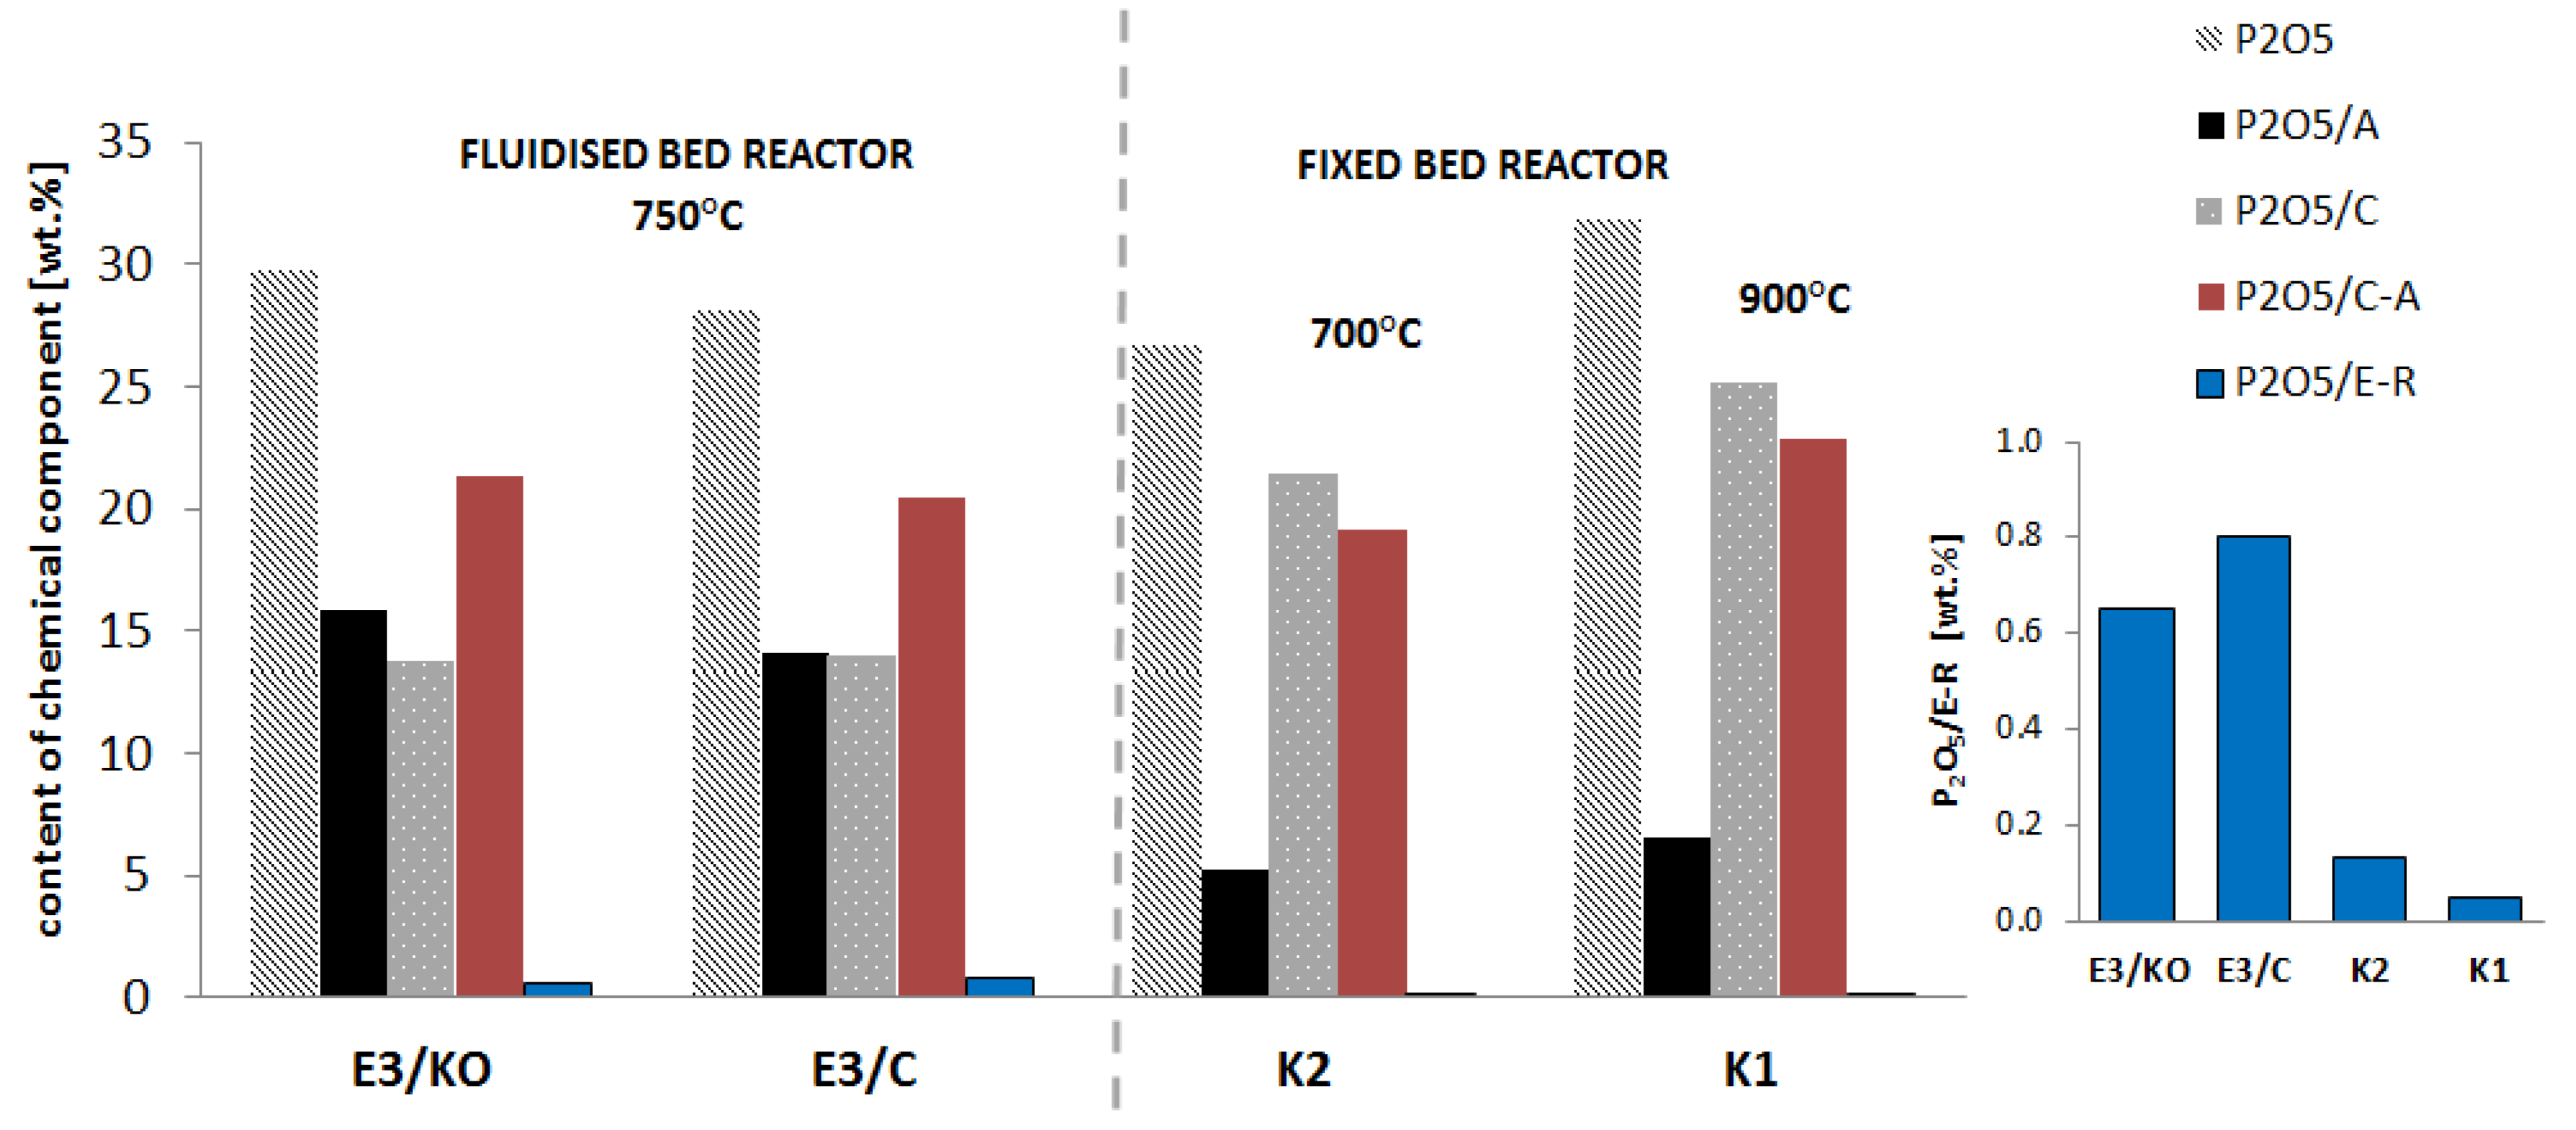
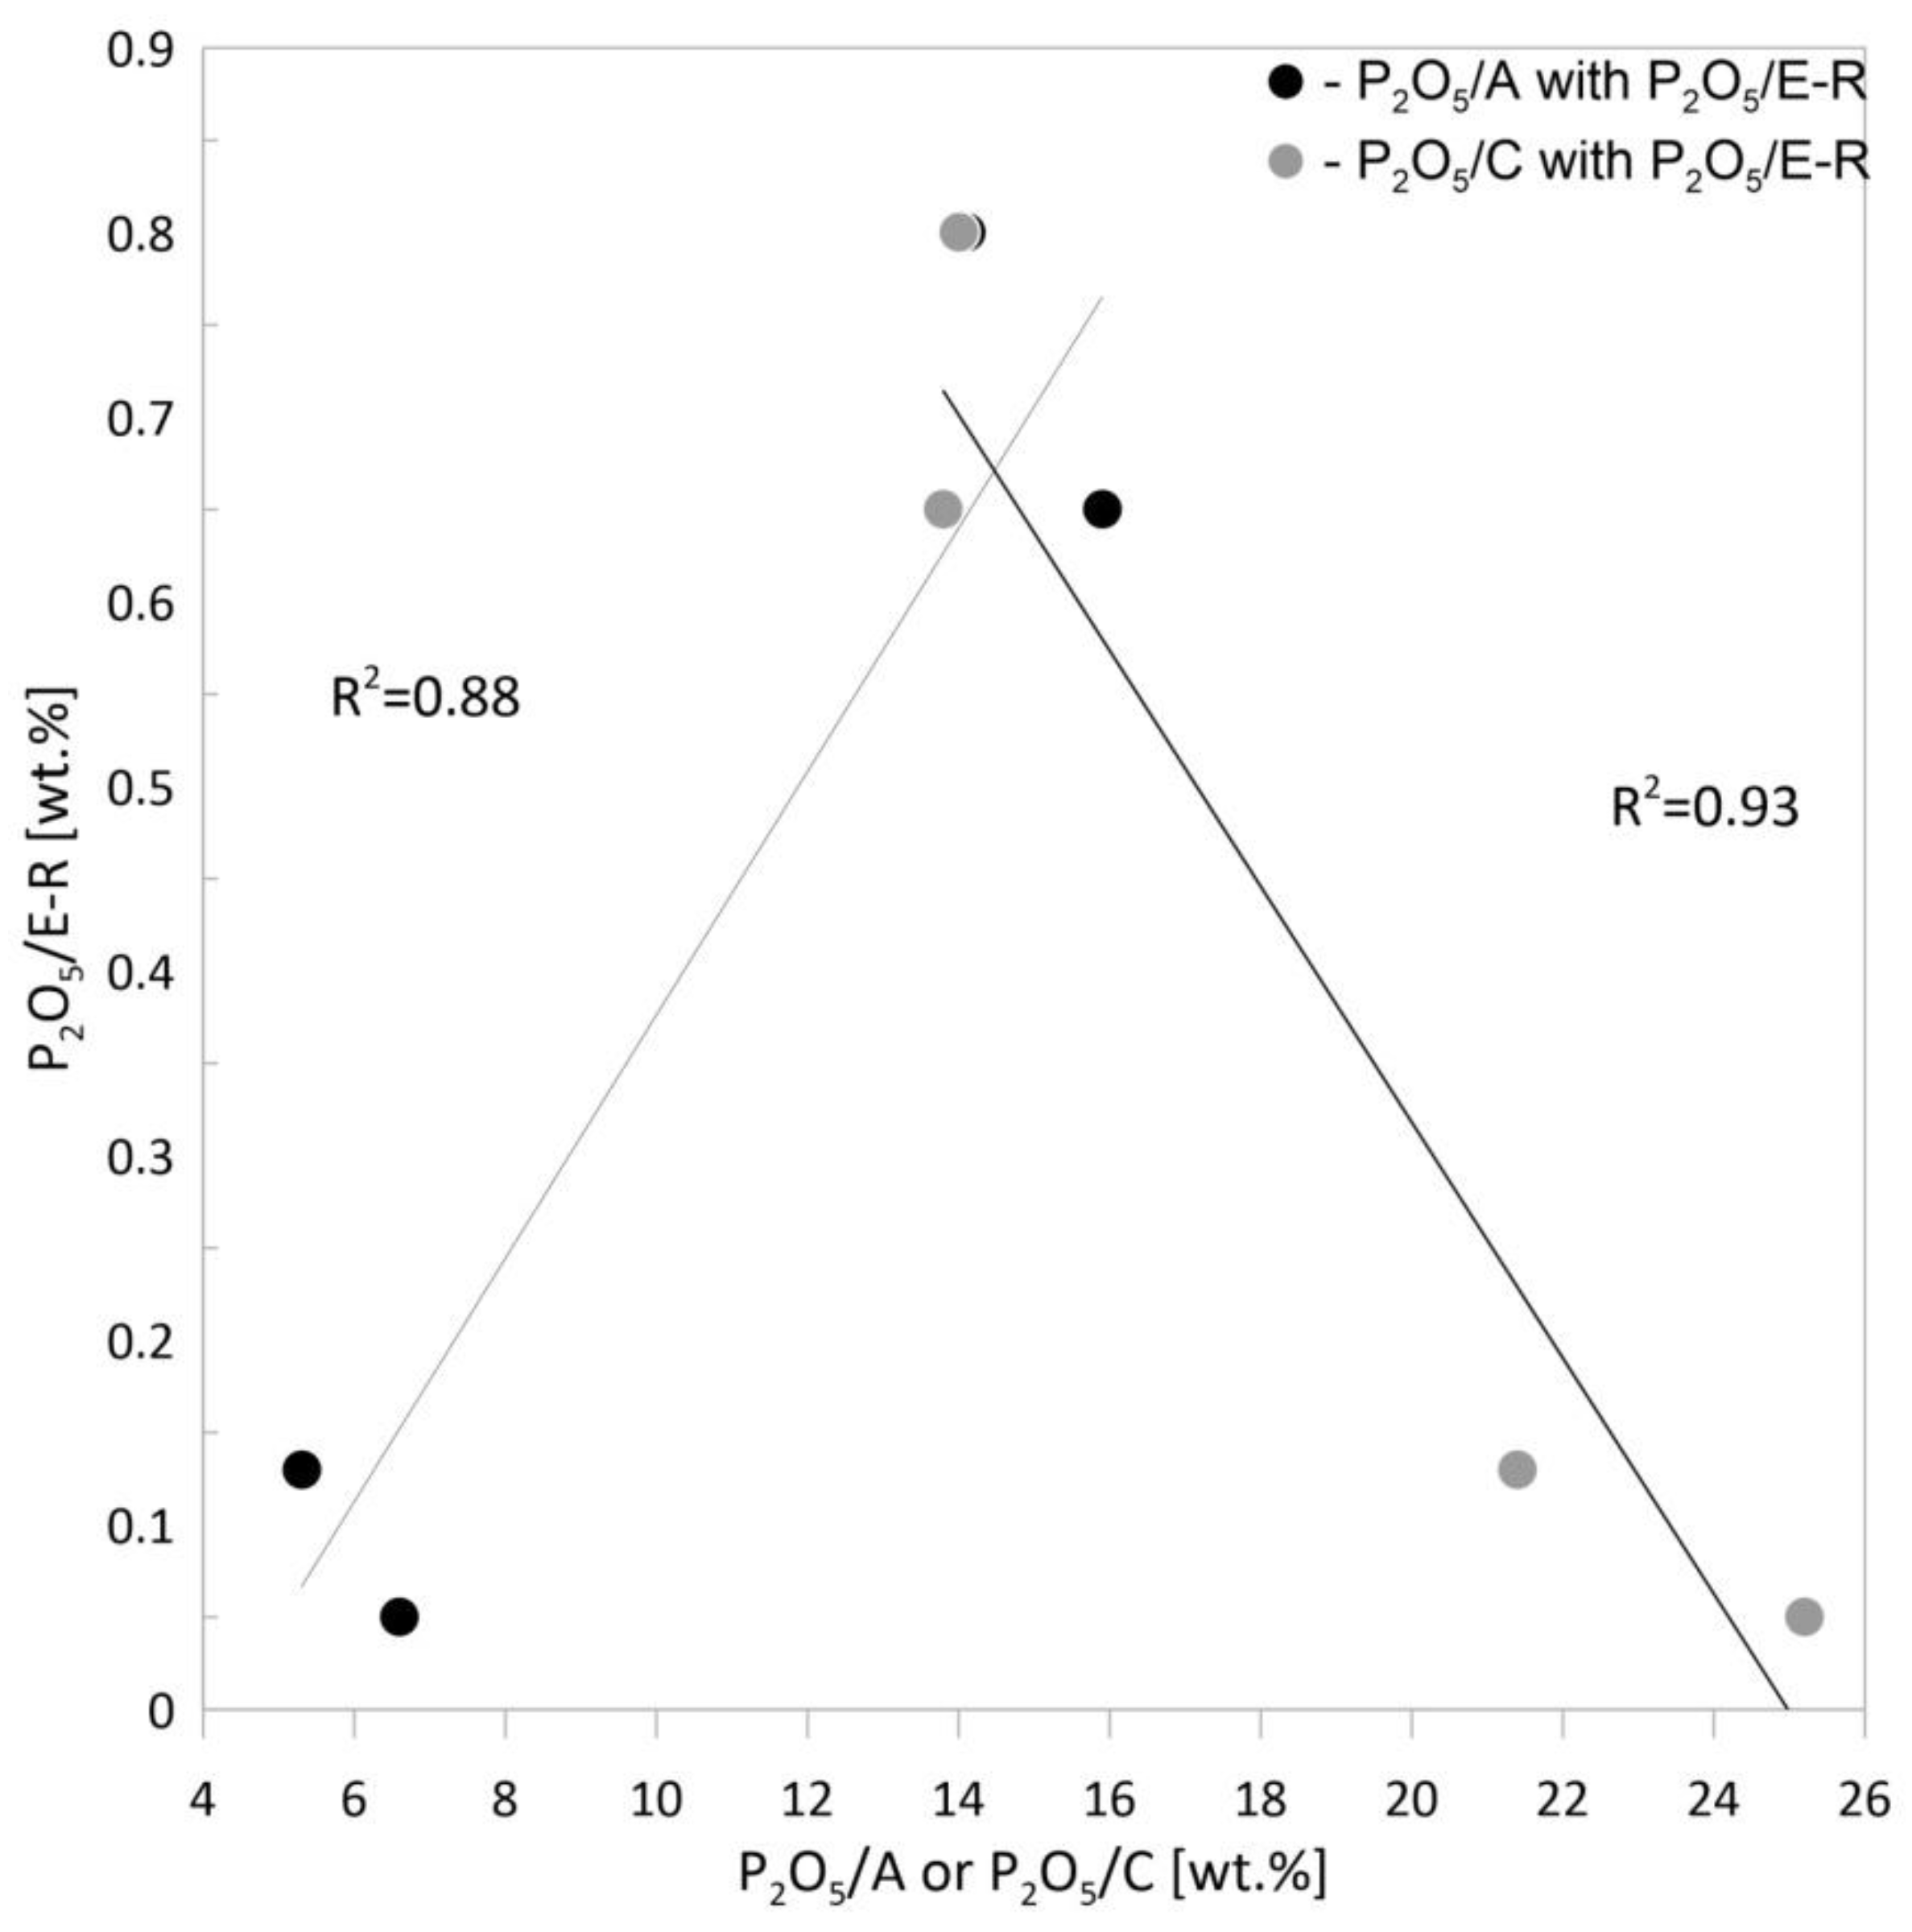
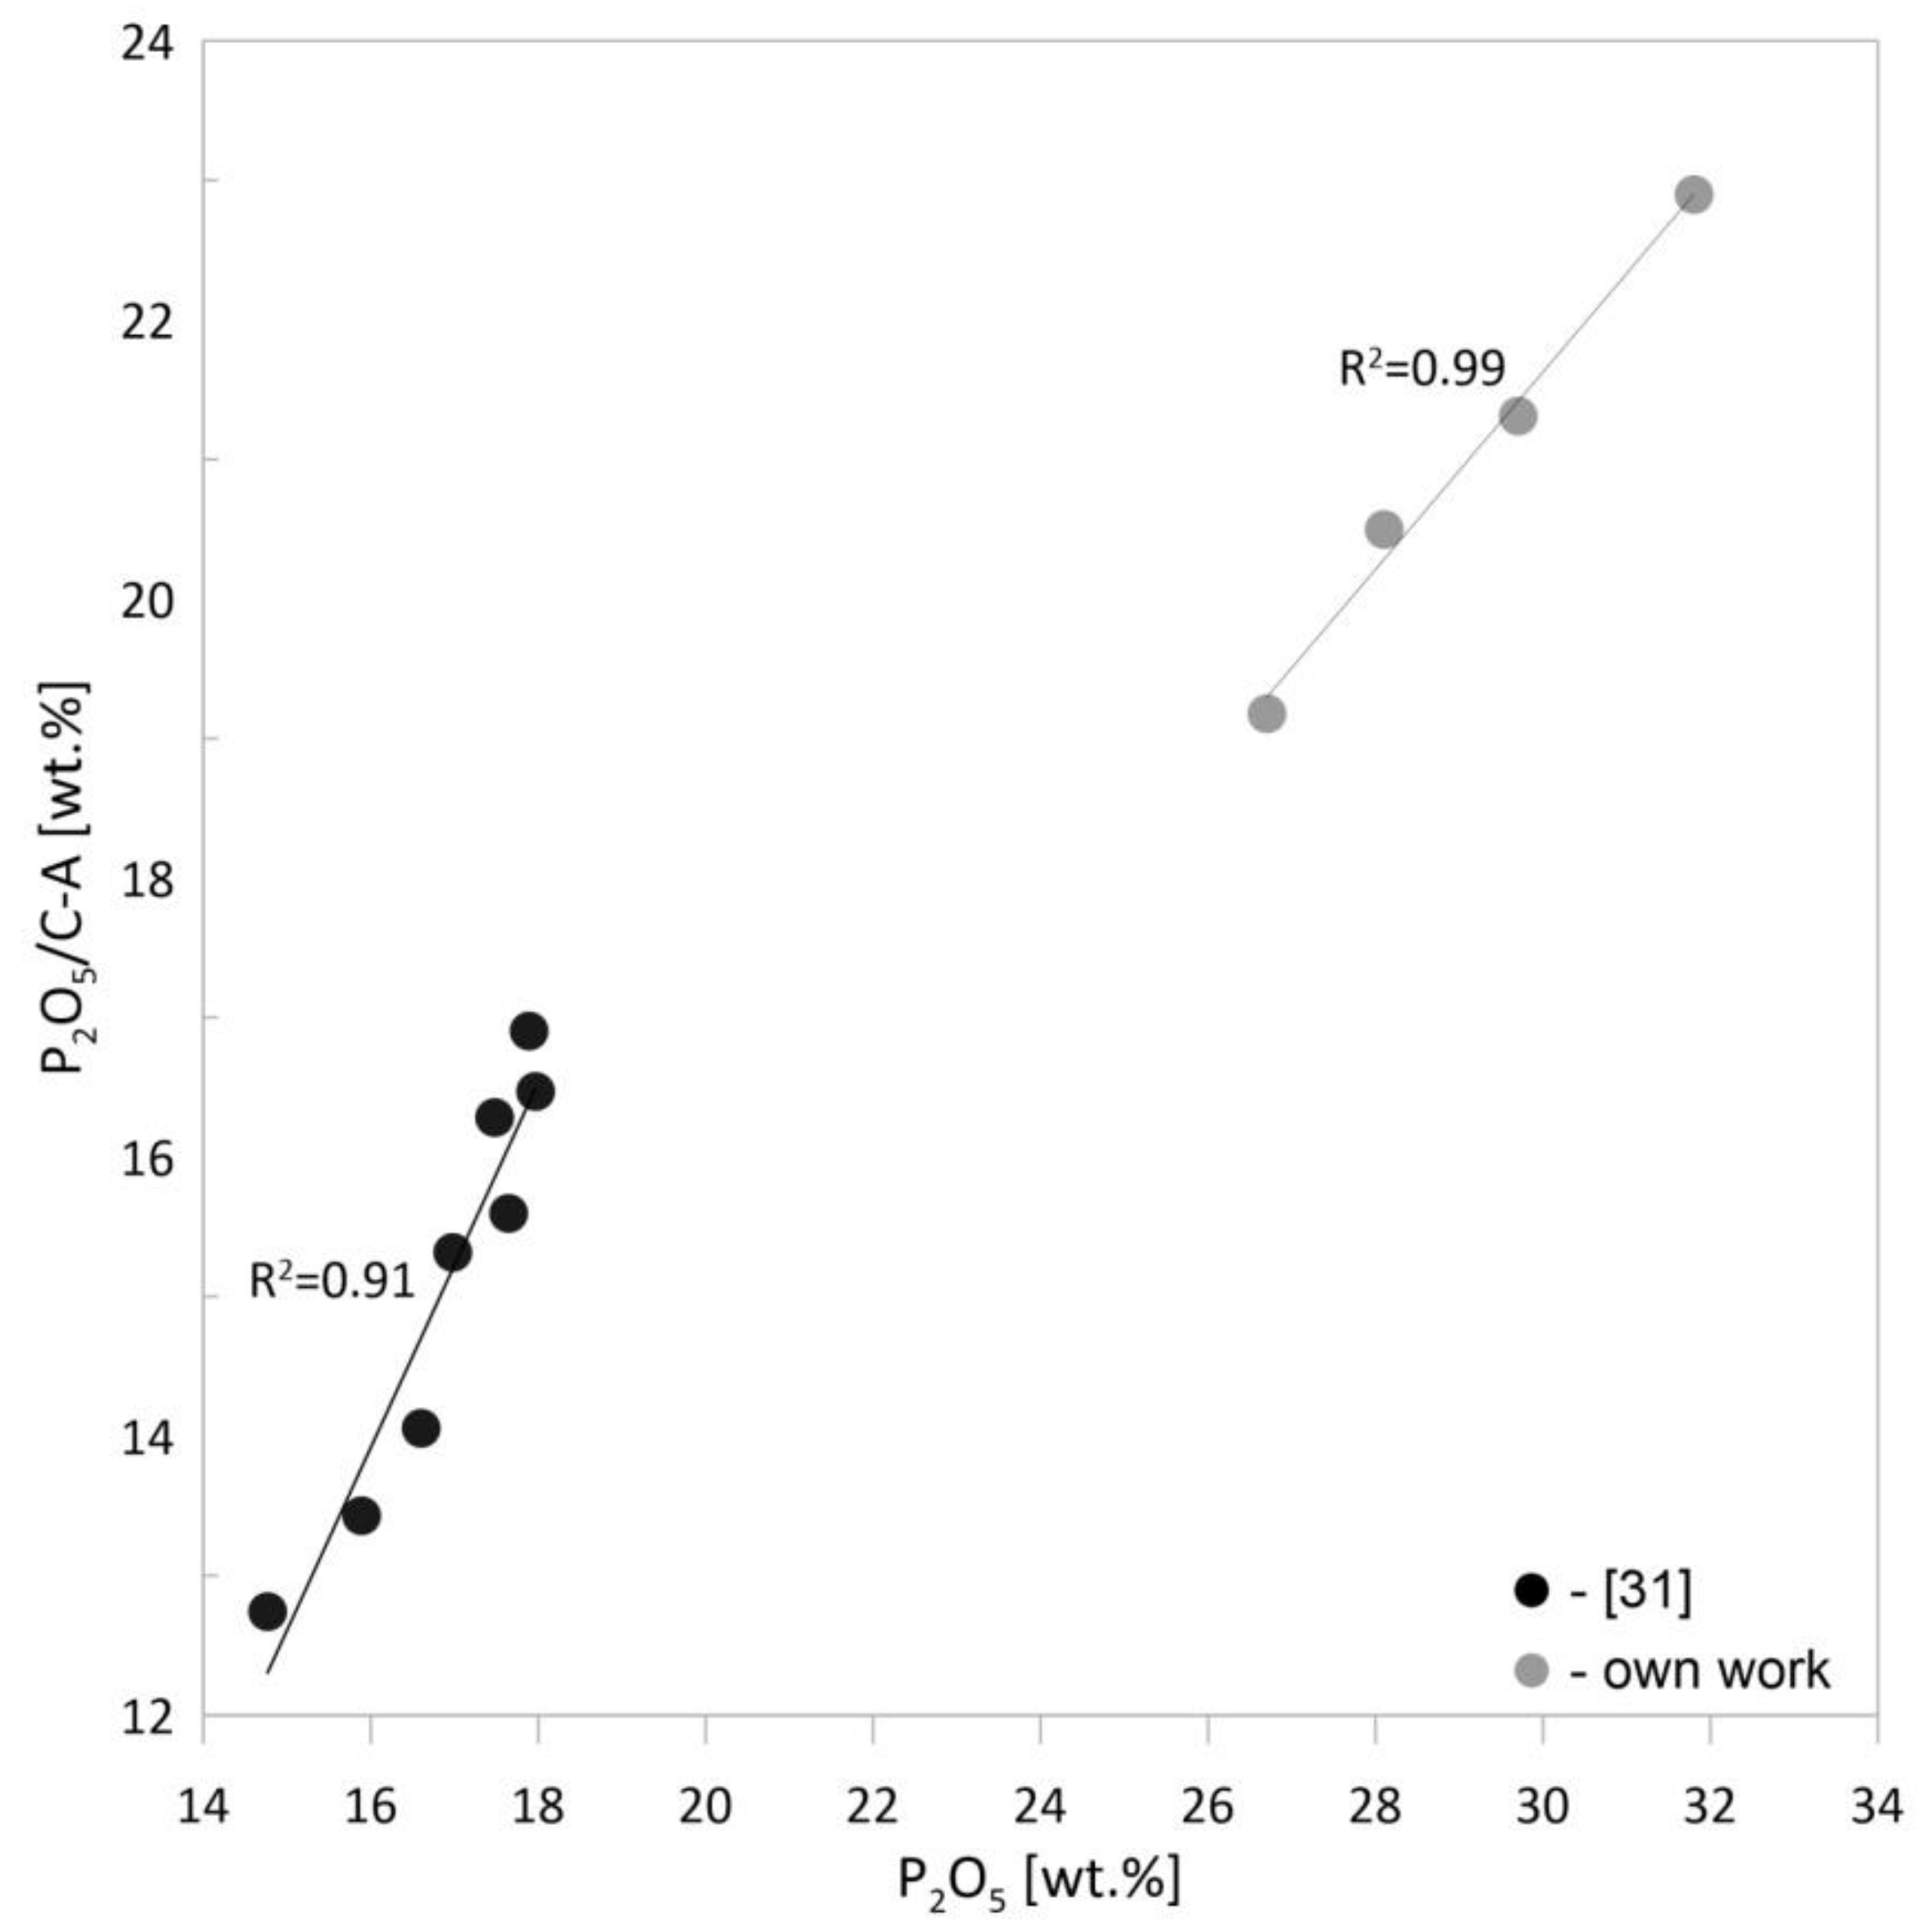
3.2.3. Bioavailable Forms of Phosphorus
4. Discussion
5. Conclusions
- Poultry manure is a very heterogeneous material in terms of grain size and grain morphology, which is strongly influenced by how and when the birds breed. The grain morphology of the manure also has a strong influence on the combustion process. Poultry manure pelletizing, i.e., changing its morphology, significantly improves the efficiency of the combustion process as well as the chemical and phase properties of the ash obtained. The main product of the process is ash collected in the settling chamber.
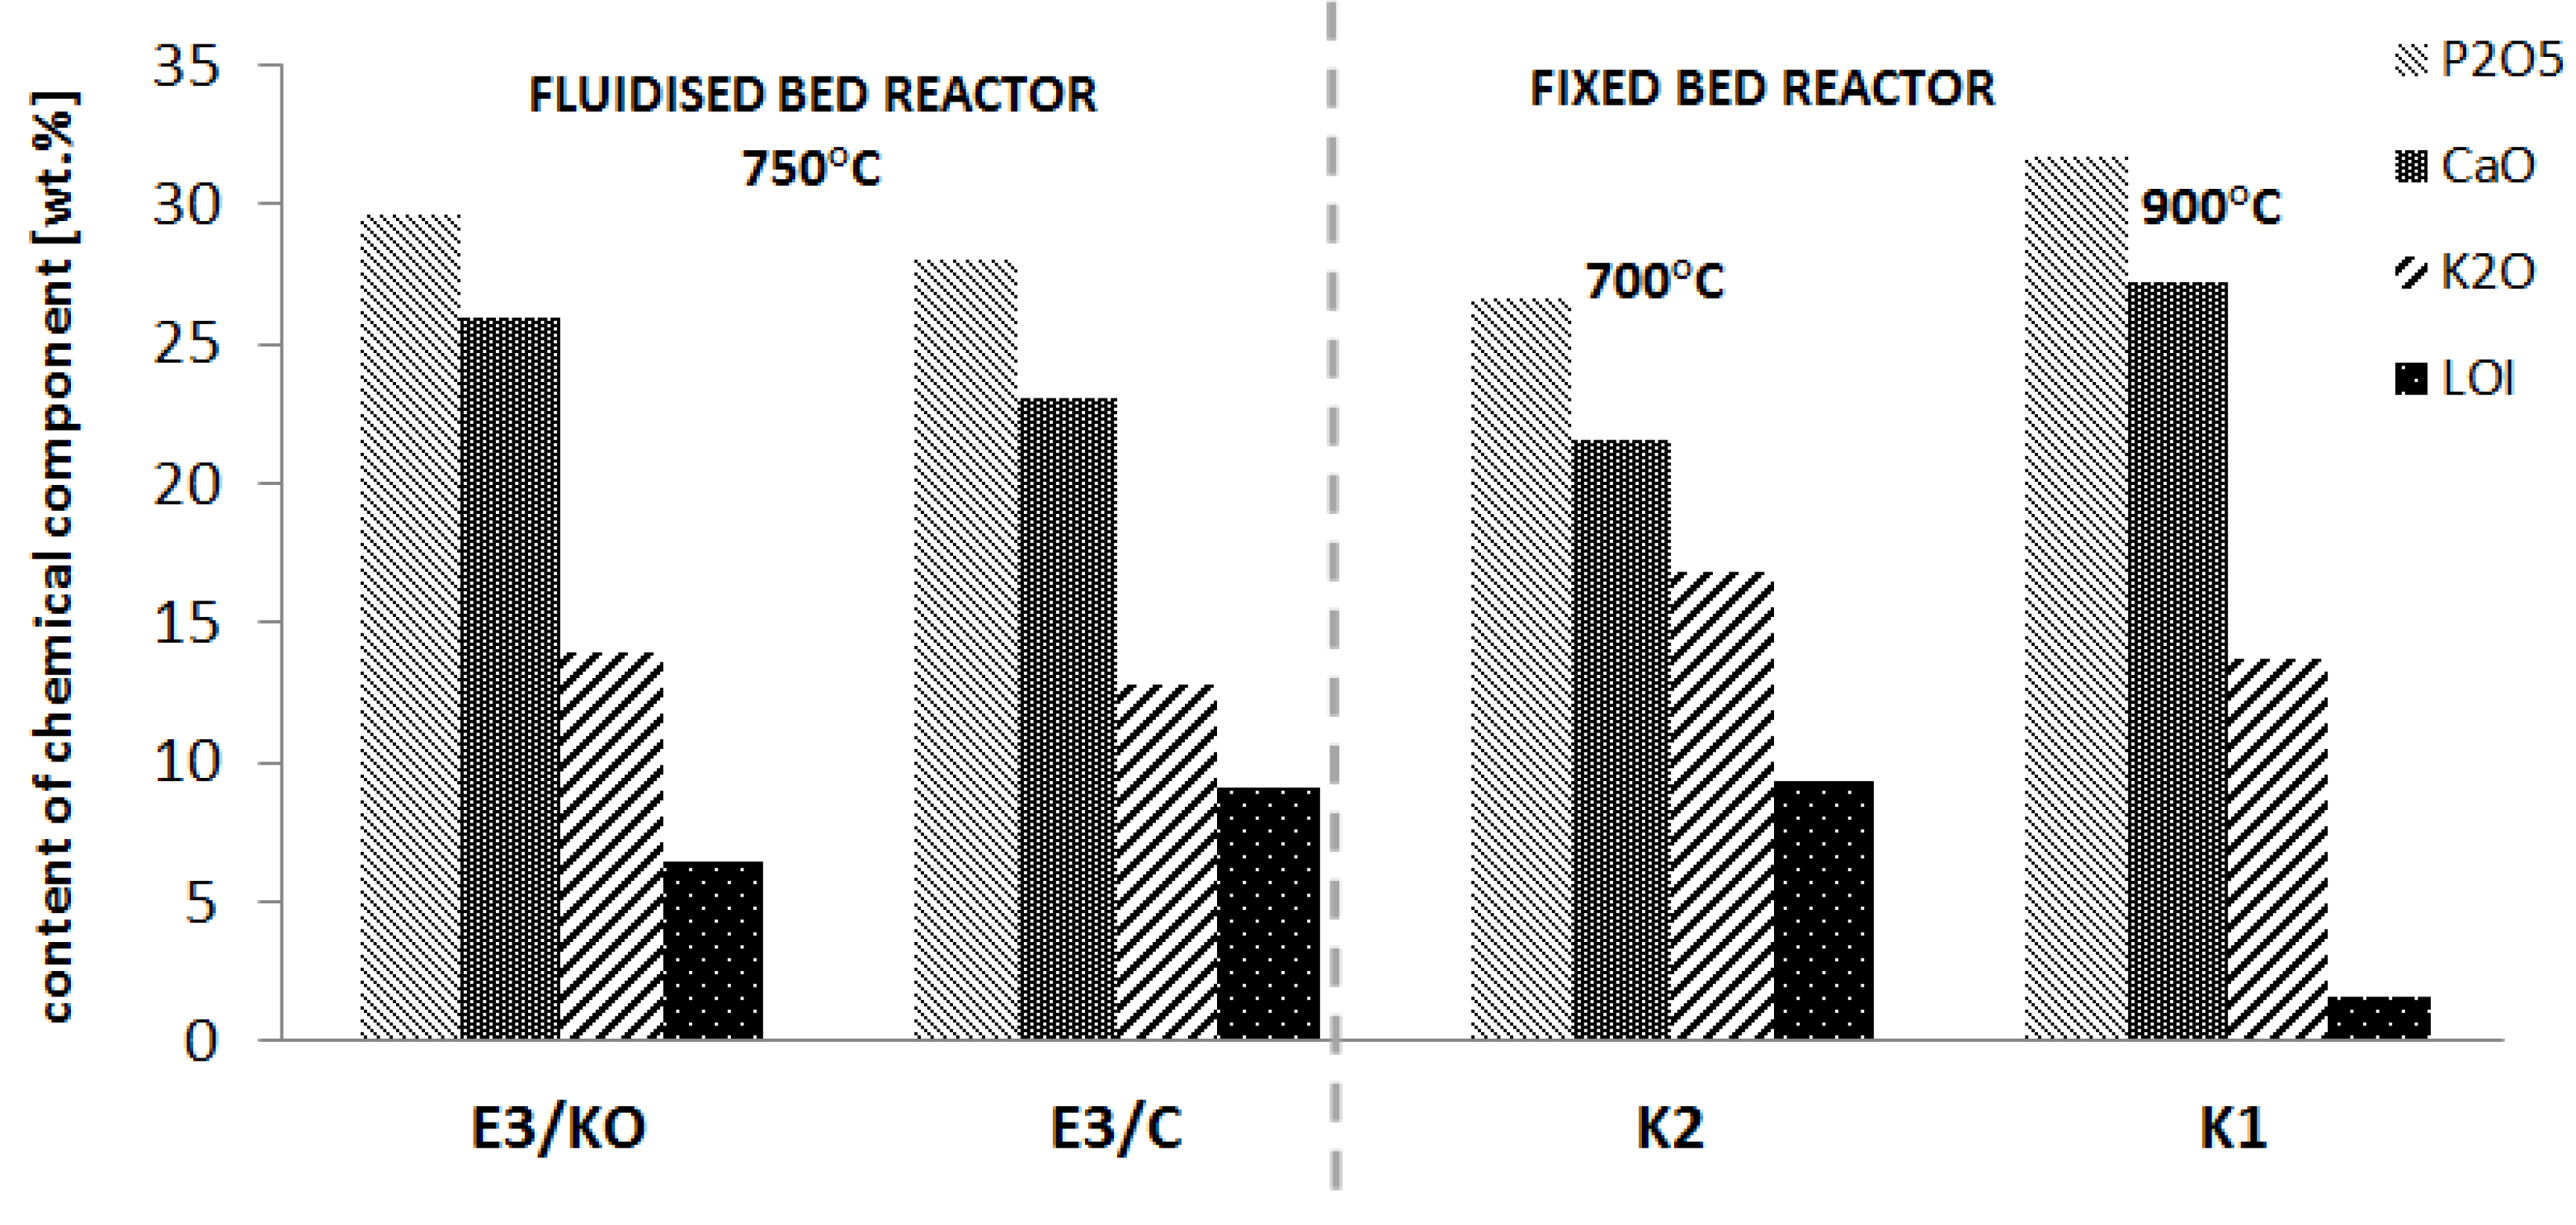
- The higher combustion efficiency of poultry manure in pellet form over the loose form is evidenced by the high phosphorus content (about 29% wt.) and the low content of ignition losses (LOI about 8%).
- The phosphorus content of the crystalline phase is similar to that of the amorphous phase, with a tendency for a higher concentration in the latter.
- The high proportion of amorphous matter in the ash obtained from the combustion of pellets (about 58% wt.) indicates a high potential for the bioavailability of phosphorus in this raw material.
- In ash from fluidised bed combustion, there was approximately three times more phosphorus in the amorphous phase than in the ash from the fixed bed combustion obtained in a similar temperature range.
Supplementary Materials
Author Contributions
Funding
Conflicts of Interest
References
- Eurostat Statistics Explained. Agricultural Production–Livestock and Meat. Available online: https://ec.europa.eu/eurostat/statistics-explained/index.php?title=Agricultural_production_-_livestock_and_meat (accessed on 19 April 2021).
- Statistic Yearbook of the Republic of Poland 2010. Available online: https://stat.gov.pl/en/topics/statistical-yearbooks/statistical-yearbooks/statistical-yearbook-of-the-republic-of-poland-2010,2,5.html?contrast=default (accessed on 19 April 2021).
- Statistic Yearbook of the Republic of Poland 2020. Available online: https://stat.gov.pl/en/topics/statistical-yearbooks/statistical-yearbooks/statistical-yearbook-of-the-republic-of-poland-2020,2,22.html (accessed on 19 April 2021).
- Myszograj, S.; Puchalska, E. Waste from rearing and slaughter of poultry–treat to the environment or feedstock for energy. Environ. Med. 2012, 15, 106–115. [Google Scholar]
- Central Statistical Office. Report on Livestock in 2014; Central Statistical Office of Poland: Warsaw, Poland, 2015. [Google Scholar]
- Council Directive. Concerning the Protection of Water Against Pollution Caused by Nitrates from Agricultural Sources; No. 91/676/EEC of 12 December 1991; Publications Office EU: Brussels, Belgium, 1991. [Google Scholar]
- Commission Regulation (EU). Amending Regulation (EU) No 142/2011 as Regards the Use of Animal By-products and Derived Products as a Fuel in Combustion Plants; No. 592/2014 of 3 June 2014; Publications Office EU: Brussels, Belgium, 2014. [Google Scholar]
- General Veterinary Inspectorate. Available online: https://www.wetgiw.gov.pl/handel-eksport-import/rejestry-i-wykazy-podmiotow-nadzorowanych (accessed on 19 April 2021).
- Steffen, W.; Richardson, K.; Rockström, J.; Cornell, S.E.; Fetzer, I.; Bennett, E.M.; Biggs, R.; Carpenter, S.R.; de Vries, W.; de Wit, C.A.; et al. Planetary Boundaries: Guiding Human Development on a Changing Planet. Science 2015, 347, 1259855. [Google Scholar] [CrossRef] [Green Version]
- Correll, D.L. The Role of Phosphorus in the Eutrophication of Receiving Waters: A Review. J. Environ. Qual. 1998, 27, 261–266. [Google Scholar] [CrossRef] [Green Version]
- Billen, P.; Costa, J.; Van der Aa, L.; Van Caneghem, J.; Vandecasteele, C. Electricity from poultry manure: A cleaner alternative to direct land application. J. Clean. Prod. 2015, 96, 467–475. [Google Scholar] [CrossRef]
- Dróżdż, D.; Wystalska, K.; Malińska, K.; Grosser, A.; Grobelak, A.; Kacprzak, M. Management of poultry manure in Poland–Current state and future perspectives. J. Environ. Manag. 2020, 264, 110327. [Google Scholar] [CrossRef]
- Pavlostathis, S.; Giraldo-Gomez, E. Kinetics of anaerobic treatment: A critical review. Crit. Rev. Environ. Control 1991, 21, 411–490. [Google Scholar] [CrossRef]
- Wu, D.; Li, L.; Zhao, X.; Peng, Y.; Yang, P.; Peng, X. Anaerobic digestion: A review on process monitoring. Renew. Sustain. Energy Rev. 2019, 103, 1–12. [Google Scholar] [CrossRef]
- Kelleher, B.P.; Leahy, J.J.; Henihan, A.; O’Dwyer, T.; Sutton, D.; Leahy, M. Advances in poultry litter disposal technology−A review. Bioresour. Technol. 2002, 83, 27–36. [Google Scholar] [CrossRef]
- Dávalos, J.Z.; Roux, M.V.; Jiménez, P. Evaluation of poultry litter as a feasible fuel. Thermochim. Acta 2002, 394, 261–266. [Google Scholar] [CrossRef]
- Tańczuk, M.; Junga, R.; Kolasa-Więcek, A.; Niemiec, P. Assessment of the energy potential of chicken manure in Poland. Energies 2019, 12, 1244. [Google Scholar] [CrossRef] [Green Version]
- Tańczuk, M.; Junga, R.; Werle, S.; Chabiński, M.; Ziółkowski, Ł. Experimental analysis of the fixed bed gasification process of the mixtures of the chicken manure with biomass. Renew. Energy 2019, 136, 1055–1063. [Google Scholar] [CrossRef]
- Whitely, N.; Ozao, R.; Artiaga, R.; Cao, Y.; Pan, W.-P. Multi-utilization of chicken litter as biomass source Part I. Combastion. Energy Fuels 2006, 20, 2660–2665. [Google Scholar] [CrossRef]
- Gil, M.V.; Casal, D.; Pevida, C.; Pis, J.J.; Rubiera, F. Thermal behaviour and kinetics of coal/biomass blends during co-combustion. Bioresour. Technol. 2010, 101, 5601–5608. [Google Scholar] [CrossRef] [Green Version]
- Lynch, D.; Henihan, A.M.; Bowen, B.; Lynch, D.; McDonnell, K.; Kwapinski, W.; Leahy, J.J. Utilisation of poultry litter as an energy feedstock. Biomass Bioenergy 2013, 49, 197–204. [Google Scholar] [CrossRef] [Green Version]
- Lynch, D.; Henihan, A.M.; Kwapinski, W.; Zhang, L.; Leahy, J.J. Ash Agglomeration and Deposition during Combustion of Poultry Litter in a Bubbling Fluidized-Bed Combustor. Energy Fuels 2013, 27, 4684–4694. [Google Scholar] [CrossRef]
- Abelha, P.; Gulyurtlu, I.; Boavida, D.; Barros, J.S.; Cabrita, I.; Leahy, J.; Kelleher, B.; Leahy, M. Combustion of Poultry Litter in a Fluidised Bed Combustor. Fuel 2003, 82, 687–692. [Google Scholar] [CrossRef]
- Wagner, K.; Häggström, G.; Mauerhofer, A.M.; Kuba, M.; Skoglund, N.; Öhman, M.; Hofbauer, H. Layer formation on K-feldspar in fluidized bed combustion and gasification of bark and chicken manure. Biomass Bioenergy 2019, 127, 105251. [Google Scholar] [CrossRef]
- Yıldız, Z.; Kaya, N.; Topcu, Y.; Uzun, H. Pyrolysis and optimization of chicken manure wastes in fluidized bed reactor: CO2 capture in activated bio-chars. Process Saf. Environ. Prot. Trans. Inst. Chem. Eng. Part B 2019, 130, 297–305. [Google Scholar] [CrossRef]
- Choudhury, A.; Felton, G.; Moyle, J.; Lansing, S. Fluidized bed combustion of poultry litter at farm-scale: Environmental impacts using a life cycle approach. J. Clean. Prod. 2020, 276, 124231. [Google Scholar] [CrossRef]
- Bolan, N.S.; Naidu, R.; Anderson, C.H. Management of Phosphorus in Organic Amendments for Sustainable Production and Environmental Protection. In Advanced Nutrient Management: Gains from the Past - Goals for the Future; Occasional Report No. 25; Currie, L.D., Christensen, C.L., Eds.; Fertilizer and Lime Research Centre, Massey University: Palmerston North, New Zealand, 2012. [Google Scholar]
- Haggstrom, G.; Fursatz, K.; Kuba, M.; Skoglund, N.; Ohman, M. Fate of Phosphorus in Fluidized Bed Cocombustion of Chicken Litter with Wheat Straw and Bark Residues. Energy Fuels 2020, 34, 1822–1829. [Google Scholar] [CrossRef]
- Vance, C.L. Digital Commons Using Poultry Litter Ash as a Fertilizer Source for Bermudagrass (Cynodon dactylon) Establishment and Loblolly Pine (Pinus taeda) Plantation. Doctoral Dissertations, Louisiana State University and Agricultural and Mechanical College, Baton Rouge, LA, USA, 2019. [Google Scholar]
- Żukowski, W.; Bradło, D. Conducting Tests of Fluidized Combustion of Chicken Manure with Optimization of the Process; Report; Politechnika Krakowska: Kraków, Poland, 2020; (Unpublished Work). [Google Scholar]
- Więckol-Ryk, A.; Białecka, B.; Cempa, M.; Adamczyk, Z. Optimization of chicken manure combustion parameters in the aspect of phosphorus recovery. Int. J. Recycl. Org. Waste Agric. 2020, 9, 273–285. [Google Scholar] [CrossRef]
- Kucharski, P.; Białecka, B. Poultry manure as a substrate for agriculture and the chemical industry. Int. Multidiscip. Sci. GeoConf. Surv. Geol. Min. Ecol. Manag. SGEM 2019, 19, 611–618. [Google Scholar] [CrossRef]
- Parker, M.B.; Perkins, H.F.; Fuller, H.L. Nitrogen, Phosphorus and Potassium Content of Poultry Manure and Some Factors Influencing Its Composition. Poult. Sci. 1959, 38, 1154–1158. [Google Scholar] [CrossRef]
- Bergfeldt, B.; Morgano, M.T.; Leibold, H.; Richter, F.; Stapf, D. Recovery of Phosphorus and other Nutrients during Pyrolysis of Chicken Manure. Agriculture 2018, 8, 187. [Google Scholar] [CrossRef] [Green Version]
- Deniza, G.; Gencoglu, H.; Cengiz, S.S.; Turkmen, I.I.; Orman, A.; Kara, C. Effects of feeding corn distiller’s dried grains with solubleswith and without enzyme cocktail supplementation to layinghens on performance, egg quality, selected manureparameters, and feed cost. Livest. Sci. 2013, 152, 174–181. [Google Scholar] [CrossRef]
- Staroń, P.; Kowalski, Z.; Staroń, A.; Seidlerová, J.; Banach, M. Residues from the thermal conversion of waste from the meat industry as a source of valuable macro- and micronutrients. Waste Manag. 2016, 49, 337–345. [Google Scholar] [CrossRef] [PubMed]
- Vucāns, R.; Līpenīte, I.; Livmanis, J. Comparison of Methods for the Determination of Phosphorus In Carbonatic Soils. Latv. J. Agron. 2008, 11, 299–305. [Google Scholar]
- Lambers, H.; Shane, M.W.; Cramer, M.D.; Pearse, S.J.; Veneklaas, E.J. Root structure and functioning for efficient acquisition of phosphorus: Matching morphological and physiological traits. Ann. Bot. 2006, 98, 693–713. [Google Scholar] [CrossRef] [Green Version]
- Abrahão, A.; Lambers, H.; Sawaya, A.C.; Mazzafera, P.; Oliveira, R.S. Convergence of a specialized root trait in plants from nutrient-impoverished soils: Phosphorus-acquisition strategy in a nonmycorrhizal cactus. Oecologia 2014, 176, 345–355. [Google Scholar] [CrossRef]
- Luyckx, L.; de Leeuw, G.H.J.; Van Caneghem, J. Characterization of Poultry Litter Ash in View of Its Valorization. Waste Biomass Valorization 2019, 11, 5333–5348. [Google Scholar] [CrossRef]
- Ciesielczuk, T.; Rosik-Dulewska, C.; Kusza, G. Ekstrakcja fosforu z osadów ściekowych i popiołów ze spalania osadów-analiza problemu. Pol. J. Sustain. Dev. 2016, 20, 21–28. [Google Scholar] [CrossRef]


| Experiment | Material | Bed | Temperature (°C) | Product Symbol |
|---|---|---|---|---|
| E1 | R1/L | A | 750 ± 20 | E1/KO E1/C |
| E2 | R2/L | Q | 750 ± 20 | E2/KO E2/C |
| E3 | R2/P | 750 ± 20 | E3/KO E3/C |
| Parameter | State | ||
|---|---|---|---|
| Wet | Analytical | Dry | |
| W (% wt.) | 73.97 | 2.40 | - |
| A (% wt.) | - | 12.80 | 13.12 |
| Qs (kJ/kg) | - | 15,504 | 15,885 |
| Qi (kJ/kg) | - | 14,334 | 14,686 |
| St (% wt.) | - | 0.52 | 0.53 |
| Ct (% wt.) | - | 37.35 | 38.27 |
| Ht (% wt.) | - | 5.09 | 5.22 |
| Nt (% wt.) | - | 7.55 | 7.74 |
| Ot (% wt.) | - | 34.91 | 35.77 |
| Main Elements | Content (% wt.) | Trace Elements | Content (ppm) |
|---|---|---|---|
| C | 38.27 | Ti | 95 |
| N | 7.74 | V | no |
| O | 35.80 | Cr | no |
| H | 5.22 | Mn | 506 |
| S | 0.53 | Co | no |
| F | 0.00 | Ni | 19 |
| Na | 0.70 | Cu | 74 |
| Mg | 0.98 | Zn | 497 |
| Al | 0.04 | Br | 7 |
| Si | 0.23 | Rb | no |
| P | 2.38 | Sr | 55 |
| S | 0.78 | Zr | 5 |
| Cl | 1.12 | Nb | no |
| K | 3.08 | Cs | 125 |
| Ca | 2.84 | Ba | 218 |
| Fe | 0.09 | Pb | no |
| Experiment | E1 | E2 | E3 |
|---|---|---|---|
| Mass balance (g) | |||
| Starting bed * | 215.0 | 300.0 | 400.0 |
| Raw material mass | 1500.0 | 700.0 | 281.4 |
| Product mass | 435.8 | 425.7 | 420.7 |
| Mass fraction of individual ingredients in the product (% wt.) | |||
| Bed after the combustion process | 39.0 | 79.1 | 96.2 |
| Product taken from the settling chamber (KO) | 41.6 | 15.7 | 1.4 |
| Product taken from the cyclone I | 17.6 | 2.0 | 0.1 |
| Product taken from the reactor walls (SR) | 1.9 | 3.2 | 2.3 |
| Sum KO + C | 59.2 | 17.7 | 1.5 |
| Components | E1/KO | E1/C | E2/KO | E2/C | E3/KO | E3/C |
|---|---|---|---|---|---|---|
| SiO2 | 1.14 | 0.88 | 0.86 | 1.08 | 3.15 | 4.11 |
| TiO2 | 0.06 | 0.05 | 0.06 | 0.03 | 0.08 | 0.10 |
| Al2O3 | no | no | no | no | 1.12 | 1.42 |
| Fe2O3 | 0.82 | 0.80 | 1.18 | 1.70 | 2.51 | 4.97 |
| MnO | 0.40 | 0.36 | 0.21 | 0.27 | 0.47 | 0.42 |
| MgO | 4.78 | 3.60 | 2.36 | 4.80 | 7.75 | 6.92 |
| CaO | 19.94 | 16.63 | 11.24 | 16.20 | 26.01 | 23.08 |
| Na2O | 2.49 | 2.14 | 1.36 | 2.81 | 4.22 | 3.43 |
| K2O | 13.11 | 12.07 | 6.33 | 9.99 | 13.97 | 12.87 |
| P2O5 | 15.41 | 12.24 | 9.65 | 16.89 | 29.71 | 28.07 |
| SO3 | 3.12 | 3.07 | 1.43 | 1.96 | 2.60 | 2.60 |
| Cl | 2.23 | 2.31 | 2.46 | 4.76 | 1.45 | 2.53 |
| SrO | 0.03 | 0.02 | 0.01 | 0.03 | 0.05 | 0.04 |
| BaO | no | no | no | 0.01 | 0.01 | no |
| LOI | 36.04 | 45.33 | 62.35 | 38.95 | 6.42 | 9.16 |
| Total | 99.57 | 99.50 | 99.50 | 99.48 | 99.52 | 99.72 |
| Element | E1/KO | E1/C | E2/KO | E2/C | E3/KO | E3/C |
|---|---|---|---|---|---|---|
| As | 3 | 5 | 21 | 14 | 7 | no |
| Cr | no | no | 39 | 12 | 96 | 84 |
| Cu | 818 | 901 | 802 | 895 | 638 | 583 |
| Mo | 23 | 18 | no | 14 | 15 | 10 |
| Ni | 34 | 41 | 184 | 210 | 70 | 75 |
| Pb | 5 | 6 | 95 | 156 | 52 | 78 |
| Rb | 113 | 121 | 141 | 205 | 94 | 88 |
| Sn | no | 27 | no | 33 | 40 | 25 |
| V | 24 | 31 | 30 | 18 | 14 | 18 |
| Y | 10 | 8 | 2 | 1 | 6 | 8 |
| Zn | 3280 | 3790 | 3610 | 3540 | 3600 | 3420 |
| Zr | 30 | 23 | 51 | 67 | 209 | 390 |
| Name | E1/KO | E1/C | E2/KO | E2/C | E3/KO | E3/C |
|---|---|---|---|---|---|---|
| Phosphorous Phases | ||||||
| Potassium Magnesium Phosphate (V) | 13.6 | 11.6 | 25.5 | 21.0 | 11.7 | 11.3 |
| Nonacalcium Magnesium Sodium Heptakis (phosphate (V)) | 8.6 | 1.2 | 12.7 | 24.6 | 15.3 | 15.5 |
| Nagelschmidtite | 12.3 | 13.0 | 18.0 | 14.3 | 9.8 | 11.5 |
| Total—Main Phosphorous Phase | 34.5 | 25.8 | 56.2 | 59.9 | 36.8 | 38.3 |
| Wopmayite | 0.8 | 4.2 | no | 8.3 | 3.0 | 4.0 |
| Apatite | 3.1 | 2.8 | 0.4 | 0.6 | 0.1 | no |
| Whitlockite | 1.8 | 4.1 | no | 1.2 | no | no |
| Calcium Iron Magnesium Hydrogen Phosphate | no | 0.8 | no | 0.2 | no | no |
| Total—All Phosphorous Phases | 40.2 | 37.7 | 56.6 | 70.2 | 39.9 | 42.3 |
| Other Phases | ||||||
| Arcanite | 6.2 | 6 | no | 0.6 | 0.1 | 0.3 |
| Calcite | 0.5 | 0.7 | 0.2 | no | 0.2 | 0.1 |
| Metathenardite | 5.4 | 8.2 | no | no | no | no |
| Periclase | 0.8 | 1.2 | 0.1 | 0.5 | 0.3 | 0.1 |
| Sylvine | 4.1 | 3.8 | 2.0 | 7.4 | 0.5 | 0.5 |
| Total—other phases | 17.0 | 19.9 | 2.3 | 8.5 | 1.1 | 1.0 |
| Total—Crystalline Phase | 57.2 | 57.6 | 58.9 | 78.7 | 41.0 | 43.3 |
| Total—Amorphous Phase | 42.8 | 42.4 | 41.1 | 21.3 | 59.0 | 56.7 |
| Total | 100.0 | 100.0 | 100.0 | 100.0 | 100.0 | 100.0 |
| Component | Content in the Crystalline Phase * | Content in the Amorphous Phase * | Total Content ** | |||
|---|---|---|---|---|---|---|
| E3/KO | E3/C | E3/KO | E3/C | E3/KO | E3/C | |
| P2O5 | 13.8 | 14.0 | 15.9 | 14.1 | 29.7 | 28.1 |
| CaO | 8.6 | 8.9 | 17.4 | 14.2 | 26.0 | 23.1 |
| K2O | 3.8 | 3.8 | 10.2 | 9.1 | 14.0 | 12.9 |
| MgO | 3.9 | 3.6 | 3.9 | 3.3 | 7.8 | 6.9 |
| Na2O | 0.6 | 0.6 | 3.6 | 2.8 | 4.2 | 3.4 |
| Sum | 30.7 | 30.9 | 51.0 | 43.4 | 81.7 | 74.4 |
| Sample | Egner-Riehm Method | Citric Acid Method |
|---|---|---|
| E3/KO | 0.65 | 21.31 |
| E3/C | 0.80 | 20.50 |
Publisher’s Note: MDPI stays neutral with regard to jurisdictional claims in published maps and institutional affiliations. |
© 2021 by the authors. Licensee MDPI, Basel, Switzerland. This article is an open access article distributed under the terms and conditions of the Creative Commons Attribution (CC BY) license (https://creativecommons.org/licenses/by/4.0/).
Share and Cite
Adamczyk, Z.; Cempa, M.; Białecka, B. Phosphorus-Rich Ash from Poultry Manure Combustion in a Fluidized Bed Reactor. Minerals 2021, 11, 785. https://doi.org/10.3390/min11070785
Adamczyk Z, Cempa M, Białecka B. Phosphorus-Rich Ash from Poultry Manure Combustion in a Fluidized Bed Reactor. Minerals. 2021; 11(7):785. https://doi.org/10.3390/min11070785
Chicago/Turabian StyleAdamczyk, Zdzisław, Magdalena Cempa, and Barbara Białecka. 2021. "Phosphorus-Rich Ash from Poultry Manure Combustion in a Fluidized Bed Reactor" Minerals 11, no. 7: 785. https://doi.org/10.3390/min11070785
APA StyleAdamczyk, Z., Cempa, M., & Białecka, B. (2021). Phosphorus-Rich Ash from Poultry Manure Combustion in a Fluidized Bed Reactor. Minerals, 11(7), 785. https://doi.org/10.3390/min11070785