
Image Process of Rock Size Distribution Using DexiNed-Based Neural Network


Abstract
:1. Introduction
- Using a modified DexiNed network to detect the edge maps of rock images;
- Propose processes to separate fine regions, connected neighboring rocks, and further segment the connected material into individual particles;
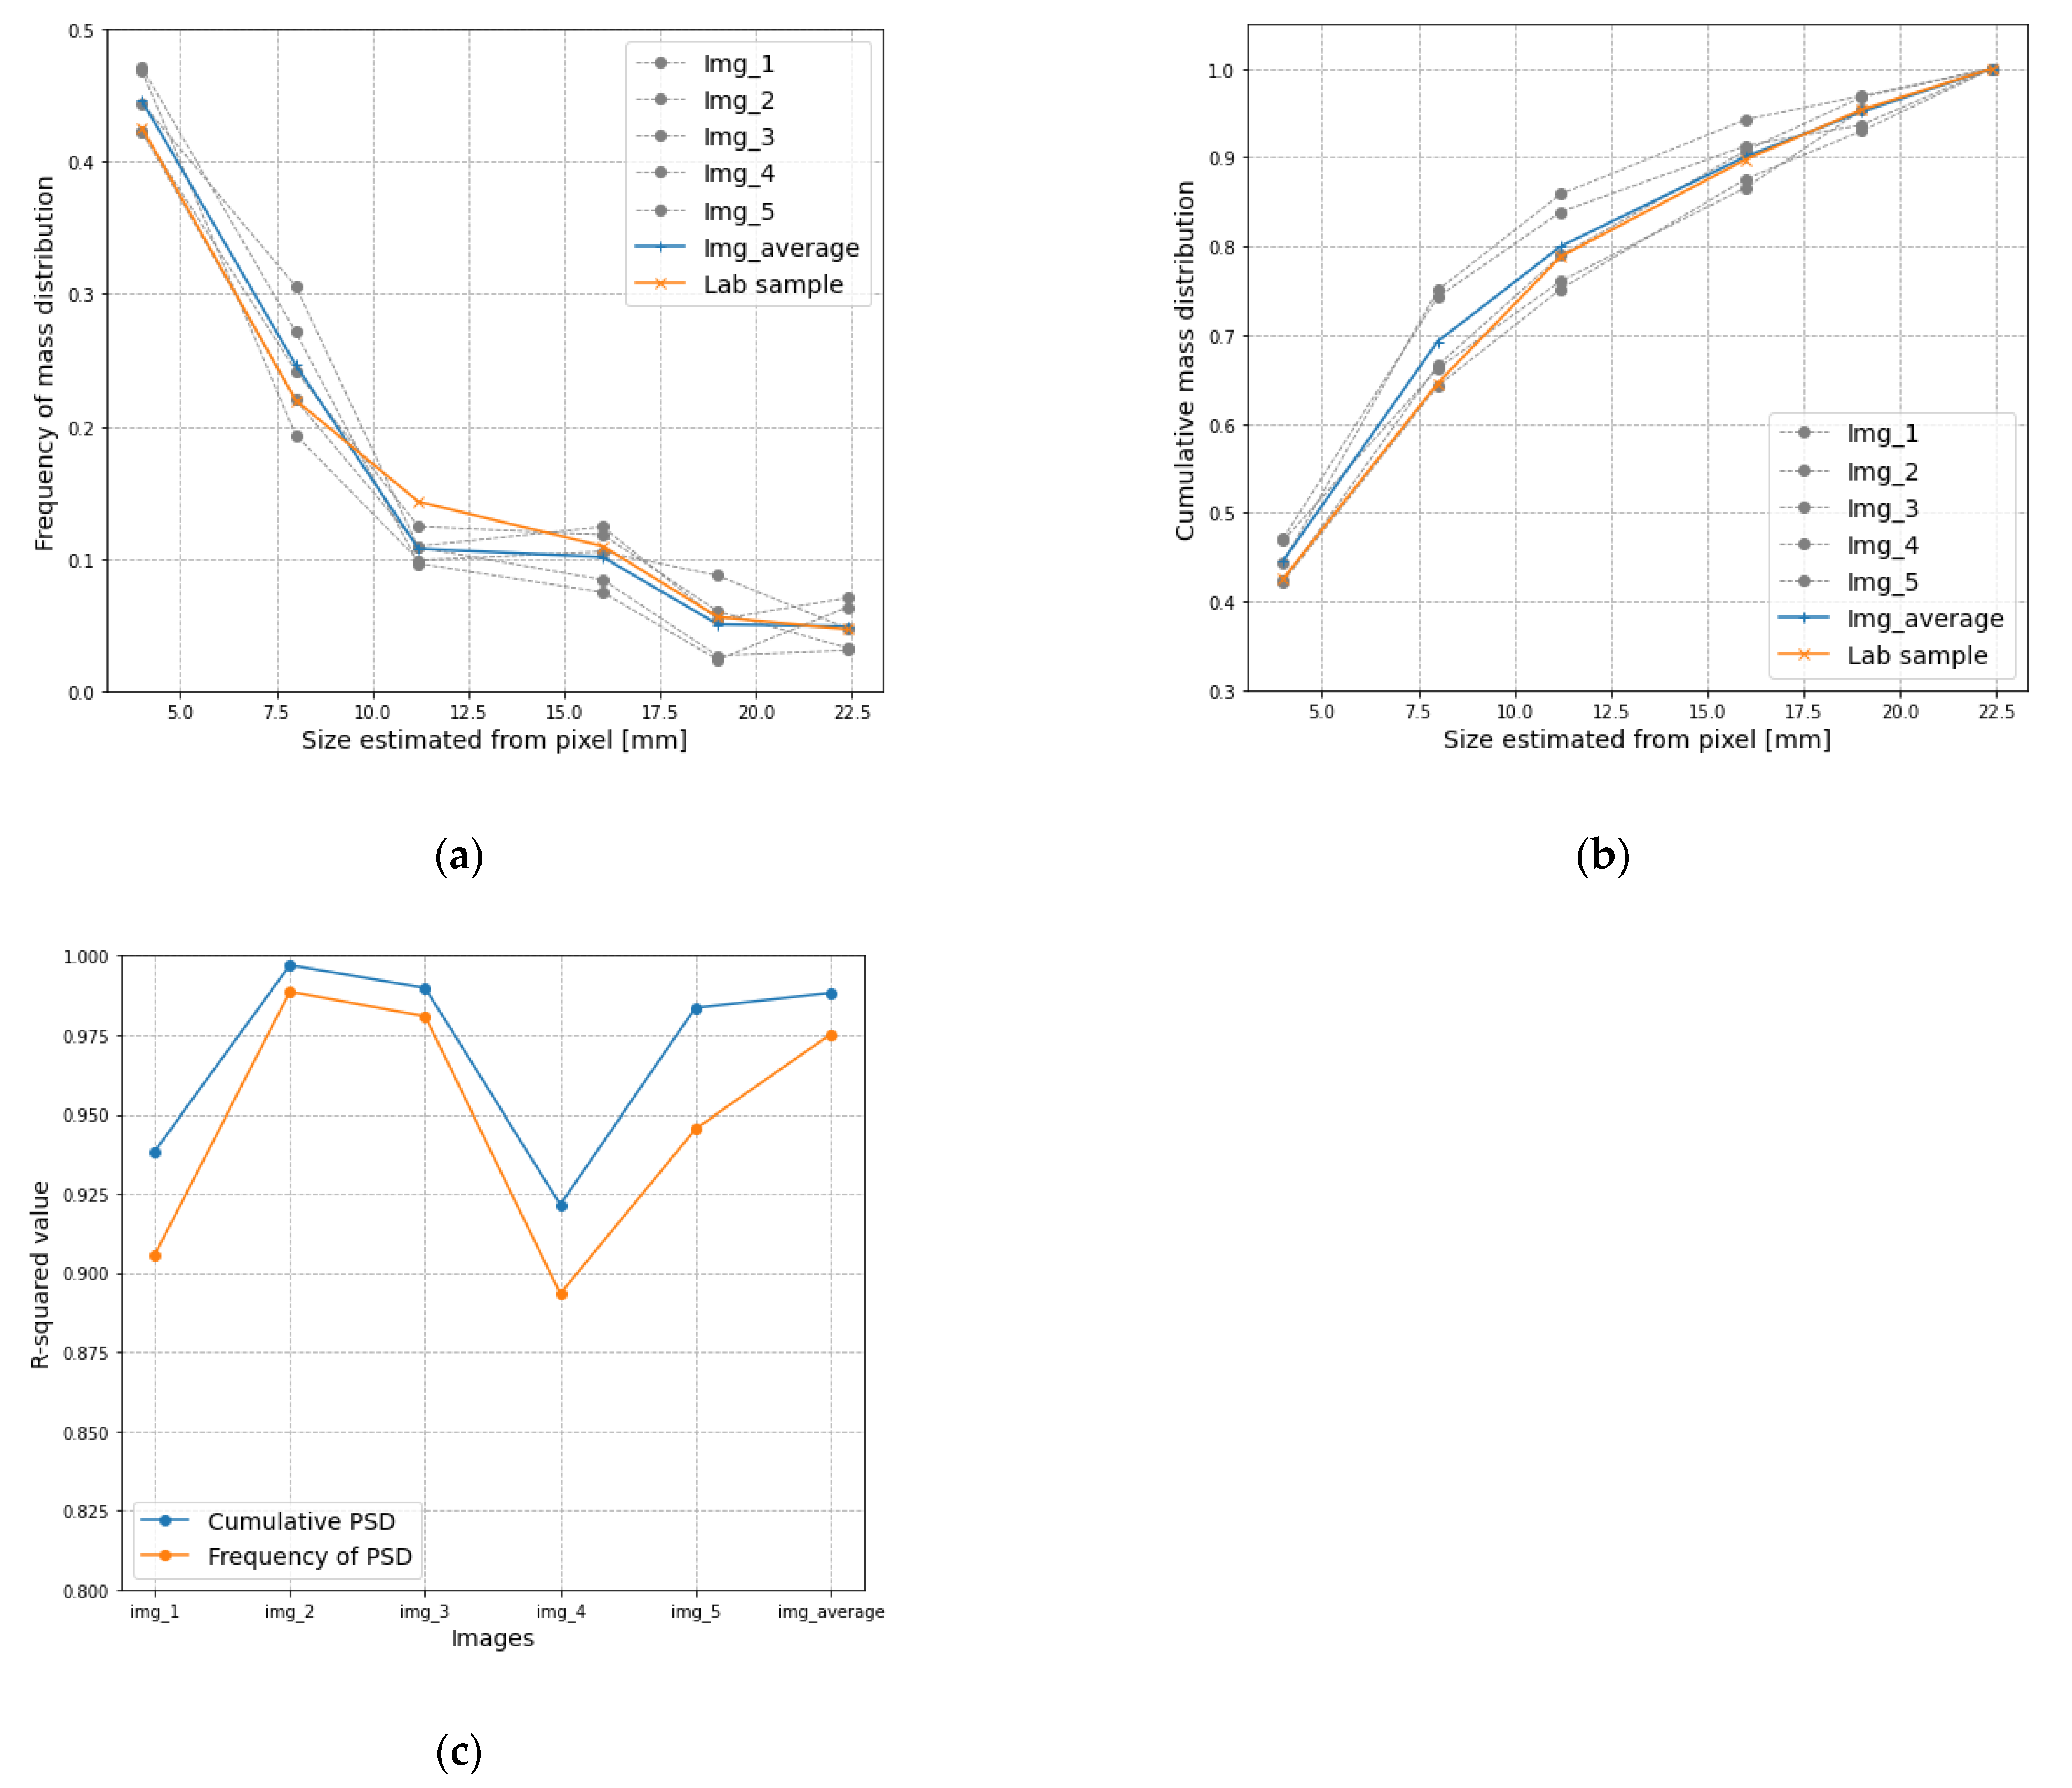
- Convert the pixel areas detected from drawn contours to mass distribution and validate results with the lab screening data.
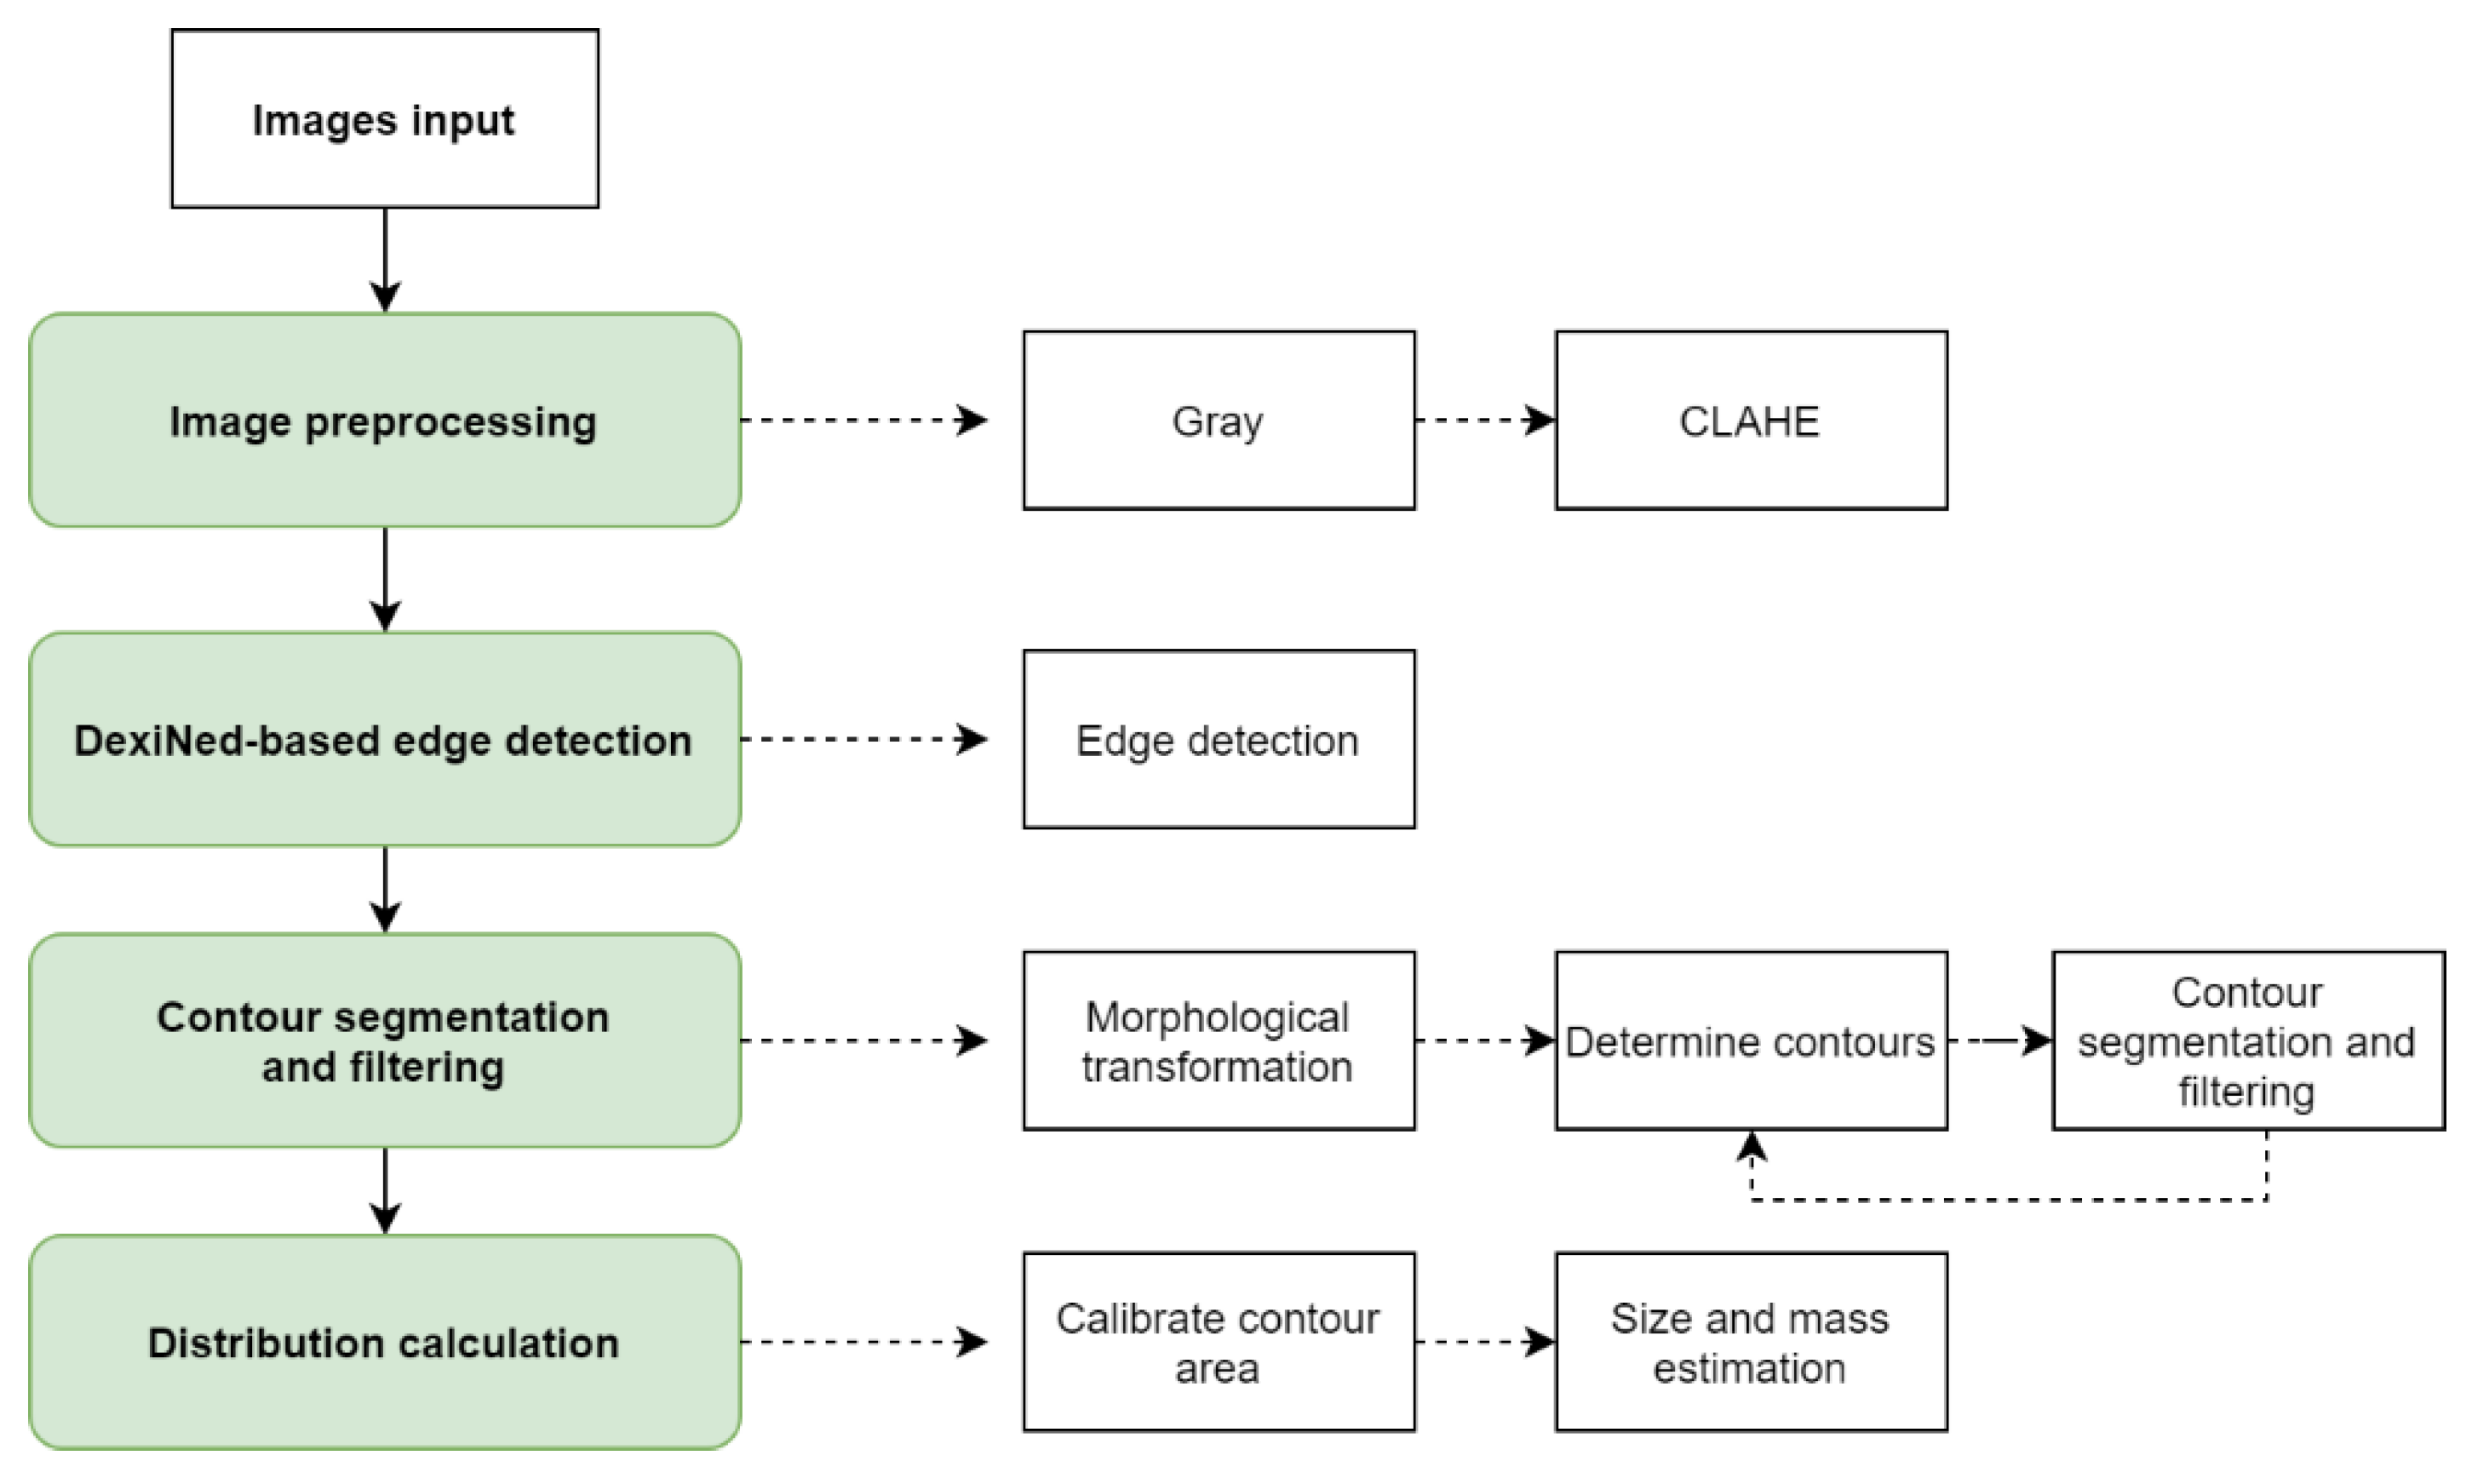
2. Materials and Methods
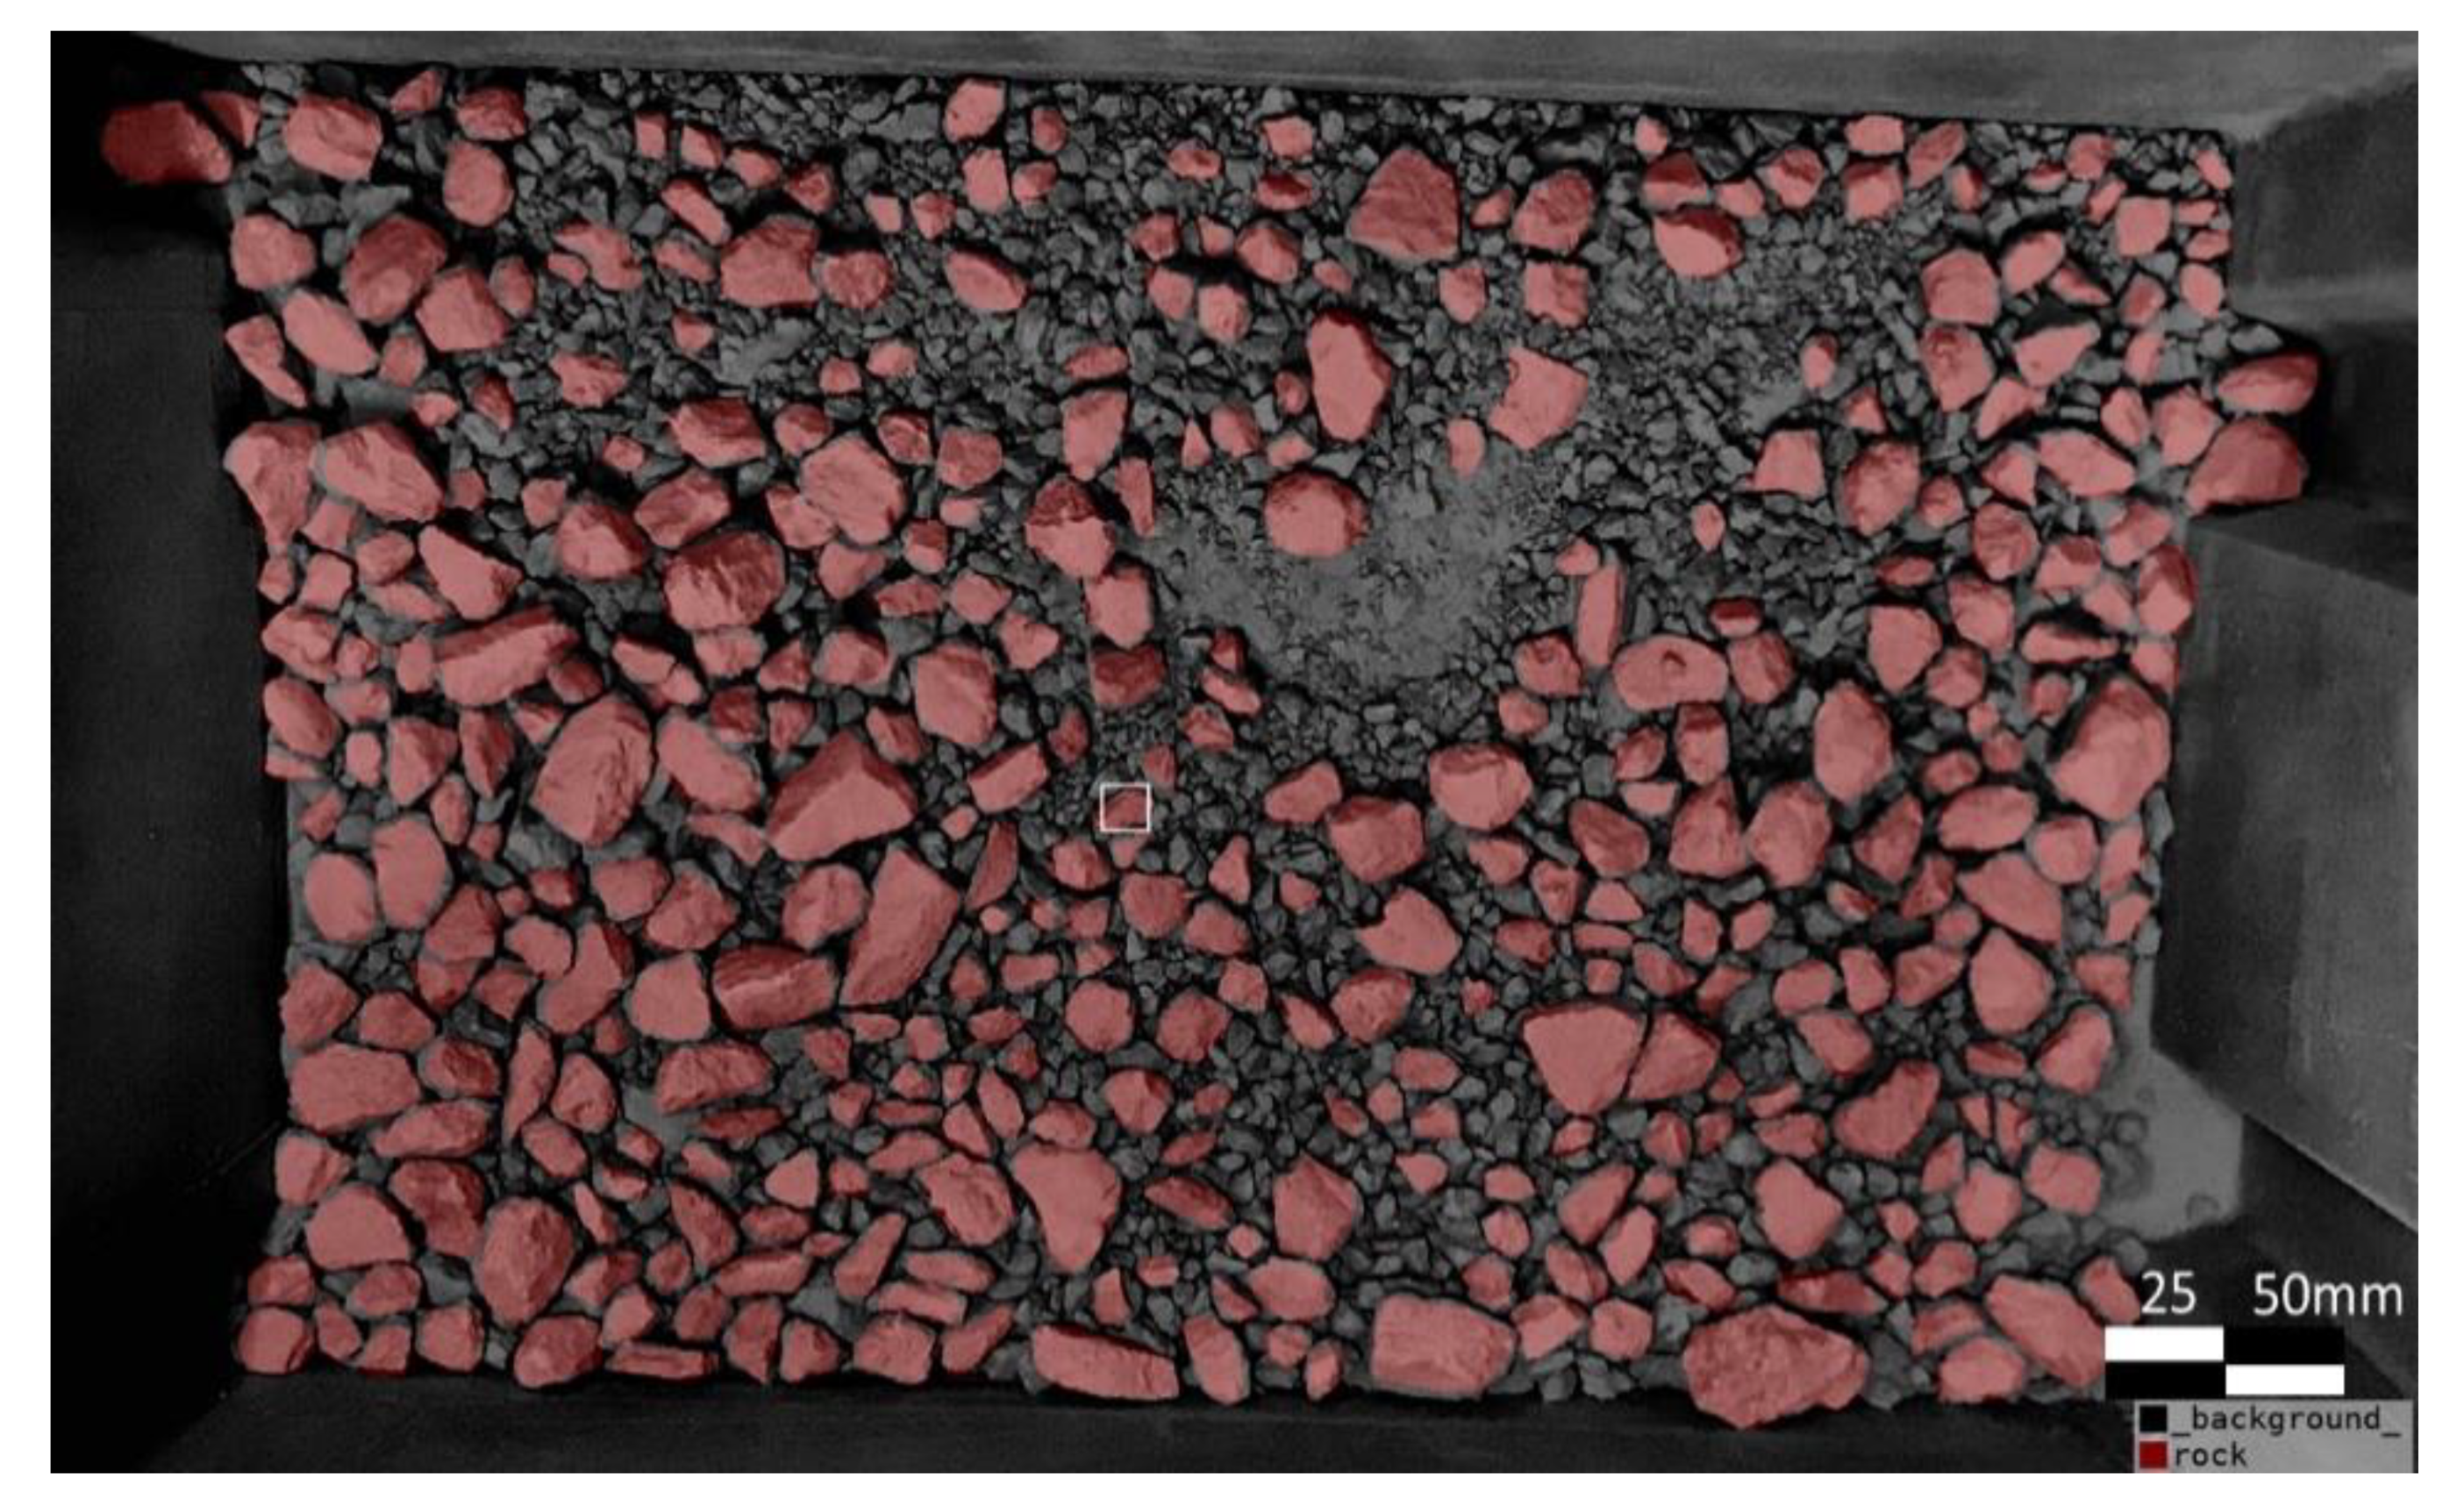
2.1. Data Preparation and Image Preprocessing
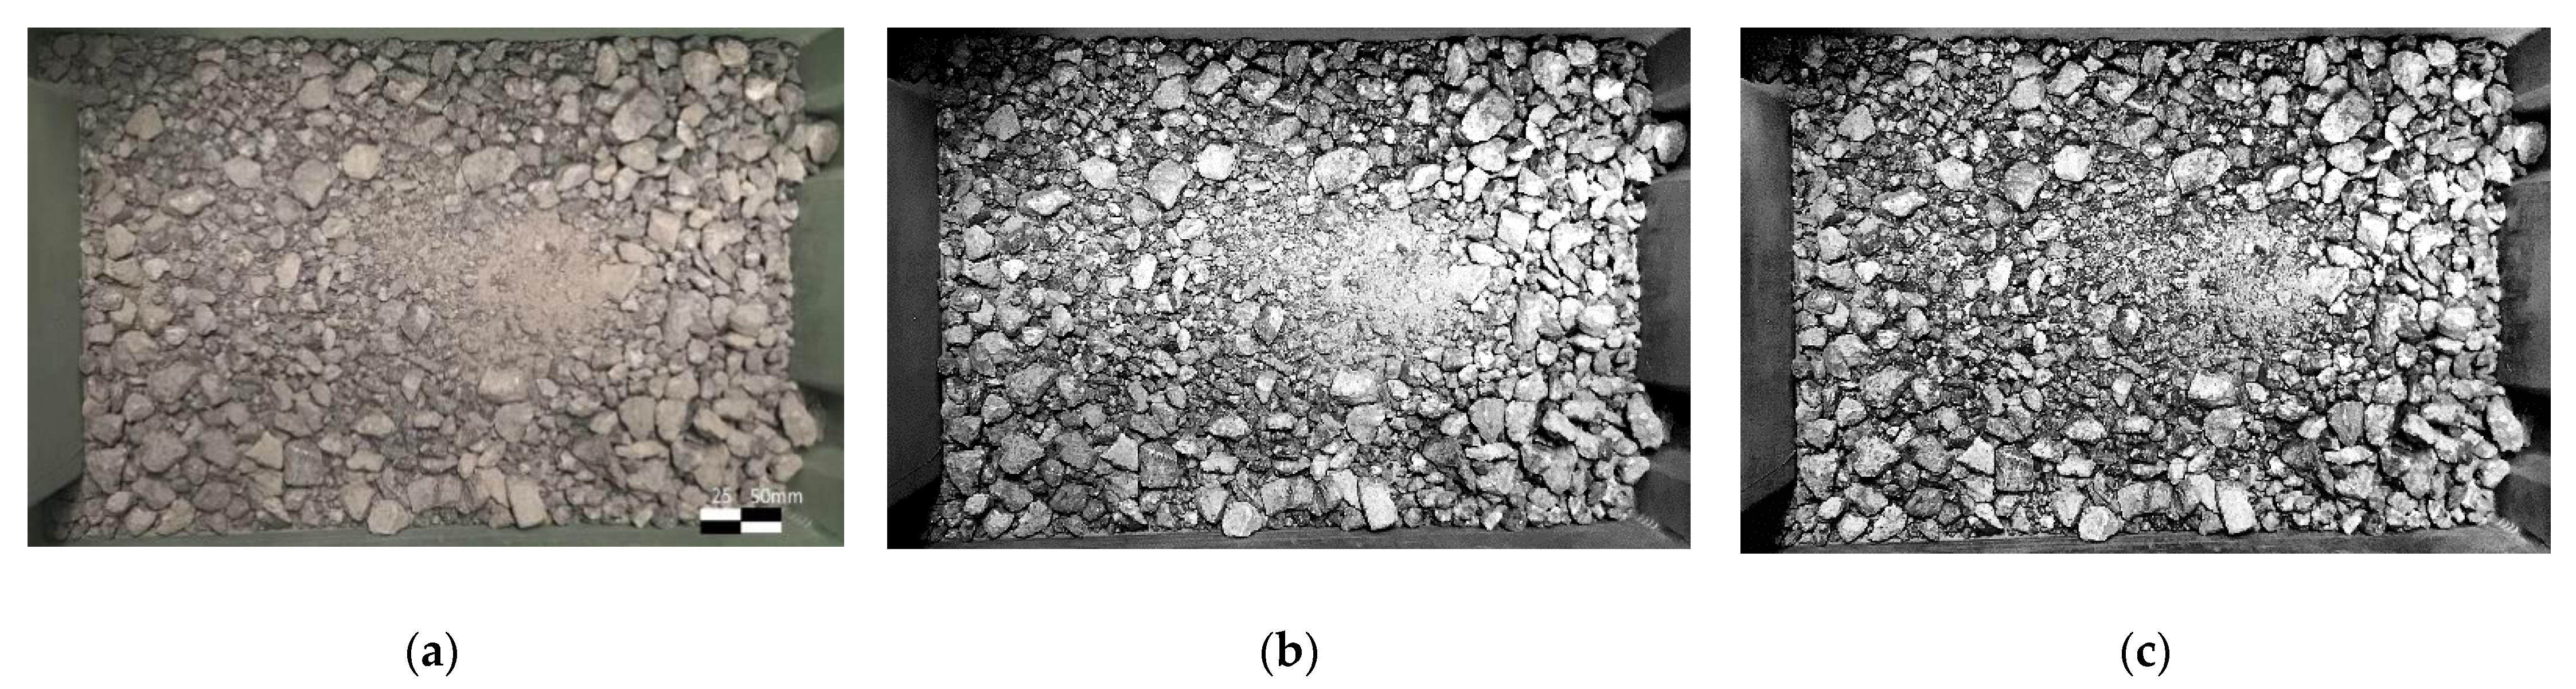
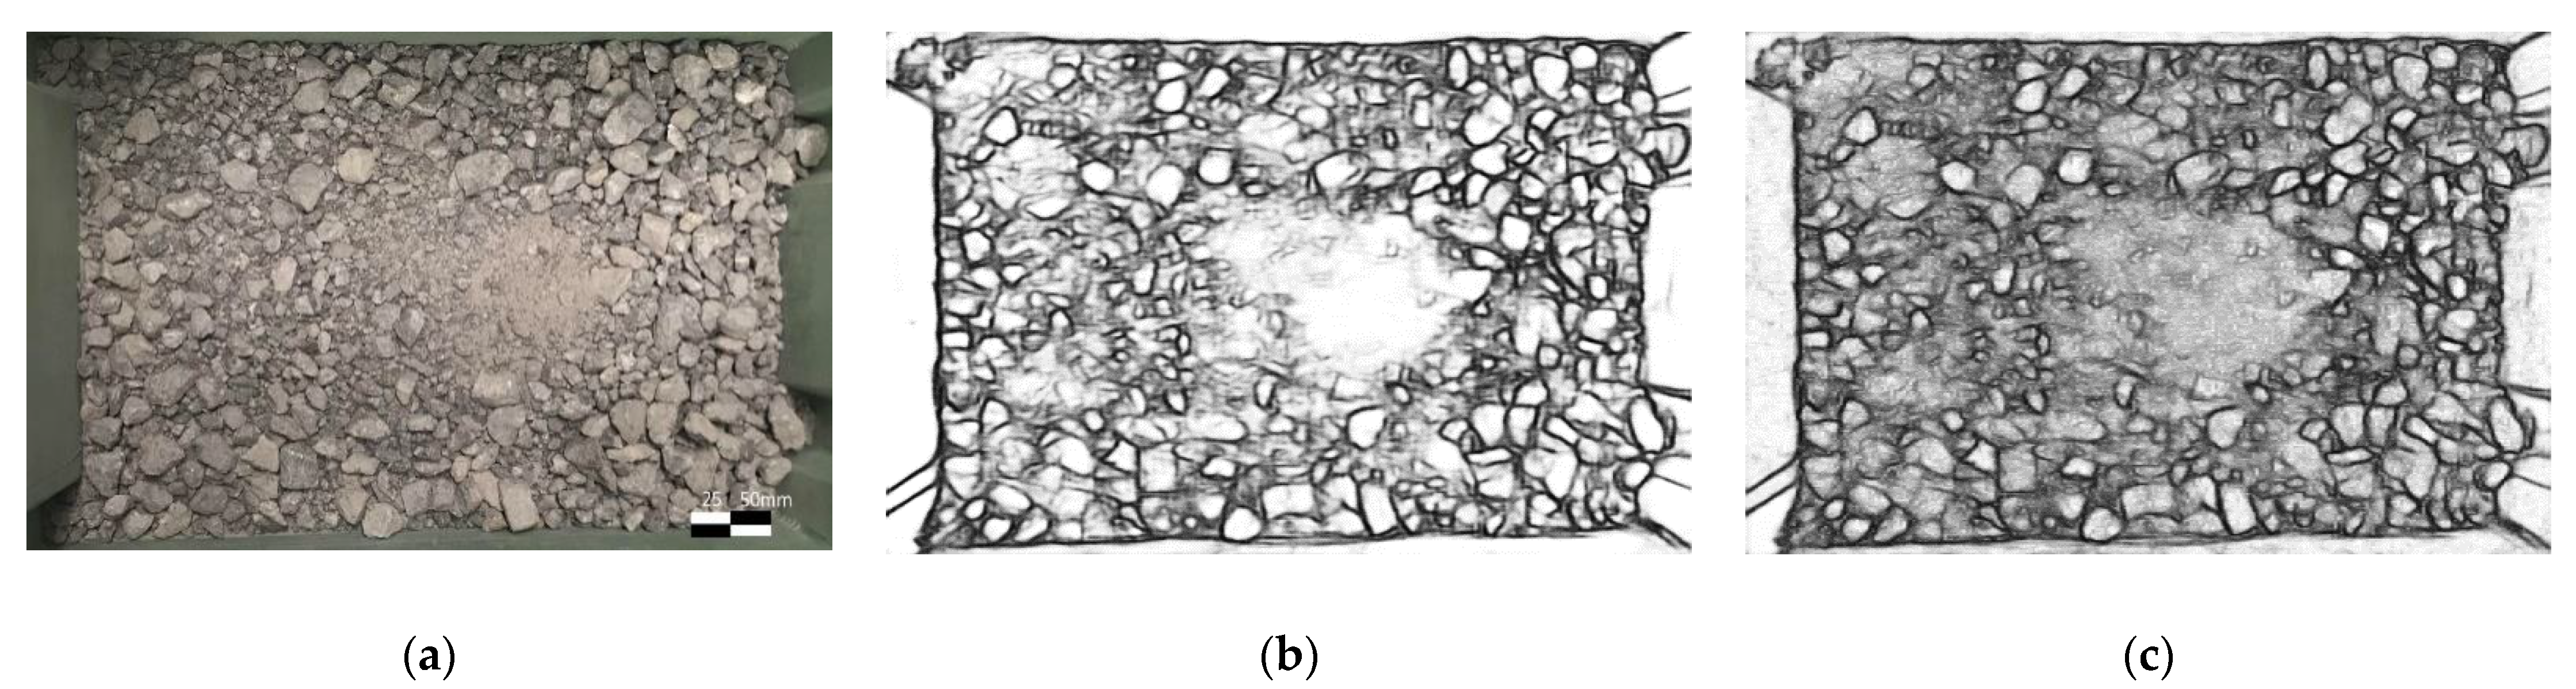
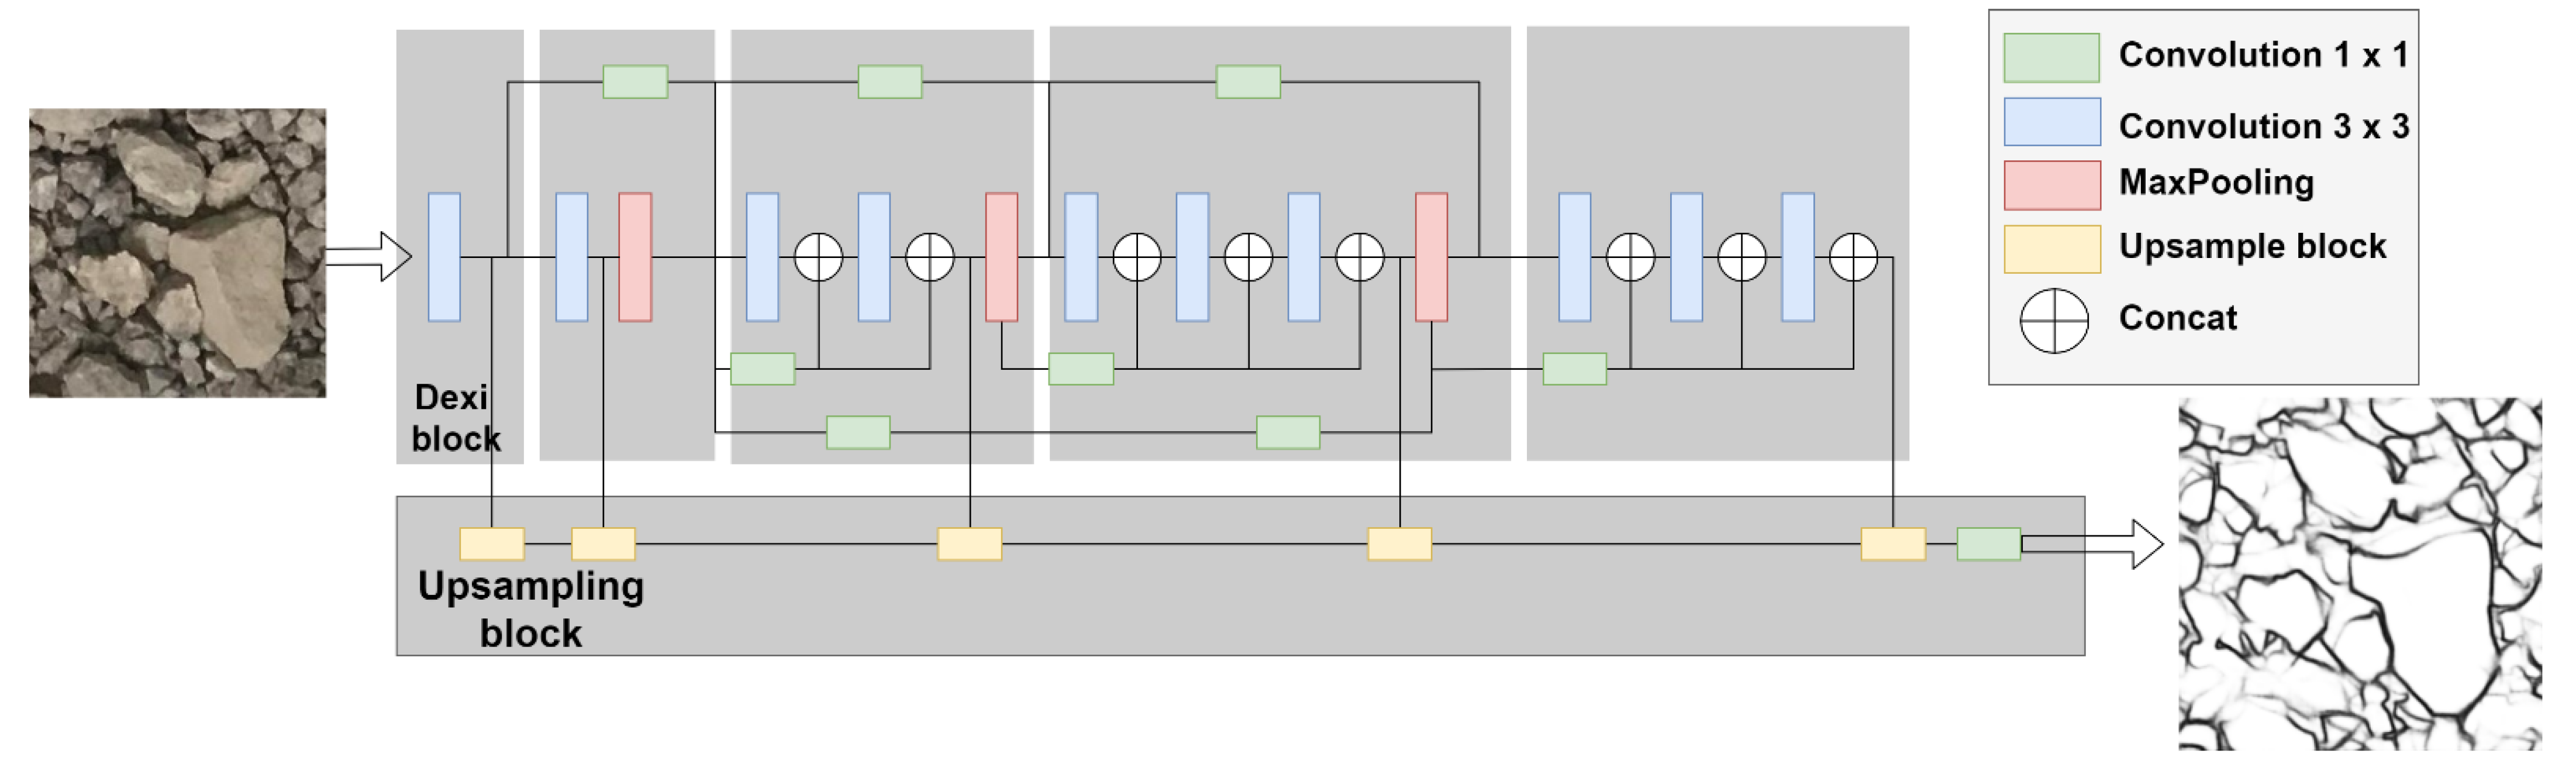
2.2. DexiNed-Based Boundary Detection
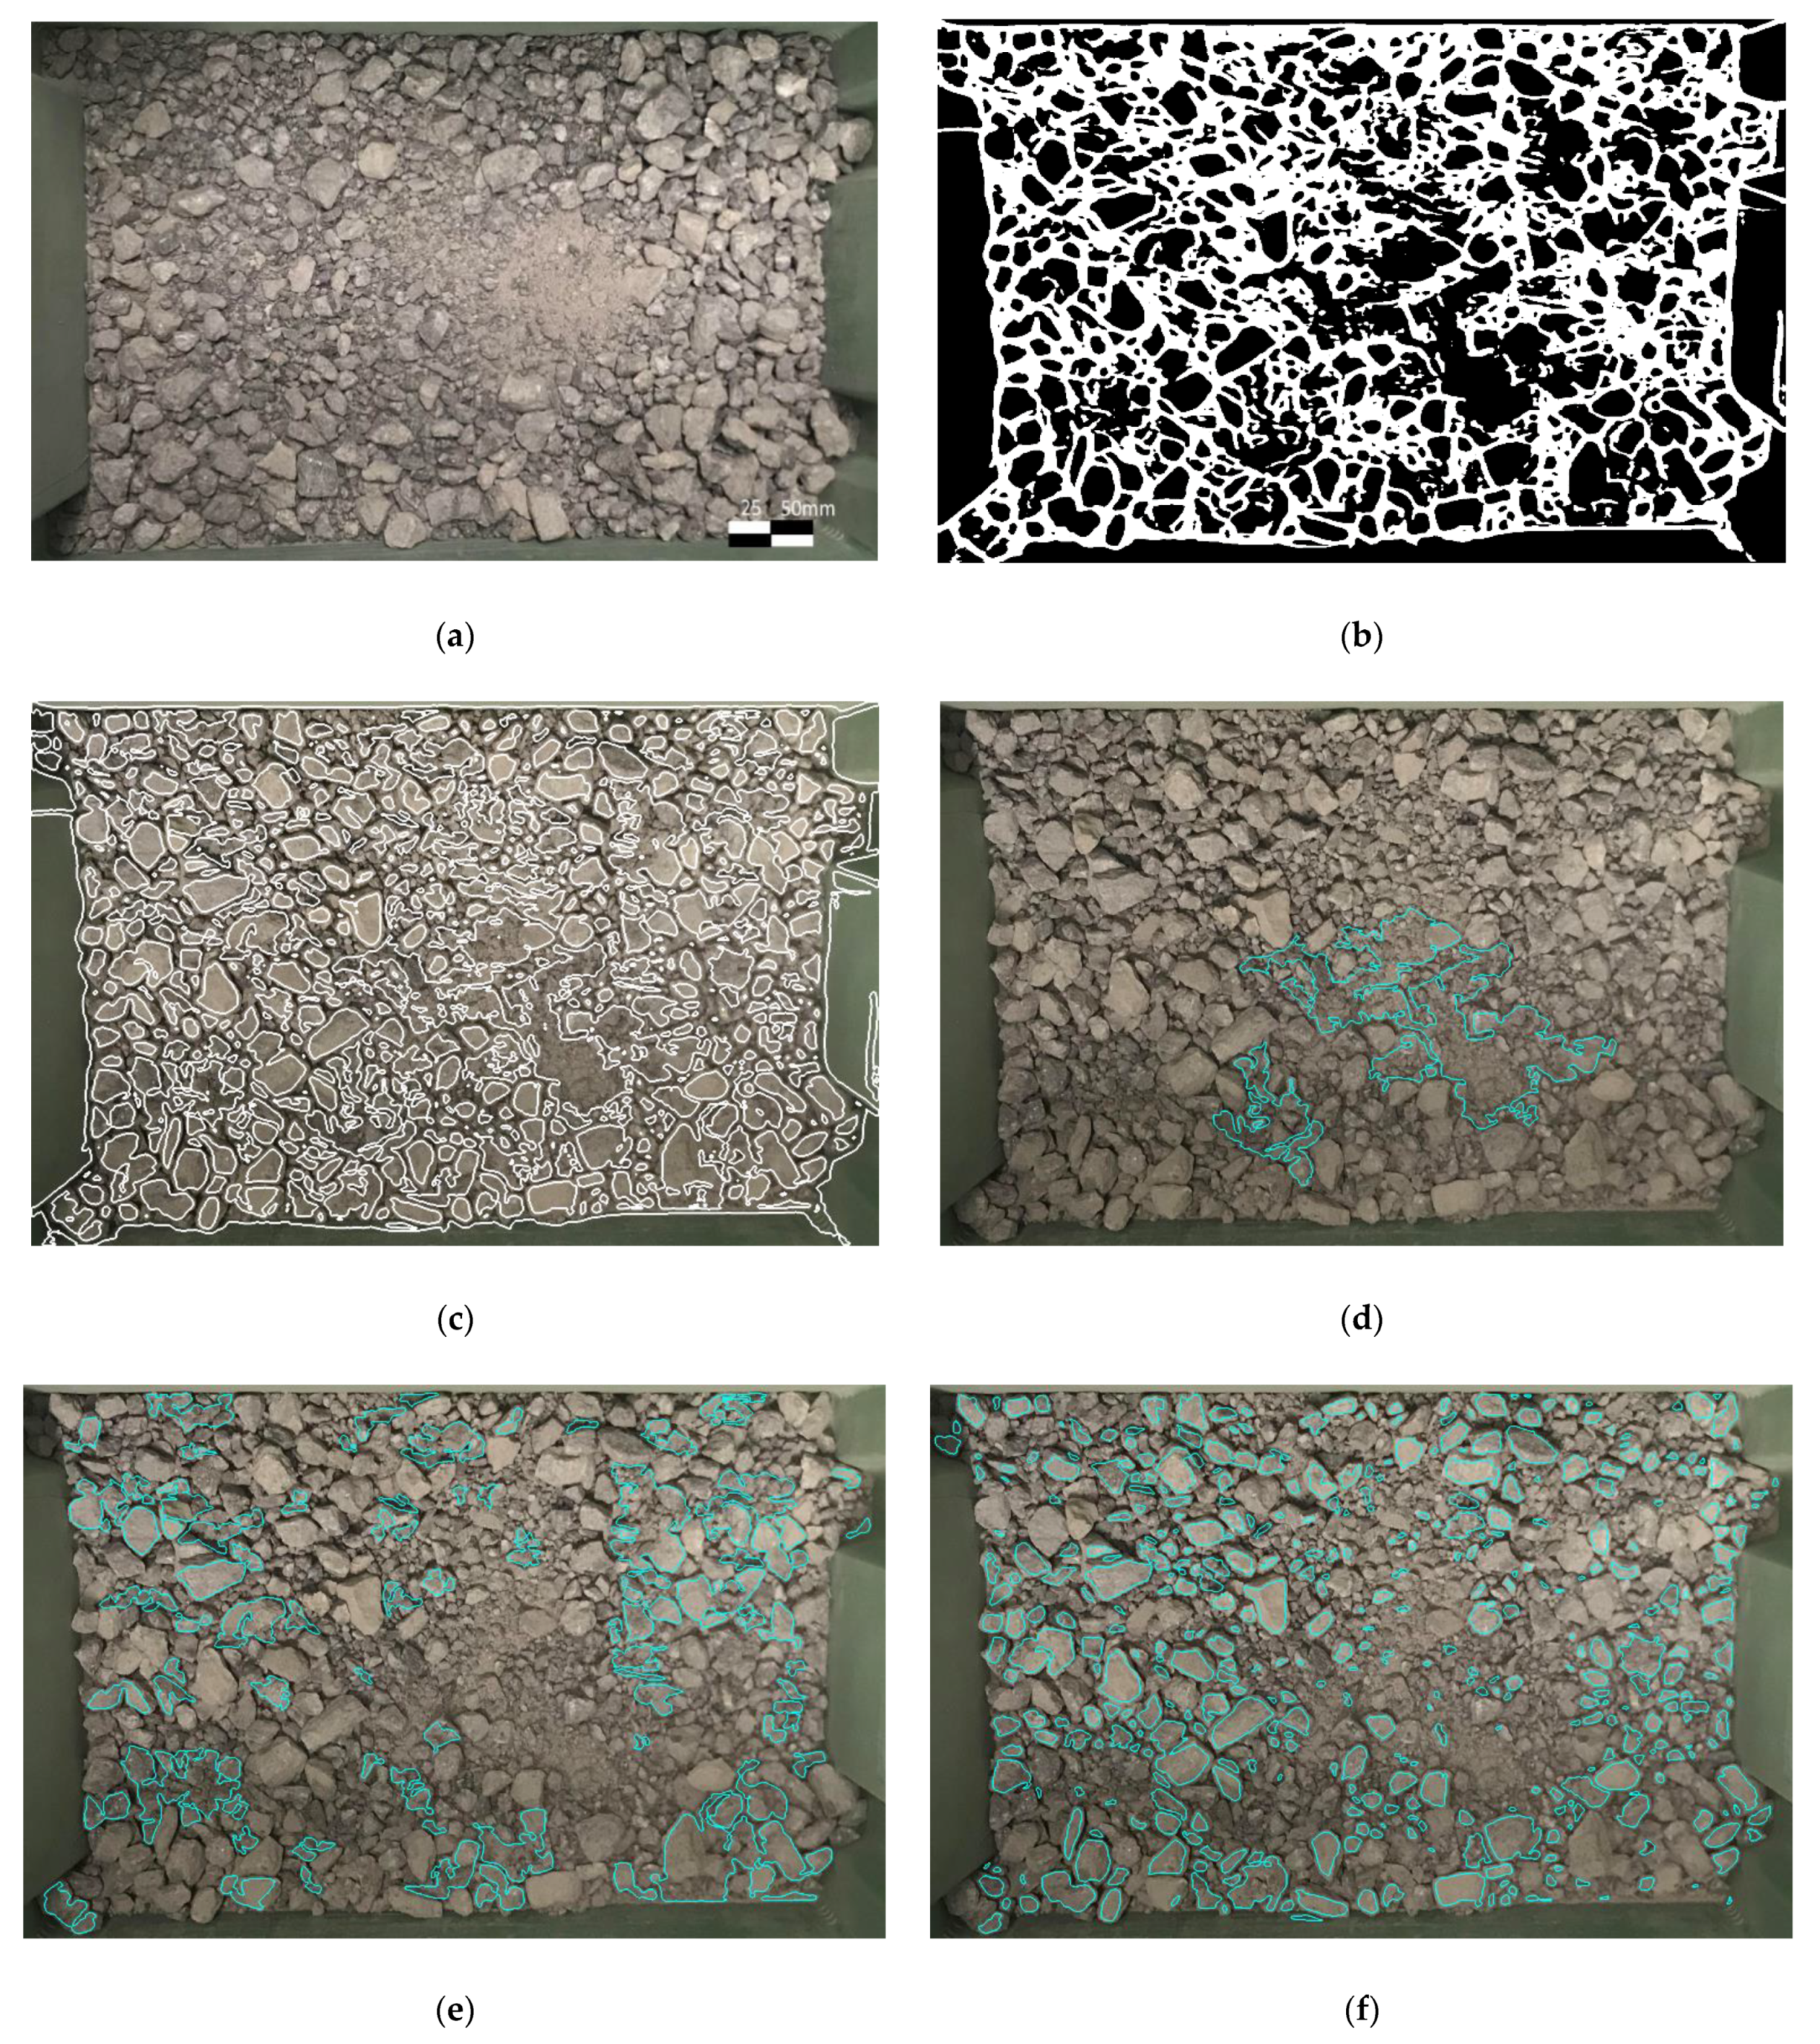
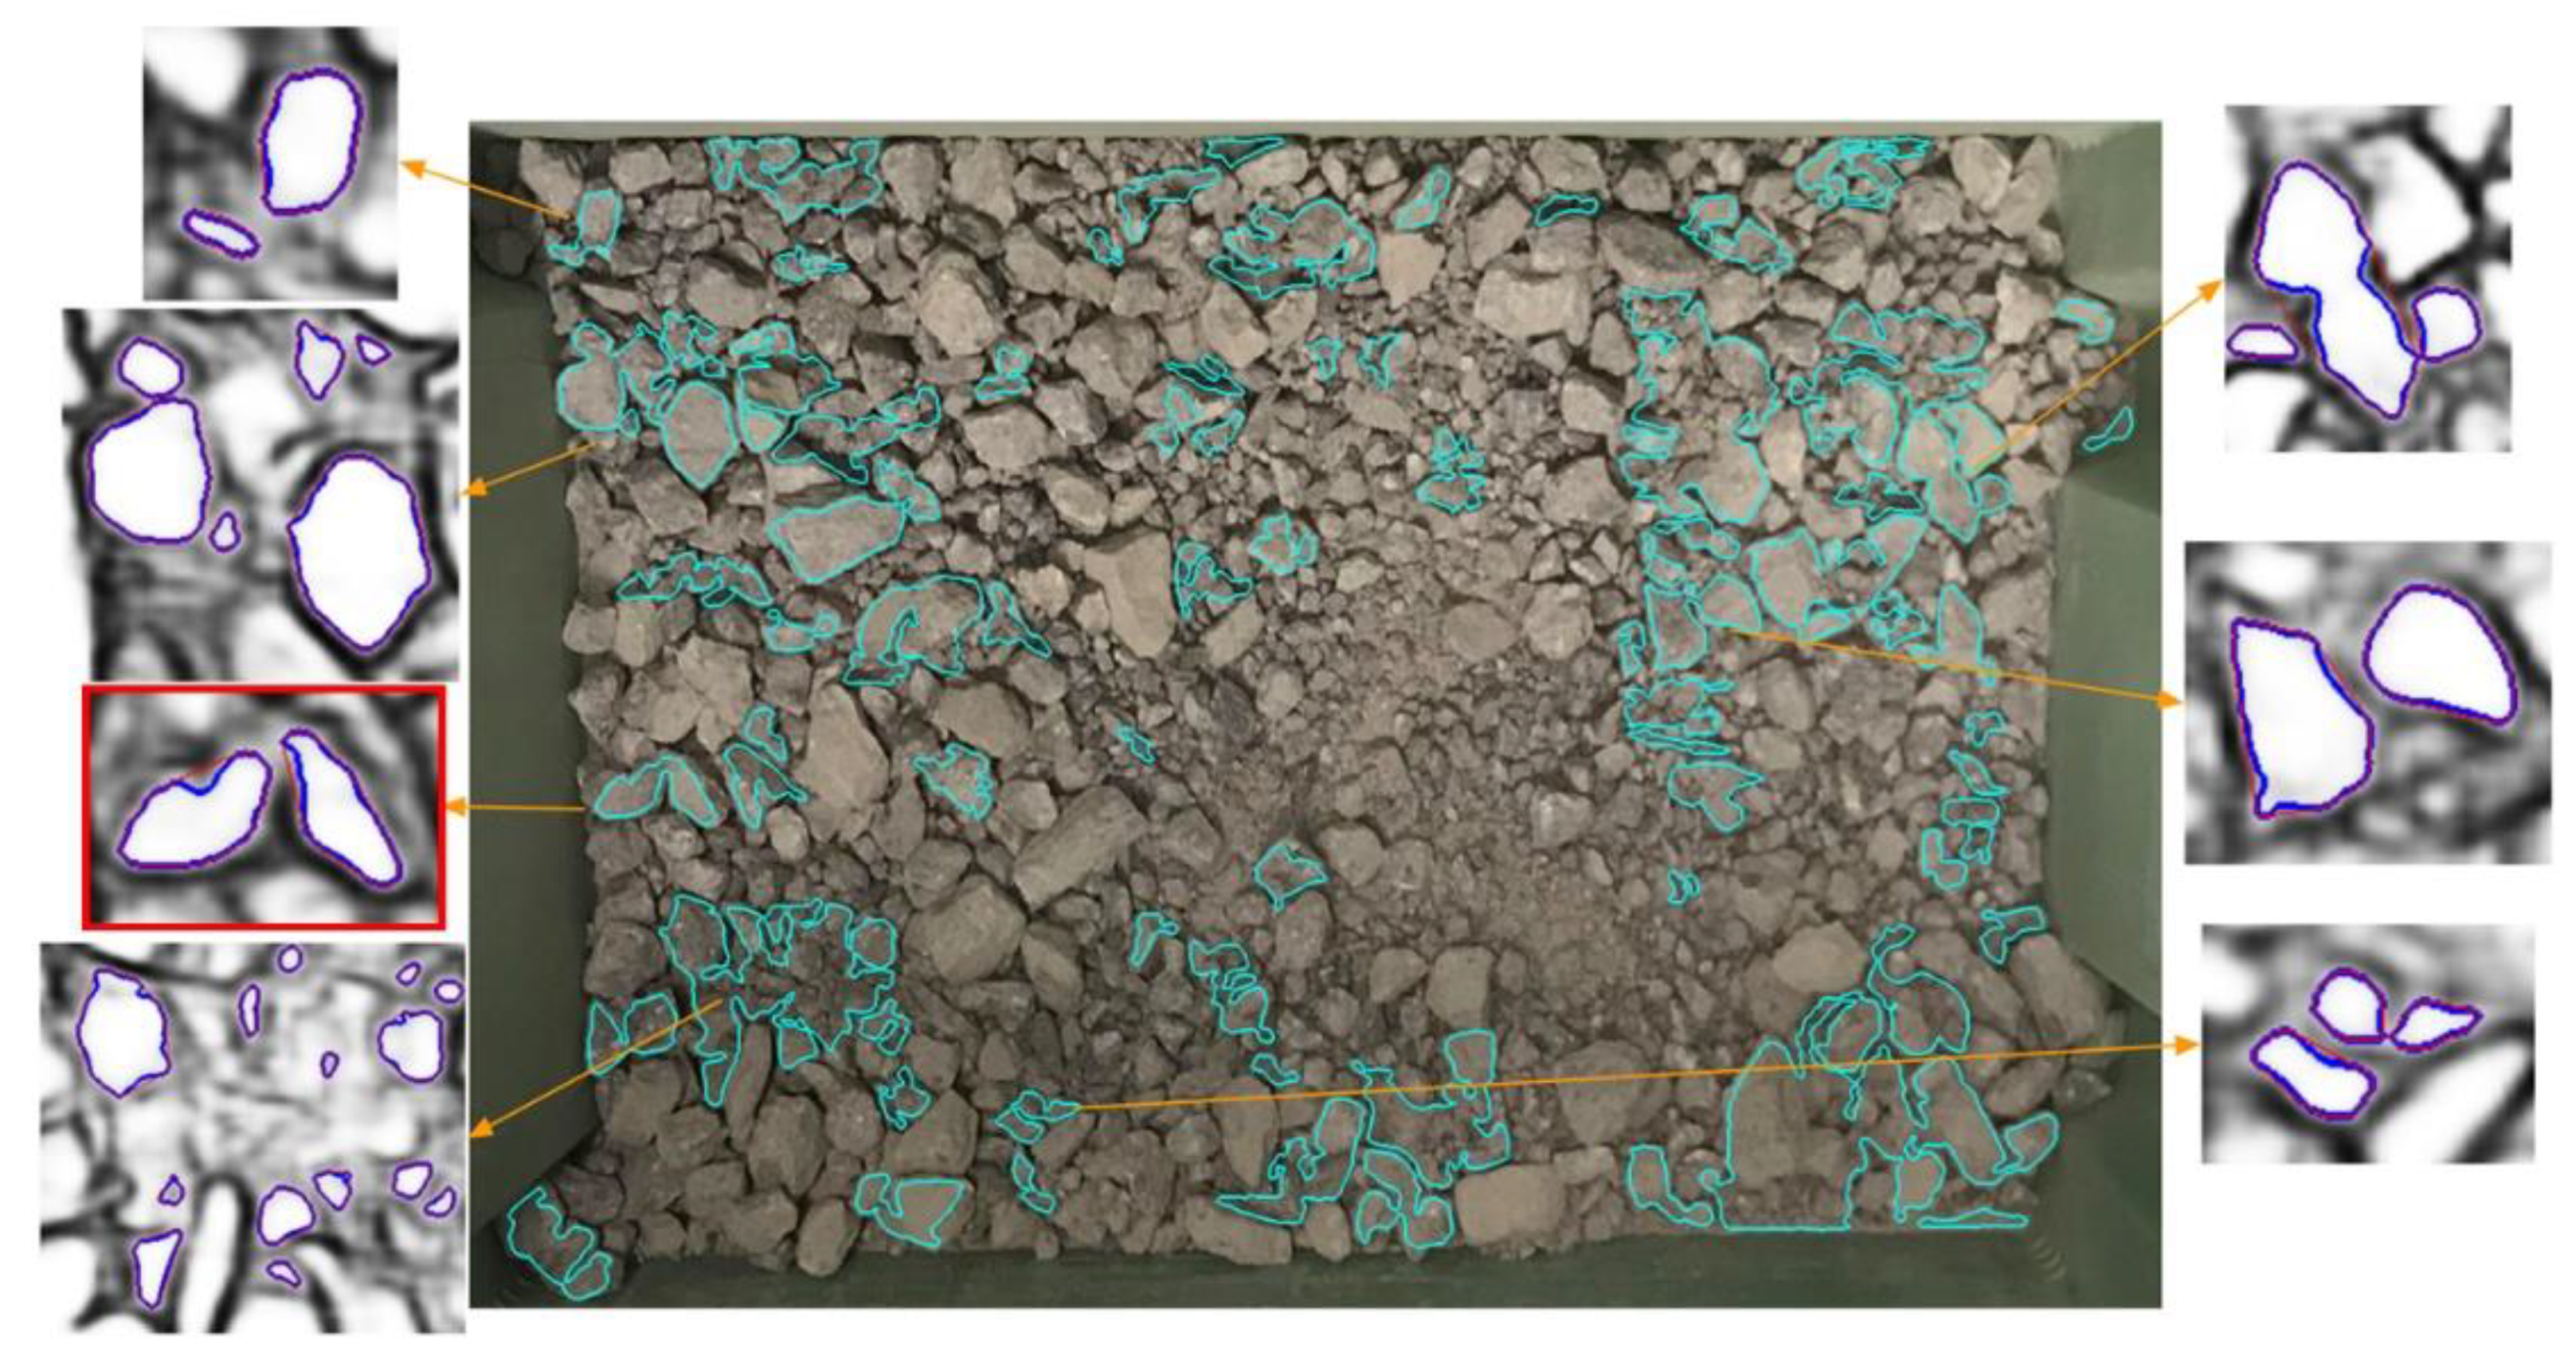
2.3. Segmentation Process
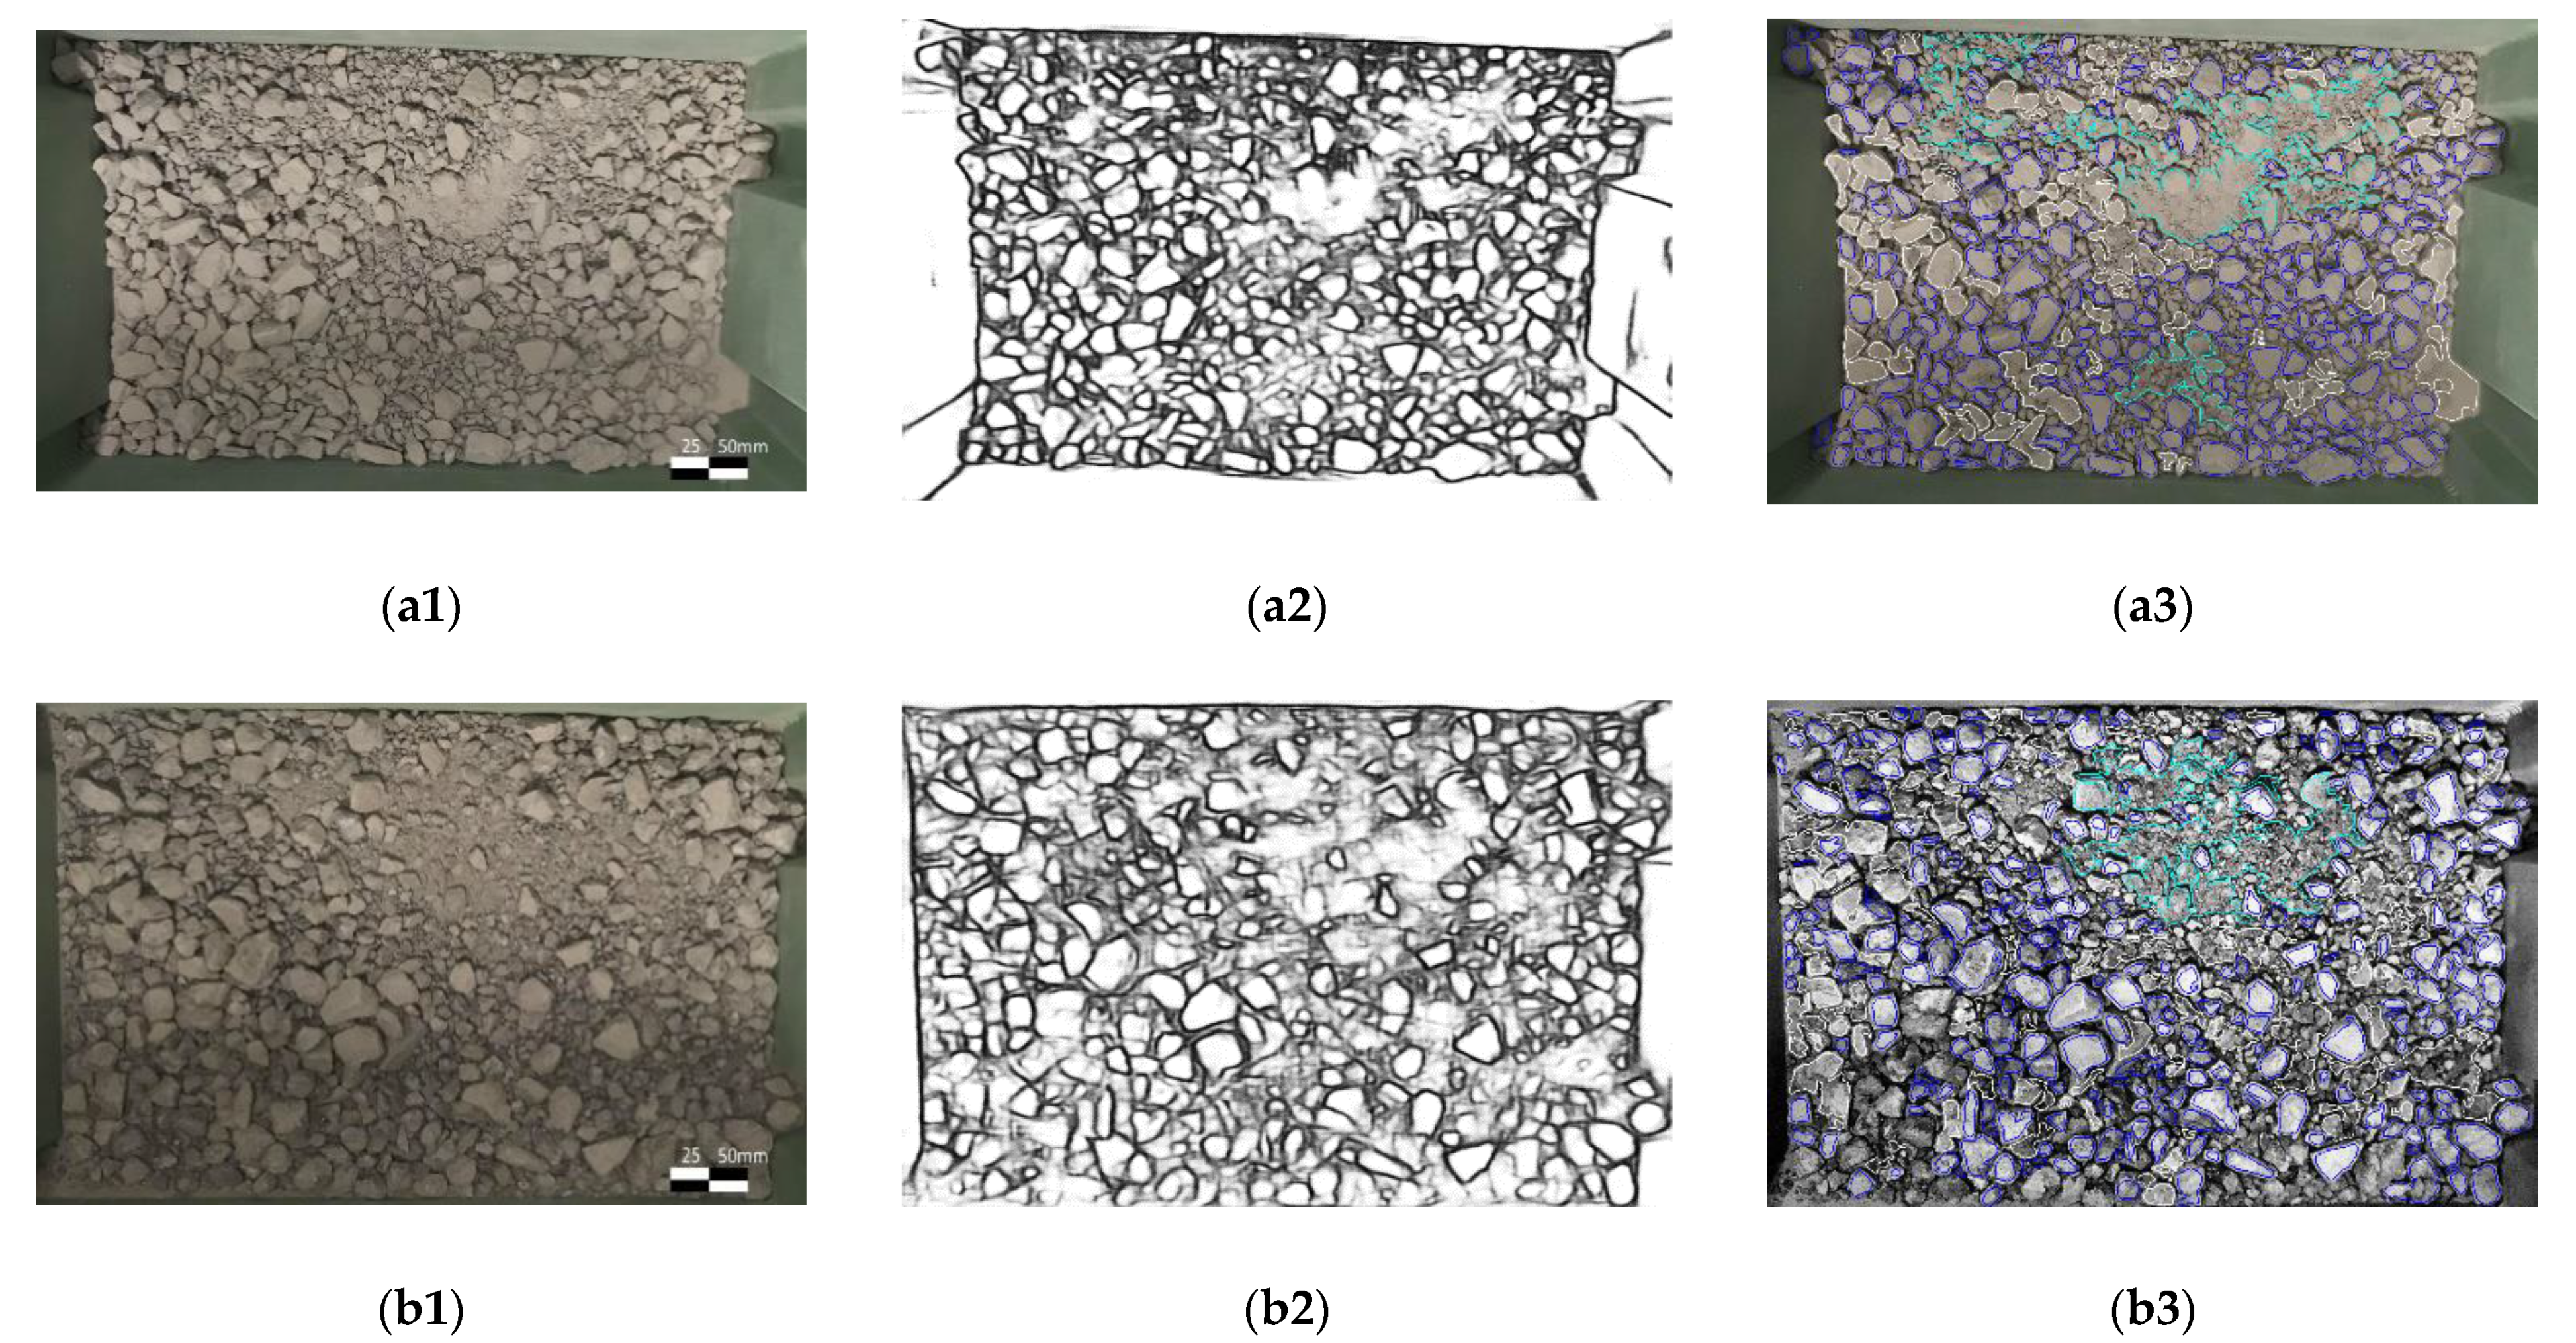
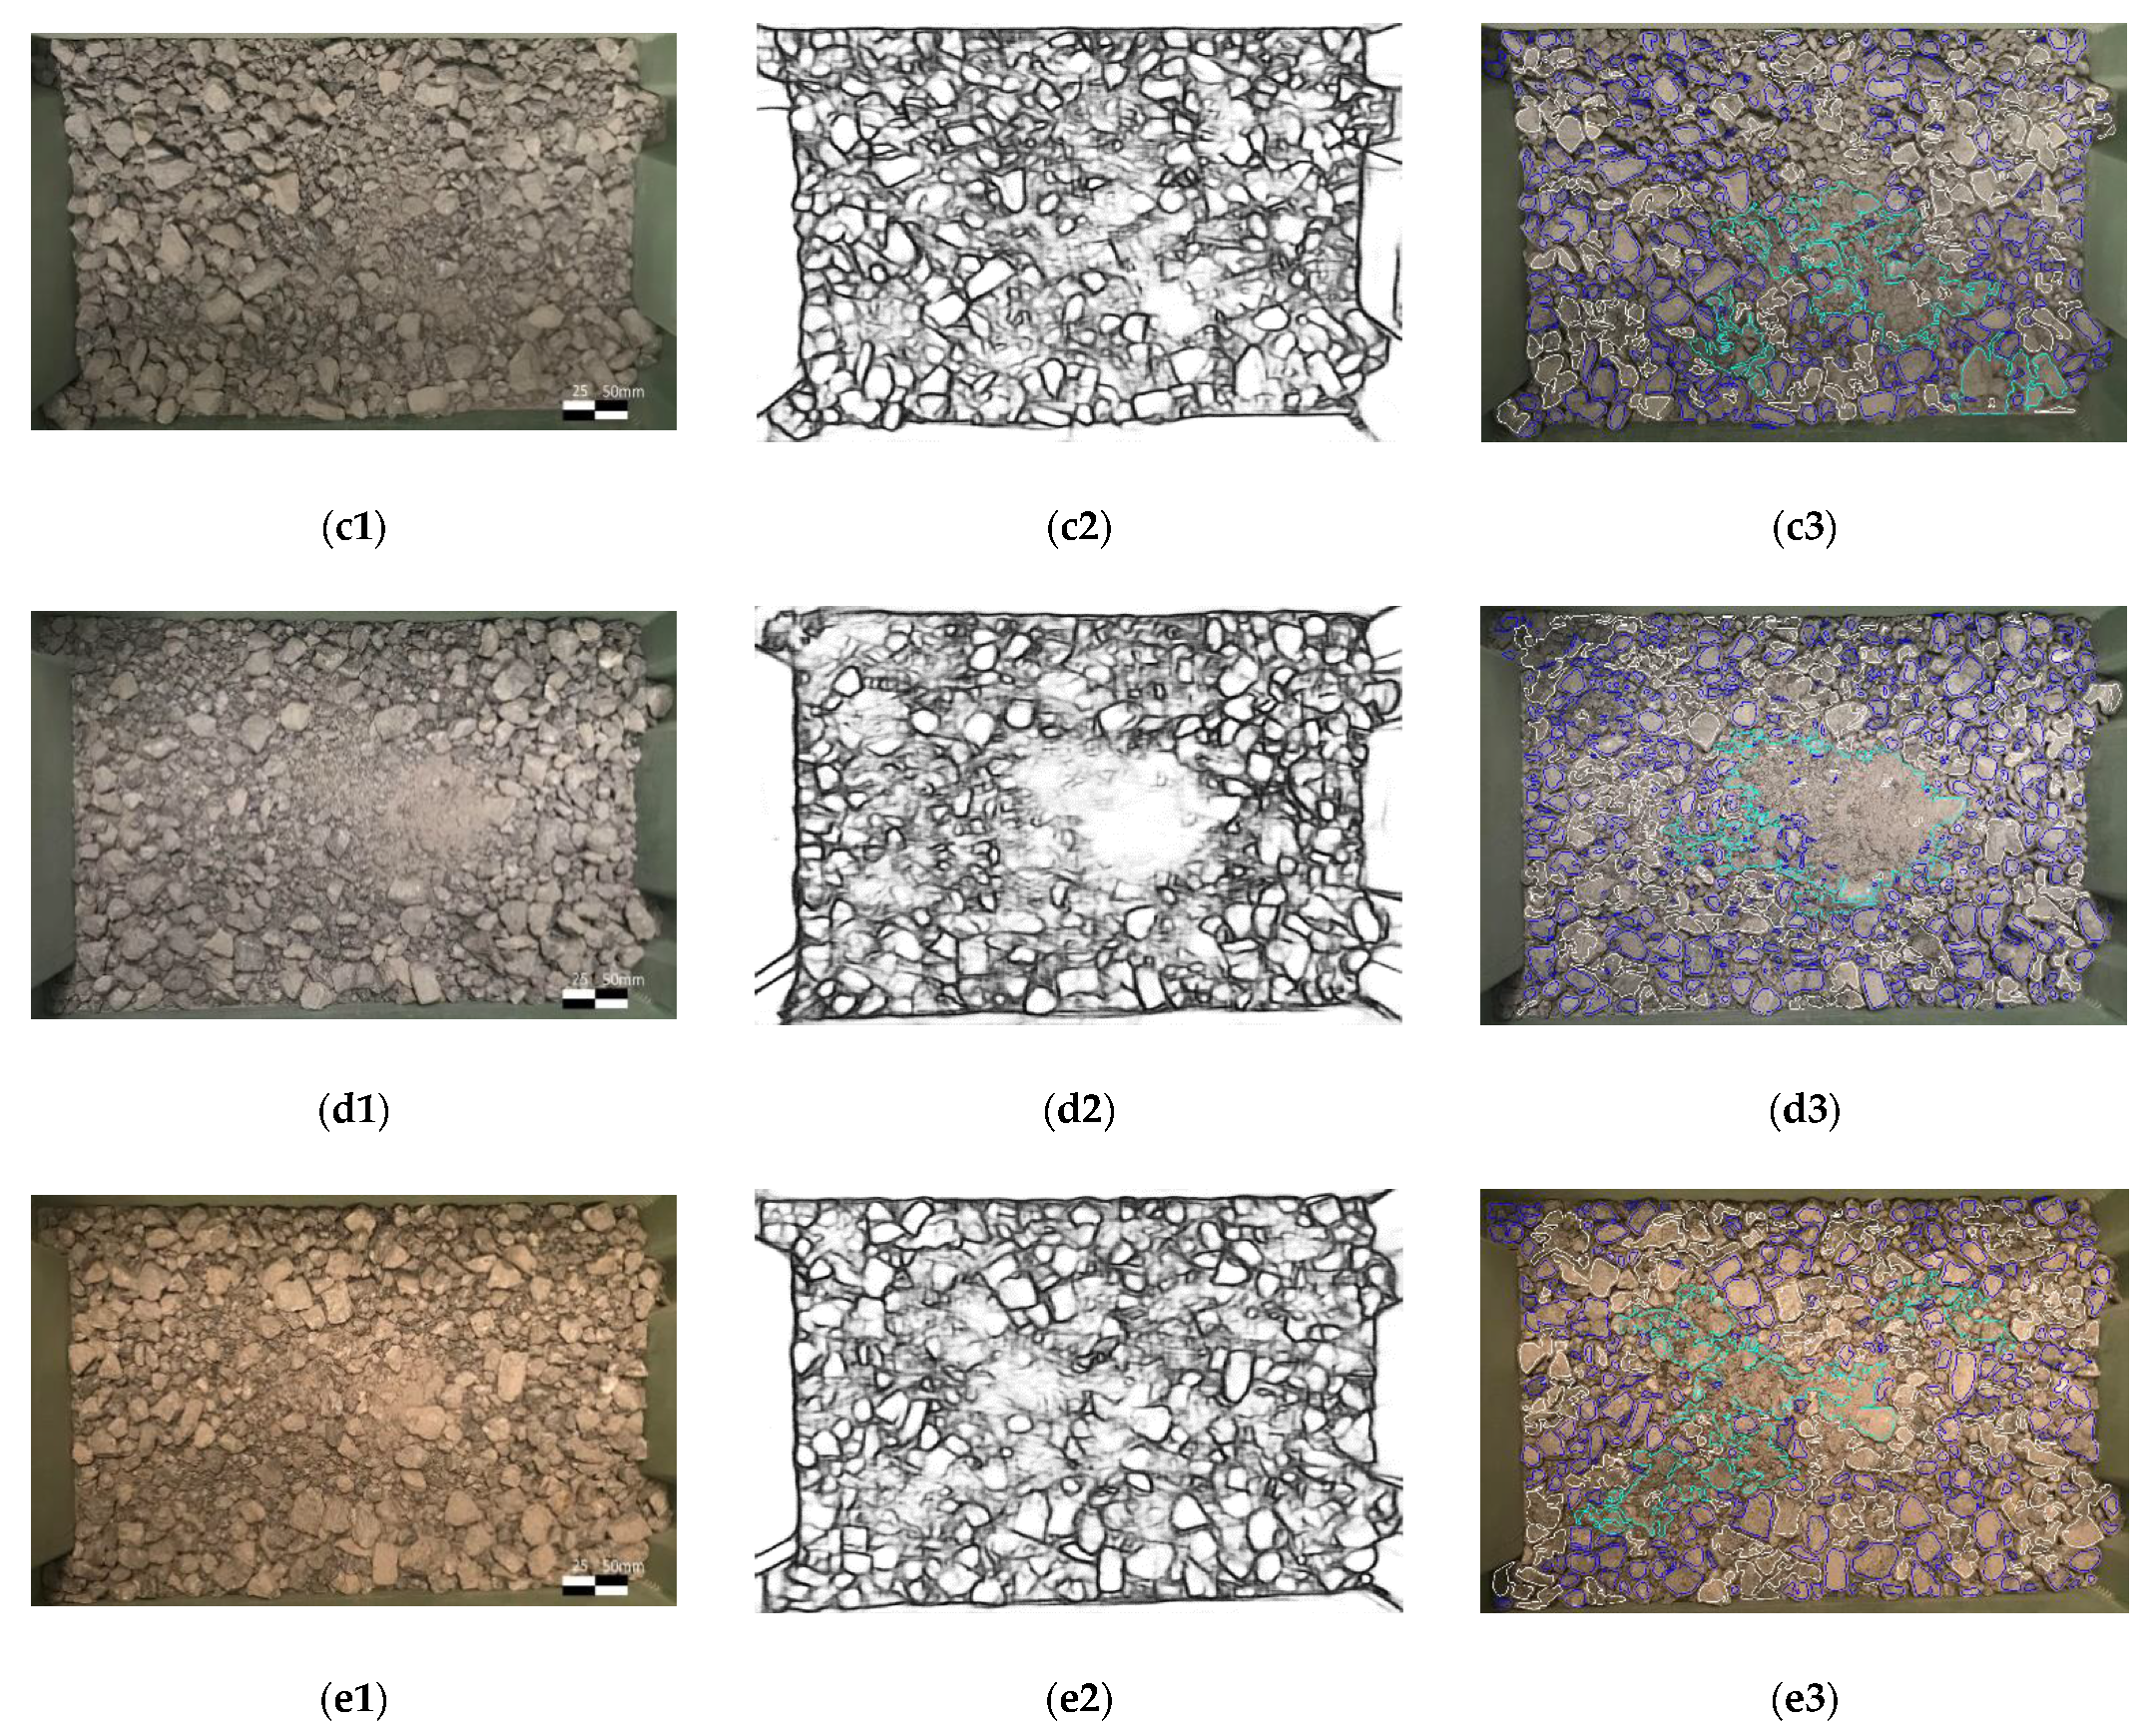
- Due to the uneven light conditions, even with the CLAHE enhancement, it is difficult to draw clear edges in the shadow;
- Binary threshold and morphological transformation remove background noises, see Figure 5b;
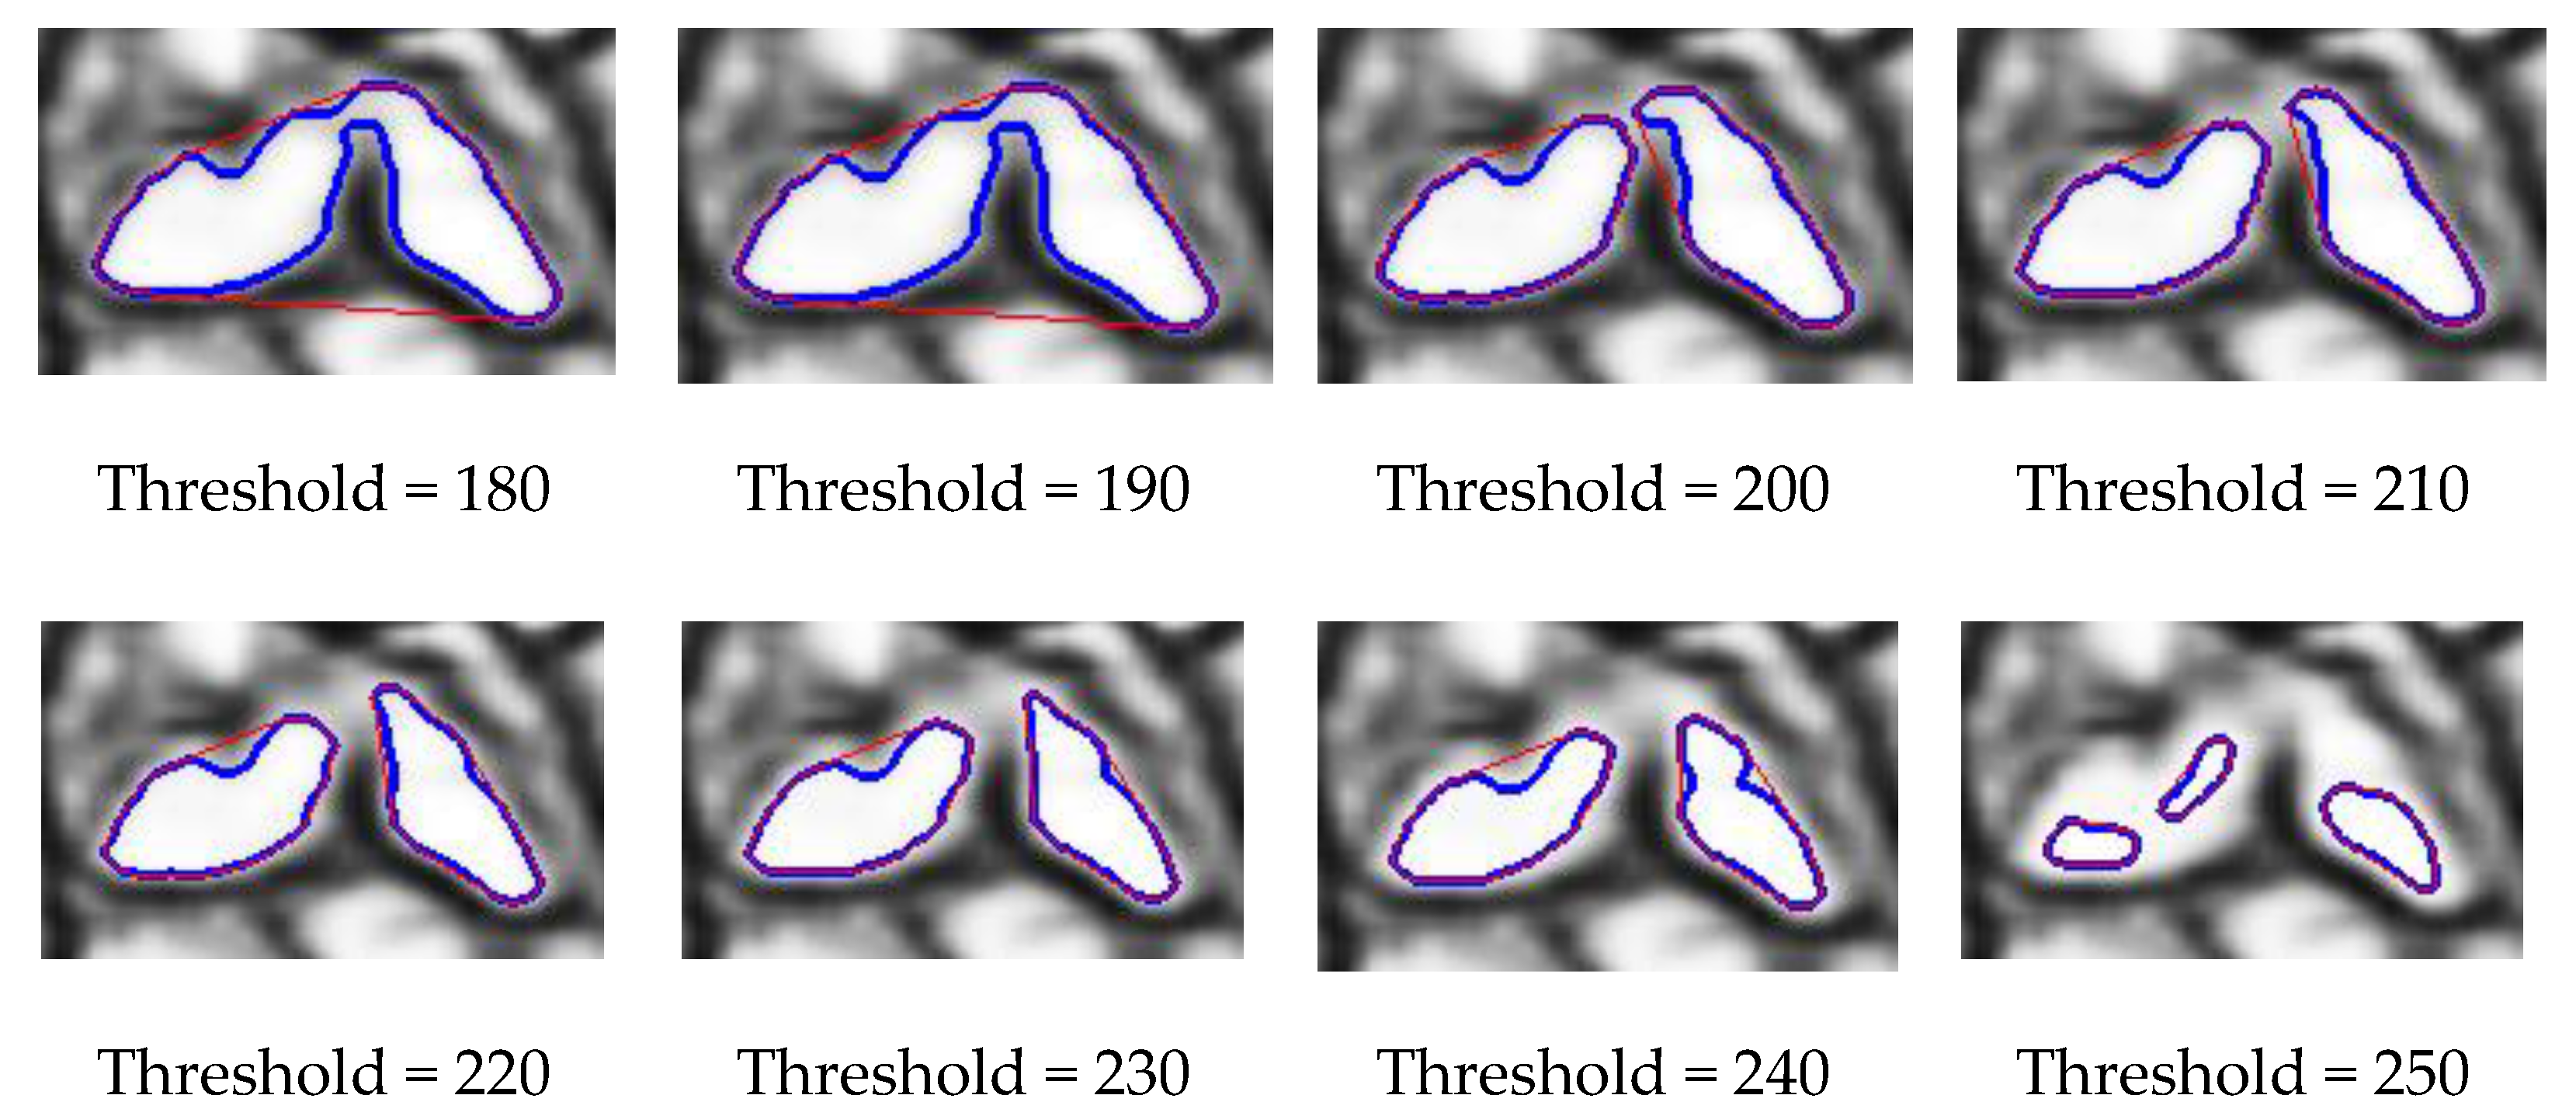
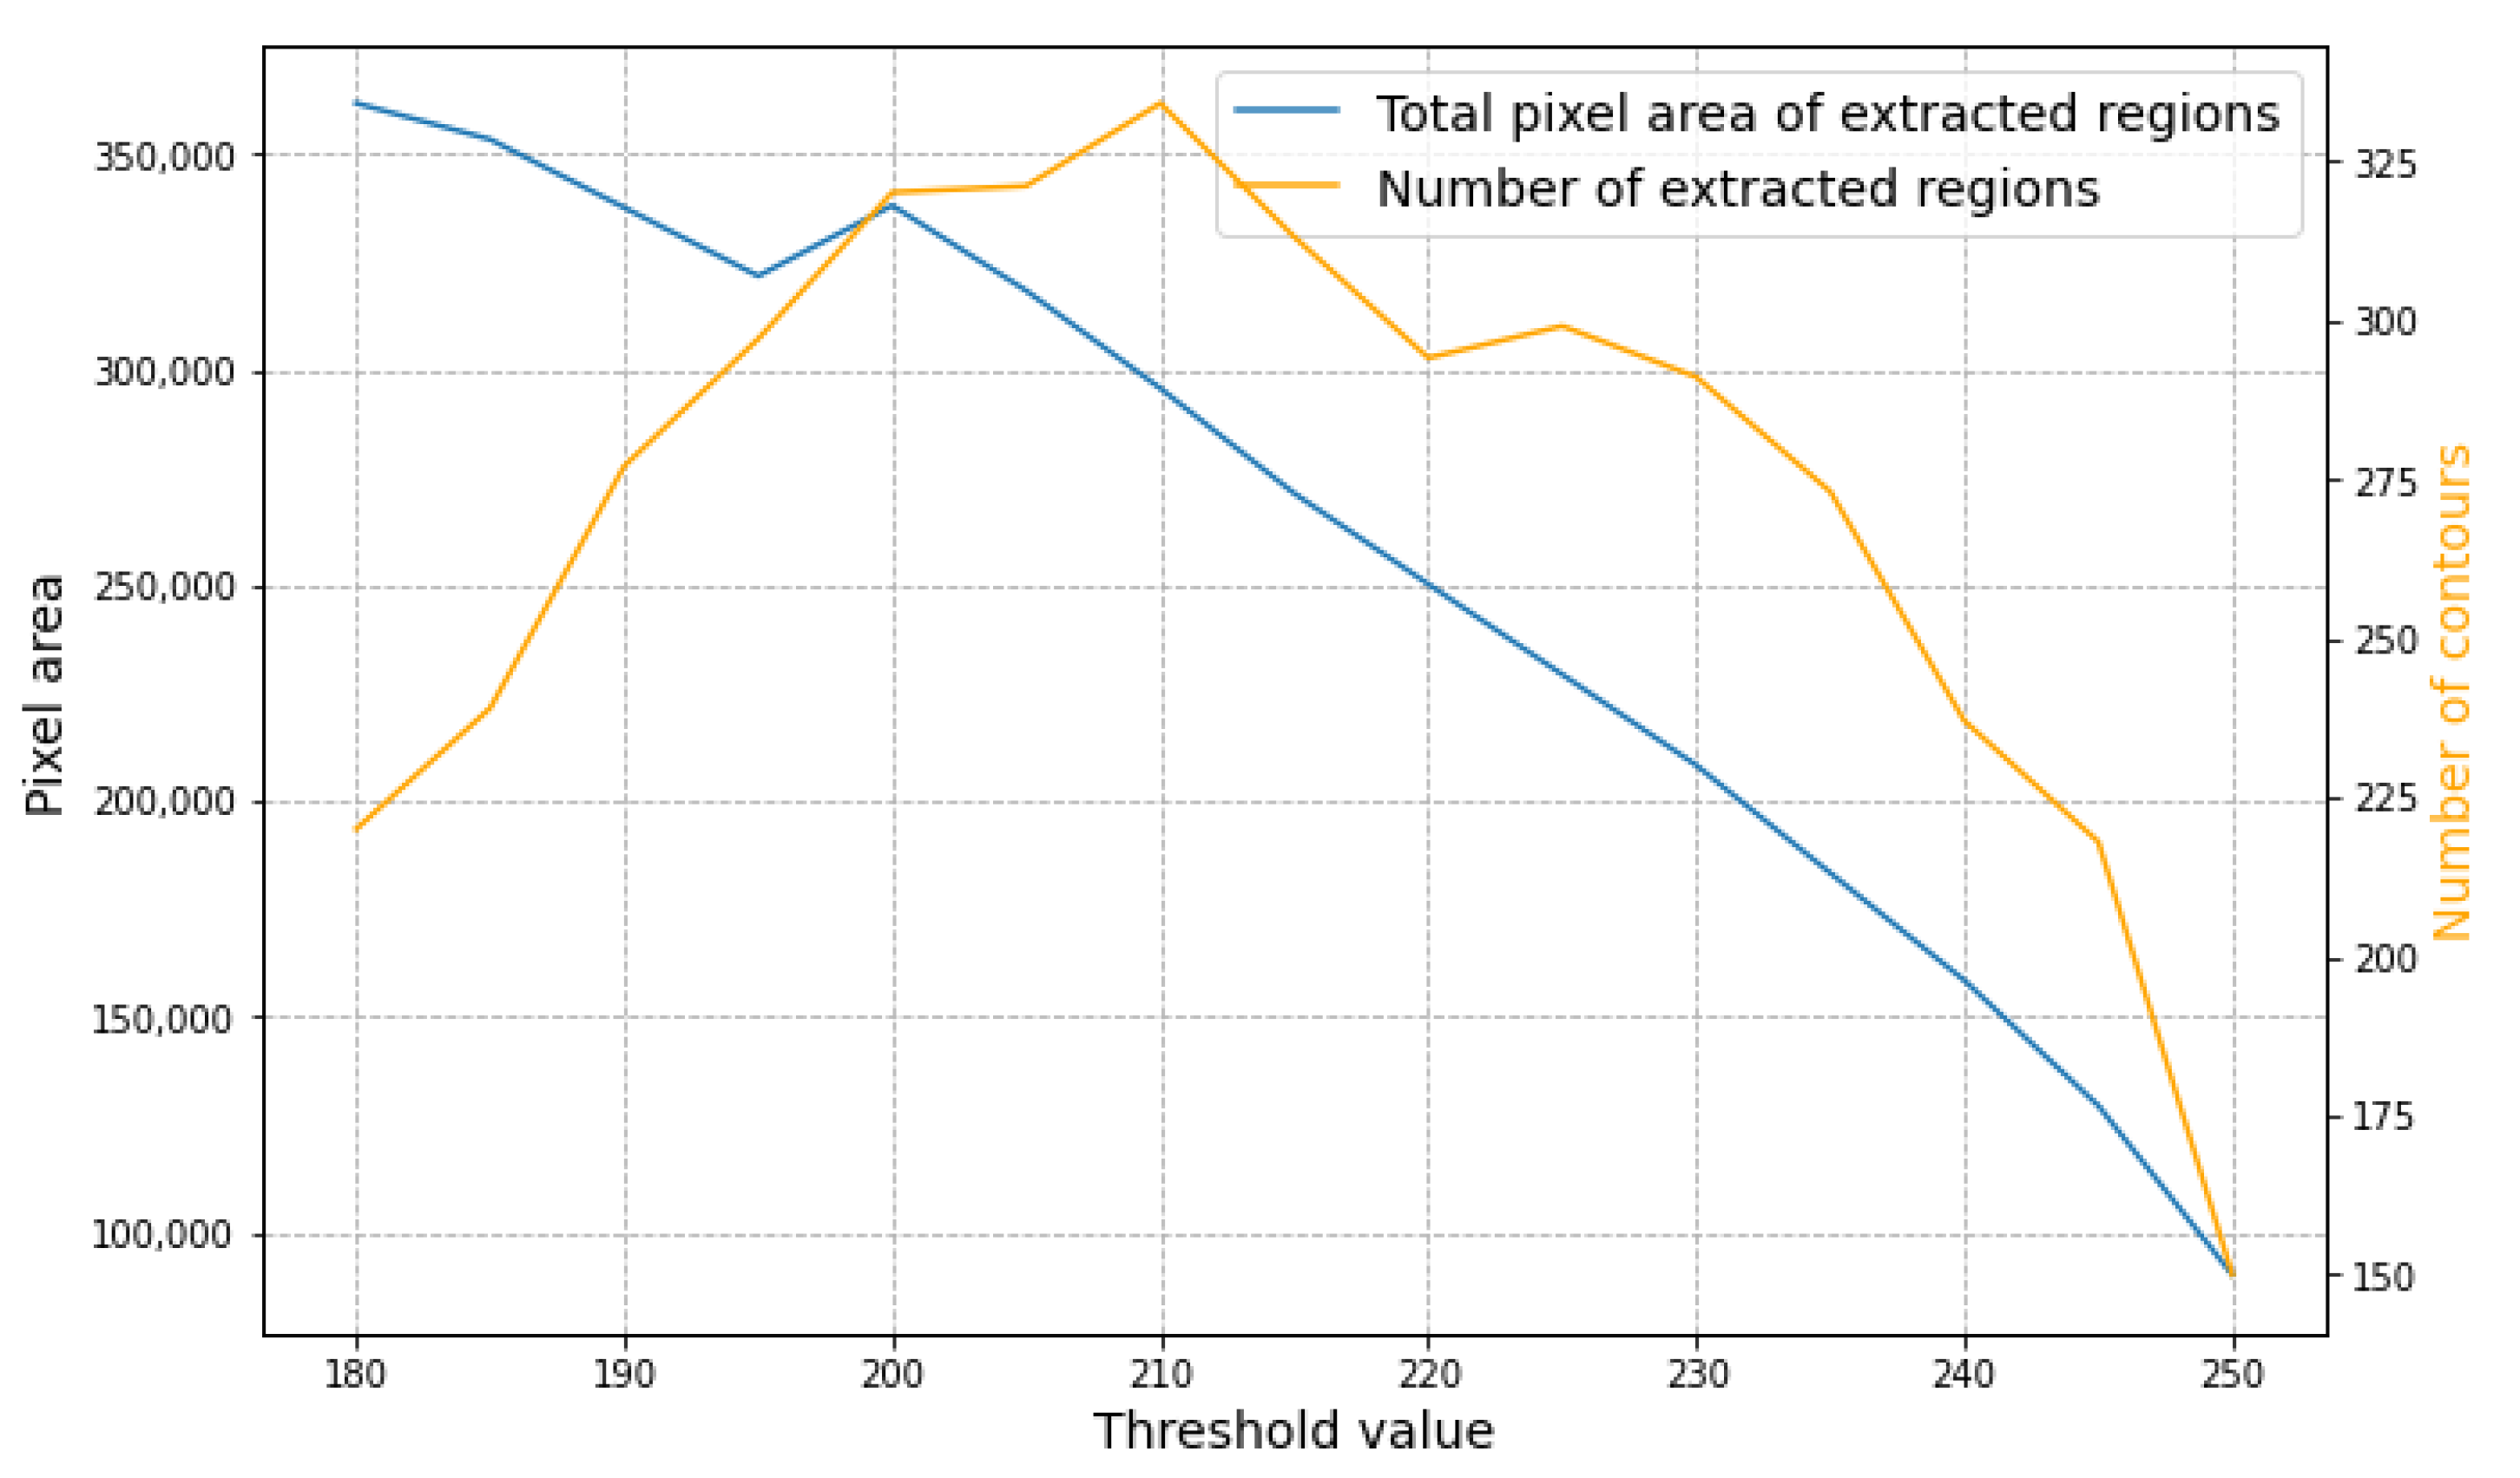
- The shape of the rocks is assumed convex while the visible part of overlapped rocks could be concave. So overlapped rocks are filtered by area ratio ;
- The hierarchy examination of each contour removes the children regions and parent regions.
3. Experimental Results and Discussion
3.1. Performance Evaluation
3.2. Result Analysis of Area and Mass Distribution
4. Conclusions
Author Contributions
Funding
Data Availability Statement
Acknowledgments
Conflicts of Interest
References
- Zhang, W.; Jiang, D. The marker-based watershed segmentation algorithm of ore image. In Proceedings of the 2011 IEEE 3rd International Conference on Communication Software and Networks, Xi’an, China, 27–29 May 2011; pp. 472–474. [Google Scholar]
- Amankwah, A.; Aldrich, C. Automatic ore image segmentation using mean shift and watershed transform. In Proceedings of the 21st International Conference Radioelektronika 2011, Brno, Czech Republic, 19–20 April 2011; pp. 1–4. [Google Scholar]
- Zhan, Y.; Zhang, G. An improved OTSU algorithm using histogram accumulation moment for ore segmentation. Symmetry 2019, 11, 431. [Google Scholar] [CrossRef] [Green Version]
- Lu, Z.M.; Zhu, F.C.; Gao, X.Y.; Chen, B.C.; Gao, Z.G. In-situ particle segmentation approach based on average background modeling and graph-cut for the monitoring of l-glutamic acid crystallization. Chemom. Intell. Lab. Syst. 2018, 178, 11–23. [Google Scholar] [CrossRef]
- Wang, W.; Li, Q.; Xiao, C.; Zhang, D.; Miao, L.; Wang, L. An Improved Boundary-Aware U-Net for Ore Image Semantic Segmentation. Sensors 2021, 21, 2615. [Google Scholar] [CrossRef] [PubMed]
- Yang, H.; Huang, C.; Wang, L.; Luo, X. An Improved Encoder-Decoder Network for Ore Image Segmentation. IEEE Sens. J. 2020, 21, 11469–11475. [Google Scholar] [CrossRef]
- Mukherjee, D.P.; Potapovich, Y.; Levner, I.; Zhang, H. Ore image segmentation by learning image and shape features. Pattern Recognit. Lett. 2009, 30, 615–622. [Google Scholar] [CrossRef]
- Yuan, L.; Duan, Y. A Method of Ore Image Segmentation Based on Deep Learning. In Proceedings of the International Conference on Intelligent Computing, Wuhan, China, 15–18 August 2018; pp. 508–519. [Google Scholar]
- Girshick, R.; Donahue, J.; Darrell, T.; Malik, J. Rich feature hierarchies for accurate object detection and semantic segmentation. In Proceedings of the IEEE Conference on Computer Vision and Pattern Recognition, Columbus, OH, USA, 23–28 June 2014; pp. 580–587. [Google Scholar]
- Ma, X.; Zhang, P.; Man, X.; Ou, L. A New Belt Ore Image Segmentation Method Based on the Convolutional Neural Network and the Image-Processing Technology. Minerals 2020, 10, 1115. [Google Scholar] [CrossRef]
- Ronneberger, O.; Fischer, P.; Brox, T. U-net: Convolutional networks for biomedical image segmentation. In Proceedings of the International Conference on Medical Image Computing and COMPUTER-Assisted Intervention, Munich, Germany, 5–9 October 2015; pp. 234–241. [Google Scholar]
- Liu, X.; Zhang, Y.; Jing, H.; Wang, L.; Zhao, S. Ore image segmentation method using U-Net and Res_Unet convolutional networks. RSC Adv. 2020, 10, 9396–9406. [Google Scholar] [CrossRef] [Green Version]
- Poma, X.S.; Riba, E.; Sappa, A. Dense extreme inception network: Towards a robust cnn model for edge detection. In Proceedings of the IEEE/CVF Winter Conference on Applications of Computer Vision, Snowmass, CO, USA, 1–5 March 2020; pp. 1923–1932. [Google Scholar]
- Tian, Z.; Chen, D.; Liu, S.; Liu, F. DexiNed-based Aluminum Alloy Grain Boundary Detection Algorithm. In Proceedings of the 2020 Chinese Control and Decision Conference (CCDC), Hefei, China, 22–24 August 2020; pp. 5647–5652. [Google Scholar]


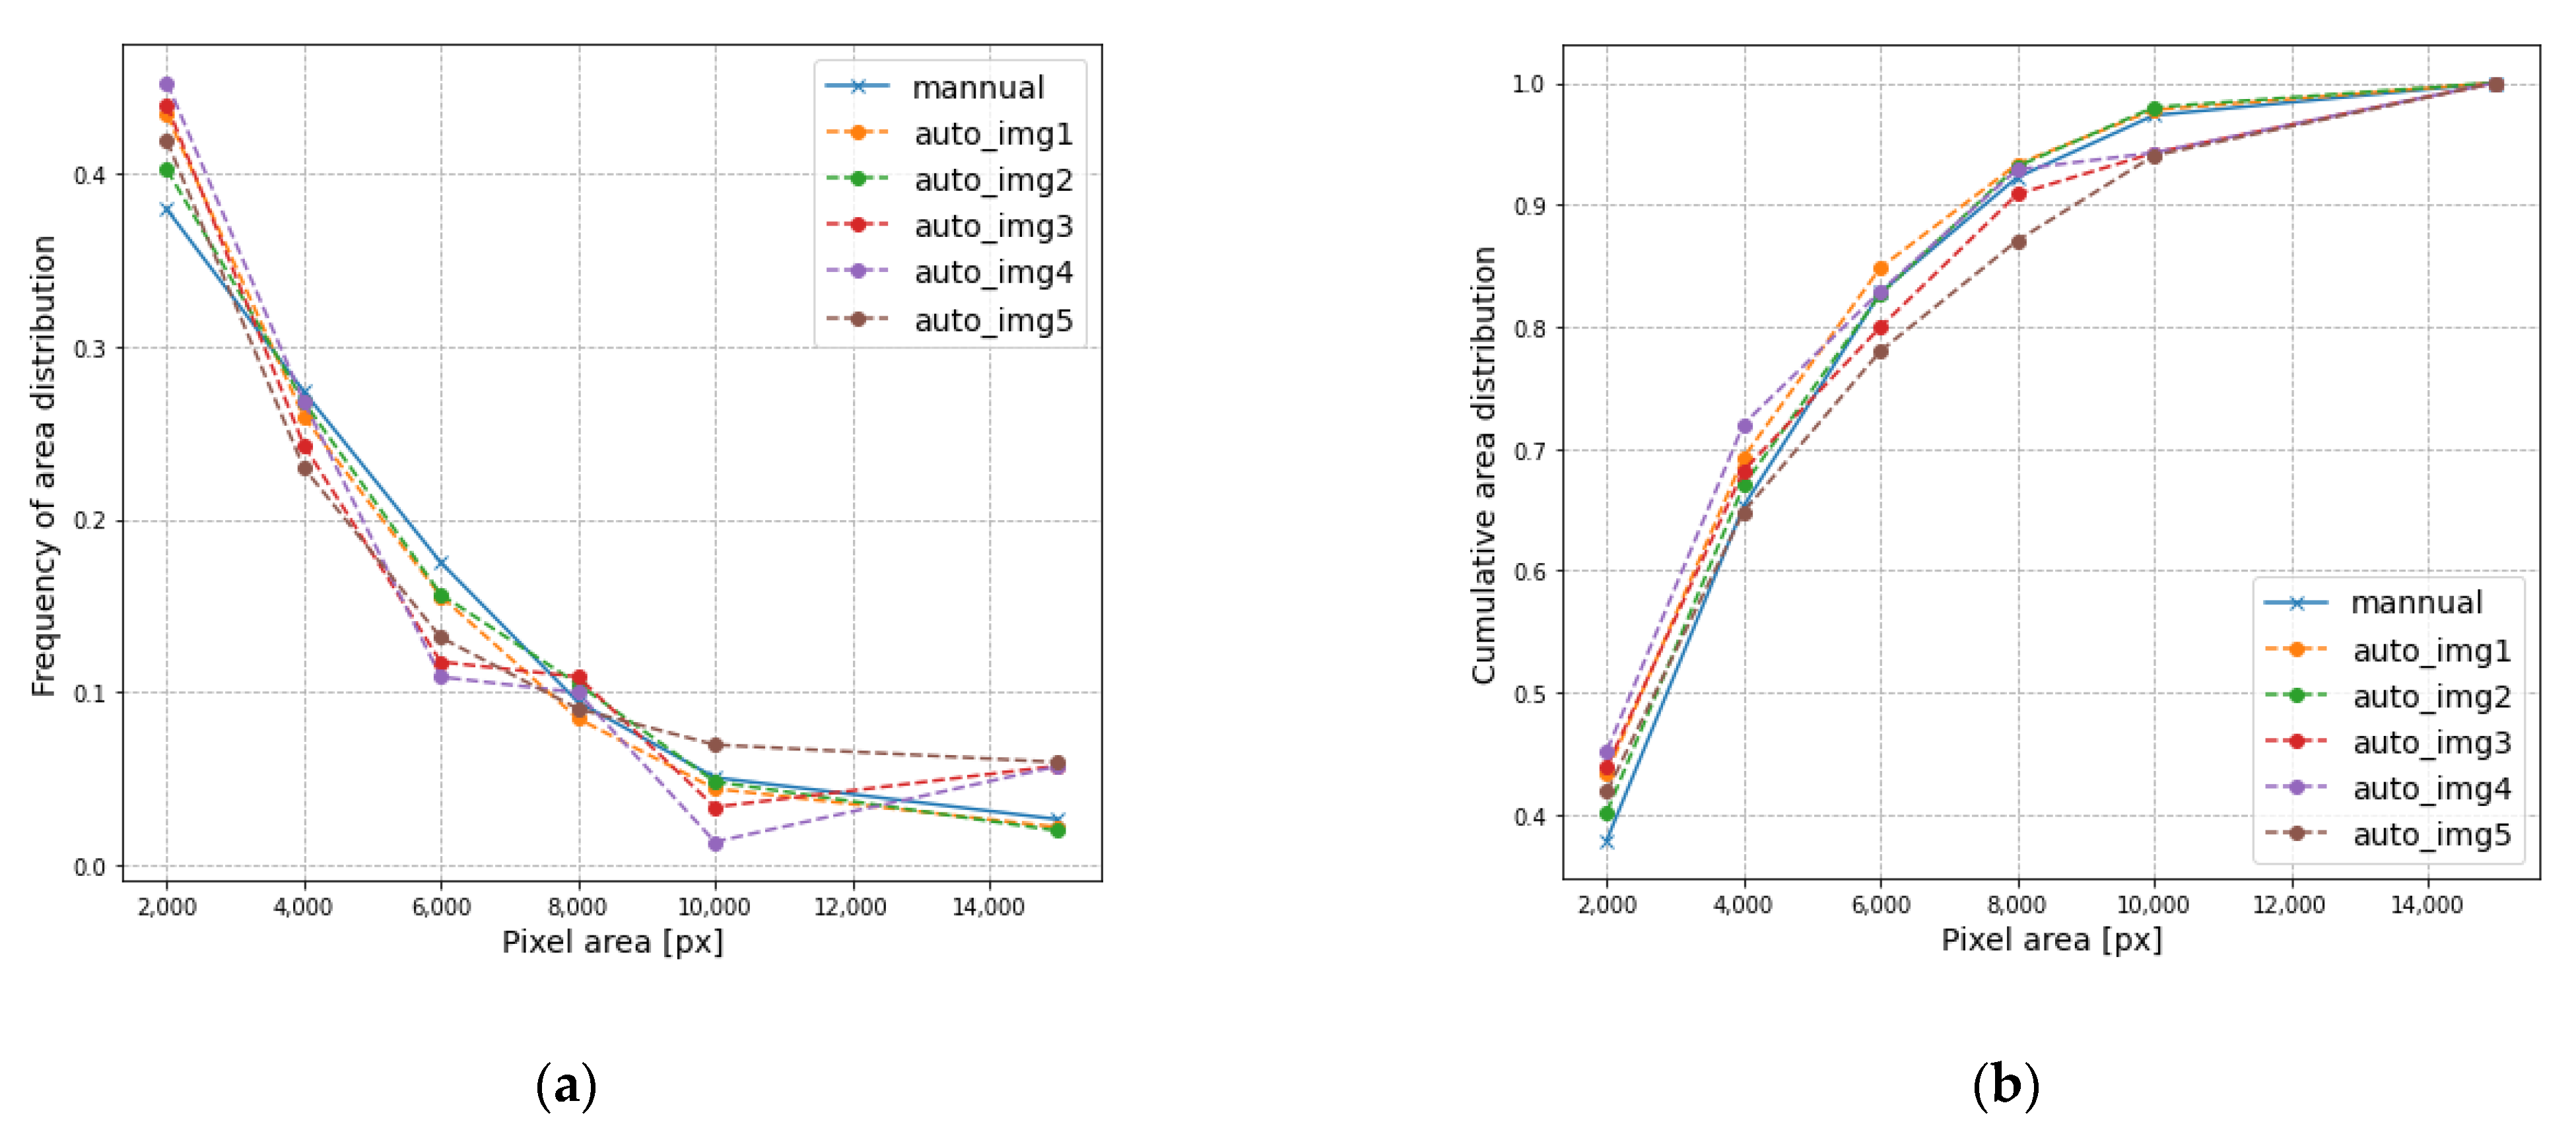
| Image No. | Frequency of Pixel Area Distribution (%) | |||||
|---|---|---|---|---|---|---|
| 2000 | 4000 | 6000 | 8000 | 10,000 | >10,000 | |
| Image 1 | 43.4 | 25.9 | 15.6 | 8.5 | 4.4 | 2.2 |
| Image 2 | 40.2 | 26.8 | 15.7 | 10.5 | 4.8 | 2.0 |
| Image 3 | 43.9 | 24.3 | 11.8 | 10.9 | 3.4 | 5.8 |
| Image 4 | 45.2 | 26.8 | 10.9 | 10.0 | 1.4 | 5.7 |
| Image 5 | 41.9 | 23.0 | 13.1 | 9.5 | 7.0 | 5.9 |
| Image 1-Manual | 37.9 | 27.4 | 17.5 | 9.5 | 5.1 | 2.7 |
| Image No. | Cumulative Pixel Area Distribution (%) | |||||
|---|---|---|---|---|---|---|
| 2000 | 4000 | 6000 | 8000 | 10,000 | >10,000 | |
| Image 1 | 43.4 | 69.3 | 84.8 | 93.3 | 97.8 | 100 |
| Image 2 | 40.2 | 67.0 | 82.6 | 93.1 | 98.0 | 100 |
| Image 3 | 43.9 | 68.2 | 80.0 | 90.9 | 94.2 | 100 |
| Image 4 | 45.2 | 72.0 | 82.9 | 92.9 | 94.3 | 100 |
| Image 5 | 41.9 | 64.8 | 78.0 | 87.0 | 94.0 | 100 |
| Image 1-Manual | 37.9 | 65.3 | 82.8 | 92.2 | 97.3 | 100 |
| Image No. | Frequency of Mass Distribution (%) | |||||
|---|---|---|---|---|---|---|
| 4 | 8 | 11.2 | 16 | 19 | 22.4 | |
| Image 1 | 47.1 | 27.1 | 9.6 | 7.5 | 2.4 | 6.3 |
| Image 2 | 42.3 | 24.2 | 12.4 | 11.8 | 6.0 | 3.2 |
| Image 3 | 42.2 | 22.0 | 10.9 | 12.4 | 5.4 | 7.0 |
| Image 4 | 44.4 | 30.6 | 10.8 | 8.4 | 2.7 | 3.1 |
| Image 5 | 46.8 | 19.3 | 9.9 | 10.5 | 8.7 | 4.7 |
| Image No. | Cumulative Mass Distribution (%) | |||||
|---|---|---|---|---|---|---|
| 4 | 8 | 11.2 | 16 | 19 | 22.4 | |
| Image 1 | 47.1 | 74.2 | 83.9 | 91.3 | 93.7 | 100 |
| Image 2 | 42.3 | 66.5 | 79.0 | 90.8 | 96.8 | 100 |
| Image 3 | 42.2 | 64.2 | 75.1 | 87.6 | 93.0 | 100 |
| Image 4 | 44.4 | 75.0 | 85.9 | 94.3 | 96.9 | 100 |
| Image 5 | 46.8 | 66.2 | 76.1 | 86.6 | 95.3 | 100 |
| Columns | Size (mm) | |||||
|---|---|---|---|---|---|---|
| 4 | 8 | 11.2 | 16 | 19 | 22.4 | |
| Weight 1 (g) | 1622.1 | 797 | 521.7 | 400.0 | 234.6 | 194.3 |
| Weight 2 (g) | 1483.0 | 807.1 | 521.6 | 398.5 | 172.6 | 144.7 |
| Frequency of Mass Distribution (%) | 42.6 | 22.0 | 14.3 | 10.9 | 5.6 | 4.6 |
| Cumulative Mass Distribution (%) | 42.6 | 64.5 | 78.8 | 89.8 | 95.4 | 100 |
Publisher’s Note: MDPI stays neutral with regard to jurisdictional claims in published maps and institutional affiliations. |
© 2021 by the authors. Licensee MDPI, Basel, Switzerland. This article is an open access article distributed under the terms and conditions of the Creative Commons Attribution (CC BY) license (https://creativecommons.org/licenses/by/4.0/).
Share and Cite
Li, H.; Asbjörnsson, G.; Lindqvist, M. Image Process of Rock Size Distribution Using DexiNed-Based Neural Network. Minerals 2021, 11, 736. https://doi.org/10.3390/min11070736
Li H, Asbjörnsson G, Lindqvist M. Image Process of Rock Size Distribution Using DexiNed-Based Neural Network. Minerals. 2021; 11(7):736. https://doi.org/10.3390/min11070736
Chicago/Turabian StyleLi, Haijie, Gauti Asbjörnsson, and Mats Lindqvist. 2021. "Image Process of Rock Size Distribution Using DexiNed-Based Neural Network" Minerals 11, no. 7: 736. https://doi.org/10.3390/min11070736
APA StyleLi, H., Asbjörnsson, G., & Lindqvist, M. (2021). Image Process of Rock Size Distribution Using DexiNed-Based Neural Network. Minerals, 11(7), 736. https://doi.org/10.3390/min11070736