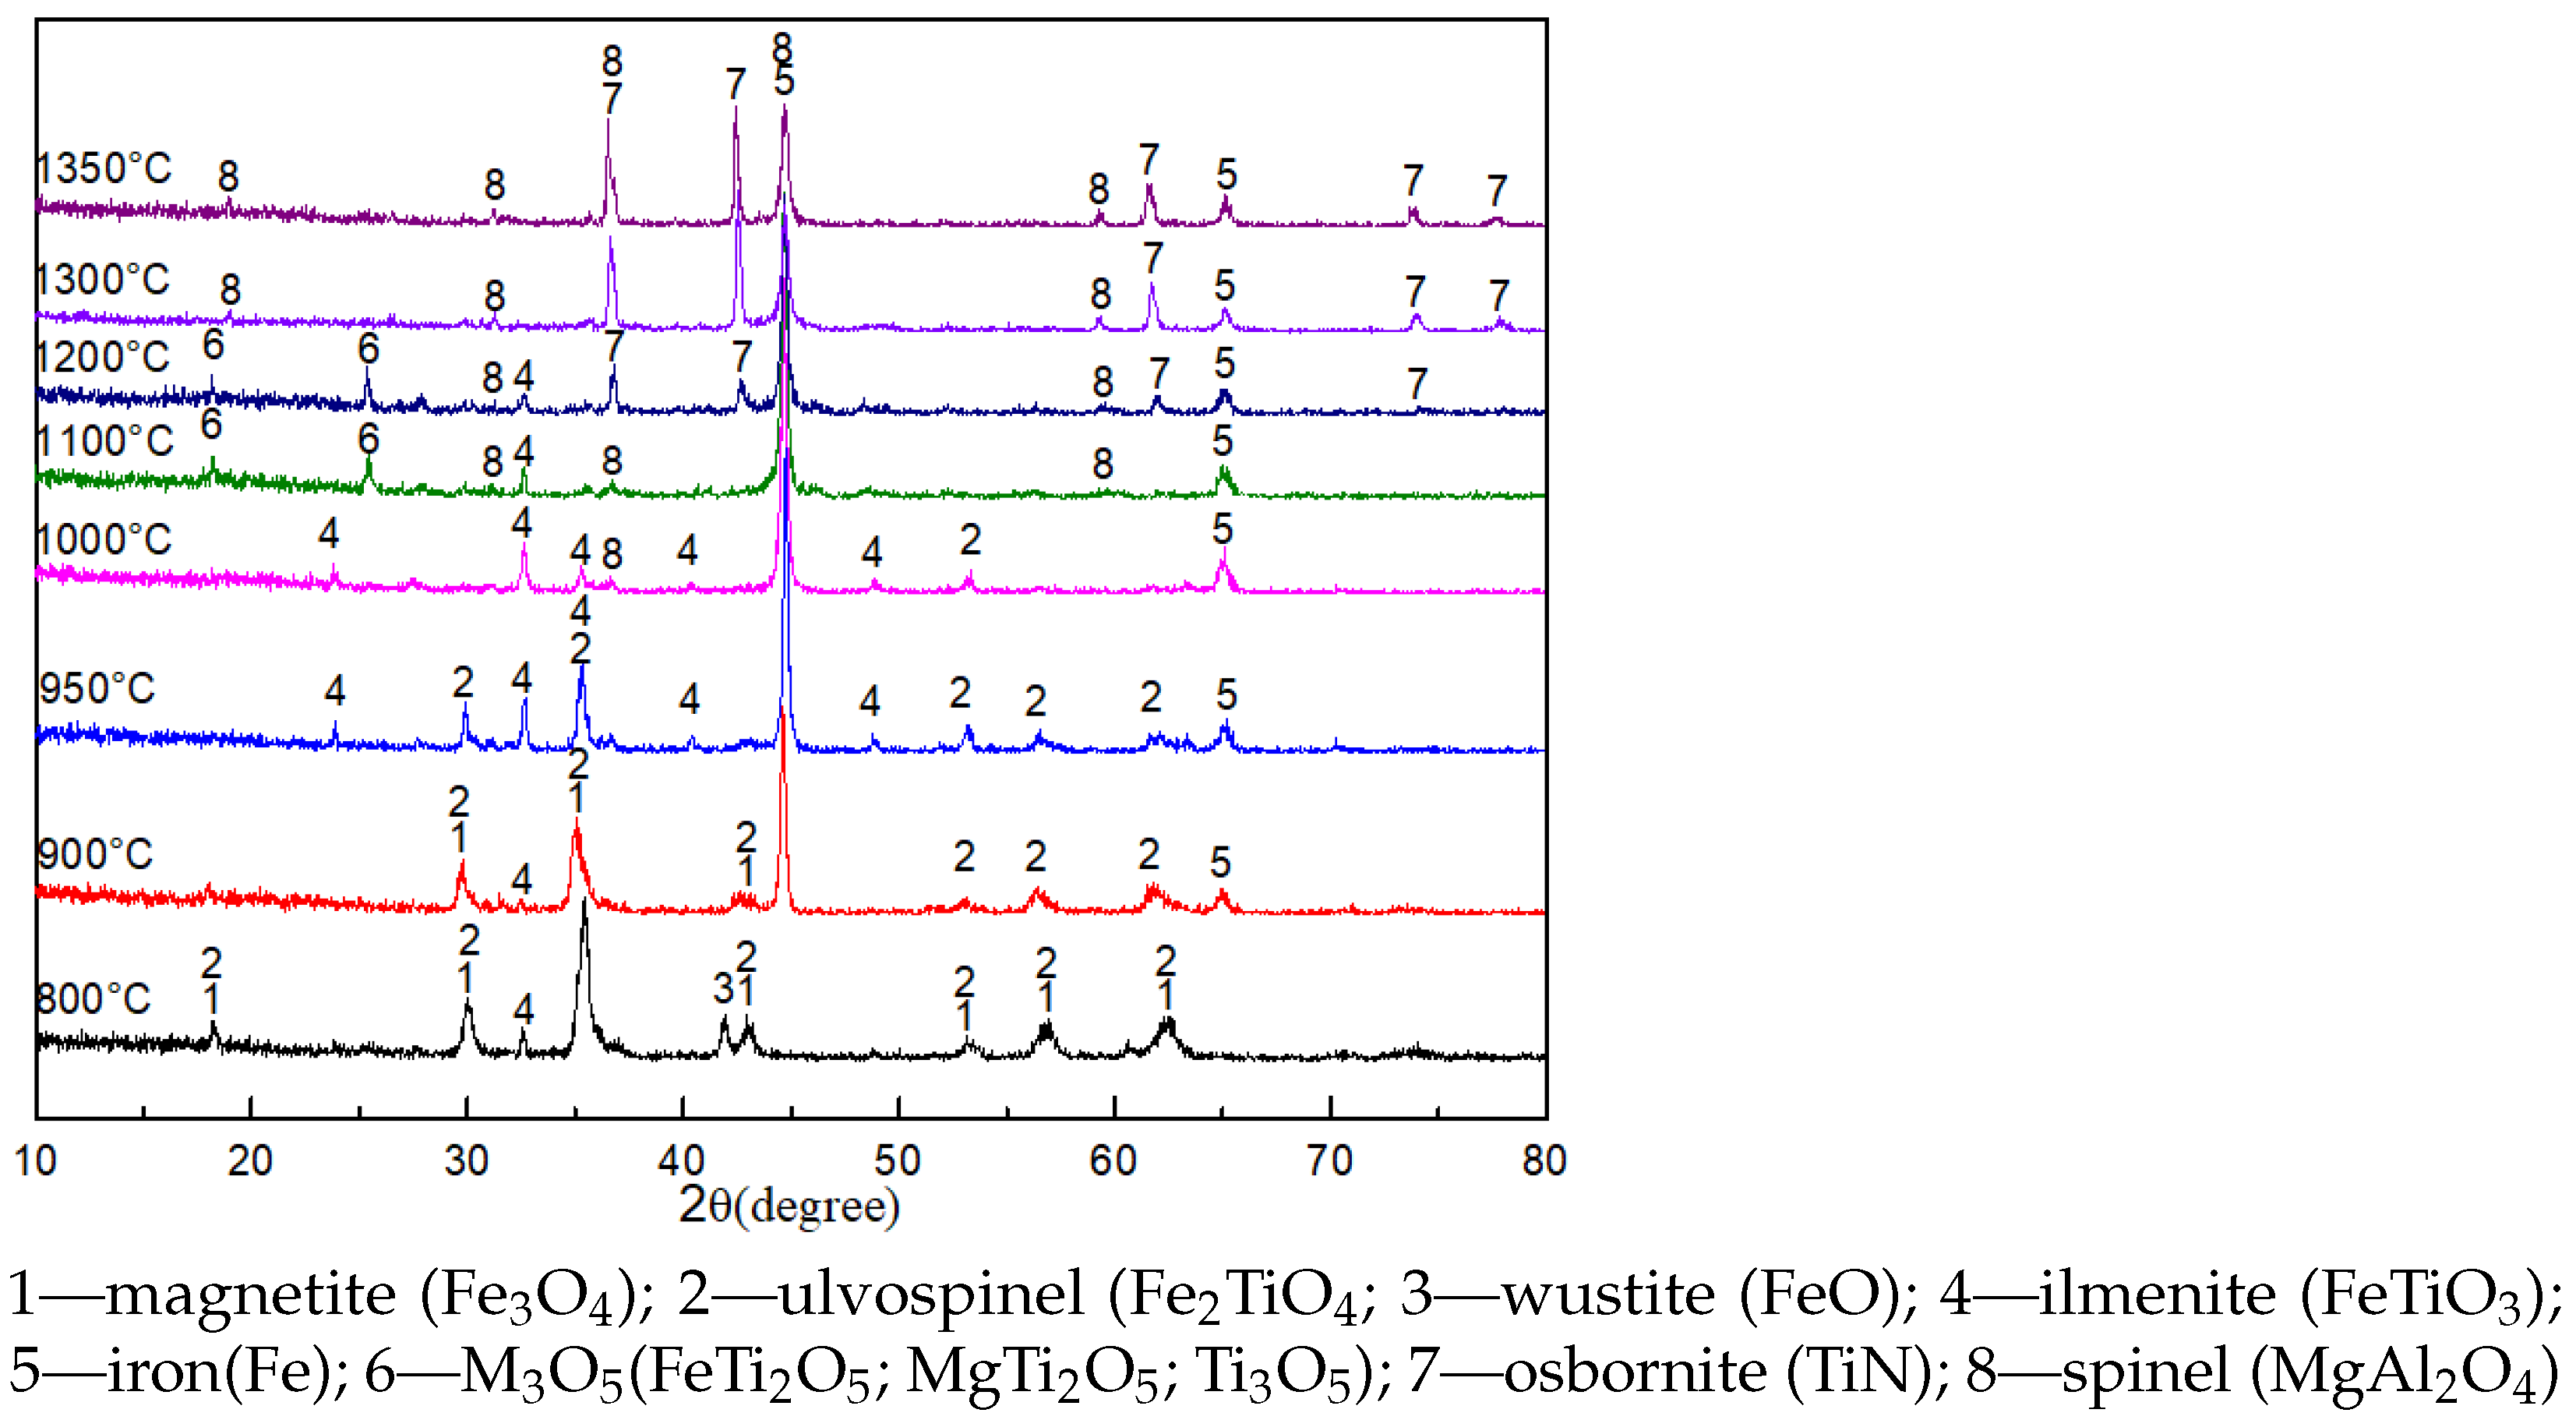
3.1. XRD Analyses
The XRD patterns of the pellets roasted for 90 min at different temperatures are shown in
Figure 2.
The main phases of the pellets roasted at 800 °C were Fe
O
, Fe
TiO
, FeTiO
, and FeO, suggesting that part of Fe
O
was reduced to FeO. The diffraction peaks of Fe were detected, and the diffraction peaks of Fe
O
decreased when the roasting temperature increased to 900 °C. The diffraction peaks of Fe
TiO
evidently decreased, and the diffraction peaks of FeTiO
increased when the roasting temperature increased to 950 °C. Only Fe and FeTiO
were observed in the pellets during roasting at 1000 °C, indicating that Fe
TiO
was reduced to Fe and FeTiO
. The diffraction peaks of FeTiO
disappeared, and FeTi
O
, MgTi
O
, Ti
O
, and MgAl
O
were observed when the roasting temperature increased to 1100 °C. FeTi
O
, MgTi
O
, and Ti
O
belong to the M
O
-type solid solution with a general formula of m[(Ti, Mg, Mn, Fe)O•2TiO
]•n[(Ti, Fe, Al, Cr, V)
O
•TiO
], and they were important intermediates during the reduction of ilmenite and titanomagnetite [
6,
27,
28]. The diffraction peaks of TiN were detected when the roasting temperature increased to 1200 °C. The peaks of M
O
disappeared, and the peaks of TiN remarkably increased when the reaction temperature increased to 1300 °C, indicating that the reduction of M
O
to TiN processed completely. The patterns remained unchanged when the roasting temperature increased to 1350 °C.
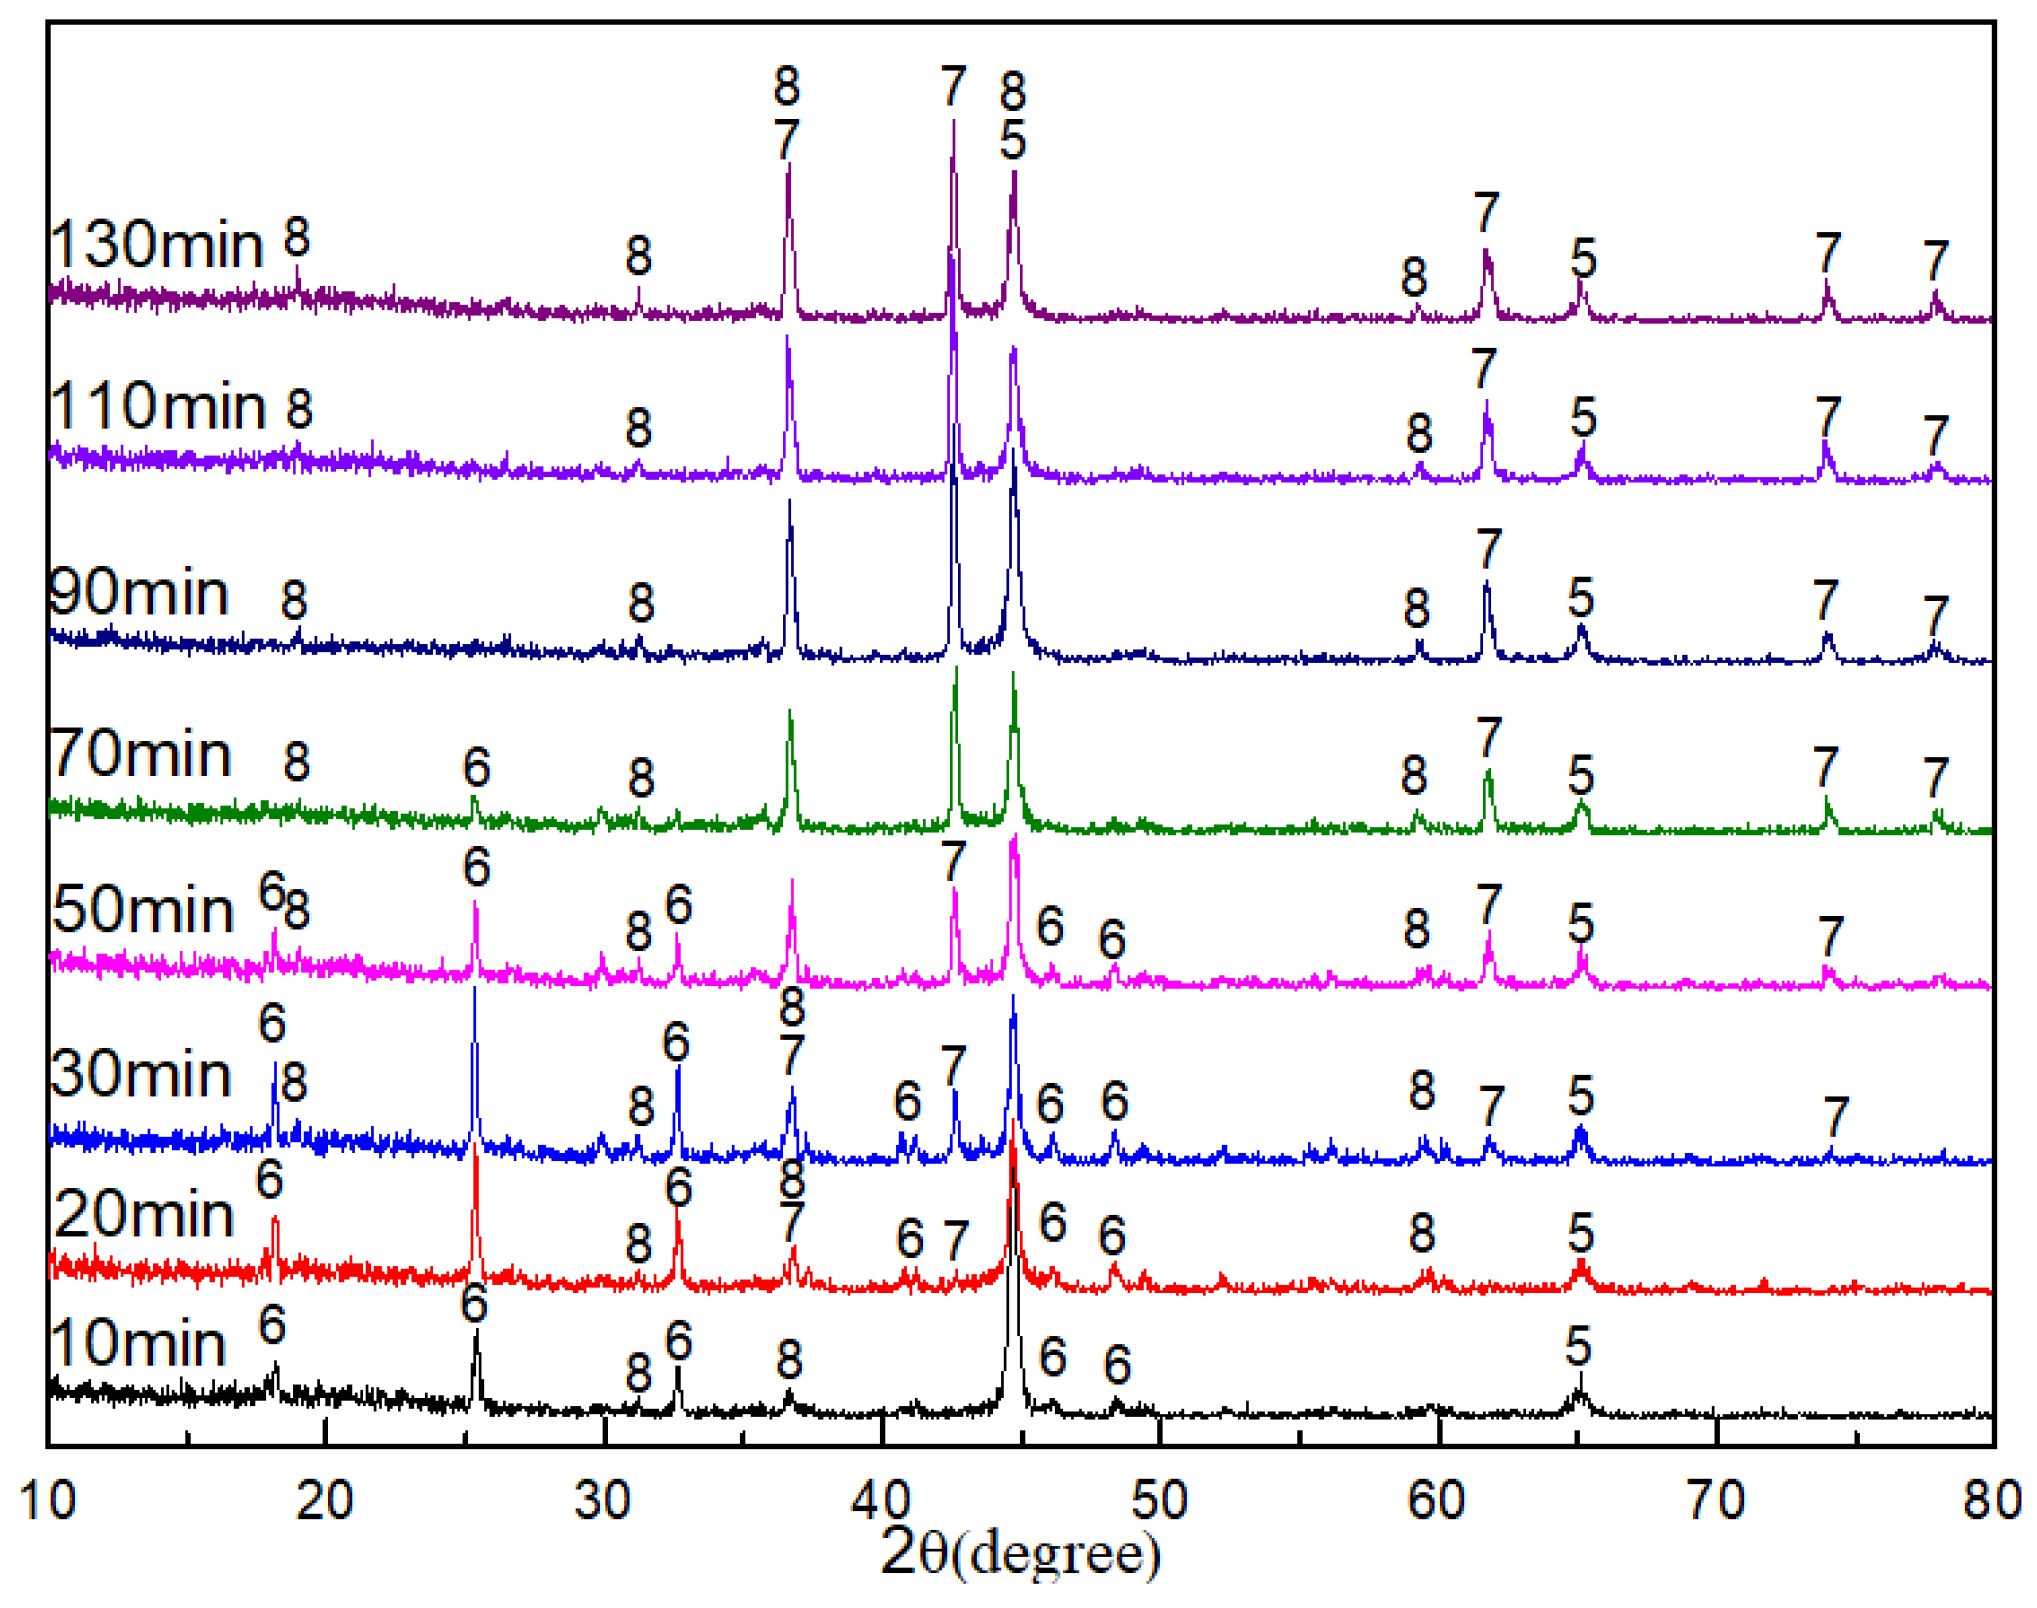
The XRD patterns of the pellets roasted at 1300 °C for different amounts of time are shown in
Figure 3. The results show that the main phases of the roasted pellets were Fe, M
O
, and MgAl
O
when the roasting time was 10 min, indicating that the reduction reactions of Fe
TixO
and FeTiO
to Fe and M
O
were essentially completed. After that, the diffraction peaks of M
O
decreased, and the peaks of TiN increased as the roasting time extended; at 90 min, the diffraction peaks of M
O
disappeared. This suggests that the reduction of M
O
to TiN was the rate-determining step of the whole reaction. The phases remained unchanged when the roasting time further increased to 130 min.
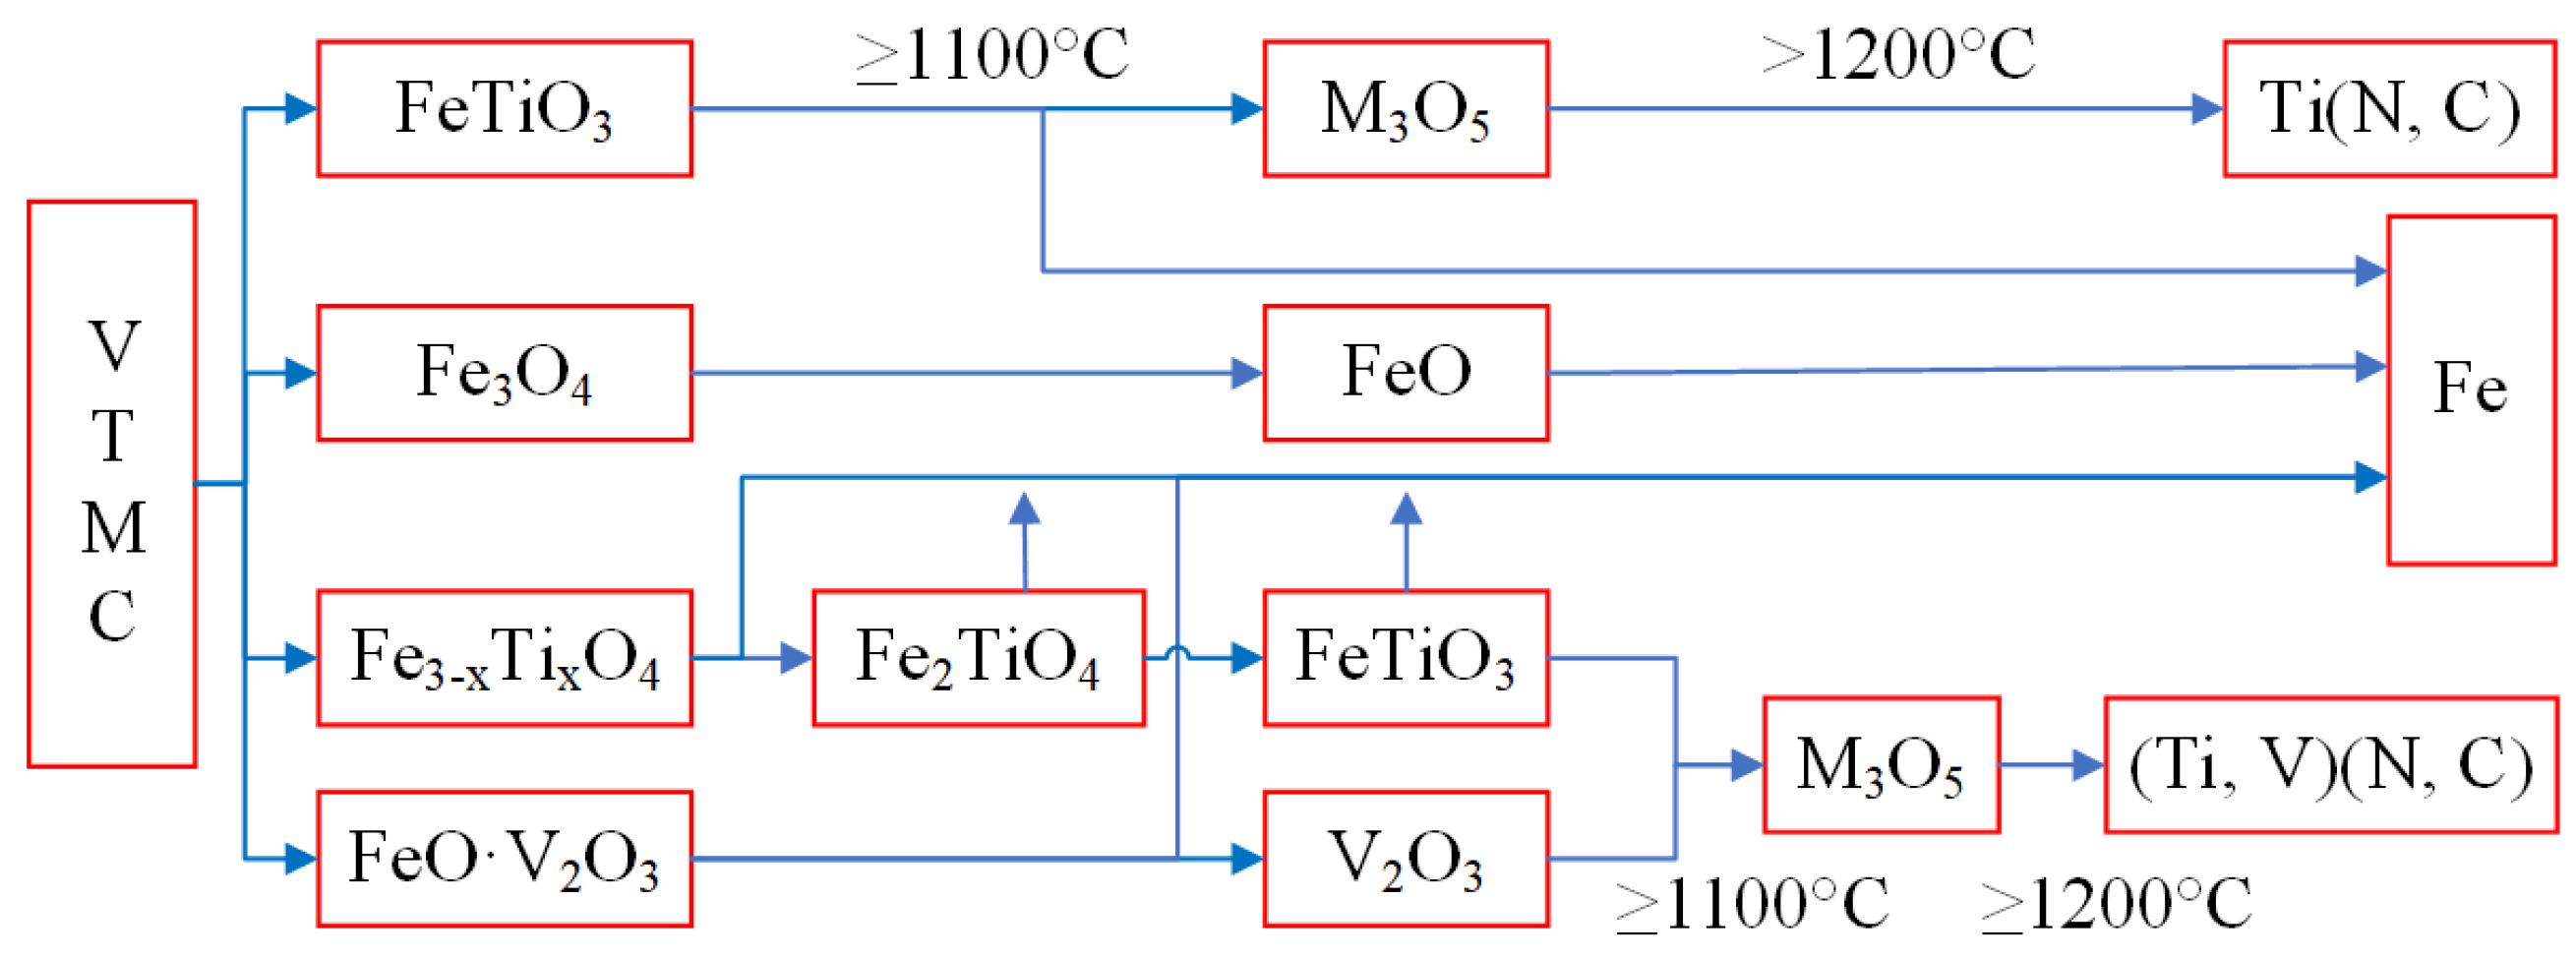
According to the XRD results, it can be deduced that the reduction sequence of Ti-bearing minerals in VTMC under the experimental condition was as follows: FeTiO→ FeTiO→FeTiO→MO→TiN. The reduction reactions of FeTiO to MO proceeded easily, but the reduction of MO to TiN proceeded with greater difficulty and was the rate-determining step of the entire reaction.
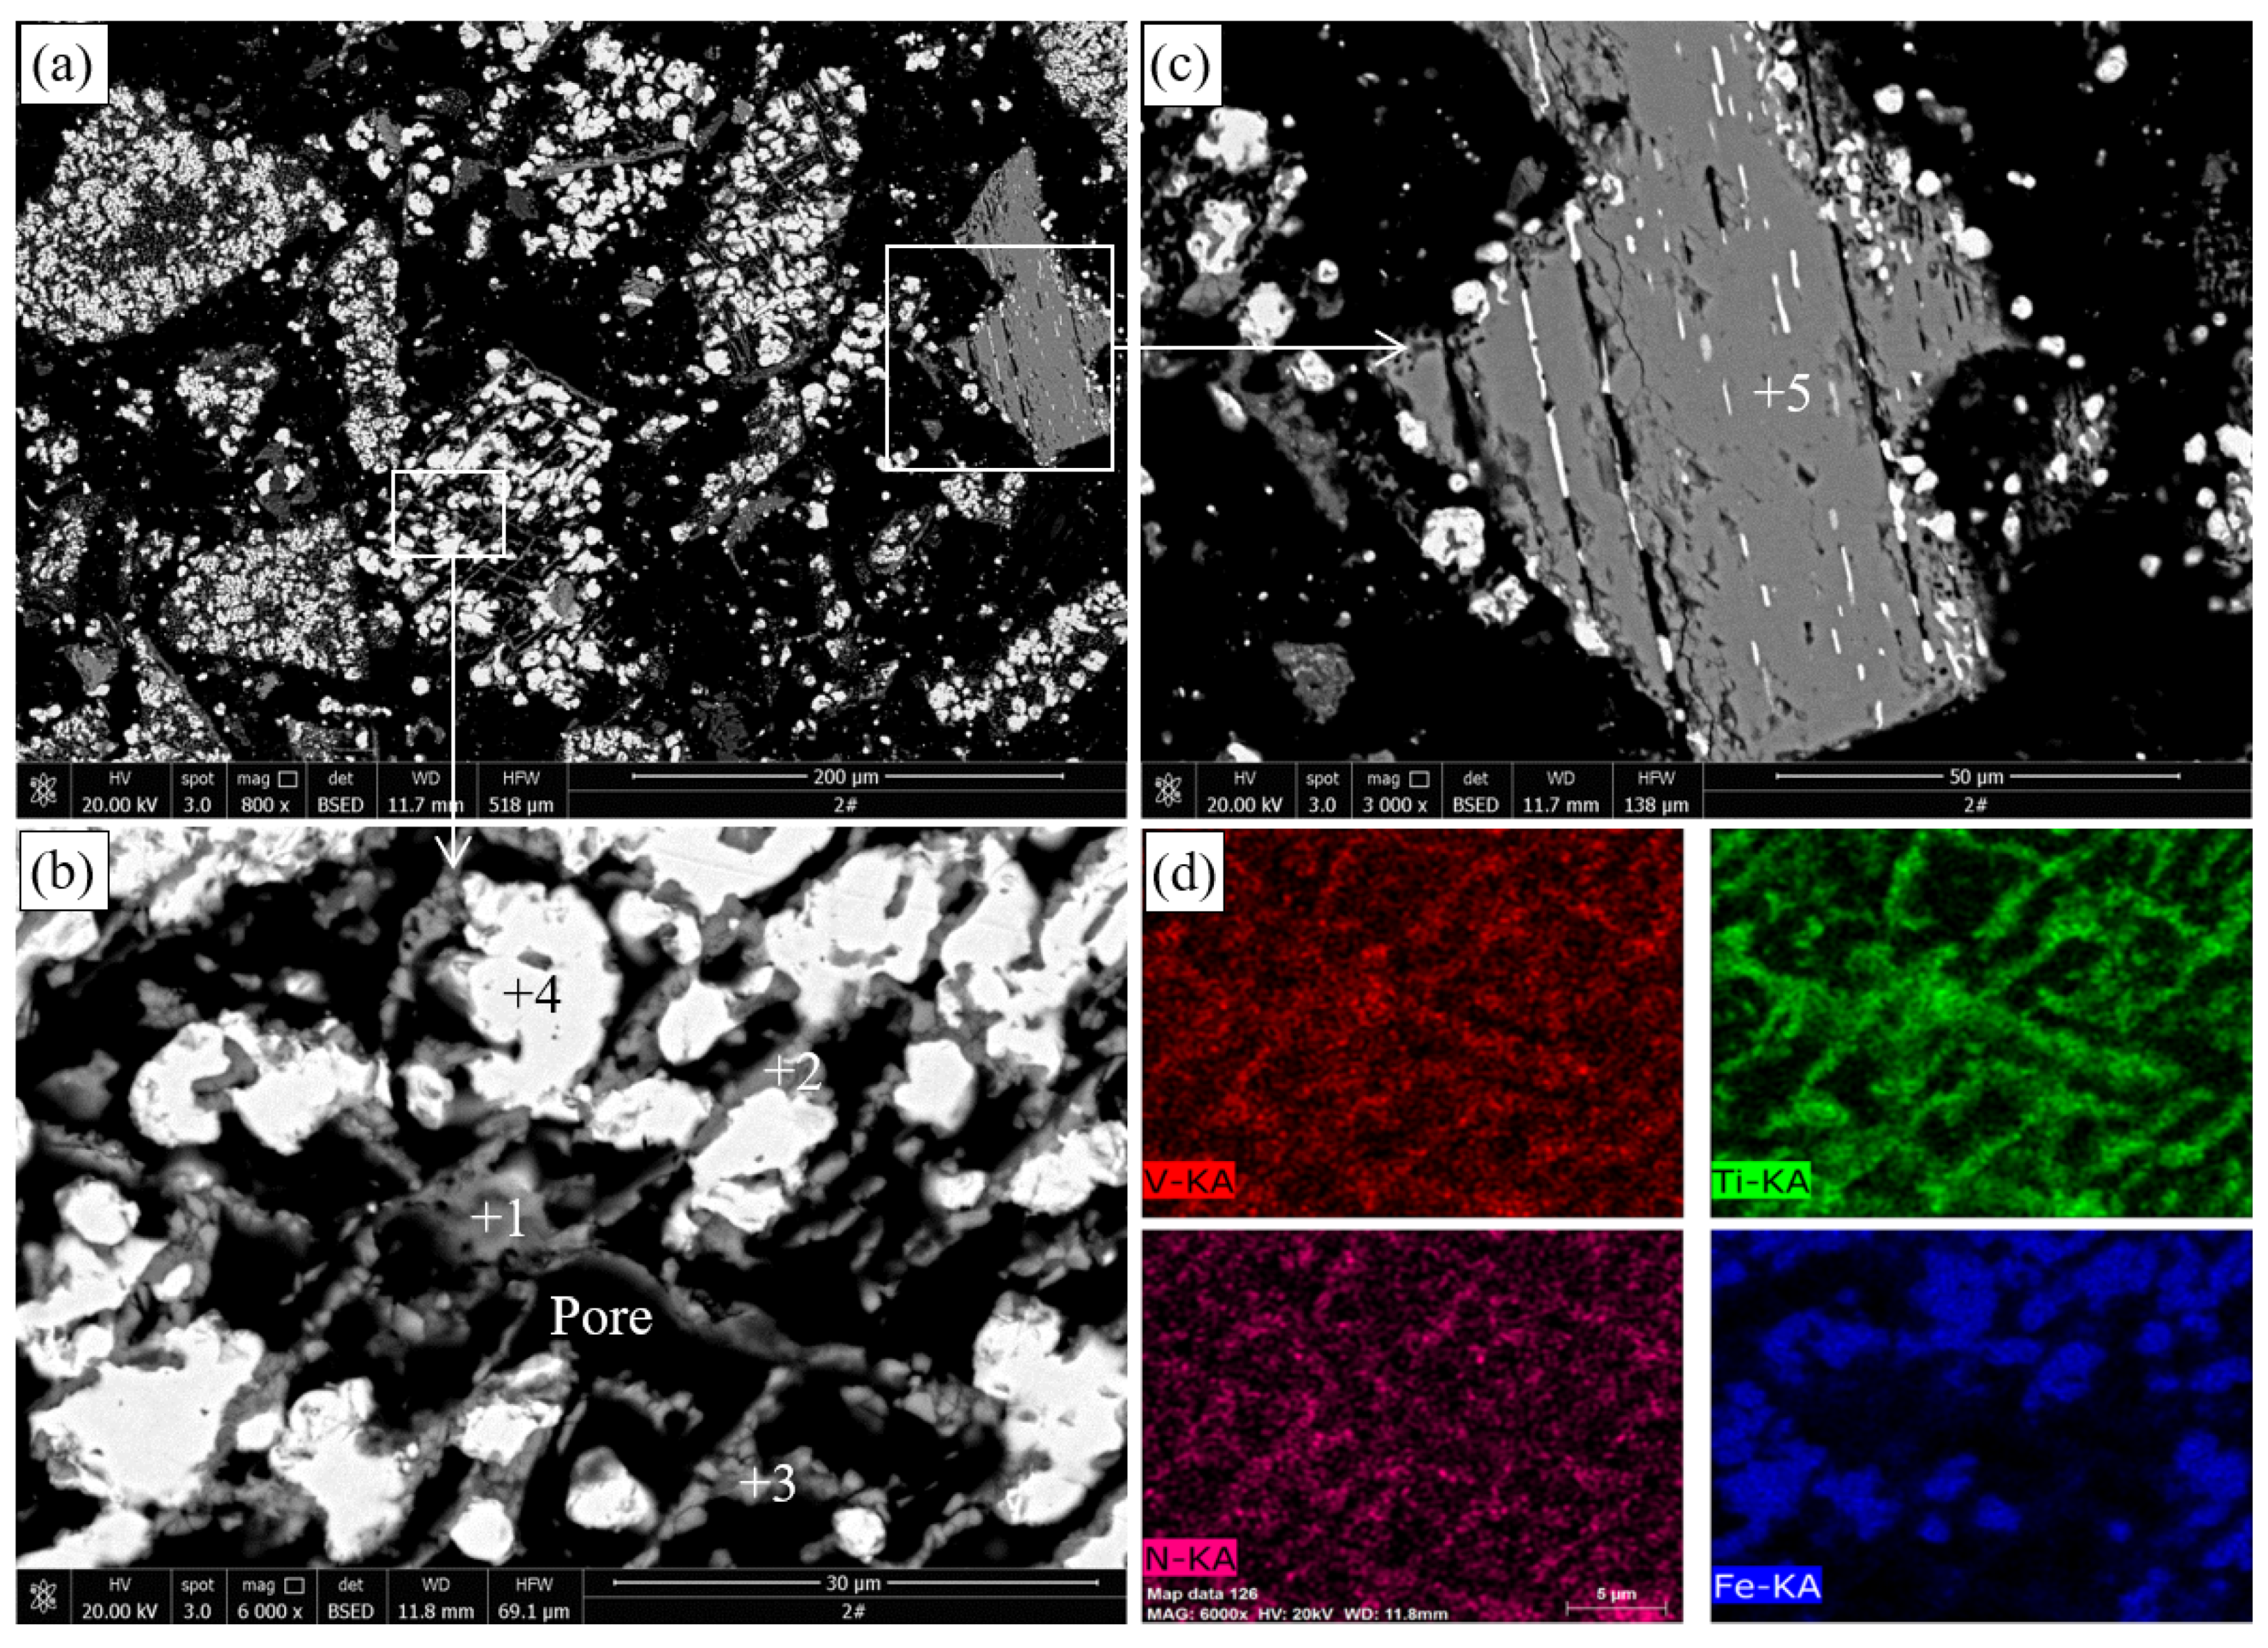
3.2. SEM and EDS Analyses
The pellets roasted at different temperatures for 90 min were evaluated through SEM and EDS analyses to examine the transformation of phases and microstructure of VTMC during roasting. In order to identify the difference in reaction behavior of titanomagnetite and ilmenite in VTMC, the typical successors of titanomagnetite and ilmenite particles after roasting were selected and examined from the roasted pellets.
The SEM images and EDS analysis results of the pellets roasted at 1000 °C are presented in
Figure 4 and
Table 3, respectively.
Figure 4a shows that the particle size of metallic iron formed in the pellets is less than 20
m, and the original structure of titanomagnetite particles was destroyed.
Figure 4b shows that metallic iron particles, pores, and reticular materials were observed in the reduced titanomagnetite particles. Combined with the EDS results in
Table 3 and the XRD results in
Figure 3, these reticular materials should be ilmenite resulting from the reduction of titanomagnetite. The porous structure was caused by the reduction of iron minerals, in which the removal of oxygen led to volume shrinkage of the product. This porous structure facilitates the further reduction of Ti-bearing minerals. The EDS results in
Figure 4d show that the distribution areas of V and Ti are highly coincident. By contrast, as shown in
Figure 4c, the ilmenite essentially maintains the original structure, except for a small amount of fine-grained metallic iron formed inside, indicating that the reduction of ilmenite is difficult to carry out at 1000 °C. This dense structure inhibits the diffusion of gases and prevents the reduction of ilmenite.
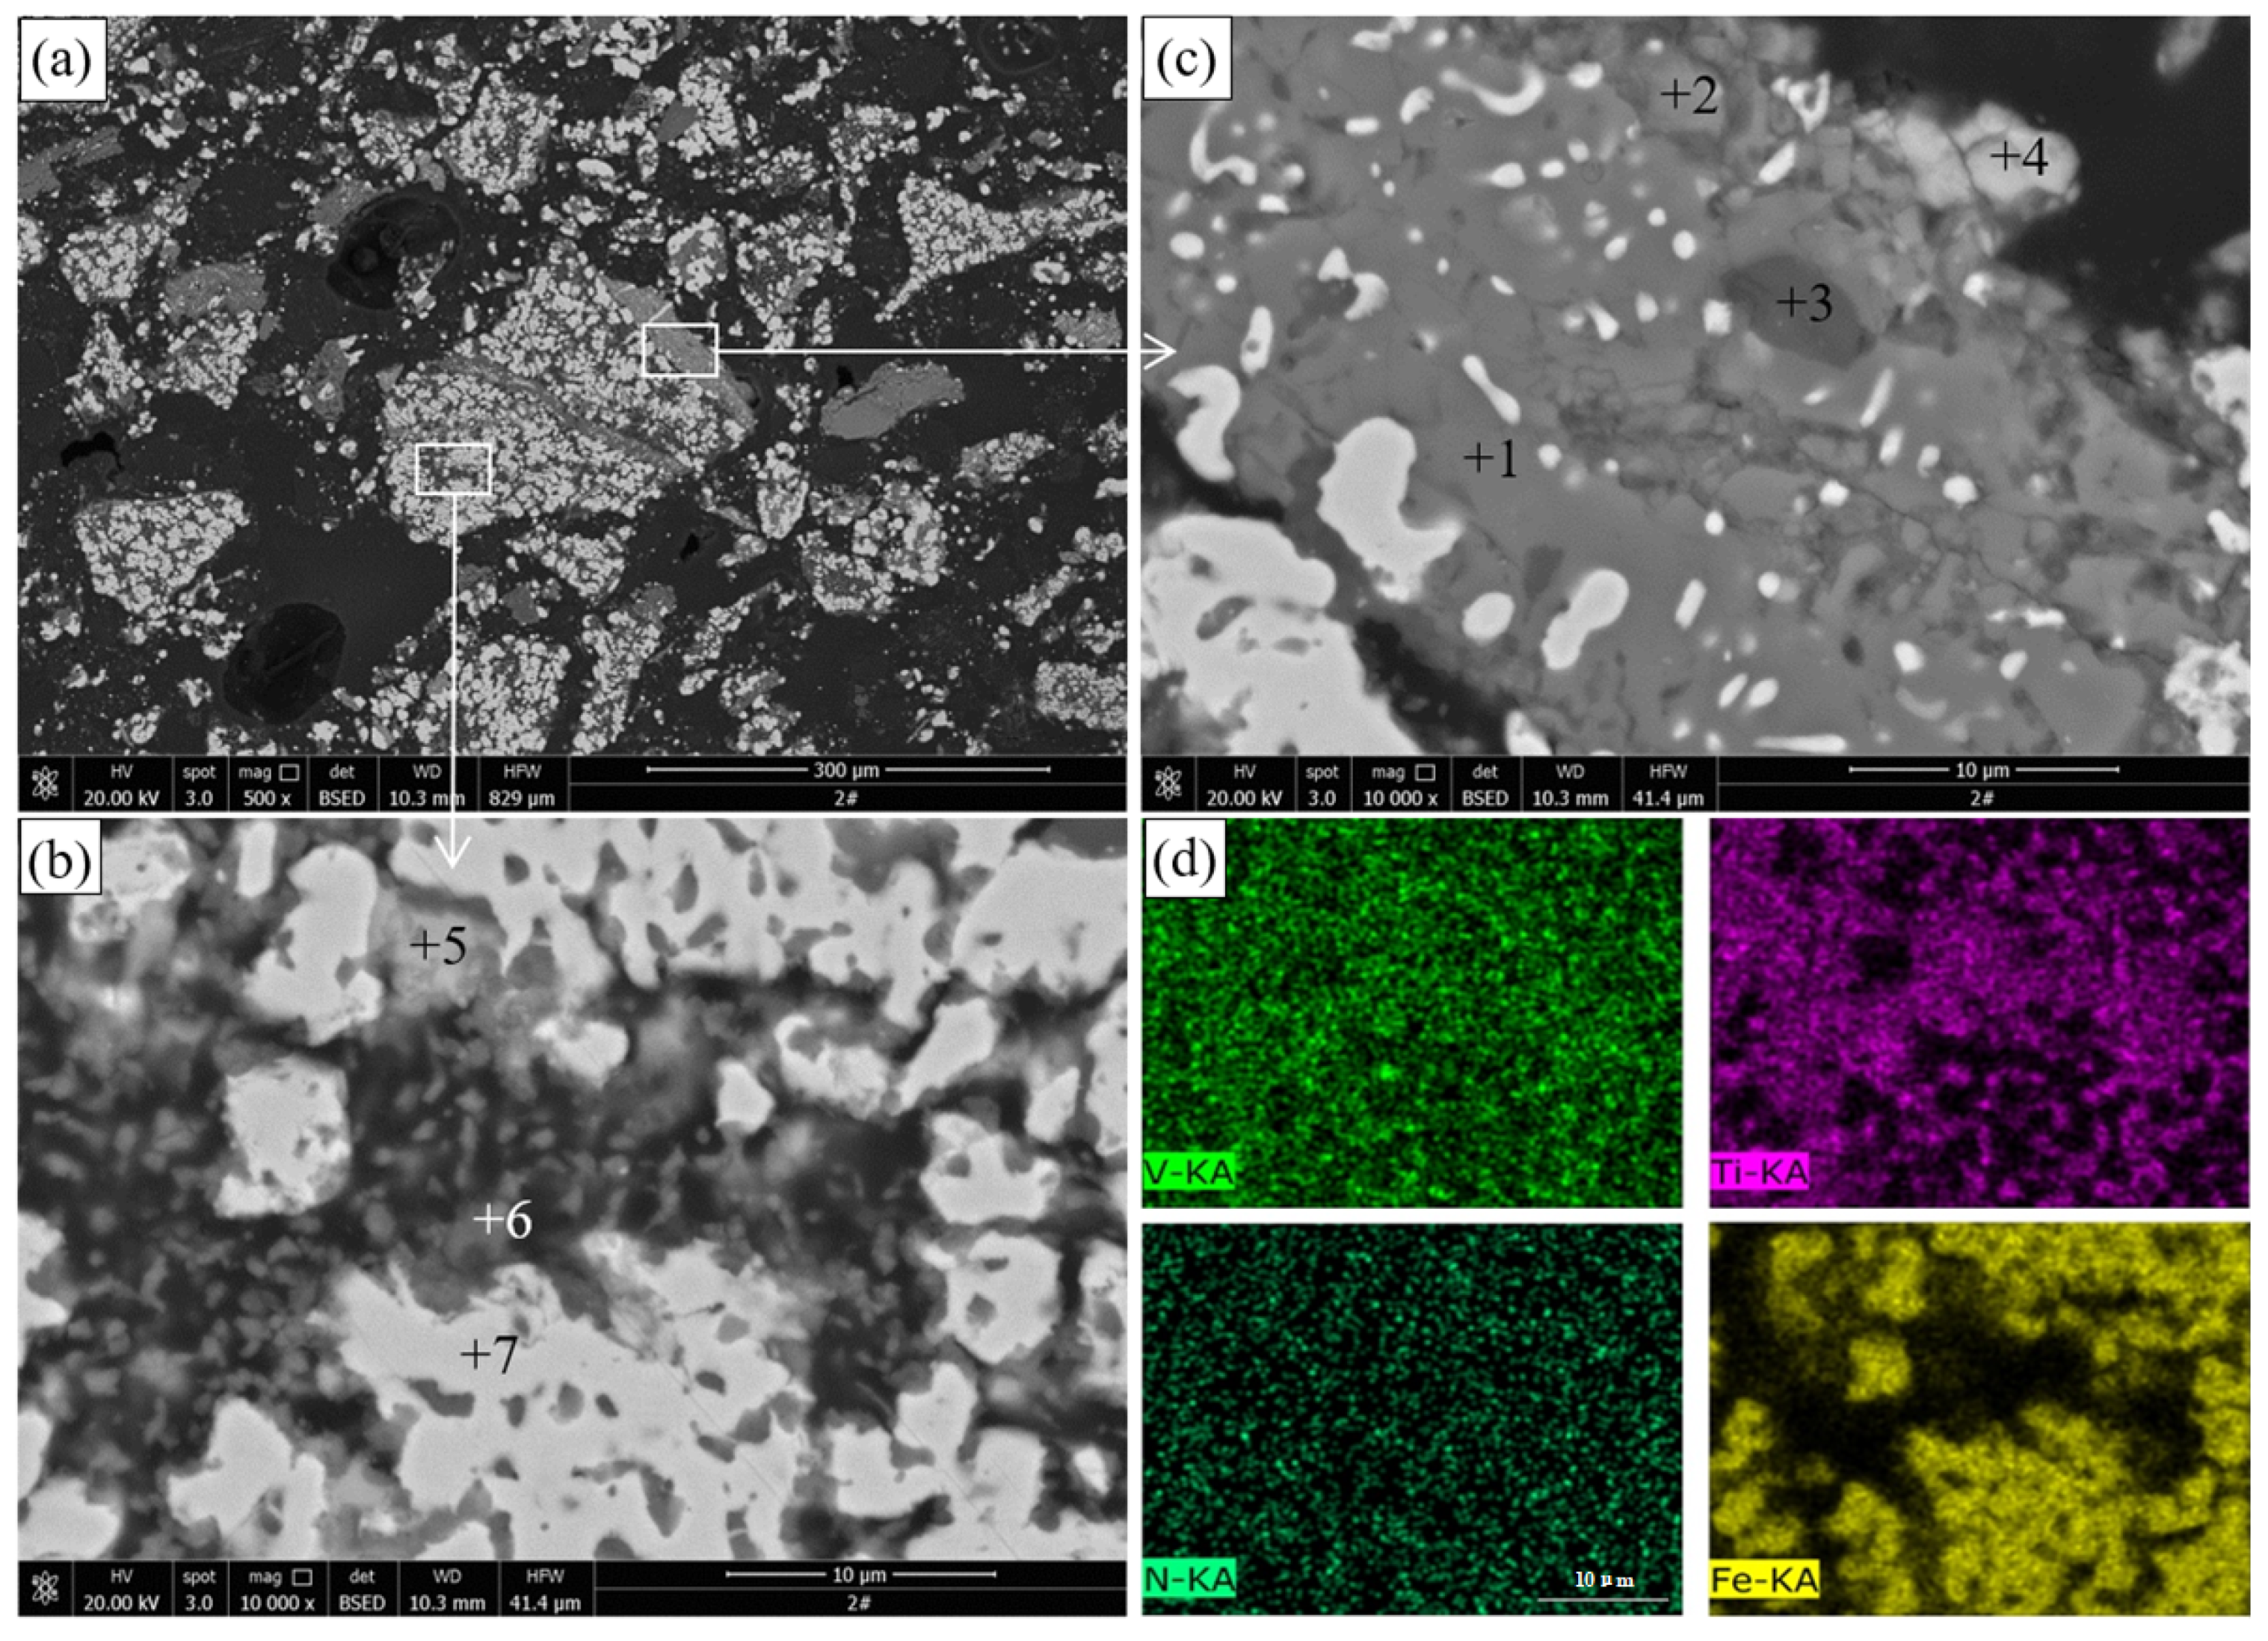
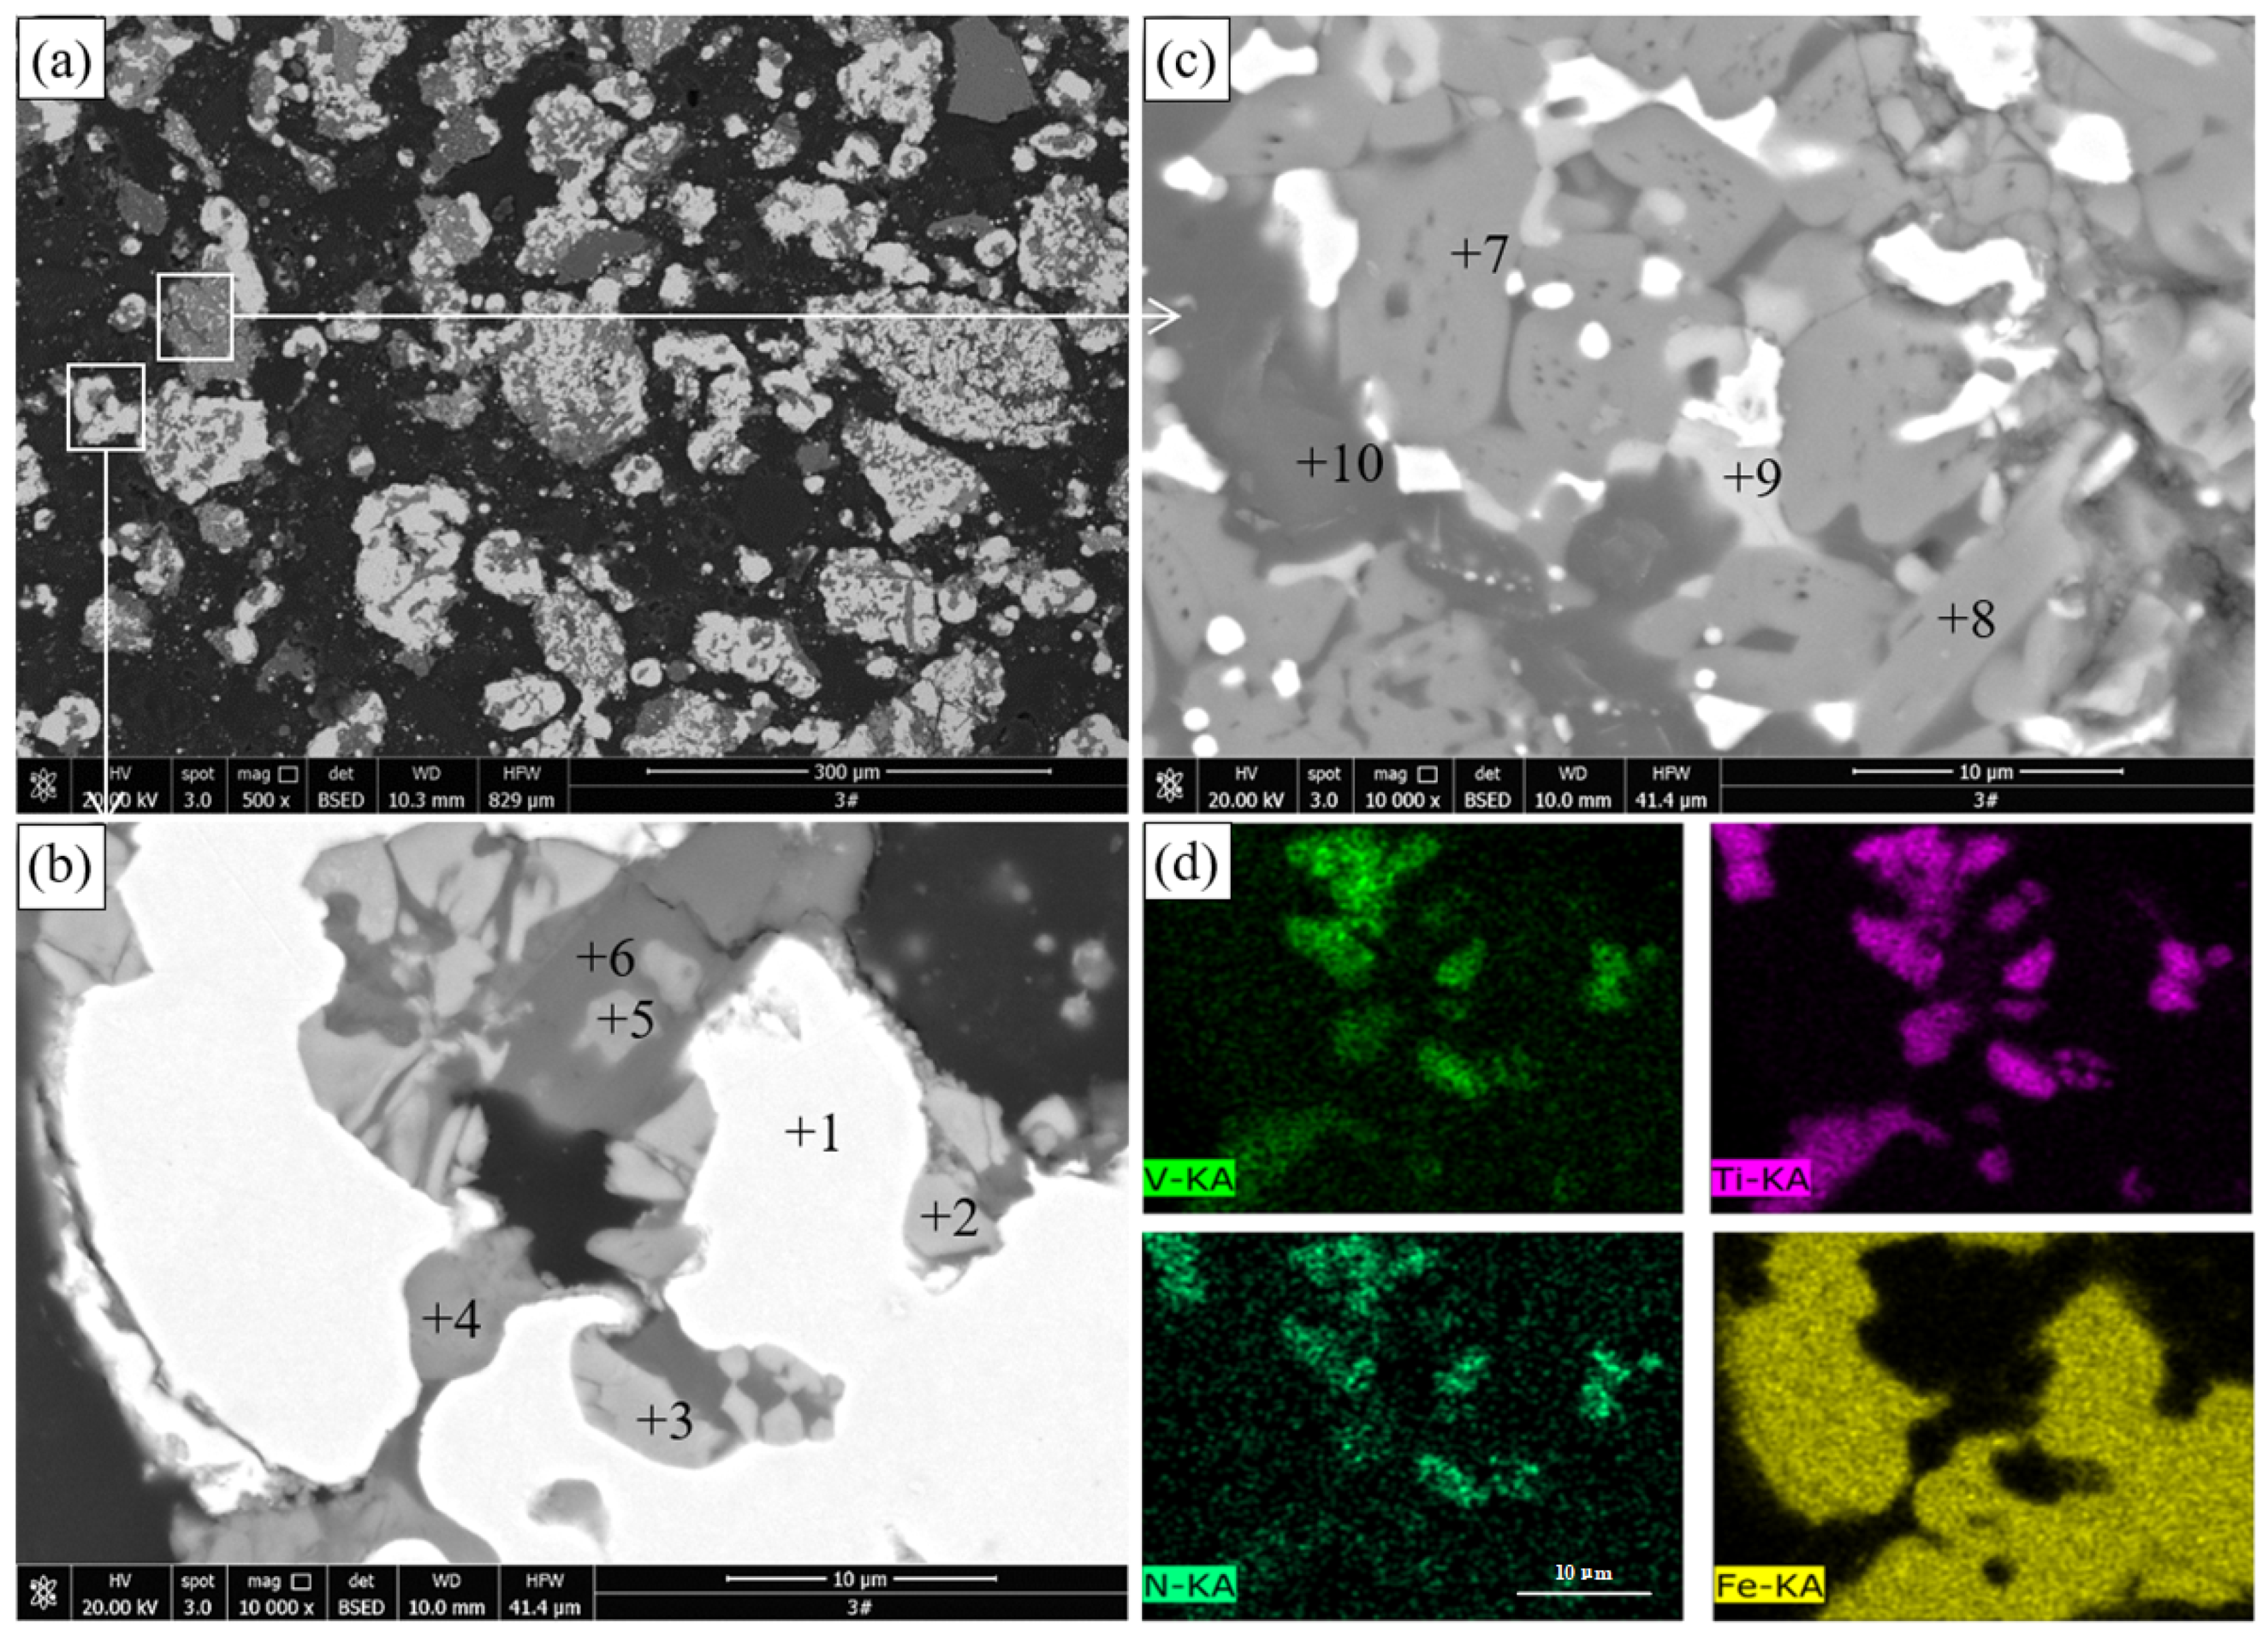
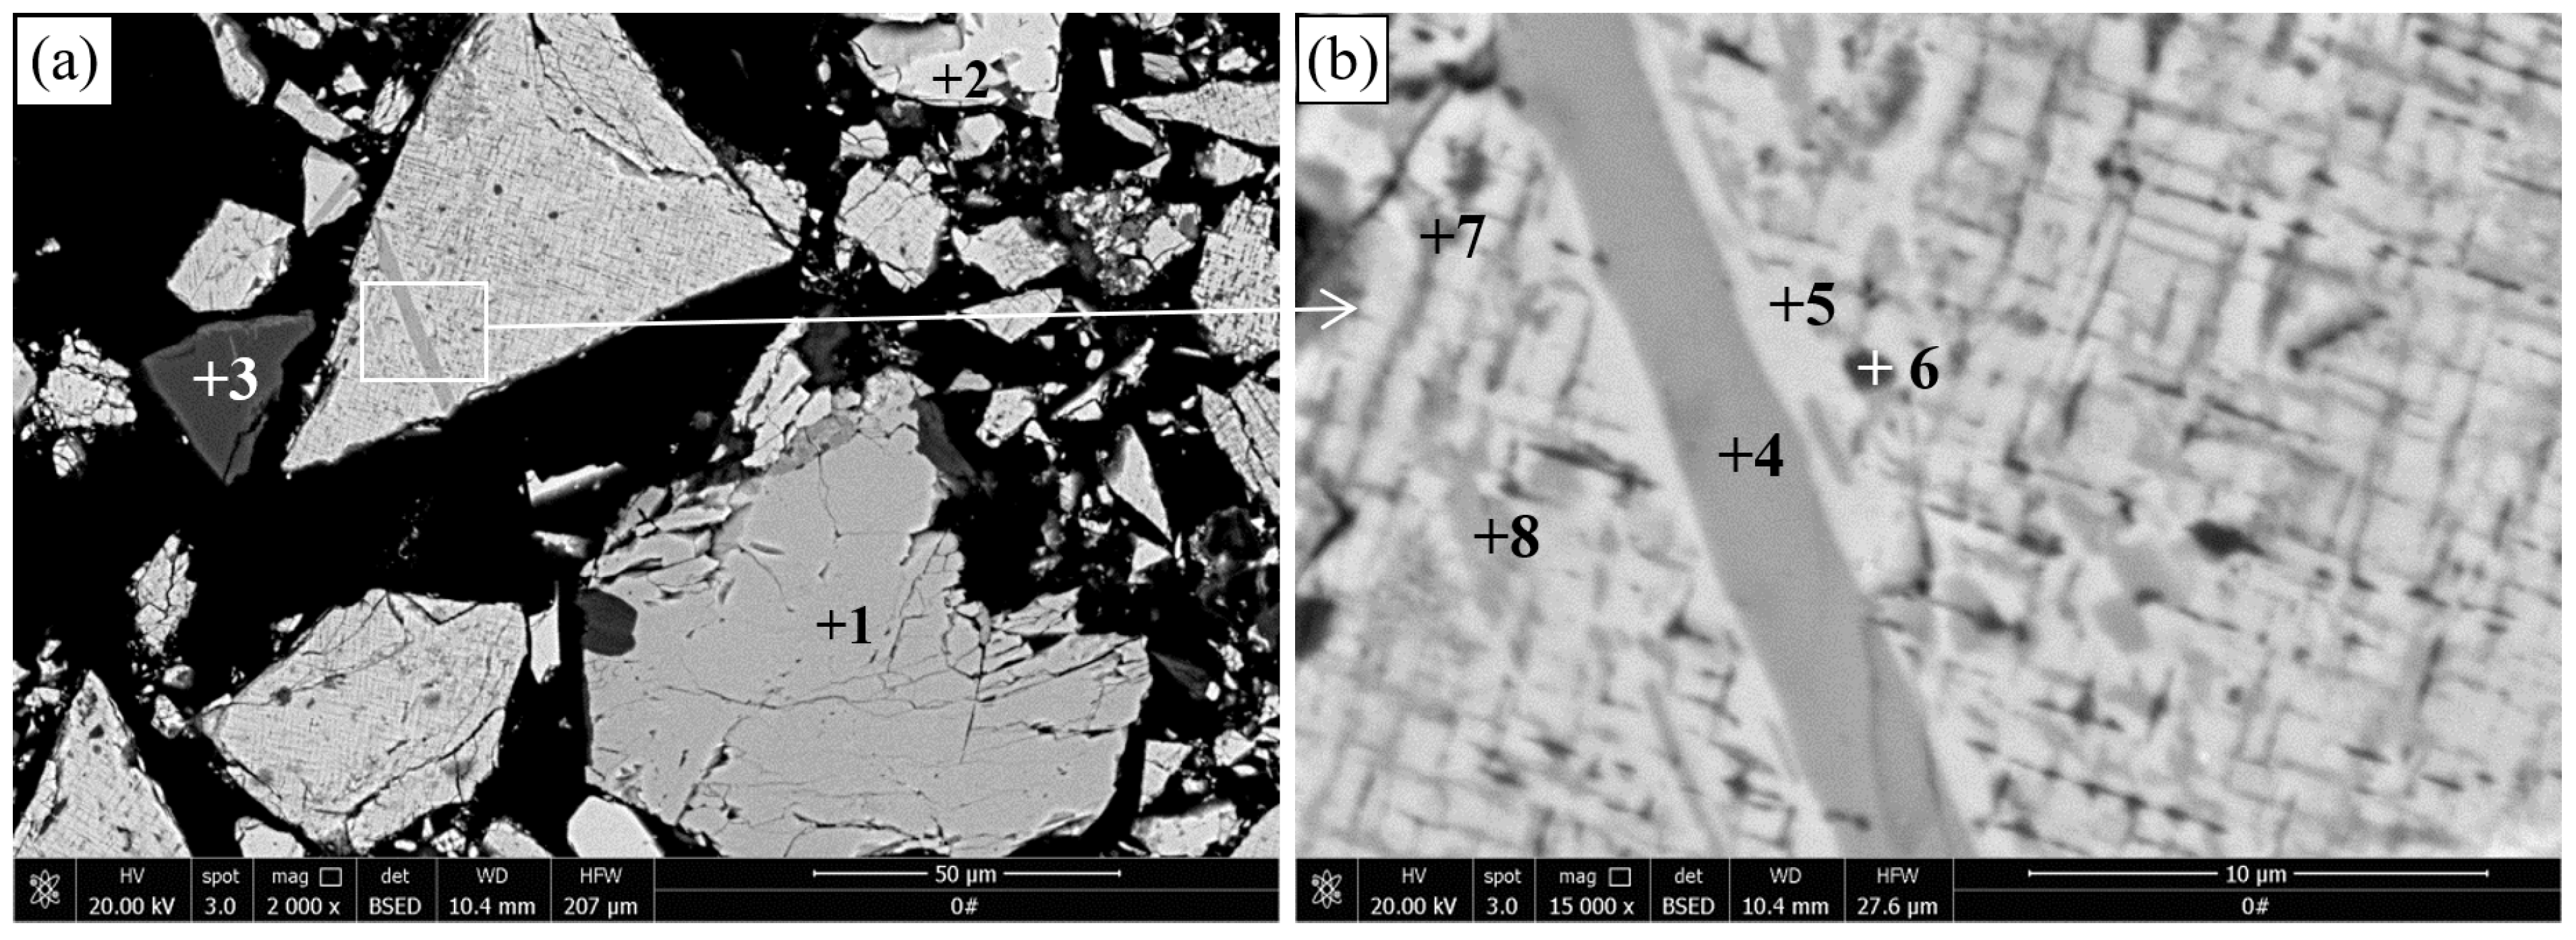
The results of SEM and EDS of the pellets roasted at 1100 °C are presented in
Figure 5 and
Table 4, respectively.
Figure 5a,b reveals that many gray particles with a size of a few microns are distributed between the metallic iron particles in the reduced titanomagnetite. The EDS results show that this phase contains 29.77% Ti, 8.07% Fe, and 1.46% V. Combined with the XRD results in
Figure 2, this phase should be M
O
. Sulfide (point 5) containing 0.42%–1.05% V is observed in the reduced titanomagnetite. Sulfur mainly comes from the sulfide minerals in the VTMC and anthracite. The EDS surface scan result shows that the distribution of V and Ti elements in the reduced titanomagnetite is highly coincident. As shown in
Figure 5c, the reduced ilmenite remains a dense structure, although more metallic iron particles are produced than for the ilmenite reduced at 1000 °C. The EDS results reveal that the main phase contains 46.81%–48.96% Ti and 2.74%–2.59% Fe; thus, this phase should be M
O
. MgAl
O
(point 3) and sulfide (point 4) particles are also observed in the reduced ilmenite.
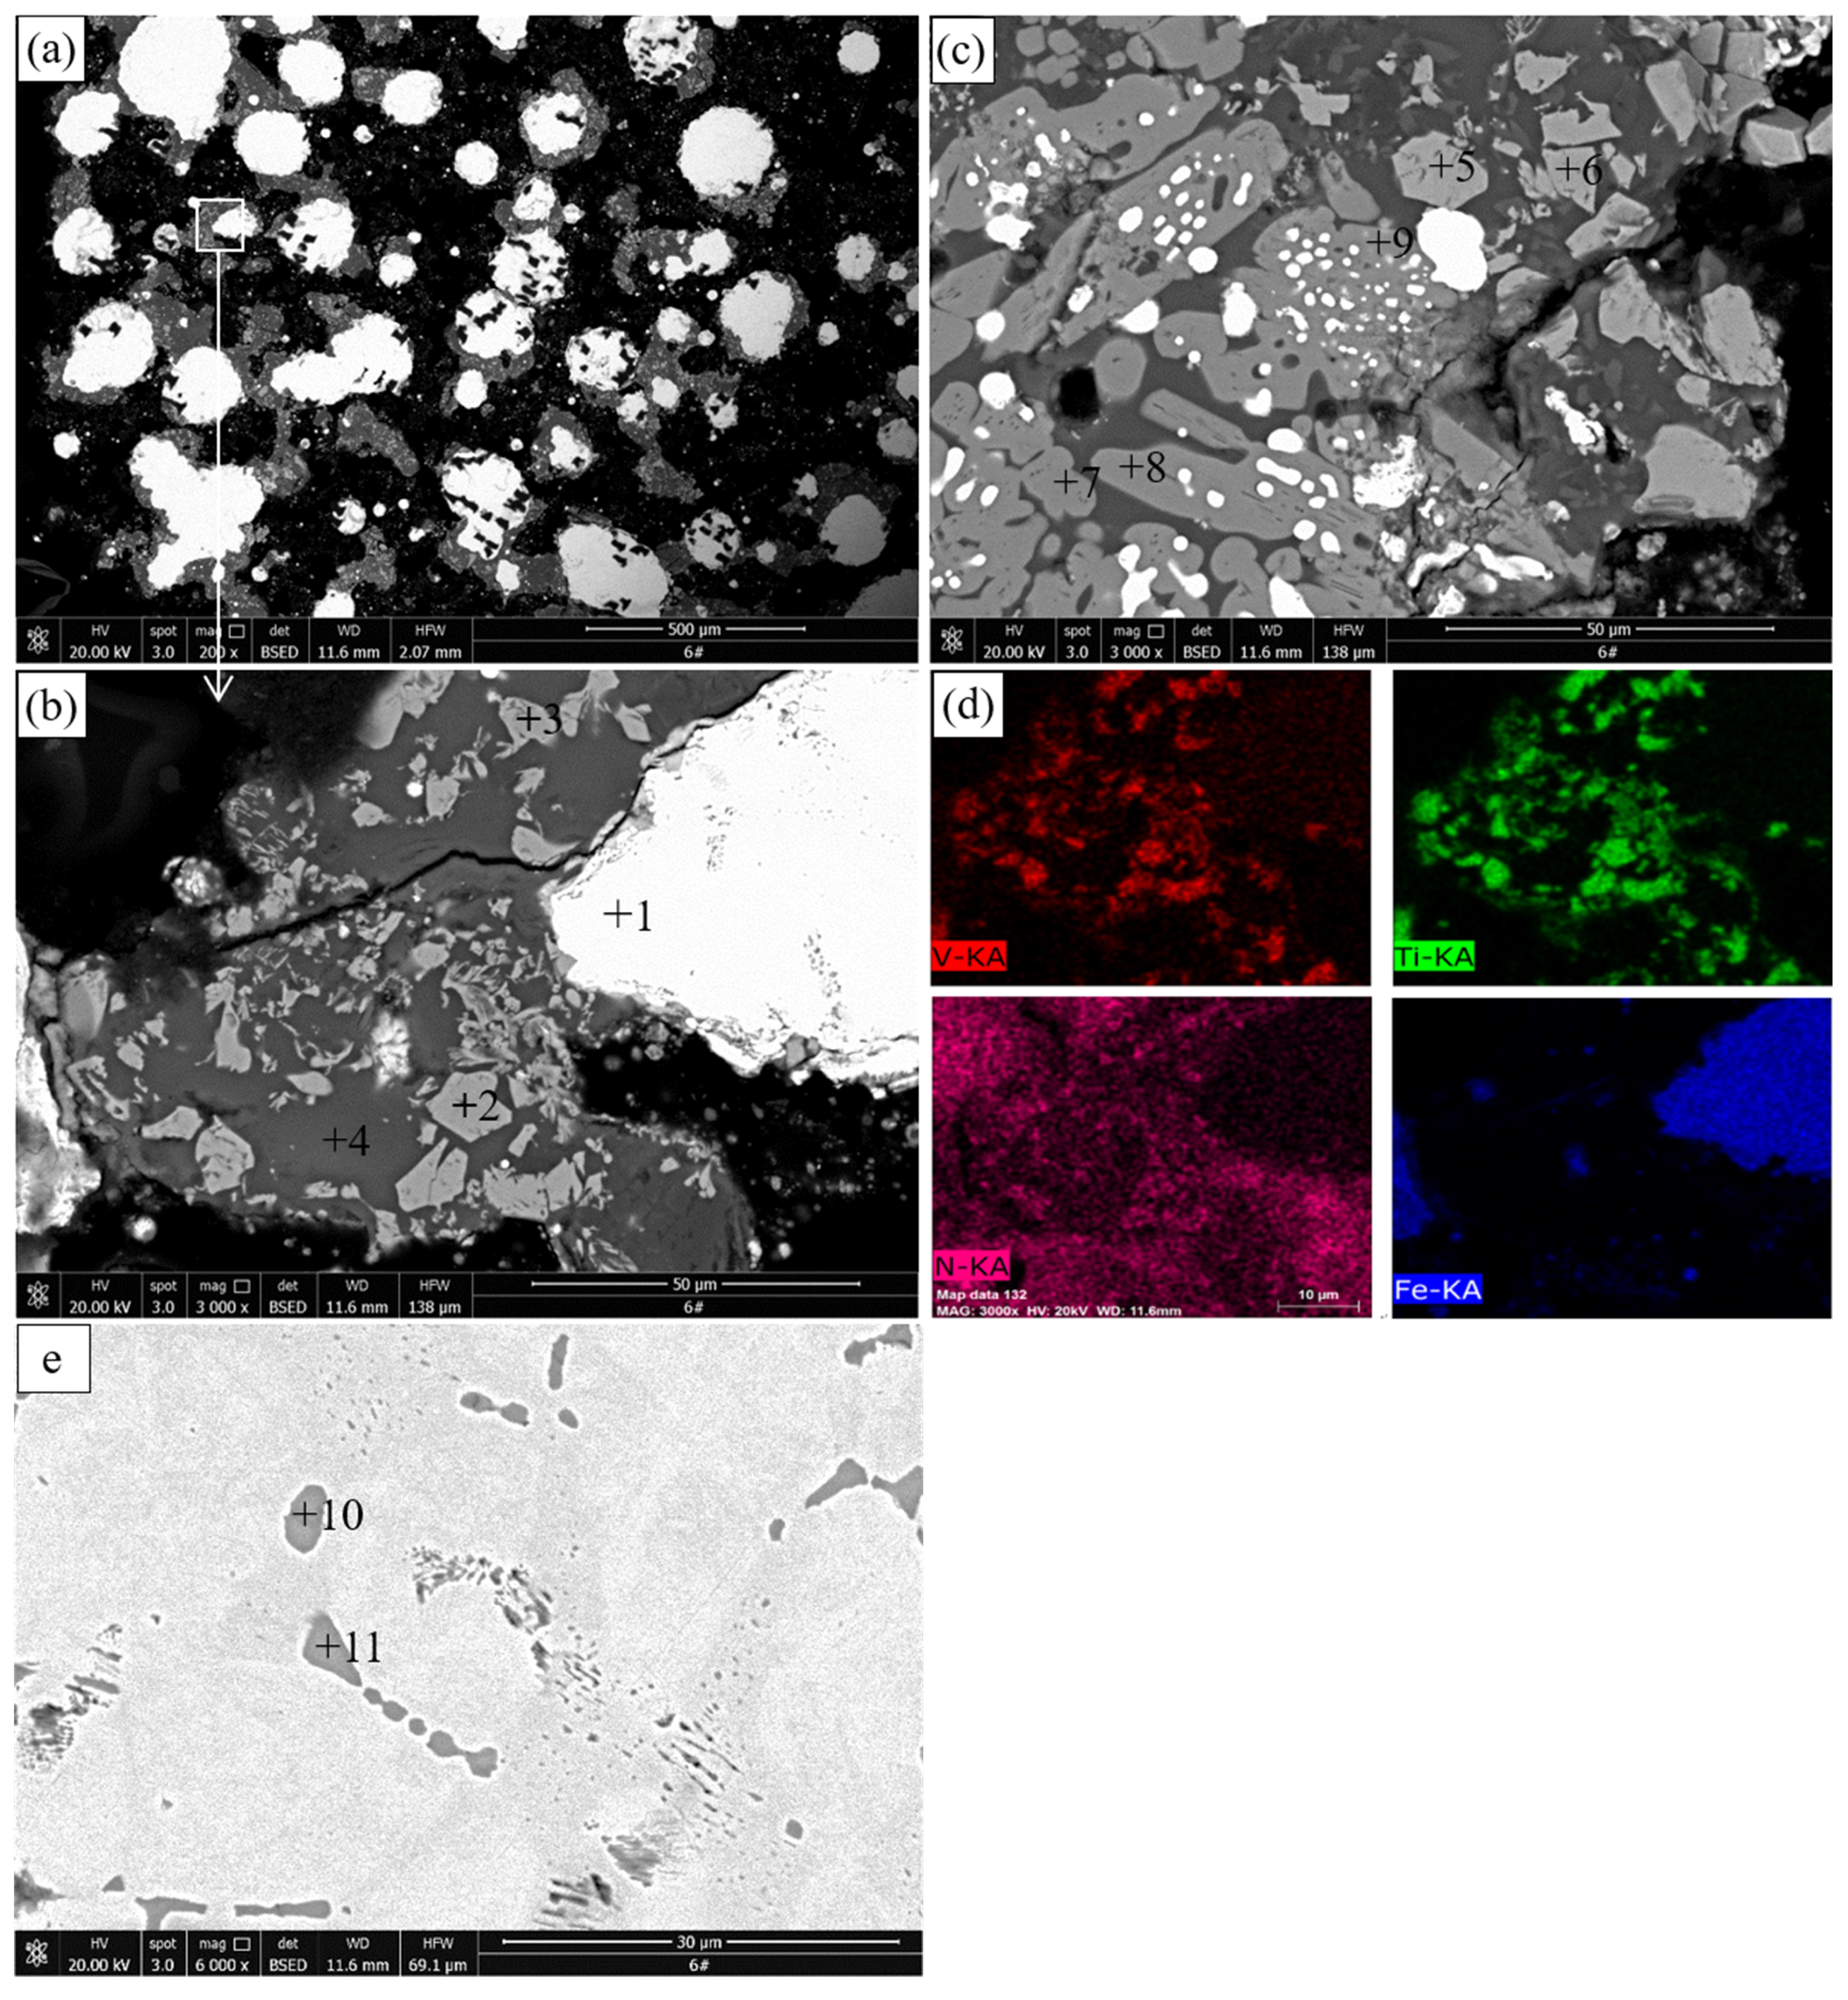
Figure 6 and
Table 5 show the microstructure and EDS results of the pellets roasted at 1200 °C.
As shown in
Figure 6a,b, several grayish particles (points 2 and 3) are formed on the surface of metallic iron in the reduced titanomagnetite. The EDS results show that they contain 59.45%–69.09% Ti, 18.08%–19.65% N, 1.97%–3.22% V, 6.68%–16.98% Fe, 0–0.99% O, and 1.94%–1.95% C. Combined with the XRD results in
Figure 2, these particles are TiN. TiN particles are first formed on the surface of metallic iron, which is consistent with the results reported by Gou [
23]. Two M
O
particles (points 4 and 5) without V are observed in the same area, which may have resulted from the reduction of ilmenite.
Figure 6c shows that many iron grains are generated in the reduced ilmenite. The Ti-bearing mineral remains as M
O
, and its Ti content is higher than that of at 1100 °C. At the same time, a small amount of MgAl
O
and V-containing sulfide particles are observed.
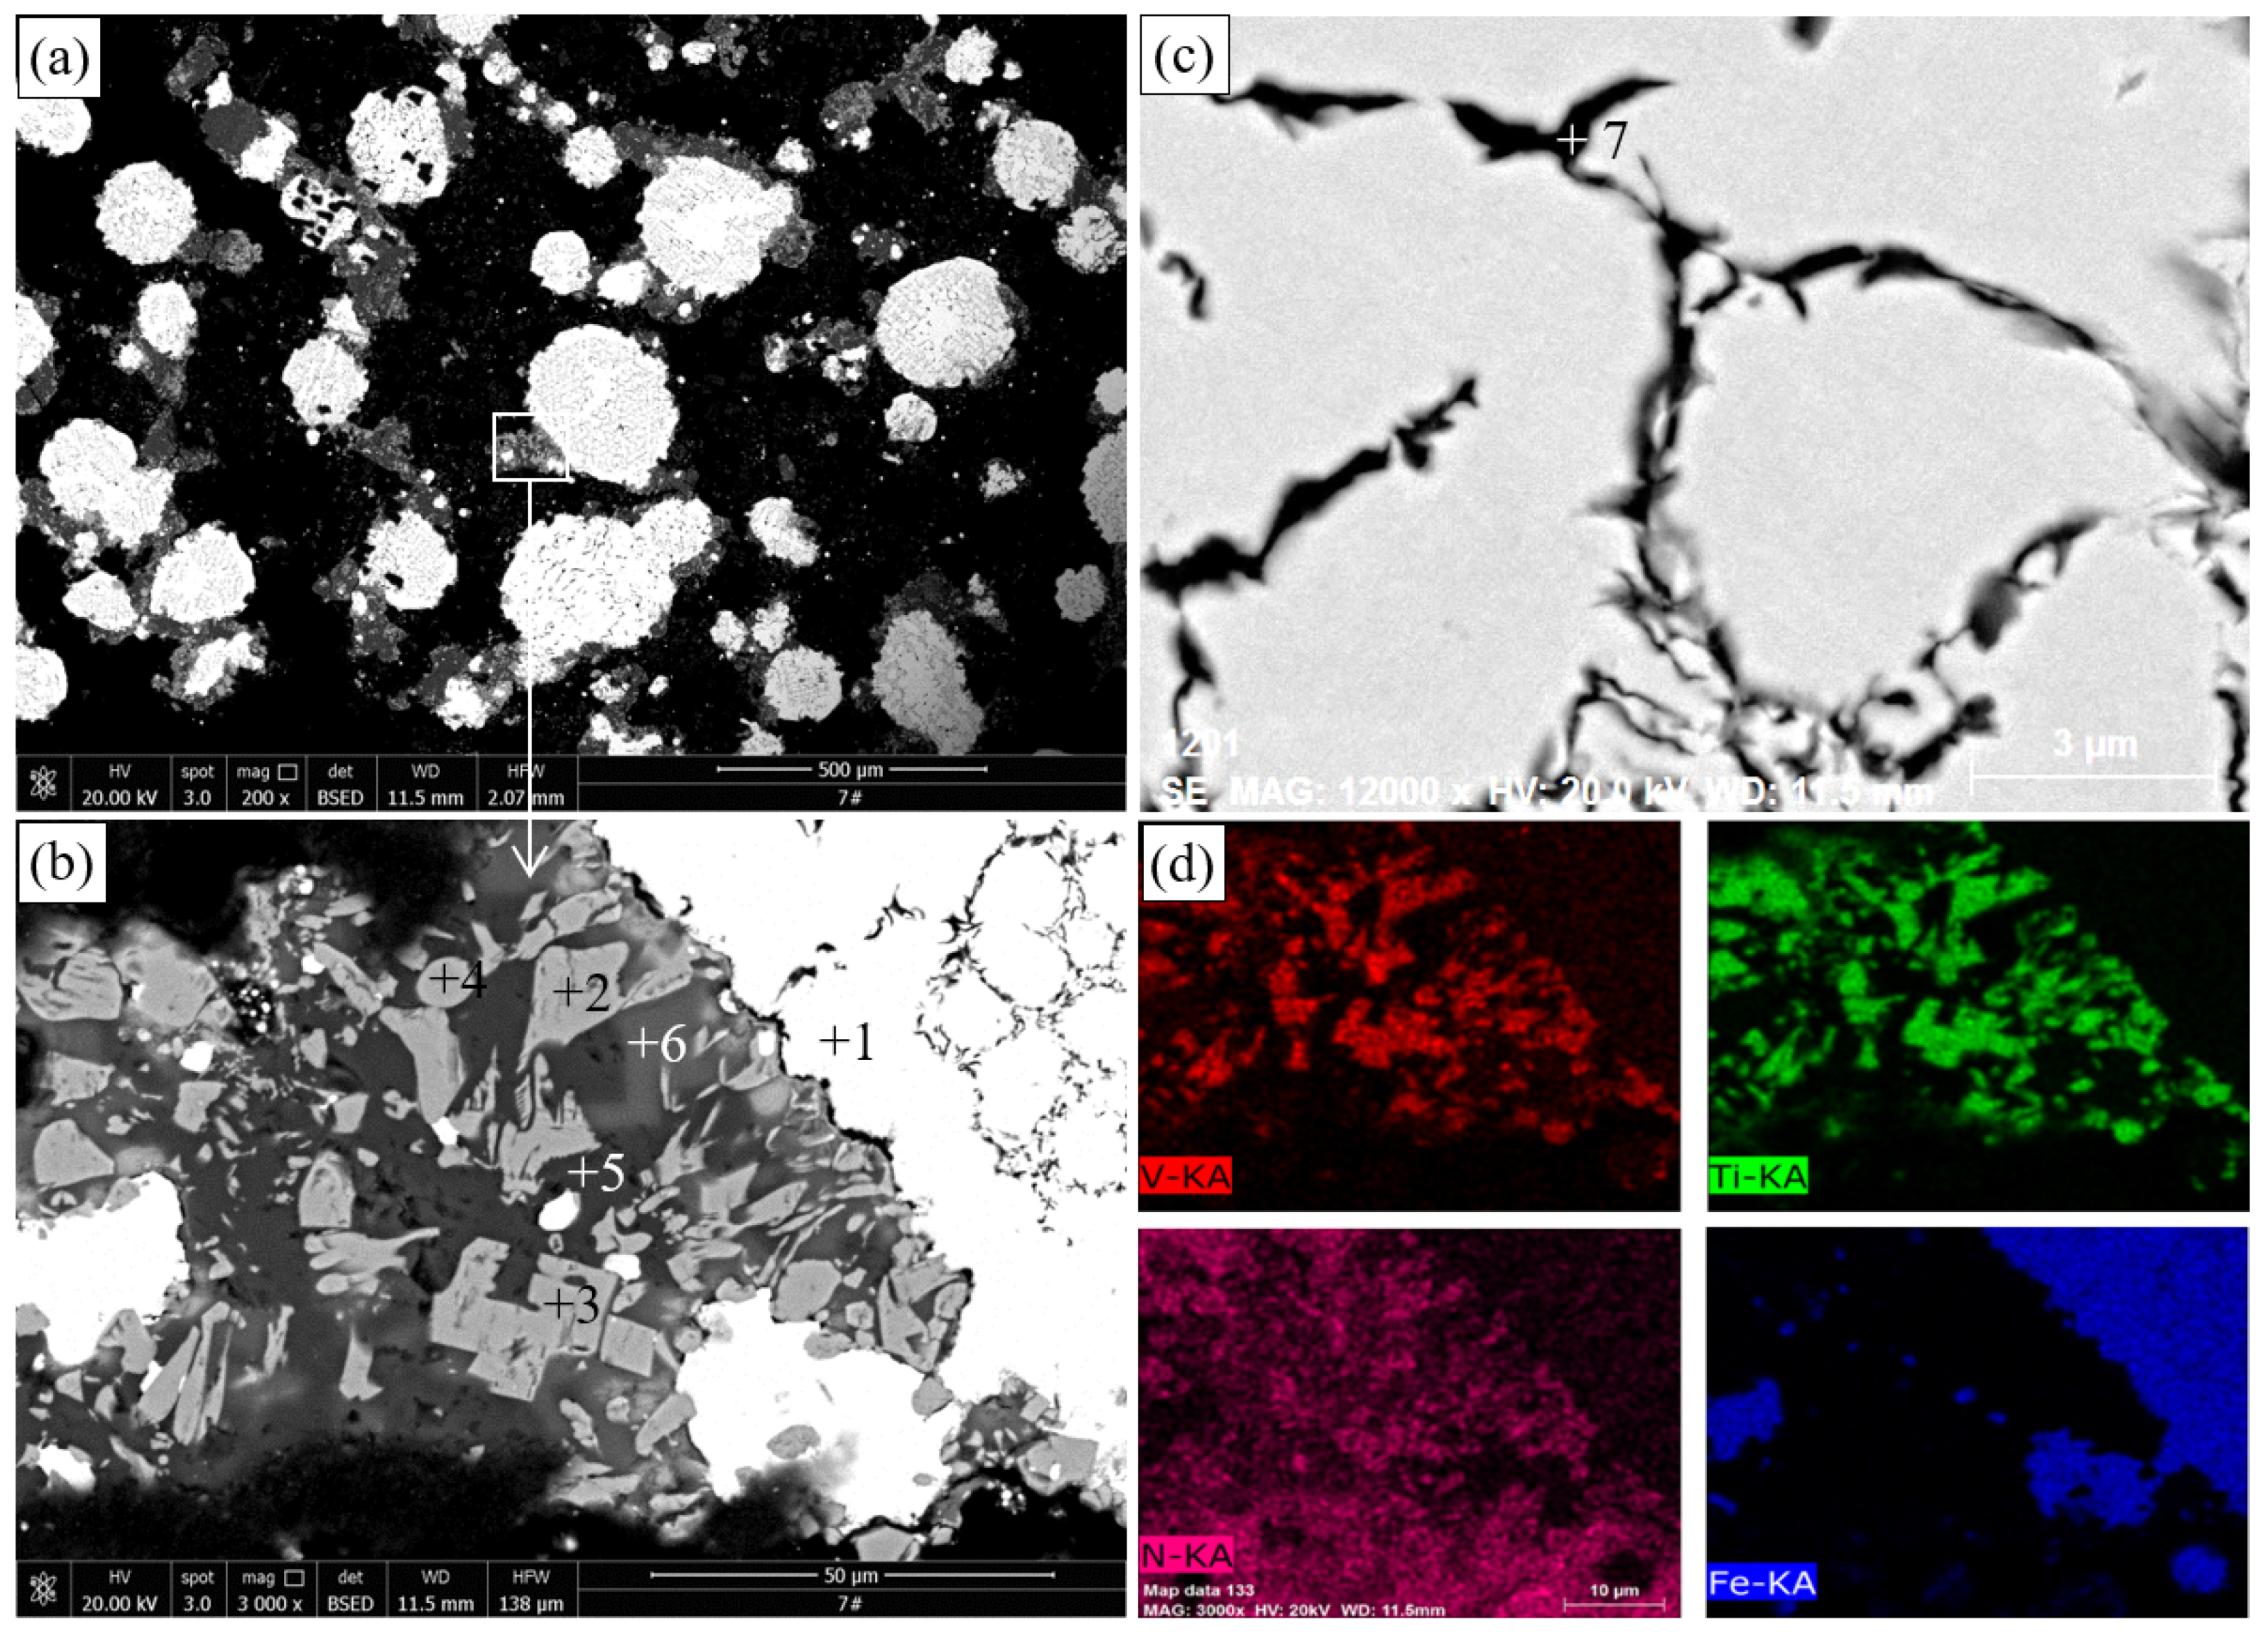
The SEM and EDS results of the pellets roasted at 1300 °C are illustrated in
Figure 7 and
Table 6, respectively.
Figure 7a shows that near-spherical iron particles with diameters of up to several hundred microns are generated in the roasted pellets. A part of C dissolves in metallic iron to form a liquid phase and Fe
C [
23], and the fine-grained metallic iron aggregates and grows to form spherical particles under the driving force of minimum surface energy when the experimental temperature is higher than the eutectic temperature of the Fe–C system (1154 °C) [
29].
Figure 7b shows that many TiN particles (light gray) below 10
m are distributed in the non-ferrous phase between the metallic iron particles in the reduced VTMC. This structure facilitates the separation of metallic iron and nonmagnetic material through grinding and magnetic separation [
30,
31].
Table 6 shows that the Fe content of the TiN phase falls to less than 1%, whereas its Ti content increases to 75.96%–78.62%. As shown in
Figure 7c, several unnitrided M
O
particles are observed. Similar to
Figure 6b,
Figure 7c shows that Ti-bearing minerals containing V are converted to TiN, whereas those without V are unnitrided. It can be inferred that the former is derived from titanomagnetite, whereas the latter is derived from ilmenite on the basis of the V contents of these particles. These results reveal that titanomagnetite is easier to convert into nitride than ilmenite is. The results in
Figure 7d show that the distribution of V and Ti is evidently coincidental. As shown in
Figure 7e, several inclusions (points 10 and 11) are observed in the metallic iron, and the EDS results in
Table 6 indicate that these inclusions are sulfur inclusions containing S, Fe, V, Cr, Mn, and Ti. These inclusions may evolve from the sulfides shown in
Figure 5 and
Figure 6.
Figure 8 and
Table 7 show the microstructure and EDS results of the pellet roasted at 1350 °C. The typical microscopic morphology of the roasted pellet is illustrated in
Figure 8b. M
O
particles were not found in the roasted pellet, indicating that M
O
was completely converted into TiN under this condition. Moreover, several TiN particles were embedded in metallic iron, because liquid iron has good wettability for TiN. Therefore, in order to obtain separate metallic iron and TiN products, the roasting temperature should not be too high.
Table 7 reveals that the V content of the TiN phase can reach 7.10%, and 1.46%–2.78% C was also detected in TiN phase.
Figure 8d shows that the distribution of V and Ti elements is highly coincidental. V was not detected in the metallic iron. It can be seen from
Figure 8c that cracked black material was observed in the metallic iron. The EDS results show that the material contains 36.71% Fe, 62.55% C, and 0.74% Si, indicating that the carburization of iron was enhanced with an increase in the roasting temperature. This facilitates the reduction of M
O
to TiN.
Based on the above analysis, it can be concluded that titanomagnetite was easier to convert into nitride than ilmenite was. V mainly coexisted with Ti during the entire reactions and finally formed (Ti, V)(N, C), while a small amount of V was enriched in the sulfur inclusions of metallic iron. When the roasting temperature was 1300 °C, TiN particles were mainly distributed in the slag phase and on the surface of metallic iron. However, when the roasting temperature exceeded 1300 °C, TiN particles tended to be immersed in metallic iron, which hindered the subsequent separation of TiN and metallic iron.


