Article

Mineralogical Appraisal of Bauxite Overburdens from Brazil

by
Leonardo Boiadeiro Ayres Negrão
,
Herbert Pöllmann
* and
Tiago Kalil Cortinhas Alves
Department of Mineralogy, Institute of Geosciences and Geography, Martin-Luther Halle-Wittenberg University, 06108 Halle, Germany
*
Author to whom correspondence should be addressed.
Minerals 2021, 11(7), 677; https://doi.org/10.3390/min11070677
Submission received: 17 May 2021 / Revised: 22 June 2021 / Accepted: 23 June 2021 / Published: 24 June 2021

Abstract

:
Mineralogical appraisal is an important tool for both mining and industrial processes. X-ray powder diffraction analysis (XRPD) can deliver fast and reliable mineralogical quantification results to aid industrial processes and improve ore recoveries. Furthermore, X-ray fluorescence (XRF) chemical data, thermal analysis (TA), and Fourier-transformed infrared spectroscopy (FTIR) can be used to validate and refine XRPD results. Mineralogical assessment of non-traditional ores, such as mining wastes, is also an important step to consider them for near-future industries. In the Brazilian Amazon, alumina-rich clays cover the largest and most important bauxitic deposits of the region and have been considered as a possible raw material for the local cement and ceramic industry. In this work, a mineralogical evaluation of these clays (Belterra Clays) is performed using XRPD, XRF, TA, and FTIR. XRPD-Rietveld quantification confirmed that kaolinite is the main phase of the clay overburden, followed by variable contents of gibbsite and goethite and minor quantities of hematite, anatase, and quartz. The chemistry derived from Rietveld, based on stoichiometric phase compositions, presents a good correlation with the XRF data and is also supported by the TA and FTIR data. The initially assumed homogeneous composition of Belterra Clay is revealed to be variable by the present mineralogical study.

1. Introduction

Chemical and phase assemblage characterizations are essential steps during industrial and mining processes to aid and improve ore processing. Traditional wet chemistry has been a reference method used for both ore and industrial products. However, these analyses are very expensive, known to consume large amounts of chemical reagents (including strong acids), and relatively slow. X-ray fluorescence (XRF) is currently one of the most used methods to determine the chemical composition of many ore types [1]. Nevertheless, XRF is not always the best option to obtain a comprehensive evaluation, as mineralogical information is necessary to understand the chemical distribution within the mineral phases and thus to evaluate ore deportment.
Mineralogical characterization is usually performed by X-ray powder diffraction (XRPD) analysis, which, when coupled with the Rietveld method, [2] enables the delivery of fast and reliable mineral phase quantifications. Online XRPD and XRF analyses are already standardized in the cement industry [3,4,5]. In the mining industry, the mineralogical evaluation of a variety of ores is commonly carried out by XRPD analysis, including Fe- [6,7], Ni (Co)- [8,9], Au- [10], Cu- [11,12], and Al-ore (bauxites) [13,14,15,16]. Other techniques are used to validate or even complement XRPD mineralogical analysis, such as XRF, Scan Electron Microscopy (SEM), Thermal Analysis (TA), and Fourier-transformed infrared spectroscopy (FTIR). Moreover, in many cases, assessment of ores and industrial products is performed alongside the characterization of mining residues, i.e., coal-related clays [17] and Al-refining tailings [18]. Some of these residues have been referred to as alternative raw materials, and their characterization is one of the first steps to evaluate their usage in the industry.
Bauxites, the main aluminum ore, have their largest reserves in Central and West Africa, Australia, Vietnam, and Brazil [19]. Open-pit mining of bauxite implies the removal of the bauxite overburden material, which might be shallow, as in Australia [20] and some bauxite deposits of West Africa [21,22], or relatively thick (>2 m), as in Brazil [23,24,25]. The bauxite overburden material in Brazil includes some topsoil and lateritic crusts, as well as thick clays that cover most bauxite deposits of the Brazilian Amazon region. These thick overburdens are usually considered a drawback during mining, as their removal increases the cost-effectiveness of the whole mining process. The bauxite overburdens in the Brazilian Amazon region are known as Belterra Clays (BTC, Figure 1) [23,24,25,26].
Belterra Clays are dominated by kaolinite and locally have high contents of gibbsite, with minor hematite, goethite, and anatase. Their high alumina contents, associated with broad availability and low exploitation costs, have turned attention to BTC as a possible near-future raw material for the local industry. Industrial applications of these clays for the production of red ceramics [27,28] and eco-friendly cements have recently been gaining attention [29]. In this work, we performed a detailed mineralogical evaluation of Belterra Clays from different locations within the bauxite deposits of Rondon do Pará in the Brazilian Amazon region. XRPD analysis was used as the basis of the mineralogical monitoring and is discussed in light of XRF, TA, and FTIR data. These data provide an important database for the potential use of these overburdens for the production of CO2-reduced cementitious materials.

2. Materials and Methods

For this study, we used eleven samples of Belterra Clay from three different pilot mines performed to test the bauxite ore in Rondon do Pará (Eastern Brazilian Amazon). The samples were collected in selected representative parts of the exposed clayey overburdens, with at least one sample from the top, one from the middle, and one from the base of the sequences in each pilot mine.
The samples are named according to their location and depth (in meters) within the BTC packet, and consist of three samples from the Branco bauxite pilot-mine (BRA0.5m, BRA5.0m, and BRA10m), three from the Décio pilot-mine (DEC0.8m, DEC7.2m, and DEC10m), and five samples from the Ciríaco pilot-mine (CIR1.0m, CIR5.0m, CIR7.5m, CIR10m, and CIR12m). All samples were carefully grinded to powders with clay size in an agate mortar until all grains were consistently fine for analysis. The analysis was performed using the following techniques.
XRPD analysis was performed using a Panalytical X’Pert Pro MPD X-ray diffractometer (Panalytical, Halle, Germany) equipped with a Cu anode, operated with 45 kV and 40 mA, set with a Ni Kβ-filter, and linear X’Celerator RTMS detector in the θ-θ Bragg-Brentano-Geometry. The samples were mounted by back-loading in 16 mm diameter sample holders and measured under 5–70° 2θ angular range, with a 0.013° step size, and at 38 s per step. Despite the use of a Cu source and the samples having relatively high iron contents, XRPD diffractograms had a good resolution with low background intensity and, therefore, were considered suitable for the Rietveld analysis. The data were evaluated with the software Highscore 4.5 Plus (Panalytical, Halle, Germany) from Panalytical. Principal component analysis (PCA) found large systematic variances (eigenvalues) in the set of observed samples. The method used a correlation matrix to display the most important eigenvalues (or Principal Component, PC) in a 3D plot. PCA was used to cluster similar diffractograms by similar profiles and peaks, using a Euclidian average linkage and a cut-off of 9.5. The closest sample of each sphere centroid (centroid method) was chosen as the representative sample of each group. The PDF-4 mineralogical database was used for the mineralogical characterization.
Rietveld refinement was used for the mineralogical quantification of the selected samples, which were spiked with 10% of highly crystalline fluorite to quantify the amorphous content using the internal standard method. The crystal structures (Table 1) used in the refinement were obtained from the ICSD (Inorganic Crystal Structure Database, from FIZ Karlsruhe, Germany). The accuracy of the Rietveld refinements was verified according to [30] by mixing the samples BRA13m with hematite and the sample BRA0.5m with gibbsite at 99:1, 95:5, and 90:10 ratios.
The refinements were performed with the software Highscore 4.5 Plus after preparing, measuring, and refining each sample in triplicate. The scale factor, the zero shift, and the unit cells were systematically refined. The Pseudo-Voigt profile function and W profile parameters were used to better refine the peak shapes.
For comparison purposes, the sample CIR14m was also refined with the software Profex BGMN [38], with a model for disordered kaolinite downloaded from the BGMN database (Kaolinitedis.str, in http://www.bgmn.de/download-structures.html, accessed on 4 February 2021). The stacking faults in the structure of kaolinite (as b/3 shifts and layers rotations within the structure) is refined with the sub-phase approach of the software, where the disordered kaolinite is described by two sub-phases that share the same lattice parameters but have individual broadening models to describe the hkl-dependent broadening in a phenomenological way [39].
FTIR spectroscopy was also used for the mineral characterization. Approximately 1 mg of dried sample was ground with 160 mg of KBr and pressed into a disk shape. The transmission IR spectra were recorded between 370 and 4000 cm−1 at room temperature, with a 4 cm−1 resolution, using a Bruker Tensor II TGA-IR spectrometer (Bruker, Billerica, MA, USA).
XRF was used to measure the chemical composition of the selected BTC samples. Four fused pearls were prepared by mixing 1 g of sample and 8 g of fondant (Li2B4O7) and measured in a Bruker SRS 3000 (Bruker, Billerica, MA, USA) sequential spectrometer. The loss on ignition (LOI) of the samples was determined after calcination at 1000 °C for one hour (Supplementary Materials, Table S1).
Thermal characterization of the selected samples was performed by thermogravimetric (TGA) and differential scanning calorimetric (DSC) analysis, using a Netzsch STA 449 F3 Jupiter® (Netzsch, Selb, Germany). Approximately 20 mg of sample was heated from 35 to 1000 °C in alumina crucibles under Ar-atmosphere, using a heating rate of 10 K/min.

3. Results

PCA analysis of the XRPD patterns enabled classifying them into three groups using the centroid method (Figure 2). Group 1 (green sphere) includes all BTC samples from Branco (BRA0.5m, BRA5.0m, and BRA13m) and all from Décio (DEC0.8m, DEC7.2m and DEC10m). Group 2 (blue sphere) is formed by the samples CIR0.5m, CIR5.0m, and CIR7.5m of Círiaco, whereas group 3 (gray sphere) includes the samples CIR10m and CIR14m from Círiaco.
The samples BRA0.5m and BRA13m were chosen as representative of group 1, whereas CIR0.5m was chosen for group 2, and CIR14m was chosen for group 3. These samples were quantified with the Rietveld method, and their mineralogical assemblage consists of kaolinite, gibbsite, goethite, hematite, anatase, and quartz, which vary only in contents (Figure 3). The only exceptions are quartz, which occasionally occurs in some samples, and hematite, which is present only in the samples closest to the surface (BRA0.5m, DEC0.8m, and CIR1.0m).
The Rietveld refinements confirm that kaolinite is the main mineral phase of the material (Figure 4, Supplementary Materials, Table S2), reaching up to 76.5% (BRA0.5m) and a minimum of 60.4% (CIR14m). Goethite varies slightly among the samples, from 14.8% to 15.9%. Gibbsite shows a stronger variation, from 3.2% to 19.2%, with higher contents in the Ciríaco mine samples. Hematite is absent in the samples close to the surface (0.5m) and represents close to 2% of the deepest samples. Anatase also shows only minor fluctuations, from 2.1% to 2.3%. Up to 2.6% of quartz was quantified, but it occurs rather occasionally as sparse quartz grains in BTC [25].
Even though the Rietveld results do not show a strong variation in the quantitative mineralogy, the Rietveld-calculated patterns presented visible misfittings in the regions 19.6–26 2θ (4.5–3.4 Å) and 34.5–37 2θ (2.6–2.4 Å) (Figure 5). These are essentially related to the refinement of kaolinite, which presents anomalous diffraction bands due to its low-ordered configuration. The disorder in kaolinite structure is mainly caused by faults in layer stacking [40]. In order to overcome this issue when refining bauxite samples rich in low-ordered kaolinites, Paz et al. [13] successfully used a calibrated hkl phase to refine this mineral in bauxites. Nevertheless, depending on the degree of disorder, an hkl phase might not accurately fit the XRPD pattern of significantly disordered kaolinites.
An improved Rietveld-calculated fitting was achieved when using a model for disordered kaolinite (Figure 6). When compared to the previous results (Figure 5), the quantified mineral contents using the model diverge little for most of the phases (differences are close to 1%). However, kaolinite and the amorphous show a greater discrepancy. The kaolinite content is 4.6% lower when using the model for disordered kaolinite, and the amorphous is proportionally 3.7% higher. These differences are most likely related to the amorphous quantified using the internal standard method, where the over-quantified content of fluorite (internal standard) from its known added amount (10%) is recalculated as amorphous. Referencing the content, for 10.46% of fluorite quantified by the Rietveld method, the indirect calculated amorphous will be 4.6% (Figure 5), whereas it would be 0.9% (Figure 6) for a quantification of 10.09% of fluorite in the sample. Therefore, even minor differences in the first decimal case will strongly influence the amorphous quantifications when using the internal standard method. Nevertheless, 62% of kaolinite was stoichiometrically calculated after XRF (considering that all SiO2 is in this phase), which is similar to the amount obtained in the refinement without the model (60.4%, Figure 5) and indicates that the amorphous composition in both cases (whether 0.9% or 4.6%) should have a composition close to that of kaolinite.
Besides the improvement in the Rietveld fit using the model of disordered kaolinite, the refinement was more unstable and time-consuming due to the increased interactions among the Rietveld parameters. Another attempt to better understand the contribution of defects in the structure of kaolinite was presented by Leonardi and Bish [41], who simulated the XRPD patterns of kaolinites with different layer-stacking defects and used them to analyze the patterns of natural samples. They observed that the 00l reflections are solely affected by the quantity of layers in the crystals, whereas the hkl reflections are also related to the amount and the nature of stacking defects, for which the stacking distance, the lateral indentation, the structure misorientation, and the structure shift were accounted. However, while the work helps to understand the nature of stacking faults in kaolinites and their contributions to their XRPD profiles, such complex profile simulations still require the use of supercomputers.
The hematite and gibbsite mixture additions proved the accuracy of the refinements (Figure 7). For both mixtures, measured in triplicate, R2 is higher than 0.99. The resulting linear function permitted knowing the calibrated amounts of gibbsite and hematite in the samples (when x = 0). These are 3.15% of gibbsite in the sample BRA0.5m and 1.99% of hematite in the sample BRA13m, values very close to the 3.1% and 2.2% quantified in the original samples, respectively. A wider standard deviation is observed for the addition of 5% of gibbsite, as a result of the preferred orientation of (00l) planes of gibbsite crystallites, which could not be completely solved using the March–Dollase function in the Rietveld refinement.
Fourier-transformed infrared spectra of the Belterra Clay samples BRA13m and CIR14m are very similar (Figure 8), showing the same bands with different intensities. Modeled and well-ordered kaolinites have well-defined OH stretching bands at 3697 (strong), 3669 (weak), 3652 (weak), and 3620 cm−1 [42,43]. Except for the weak band at 3669 cm−1, these other bands are present in the FTIR spectra of BTC and confirm the presence of kaolinite. The disappearance of the 3669 cm−1 band was observed in low-ordered kaolinites by Brindley et al. [44]. These authors also reported a stronger 3652 cm−1 band in low-ordered kaolinites, which is a characteristically strong band in dickites and related to a disorder in the structure of kaolinite caused by the displacement of the octahedral sites’ vacancies.
The band at 3620 cm−1 is also an intense and characteristic band of gibbsite OH stretching, which presents its further common bands at 3526, 3441 (wider), 3393, and 3373 cm−1 [45]. The bands attributed to gibbsite are much more intense for CIR14m due to its higher gibbsite content. The wide band with a maximum of 3441 cm−1 also coincides with a non-stoichiometric OH stretching of goethite [46,47]. This mineral presents the less obvious band at ~3062 cm−1, attributed to stoichiometric OH.
In the mid-IR range (Figure 8B) of the spectra, the bands at 1112, 1103, 1032, and 1008 cm−1 are characteristic of the Si-O stretching modes of kaolinite, whereas the band at 798 is due to the OH bend of goethite. The further bands are mainly related to the contribution of the displacement of Si, Al, and H.
The thermal analysis (Figure 9) shows four main mass-losses resulting from the heating of the BTC samples. They are well-evidenced by both DTG and DSC peaks with maximums at 50 °C, 270 °C, 375 °C, and 535 °C. The first is related to the loss of residual water absorbed by the BTC grains, whereas the following ones represent gibbsite, goethite, and kaolinite. Gibbsite dehydroxylates from 240 to approximately 380 °C, forming ρ-Al2O3 [48], with a consequent mass-loss of 5.49% for the CIR14m sample and 1.8% for BRA13m. The mass-loss from 340 to 410 °C corresponds to the dehydroxylation of goethite [46,47], releasing approximately 1.85% of water. The last mass-loss, 59.5% in the CIR14m and 71.9% in BRA13m, is attributed to kaolinite’s decomposition to form metakaolinite [49], which later goes to mullite at approximately 980 °C [50]. The thermal analyses not only confirm the main mineralogy of the BTC samples, but are also consistent with their relative mineralogical abundancy. Using the observed mass-losses to stoichiometrically calculate mineral contents, 59.5% of kaolinite, 15.8% of gibbsite, and 16.2% of goethite are estimated for CIR14m. For BRA13m, 71.9% of kaolinite, 3.8% of gibbsite, and 16.2% of goethite are computed after the mass-losses. The calculated results are a good approximation to those obtained by the Rietveld analysis. Minor differences might be due to low-ordered and non-stoichiometric phases, such as goethite, known to be rich in Al [15]. For instance, an Al-free goethite [FeO(OH)] has 10.14% of H2O, whereas an Al-rich goethite [(Fe0.66Al0.34)O(OH)] has 11.73% of H2O to be stoichiometrically balanced. Furthermore, non-stoichiometric hydroxyl units normally occur incorporated into the structure of goethites and were found to increase proportionally to the Al/Fe ratio in this mineral [46,47].

4. Discussions

The influence of the different minerals on components of the PCA analysis is easily seen in the mineralogical quantification of the representative samples of each PCA group (Figure 4). The major difference concerns their kaolinite vs. gibbsite contents, which are proportional to the intensity of the main XRPD peaks of these minerals. Minerals with concentrations lower than 3% (quartz, hematite, and anatase, right portion of Figure 4) have some contrasting values within the same group (i.e., BRA0.5m and BRA13m of group 1). Nevertheless, these changes in minor contents (~1%) did not affect the PCA grouping, whereas the changes for kaolinite and gibbsite contents (over 10%) controlled the PCA sorting. If one wishes to consider the changes caused by minerals in minor proportions, the defined cut-off of PCA must be reduced, and the clustering would result in PCA groups composed of two or even only one scan, therefore not reducing the amount of data.
In XRPD, PCA can also be used to build calibration curves for specific minerals by inserting XRPD patterns of pure mineral phases (for example, varying from 0% to 100%) added to series of samples. However, a kaolinite standard with a XRPD pattern similar to ours is necessary to build a calibration curve for our samples, which is challenging due to the varying crystallinity of it.
The low-ordered character of kaolinite was confirmed by the different techniques used. Poorly defined peaks, or even the absence of them, were noticed in the XRPD patterns, which were better fitted in the Rietveld refinements using a special model of low-ordered kaolinite. The OH bands of kaolinite observed in the FTIR spectra are also typical of low-ordered ones. Nevertheless, a crystallinity estimation (i.e., crystallinity index) for kaolinite from the XRPD patterns [51,52] was not possible in this work, as the (02l) and (11l) reflexes of kaolinite in Belterra Clay are partially overlapped by the reflexes of gibbsite and goethite.
The chemical composition and LOI of the samples, calculated after the Rietveld results (Table S1), are plotted against the ones measured by XRF in Figure 10. The results show a good correlation with R2 > 0.9 for the most abundant components (Al2O3, SiO2, Fe2O3, and LOI) when using the following stoichiometric compositions: for kaolinite, Al2Si2O5(OH)4; for gibbsite, Al(OH)3; and for goethite, (Fe0.66Al0.34)O(OH), which is close to the average composition of BTC goethites in Rondon do Pará [15,25]. Instead, if Al-free goethite is considered, this correlation is much poorer for Fe2O3 (R2 = 0.8334). The poorest correlation is notably for TiO2 (R2 = 0.6297), which shows very low content and is solely influenced by the anatase. Due to its small quantities, this phase is consequently more influenced by expected errors of the Rietveld refinement [53].
Belterra Clay has indeed a similar chemical composition among the studied samples, except for Al2O3, which shows a variation of 4.8% from the BTC at Círiaco mine (CIR14m) to the BTC at Branco mine (BRA0.5m). Such variable alumina contents will further influence BTC’s possible applicability. For ceramic purposes [27], an increase in alumina is usually related to an increase in refractoriness [54]. When applied to the production of calcium sulphoaluminate-based cements (CSAs), BTCs richer in alumina will favor the formation of calcium sulphoaluminates, whereas those with lower alumina (and consequently higher SiO2) will result in CSA cements richer in calcium silicates [29].
Finally, the variations in SiO2 and Al2O3 are mostly controlled by kaolinite and gibbsite in Belterra Clay, as the higher the gibbsite-to-kaolinite ratio is in BTC, the more enriched in alumina it will be. Gibbsite is mostly found in bauxitic nodules that occur within the clayey fraction of Belterra Clays [15,24,25,55].

5. Conclusions

The mineralogical evaluation of the clay-rich overburden of bauxites from Brazil based on XRPD analysis shows good agreement with the independently acquired results obtained by XRF chemical analysis, FTIR, and TA. When compared to traditional wet chemistry methods, the use of XRPD analysis is enhanced by the possibility of acquiring data faster, using simpler and cheaper sample preparation. Applied to BTC, the Rietveld analysis was able to deliver reliable mineralogical and chemical-derived results for the main oxides.
XRF, FTIR, and TA were complementary and crucial for an initial validation of the XRPD results and for the verification of minor phases (close to 1%). After such validations, XRPD can be applied to a variety of similar samples for rapid mineralogical control. For reliability of the results, the chemistry composition calculation after Rietveld analysis must consider the possibility of solid solutions and non-stoichiometric compositions, as was seen for Al-rich goethites in BTC.
The studied BTC samples have a quasi-homogeneous composition for Fe2O3 and TiO2, controlled, respectively, by goethite and anatase. On the other hand, SiO2 and Al2O3 are more variable, influenced by the abundancies of kaolinite and gibbsite. The major differences in an industrial application of BTC will be further related to its alumina contents. Whereas the alumina content of Belterra Clay is too low for Al-ore (as bauxite), it is high enough to consider it as a non-traditional raw material to be used in the cement or ceramic industries.

Supplementary Materials

The following materials are available online at https://www.mdpi.com/article/10.3390/min11070677/s1, Table S1. Chemistry (wt. %) of the studied representative Belterra Clay samples, Table S2. Mineralogical composition of the studied representative Belterra Clay samples after the Rietveld-XRPD quantifications. Rwp: R-weighted profile; GOF: goodness of fit.

Author Contributions

Conceptualization, L.B.A.N. and H.P.; methodology, L.B.A.N.; software, L.B.A.N. and T.K.C.A.; formal analysis, L.B.A.N.; investigation, L.B.A.N.; resources, L.B.A.N. and H.P.; data curation, L.B.A.N. and T.K.C.A.; writing—original draft preparation, L.B.A.N.; writing—review and editing, H.P.; supervision, H.P.; funding acquisition, L.B.A.N. All authors have read and agreed to the published version of the manuscript.

Funding

This research was funded by CAPES foundation, grant number: 88881.199654/2018-01.

Data Availability Statement

The data produced is available in this publication and in its Supplementary material. Further data can be shared after request to the authors.

Acknowledgments

The authors acknowledge Marcondes Lima da Costa and the company Nexa Resources for the BTC samples. The financial support (first author) of the Brazilian CAPES foundation, through the grant 88881.199654/2018-01, and the valuable contributions of the editors and anonymous reviewers are also gratefully acknowledged.

Conflicts of Interest

The authors declare no conflict of interest.

References

  1. Streli, C.; Wobrauschek, P.; Kregsamer, P. X-ray Fluorescence Spectroscopy, Applications. In Encyclopedia of Spectroscopy and Spectrometry; Elsevier: Amsterdam, The Netherlands, 1999; pp. 2478–2487. [Google Scholar]
  2. Rietveld, H.M. A profile refinement method for nuclear and magnetic structures. J. Appl. Crystallogr. 1969, 2, 65–71. [Google Scholar] [CrossRef]
  3. Aranda, M.A.G.; De la Torre, A.G.; León-Reina, L. Powder-diffraction characterization of cements. In International Tables for Crystallography; International Union of Crystallography: Chester, UK, 2019; ISBN 9780470685754. [Google Scholar] [CrossRef]
  4. Galluccio, S.; Pöllmann, H. Quantifications of Cements Composed of OPC, Calcined Clay, Pozzolanes and Limestone. In Calcined Clays for Sustainable Concrete; Springer: Berlin/Heidelberg, Germany, 2020. [Google Scholar]
  5. Khelifi, S.; Ayari, F.; Tiss, H.; Hassan Chehimi, D. Ben X-ray fluorescence analysis of Portland cement and clinker for major and trace elements: Accuracy and precision. J. Aust. Ceram. Soc. 2017, 53, 743–749. [Google Scholar] [CrossRef]
  6. König, U.; Norberg, N.; Gobbo, L. From iron ore to iron sinte-Process Control using X-ray Diffraction. In Proceedings of the 45° Ironmaking/16° Iron Ore/3° Agglomeration, Rio de Janeiro, Brazil, 17–21 August 2015; pp. 146–153. [Google Scholar]
  7. De Villiers, J.P.R.; Lu, L. XRD analysis and evaluation of iron ores and sinters. In Iron Ore: Mineralogy, Processing and Environmental Sustainability; Elsevier: Amsterdam, The Netherlands, 2015; pp. 85–100. [Google Scholar]
  8. Santoro, L.; Putzolu, F.; Mondillo, N.; Herrington, R.; Najorka, J.; Boni, M.; Dosbaba, M.; Maczurad, M.; Balassone, G. Quantitative mineralogical evaluation of Ni-Co laterite ores through XRPD-QPA- and automated SEM-based approaches: The Wingellina (Western Australia) case study. J. Geochem. Explor. 2021, 223, 106695. [Google Scholar] [CrossRef]
  9. Ribeiro, P.P.M.; de Souza, L.C.M.; Neumann, R.; dos Santos, I.D.; Dutra, A.J.B. Nickel and cobalt losses from laterite ore after the sulfation-roasting-leaching processing. J. Mater. Res. Technol. 2020, 9, 12404–12415. [Google Scholar] [CrossRef]
  10. Ospina-Correa, J.D.; Mejía-Restrepo, E.; Serna-Zuluaga, C.M.; Posada-Montoya, A.; Osorio-Cachaya, J.G.; Tamayo-Sepúlveda, J.A.; Calderón-Gutiérrez, J.A. Process mineralogy of refractory gold ore in thiosulfate solutions. Hydrometallurgy 2018, 182, 104–113. [Google Scholar] [CrossRef]
  11. Rahfeld, A.; Kleeberg, R.; Möckel, R.; Gutzmer, J. Quantitative mineralogical analysis of European Kupferschiefer ore. Miner. Eng. 2018, 115, 21–32. [Google Scholar] [CrossRef]
  12. Li, G.; Cheng, H.; Xu, C.; Lu, C.; Lu, X.; Zou, X.; Xu, Q. Mineralogical Analysis of Nickel/Copper Polymetallic Sulfide Ore by X-ray Diffraction Using Rietveld Method. In Characterization of Minerals, Metals, and Materials 2016; Ikhmayies, S.J., Li, B., Carpenter, J.S., Hwang, J.-Y., Monteiro, S.N., Li, J., Firrao, D., Zhang, M., Peng, Z., Escobedo-Diaz, J.P., et al., Eds.; Springer International Publishing: Cham, Switzerland, 2016; pp. 67–74. [Google Scholar]
  13. Paz, S.P.A.; Angélica, R.S.; Kahn, H. Optimization of the reactive silica quantification method applied to Paragominas-type gibbsitic bauxites. Int. J. Miner. Process. 2017, 162, 48–57. [Google Scholar] [CrossRef]
  14. Melo, C.C.A.; Angélica, R.S.; Paz, S.P.A. A proposal for rapid grade control of gibbsitic bauxites using multivariate statistics on XRD data. Miner. Eng. 2020, 157, 106539. [Google Scholar] [CrossRef]
  15. Negrão, L.B.A.; da Costa, M.L.; Pöllmann, H.; Horn, A. An application of the Rietveld refinement method to the mineralogy of a bauxite-bearing regolith in the Lower Amazon. Mineral. Mag. 2018, 82, 413–431. [Google Scholar] [CrossRef]
  16. Negrão, L.B.A.; da Costa, M.L. Mineralogy and geochemistry of a bauxite-bearing lateritic profile supporting the identification of its parent rocks in the domain of the huge Carajás iron deposits, Brazil. J. South. Am. Earth Sci. 2021, 108, 103164. [Google Scholar] [CrossRef]
  17. De Ruan, C.; Ward, C.R. Quantitative X-ray powder diffraction analysis of clay minerals in Australian coals using Rietveld methods. Appl. Clay Sci. 2002, 21, 227–240. [Google Scholar] [CrossRef]
  18. Santini, T.C. Application of the Rietveld refinement method for quantification of mineral concentrations in bauxite residues (alumina refining tailings). Int. J. Miner. Process. 2015, 139, 1–10. [Google Scholar] [CrossRef]
  19. U.S Geological Survey. Mineral Commodity Summaries; U.S Geological Survey: Reston, VA, USA, 2021. [Google Scholar]
  20. Horbe, A.M.C.; Anand, R.R. Bauxite on igneous rocks from Amazonia and Southwestern of Australia: Implication for weathering process. J. Geochem. Explor. 2011, 111, 1–12. [Google Scholar] [CrossRef]
  21. Nyamsari, D.G.; Yalcin, M.G. Statistical analysis and source rock of the Minim-Martap plateau bauxite, Cameroon. Arab. J. Geosci. 2017, 10, 415. [Google Scholar] [CrossRef]
  22. Sidibe, M.; Yalcin, M.G. Petrography, mineralogy, geochemistry and genesis of the Balaya bauxite deposits in Kindia region, Maritime Guinea, West Africa. J. Afr. Earth Sci. 2019, 149, 348–366. [Google Scholar] [CrossRef]
  23. Horbe, A.M.C.; da Costa, M.L. Lateritic crusts and related soils in eastern Brazilian Amazonia. Geoderma 2005, 126, 225–239. [Google Scholar] [CrossRef]
  24. Truckenbrodt, W.; Kotschoubey, B.; Schellmann, W. Composition and origin of the clay cover on North Brazilian laterites. Geol. Rundsch. 1991, 80, 591–610. [Google Scholar] [CrossRef]
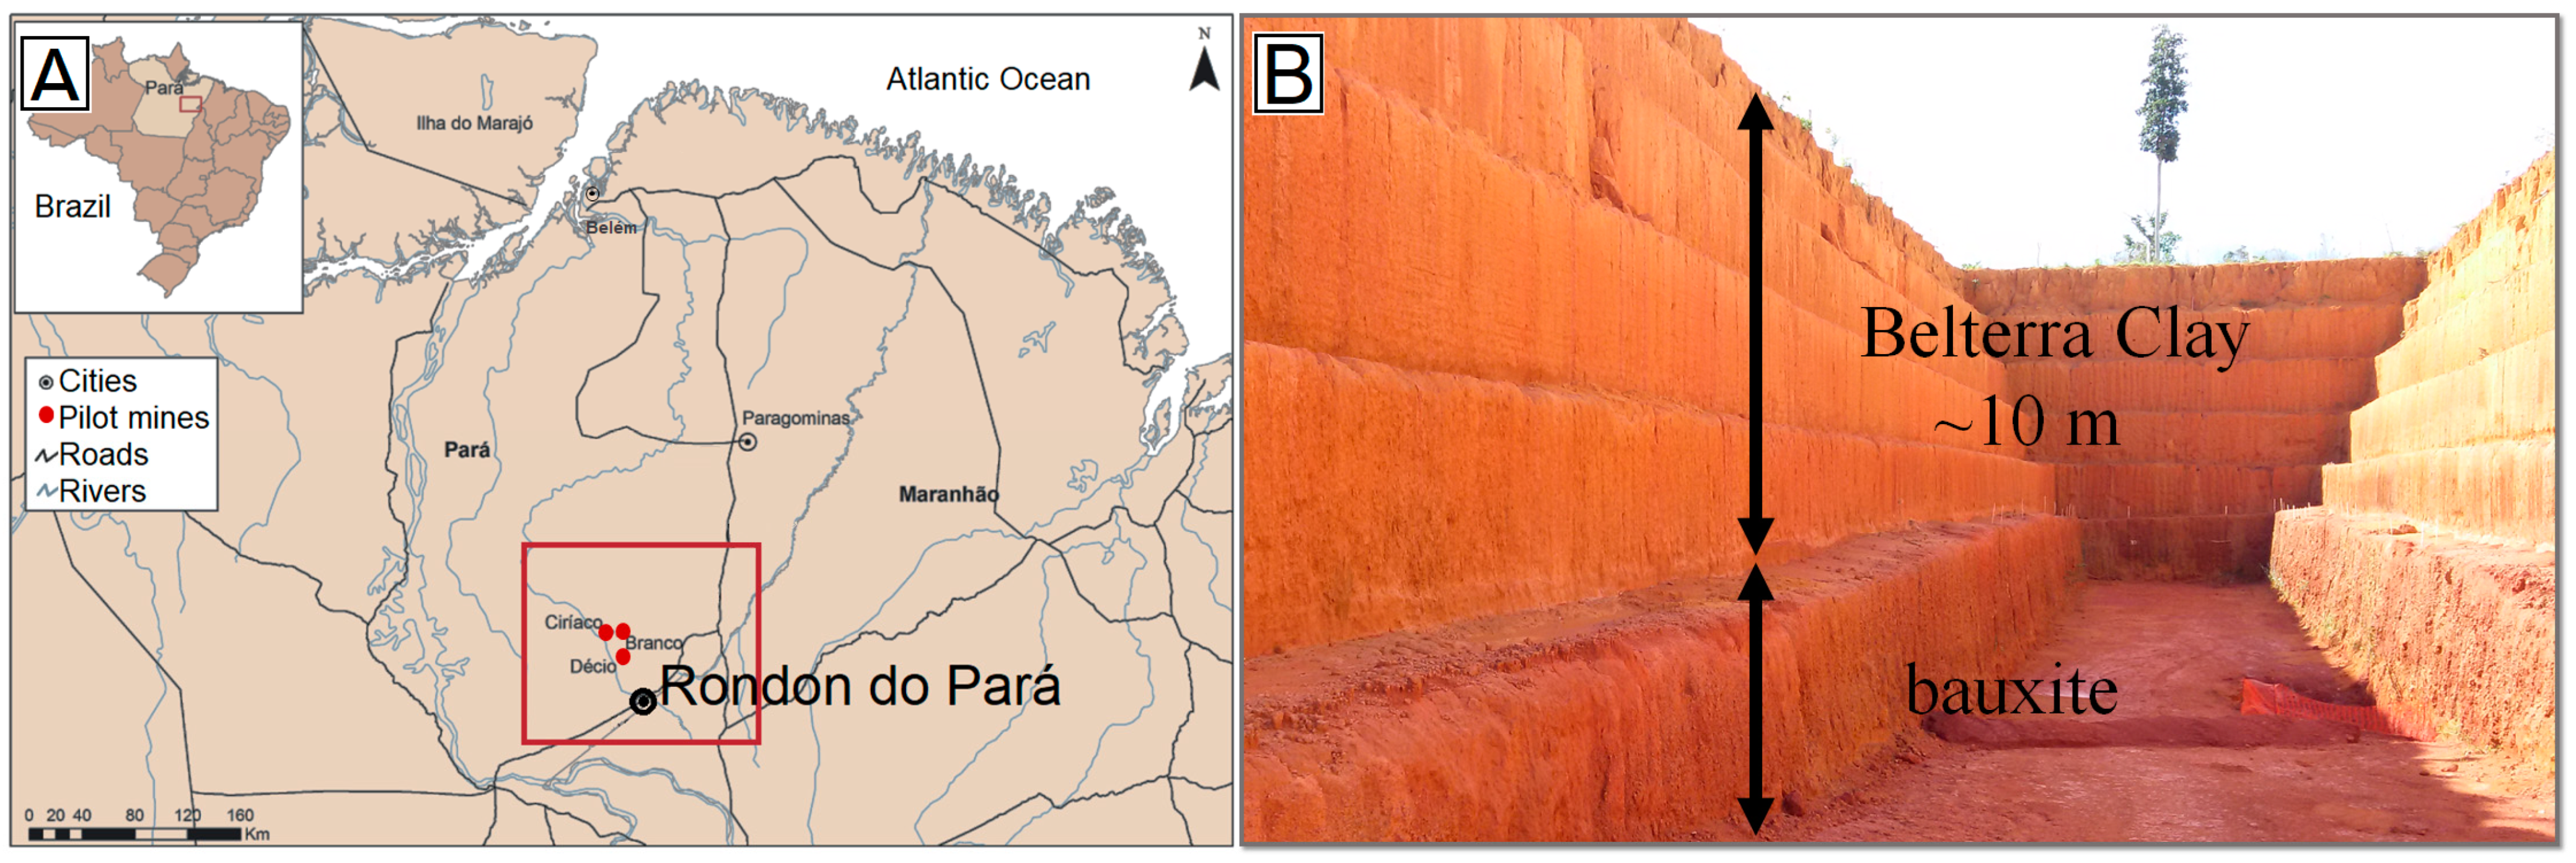
  25. Negrão, L.B.A.; da Costa, M.L.; Pöllmann, H. The Belterra Clay on the bauxite deposits of Rondon do Pará, Eastern Amazon. Braz. J. Geol. 2018, 48, 473–484. [Google Scholar] [CrossRef]
  26. Sombroek, W.G. Amazon Soils: A Reconnaissance of the Soils Region, the Brazilian Amazonitle; Wageningen University: Wageningen, The Netherlands, 1966. [Google Scholar]
  27. Barreto, I.A.R.; da Costa, M.L. Sintering of red ceramics from yellow Amazonian latosols incorporated with illitic and gibbsitic clay. Appl. Clay Sci. 2018, 152, 124–130. [Google Scholar] [CrossRef]
  28. Barreto, I.A.R.; da Costa, M.L. Viability of Belterra clay, a widespread bauxite cover in the Amazon, as a low-cost raw material for the production of red ceramics. Appl. Clay Sci. 2018, 162, 252–260. [Google Scholar] [CrossRef]
  29. Negrão, L.B.A.; Pöllmann, H.; da Costa, M.L. Production of low-CO2 cements using abundant bauxite overburden “Belterra Clay”. Sustain. Mater. Technol. 2021, e00299. [Google Scholar] [CrossRef]
  30. Negrão, L.B.A.; Pöllmann, H. The Phase Addition method to evaluate Rietveld mineral quantitative analysis of hydrated cements. Bol. DO Mus. Geociênc. Amaz. 2020, 7, 7. [Google Scholar] [CrossRef]
  31. Weirich, T.E.; Winterer, M.; Seifried, S.; Hahn, H.; Fuess, H. Rietveld analysis of electron powder diffraction data from nanocrystalline anatase, TiO2. Ultramicroscopy 2000, 81, 263–270. [Google Scholar] [CrossRef]
  32. Batchelder, D.N.; Simmons, R.O. Lattice constants and thermal expansivities of silicon and of calcium fluoride between 6 and 322 K. J. Chem. Phys. 1964, 41, 2324–2329. [Google Scholar] [CrossRef]
  33. Saalfeld, H.; Wedde, M. Refinement of the crystal structure of gibbsite, A1(OH)3. Z. Krist. Cryst. Mater. 1974, 139, 129–135. [Google Scholar] [CrossRef]
  34. Li, D.; O’Connor, B.H.; Low, I.-M.; van Riessen, A.; Toby, B.H. Mineralogy of Al-substituted goethites. Powder Diffr. 2006, 21, 289–299. [Google Scholar] [CrossRef]
  35. Sadykov, V.A.; Isupova, L.A.; Tsybulya, S.V.; Cherepanova, S.V.; Litvak, G.S.; Burgina, E.B.; Kustova, G.N.; Kolomiichuk, V.N.; Ivanov, V.P.; Paukshtis, E.A.; et al. Effect of mechanical activation on the real structure and reactivity of iron (III) oxide with corundum-type structure. J. Solid State Chem. 1996, 123, 191–202. [Google Scholar] [CrossRef]
  36. Bish, D.L.; Von Dreele, R.B. Rietveld refinement of non-hydrogen atomic positions in kaolinite. Clays Clay Miner. 1989, 37, 289–296. [Google Scholar] [CrossRef]
  37. D’Amour, H.; Denner, W.; Schulz, H. Structure determination of α-quartz up to 68 × 10 8 Pa. Acta Crystallogr. Sect. B Struct. Crystallogr. Cryst. Chem. 1979, 35, 550–555. [Google Scholar] [CrossRef] [Green Version]
  38. Doebelin, N.; Kleeberg, R. Profex: A graphical user interface for the Rietveld refinement program BGMN. J. Appl. Crystallogr. 2015, 48, 1573–1580. [Google Scholar] [CrossRef] [Green Version]
  39. Bergmann, J.; Kleeberg, R. Rietveld Analysis of Disordered Layer Silicates. Mater. Sci. Forum 1998, 278–281, 300–305. [Google Scholar] [CrossRef]
  40. Ufer, K.; Kleeberg, R.; Monecke, T. Quantification of stacking disordered Si-Al layer silicates by the Rietveld method: Application to exploration for high-sulphidation epithermal gold deposits. Powder Diffr. 2015, 30, S111–S118. [Google Scholar] [CrossRef]
  41. Leonardi, A.; Bish, D.L. Understanding Powder X-ray Diffraction Profiles from Layered Minerals: The Case of Kaolinite Nanocrystals. Inorg. Chem. 2020, 59, 5357–5367. [Google Scholar] [CrossRef]
  42. Chukanov, N.V.; Chervonnyi, A.D. IR Spectra of Minerals and Related Compounds, and Reference Samples’ Data. In Principles and Applications of Well Logging; Springer: Berlin/Heidelberg, Germany, 2016; pp. 51–1047. [Google Scholar]
  43. Balan, E.; Saitta, A.M.; Mauri, F.; Calas, G. First-principles modeling of the infrared spectrum of kaolinite. Am. Mineral. 2001, 86, 1321–1330. [Google Scholar] [CrossRef]
  44. Brindley, G.W.; Kao, C.C.; Harrison, J.L.; Lipsicas, M.; Raythatha, R. Relation between structural disorder and other characteristics of kaolinites and dickites. Clays Clay Miner. 1986, 34, 239–249. [Google Scholar] [CrossRef]
  45. Balan, E.; Lazzeri, M.; Morin, G.; Mauri, F. First-principles study of the OH-stretching modes of gibbsite. Am. Mineral. 2006, 91, 115–119. [Google Scholar] [CrossRef]
  46. Ruan, H.D.; Frost, R.L.; Kloprogge, J.T.; Duong, L. Infrared spectroscopy of goethite dehydroxylation. II. Effect of aluminium substitution on the behaviour of hydroxyl units. Spectrochim. Acta Part A Mol. Biomol. Spectrosc. 2002, 58, 479–491. [Google Scholar] [CrossRef]
  47. Schulze, D.G.; Schwertmann, U. The influence of aluminium on iron oxides: X. properties of Al-substituted goethites. Clay Miner. 1984, 19, 521–539. [Google Scholar] [CrossRef]
  48. Colombo, C.; Violante, A. Effect of time and temperature on the chemical composition and crystallization of mixed iron and aluminum species. Clays Clay Miner. 1996, 44, 113–120. [Google Scholar] [CrossRef]
  49. Yeskis, D.; Van Groos, A.F.K.; Guggenheim, S. The dehydroxylation of kaolinite. Am. Mineral. 1985, 70, 159–164. [Google Scholar]
  50. Chen, Y.F.; Wang, M.C.; Hon, M.H. Phase transformation and growth of mullite in kaolin ceramics. J. Eur. Ceram. Soc. 2004, 24, 2389–2397. [Google Scholar] [CrossRef]
  51. Aparicio, P.; Galán, E.; Ferrell, R.E. A new kaolinite order index based on XRD profile fitting. Clay Miner. 2006, 41, 811–817. [Google Scholar] [CrossRef]
  52. Plançon, A.; Giese, R.F.; Snyder, R. The Hinckley index for kaolinites. Clay Miner. 1988, 23, 249–260. [Google Scholar] [CrossRef]
  53. Bish, D.L.; Howard, S.A. Quantitative phase analysis using the Rietveld method. J. Appl. Crystallogr. 1988, 21, 86–91. [Google Scholar] [CrossRef]
  54. Djangang, C.N.; Kamseu, E.; Ndikontar, M.K.; Nana, G.L.L.; Soro, J.; Melo, U.C.; Elimbi, A.; Blanchart, P.; Njopwouo, D. Sintering behaviour of porous ceramic kaolin-corundum composites: Phase evolution and densification. Mater. Sci. Eng. A 2011, 528, 8311–8318. [Google Scholar] [CrossRef]
  55. Da Costa, M.L.; da Cruz, G.S.; de Almeida, H.D.F.; Poellmann, H. On the geology, mineralogy and geochemistry of the bauxite-bearing regolith in the lower Amazon basin: Evidence of genetic relationships. J. Geochemical Explor. 2014, 146, 58–74. [Google Scholar] [CrossRef]
Figure 1. (A) Samples location; (B) Bauxite mining trench in Rondon do Pará (Brazil) showing the thick Belterra Clay.
Minerals 11 00677 g001
Figure 2. Principal component analysis showing the grouping of the diffractograms. Group 1: green sphere (BRA0.5m, BRA5.0m, BRA13m, DEC0.8m, DEC7.2m, and DEC10m); Group 2: blue sphere (CIR0.5m, CIR5.0m, and CIR7.5m); Group 4: gray sphere (CIR10m and CIR14m).
Minerals 11 00677 g002
Figure 3. X-ray diffractograms of selected BTC samples spiked with fluorite (Fl). Kln: kaolinite; Gbs: gibbsite; Gt: goethite; Hem: hematite; Ant: anatase; and Qtz: quartz.
Minerals 11 00677 g003
Figure 4. Mineralogical quantification of selected samples by XRPD-Rietveld. The results are the triplicate average shown with the standard deviation bars.
Minerals 11 00677 g004
Figure 5. Refined X-ray pattern of sample CIR14m and its difference plot using Highscore Plus. Goodness of fit: 1.6 and R—weighted profile: 5.5.
Minerals 11 00677 g005
Figure 6. Refined X-ray pattern of sample CIR14m, refined in PROFEX-BGMN using a model of disordered kaolinite. Good of fitness: 1.3 and R—weighted profile: 3.2.
Minerals 11 00677 g006
Figure 7. Mixture additions of gibbsite for the sample BRA0.5m and hematite for the sample BRA13m.
Minerals 11 00677 g007
Figure 8. FT-IR spectra of BTC samples BRA13m and CIR14m: (A) OH-stretching region and (B) middle IR range. The IR bands characterized for each mineral are marked by color for a quicker interpretation. Overlapping colors means the bands are attributed to more than one mineral. Non-marked bands are related to the displacement contribution of Si, Al, and H.
Minerals 11 00677 g008
Figure 9. Thermal analysis of the BTC samples CIR14m and BRA13m. Heating rate 10 K/min. TG: termogravimetric curve; DTG: first derivate of TG and; DSC: differential scanning calorimetry.
Minerals 11 00677 g009
Figure 10. Comparison of the chemical composition measured by XRF and calculated after the Rietveld analysis.
Minerals 11 00677 g010
Table 1. Phases and their respective ICSD codes used in the Rietveld refinements.
PhaseChemical FormulaSpace GroupICSD CodeReference
AnataseTiO2I41/amd92363[31]
FluoriteCaF2Fm-3m60368[32]
GibbsiteAl(OH)3P216162[33]
Goethite(Fe,Al)O(OH)Pnma109411[34]
HematiteFe2O3R-3c82137[35]
KaoliniteAl2Si2O5(OH)4P163192[36]
QuartzSiO2P312116331[37]
Publisher’s Note: MDPI stays neutral with regard to jurisdictional claims in published maps and institutional affiliations.

