Article

Investigation of Iron Ore Mineral Distribution Using Aero-Magnetic Exploration Techniques: Case Study at Pocheon, Korea

Mineral Resources Research Division, Korea Institute of Geoscience and Mineral Resources, 124 Gwahak-ro Yuseong-gu, Daejeon 34132, Korea
*
Author to whom correspondence should be addressed.
Minerals 2021, 11(7), 665; https://doi.org/10.3390/min11070665
Submission received: 29 April 2021 / Revised: 13 June 2021 / Accepted: 19 June 2021 / Published: 22 June 2021

Abstract

:
We present our aeromagnetic survey results from an investigation of the iron ore mineral distribution in Pocheon, Korea, in the west-central area of the Korean Peninsula. A manned aeromagnetic system using a helicopter for regional exploration and an unmanned aeromagnetic system using a multicopter for high-resolution exploration were used for the survey. The inversion results of the magnetic data confirmed the possibility of the existence of a new iron ore body. Drilling was carried out based on inversion results and drilling revealed amphibolite including iron ore, as indicated by a strong magnetic response. The position and depth of the iron ore were consistent with the interpretation results of the magnetic data.

1. Introduction

Securing adequate mineral resources is important for successfully navigating a new era of industrial growth. For some time, we have conducted studies on titanomagnetite deposits located in the west–central portion of the Korean Peninsula. The area has numerous active mines, with magnetite (an iron ore mineral), titanium (Ti), and vanadium (V) as the main deposits. Magnetite is easy to identify with magnetic surveys, as it has a strong susceptibility. Given that susceptibility is a direct indicator of the magnetic mineral content, magnetic exploration is one of the most efficient means of finding new iron ore sources. As such, the identification of iron ore deposits and their distribution throughout the west–central part of the Korean Peninsula using magnetic surveys has been and continues to be the focus of our research.
Exploration for new mineral resources is challenging in Korea, given that the target areas are mostly located in complex mountainous terrain. In particular, Mount Gonam, the subject area of this study, has an altitude of 848.8 m and very rugged and steep topography. Exploration of harsh environments such as this requires high-resolution measurement devices and efficient data acquisition. In consideration of the conditions of this region, we used an aeromagnetic exploration method to map the iron ore mineral distribution in Pocheon, Korea.
Aeromagnetic surveys are one of the most commonly used techniques in the mineral exploration field [1,2,3,4,5]. These surveys are often conducted using helicopters and airplanes with hanging transmitters and receivers attached. These existing exploration methods can quickly cover large areas. However, there is a safety issue when collecting high-quality data while flying close to the ground. Extensive research on exploration systems based on unmanned aerial vehicles (UAVs) has accelerated in recent years [6,7,8,9,10,11,12,13], in an effort to supplement the limitations of conventional airborne and ground exploration methods. In particular, UAV-based magnetic exploration has been of particular interest, and commercial UAV products are now readily available for this purpose. UAV systems are convenient and simple to use, and UAV surveying is an efficient method in terms of both time and cost. Additionally, because UAVs are capable of automatic flight, they can traverse the terrain safely when flying close to the ground, allowing for the acquisition of more detailed information over a larger area.
Various technologies and data processing methods have been proposed for interpreting magnetic data and understanding the nature of the magnetic sources, such as upward continuation, downward continuation, first vertical derivative, Euler deconvolution, and Werner deconvolution [14]. These methods have the advantages of being effective and easy to use, but quantitative interpretation of the data obtained using these techniques tends to be difficult. Inversion methods play a key role in finding the optimized answer, such as the size, shape, depth, and physical properties of the target deposit [15]. However, in most cases, the optimization of the geophysical data set is complex, and generally the solution is ambiguous because the number of observation points is not sufficient [16,17]. Any magnetic field measured at the Earth’s surface can be reproduced using an extremely thin layer of magnetic dipoles below the surface [18]. Thus, there is no inherent sensitivity to depth in the magnetic field data. This non-uniqueness problem in inversion may be solved using additional information, such as geophysical or geological a priori information and constraints on the variable values [18,19,20,21,22].
In this study, we investigated the distribution of iron ore mineral in Pocheon, Korea, in the west-central area of the Korean Peninsula using manned and unmanned aeromagnetic surveys for data acquisition.

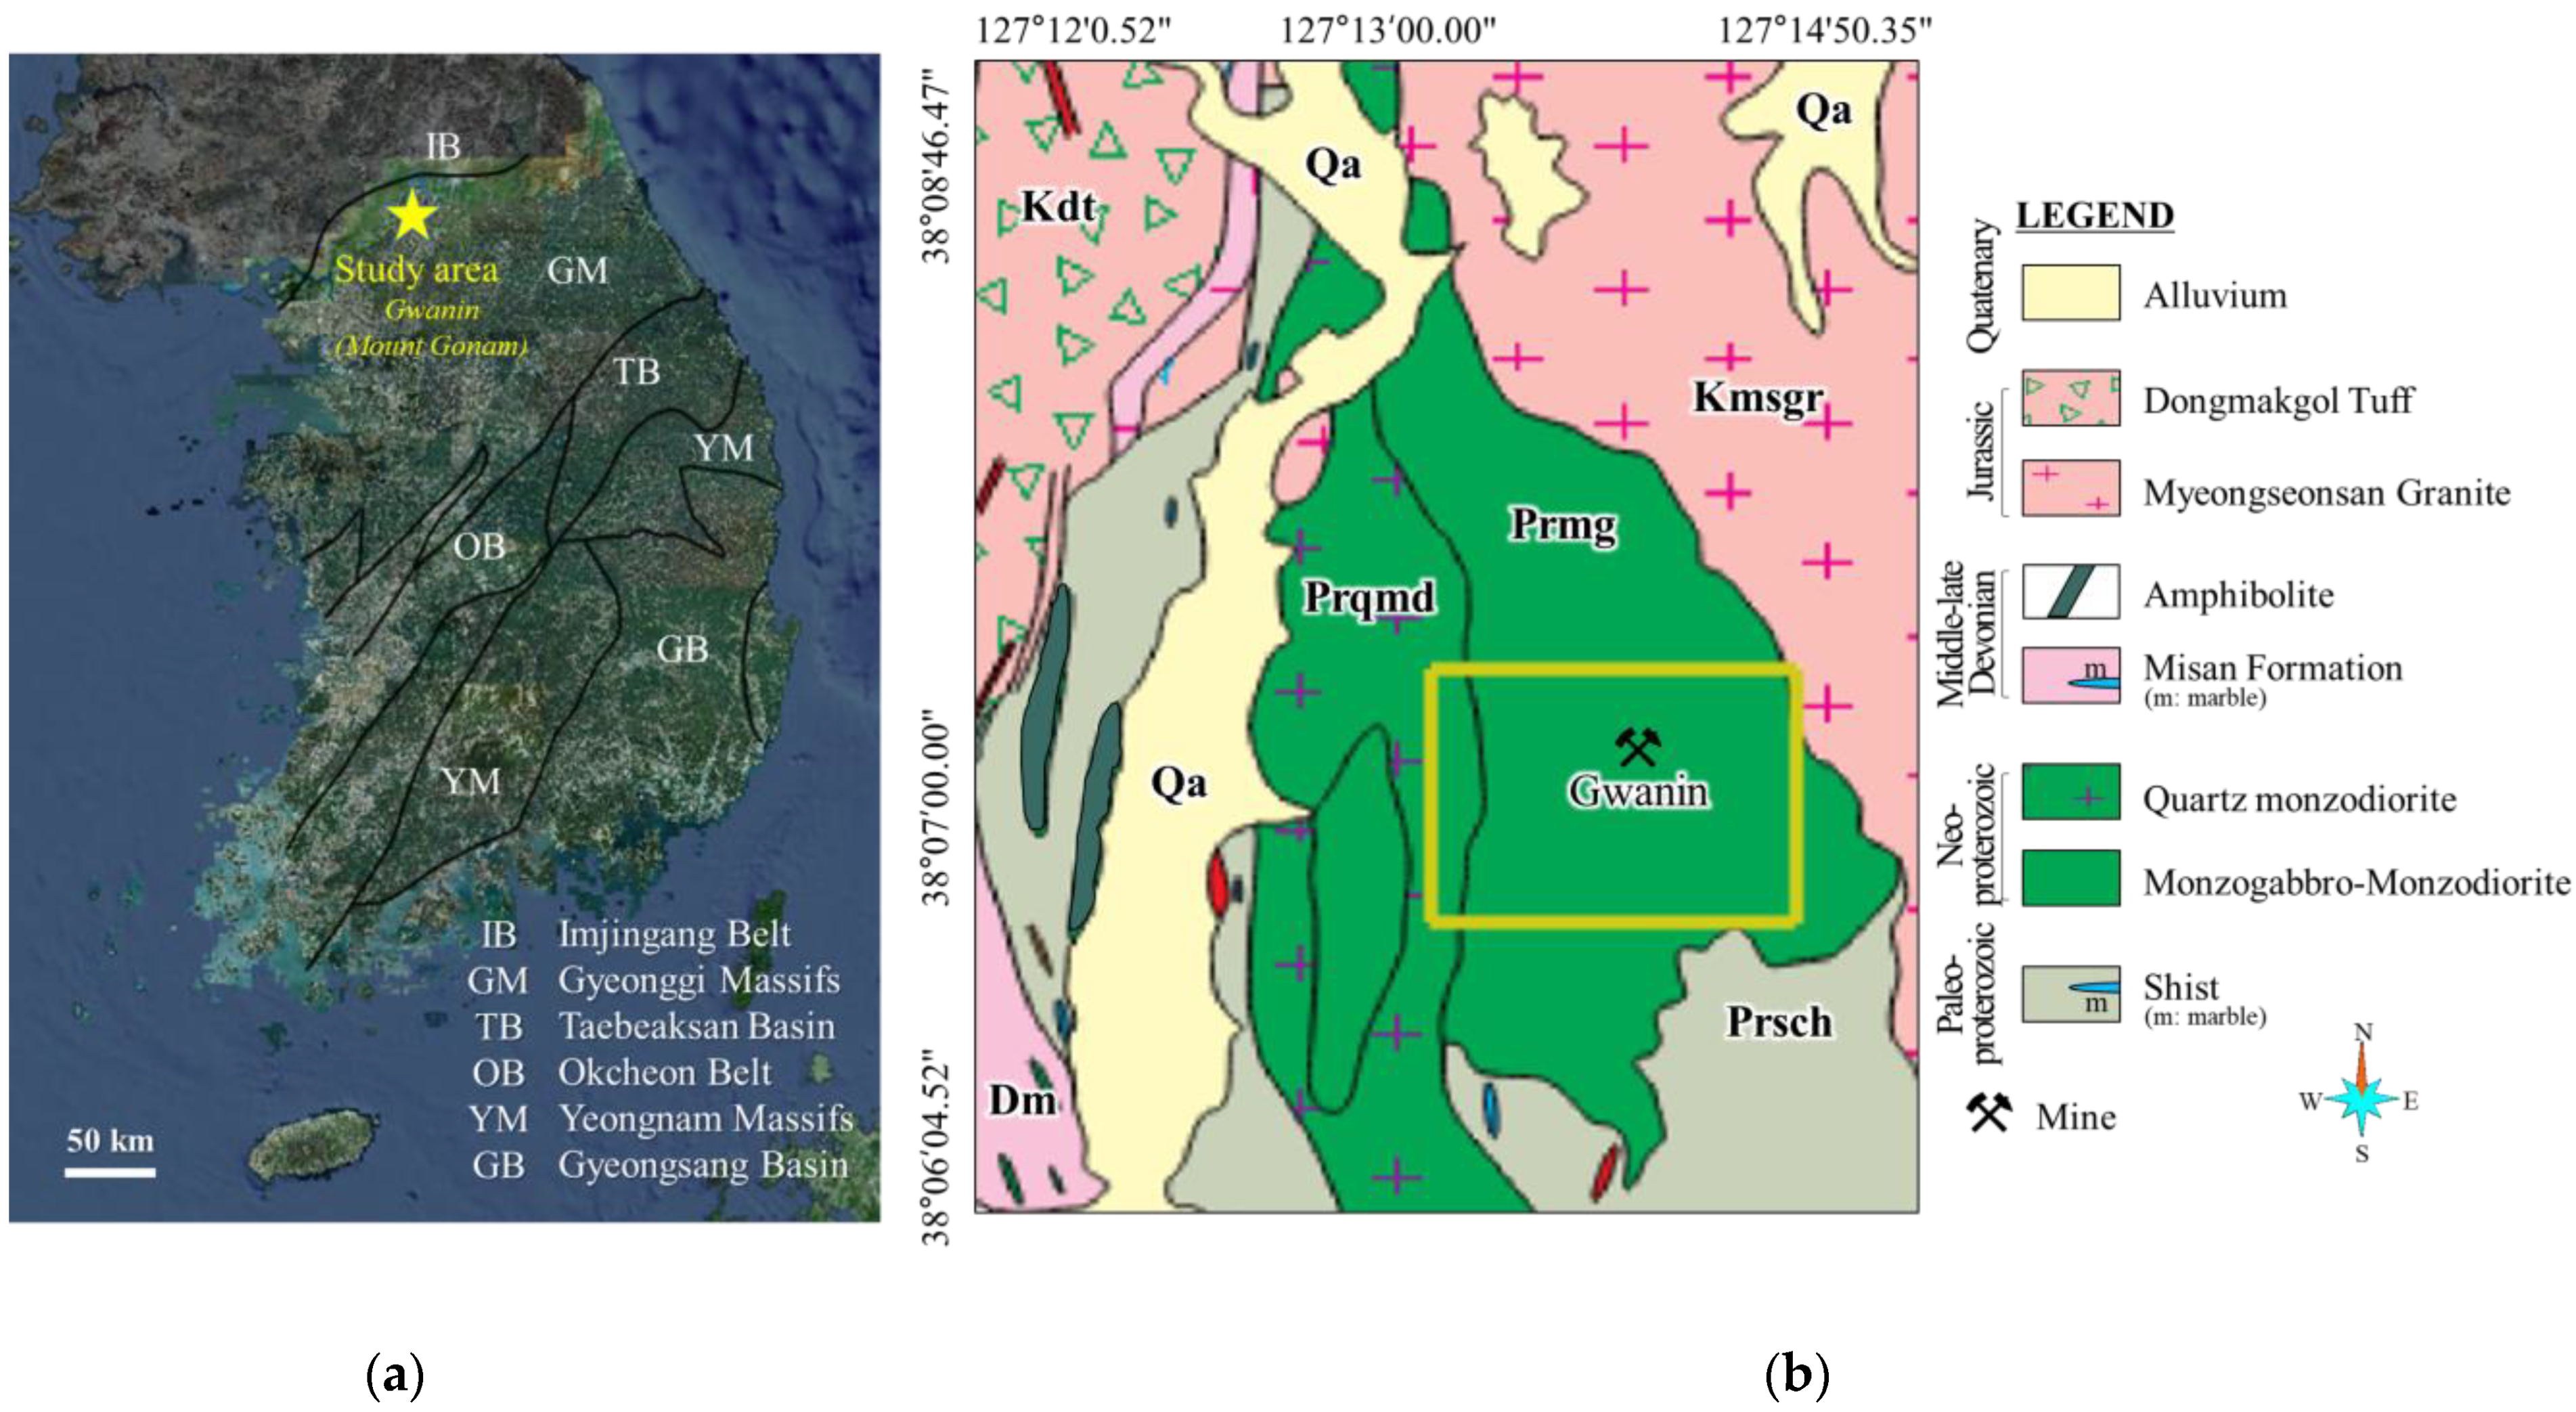
2. Geological Background

The research area for the current study, the Pocheon area, includes the intrusive, igneous body of Mount Gonam. Mount Gonam is located at the boundary between the southeastern part of the Imjingang Belt and the northwestern part of the Gyeonggi Massif (marked with a star in Figure 1a). The Gyeonggi gneiss complex is composed of schist and gneiss. The Paleoproterozoic Gyeonggi gneiss constitutes the bedrock of the study area. The Paleoproterozoic gneiss complex was intruded by Neoproterozoic plutonic rocks, Jurassic Daebo granite, and Cretaceous granite. The intrusive body in Mount Gonam occupies an area of approximately 3 km × 2 km in a north–south direction. Most of the deposits are in contact with the Paleoproterozoic gneiss complex, but in the northeastern part they are in contact with Cretaceous Myeongseongsan granite. According to the surface survey [23], the eastern side of the intrusive rock is melanocratic monzogabbro–monzodiorite, and the western side is leucocratic quartz monzodiorite (Figure 1b).
The deposits in the study area are iron ore that developed within gabbroid rocks intruding into the Precambrian metamorphic sedimentary rock. According to petrochemical studies [25,26], the genesis of the magnetite deposit is interpreted as an orthomagmatic deposit originating from basic magma. The ore production states of mines in this area can be classified into veins, lenticulars, masses, skarn-type ores, and stratified ore bodies, which are closely related to gabbroid rock. In a report presented in 2019 from the Gwanin mine with the location indicated in Figure 1b, the main ore body of the mine is classified as a skarn-type ore.

3. Methods

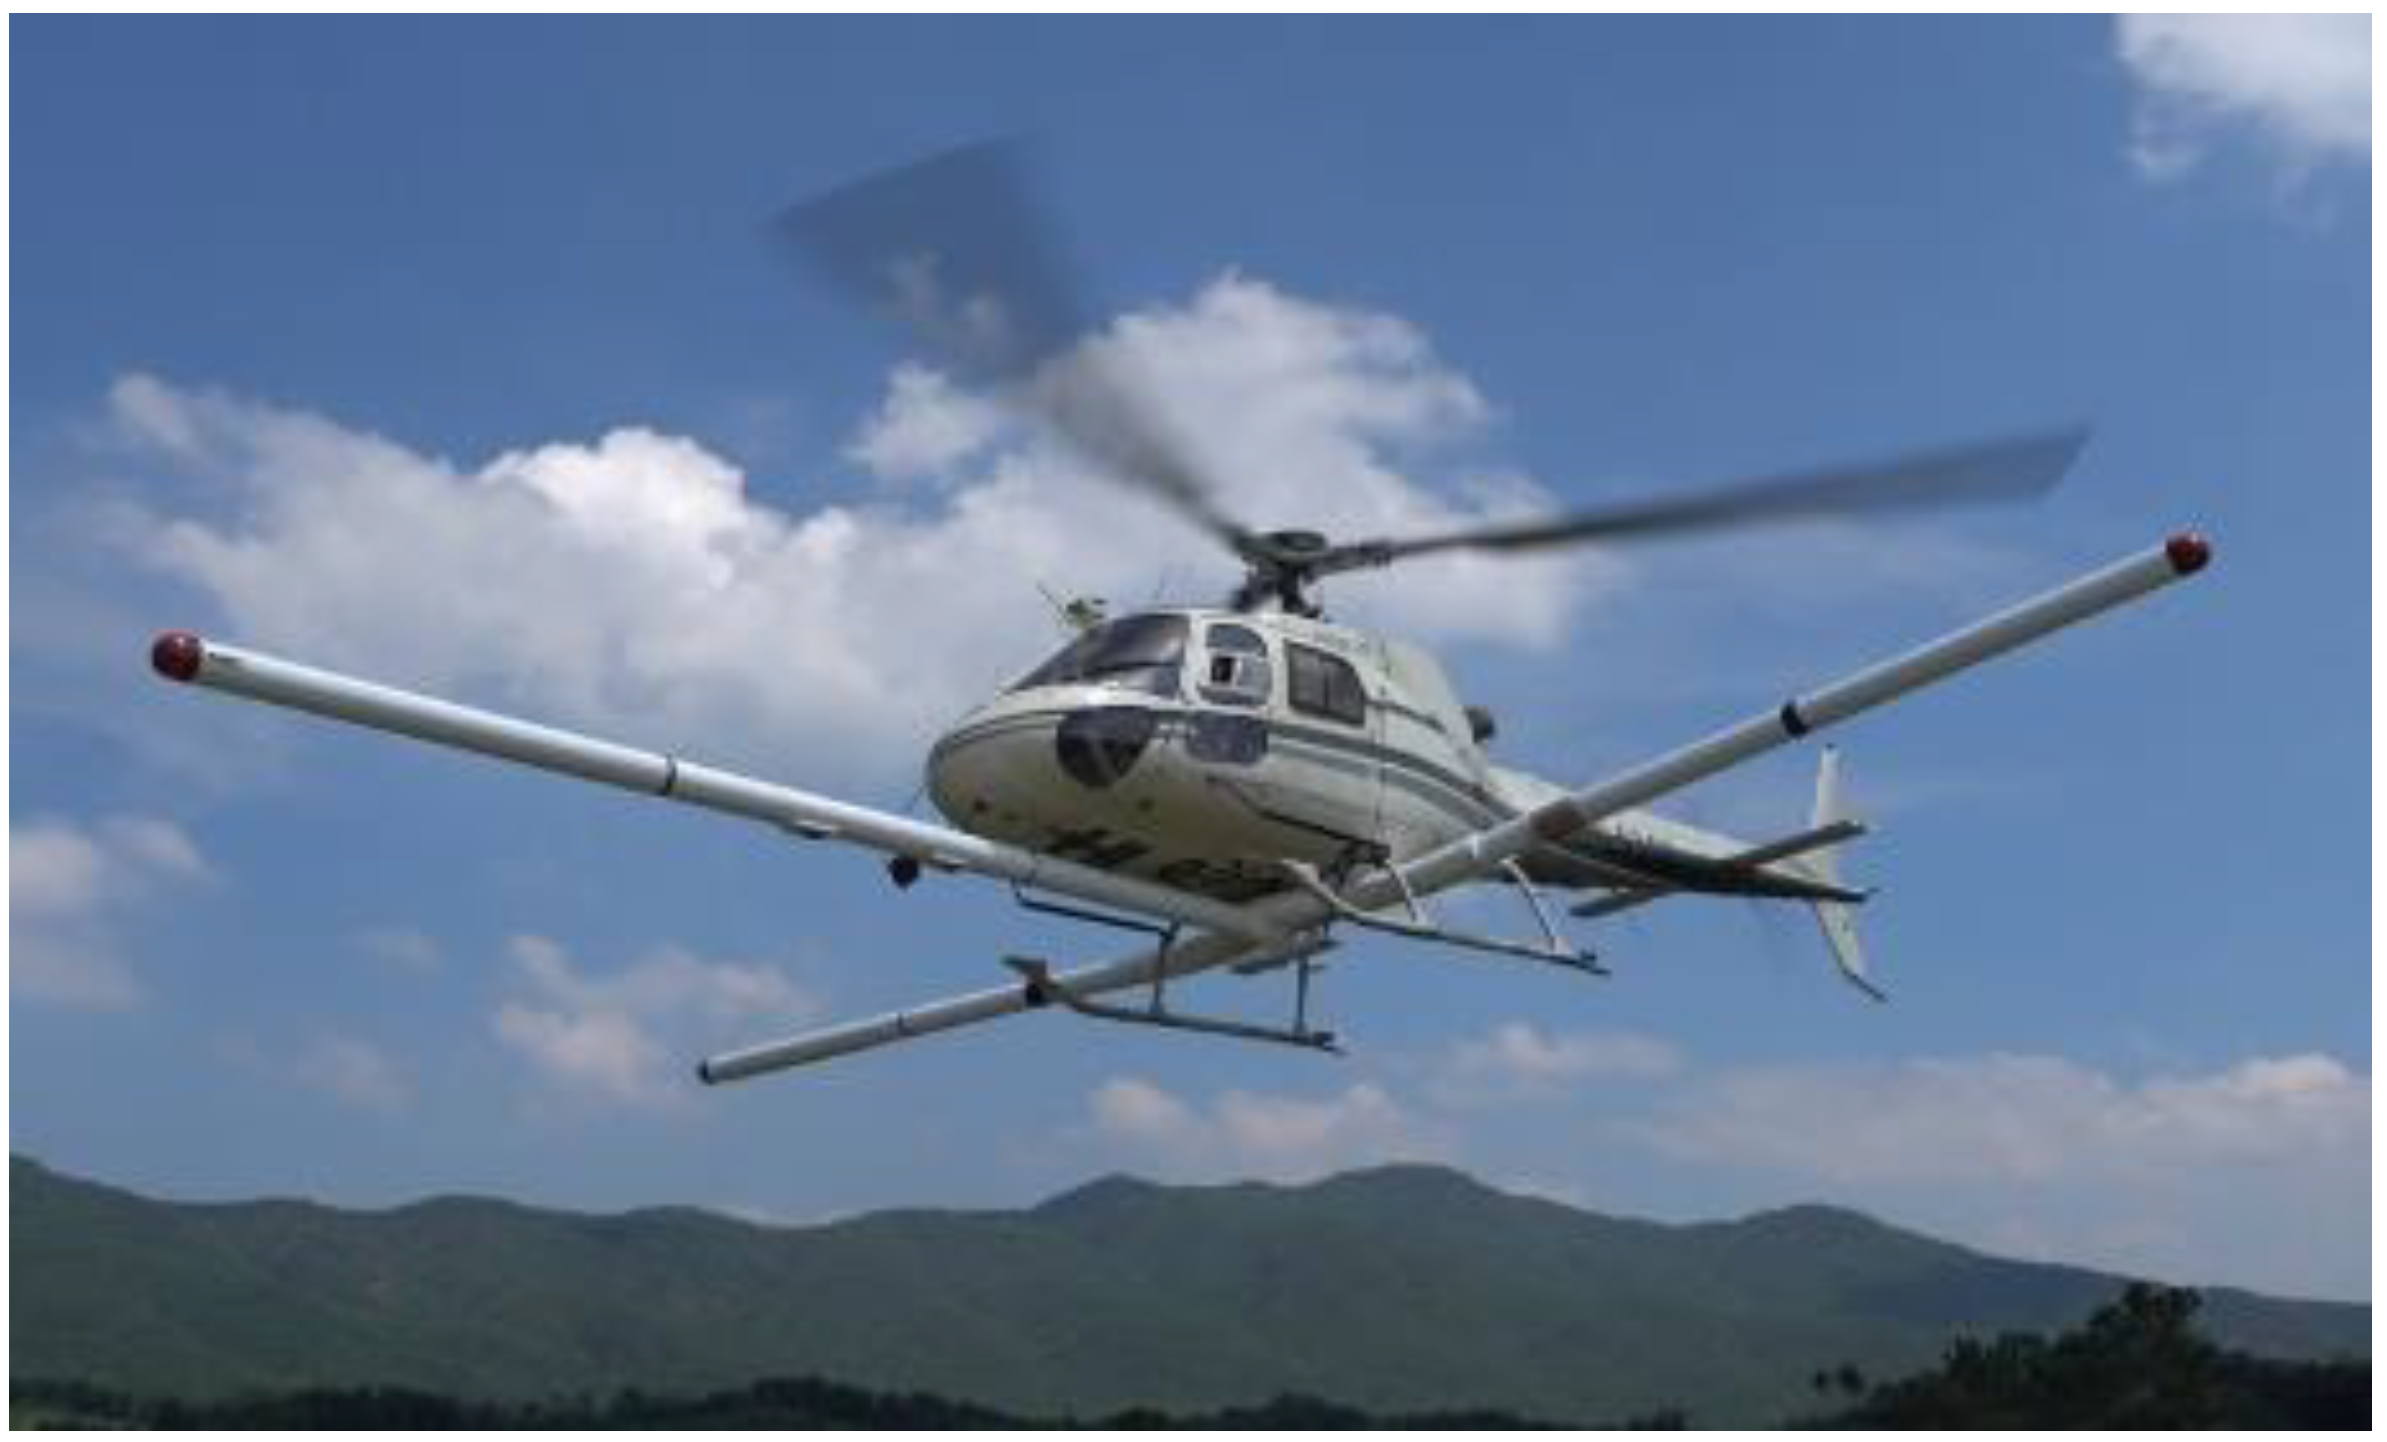
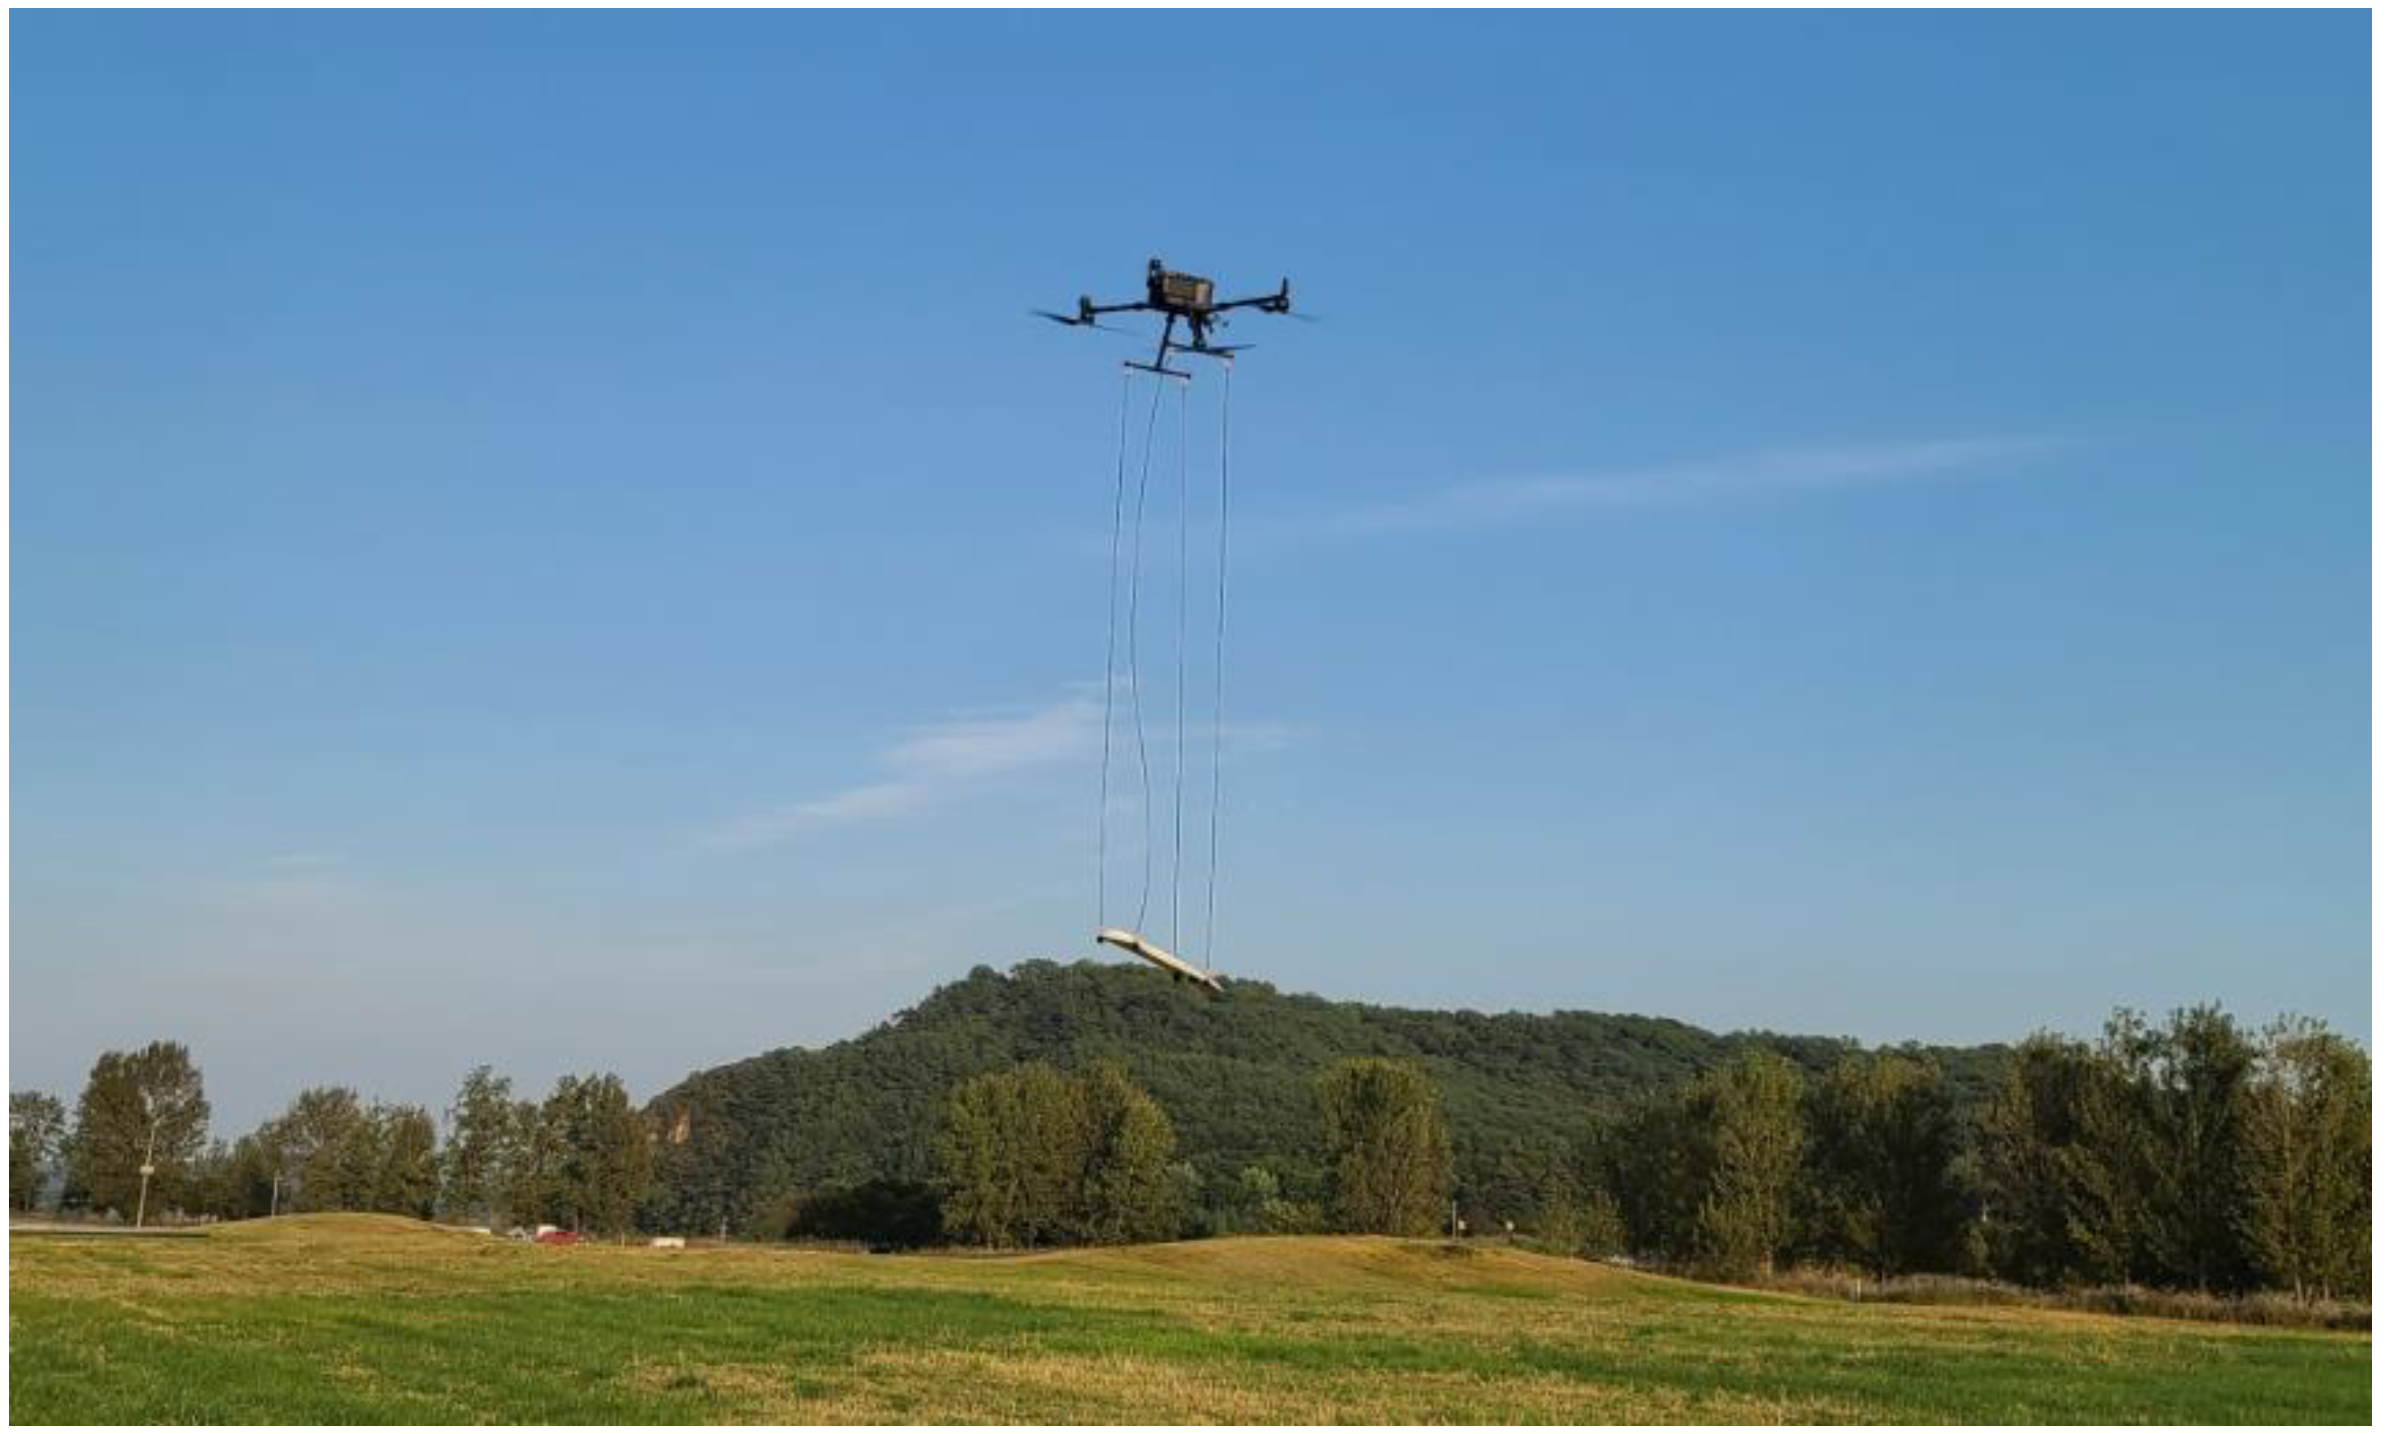
3.1. Aeromagnetic Exploration with a Helicopter

Since 1981, the Korea Institute of Geoscience and Mineral Resources (KIGAM) has been researching aeromagnetic exploration and developing technology to this end, in an attempt to identify magnetic anomalies throughout the Korean Peninsula. There has been great interest among the research community in using high-resolution aerial exploration to identify mineral resources.
Figure 2 presents a helicopter-based KIGAM-manned aeromagnetic system. Three booms are attached to the lower part of the helicopter, and a total of four magnetic sensors are installed within the booms. A fluxgate magnetometer is attached to the center of the front boom to compensate for the magnetic field associated with the movement of the helicopter during flight. The other three magnetometers (G-822A, GeoMetrics Inc., San Jose, CA, USA) are scalar magnetometers that are used to measure the total magnetic intensity. One magnetometer is attached to the end of the boom facing the front of the helicopter, and the others are attached to either end of the boom installed in a direction perpendicular to that of the central boom. The three magnetometers have a sampling frequency of 10 Hz. In the helicopter, a DAARC500 data acquisition system (RMS Instruments, Mississauga, ON, Canada) is installed; this system is capable of calibrating against the magnetic response that occurs from the helicopter itself in real time. Additionally, the DAARC500 system collects and stores data from all installed sensors, such as the global positioning system and barometer. All data can be used to match, calibrate, and analyze magnetic findings.
In 1975, the National Geological Survey (current KIGAM) conducted surface geological and magnetic surveys of the area [23]. Production activities began in earnest in 1982 and continue to this day. However, although it was possible to confirm the results of magnetic exploration in some areas with large magnetic anomalies, most of the magnetic data in general were insufficient for confirming the magnetic response of an entire area, including mines. Therefore, in 2019, additional exploration using helicopters was planned.
In this study, the flight line spacing and altitude of the surveys were set at 100 m and 60–100 m, respectively, to acquire high-quality data (Figure 3). Real-time information from navigation systems and the radar altimeter was used to control the helicopter within the specified line spacing and altitude range.

3.2. Aeromagnetic Exploration with a Multicopter

In this study, to obtain a more precise reading of the strong magnetic anomalies, we also conducted a multicopter aeromagnetic exploration survey. The multicopter was outfitted with a MagArrow scalar magnetometer (GeoMetrix Inc., Scottsdale, AZ, USA). The MagArrow system weighs only 1 kg and has a sampling rate of 1000 Hz, meaning that data can be acquired every centimeter when flying at a speed of 10 m/s [27]. In this study, the data acquired at 1000 Hz were downsampled to 50 Hz considering the flight speed and data redundancy. Among the various multicopters, the M210RTK (DJI, Shenzhen, China) was selected for this study, based on its maximum payload (<1.23 kg) and reliability.
Figure 4 presents the multicopter configuration for this study. Helicopter and multi-rotor UAVs typically use a single magnetic sensor rigidly mounted on a platform or suspended below the platform [13]. Depending on the mounting method, magnetic signals generated by various UAVs and their on-board components have been investigated, and studies on optimal sensor placement have been conducted [28,29,30,31]. In these papers, it was concluded that the magnetic signal interference between the magnetic sensor and multicopter is minimized when the magnetic sensor is more than 3 m away from the multicopter [28,29,30,31,32]. Based on these studies, we hung the MagArrow 3 m below the multicopter. During the test flight, the magnetic field contributions from the multicopter were not observed in the obtained data and no additional calibration process was required to eliminate the magnetic signal interference. The maximum flight time with the MagArrow was about 20 min. To acquire high-quality data, the flight line spacing and altitude of the surveys were set at 50 m and 60 m, respectively, as shown in Figure 5. In this study, a single drone was used, and it was difficult to secure a line-of-sight distance due to rugged, mountainous terrain covered with trees. Flight data were collected 15 times while moving between the take-off and landing points. It took a total of about 8 h to collect data for an area of 25 km2.
To increase the amplitude of the sensed magnetic anomalies within the subsurface, it is important to fly as low as possible. However, because the target area to be explored is a rugged mountainous terrain covered with trees taller than 20 m, as noted above, it is dangerous and difficult to perform low-altitude UAV surveying in practice. Low-altitude UAV surveying requires advanced UAV operation skills, reliable equipment, and specialized software for mission planning to safely collect high-quality data while flying close to the ground.
In this study, survey missions were planned and flown in automatic mode with UgCS software version 4.3.82 (SPH Engineering, Riga, Latvia). The altitude of the multicopter was set at a constant altitude based on the digital elevation model (DEM) provided by Google (Mountain View, CA, USA). Because the DEM information cannot reflect changes in vegetation such as the growth of trees over time, the flight altitude was set to 60 m for stable flight. Additionally, to avoid the risk of a flight accident when the multicopter disappeared from view or when the communication with the ground monitoring system was cut off, the survey was conducted by moving the take-off and landing sites as needed.

3.3. Interpretation Methods of Aeromagnetic Data

The goal of interpretation is to determine the target sources based on measured aeromagnetic data. Inversion is a well-established tool that supports the interpretation of geophysical data by generating the subsurface distribution of a physical property from observed data. The obtained magnetic data must undergo a basic correction process before inversion is performed. Preprocessing for inversion of the aeromagnetic data in this study was as follows. First, the diurnal variation correction was performed based on the data obtained at the Cheongyang geomagnetic observatory in Korea. The correction was carried out to separate sudden temporal variation in the Earth’s magnetic field, caused by the rotation of the Earth and solar wind from geographical variations. International Geomagnetic Reference Field (IGRF) correction was then applied to correct for secular variation. Given that the published IGRF coefficients represent the field originating from within the core, subtracting the IGRF field from the Earth’s field should only leave anomalies caused by sources within the Earth’s crust [14]. Lastly, interpolation and resampling were applied considering the inversion block size.
We used VPmg, which is a magnetic 3D modeling and inversion program developed by Fullagar Geophysics Pty Ltd. (Blackmans Bay, Tasmania, Australia) [33,34,35,36]. VPmg permits a wide variety of inversion styles to accommodate homogeneous unit properties, geometry, VP basement properties, and heterogeneous properties. In this research, due to a lack of known information about the subsurface, heterogeneous property inversion was selected without constraints. We first established that the starting model was a two-layer model. The first layer extended from the topography to a flat subsurface at 0 m of elevation, and was split into a heterogeneous layer. The 1:5000-scale digital topographic map obtained from the National Geographic Information Institute was used as the topography data. The elevation of the flat subsurface was determined considering the depth of the iron ore deposit already confirmed. The inversion cell size of the layer was assigned based on the line spacing. A scaling factor of 1.2% was applied to the vertical cell size with increasing depth. The initial susceptibility was set to 0 SI (Magnetic susceptibility). The magnetic field parameters used for inversion were an inclination of 55.059°, a declination of −8.5731°, and an amplitude of 51,427.8 nT. One important problem in potential field inversion is the lack of depth resolution. To enhance the depth resolution, depth-based weighting was used. The detailed inversion results are presented in the next section.

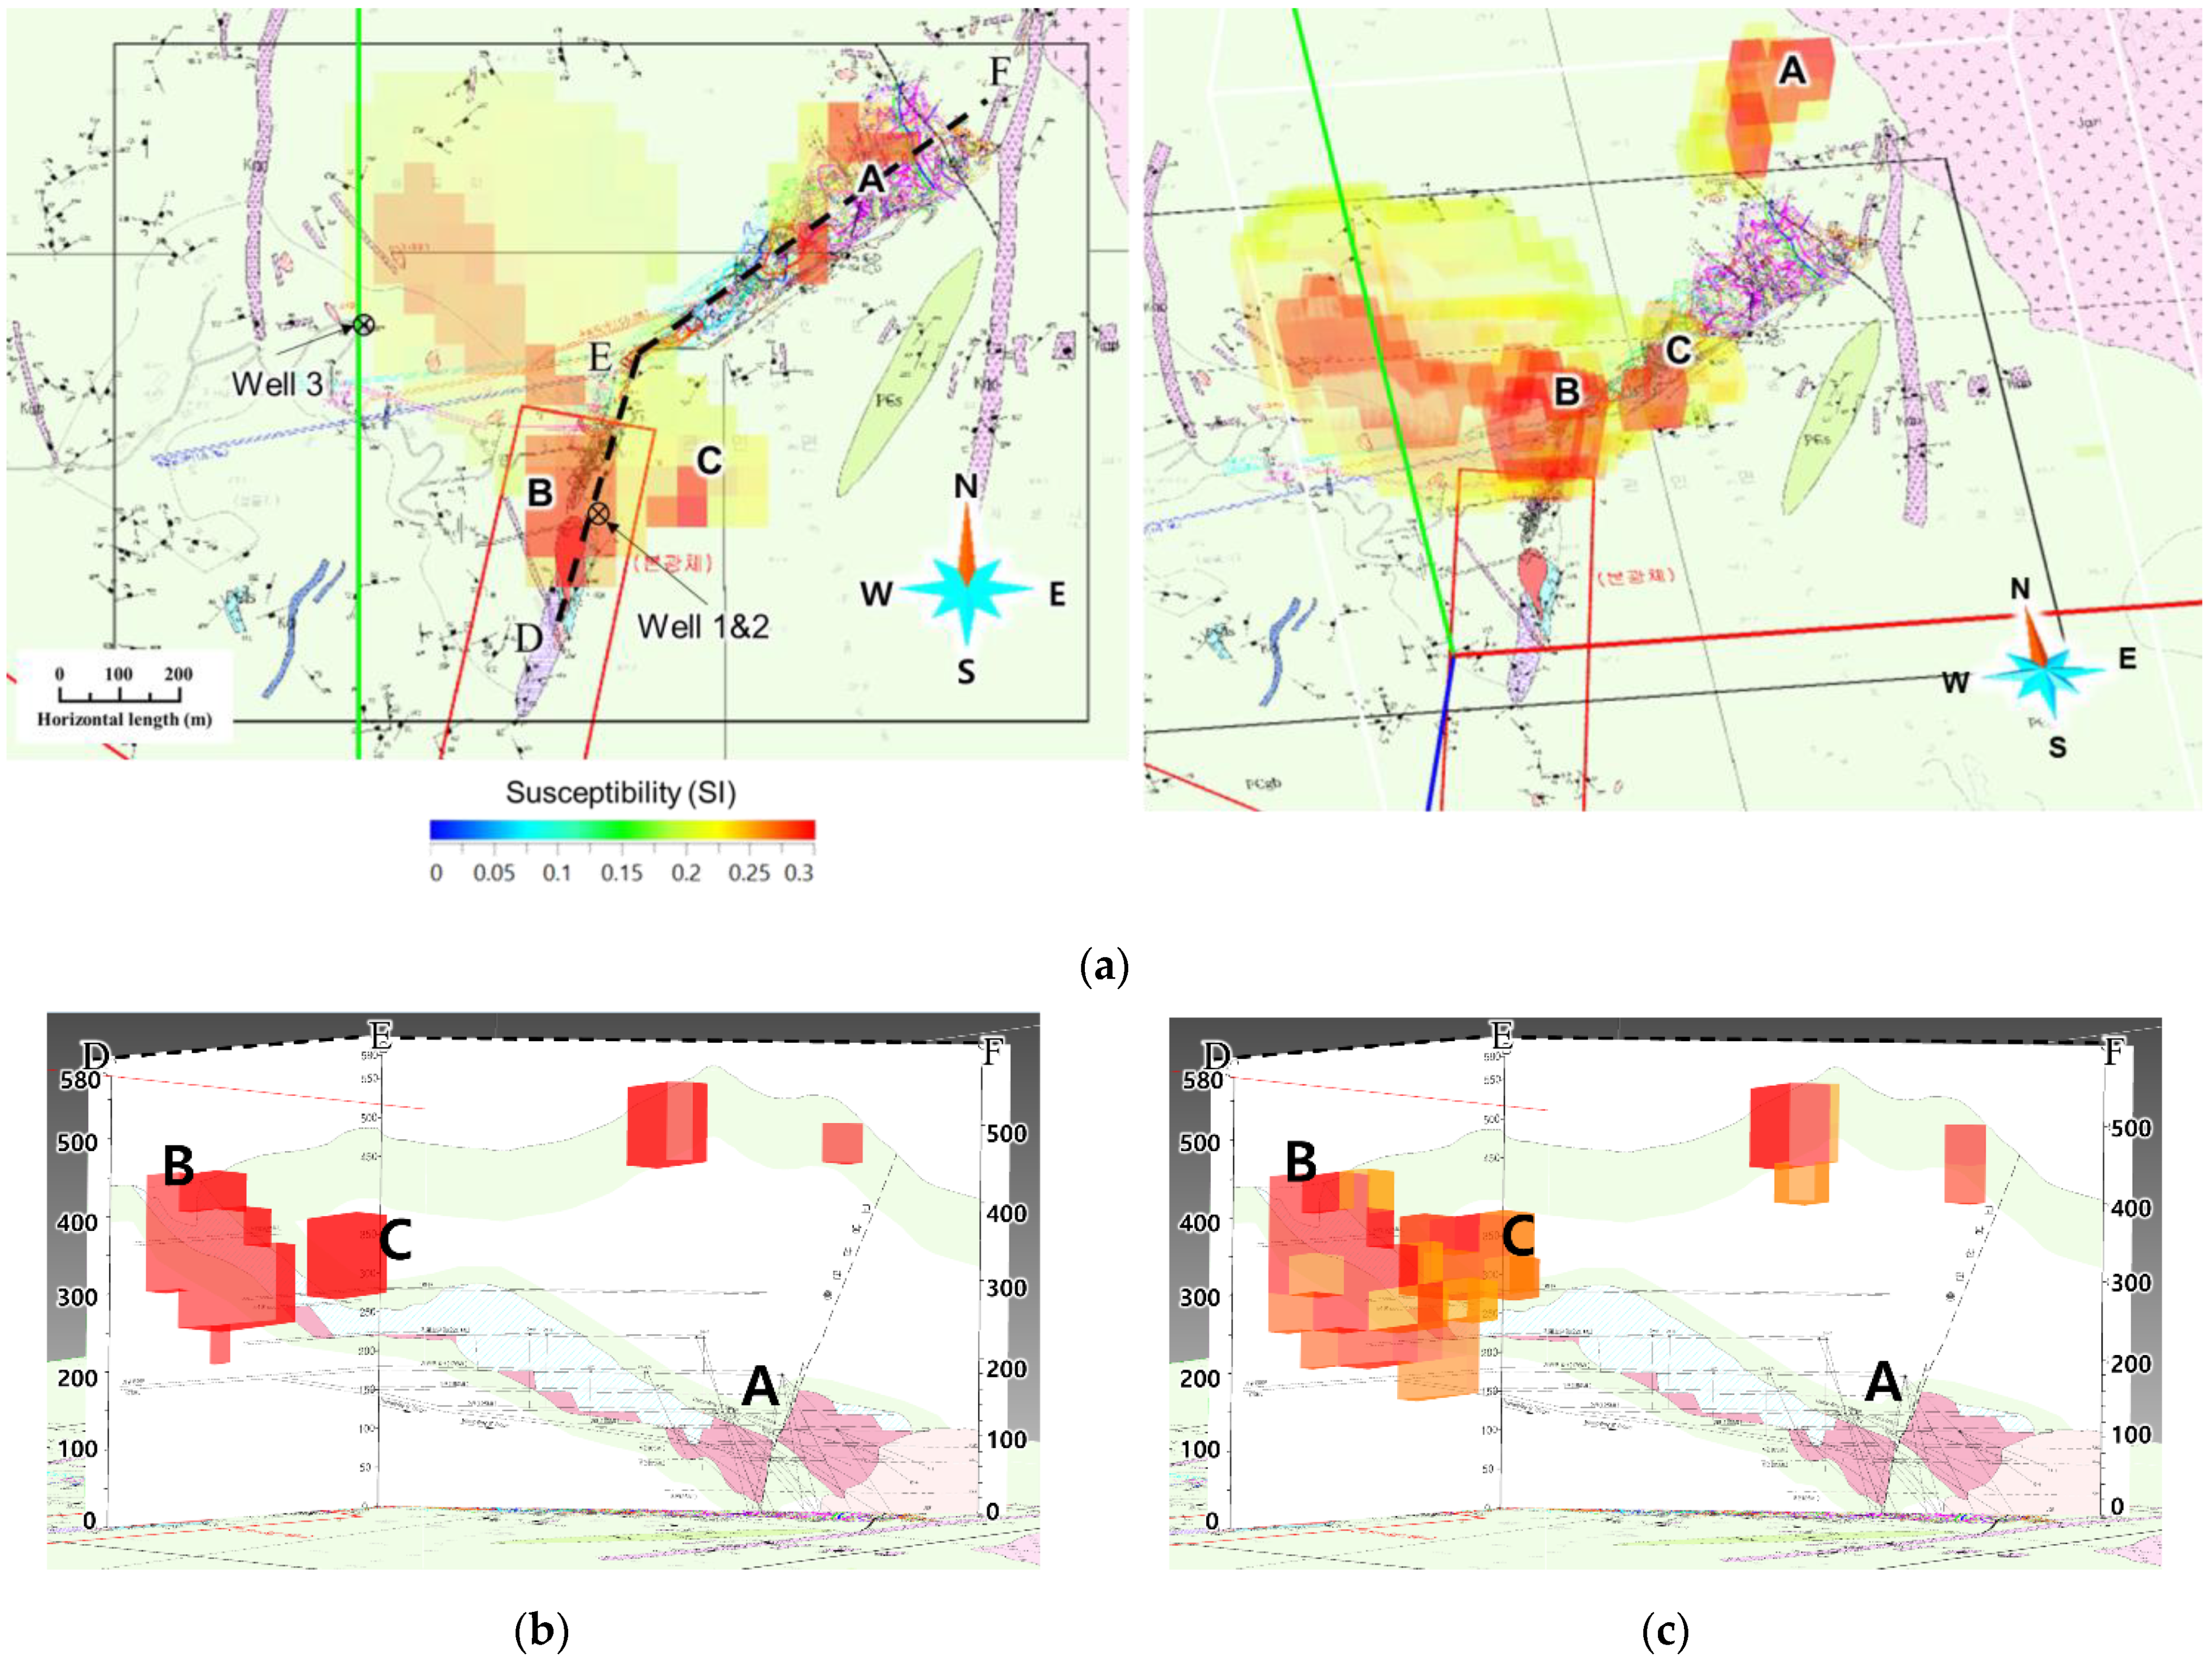
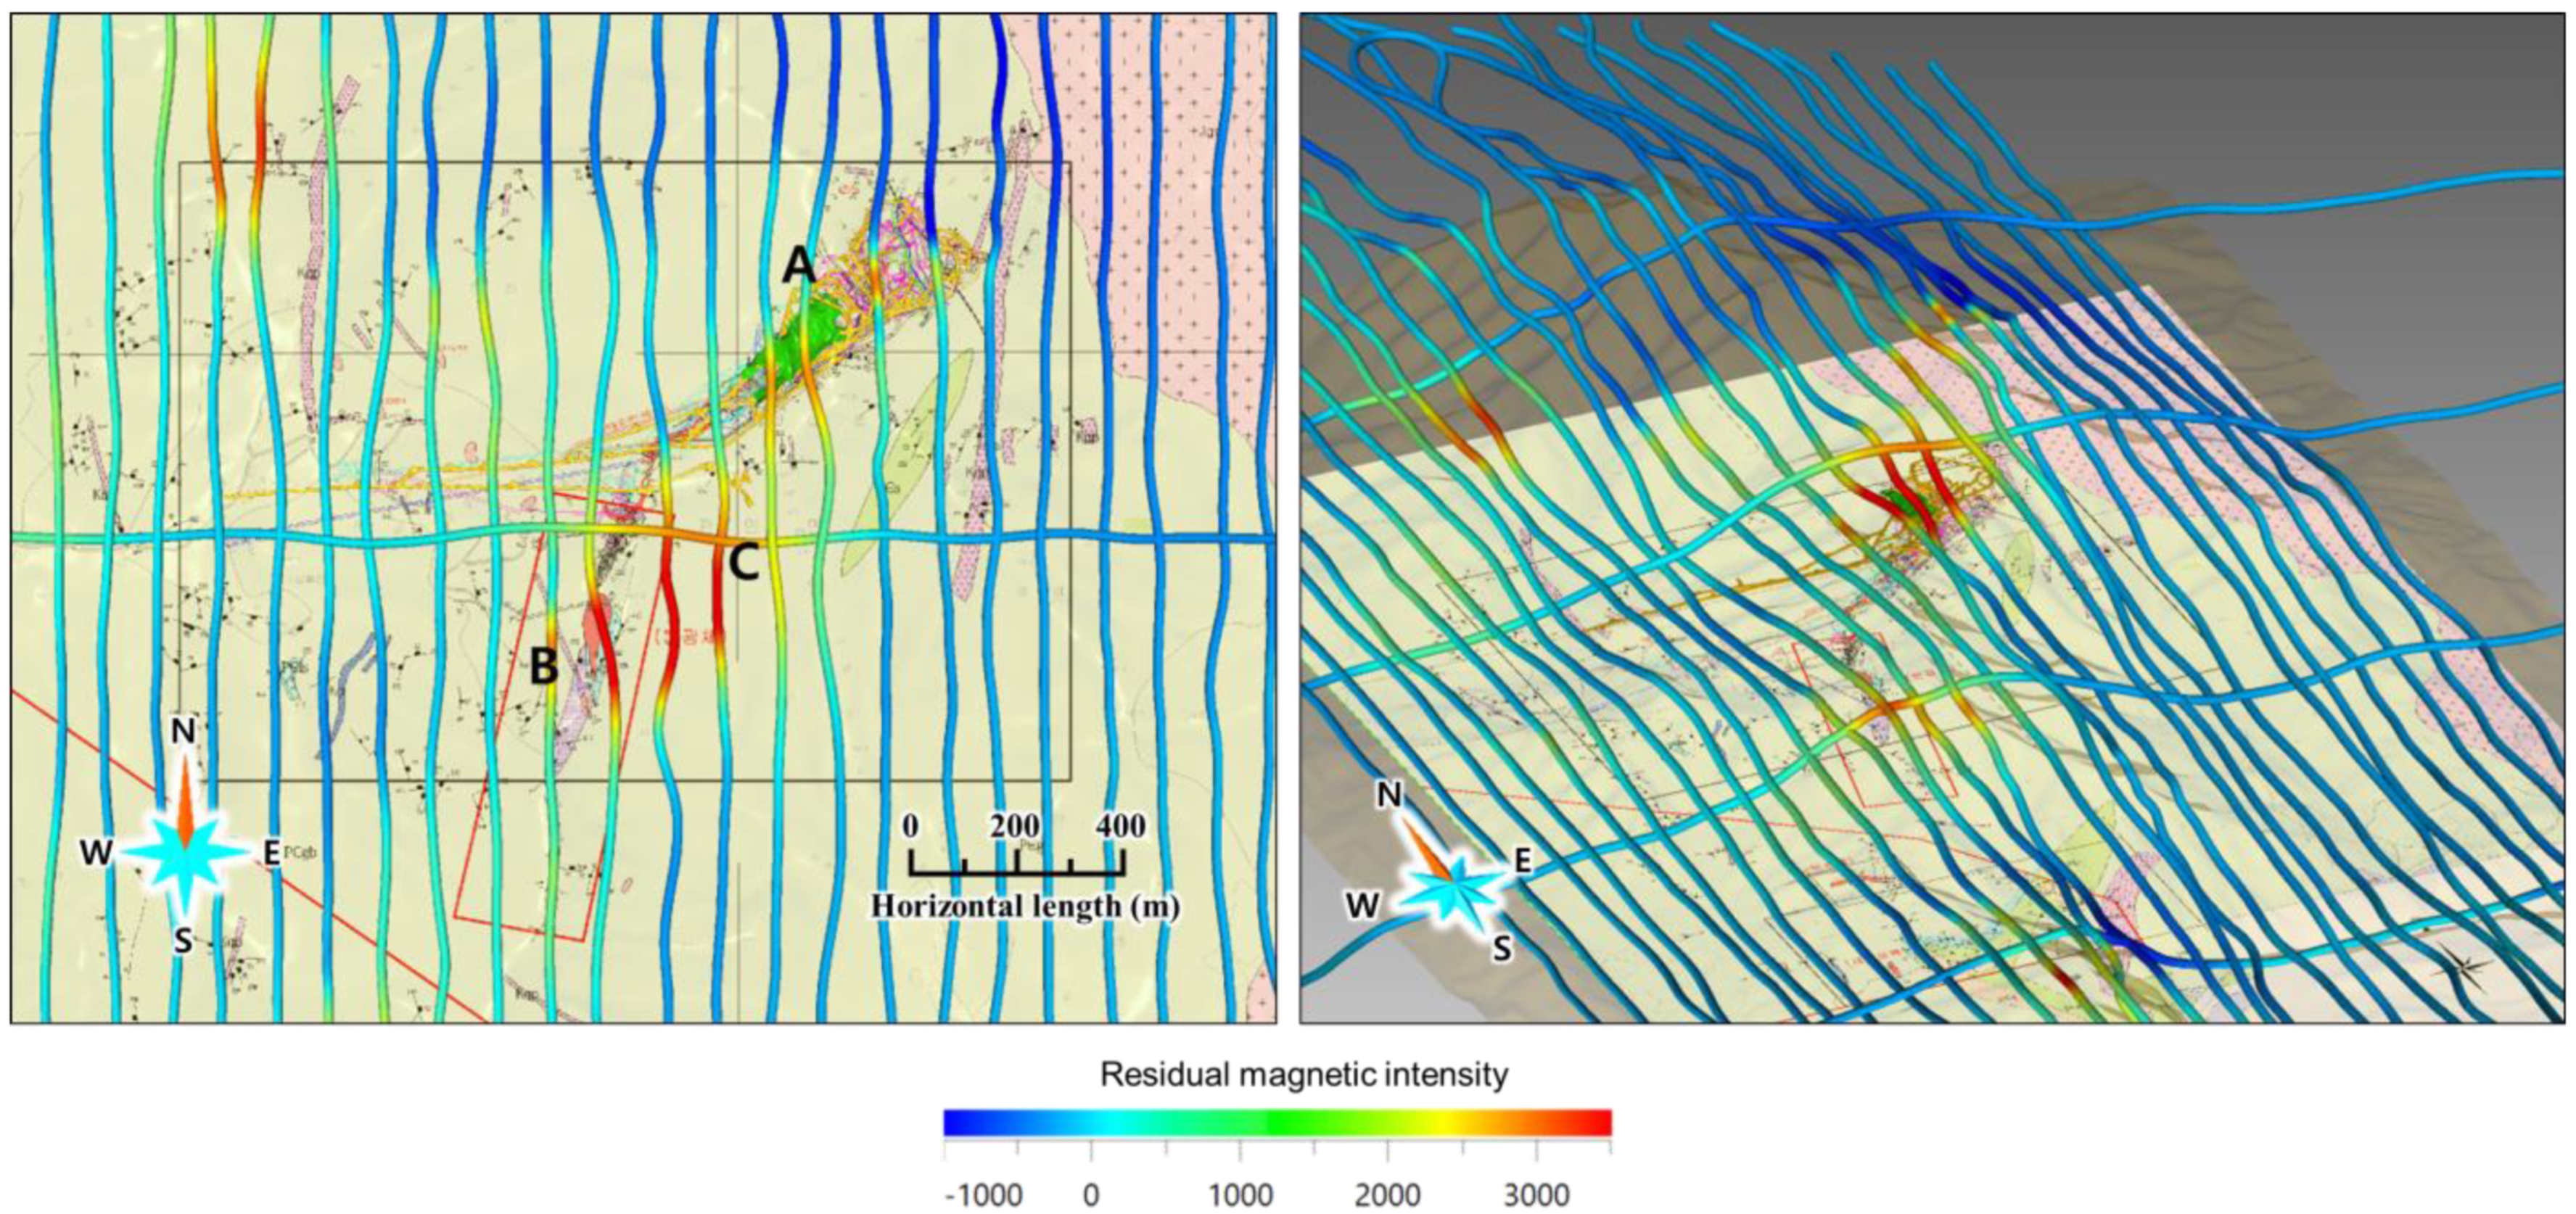
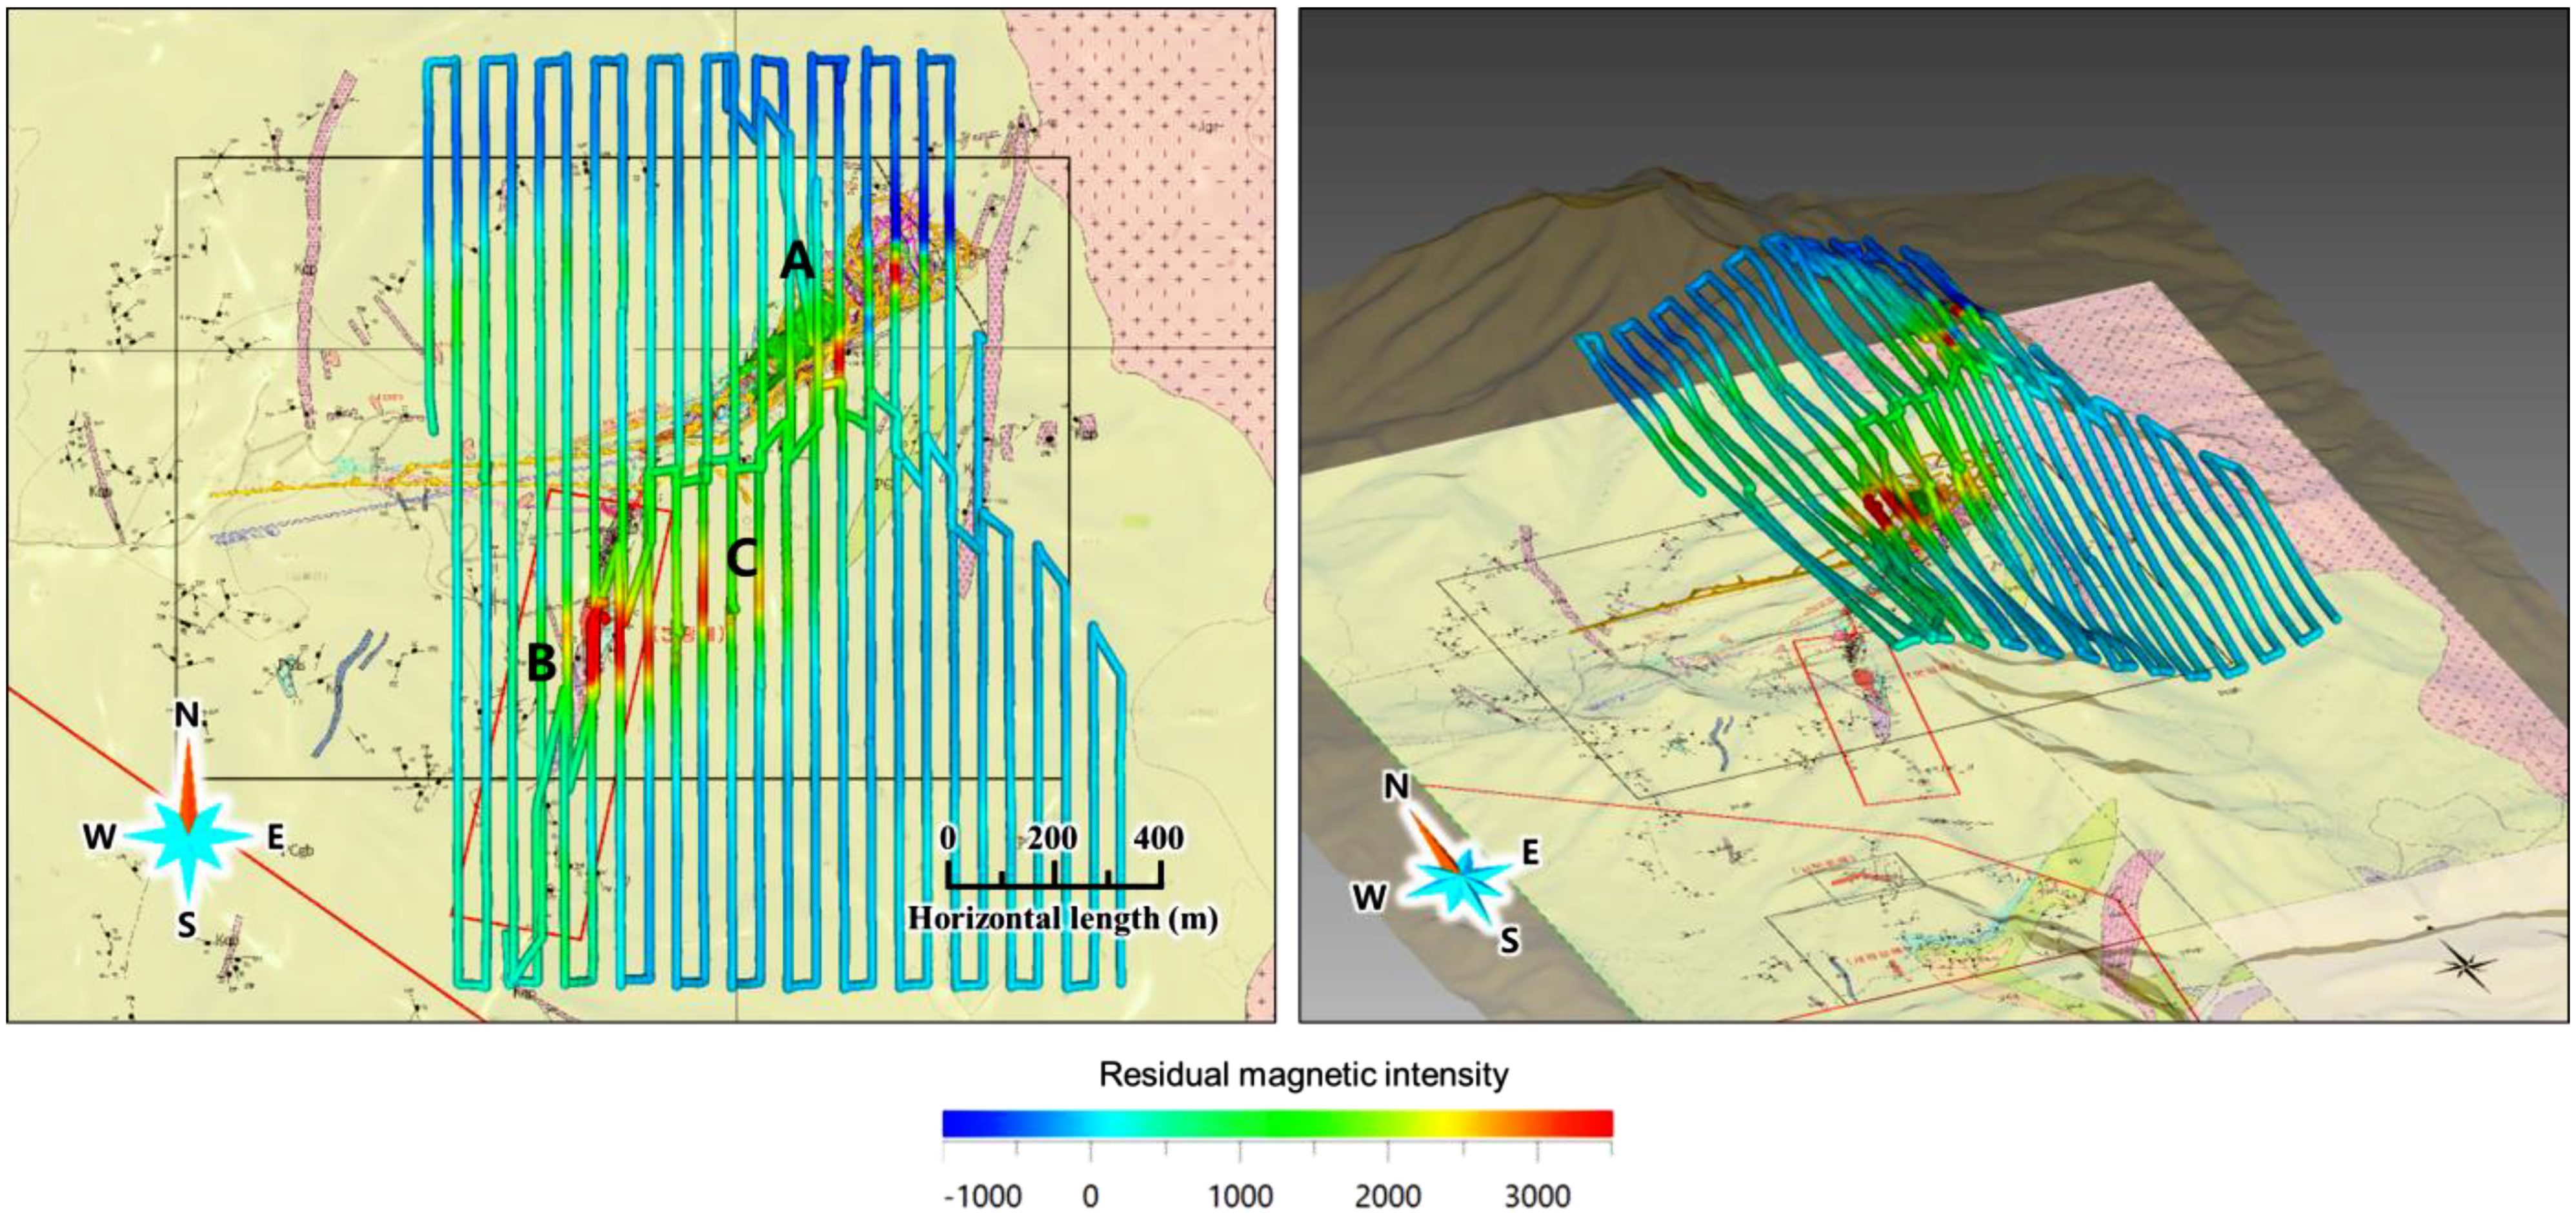
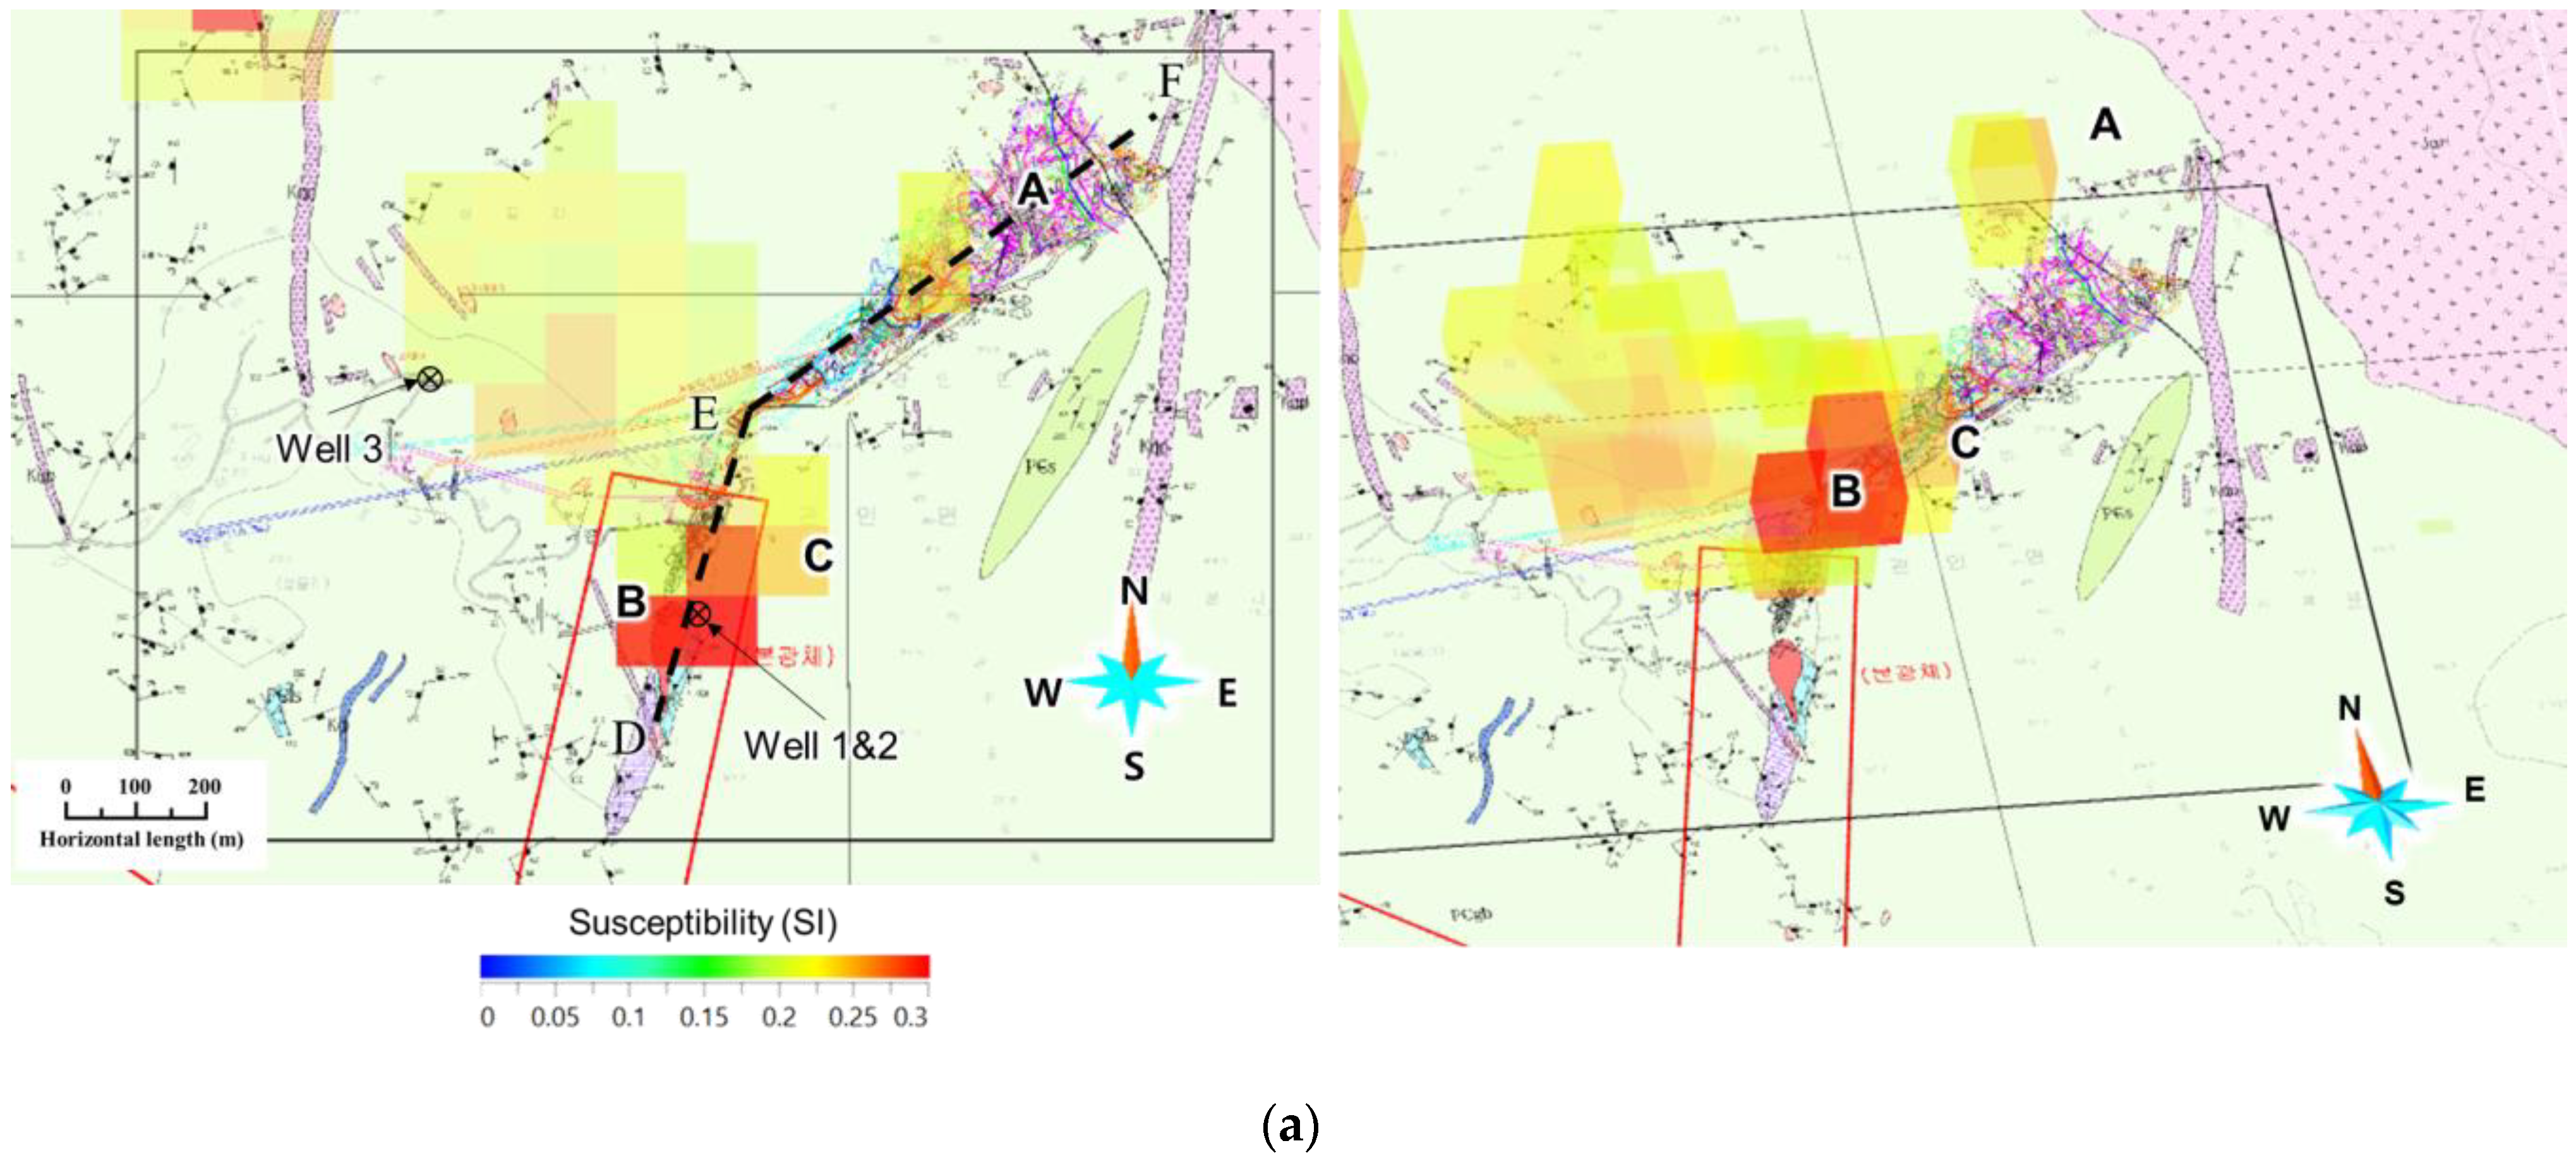
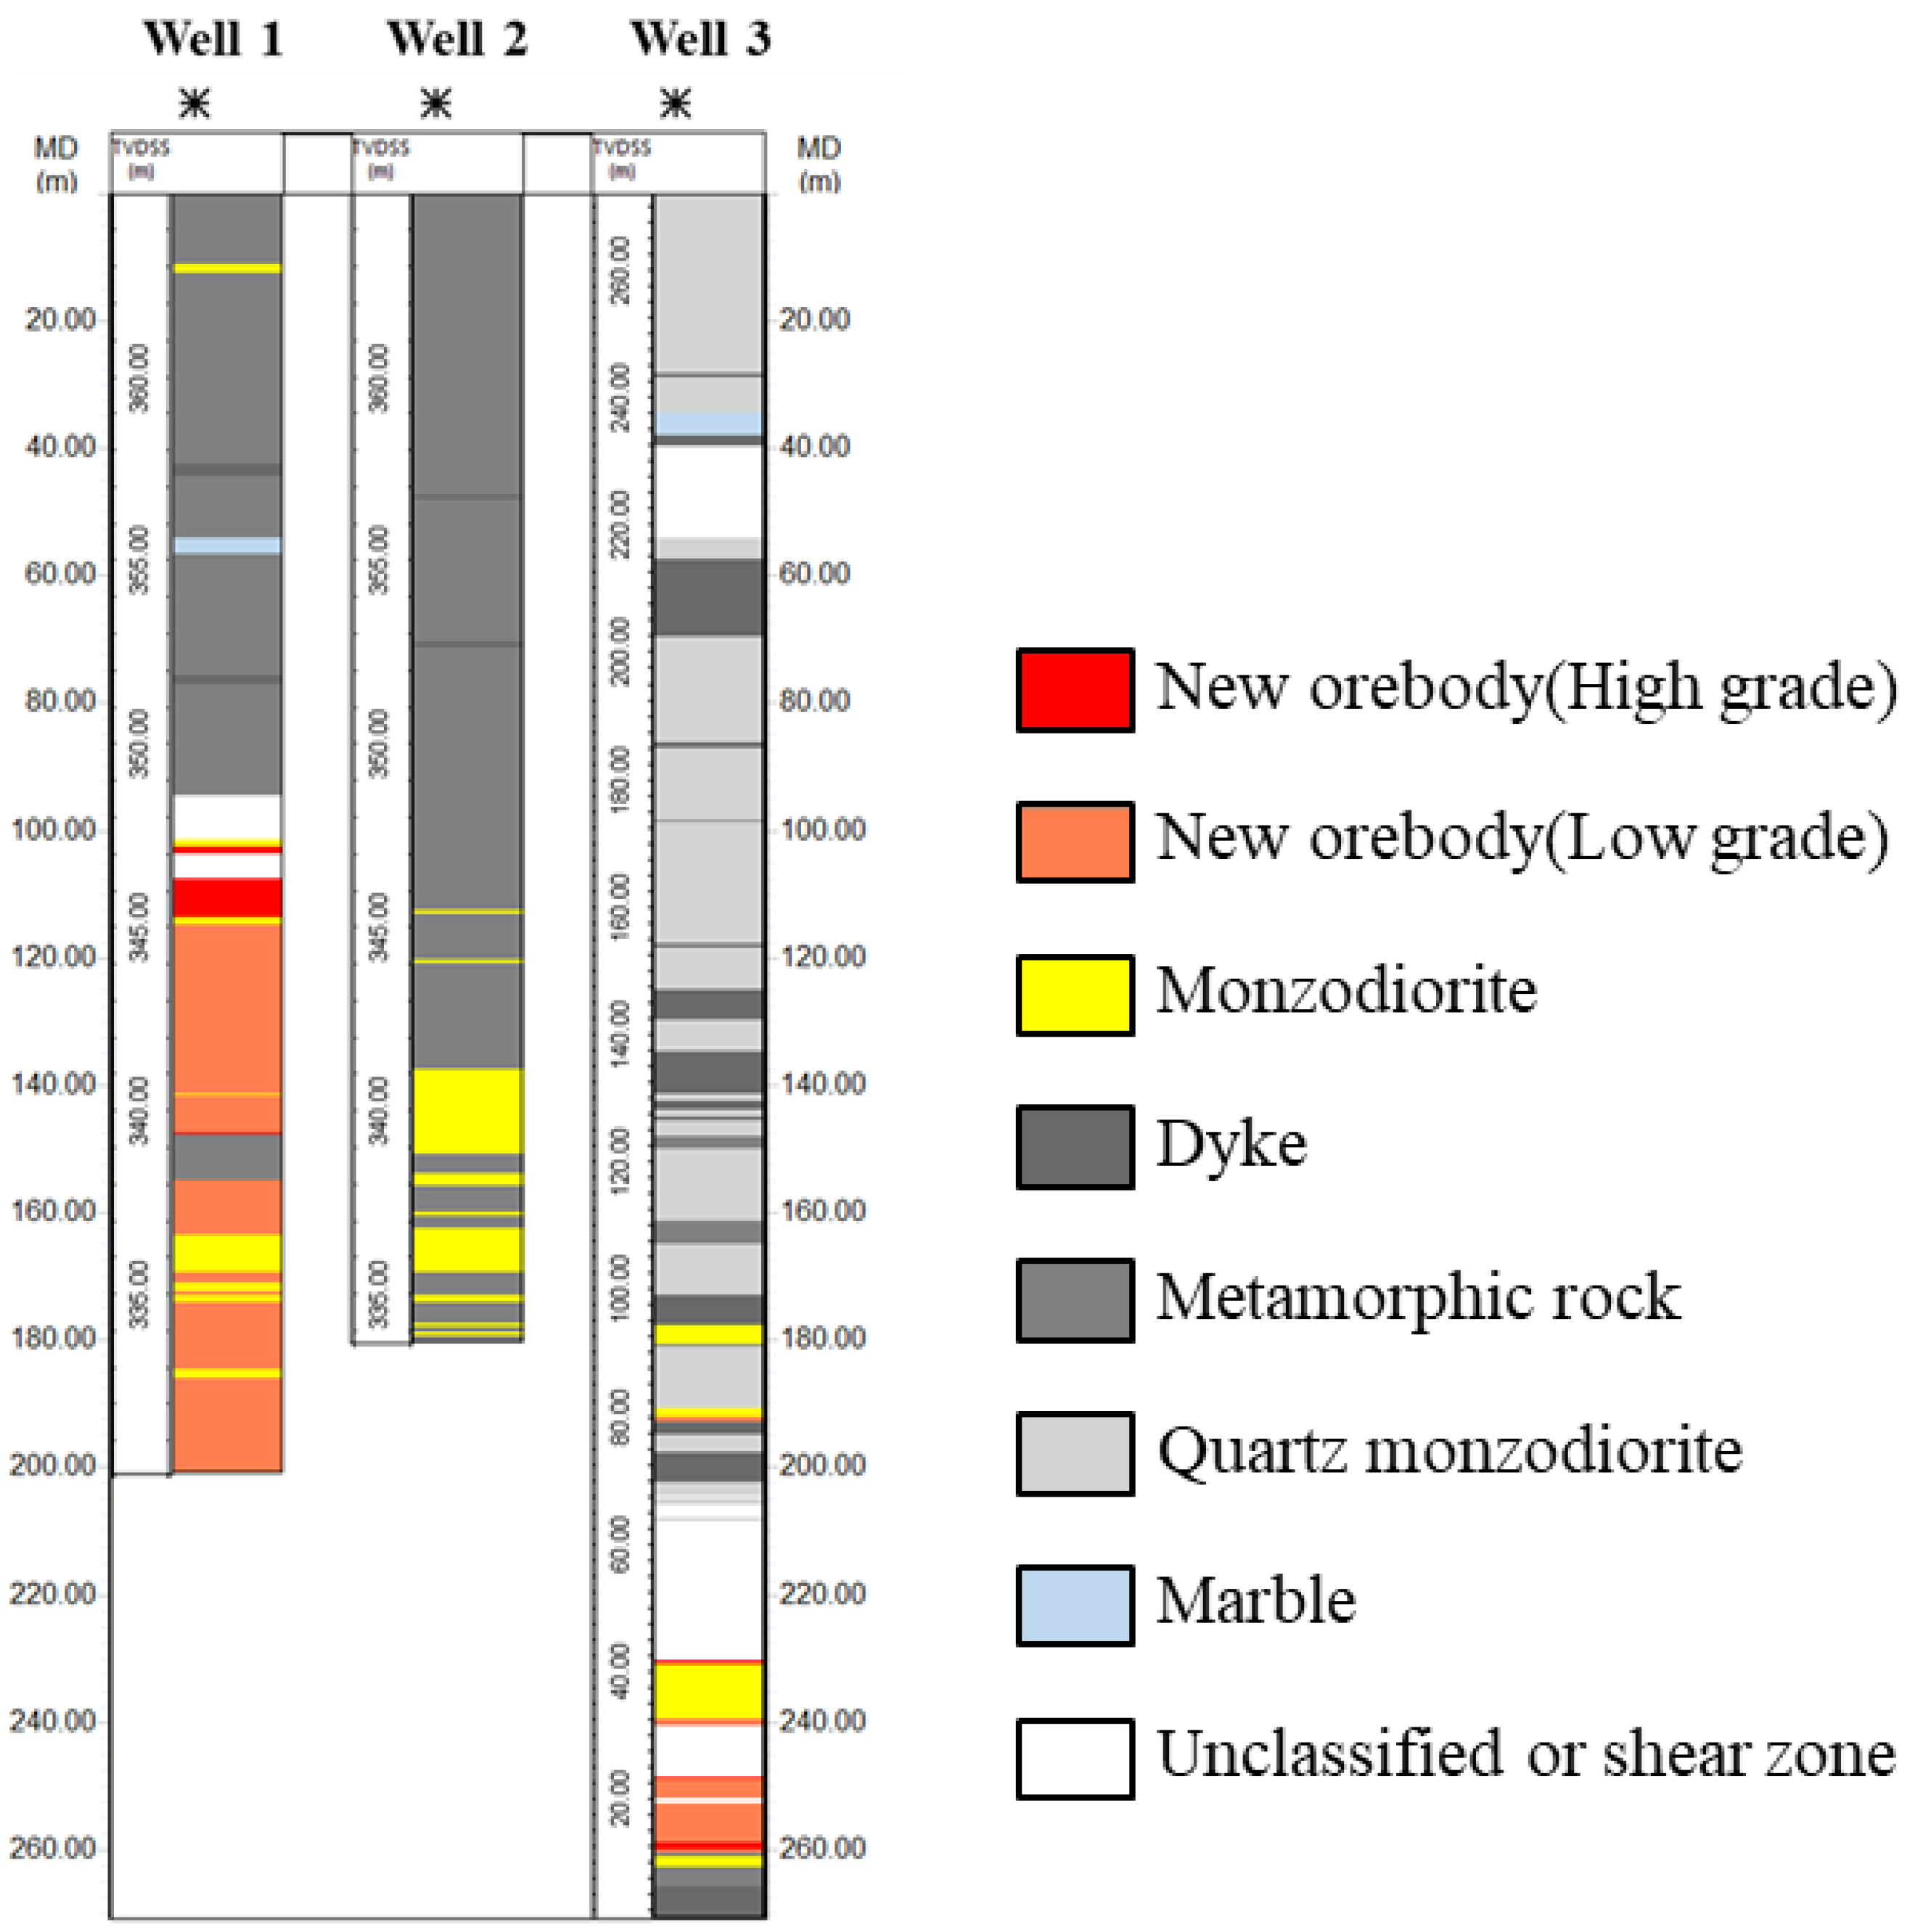
4. Results and Discussion

This section presents the inversion results obtained using the aeromagnetic data introduced above and the inversion technique. Figure 6 shows the inversion results of the aeromagnetic survey using a helicopter system. Figure 6a displays the inversion results superimposed on the geological map of Gwanin mine, and Figure 6b,c displays the 3D inversion results superimposed on the geological cross section interpreted from Gwanin mine. Figure 6a displays the region of the 3D inverted model with a susceptibility greater than 0.2 SI. Figure 6b,c only displays the region of the 3D inverted model with a susceptibility greater than 0.28 SI and 0.25 SI, respectively. Considering the line spacing (100 m), the size of inversion block was chosen (100 m × 100 m × 100 m). The location of the geological cross section shown in Figure 6b,c is indicated by dashed lines DE and EF in Figure 6a. The cross section shows the predicted distribution of potential iron ore (pink region) based on the position information of iron ore confirmed through drilling in the mine and the region developed so far. Area B is the area where iron ore is exposed on the surface as the pit that had been developed in the past collapsed. In the inversion results, the high susceptibility distribution is consistent with area B. In the case of area A, contrary to expectations, the anomalous body present directly under the surface and the susceptibility is relatively smaller than that of area B.
For a more detailed investigation, as described above, we also carried out an aeromagnetic exploration using a multicopter. Figure 7 shows the inversion result of the aeromagnetic survey using the multicopter system. Figure 7a displays the plan view of the inversion result superimposed on the geological map of Gwanin mine. Figure 7b,c displays the 3D inversion result superimposed on the geological cross section interpreted in Gwanin mine. Similar to the previous inversion results, Figure 7b,c only displays the region of the 3D inverted model with a susceptibility greater than 0.28 and 0.25 SI, respectively. Considering the line spacing (50 m), the size of inversion block was chosen (50 m × 50 m × 50 m). Compared with the previous inversion results using the aeromagnetic data from the helicopter, the location of a highly anomalous body (area B) was identified similarly. Additionally, a newly discovered anomalous body in area C was confirmed. However, the inversion result for area A, where there is an active mine, was still different from the location of magnetite that had already been identified (pink region in area A in Figure 7c). Therefore, to analyze the cause of the inconsistency in the inversion result in area A, the magnetic field data was simulated using the model constructed based on geological cross sections. Even when there was an anomaly having a higher magnetic susceptibility than the actual ore body (0.81 SI) and having a larger size, the magnetic intensity was close to zero at the investigation altitude. Based on these results, in the case of area A, we determined that there is a possibility that another anomalous body exists in the upper part and that through the surface geological survey, we could find the magnetite on the surface.
By comprehensively analyzing the inversion using the two sets of aeromagnetic data and the results of the geological analysis, two directional drilling and one vertical drilling project were designed (indicated in Figure 6a and Figure 7a) for verification. In the case of two-directional drilling, to obtain drilling data passing through area C, drilling was carried out at a location as close to area C as possible using the previously used pit. Well 1 was drilled to 201.2 m. The strike was N75E, and the slope was 10°. Well 2 was drilled to 180.5 m, with a strike of N80E and a slope of 10°. Well 3 (vertical drilling) was drilled to 271 m. Figure 8 shows the facies classification profiles of three wells. The results are shown based on the measured depth without considering the strike and slope. For clear distinction, the area that reacts with the magnet is marked with color, and the other areas are marked with achromatic color. In the case of well 1, iron-containing minerals appeared from 92 to 201.2 m. In well 2, iron-containing minerals appeared from 136 to 180.5 m. Comparing the two sets of drilling data, well 1 showed a relatively strong magnetic response; the strongest magnetic spot was located in the vicinity of 100 m of excavation depth. In the case of well 3, the weak magnetic response appeared at the vicinity of 250 m.
Additionally, to interpret the interior of the 3D magnetic inversion results quantitatively, we used the measured susceptibility results obtained from laboratory experiments of a core sample obtained from the main active mine (area A) and three new boreholes. Figure 9 shows box plots of the ranges of measured susceptibility according to rock type. In the case of area A, where iron ore development is in progress, it shows a relatively strong susceptibility distribution in the range of 0.78 to 0.84 SI. Among the drilling data of area C, the SI range of 0.3 to 0.4 for rock samples is classified as relatively high-grade ore bodies (red in Figure 8). The SI range of 0.11 to 0.19 for rock samples is classified as low-grade ore bodies (orange area in Figure 8). In the case of well 3, the region that reacted with the magnet shows an SI distribution of 0.013 to 0.16.
By performing a comparative analysis by superimposing the drilling data on the inversion result of the aeromagnetic data acquired using the multicopter system (Figure 10), well 1 was designed to penetrate the inside of the anomalous body in area C, and well 2 was configured to penetrate the boundary of the anomalous body. This is consistent with the observation that the intensity of the magnetic strength decreased from well 1 to well 2. Additionally, the appearance of iron-containing amphibolite after 92 m excavation in well 1 was consistent with the analysis results that area C was separated from area B. Additionally, when only values greater than 0.2 SI are shown among the 3D susceptibility models obtained through the inversion, the depth of the anomaly decreases from region B toward the drilling position of Well 3. The inversion results are consistent with the tendency to have susceptibility less than 0.2 SI from a depth of 250 m in well 3.
As a result of analyzing the distribution of ore bodies by applying two aeromagnetic methods, it was difficult for the manned aerial survey using helicopter to fly at low altitude along narrow line spacing due to safety concerns. On the other hand, in the case of using a multicopter, because automatic flight was performed based on sensors, it was possible to obtain data of narrow line spacing and relatively close to the ground. For this reason, the area that appeared to be a single ore body in the inversion result of the aeromagnetic data obtained using a helicopter was clearly distinguished in the inversion result of the aeromagnetic data obtained using the multicopter.
However, since UAV multicopters need to fly within line-of-sight, data must be collected while moving to the take-off and landing points for safety in the mountainous terrain, which can be an inefficient method to acquire a wide range of data. Therefore, it is recommended that these two methods are used as complements to each other for studying the distribution of ore bodies in complex mountainous terrain covered with trees.

5. Conclusions

We describe a case study in which we identified the distribution of iron ore mineral in the west-central portion of the Korean Peninsula using aeromagnetic techniques. We obtained regional information based on manned aeromagnetic data from a helicopter survey. Next, we acquired magnetic data with higher resolution from a UAV multicopter focusing on the target area. The advantage of using a helicopter was that it could acquire data quickly over a wide area. The advantage of using the multicopter was that it could perform precise automatic flight control, so it was suitable for acquiring high-resolution magnetic data. Through the inversion result of the higher-resolution magnetic data, we confirmed the possibility of the existence of a new ore body. Finally, drilling was performed based on the analysis results, and new ore bodies were successfully identified.

Author Contributions

Conceptualization, B.K., S.J., E.B., S.S. and S.C.; methodology, B.K., S.J. and S.C.; software, B.K. and S.J.; validation, B.K. and S.S.; formal analysis, S.J.; investigation, B.K., S.J., E.B., S.S. and S.C.; data curation, S.J.; writing—original draft preparation, B.K.; writing—review and editing, S.C.; visualization, B.K.; supervision, E.B. and S.C.; project administration, S.C.; funding acquisition, S.C. All authors have read and agreed to the published version of the manuscript.

Funding

This research was supported by the basic research project of the Korea Institute of Geoscience and Mineral Resources, Daejeon, South Korea, funded by the Ministry of Science and ICT of Korea (GP2020-007).

Acknowledgments

We appreciate anonymous reviewers and the associated editor for the constructive review comments to improve the quality of the manuscript. We also thank all KIGAM researchers who helped to obtain the data used in this manuscript.

Conflicts of Interest

The authors declare no conflict of interest.

References

  1. Amigun, J.O.; Afolabi, O.; Ako, B.D. Application of airborne magnetic data to mineral exploration in the Okene Iron Ore Province of Nigeria Prospect for Investment in Mineral Resources. Int. Res. J. Geol. Min. 2012, 2, 132–140. [Google Scholar]
  2. Everett, M. Magnetics. In Near-Surface Applied Geophysics; Cambridge University Press: Cambridge, UK, 2013; pp. 123–135. [Google Scholar]
  3. Hinze, W.J.; von Frese, R.B.; Saad, A.H. Part II-Magnetic exploration. In Gravity and Magnetic Exploration: Principles, Practices, and Applications; Cambridge University Press: Cambridge, UK, 2013. [Google Scholar]
  4. Okpoli, C.C. High resolution magnetic field signature over Akure and its environs, Southwestern Nigeria. Earth Sci. Malays. 2019, 3, 9–17. [Google Scholar] [CrossRef]
  5. Spector, A.; Lawler, T.L. Application of aeromagnetic data to mineral potential evaluation in Minnesota. Geophysics 1995, 50, 1704–1714. [Google Scholar] [CrossRef]
  6. Caron, R.; Samson, C.; Straznicky, P.; Ferguson, S.; Sander, L. Aeromagnetic surveying using a simulated unmanned aircraft system. Geophys. Prospect. 2014, 62, 352–363. [Google Scholar] [CrossRef]
  7. Gavazzi, B.; Le Maire, P.; Munschy, M.; Dechamp, A. Fluxgate vector magnetometers: A multisensor device for ground, UAV, and airborne magnetic surveys. Lead. Edge 2016, 35, 795–797. [Google Scholar] [CrossRef] [Green Version]
  8. Hashimoto, T.; Koyama, T.; Kaneko, T.; Ohminato, T.; Yanagisawa, T.; Yoshimoto, M.; Suzuki, E. Aeromagnetic survey using an unmanned autonomous helicopter over Tarumae Volcano, northern Japan. Explor. Geophys. 2014, 45, 37–42. [Google Scholar] [CrossRef] [Green Version]
  9. Jackisch, R.; Madriz, Y.; Zimmermann, R.; Pirttijärvi, M.; Saartenoja, A.; Heincke, B.H.; Salmirinne, H.; Kujasalo, J.; Andreani, L.; Gloaguen, R. Drone-Borne Hyperspectral and Magnetic Data integration: Otanmäki Fe-Ti-V Deposit in Finland. Remote Sens. 2019, 11, 2084. [Google Scholar] [CrossRef] [Green Version]
  10. Malehmir, A.; Dynesius, L.; Paulusson, K.; Paulusson, A.; Johansson, H.; Bastani, M.; Wedmark, M.; Marsden, P. The potential of rotary-wing UAV-based magnetic surveys for mineral exploration: A case study from central Sweden. Lead. Edge 2017, 36, 552–557. [Google Scholar] [CrossRef]
  11. Parshin, A.V.; Morozov, V.A.; Blinov, A.V.; Kosterev, A.N.; Budyak, A.E. Low-altitude geophysical magnetic prospecting based on multirotor UAV as a promising replacement for traditional ground survey. Geo-Spat. Inf. Sci. 2018, 21, 67–74. [Google Scholar] [CrossRef] [Green Version]
  12. Walter, C.; Braun, A.; Fotopoulos, G. High-resolution unmanned aerial vehicle aeromagnetic surveys for mineral exploration targets. Geophys. Prospect. 2020, 68, 334–349. [Google Scholar] [CrossRef]
  13. Cunnigham, M.; Samson, C.; Laliberte, J.; Goldie, M.; Wood, A.; Birkett, D. Inversion of Magnetic Data Acquired with a Rotary-Wing Unmanned Aircraft System for Gold Exploration. Pure Appl. Geophys. 2021, 178, 501–516. [Google Scholar] [CrossRef]
  14. Li, Y.; Nabighian, M. 11.11-Tools and Techniques: Magnetic Methods of Exploration-Principles and Algorithms. In Treatise on Geophysics; Elsevier: Amsterdam, The Netherlands, 2015; pp. 343–357. [Google Scholar]
  15. Ekinci, Y.L.; Balkaya, Ç.; Göktürkler, G. Global Optimization of Near-Surface Potential Field Anomalies Through Metaheuristics. In Advances in Modeling and Interpretation in Near Surface Geophysics; Springer Geophysics; Springer: Cham, Switzerland, 2020; p. 156. [Google Scholar]
  16. Menke, W. Geophysical Data Analysis: Discrete Inverse Theory; Academic Press: San Diego, CA, USA, 1989. [Google Scholar]
  17. Tarantola, A. Inverse Problem Theory and Methods for Model Parameter Estimation; Society of Industrial and Applied Mathematics: Philadelphia, PA, USA, 2005. [Google Scholar]
  18. Li, Y.; Oldenburg, D.W. 3-D inversion of magnetic data. Geophysics 1996, 61, 394–408. [Google Scholar] [CrossRef]
  19. Li, Y.; Oldenburg, D.W. Fast inversion of large-scale magnetic data using wavelet transforms and a logarithmic barrier method. Geophys. J. Int. 2003, 152, 251–265. [Google Scholar] [CrossRef] [Green Version]
  20. Portniaguine, O.; Zhdanov, M.S. 3-Dmagnetic inversion with data compression and image focusing. Geophysics 2002, 67, 1532–1541. [Google Scholar] [CrossRef] [Green Version]
  21. Čuma, M.; Wilson, G.A.; Zhdanov, M.S. Large-scale 3D inversion of potential field data. Geophys. Prospect. 2012, 60, 1186–1199. [Google Scholar] [CrossRef]
  22. Balkaya, Ç. An implementation of differential evolution algorithm for inversion of geoelectrical data. J. Appl. Geophys. 2013, 98, 160–175. [Google Scholar] [CrossRef]
  23. Cho, J.D.; Bang, K.Y. A Report of the Magnetic Survey on the Titanomagnetite Ore Bodies of the Mt. Gonam Area; Korea Research Institute of Geoscience and Mineral Resources: Deajeon, Korea, 1980; Volume 8, pp. 149–164. [Google Scholar]
  24. Kee, W.S.; Cho, D.L.; Kim, B.C.; Jin, K.M. Geological Report of the Pocheon Sheet (1:50,000); Korea Institute of Geoscience and Mineral Resources: Daejeon, Korea, 2005; p. 66. (In Korean) [Google Scholar]
  25. Jang, H.W.; Yum, B.W.; Park, N.Y. Petrochemical Study on the Alkaline Gabbroic Host Rocks of Titaniferous Magnetite Deposits in Gonamsan, Yeoncheon-Gun, South Korea. Korean Soc. Econ. Environ. Geol. 1987, 20, 85–95. [Google Scholar]
  26. Kim, K.H.; Lee, H.J.; Chon, H.T. Ore genesis of the Yonchon titaniferous iron ore deposits, South Korea. Korean Soc. Econ. Environ. Geol. 1994, 27, 117–130. [Google Scholar]
  27. MagArrow UAV-Enabled Magnetometer. Available online: https://www.geometrics.com/product/MagArrow/ (accessed on 19 April 2021).
  28. Wells, M. Attenuating Magnetic Interference in a UAV System. Master’s Thesis, Department of Earth Science, Carleton University, Ottawa, ON, Canada, 2008; pp. 1–128. [Google Scholar]
  29. Cunningham, M. Aeromagnetic Surveying with Unmanned Aircraft System. Master’s Thesis, Department of Earth Science, Carleton University, Ottawa, ON, Canada, 2016; pp. 1–156. [Google Scholar]
  30. Parvar, K. Development and Evaluation of Unmanned Aerial Vehicle (UAV) Magnetometry Systems. Master’s Thesis, Department of Geological Sciences and Geological Engineering, Queen’s University, Kingston, ON, Canada, 2016; pp. 1–141. [Google Scholar]
  31. Walter, C.; Braun, A.; Fotopoulos, G. Impact of three-dimensional attitude variations of an unmanned aerial vehicle magnetometry system on magnetic data quality. Geophys. Prospect. 2019, 67, 465–479. [Google Scholar] [CrossRef]
  32. Parvar, K.; Braun, A.; Layton-Matthews, D.; Burns, M. UAV magnetometry for chromite exploration in the Samail ophiolite sequence, Oman. J. Unmanned Veh. Syst. 2018, 6, 57–69. [Google Scholar] [CrossRef] [Green Version]
  33. Fullagar, P.K.; Pears, G.A. Towards geologically realistic inversion. Proc. Dec. Int. Conf. Miner. Explor. 2007, 5, 444–460. [Google Scholar]
  34. Fullagar, P.K.; Hughes, N.A.; Paine, J. Drilling-constrained 3D gravity interpretation. Explor. Geophys. 2000, 31, 17–23. [Google Scholar] [CrossRef]
  35. Fullagar, P.K.; Pears, G.; Hutton, D.; Thompson, A.D. 3D gravity and aeromagnetic inversion for MVT lead-zinc exploration at Pillara, Western Australia. Explor. Geophys. 2004, 35, 142–146. [Google Scholar]
  36. Fullagar, P.K.; Pears, G.A.; McMonnies, B. Constrained inversion of geologic surfaces—Pushing the boundaries. Lead. Edge 2008, 27, 98–105. [Google Scholar] [CrossRef]
Figure 1. (a) General geological map showing the tectonostratigraphic units of the southern Korean Peninsula. Yellow star indicates the location of study area, Gwanin (Mount Gonam). (b) Geological map of Gwanin (modified from [24]). Yellow rectangle indicates the study area.
Minerals 11 00665 g001
Figure 2. Manned aeromagnetic survey system used by the Korean Institute of Geoscience and Mineral Resources (KIGAM).
Minerals 11 00665 g002
Figure 3. Aeromagnetic survey results using a helicopter in 2019.
Minerals 11 00665 g003
Figure 4. Unmanned aeromagnetic survey system used by KIGAM.
Minerals 11 00665 g004
Figure 5. Aeromagnetic survey results using multicopter in 2020.
Minerals 11 00665 g005
Figure 6. Inversion results of aeromagnetic data acquired using the helicopter system shown in Figure 3: (a) plan views showing only areas with susceptibility greater than 0.2, (b) side view showing only areas with susceptibility greater than 0.28, and (c) side view showing only areas with susceptibility greater than 0.25. The location of geological cross section shown in Figure 6b,c is indicated by dashed lines DE and EF in Figure 6a. The cross section shows the predicted distribution of potential iron ore (pink region) based on the position information of iron ore confirmed through drilling in the mine and the region developed so far.
Minerals 11 00665 g006aMinerals 11 00665 g006b
Figure 7. Inversion results of aeromagnetic data acquired using the multicopter system shown in Figure 5: (a) plan view showing only areas with a susceptibility greater than 0.2, (b) side view showing only areas with a susceptibility greater than 0.28, and (c) side view showing only areas with a susceptibility greater than 0.25. The location of geological cross section shown in Figure 7b,c is indicated by dashed lines DE and EF in Figure 7a. The cross section shows the predicted distribution of potential iron ore (pink region) based on the position information of iron ore confirmed through drilling in the mine and the region developed so far.
Minerals 11 00665 g007
Figure 8. Facies classification profiles of three wells. The results are displayed based on the measured depth without considering the strike and slope.
Minerals 11 00665 g008
Figure 9. Box plots of measured susceptibility according to rock type from drilling data. The solid lines in the box plots represent the median value of each rock type.
Minerals 11 00665 g009
Figure 10. Drilling results shown overlaid on the inversion result of the aeromagnetic data acquired using the multicopter system.
Minerals 11 00665 g010
Publisher’s Note: MDPI stays neutral with regard to jurisdictional claims in published maps and institutional affiliations.

