Article

Ultrafast X-ray Diffraction Study of a Shock-Compressed Iron Meteorite above 100 GPa

1
Department of Geological Sciences, Stanford University, Stanford, CA 94305, USA
2
SLAC National Accelerator Laboratory, Menlo Park, CA 94025, USA
3
Los Alamos National Laboratory, Los Alamos, NM 87545, USA
4
Unité Matériaux et Transformations Cité scientifique, CNRS, INRAE, Centrale Lille, UMR 8207—UMET, F-59000 Lille, France
*
Author to whom correspondence should be addressed.
Now at CERN, 1211 Geneva 23, Switzerland.
Now at Physics Department, University of California, Berkeley, CA 94704, USA.
Minerals 2021, 11(6), 567; https://doi.org/10.3390/min11060567
Submission received: 13 April 2021 / Revised: 24 May 2021 / Accepted: 24 May 2021 / Published: 26 May 2021
(This article belongs to the Special Issue Structural Characterization of Earth Materials at Extreme Conditions)

Abstract

:
Natural kamacite samples (Fe92.5Ni7.5) from a fragment of the Gibeon meteorite were studied as a proxy material for terrestrial cores to examine phase transition kinetics under shock compression for a range of different pressures up to 140 GPa. In situ time-resolved X-ray diffraction (XRD) data were collected of a body-centered cubic (bcc) kamacite section that transforms to the high-pressure hexagonal close-packed (hcp) phase with sub-nanosecond temporal resolution. The coarse-grained crystal of kamacite rapidly transformed to highly oriented crystallites of the hcp phase at maximum compression. The hcp phase persisted for as long as 9.5 ns following shock release. Comparing the c/a ratio with previous static and dynamic work on Fe and Fe-rich Fe-Ni alloys, it was found that some shots exhibit a larger than ideal c/a ratio, up to nearly 1.65. This work represents the first time-resolved laser shock compression structural study of a natural iron meteorite, relevant for understanding the dynamic material properties of metallic planetary bodies during impact events and Earth’s core elasticity.

1. Introduction

Iron meteorites provide unique samples of early solar system material and offer insight into planetary processes such as impact events and core formation originating from differentiated planetesimals bodies [1,2]. The Gibeon meteorite, an iron meteorite that was discovered in 1836 after falling in Namibia, Africa [3], is studied here due to its compositional similarity to the Earth’s core and commercially availability. It can be used for studying how the physical properties of planetary core materials are affected by dynamic processes that may have occurred during the formation and evolution—much like the metallic asteroid 16-Psyche [4]. During cosmic hit-and-run collisions, planetesimals are stripped of their mantle material and leave behind a residual metal core that later could break up further through collisions with other planetary bodies [5]. In addition, exploring the effects of shock metamorphism on iron meteorites, as characterized by microstructure and microchemistry studies, provides insight into impact events and thermal history [6]. Understanding the structural properties of meteorites under shock compression and during the timescale of dynamic compression may provide insight into the evolution of these asteroids.
The Gibeon meteorite is made of an Fe-rich Fe-Ni alloy and belongs to the most common structural class for iron meteorites called octahedrites (group IVA). This meteorite contains three major phases, depending on the Fe/Ni ratio in its composition: an Fe-rich/Ni-poor ferrite phase (<7.5% Ni) known as kamacite, which has a body-centered cubic (bcc) structure; a second major phase taenite, also called austenite, which can incorporate up to 25% Ni, crystallizing in a face-centered cubic (fcc) structure [7,8]; and plessite, the third major meteorite texture, which is a mixture of kamacite and taenite, exhibiting fine grains between larger bands of pure taenite and kamacite phases. The kamacite phase is located in the Widmanstätten lamellae [9], with plessite and taenite making up the material between the lamellae, producing complex structural orientations and boundaries between the bcc and fcc crystals [10]. This is the dominant microstructure seen in Gibeon meteorite samples [11].
The phase diagram of Fe has been studied extensively as a function of pressure and temperature and is of particular importance for Earth and planetary science as well as for industry. It shows transitions between the bcc or fcc structures transforming to a hexagonal close-packed (hcp) structure at high pressure, (e.g., [12,13,14,15]). Some reports include investigations on the Fe-Ni binary system, demonstrating that the fcc–hcp boundary is shifted toward higher pressure and lower temperature with respect to the pure Fe phase diagram. Here, the Ni stabilizes the fcc structure, showing that the Ni content could be crucial in stabilizing the two-phase region (fcc together with hcp) at extreme conditions [16].
The ratio of hcp crystal structure lattice parameters, c/a, is often tracked as a function of pressure (P) or volume (V) and temperature (T) to provide insight into atomic packing and examine deformation mechanisms in metals. At Earth’s inner core pressure–temperature conditions, hcp iron is likely the stable phase. However, despite the importance of understanding the inner core structure and properties, the elastic constants of hcp iron at relevant core conditions are still poorly constrained. The ideal c/a ratio of 1.633 is derived from the assumption of non-interacting, identical hard spheres in an hcp structure. One way to track the elasticity of hcp iron at extreme conditions, and in particular, elastic anisotropy, is to measure departure from the ideal c/a ratio. For instance, alignment of hcp crystallites could be responsible for the measured seismic anisotropy in Earth’s inner core. Substantially larger c/a ratios of 1.7, for instance, have been predicted for hcp Fe at inner core conditions [17], although static experiments do not agree with those predictions [18]. The axial c/a ratio can be used to characterize hcp Fe elasticity under static [17] or dynamic [19] compression. Similar to static compression measurements, dynamic compression experiments and simulations on polycrystalline bcc Fe show shock-induced transitions to hcp Fe and also reveal a c/a ratio below the ideal value [19]. This could be associated with defects, such as dislocations, or grain boundaries that act as sources of stress on the time scale of the measurements (i.e., nanoseconds) [19]. Furthermore, it has been demonstrated that hcp Fe-Ni and Fe-Ni-Si alloys only have slightly higher c/a ratios (less than 1% higher) than pure hcp Fe for the same pressure range [20] but that are all still lower than the ideal value. Tracking this parameter could provide insight into which important underlying physical or chemical properties (e.g., starting structure, composition, and microstructure like crystal orientation or texture) and/or processes (e.g., static vs. dynamic compression, including strain rate) dictate the deformation response in meteoritic material—including the typical timescales of phase transformation of meteorites exposed to extreme conditions.
High-pressure dynamic compression experiments represent a unique way to recreate dynamic processes such as asteroid/planetary collisions in the lab and make it possible to track the lattice-level response of materials using in situ time-resolved X-ray diffraction [21,22]. Dynamic compression techniques also provide access to combined high-pressure and high-temperature states of a material in concert with characterization via ultrafast X-ray probes that more traditional static compression techniques cannot access, e.g., [23]. Coupling the laser-induced shock compression experiments with reliable structural studies to elucidate phase transitions that occur at short timescales of hundreds of picoseconds to nanoseconds requires an ultrafast and tunable X-ray source such as X-ray free-electron lasers (XFELs) that can operate on femtosecond timescales with a high repetition rate, e.g., [24,25,26].
Herein, the first time-resolved structural study of a laser-shock-compressed natural meteorite is presented. Phase transformation kinetics of Fe92.5Ni7.5 natural kamacite was investigated from the Gibeon meteorite using in situ time-resolved X-ray diffraction and compared to previous static compression work on related systems.

2. Materials and Methods

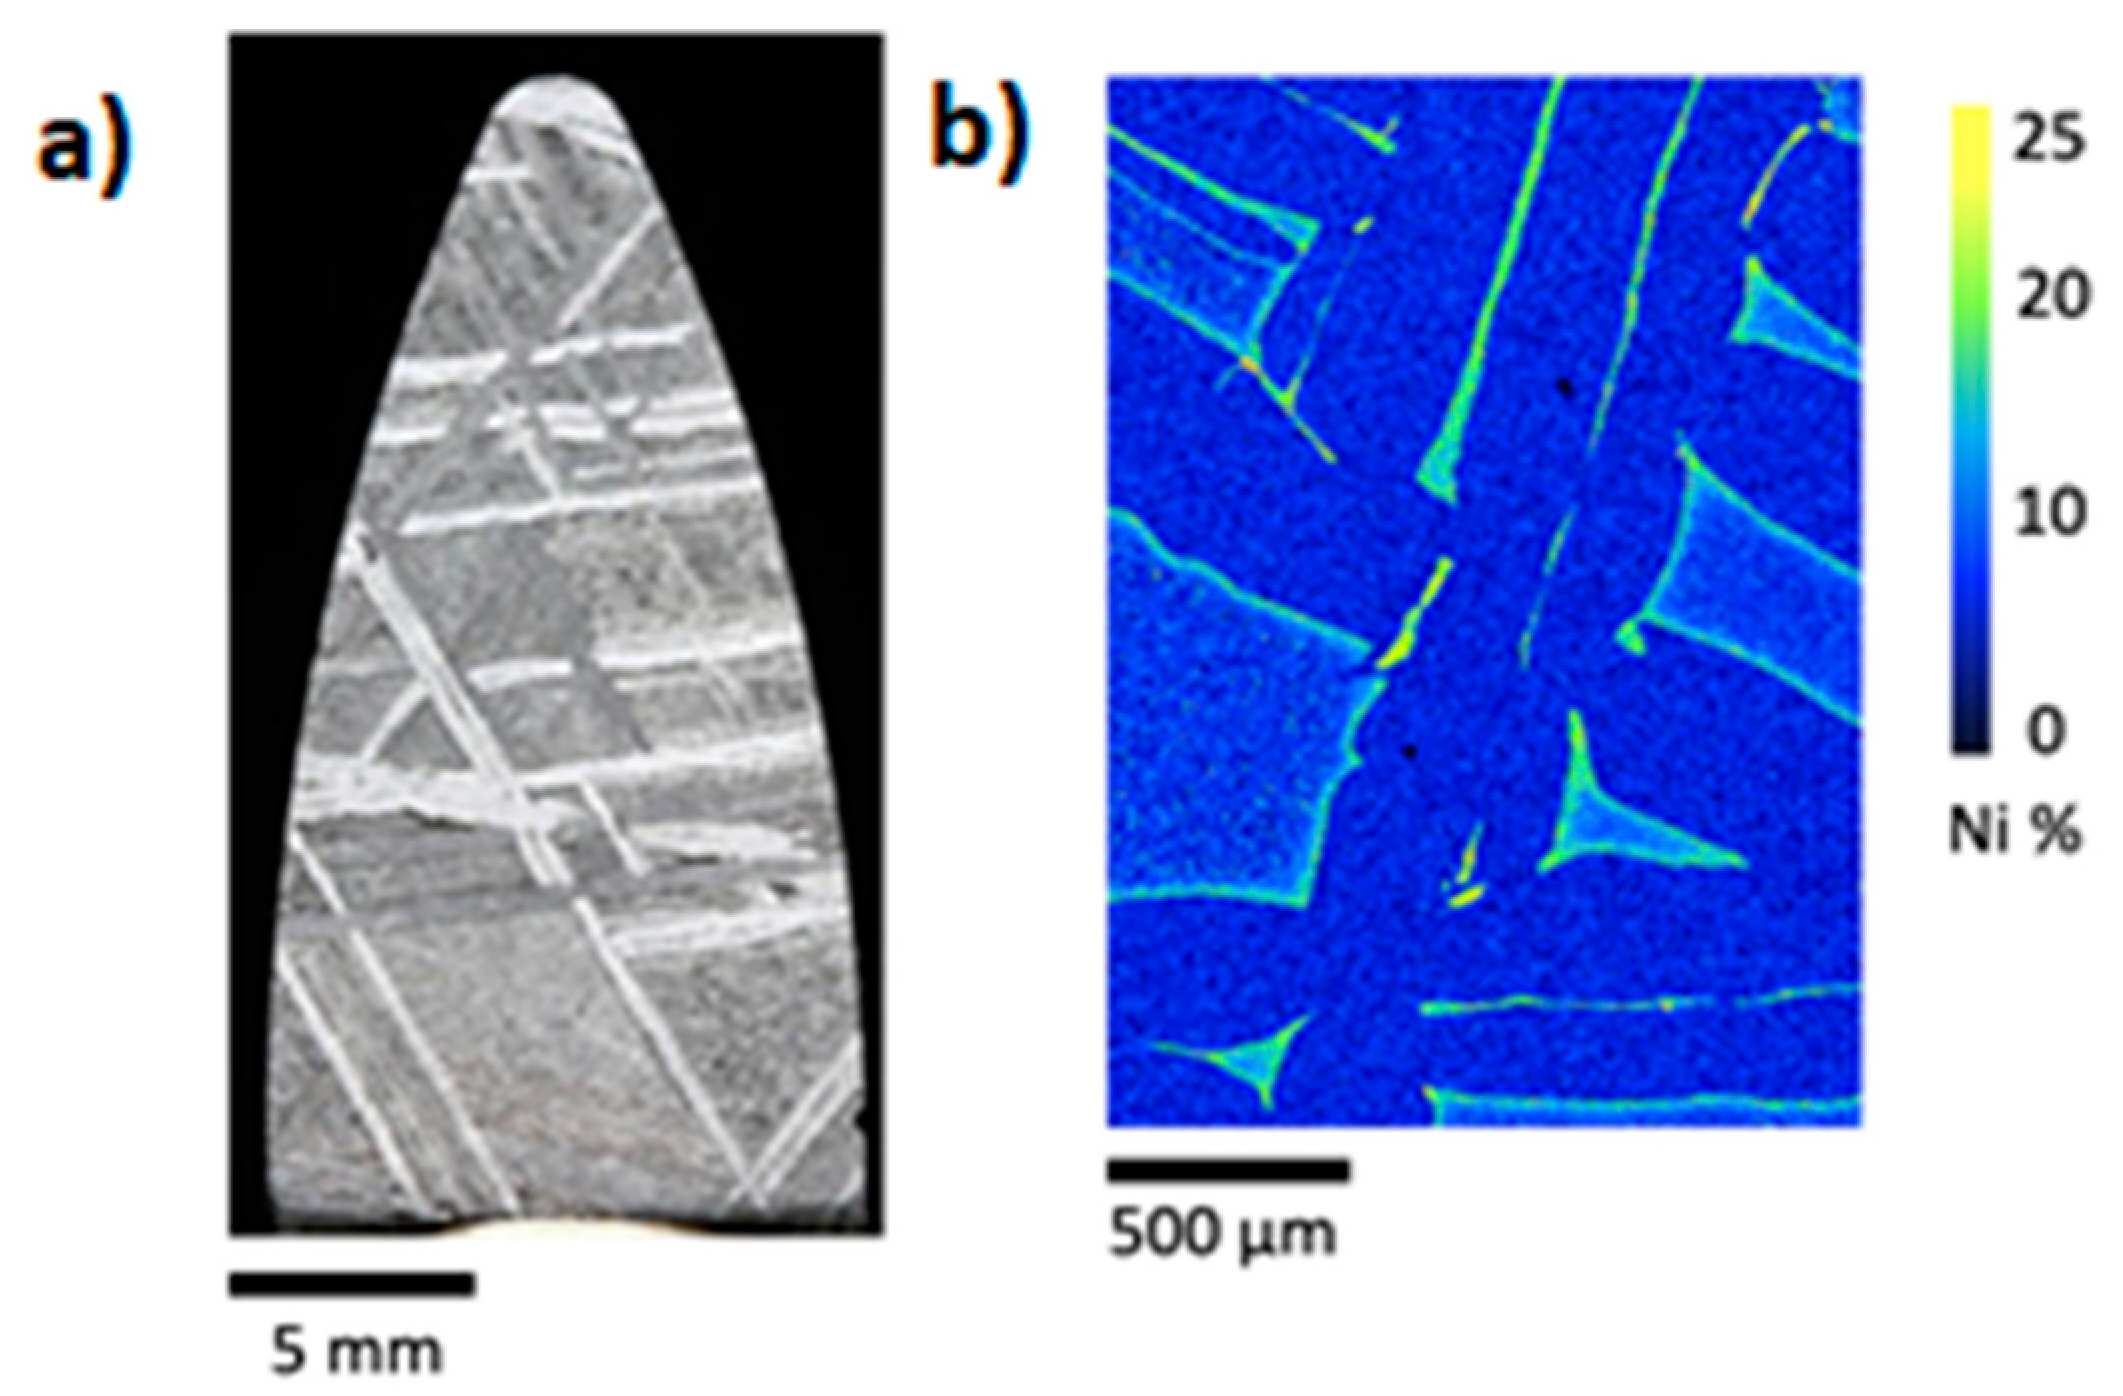
2.1. Sample Preparation and Characterization

The starting material was a hand sample fragment (0.4 cm × 2 cm × 3 cm) of the Gibeon meteorite (Figure 1a) that was characterized by an electron microprobe to determine the precise metallic composition before shock compression (Figure 1b). Electron backscatter diffraction (EBSD, Philips XL30 FEG SEM using TSL Data Collection & Analysis software, MST-8, LANL, Los Alamos, NM, USA) was also performed to determine crystal orientations (Supplementary Materials, Figure S1). Individual, large-grained crystals of kamacite (bcc) are clear in the Widmanstätten lamellae, with Ni-rich taenite (fcc) and plessite concentrated in the grain boundaries. The hand sample fragment was sectioned and double-side parallel-polished into 34-µm-thick foils. Here, kamacite was isolated for primary investigation of this study due to its similarity to Earth’s core composition. Individual kamacite lamellae were cut along the perimeter and diced into 1 mm × 2 mm foils. The composition within the selected lamellae was Fe92.5Ni7.5, with taenite and plessite (Ni content up to 25%) concentrated in the grain boundaries. The samples were aligned such that the length of the lamellae was perpendicular to the shock propagation direction. Dupont Kapton CB plastic film, 54 µm thick, was glued (glue layer thickness: 2–5 µm) to the meteorite foil, serving as the laser ablation layer. This plastic smooths out any inhomogeneities (e.g., hot spots) in the drive laser to generate a planar, uniform shock front with respect to the X-ray probed volume.

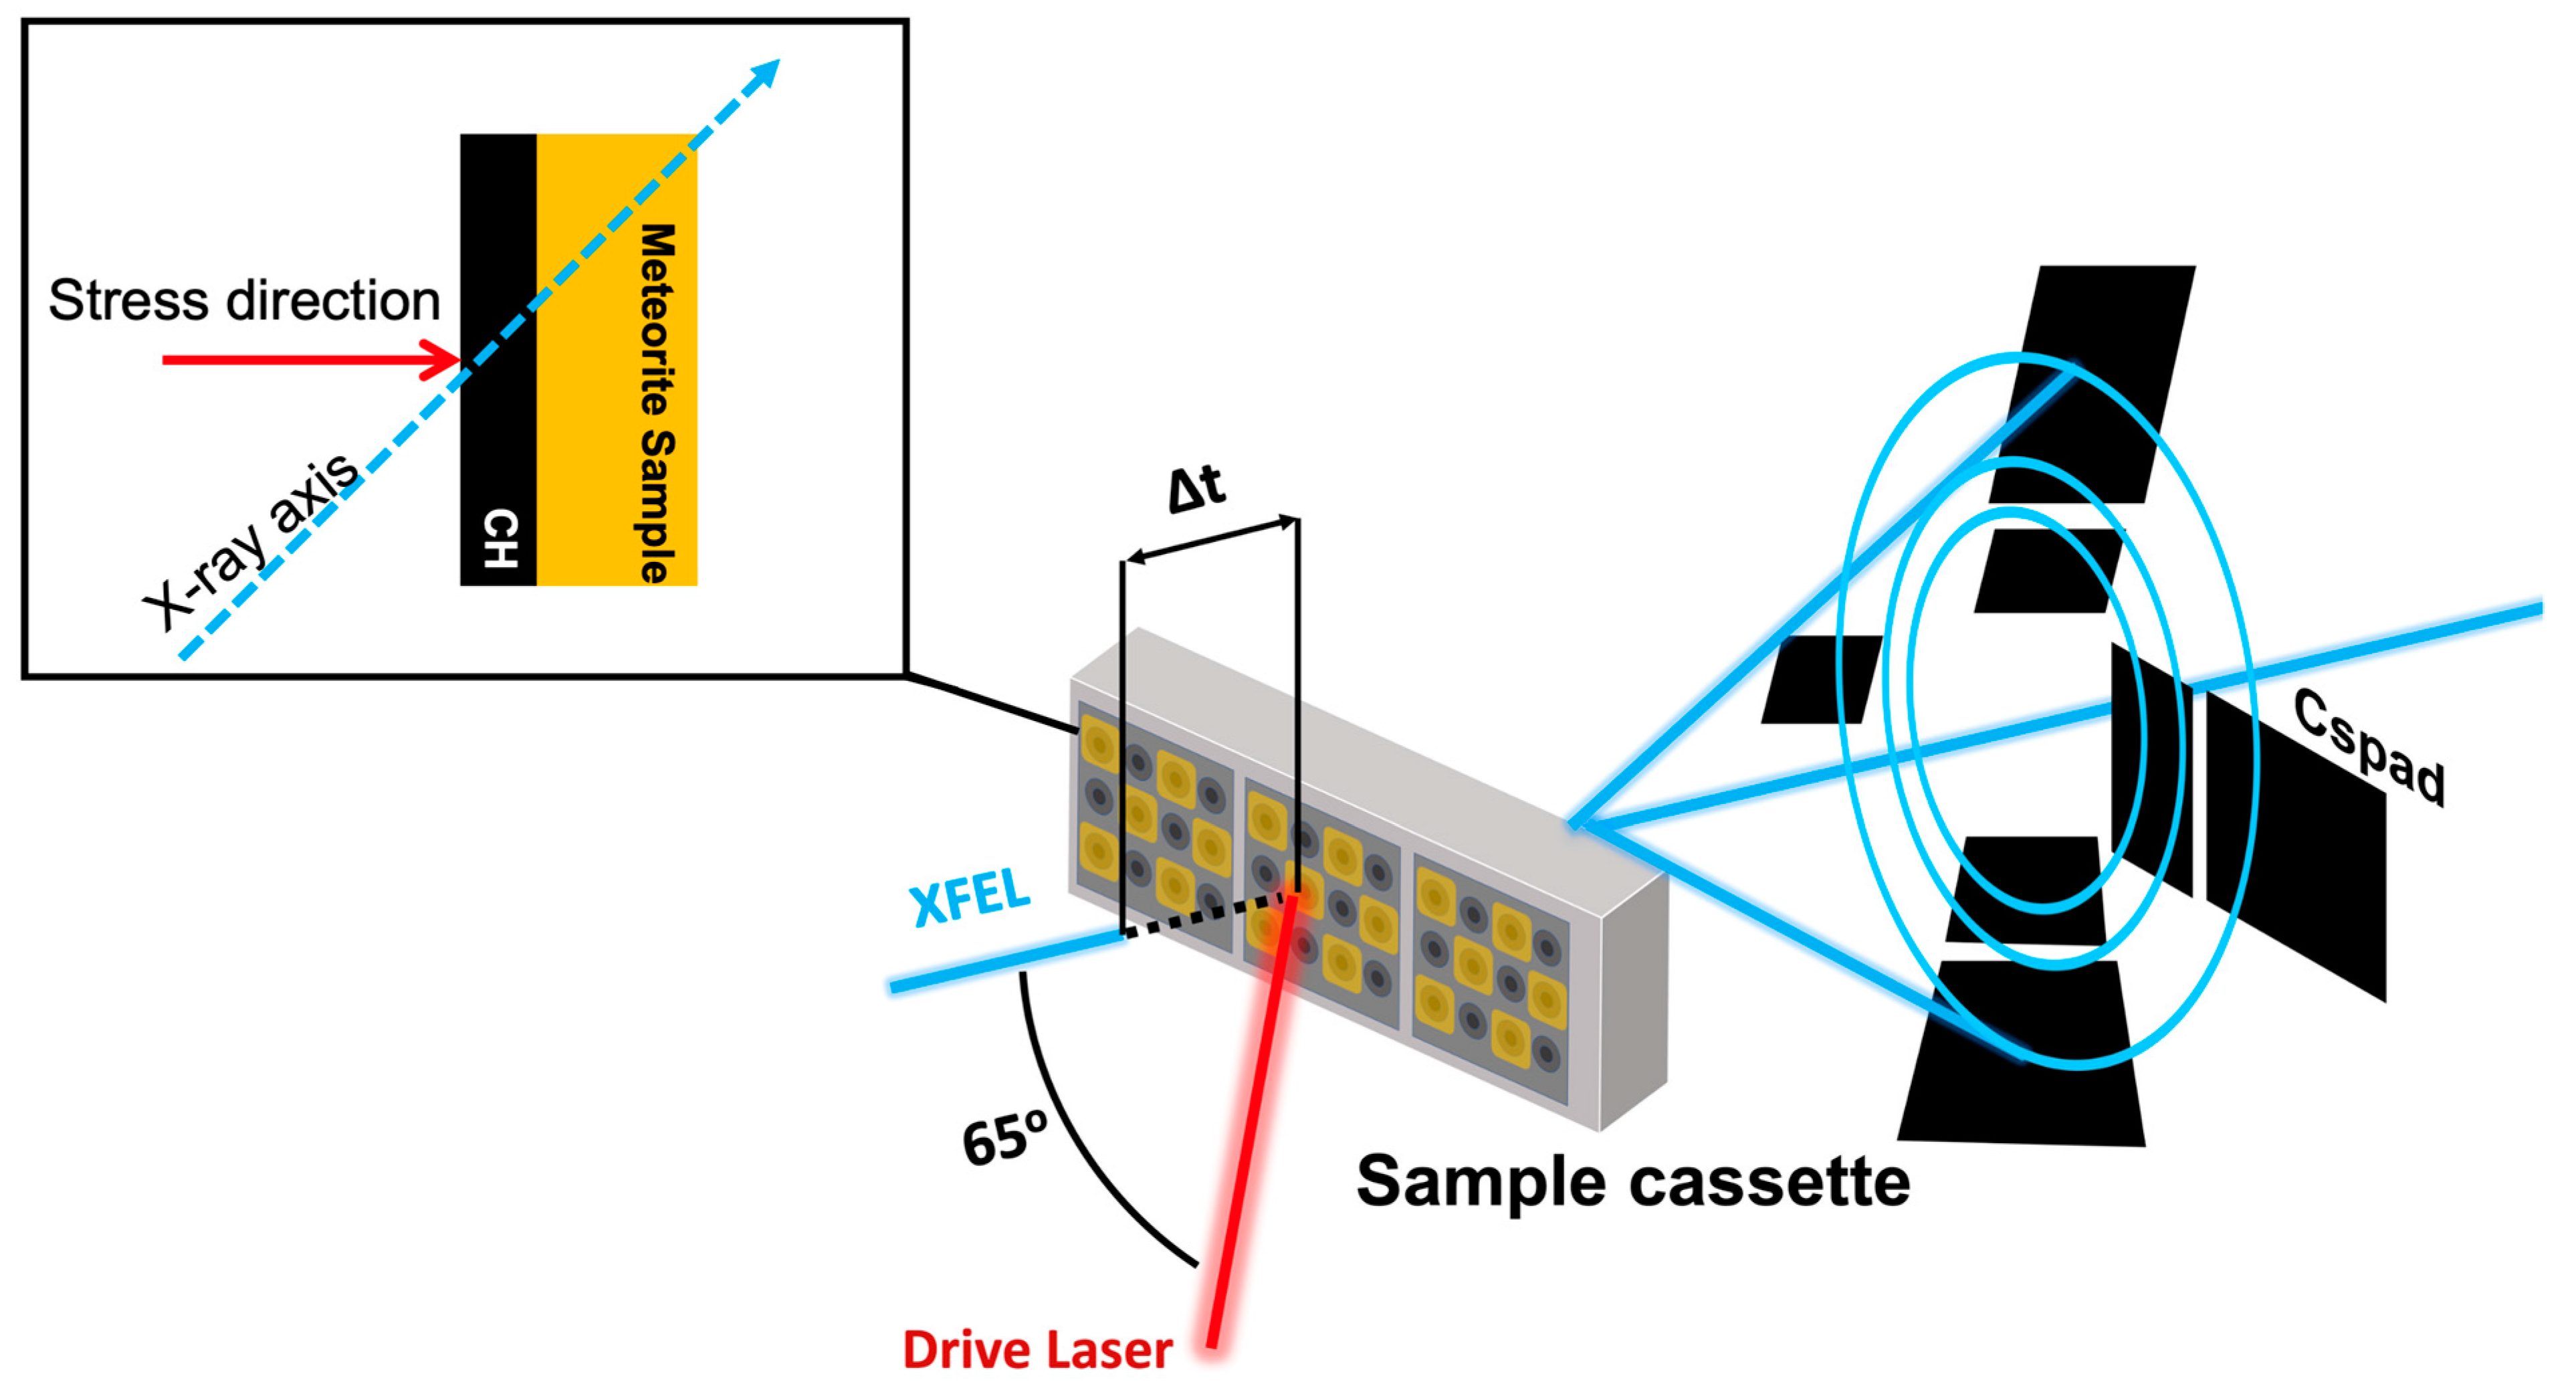
2.2. Experimental Setup

A schematic of the setup for the dynamic compression experiments carried out at the Matter at Extreme Conditions (MEC) end station is shown in Figure 2. The XFEL probe was generated by the Linac Coherent Light Source (LCLS) at the SLAC National Accelerator Laboratory [27] through a quasi-monochromatic beam with high-energy resolution (ΔE/E~0.2%), fully transverse coherent at 6.9 keV, with a 60 fs temporal duration and an average of 1012 photons per pulse. The XFEL probe beam was 20 μm in diameter on the sample. Phase plates on the optical drive laser, a frequency-doubled Nd: Glass laser system (527 nm), set a 176-µm-diameter laser spot on target. This was used to achieve a focal spot intensity of ~1012 W/cm2 over a 12 ns quasi-flat top temporal pulse profile. The energy of the drive laser was varied from 6 to 40 J to achieve different peak pressures in the sample. The angle between the target normal and the XFEL probe was 65°. The optical laser and X-ray beam were spatially overlapped and operated in single-shot mode with absolute time zero corresponding to the overlap of their leading edges of the pulse. Prior to each laser shot, an X-ray-only pattern was first collected to confirm the starting sample area corresponding to the expected bcc structure. For each shot, a time delay (Δt) was selected for the XFEL pulse relative to the optical laser pulse with a jitter of 0.5 ns. This ∆t was verified by oscilloscope traces captured for each shot. The pump-probe delay scans at several nanosecond intervals enabled collection of X-ray diffraction (XRD) time series, where the 2-dimensional (2D) patterns were captured by Cornell–SLAC Pixel Array Detectors (CSPADs) constructed of individual application-specific integrated circuits (ASICs) [28]. The combined azimuthal angle coverage was 180°. One target was shot per selected Δt.

3. Results

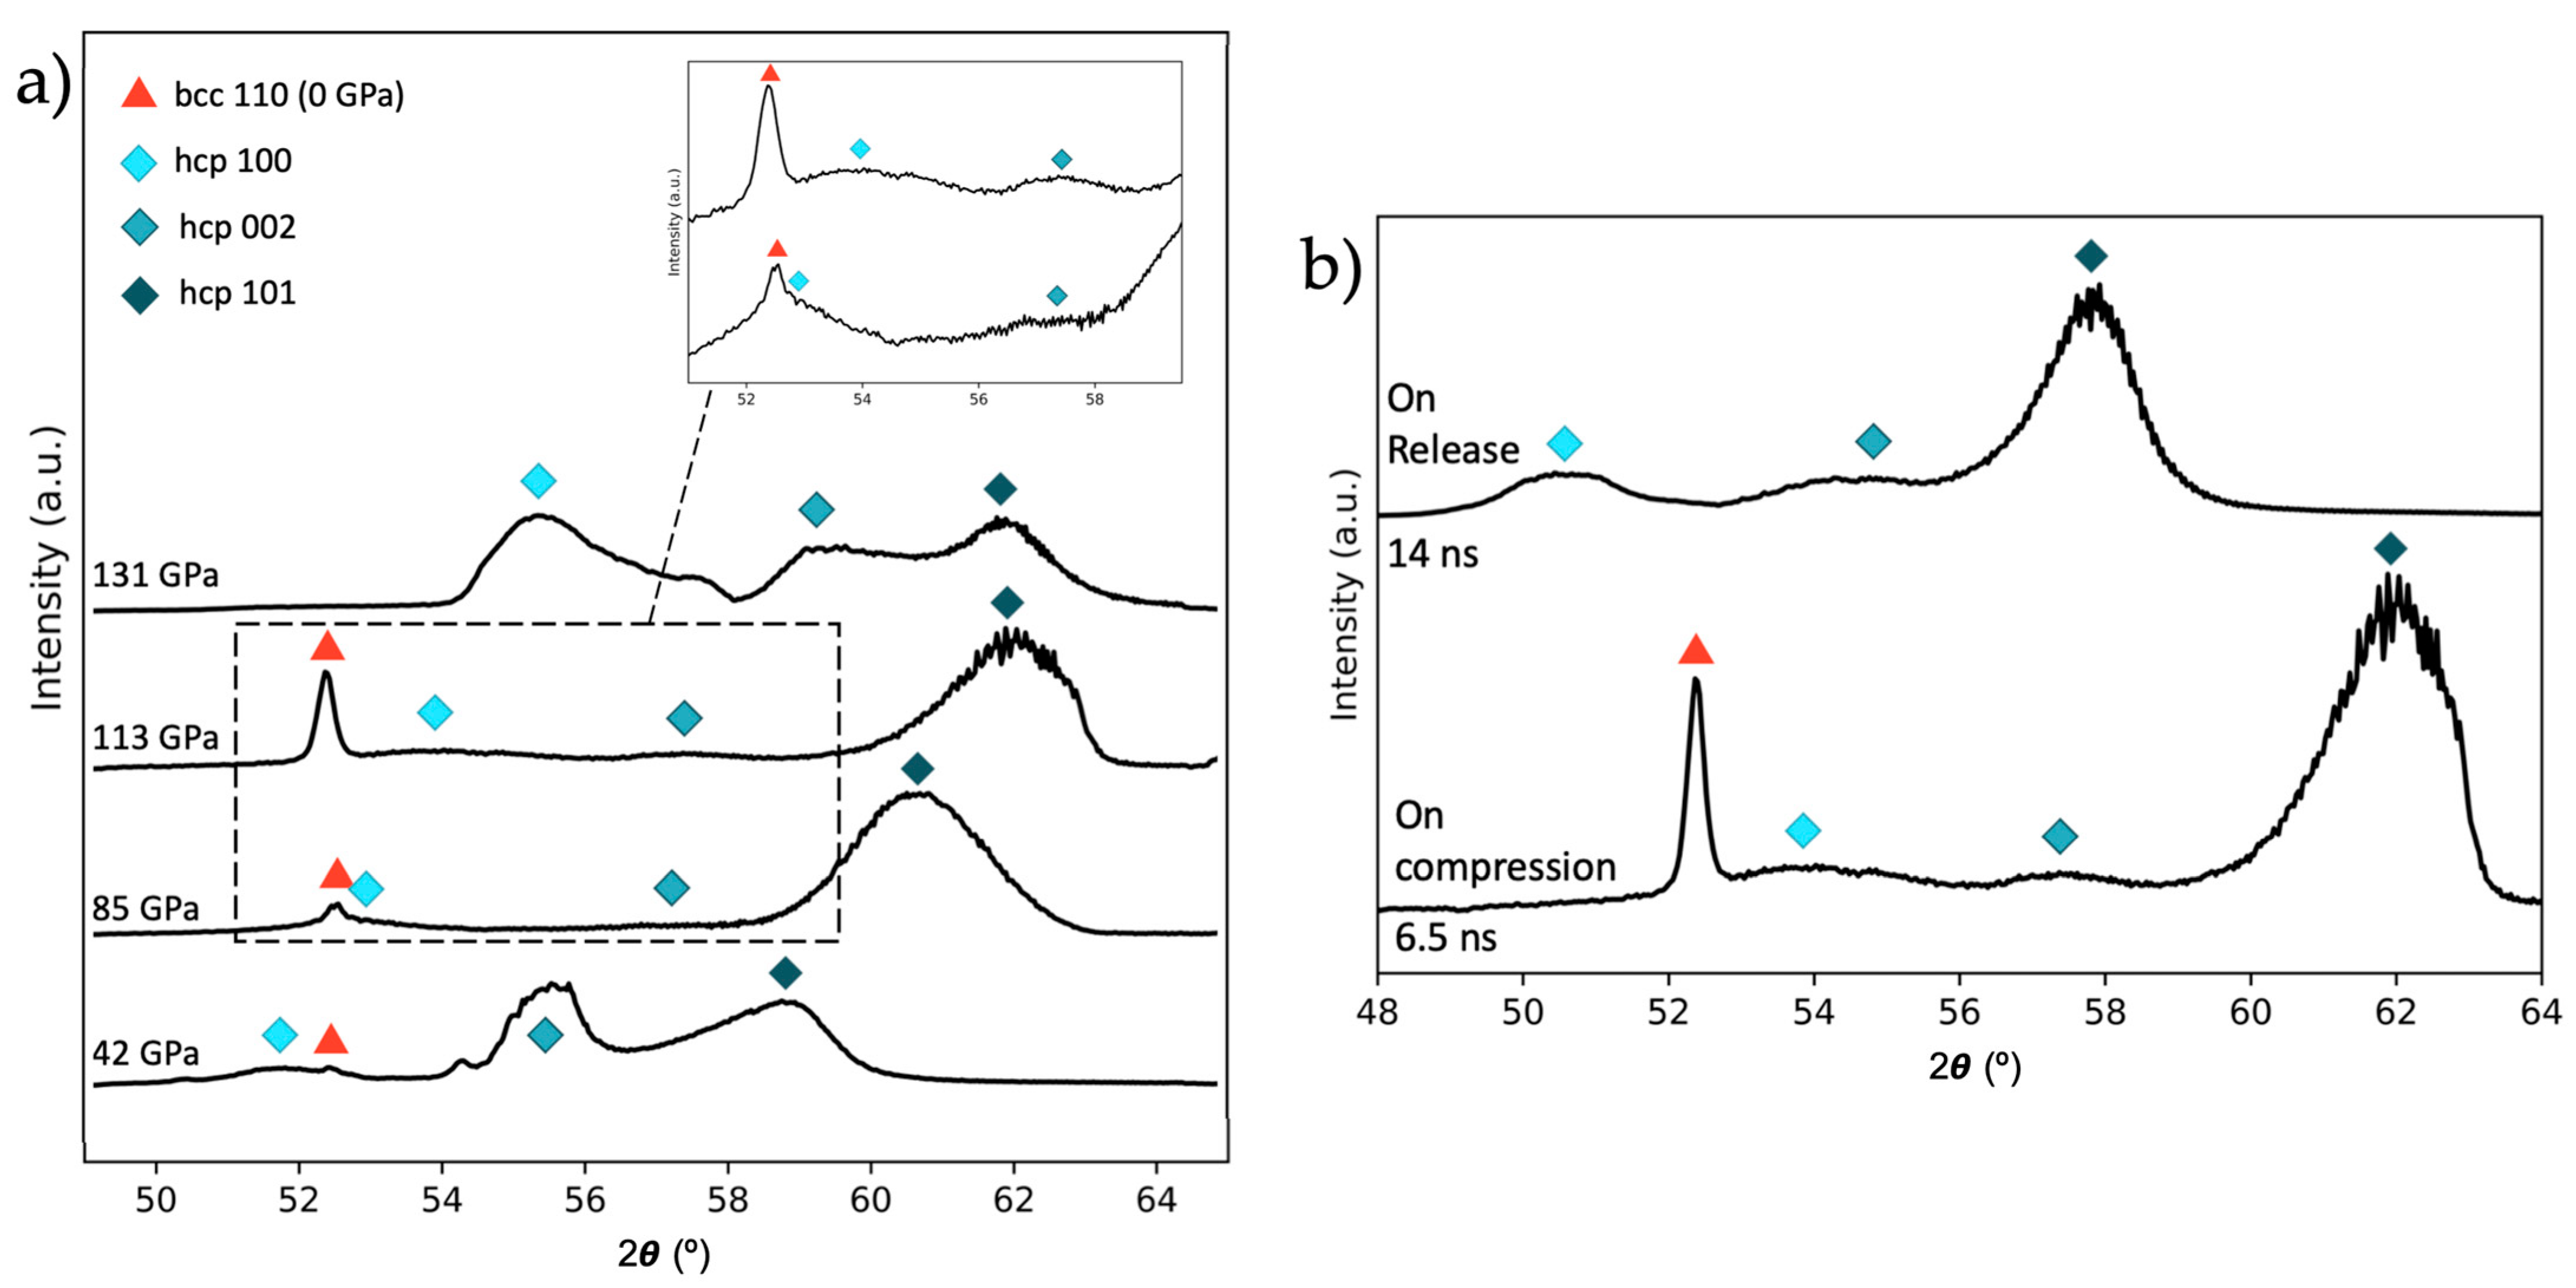
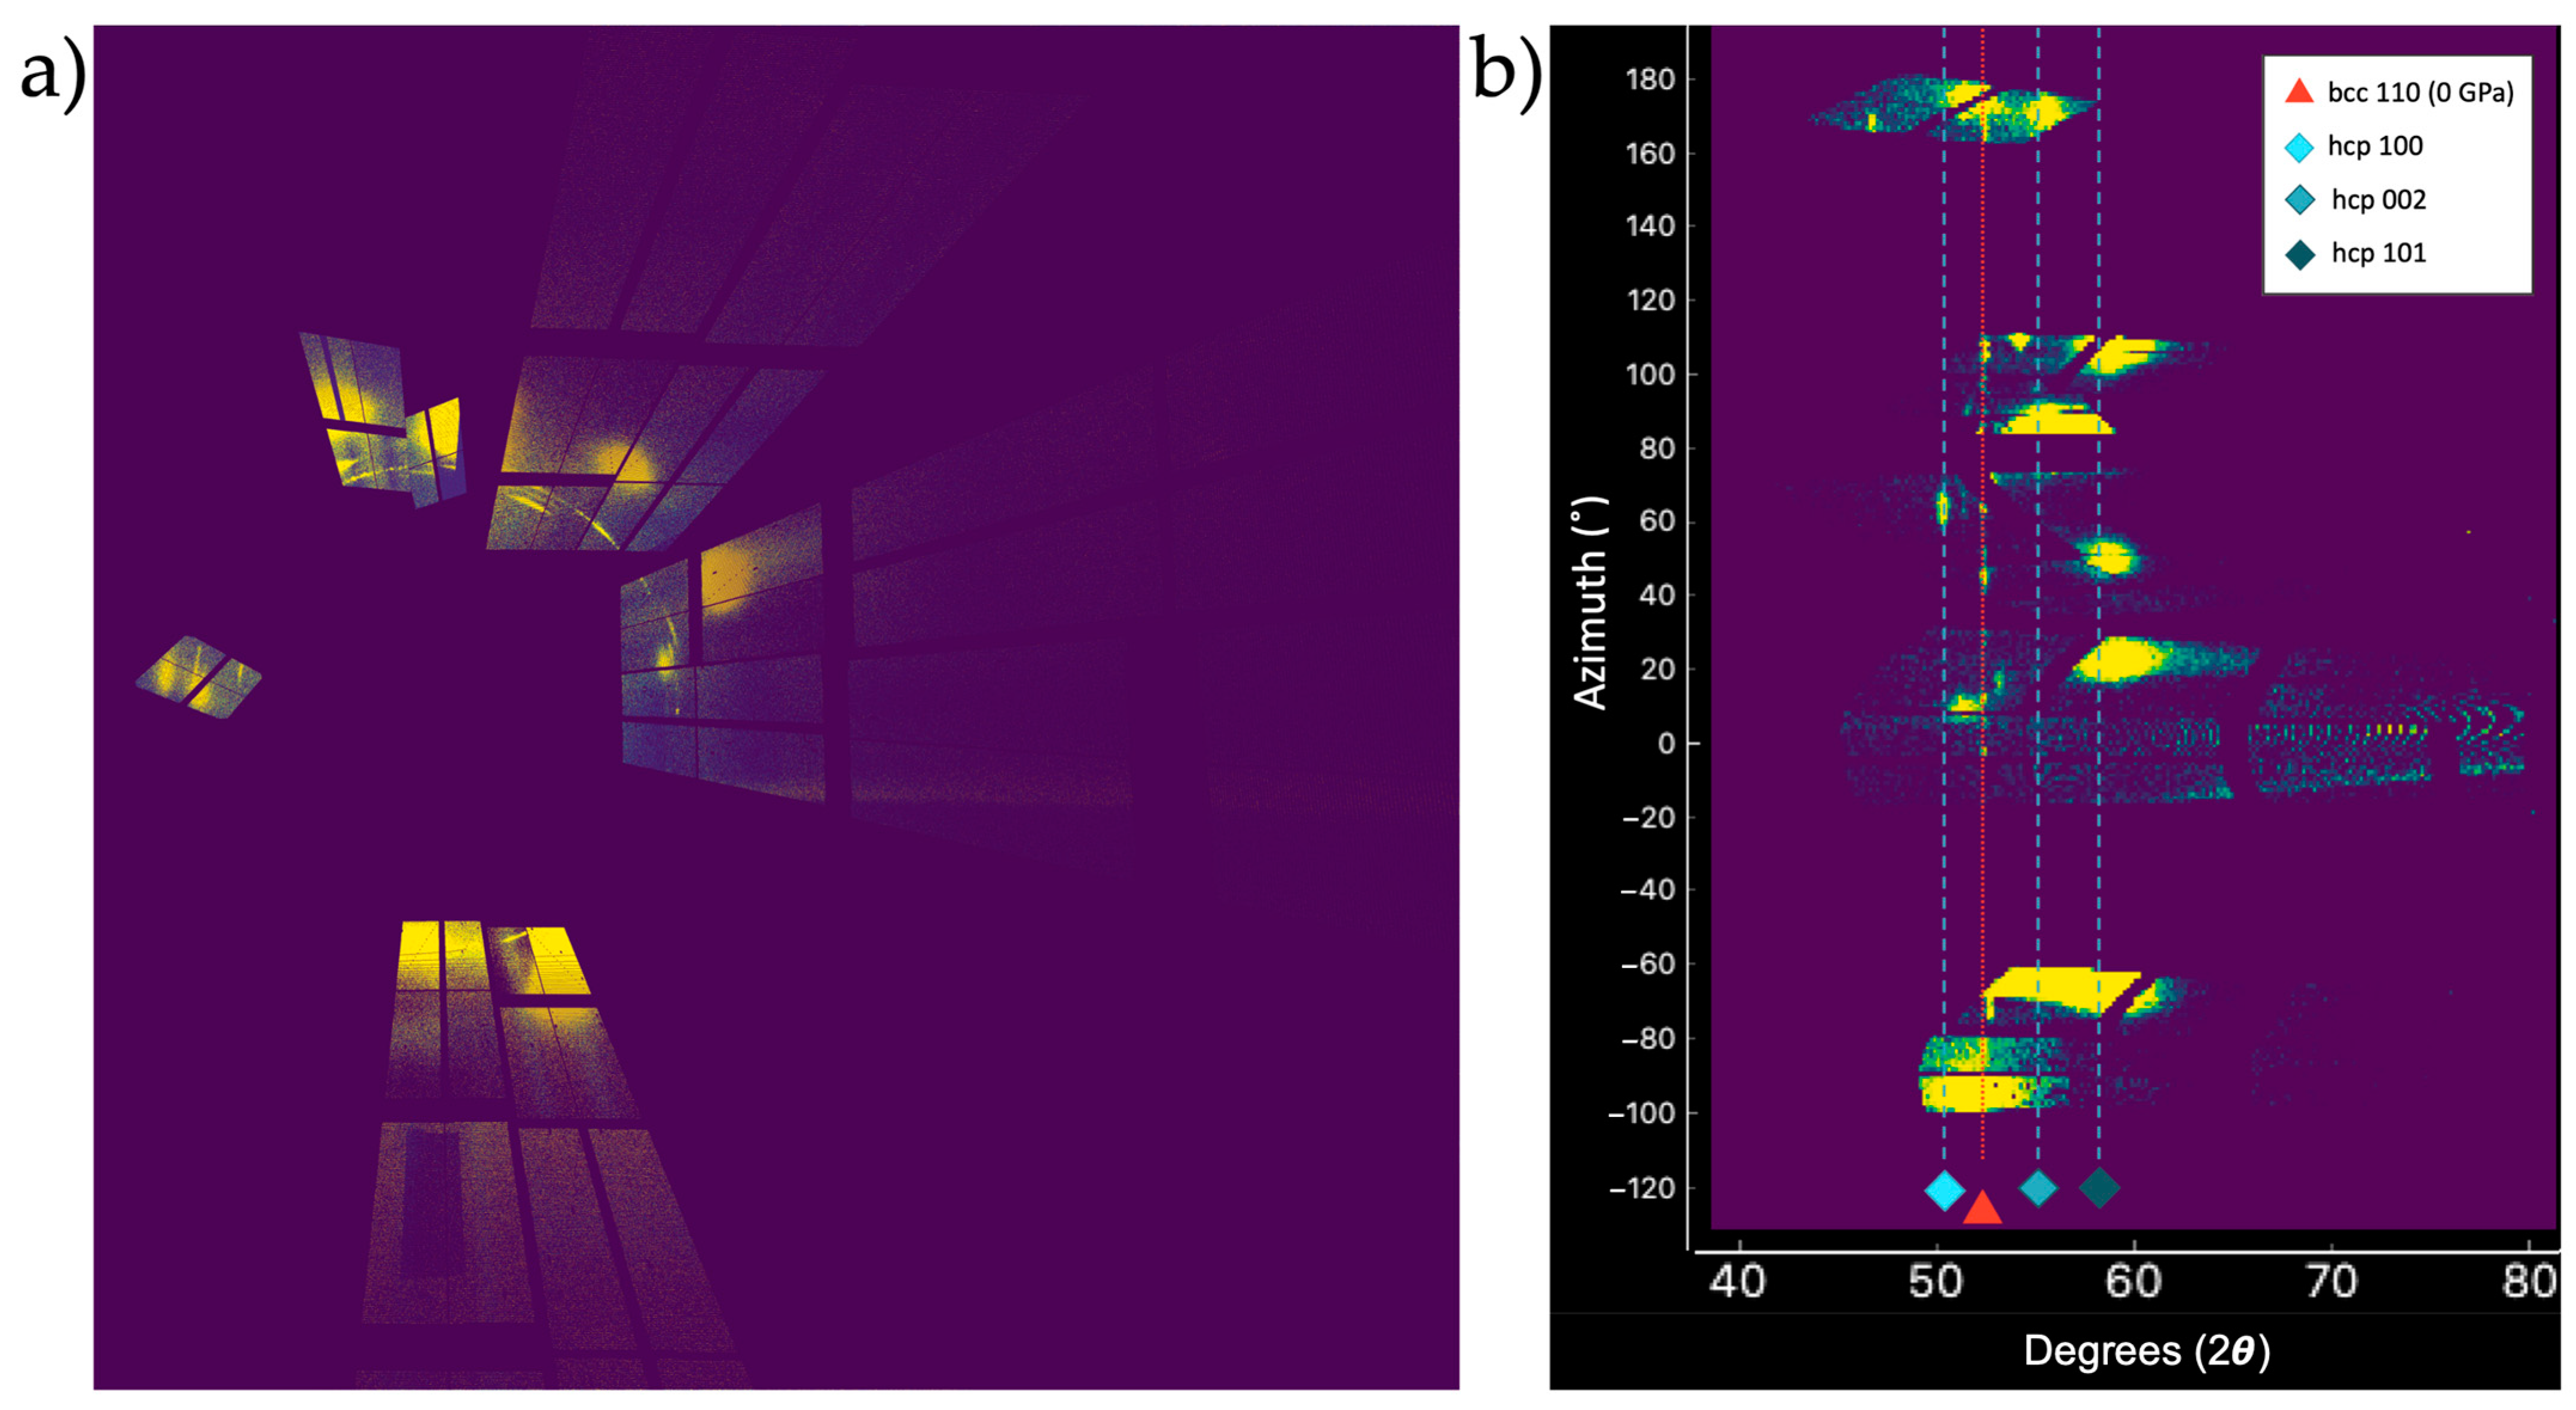
3.1. X-ray Diffraction

Calibration for the sample-to-detector distance and orientation of the CSPADs were performed using internally developed software [29] and Dioptas [30]. Peak fitting was performed using Fityk [31]. An image of raw data from the CSPADs projected onto a single plane is shown in Figure 3a. The XRD patterns of the shock-compressed material showed new peaks identified as (100), (002), and (101) for high-pressure hcp Fe [18,32] (Figure 3b). This hcp Fe manifested as large spots with uneven intensity distribution in the XRD about the azimuthal coverage. A possible explanation for this diffraction character is highly oriented crystallites of hcp Fe, rather than a few large-grained crystals, since previous shock compression work on Fe demonstrated nano-crystalline hcp Fe formation at ultrafast timescales [13]. Due to the large angle between the shock propagation direction and the incident X-ray beam, some small volume (less than a few μm3) of unshocked sample was recorded in the data, identified as ambient-pressure bcc Fe. For each shot, the hcp (100), (002), and (101) peak positions were used to determine the lattice parameters and density ( ρ ) , adjusted to include 7.5% Ni. A compositionally close Fe90Ni10 Hugoniot [33] was used to determine pressure for the measured density for in-shock data. Data collected after the cessation of the drive laser, and/or when the compressive wave reached the edge of the sample, were on release and no longer represented an on-Hugoniot measurement. Here, the quasi-isentropic release path from our peak pressure was estimated by extrapolating pressure and temperature from previously reported post-shock studies on iron [34,35]; see Supplemental Discussion, Section 1. Using the measured density from our XRD, we used these extrapolated release paths to constrain the pressure. Pressure uncertainty was derived from standard error propagation from XRD peak fitting. Velocimetry records were also collected corroborating pressure estimates within 8% using the velocity interferometry system for any reflector (VISAR) diagnostic. However, only transit times were available due to the low reflectivities of the natural samples. LiF as a VISAR window material was not used. Representative VISAR data are shown in Supplementary Materials, Figure S2.
Two types of XRD data series were collected, a pressure series and a time series on shock release from a peak pressure. A pressure series consisted of varied drive laser parameters to achieve a suite of peak pressure states, ~40 GPa to above 140 GPa, on the Hugoniot where the sample was probed at the state of maximum compressed sample volume, ~6.5 ns after onset of compression, for our target design. The 2D XRD data were recorded for each pressure. After a steady shock was no longer supported (i.e., the drive laser turned off or the shock front reached the end of the sample at the vacuum interface), the sample underwent quasi-isentropic release, during which time the pressure and temperature decreased from some peak state. XRD patterns were collected at time delays of >6.5 ns to examine the metastability kinetics of hcp Fe. In this regime, though not totally released back to the starting bcc structure, the sample was still within the hcp phase stability region.
Spotty, high-intensity features in the 2D XRD made the hcp peaks challenging to identify. The hcp Fe transformation agreed with previous static compression experiments on pure Fe and Fe-rich Fe-Ni alloys up to 30% [36]. As expected, when Ni was added, the unit cell contracted to accommodate the slightly smaller Ni atoms (~1.24 Å) compared to the Fe atoms (~1.26 Å) [37]. As the drive laser energy increased, a suite of high-pressure states on the Hugoniot could be achieved. On compression, the hcp Fe peak positions shifted to a higher 2 θ   (or smaller d-spacing), as seen in azimuthally integrated XRD patterns at pressures ~40 GPa to above 140 GPa (Figure 4a).
XRD data were also collected during shock release. After cessation of the drive laser and/or reaching the edge of the sample, peak compression was no longer supported and lower pressures and temperature could be accessed. Successively longer XFEL time delays probed the lattice structure as it reverted from the high-pressure phase back to the low-pressure state. The material eventually reached ambient conditions. An example of this shock release XRD data (Figure 4b) still showed retention of the hcp Fe phase at a pressure lower than the peak compression state.

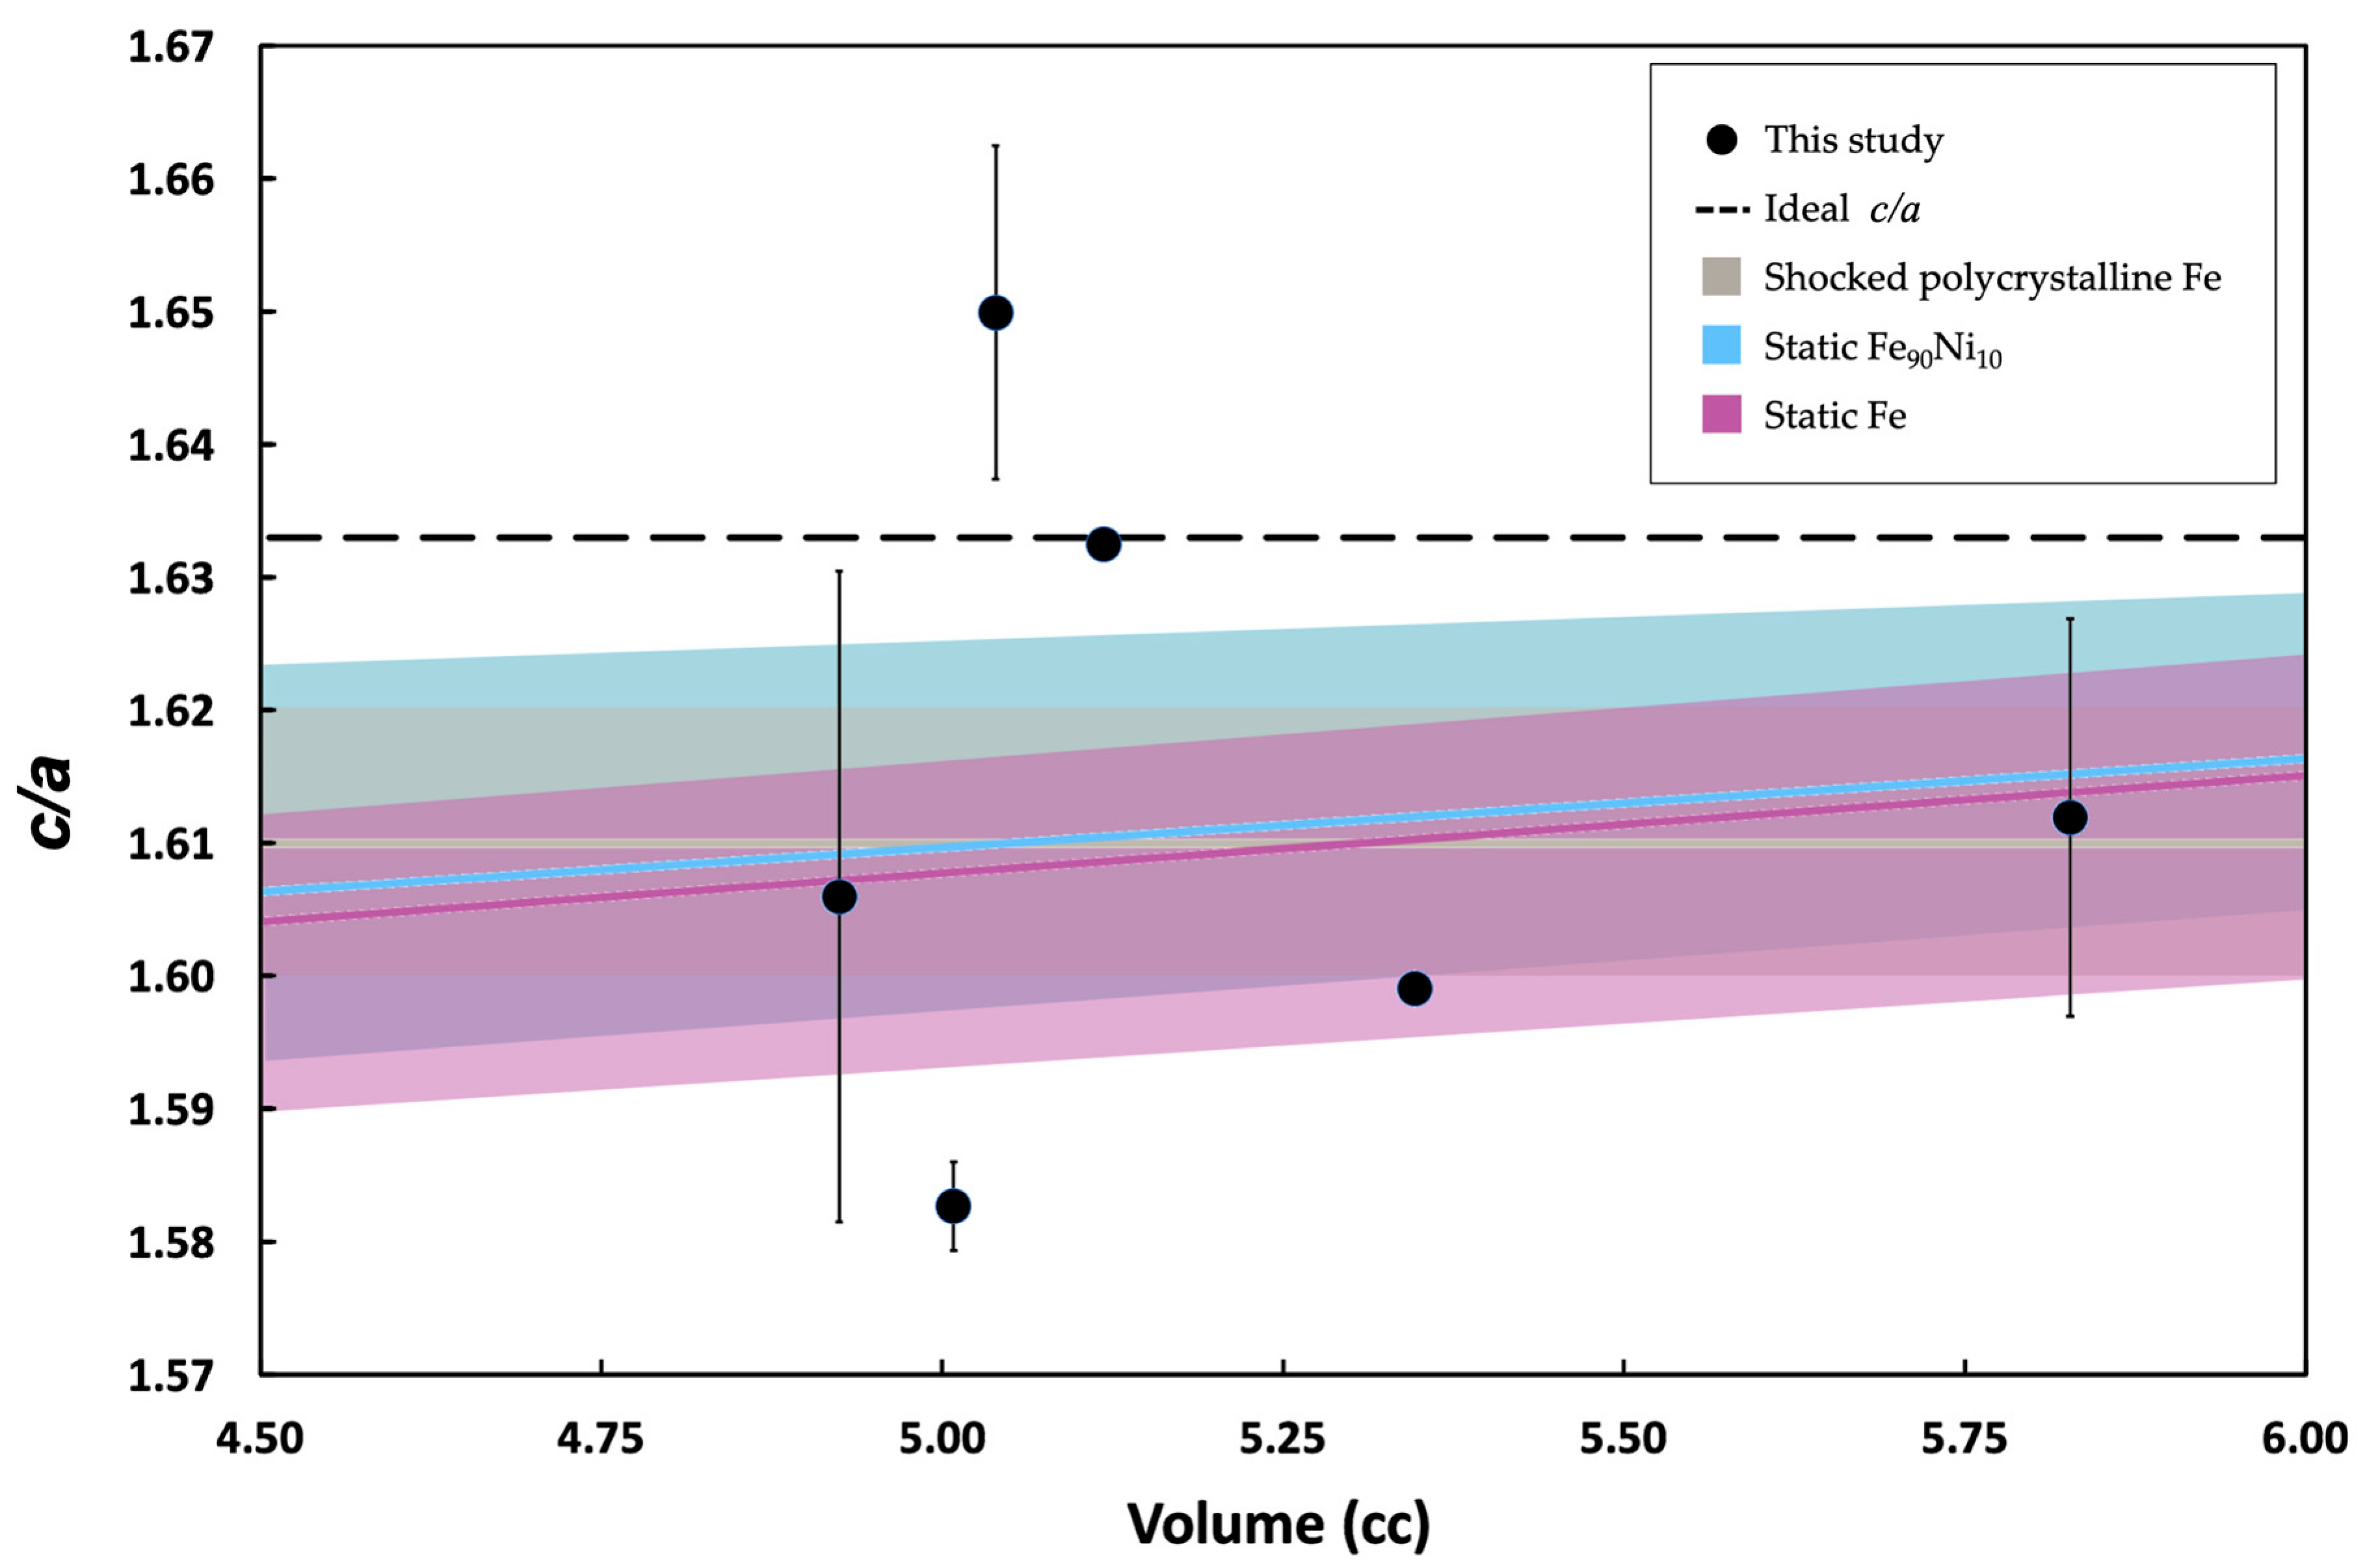
3.2. Axial c/a Ratio
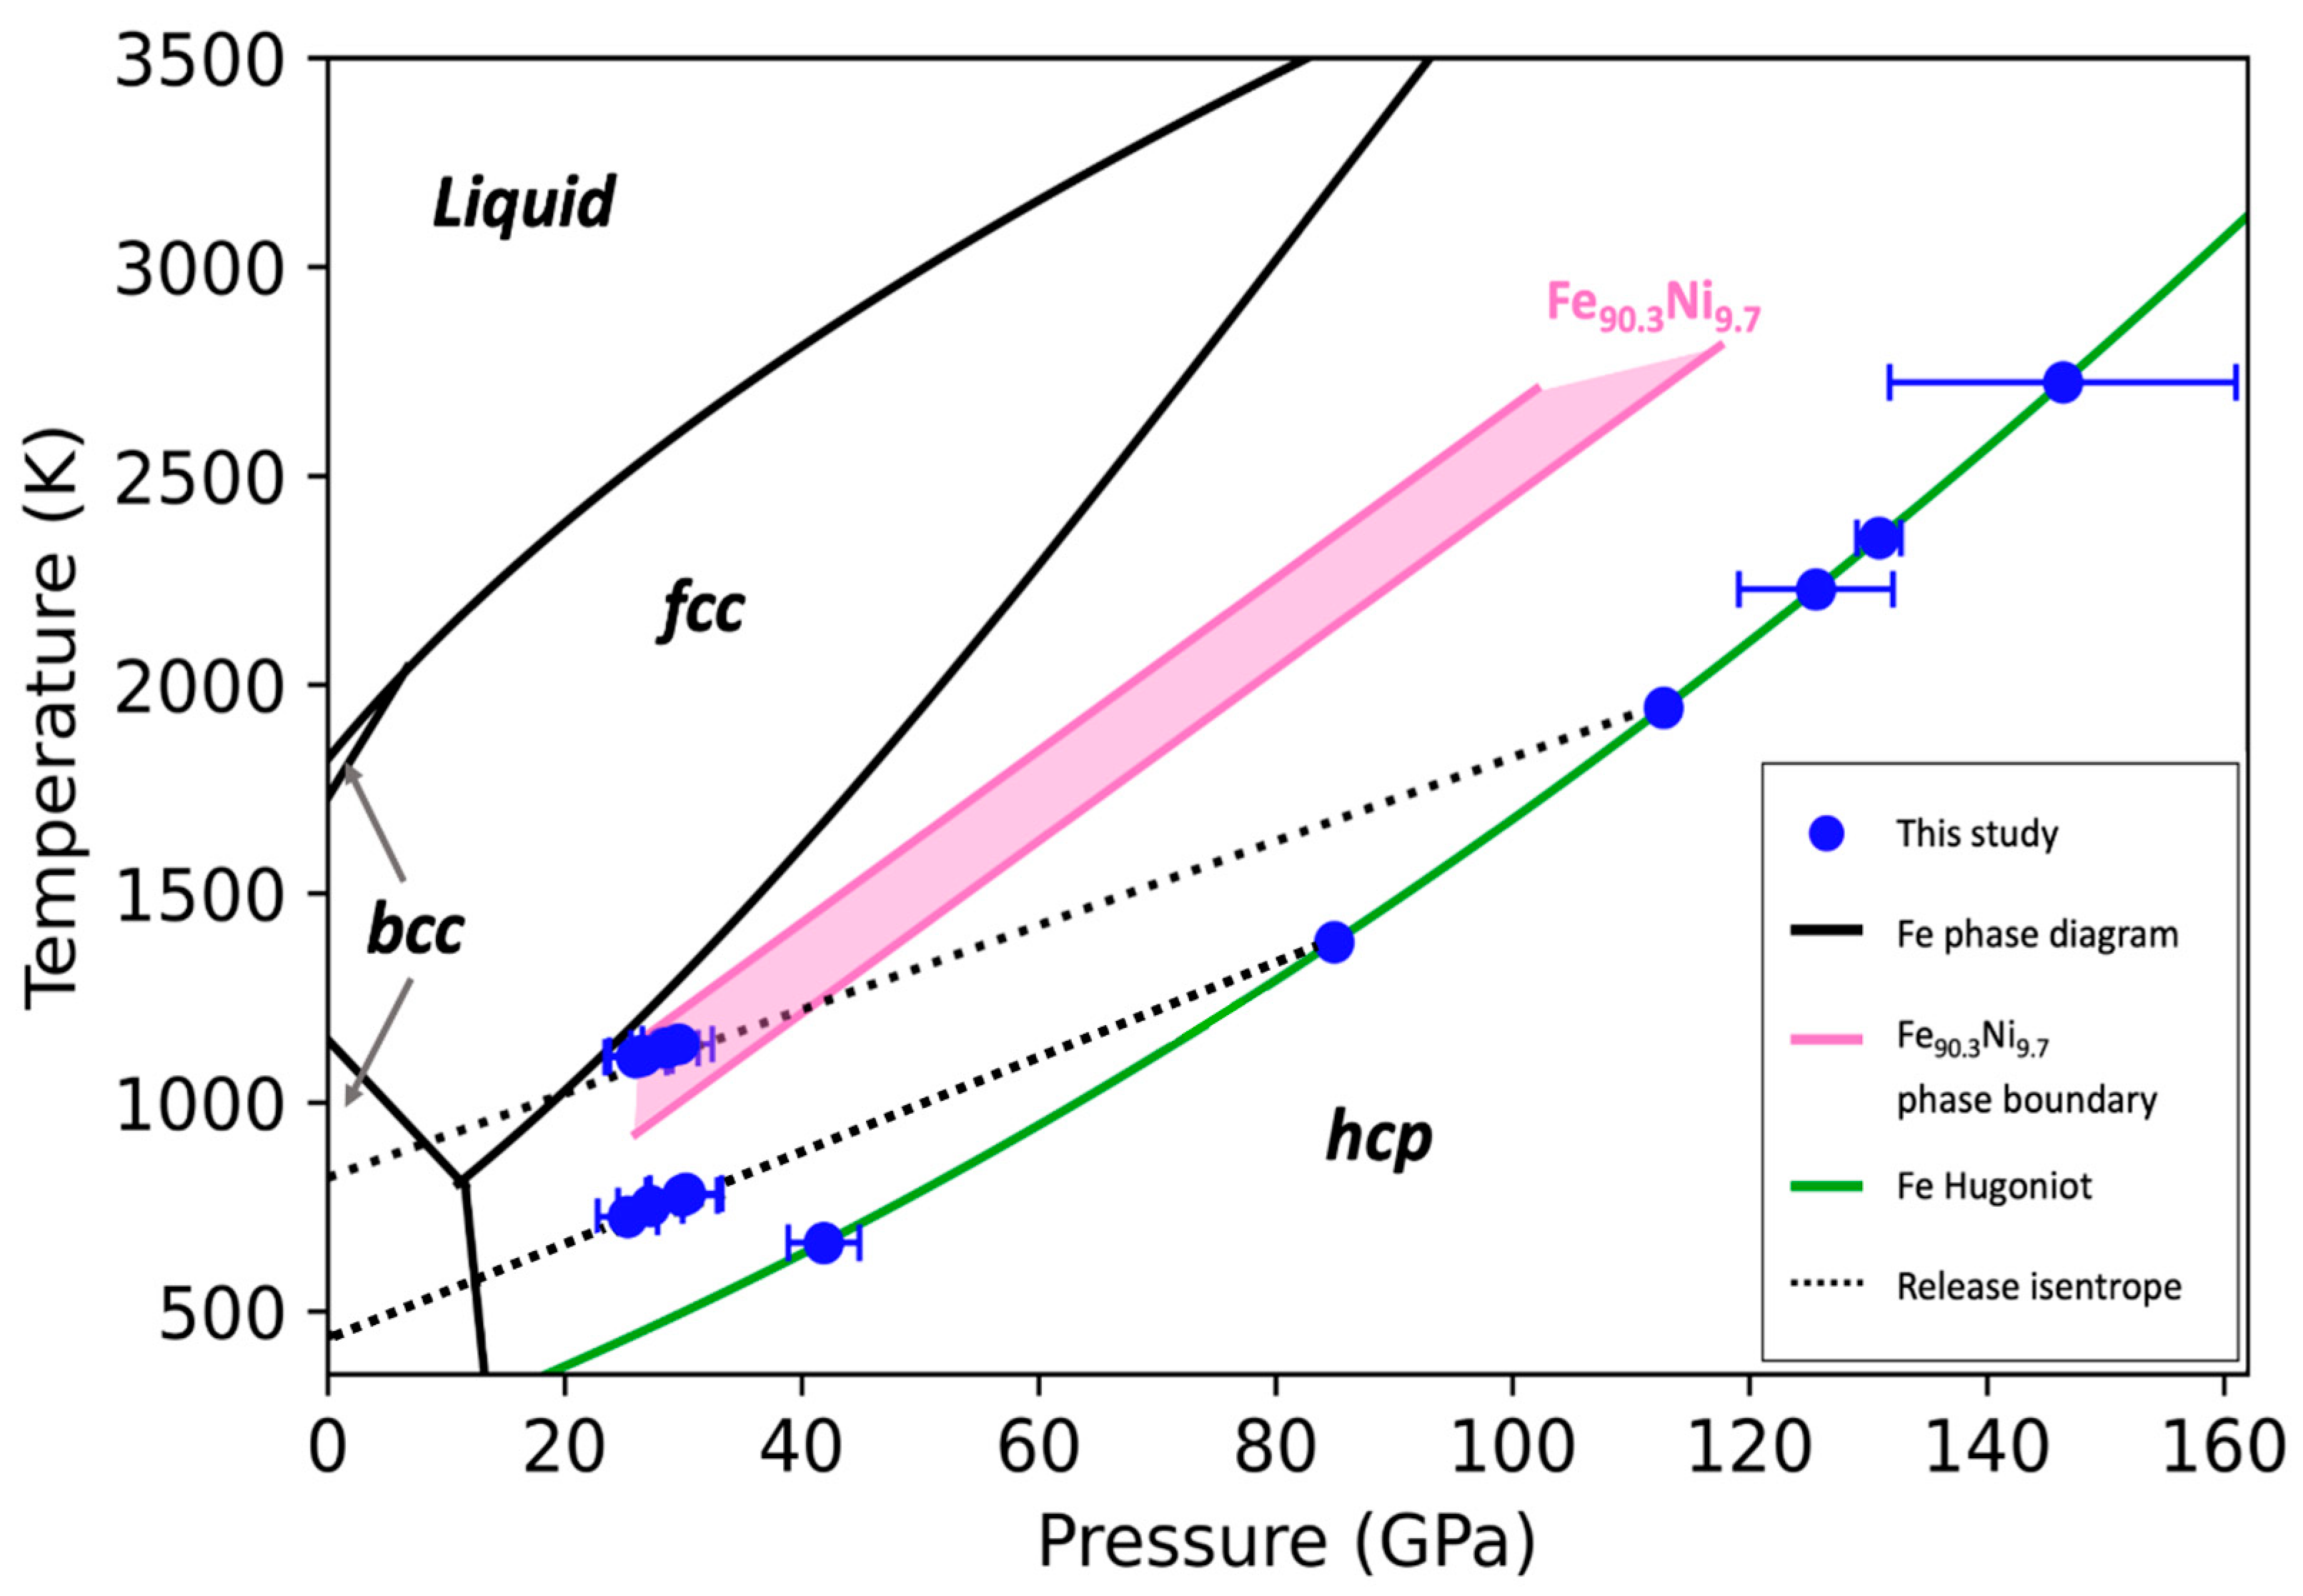
After identifying the hcp Fe peaks in the XRD for each run, least-squares fitting was performed to determine the hexagonal lattice parameters, a and c. Studying the c/a ratio as a function of P, ρ , and T is a common approach to track changes in elasticity of hexagonal metals at extreme conditions. As such, the axial c/a ratio was calculated and plotted against volume to compare to previous static work on Fe-Ni alloys and previous dynamic compression of single- and poly-crystalline Fe (Figure 5); see Supplemental Discussion, Section 2. Previous static compression experiments on pure hcp Fe and Fe90Ni10 studied the effects of pressure, temperature, and composition on the axial ratio, in particular revealing an increase in c/a with increasing volume [38]. Most notably, these previous studies showed that the c/a ratio stays below the ideal 1.63 and is, on average, 1.61. Similarly, a shock compression study on polycrystalline Fe found that the axial ratio stays at 1.61 ± 0.01 regardless of pressure (up to 80 GPa) [19]. However, dynamic compression of single-crystal bcc Fe shocked along the [100] axis could produce a c/a that exceeds 1.7. Molecular dynamics simulations [39] show that in a compression regime imposing uniaxial strain, spacing between the atoms in the direction orthogonal to the shock front cannot change, and there can be a lack of plasticity from generation and propagation of dislocations. Specifically, the high strain rate and short timescale of these experiments inhibit defect and dislocation motion, such that the interplanar spacing of the (011) planes, which are perpendicular to the shock propagation direction, are completely unchanged during compression. In this case, the [100] of a bcc lattice remains less compressed and larger than expected as it becomes the c-axis in an hcp lattice and makes it possible to get an apparently large c/a ratio [40]. Our experimental data show a distribution in the c/a ratio—some instances with larger than, similar to, or less than the ideal ratio. The XRD data giving larger than ideal c/a ratios are cases where the c-axis is 2–3% larger and the a-axis is comparable to values of the same pressure under quasi-hydrostatic compression in a diamond-anvil cell [18]. This large c-axis value is consistent with model predictions, e.g., [39] and is the first experimental demonstration of a c/a ratio > 1.63.

4. Discussion

Results from this work were compared with previous data within the same temperature range as this study (1000–3000 K). Our c/a data show a large distribution as a function of volume, with some values near previous work, e.g., [17] or near the ideal 1.63 and even above or below previous trends by as much as 3% (Figure 5). Though the data distribution from all previous static experiments falls below the ideal c/a ratio, we present the first experimental observation of a high c/a, at 1.65, which is even higher than previous ratios determined during shock compression on polycrystalline Fe. This suggests that the requirements for achieving a higher than ideal c/a ratio include starting with an oriented single crystal or highly textured polycrystalline bcc sample and using dynamic compression to transform the bcc to the hcp phase. Though the starting orientation of the exsolution lamellae remained constant shot to shot, meaning the long edge of the lamellae was always placed parallel to the top of the sample holder, specific control of intra-grain orientation for these natural large-grained samples was not possible. This could explain the wide distribution in the c/a values for the Gibeon meteorite—some crystals may have been oriented with the bcc [100] parallel to the shock propagation direction, as in Run, reaching c/a = 1.65, whereas other samples may have had grains oriented along the body diagonal or at high angles from the [100] direction. Recent work [51] systematically tracked the starting orientation in single-crystal Fe during laser-driven shock compression, notably documenting higher than ideal c/a ratios as well. Continued effort in this area is needed to potentially reveal how crystalline orientation trends support proposed deformation mechanisms [13,39], as previously reported for Fe single crystals [52].
The pure Fe Hugoniot plotted on an equilibrium P–T phase diagram was used to compare our data with previous work, including the phase boundaries for pure Fe and the two-phase (fcc + hcp) region from a previous study on Fe90.3Ni9.7 [36] (Figure 6). The hcp–fcc boundary on the pure Fe phase diagram shifts to higher pressures and lower temperatures with increasing Ni content. We examined the composition dependence, ranging from pure Fe to Fe90Ni10, for the Hugoniot distribution across P ρ and P–V, finding little change in our measured pressure regime, i.e., scatter in the datasets for each Ni content composition was within the scatter for pure Fe Hugoniot data [32,33]. We did not measure temperature directly and therefore used the Fe Hugoniot to estimate temperature. For XRD data collected after peak compression, on release ~7–16 ns, we estimated isentropic release paths using previously reported post-shock temperatures [34,35]. This helped to identify where, on the phase diagram, we were probing the lattice structure.
The hcp structure persisted to peak pressures on the Hugoniot, as expected. Interestingly, the hcp structure also remained in existence well past peak compression states to time delays as long as 16 ns. Here, samples follow an isentropic release path, similar to a natural impact or large-body collision process, with relevance to Psyche. However, it is important to consider that the starting conditions of our sample may be admittedly different than a natural iron meteorite in space or a metallic asteroid in our solar system at different points in the solar system evolution. For instance, starting temperatures can differ—our samples started at 300 K in this experiment, whereas initial temperatures of asteroids (e.g., Psyche) could have been substantially higher in the early history of the solar system. At a later time, the temperatures of iron asteroids in the main belt can be significantly colder than room temperature on Earth.
It is remarkable to study the physical properties of natural Fe-Ni samples at extreme conditions to obtain insight into the rheological behavior of metal-rich and remanent core planetary bodies for modeling impacts, collisions, and planet-forming processes. The next steps include a systematic examination of oriented single-crystal Fe to further reveal deformation mechanisms from c/a studies and the examination of further microstructure complexities, such as variable and increased porosity and multiphase response during a dynamic compression event.

Supplementary Materials

The following are available online at https://www.mdpi.com/article/10.3390/min11060567/s1, Figure S1: Electron backscatter diffraction image for Gibeon meteorite sample, Figure S2: Representative VISAR data, Supplementary Discussion: Error Analysis and Shock Release Temperature Estimate.

Author Contributions

Project lead, A.E.G.; experiment participants, C.B., E.G. (Eric Galtier), E.G. (Eduardo Granados), A.H., H.J.L., S.M., B.N., K.R., D.R., W.L.M. and A.E.G.; sample characterization, B.M., A.E.G. and S.T.; data visualization software, C.B.; data analysis, S.T. and S.H.; writing—original draft preparation, S.T., R.C.-R. and A.E.G.; writing—review and editing, R.C.-R., R.W., W.L.M. and A.E.G.; All authors have read and agreed to the published version of the manuscript.

Funding

A.E.G. and W.L.M. were supported by NSF Geophysics (EAR0738873). A.E.G. acknowledges support from LANL Reines LDRD. A.E.G. and R.C.-R. acknowledge support from the DOE Office of Science, Fusion Energy Science ECA. This work was performed at the Matter at Extreme Conditions (MEC) instrument of the LCLS, supported by the US DOE Office of Science, Fusion Energy Science, under contract no. SF00515, and was supported by the LCLS, a National User Facility operated by Stanford University on behalf of DOE-BES. The Los Alamos National Laboratory is operated for the US DOE National Nuclear Security Administration under contract no. DE-AC52-06NA25396.

Data Availability Statement

All XRD and sample characterization data are available upon request.

Acknowledgments

We thank the LCLS and SLAC staff for assistance during/after the experiment.

Conflicts of Interest

The authors declare no conflict of interest.

References

  1. Asphaug, E. Interiors of small bodies and moons. Nat. Commun. 2020, 11, 10–12. [Google Scholar] [CrossRef]
  2. Goldstein, J.I.; Scott, E.R.D.; Chabot, N.L. Iron meteorites: Crystallization, thermal history, parent bodies, and origin. Geochemistry 2009, 69, 293–325. [Google Scholar] [CrossRef]
  3. Buchwald, V.F. Handbook of Iron Meteorites. Their History, Distribution, Composition and Structure; Danmarks Tekniske Hojskole: Lyngby, Denmark, 1975. [Google Scholar]
  4. Oh, D.Y.; Goebel, D.; Polanskey, C.; Snyder, S.; Carr, G.; Collins, S.M.; Lantoine, G.; Landau, D.; Elkins-Tanton, L.; Lord, P.; et al. Psyche: Journey to a metal world. In Proceedings of the 52nd AIAA/SAE/ASEE Joint Propulsion Conference, Salt Lake City, UT, USA, 25–27 July 2016; p. 4541. [Google Scholar] [CrossRef]
  5. Burbine, T.H.; Meibom, A.; Binzel, R.P. Mantle material in the main belt: Battered to bits? Meteorit. Planet. Sci. 1996, 31, 607–620. [Google Scholar] [CrossRef]
  6. Yang, J.; Goldstein, J.I.; Scott, E.R.D.; Michael, J.R.; Kotula, P.G.; Pham, T.; Mccoy, T.J. Thermal and impact histories of reheated group IVA, IVB, and ungrouped iron meteorites and their parent asteroids. Meteorit. Planet. Sci. 2011, 46, 1227–1252. [Google Scholar] [CrossRef]
  7. McKeehan, L.W. The crystal structure of iron-nickel alloys. Phys. Rev. 1923, 21, 402–407. [Google Scholar] [CrossRef]
  8. Owen, E.A.; Yates, E.L.; Sully, A.H. An X-ray investigation of pure iron-nickel alloys. Part 4: The variation of lattice-parameter with composition. Proc. Phys. Soc. 1937, 49, 315–322. [Google Scholar] [CrossRef]
  9. Purdy, G.R. Widmanstätten Structures. In Encyclopedia of Materials: Science and Technology; Elsevier: Amsterdam, The Netherlands, 2001; pp. 9575–9578. [Google Scholar]
  10. Johnson, A.A.; Remo, J.L. A new interpretation of the mechanical properties of the Gibeon Meteorite. J. Geophys. Res. 1974, 79, 1142–1146. [Google Scholar] [CrossRef]
  11. He, Y.; Godet, S.; Jacques, P.J.; Jonas, J.J. Crystallographic relations between face- and body-centred cubic crystals formed under near-equilibrium conditions: Observations from the Gibeon meteorite. Acta Mater. 2006, 54, 1323–1334. [Google Scholar] [CrossRef]
  12. Jeanloz, R. The nature of the Earth’s core. Annu. Rev. Earth Planet. Sci. 1990, 18, 357–386. [Google Scholar] [CrossRef]
  13. Hawreliak, J.; Colvin, J.D.; Eggert, J.H.; Kalantar, D.H.; Lorenzana, H.E.; Stölken, J.S.; Davies, H.M.; Germann, T.C.; Holian, B.L.; Kadau, K.; et al. Analysis of the x-ray diffraction signal for the α- transition in shock-compressed iron: Simulation and experiment. Phys. Rev. B Condens. Matter Mater. Phys. 2006, 74, 184107. [Google Scholar] [CrossRef]
  14. Anzellini, S.; Dewaele, A.; Mezouar, M.; Loubeyre, P.; Morard, G. Melting of Iron at Earth’s Inner Core Boundary Based on Fast X-ray Diffraction. Science 2013, 340, 464–466. [Google Scholar] [CrossRef] [PubMed]
  15. Hwang, H.; Galtier, E.; Cynn, H.; Eom, I.; Chun, S.H.; Bang, Y.; Hwang, G.C.; Choi, J.; Kim, T.; Kong, M.; et al. Subnanosecond phase transition dynamics in laser-shocked iron. Sci. Adv. 2020, 6, 5132–5137. [Google Scholar] [CrossRef]
  16. Mao, W.L.; Campbell, A.J.; Heinz, D.L.; Shen, G. Phase relations of Fe-Ni alloys at high pressure and temperature. Phys. Earth Planet. Inter. 2006, 155, 146–151. [Google Scholar] [CrossRef]
  17. Steinle-Neumann, G.; Stixrude, L.; Cohen, R.E.; Gülseren, O. Elasticity of iron at the temperature of the Earth’s inner core. Nature 2001, 413, 57–60. [Google Scholar] [CrossRef]
  18. Mao, H.K.; Wu, Y.; Chen, L.C.; Shu, J.F.; Jephcoat, A.P. Static compression of iron to 300 GPa and Fe0.8Ni0.2 alloy to 260 GPa: Implications for composition of the core. J. Geophys. Res. 1990, 95, 21737–21742. [Google Scholar] [CrossRef]
  19. Hawreliak, J.A.; El-Dasher, B.; Lorenzana, H.; Kimminau, G.; Higginbotham, A.; Nagler, B.; Vinko, S.M.; Murphy, W.J.; Whitcher, T.; Wark, J.S.; et al. In situ x-ray diffraction measurements of the c/a ratio in the high-pressure ε phase of shock-compressed polycrystalline iron. Phys. Rev. B Condens. Matter Mater. Phys. 2011, 83, 1–6. [Google Scholar] [CrossRef] [Green Version]
  20. Morrison, R.A.; Jackson, J.M.; Sturhahn, W.; Zhang, D.; Greenberg, E. Equations of State and Anisotropy of Fe-Ni-Si Alloys. J. Geophys. Res. Solid Earth 2018, 123, 4647–4675. [Google Scholar] [CrossRef]
  21. Reagan, M.M.; Gleason, A.E.; Liu, J.; Krawczynski, M.J.; Van Orman, J.A.; Mao, W.L. The effect of nickel on the strength of iron nickel alloys: Implications for the Earth’s inner core. Phys. Earth Planet. Inter. 2018, 283, 43–47. [Google Scholar] [CrossRef]
  22. Schoelmerich, M.O.; Tschentscher, T.; Bhat, S.; Bolme, C.A.; Cunningham, E.; Farla, R.; Galtier, E.; Gleason, A.E.; Harmand, M.; Inubushi, Y.; et al. Evidence of shock-compressed stishovite above 300 GPa. Sci. Rep. 2020, 10, 1–8. [Google Scholar] [CrossRef] [PubMed]
  23. Duffy, T.S.; Smith, R.F. Ultra-high pressure dynamic compression of geological materials. Front. Earth Sci. 2019, 7, 23. [Google Scholar] [CrossRef]
  24. Coleman, A.L.; Gorman, M.G.; Briggs, R.; McWilliams, R.S.; McGonegle, D.; Bolme, C.A.; Gleason, A.E.; Fratanduono, D.E.; Smith, R.F.; Galtier, E.; et al. Identification of Phase Transitions and Metastability in Dynamically Compressed Antimony Using Ultrafast X-Ray Diffraction. Phys. Rev. Lett. 2019, 122, 255704. [Google Scholar] [CrossRef] [PubMed] [Green Version]
  25. Tracy, S.J.; Smith, R.F.; Wicks, J.K.; Fratanduono, D.E.; Gleason, A.E.; Bolme, C.A.; Prakapenka, V.B.; Speziale, S.; Appel, K.; Fernandez-Pañella, A.; et al. In situ observation of a phase transition in silicon carbide under shock compression using pulsed x-ray diffraction. Phys. Rev. B 2019, 99, 214106. [Google Scholar] [CrossRef]
  26. Gleason, A.E.; Bolme, C.A.; Lee, H.J.; Nagler, B.; Galtier, E.; Kraus, R.G.; Sandberg, R.; Yang, W.; Langenhorst, F.; Mao, W.L. Time-resolved diffraction of shock-released SiO2 and diaplectic glass formation. Nat. Commun. 2017, 8, 1–6. [Google Scholar] [CrossRef] [PubMed] [Green Version]
  27. Nagler, B.; Arnold, B.; Bouchard, G.; Boyce, R.F.; Boyce, R.M.; Callen, A.; Campell, M.; Curiel, R.; Galtier, E.; Garofoli, J.; et al. The Matter in Extreme Conditions instrument at the Linac Coherent Light Source. J. Synchrotron Radiat. 2015, 22, 520–525. [Google Scholar] [CrossRef]
  28. Blaj, G.; Caragiulo, P.; Carini, G.; Carron, S.; Dragone, A.; Freytag, D.; Haller, G.; Hart, P.; Hasi, J.; Herbst, R.; et al. X-ray detectors at the Linac Coherent Light Source. J. Synchrotron Radiat. 2015, 22, 577–583. [Google Scholar] [CrossRef]
  29. Bolme, C. Bolmian XRD Projection Software; LA-UR-15-25840, US DOE Copyright; Los Alamos National Laboratory: Los Alamos, NM, USA, 2015. [Google Scholar]
  30. Prescher, C.; Prakapenka, V.B. DIOPTAS: A program for reduction of two-dimensional X-ray diffraction data and data exploration. High Press. Res. 2015, 35, 223–230. [Google Scholar] [CrossRef]
  31. Wojdyr, M. Fityk: A general-purpose peak fitting program. J. Appl. Crystallogr. 2010, 43, 1126–1128. [Google Scholar] [CrossRef]
  32. Brown, J.M.; McQueen, G. Phase transitions, Grüneisen parameter, and elasticity. J. Geophys. Res. 1986, 91, 7485–7494. [Google Scholar] [CrossRef]
  33. Marsh, S.P. LASL Shock Hugoniot Data; University of California Press: Berkeley, CA, USA, 1980; ISBN 0-520-04008-2. [Google Scholar]
  34. Huser, G.; Koenig, M.; Benuzzi-Mounaix, A.; Henry, E.; Vinci, T.; Faral, B.; Tomasini, M.; Telaro, B.; Batani, D. Temperature and melting of laser-shocked iron releasing into an LiF window. Phys. Plasmas 2005, 12, 1–4. [Google Scholar] [CrossRef]
  35. Dorogokupets, P.I.; Dymshits, A.M.; Litasov, K.D.; Sokolova, T.S. Thermodynamics and Equations of State of Iron to 350 GPa and 6000 K. Sci. Rep. 2017, 7, 1–11. [Google Scholar] [CrossRef] [PubMed] [Green Version]
  36. Komabayashi, T.; Hirose, K.; Ohishi, Y. In situ X-ray diffraction measurements of the fcc-hcp phase transition boundary of an Fe-Ni alloy in an internally heated diamond anvil cell. Phys. Chem. Miner. 2012, 39, 329–338. [Google Scholar] [CrossRef]
  37. Wells, A.F. Structural Inorganic Chemistry; Oxford University Press: Oxford, UK, 1984; Volume 168. [Google Scholar]
  38. Fischer, R.A.; Campbell, A.J. The axial ratio of hcp Fe and Fe-Ni-Si alloys to the conditions of Earth’s inner core. Am. Mineral. 2015, 100, 2718–2724. [Google Scholar] [CrossRef]
  39. Kalantar, D.H.; Belak, J.F.; Collins, G.W.; Colvin, J.D.; Davies, H.M.; Eggert, J.H.; Germann, T.C.; Hawreliak, J.; Holian, B.L.; Kadau, K.; et al. Direct observation of the α-ε Transition in shock-compressed iron via nanosecond X-ray diffraction. Phys. Rev. Lett. 2005, 95, 075502. [Google Scholar] [CrossRef] [PubMed]
  40. Merkel, S.; Lincot, A.; Petitgirard, S. Microstructural effects and mechanism of bcc-hcp-bcc transformations in polycrystalline iron. Phys. Rev. B 2020, 102, 104103. [Google Scholar] [CrossRef]
  41. Boehler, R.; Santamaría-Pérez, D.; Errandonea, D.; Mezouar, M. Melting, density, and anisotropy of iron at core conditions: New x-ray measurements to 150 GPa. J. Phys. Conf. Ser. 2008, 121. [Google Scholar] [CrossRef]
  42. Fischer, R.A.; Campbell, A.J.; Shofner, G.A.; Lord, O.T.; Dera, P.; Prakapenka, V.B. Equation of state and phase diagram of FeO. Earth Planet. Sci. Lett. 2011, 304, 496–502. [Google Scholar] [CrossRef] [Green Version]
  43. Yamazaki, D.; Ito, E.; Yoshino, T.; Yoneda, A.; Guo, X.; Zhang, B.; Sun, W.; Shimojuku, A.; Tsujino, N.; Kunimoto, T.; et al. P-V-T equation of state for ε-iron up to 80 GPa and 1900 K using the Kawai-type high pressure apparatus equipped with sintered diamond anvils. Geophys. Res. Lett. 2012, 39. [Google Scholar] [CrossRef]
  44. Ono, S.; Kikegawa, T.; Hirao, N.; Mibe, K. High-pressure magnetic transition in hcp-Fe. Am. Mineral. 2010, 95, 880–883. [Google Scholar] [CrossRef]
  45. Tateno, S.; Hirose, K.; Ohishi, Y.; Tatsumi, Y. The structure of iron in earth’s inner core. Science 2010, 330, 359–361. [Google Scholar] [CrossRef] [PubMed]
  46. Uchida, T.; Wang, Y.; Rivers, M.L.; Sutton, S.R. Stability field and thermal equation of state of ε-iron determined by synchrotron X-ray diffraction in a multianvil apparatus. J. Geophys. Res. Solid Earth 2001, 106, 21799–21810. [Google Scholar] [CrossRef] [Green Version]
  47. Sakai, T.; Ohtani, E.; Hirao, N.; Ohishi, Y. Stability field of the hcp-structure for Fe, Fe-Ni, and Fe-Ni-Si alloys up to 3 Mbar. Geophys. Res. Lett. 2011, 38. [Google Scholar] [CrossRef]
  48. Dewaele, A.; Loubeyre, P.; Occelli, F.; Mezouar, M.; Dorogokupets, P.I.; Torrent, M. Quasihydrostatic equation of state of Iron above 2 Mbar. Phys. Rev. Lett. 2006, 97, 215504. [Google Scholar] [CrossRef] [PubMed]
  49. Tateno, S.; Hirose, K.; Komabayashi, T.; Ozawa, H.; Ohishi, Y. The structure of Fe-Ni alloy in Earth’s inner core. Geophys. Res. Lett. 2012, 39. [Google Scholar] [CrossRef] [Green Version]
  50. Lin, J.F.; Heinz, D.L.; Campbell, A.J.; Devine, J.M.; Mao, W.L.; Shen, G. Iron-nickel alloy in the Earth’s core. Geophys. Res. Lett. 2002, 29, 109-1–109-3. [Google Scholar] [CrossRef] [Green Version]
  51. Hok, S.; Gleason, A.E.; Bolme, C.; Rittman, D.; Merkel, S.; Ramos, K.J.; Morrow, B.; Lee, H.J.; Nagler, B.; Galtier, E.; et al. In situ strength measurement of shock-compressed iron via time-resolved X-ray diffraction. AGUFM 2019, 2019, DI23B-0043. [Google Scholar]
  52. Dewaele, A.; Denoual, C.; Anzellini, S.; Occelli, F.; Mezouar, M.; Cordier, P.; Merkel, S.; Véron, M.; Rausch, E. Mechanism of the α-ε Phase transformation in iron. Phys. Rev. B Condens. Matter Mater. Phys. 2015, 91, 174105. [Google Scholar] [CrossRef]
  53. Komabayashi, T.; Fei, Y. Internally consistent thermodynamic database for iron to the Earth’s core conditions. J. Geophys. Res. Solid Earth 2010, 115. [Google Scholar] [CrossRef] [Green Version]
  54. Wang, J.; Smith, R.F.; Eggert, J.H.; Braun, D.G.; Boehly, T.R.; Reed Patterson, J.; Celliers, P.M.; Jeanloz, R.; Collins, G.W.; Duffy, T.S. Ramp compression of iron to 273 GPa. J. Appl. Phys. 2013, 114. [Google Scholar] [CrossRef] [Green Version]
Figure 1. (a) Photomicrograph of Gibeon meteorite starting material. (b) Electron microprobe map showing the Ni distribution (in wt %) in a typical portion of the sample. On average, the Ni content within the grains is 7.5%, while the grain boundaries are Ni rich (up to 25%).
Minerals 11 00567 g001
Figure 2. Experimental setup at the Matter in Extreme Conditions (MEC) end station with the Linac Coherent Light Source (LCLS), an X-ray free-electron laser (XFEL) at the SLAC National Accelerator Laboratory. An MEC long-pulse laser was used to generate and launch a shock wave, via laser ablation, in the plastic (labeled ‘CH’ in the schematic), which then traversed the meteorite foil. At discrete time delays (Δt) during the shockwave propagation, the XFEL was used to probe the lattice structure by measuring XRD in transmission. Inset: cross section of the sample package. Meteorite sample thickness was 34 ± 0.5 μm.
Minerals 11 00567 g002
Figure 3. Representative raw X-ray diffraction data for a sample shocked to 42 GPa. (a) 2D diffraction image from CSPADs projected onto a single plane. (b) Caked pattern of (a) displayed as an s function of the 2 θ and azimuthal angle. The blue diamonds and dashed lines show the hcp peaks for the shock-compressed high-pressure phase. The red line and triangle indicate uncompressed starting bcc Fe. The large spots and uneven intensity distribution indicate the sample is coarse-grained and highly textured.
Minerals 11 00567 g003
Figure 4. Integrated XRD patterns at 6.9 keV. The blue diamonds show hcp peak locations: light blue, mid-tone blue, and dark blue indicate hcp (100), hcp (002), and hcp (101) peaks, respectively. The red diamonds show the unshocked bcc (110) peak from the starting material at ambient pressure. (a) Pressure series for separate runs collected at full compression. Inset: zoomed-in 2 θ region to illustrate a weak S/N of the hcp (100) and (200) peaks at 85 and 113 GPa, relative to the more intense (101) peak. (b) Representative time series showing XRD data collected for the same incident laser intensity, generating a 113 GPa peak pressure, but different XFEL time delays: at nearly full compression (bottom trace) and on release (top trace) at ~25 GPa.
Minerals 11 00567 g004
Figure 5. Comparison of the axial c/a ratios determined in this study (black circles) to the ideal c/a ratio of 1.633 (dashed black line) and to previous static and dynamic compression work on Fe and Fe-rich Fe-Ni alloys [17]. Solid, colored lines are plotted to show the trend line for different groups from individual datasets from [17]. The shaded polygons show the spread of the data: shock-compressed polycrystalline Fe (gray) from [19], static-compressed polycrystalline Fe (pink) and Fe90Ni10 (blue) from datasets compiled in [38], pure Fe from [14,41,42,43,44,45,46,47,48], and Fe-Ni alloys from [36,47,49,50]. We plotted the static-compressed Fe and Fe90Ni10 data that fell in a similar temperature region as our study, 1000–3000 K. Error bars were calculated by propagating the uncertainty of the least-squares fit for hcp lattice parameters. The error bars on the data at 5.12 and 5.35 cm3 are smaller than the symbol size on the plot.
Minerals 11 00567 g005
Figure 6. Phase diagram of Fe and results of shock-compressed Gibeon meteorite, kamacite lamellae, Fe92.5Ni7.5 on the Fe Hugoniot from this study. Shock compression data (blue circles) plotted on a pure Fe phase diagram: bcc boundaries from [53], melt curve from [14], along with the Fe90.3Ni9.7 phase boundary from [36] (pink section). XRD data collected at full compression are plotted along the Hugoniot for pure Fe (green curve) [54]. Guides for the eye of release isentropes (dashed lines) are derived from post-shock temperatures [34,35]. Our temperature uncertainties are 20%.
Minerals 11 00567 g006
Publisher’s Note: MDPI stays neutral with regard to jurisdictional claims in published maps and institutional affiliations.

