Article

Magnetic Fly Ash as a Chronological Marker in Post-Settlement Alluvial and Lacustrine Sediment: Examples from North Carolina and Illinois

1
Illinois State Geological Survey, Prairie Research Institute, University of Illinois, Champaign, IL 61820, USA
2
Department of Geological Sciences, University of North Carolina at Chapel Hill, Chapel Hill, NC 27514, USA
3
North Carolina Geological Survey, Division of Energy, Mineral, and Land Resources, Raleigh, NC 27603, USA
4
Department of Civil & Environmental Engineering, Northwestern University, Evanston, IL 60208, USA
5
Department of Earth & Planetary Sciences, Northwestern University, Evanston, IL 60208, USA
*
Author to whom correspondence should be addressed.
Minerals 2021, 11(5), 476; https://doi.org/10.3390/min11050476
Submission received: 4 April 2021 / Revised: 27 April 2021 / Accepted: 28 April 2021 / Published: 30 April 2021
(This article belongs to the Special Issue Natural and Technogenic Magnetic Particles in the Environment)

Abstract

:
Fly ash consists of mainly silt-size spherules that form during high-temperature coal combustion, such as in steam locomotives and coal-burning power plants. In the eastern USA, fly ash was distributed across the landscape atmospherically beginning in the late 19th century, peaking in the mid-20th century, and decreasing sharply with implementation of late 20th century particulate pollution controls. Although atmospheric deposition is limited today, fly ash particles continue to be resedimented into alluvial and lacustrine deposits from upland soil erosion and failure of fly ash storage ponds. Magnetic fly ash is easily extracted and identified microscopically, allowing for a simple and reproducible method for identifying post-1850 CE (Common Era) alluvium and lacustrine sediment. In the North Carolina Piedmont, magnetic fly ash was identified within the upper 50 cm at each of eight alluvial sites and one former milldam site. Extracted fly ash spherules have a magnetite or maghemite composition, with substitutions of Al, Si, Ca, and Ti, and range from 3–125 µm in diameter (mainly 10–45 µm). Based on the presence of fly ash, post-1850 alluvial deposits are 15–45 cm thick in central North Carolina river valleys (<0.5 km wide), ~60% thinner than in central Illinois valleys of similar width. Slower sedimentation rates in North Carolina watersheds are likely a result of a less agricultural land and less erodible (more clayey) soils. Artificial reservoirs (Lake Decatur, IL) and milldams (Betty’s Mill, NC), provide chronological tests for the fly ash method and high-resolution records of anthropogenic change. In cores of Lake Decatur sediments, changes in fly ash content appear related to decadal-scale variations in annual rainfall (and runoff), calcite precipitation, land-use changes, and/or lake history, superimposed on longer-term trends in particulate pollution.

1. Introduction

Industrial fly ash, fine particles released to the atmosphere from high temperature coal burning, have been successfully used as a geochronological tool for recent alluvial or lacustrine sediments worldwide [1,2,3,4,5,6]. The presence of fly ash in sediments is an excellent marker because it only occurs in deposits that post-date industrial coal-burning technologies, generally after 1850 in the eastern USA [1,4,7]. Older sediments generally do not contain magnetic fly ash with the exception of rare particles that may have been pedogenically mixed downwards. A rapid increase in carbonaceous fly ash particles, at about 1950 in lake sediment cores worldwide, has been suggested as a potential global stratigraphic marker for the Anthropocene [4]. Fly ash emissions from coal burning became regulated in the USA after the Clean Air Act of 1970 and were dramatically reduced with requirements of electrostatic precipitators by 1975; significant use of precipitators in the USA began in the 1960s [8]. Furthermore, the use of coal as an energy source in the USA has decreased since 2008 [9]. Thus, atmospheric deposition of fly ash is significantly more limited today, although it remains ubiquitous in many recent depositional records because of resedimentation from uplands to floodplains [6] or lakes [10]. Fly ash is now stored as slurries in coal ash ponds, but these ponds are occasionally breached, which can lead to recent deposition in valleys [11]. Tracking unintended releases of stored coal ash is also of importance because several trace elements (e.g., boron, arsenic, sulfate, selenium) in coal ash leachate can lead to groundwater toxicity [12] and can be detrimental to aquatic life [13].
Atmospheric sources of fly ash in the eastern USA include coal-burning power plants, historical steam powered farm equipment, historical steam-powered locomotives, and other technologies that used coal for energy [1,4]. Coal burning locomotive use, a fly ash source, began approximately in the 1860s in central Illinois and in the 1850s in central North Carolina. Coal burning for power generation began in the late 19th century; power plant use substantially increased into the early and mid-20th century along with electrification and increased energy consumption.
Fly ash particles generally range in size from ~1 to 90 µm [14]; most are siliceous in composition, but a significant fraction (5% to 10%) can be strongly magnetic [15,16]. The composition of the magnetic fly ash particles includes magnetite, maghemite, and, in some cases, magnesioferrite or mullite; thin coatings of silicates and aluminosilicates are also common [15,17]. The strongly magnetic fly ash spheres form from oxidation of pyrite at high temperatures, well above 1000 °C [18,19]. Thus, household coal burning, generally at lower temperatures, is not considered to be a significant source. Fly ash is also highly spherical, allowing for ease of microscopic identification, with magnetic particles having particularly strong sphericity [14]. Although magnetic spherules can possibly originate from micrometeorites or natural processes, such particles are relatively rare and have not been observed in older (pre-industrial) sediments in the central USA, below ~1 m depth [2,6].
Magnetic susceptibility and other soil magnetic properties have also been used to identify post-settlement or post-industrial age alluvial or lacustrine sediments [16,20]; such data has been often calibrated with Cs-137 data. Magnetic susceptibility (MS) and frequency dependent magnetic susceptibility (XFD) are both typically higher in the upper solum of soil profiles, where ultrafine magnetite and magnetite particles can neoform [21,22]. XFD is sensitive to ferrimagnetic minerals in the 0.012–0.022 µm range, many of which are pedogenic in origin [23]. Fly ash particles, being mainly >1 µm in diameter, have low XFD values that are mainly <2% [15]. Thus, soils with significant content of fly ash typically have high MS and low XFD [24].
The thickness of post-settlement alluvium, in some studies in the central USA, has been found to have a strong positive relationship with valley width [6,25], with more rapid sedimentation due to reduced stream power. In the eastern USA, sedimentation of post-settlement alluvium (PSA or legacy sediment) during the late 18th and 19th centuries was significantly impacted by historic milldam construction along many streams [26,27,28]. Furthermore, deforestation for European-style row crop agriculture, beginning during the Colonial era (mid-18th to mid-19th centuries), led to accelerated erosion of sediment from upland and deposition in floodplains [28]. However, the rates of human-accelerated upland erosion and floodplain sedimentation likely peaked for many areas in the southeastern USA during late 19th and early 20th centuries [29,30,31]. Land-use practice changes after this time, including reforestation, have since led to reduced sedimentation and incision of streams into legacy sediment in the eastern Piedmont [27,32].
A primary objective of this research was to test the use of magnetic fly ash as a means to delineate post-1850 alluvial deposits in the North Carolina Piedmont. Secondly, we compare this data with prior findings by similar methods in the central USA (Illinois), in order to yield better understanding of the geologic, topography, land-use and anthropogenic controls. Additionally, magnetic fly ash records in lacustrine sediments of artificial reservoirs and milldams were examined in order to evaluate the potential for higher resolution records in areas with more rapid sedimentation rates. These lacustrine records, with well-known chronologies, can help to evaluate the timing of the earliest fly ash deposition as well as dramatic increases in fly ash in eastern USA sedimentary records.

2. Geologic and Historical Setting

2.1. North Carolina Piedmont Study Area

The study area in central North Carolina contains nine sites within the upper Cape Fear River and Neuse River drainage basins (Figure 1). These areas are underlain by crystalline bedrock, separated by a northeast-southwest trending Deep River basin that is filled with Triassic sedimentary rocks (sandstone, mudstone, shale, coal, and conglomeritic facies) that are as much as 4 km thick [33,34]. The Triassic bedrock fills a half graben structure that contains dikes of Jurassic diabase [33,35]. The Deep River Triassic basin separates the Raleigh metamorphic belt on the east, from Carolina terrain metavolcanics and metasedimentary rocks on the west. Much of the region has near-surface fine-grained material that consists of weathered (in situ) Triassic deposits, saprolite in crystalline bedrock, or younger sediments derived from these materials. Cretaceous and Tertiary deposits are locally present but are not common in the central North Carolina study area (Wake, Orange, and Lee counties). Quaternary terraces and alluvial fills are inset into the Triassic bedrock. The Quaternary sediments are generally fine-grained, but range from gravelly sand (mainly in higher terraces) to loamy sand to silty clay. The Quaternary sediments are relatively thin, ranging from thin strath terrace deposits to fills of up to 5 m thick. Overall, fine-grained alluvial sediments and silty clay to clay residuum dominate the surficial materials in much of this region, with gravelly sand deposits in terraces only locally distributed [35,36].
Since European colonization, in particular from the mid-18th to mid-19th century, some areas in central North Carolina were deforested for agriculture [27,37]. Mill dams, forming localized ponds in stream valleys, were common from the late 18th to early 20th century [27,32]. Betty’s Milldam, a historical milldam in William B. Umstead State Park, is estimated to have been built before 1810, based on its construction style [27], and likely in the late 1700s. The milldam lake (which was a few hundred meters in length) is not shown on a map of Wake County drafted in 1865 for tax purposes [38] and so had been abandoned before this time. The sediment record in the milldam lake deposits has been previously studied [27,37,39].
About 20% to 40% of Wake, Chatham and Orange counties were in agriculture from 1850 to 1940, but decreased to <20% of the land area by the 1960s [40] as some areas became reforested or urbanized. During the 20th century, several large lakes (reservoirs) were formed from dam construction along the Cape Fear, New Hope, and Haw rivers. The completion of the B. Everett Jordan Lake Dam in 1974 resulted in today’s Jordan Lake (5640 ha). After several years of flooding, the current mean water level of 66 m above sea level in the reservoir was reached in 1983. Much of the study area (Figure 1) is now forested, with a significant amount of land area in county, state or federal parklands or recreation areas. A large part of the study area also consists of suburban to urban land, mainly wooded, with only a small percentage of land in agriculture.
Coal mining in the Deep River Triassic Basin began largely after 1850; earlier coal mines were small scale and local [43]. The use of coal burning locomotives likely began in the 1850s in the study area. An early map [44] shows a pre-1850 rail line extended from Richmond, Virginia to Raleigh, North Carolina. However, the first westward railroad from Raleigh to Durham to Greensboro opened in 1856 (Figure 1) and is shown on an 1860 map. This rail line could have impacted many of the study sites. An 1871 Wake County map [38] shows two rail lines extending west from Raleigh, the older line to Durham and points west and a newer line from Raleigh to Sanford. Both of these railroad lines are still present and operating today. Several other minor and short lines were constructed that operate today or historically. All nine study sites are within ~4 km of a current or former railroad line, with operations beginning between 1855 and 1890 for most lines in Wake, Lee, and Orange County (Figure 1).
The largest coal-burning power plant in the study area was the Cape Fear Power Plant, located at the confluence of the Deep and Haw Rivers (where Cape Fear River begins). This power plant began operation in 1923. Subsequently, two of the 6 coal-fired units were retired in 1977, two more were retired in 2011, and the last two retired in 2012 [45]. The Cape Fear Power Plant was demolished in 2017. The University of North Carolina in Chapel Hill had its first power plant in 1895, with a coal plant built in 1940 on West Cameron Avenue to supply electricity to Chapel Hill and Carrboro [46]. In 1988, a coal-fired cogeneration facility was built for the university hospital, but fly ash has been captured and the plant is phasing out coal burning. In eastern North Carolina, many small, municipality-owned coal-burning steam plants once operated in the early 20th century; such plants were periodically updated and were eventually replaced with large coal-burning power plants between 1940 and 1965, as rural electrification and overall electrical use grew rapidly [47].

2.2. Central Illinois and Lake Decatur

Central Illinois is a formerly glaciated, low-relief (average slope 1.6%) region that includes the upper Sangamon River Basin. This region was glaciated several times during the Pleistocene, most recently from 25 to 21 thousand years ago (ka) [48,49]. The landscape includes moraines, glacial plains and terraces, underlain by fine-grained till, outwash sand or lake sediment [50,51,52] Uplands are draped by 0.75 to 1.5 m of late glacial loess [53,54]. The Sangamon River Valley contains terraces with outwash deposits related to ice marginal drainage. The modern floodplains contain 1 to 5 m of Holocene alluvium, sourced mainly from loess mantled uplands, as well as streambanks with glacial till, outwash, and alluvium. The Holocene alluvium is mainly fine-grained, ranging from silt loam to silty clay loam to sandy loam. Pre-settlement vegetation consisted mostly of prairie, with woodlands along many stream corridors [53,55]. The vast central Illinois prairie was primarily converted to farmland during the late 1800s [56]; this change was accelerated by technology that led to the expansion of drainage ditches and formation of drainage districts in 1879 [57]. Steam locomotives began operating in central Illinois in 1854, burning at first mainly wood, but switching primarily to coal during the 1860s [58]. Coal-burning locomotive use expanded during the late 19th century, peaked in the early 20th century, and declined rapidly in the mid-20th century as diesel engines became dominant. Coal burning power plants have operated in Illinois since the early to mid-20th century. Two coal burning plants have operated in the city of Decatur, Illinois: the A.E. Staley and Archer Daniels Midland (ADM) Company plants began operation in 1922 and 1937, respectively [59]. The plants and mills are located about 1 to 3 km northwest of Lake Decatur.
Lake Decatur is an artificial reservoir created in central Illinois by dams constructed in 1878, 1910 and 1922 to impound the Sangamon River [60]. The 1922 dam was the largest, expanding the size of Lake Decatur. The addition of bascule spillway gates to the top of the dam in 1956 raised the water level over a meter and temporarily increased sediment trapping efficiency [60]. The lake today is long and narrow, being about 15 km long but <1 km wide. In area, the lake today is ~12 km2 and the watershed area is ~2400 km2 [61]. Land use in the watershed has been dominated by row crop cultivation of corn and soybeans since 1960 [62]. Previous studies include the lake sedimentation patterns from the 1930s–1980s [60] and the biogeochemistry and organic carbon sources from 16 sediment cores distributed across the middle and lower reaches of Lake Decatur ([61], Figure 2B).

3. Methods

3.1. Soil Sampling

Seven outcrops and two hand auger cores, ranging in depth from about 1 to 3 m, were described and sampled from modern floodplains in the North Carolina Piedmont (Figure 1; Table 1). The outcrops are creek bank exposures, some of which contained entirely alluvium, but four sites contain bedrock at or just above creek level. The two hand auger samples contained entirely alluvium. Field samples, for fly ash and magnetic susceptibility analysis, were acquired in continuous intervals every 10 cm up to 1 m depth. For graphing purposes, samples were assigned the midpoint depth (e.g., 0–10 cm plotted as 5 cm depth). For sites sampled below 1 m, a grab sample was taken every 20 cm or below a unit contact. Descriptions of sediment were made using standard geologic notations, USDA soil textures, and Munsell colors (Table S1).
From the Lake Decatur reservoir (central Illinois), two of the sixteen shallow cores acquired in 2014–2015 [61], were analyzed for magnetic fly ash as well as other geochemical data at 5 cm depth intervals. Core 9 (1.05 m sediment; 39.84211° N, 88.89432° W) and Core 13 (0.80 m sediment; 39.83570° N, 88.90741° W) were recovered from water depths of 2.1 and 2.3 m, respectively. They are both located in the lower third of Lake Decatur and close to the original channel of the pre-dam (pre-1922) Sangamon River, with Core 13 about 1 km southwest (or downlake) of Core 9 (Figure 2B). In the vicinity of these cores, Lake Decatur is about 500 to 800 m wide. Core 13 is located ~300 m from the lakeshore, whereas Core 9 is <100 m from the southeastern lakeshore and directly over the former river channel [61]. The part of the lake where these cores were taken has not been disturbed by dredging before the time of sampling in 2015, although upper parts of Lake Decatur have periodically been dredged. Cores 9 and 13 are located ~2.5 to 3.5 km south or southeast (and downstream) from the A.E. Staley and ADM power plants.

3.2. Magnetic Fly Ash Extraction

To facilitate magnetic particle extraction, a process similar to that used in an earlier study [6] was used. About 25 g sediment was dried, ground with mortar and pestle, and sieved <2 mm to remove roots and gravel. From the <2 mm fraction, 20 g of dried sediment, 250 mL of water and 10 mL of Na-hexametaphosphate solution (50 g/L) were placed in a 400 mL beaker. An egg-shaped magnet (5 cm × 2 cm) was placed in the beaker to extract strongly magnetic particles, using a magnetic stirrer at low setting to aid dispersion. Magnetic extraction was repeated three times, using 5 min, 2 min, and 1 min spins with the magnetic stirrer, so that all or nearly all strongly magnetic particles were collected. After each of the timed spins, magnetic particles were washed with water from the magnet into a 100 mL beaker using a spray bottle. Extracted particles were dried over several hours at ~100 °C. Next, the strongly magnetic particles were purified with a 7 cm × 1.6 cm magnet, wrapped in clear plastic and held above the dried powder. This process generally purified the sample to a dark gray or black powder with typically >90% gray or black particles.

3.3. Counting of Magnetic Spheroids

The purified magnetic extract was examined in reflected light with a binocular microscope (Nikon SMZ-2800 or SMZ-745T, Nikon Instruments Inc., Melville, NY, USA) and counted at 63× or 150× magnification (150× for Lake Decatur samples). A random count of 100 dark gray to black magnetic particles in the 10–60 µm size range, was made using at least 3 different fields of view. Counted particles were classified as either spheroidal or non-spheroidal. Light-colored particles and particles <10 µm were excluded from counts. The non-spherical particles in the 10–60 µm size range were generally black, highly magnetic, and had a metallic luster, consistent with magnetite. Non-spherical particles >60 µm (the typical maximum size of fly ash) were also excluded from counts. Rarely, magnetic spheroids were observed >60 µm (up to 125 µm); these few large particles were included in the counts. Spheroidal particles are assumed to be fly ash, although a small percentage could be naturally rounded ilmenite in some regions [6,63]. This assumption that the magnetic spheroids are fly ash seems valid as spheroids were not observed in native sediments or bedrock below 1.5 m depth in both Illinois and North Carolina. The term fly ash is hereafter used for the spheroids identified in the magnetic fractions. Based on multiple reruns, precision of counting is about ±10% of values for recounts and ±20% of values for re-extracted and recounted samples.

3.4. Magnetic Susceptibility

To prepare samples, dried sediment or soil was pulverized with a mortar and pestle and then sieved to <2 mm. The powdered sample was placed in 20 mm sided plastic cubes that were lightly tapped to pack the sediment uniformly. Measurements of magnetic susceptibility were made with a Bartington MS2 Meter (Bartington Instruments, Witney, UK) meter with an MS2B attachment. Two low frequency (0.47 kHz) measurements were made (SI units, 1.0 s setting), with background values subtracted, and then averaged to calculate a raw MS value. A final mass-based MS value (×10−8 m3/kg) was calculated by the formula [10× raw MS/dry weight (in grams)].
Measurements of frequency dependent magnetic susceptibility (XFD), a reflection of ultrafine-grained ferrimagnetics [64], were made with a Bartington MS3 Meter (Bartington Instruments) meter with the MS2B attachment. XFD values are expressed as a percent difference between measurements of MS at high frequency (4.7 kHz) and low frequency (0.47 kHz), using the formula XFD = (XLF − XHF)/XLF. Measurements of high and low frequency MS were made with a 5 s interval setting.

3.5. Post-1850 Alluvial Thickness Determination

The basal PSA contact was delineated where fly ash proportions are consistently above background levels. The first occurrence of a single magnetic spheroid was not always used because of possible pedogenic mixing and rare naturally spheroidal magnetic particles. The precision of a fly-ash-based, basal PSA contact is likely limited to ~5 cm because of pedogenic mixing. At a few sites where the contact was transitional over 10–20 cm in thickness, we used other data, such as changes in MS to verify or improve the precision of fly-ash-based PSA thickness determinations. In some cases, subtle changes in field characteristics corresponded with PSA thickness estimations, but were not used as a criterion.

3.6. Scanning Electron Microscopy

Extracted magnetic powders for scanning electron microscopy were sprinkled onto pin mounts with double-sided carbon tape. Two samples were examined: 0–10 cm depth from NCFA-8 (with fly ash) and 100–120 cm depth from NCFA-2 (without fly ash). The magnetic extracts were examined on a Hitachi S3200N Variable Pressure Scanning Electron Microscope (at the North Carolina State University Analytical Instrumentation Facility) at 20 KeV and with a 15 mm working distance. Energy dispersive spectroscopy (with Oxford energy dispersive X-ray spectrometer) was performed on several individual grains of fly ash spheres and non-fly ash grains to determine elemental compositions.

3.7. Carbon Isotopes, Carbonate Content, and Cesium-137

The δ13C (13C/12C ratio) of the particulate organic carbon (POC) in the lake sediments was measured using methods formerly outlined [61]. Sediments were treated with aqueous 2 N HCL for 1–2 days and then dried in vacuo to remove carbonates. The decarbonated sediment samples were analyzed for POC concentrations and δ13C values using a Costech Elemental Analyzer-Conflo IV interface-Thermo Delta V Plus (Thermo Fisher Scientific (Bremen) GmbH, Bremen, Germany) isotope ratio mass spectrometer (IRMS) combination. Isotopic compositions were related to the international standard, VPDB, through calibrated laboratory reference materials.
Carbonate mineral identification and quantification was accomplished using Diffuse Reflectance Fourier Transform Infrared Spectroscopy (DRIFT; [65]). Dried, finely ground samples were analyzed using a Bruker Tensor 37 FTIR (Bruker Corporation, Billerica, MA, USA) spectrometer with a Harrick Praying Mantis DRIFTS attachment. Each spectrum was recorded from 4000 to 400 cm−1 with a 4 cm−1 resolution and an average of 16 scans. All spectra were corrected against a KBr background. A 3-mm-diameter sampling cup capable of holding ~30 mg of sample was used. The absorbance band region of 2515 ± 9 cm−1 was used to distinguish between calcite and dolomite and quantify the identified mineral’s dry weight concentration.
Gamma spectroscopy was used to determine 137Cs activity. Samples were counted for more than 82,800 s using an EG&G Ortec® HPGe (Advanced Measurement Technology, Oak Ridge, TN, USA) detector [61]. Most 137Cs in the environment was released between 1955 and 1965, during atmospheric nuclear bomb tests, and peaked in early 1960s [66].

4. Results

4.1. Field Observations: (North Carolina Alluvium)

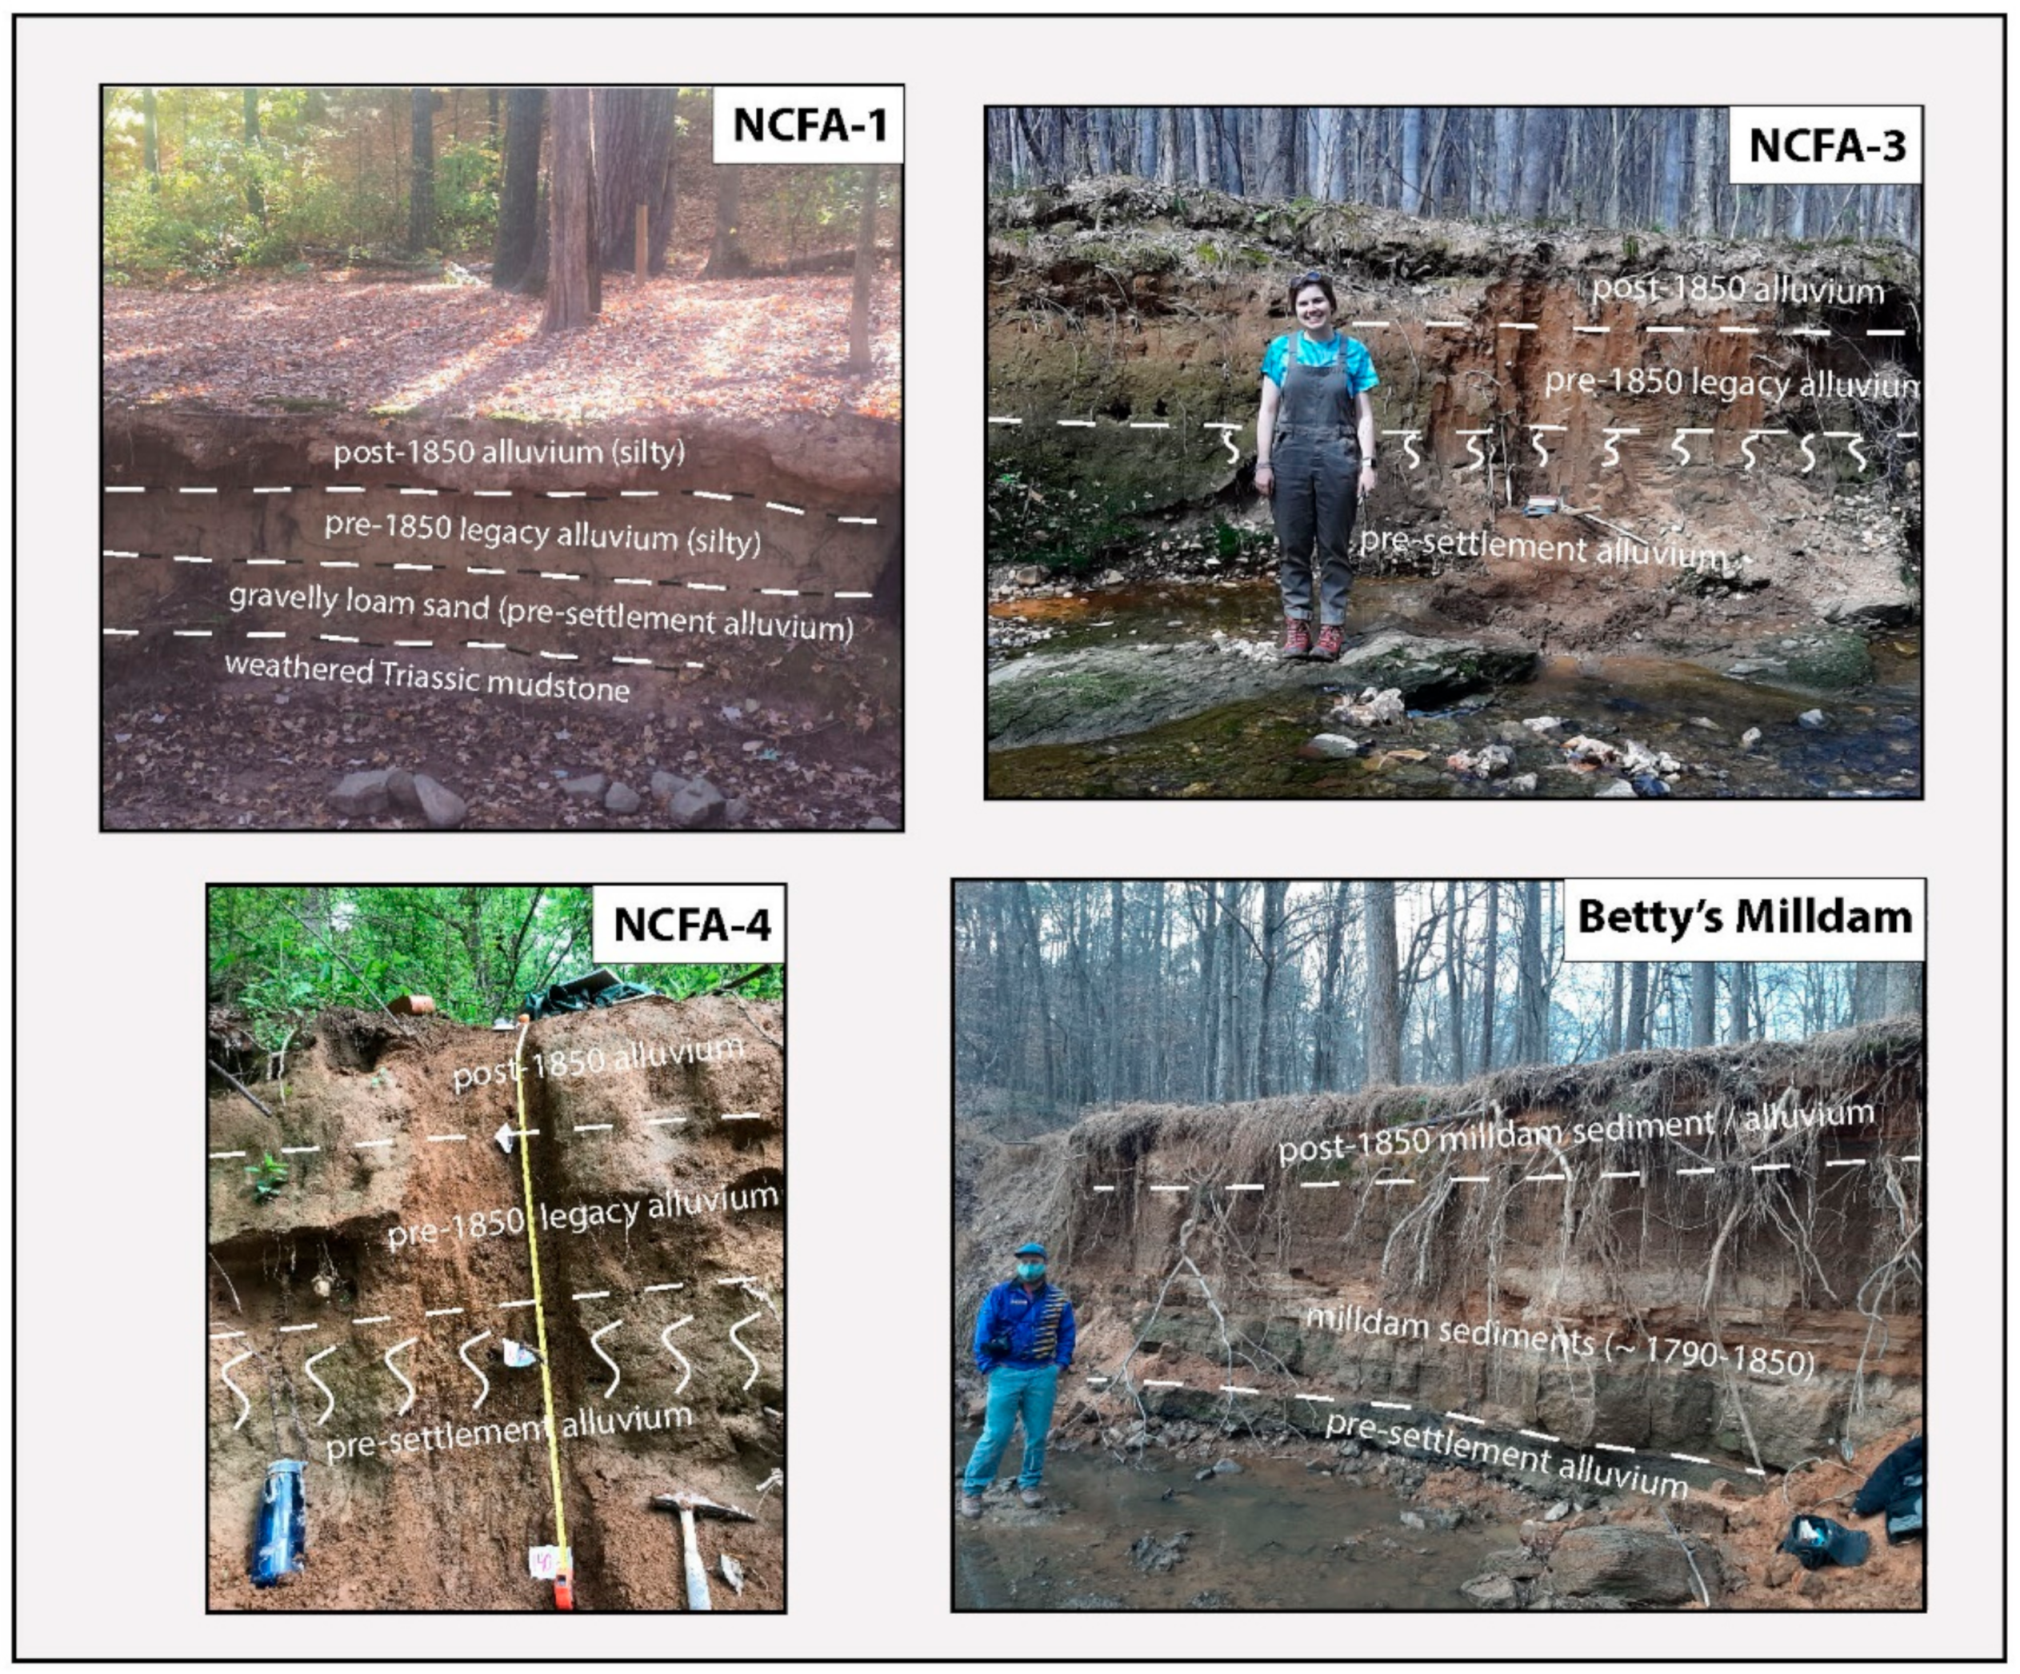
Based on the seven studied outcrops and two hand auger samples, the alluvium in this region is mainly fine-grained, but generally coarsens at depth (full descriptions in Table S1). Soil textures, determined in the field, range from silt loam and silty clay loam to sandy loam and gravelly loamy sand. The upper meter of alluvium is typically brown (7.5YR 5/4) to dark yellowish brown (10YR 4/4), silty, soft, and massive to weakly stratified. Minor amount of fine sand and rare rounded quartz pebbles may occur in this upper alluvium. Coarser (sandy or gravelly) zones, if present, are typically imbricated and occur in basal part of the alluvial sequence immediately above bedrock or near creek level (Figure 3). A weakly developed paleosol (likely representing the pre-settlement surface), slightly darker and with stronger soil structure, was notable in the field at NCFA-3 (1.0–1.4 m depth), NCFA-5, and Betty’s Milldam sections.
The bedrock surface was observed at sites NCFA-1, NCFA-3, NCFA-5, and NCFA-6. Schist is locally exposed in the creek bed at NCFA-3 (Figure 3), whereas Triassic mudstone floors the creek bed, below alluvium, at sites NCFA-1 (Figure 3) and NCFA-6. Weathered bedrock (residuum), probably altered mudstone, occurred in the lower part of the described section at NCFA-5. In the vicinity of NCFA-6 (~30 m upstream of sampled bank), a 0.6 m layer of cross-bedded sand, likely Tertiary in age, occurs between the recent alluvium and the Triassic mudstone that floors the streambed locally.

4.2. Magnetic Fly Ash (North Carolina Alluvium)

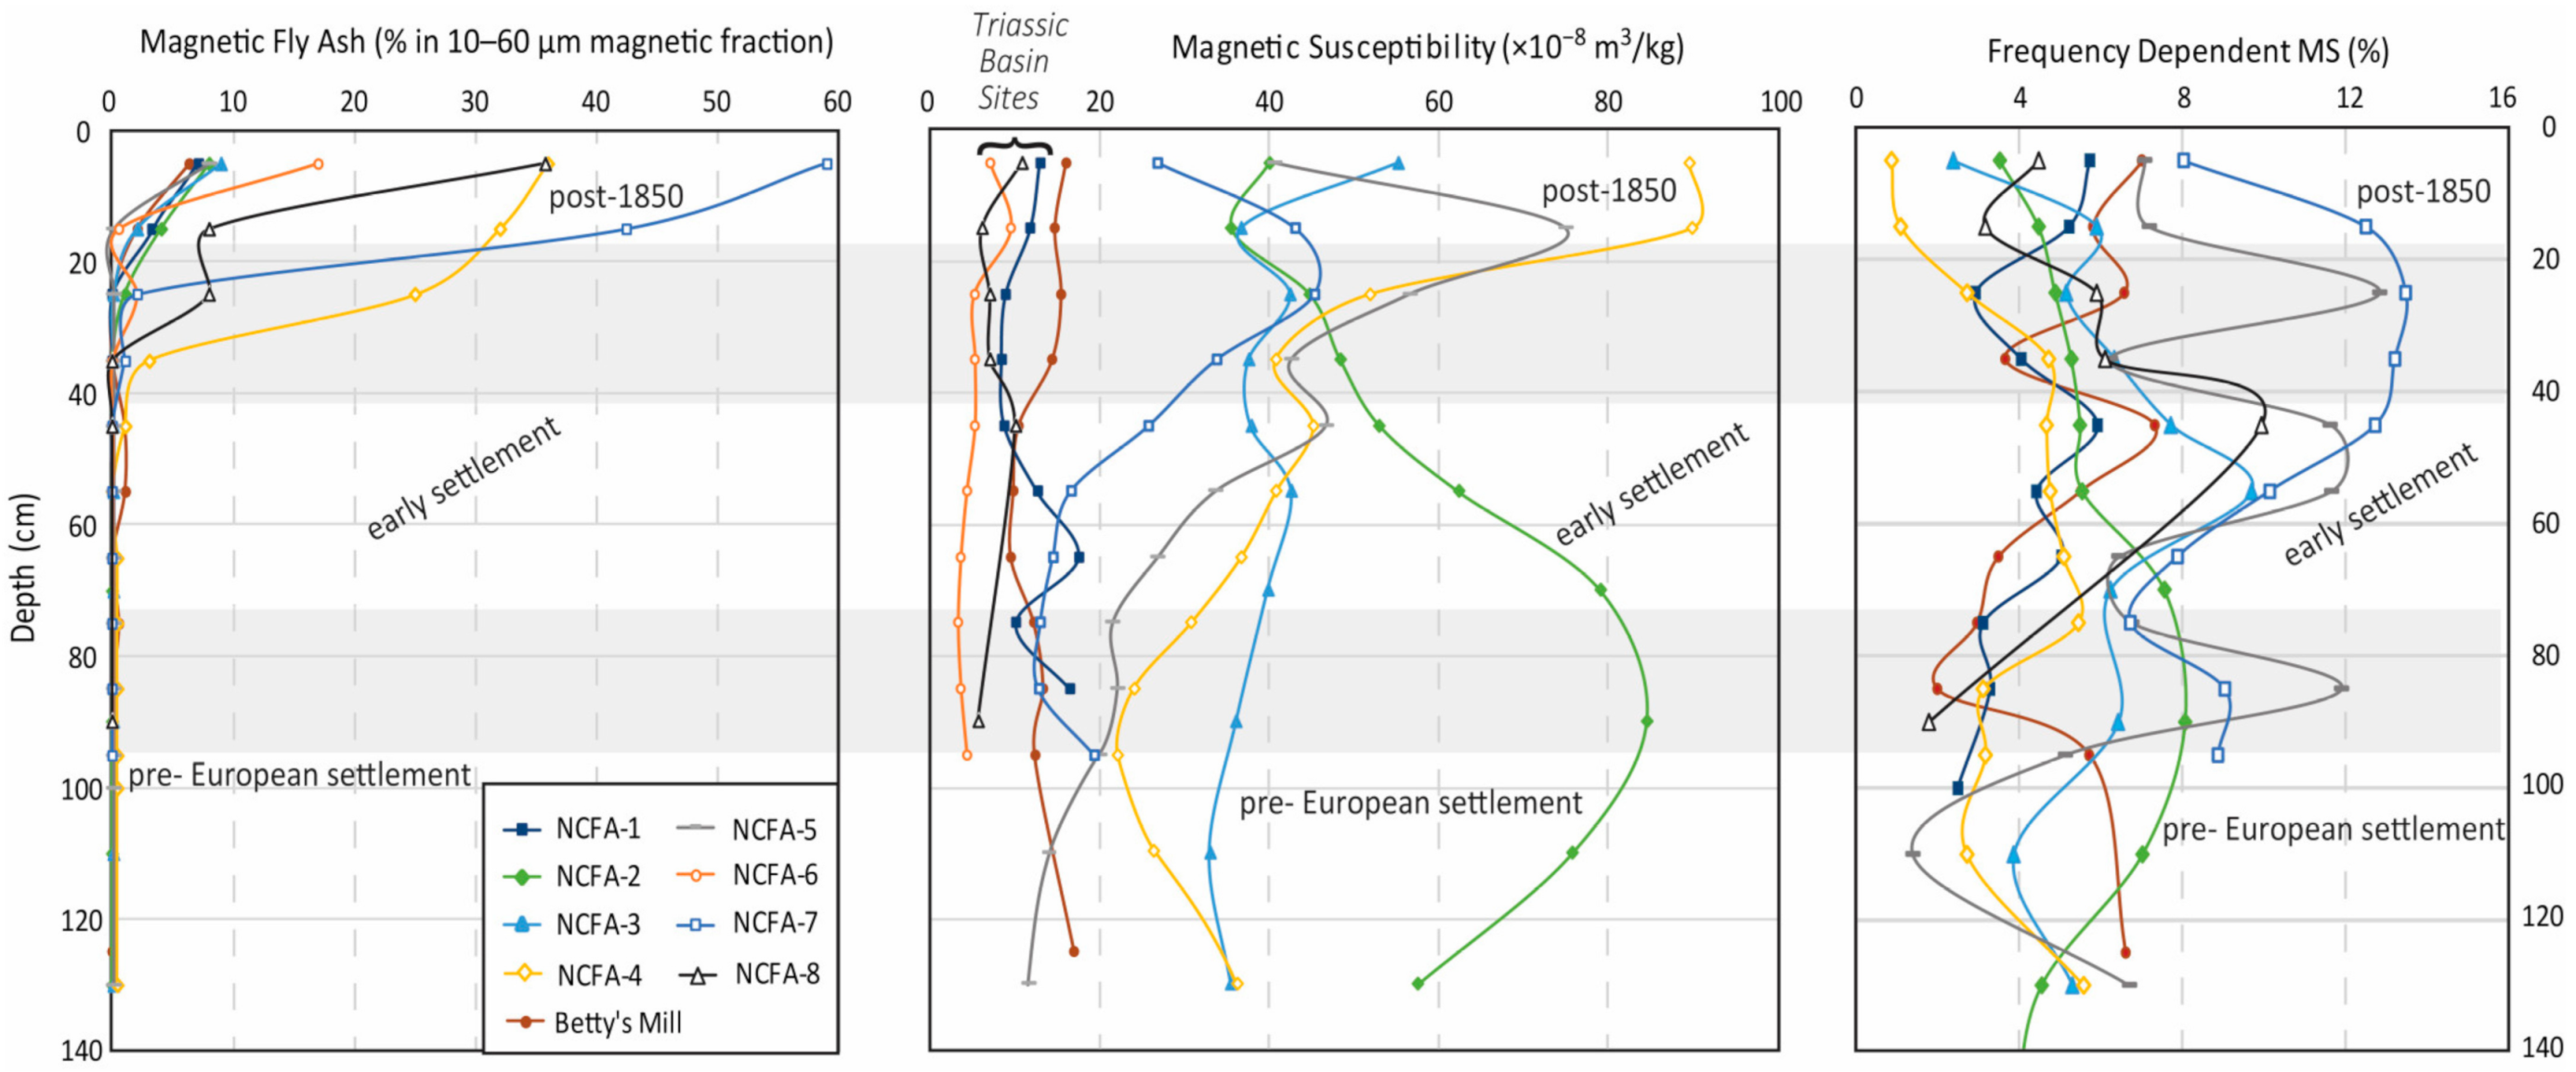
The proportion of magnetic fly ash within the strongly magnetic silt fraction in alluvium of the North Carolina Piedmont study area ranges up to 59%, based on particle counts (Figure 4). More typically, the proportion of fly ash in the magnetic fraction is <10%. At all nine sites, fly ash proportions are highest at the surface and decrease relatively strongly between 10 and 30 cm below surface. Magnetic fly ash particles observed with the binocular microscope were typically 10–50 µm in diameter; however, a few fly ash spheroids were 90–125 µm in diameter at NCFA-4 (0–20 cm depth) and NCFA-5 (0–10 cm depth). These large particles are likely a result of the proximity of these sampling sites to the University of North Carolina power plant in Chapel Hill (within 3 to 4 km). Large fly ash grains, up to 85 µm in diameter were also notable at NCFA-7, located only 3.5 km from (and downstream of) the former Cape Fear Power Plant.
High proportions of magnetic fly ash likely relate, in part, to the distance from coal burning power plants. At NCFA-4, NCFA-7 and NCFA-8, proportion of fly ash within the magnetic fraction ranges between 30% and 60% in the uppermost samples. Site NCFA-4 is located ~3 km downwind (northeast) of a power plant in Chapel Hill. NCFA-7 and -8 are located within a few km of the Cape Fear Power Plant which operated from 1923–2012. The proximity to power plants is likely a primary control on the proportion of magnetic fly ash in surficial samples. Although a quantitative analysis was not performed, the particle size of fly ash spherules also tends to be larger in these sites that are proximal to power plants.

4.3. Scanning Electron Microscopy

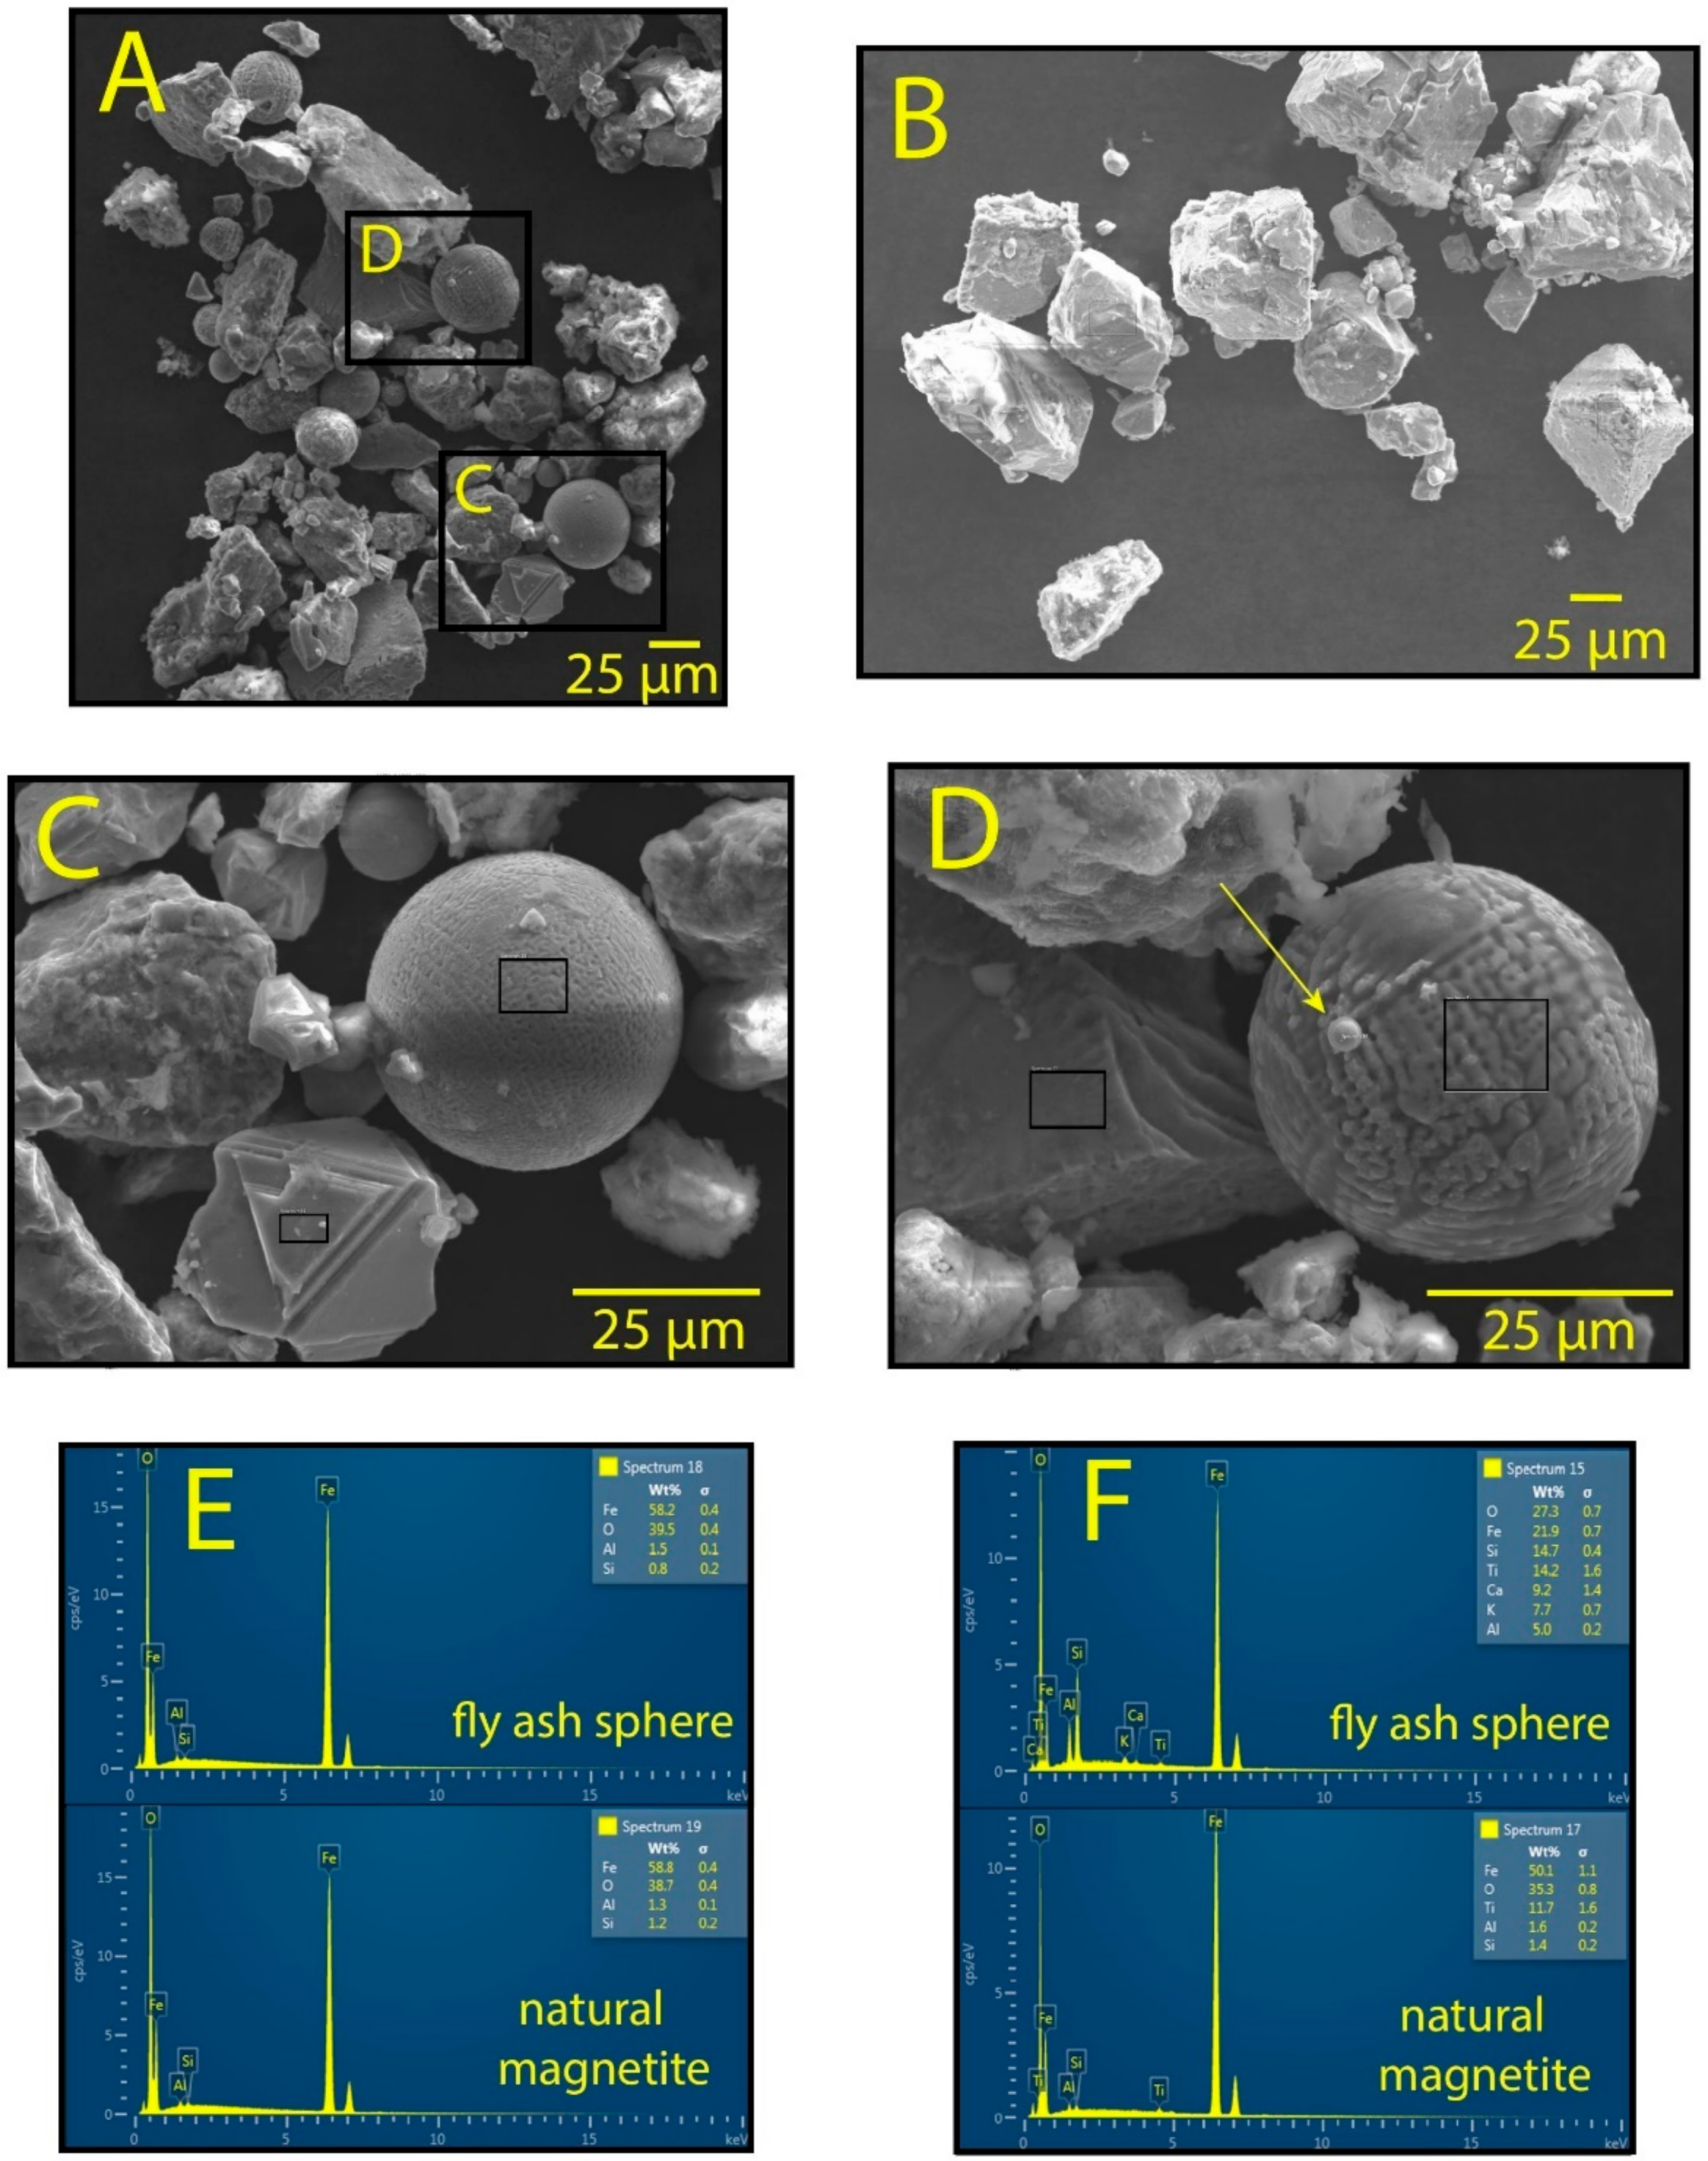
Fly ash spheres from sample NCFA-8 (0–10 cm depth) were easily detectable in scanning electron microscope (SEM) images (Figure 5), confirming observations with a low power binocular microscope. Fly ash spheres were not observed in pre-settlement alluvium from NCFA-2 at 100–120 cm depth. SEM images, obtained at magnifications of 150× to 5000×, clearly display the sphericity of the magnetic fly ash particles and characteristic textures that have been previously noted [17,63]. The fly ash observed in the NCFA-8 (0–10 cm) sample ranges from 3 to 50 µm in diameter and appear relatively unaltered at this shallow depth. From energy dispersive X-ray data, the magnetic fly ash spheres are dominated by Fe and O, with typically minor amounts of Al and Si, as well as Ca, Ti, and K in some instances (Figure 5). This composition likely reflects elemental substitutions in magnetite or maghemite [67] and is similar in composition to magnetic fly ash examined from alluvial soils in central Illinois [6].
Non-spherical, natural magnetic particles that were analyzed (from NCFA-8 and pre-settlement alluvium at NCFA-2) have a similar composition to the magnetic fly ash, but with fewer substitutions of Ca. Substitutions of trace elements in magnetite is known to be common [67], although fewer substitutions were noted in a prior study in Illinois [6]. Natural magnetite particles, in many cases, show their octahedral crystal form and alter along planes of crystallographic weakness.

4.4. Magnetic Susceptibility (North Carolina Alluvium)

The mass-normalized magnetic susceptibility (MS) values for the alluvial samples in North Carolina range from 3–90 × 10−8 m3/kg (Figure 4). Generally, the MS values are below 20 × 10−8 m3/kg for sites located within the Triassic Basin, notable NCFA-1, NCFA-6 and NCFA-8. The local sedimentary bedrock, from which much of the alluvium was ultimately derived, also has low MS values. Four sample of Triassic mudstone and sandstone from the study area had MS ranging from 2 to 19 × 10−8 m3/kg.
At some sites, such as NCFA-4, -5, and -7, the MS is higher in the upper 20 to 30 cm and decreases at depth (Figure 4). Because the% fly ash is also high in upper samples from NCFA-4 and NCFA-7, it is likely that increases in near-surface soil MS at these sites are a result of fly ash deposition. Corresponding decreases in XFD values are consistent with high contents of silt-size fly ash in the magnetic fraction. At several other sites, there are few trends in MS with depth.
Frequency dependent magnetic susceptibility values of alluvium ranged from 1% to as high as 13% (at site NCFA-7). The highest XFD values, at any given site, generally occur between 10 and 60 cm depth (Figure 4). High values of XFD implies there is a significant proportion of ultrafine ferrimagnetics (magnetite and maghemite) that was neoformed in the soil [22,64] or, more likely, inherited from erosion of upland soil profiles and resedimentation in valleys.

4.5. Post-1850 Alluvium Thickness (North Carolina–Illinois Comparisons)

Based on the presence of magnetic fly ash, the thickness of post-1850 alluvial sediment at the 8 studied sites in the North Carolina Piedmont (excluding Betty’s milldam) ranges between about 15 and 45 cm. Sampled sites were in small to medium-size river valleys having widths of 55 to 450 m. There is a moderate linear relationship between post-1850 alluvial thickness and valley width, with an R2 value of 0.4 (Figure 6).
Based on a similar study of 17 alluvial sites in the upper Sangamon River Basin, post-settlement (post-1850) alluvium in central Illinois ranges from about 30 to 100 cm thick in valleys between 30 and 800 m wide (Figure 6; [6]). A strong relation between post-1850 alluvial thickness and valley width (R2 = 0.7) was found in this prior study [6]. The reason for this stronger relation to valley width in the Illinois study may be because the surficial material is more uniform (loessal) and all sites were within the same drainage basin, thus minimizing intrinsic geologic factors. Nonetheless, in comparing the same valley widths, the post-1850 alluvium (containing fly ash) in North Carolina is about 60% the thickness of the post-1850 alluvium in Illinois.

4.6. Fly Ash Records in Milldam and Reservoir Lake Sediments

4.6.1. Betty’s Milldam, North Carolina

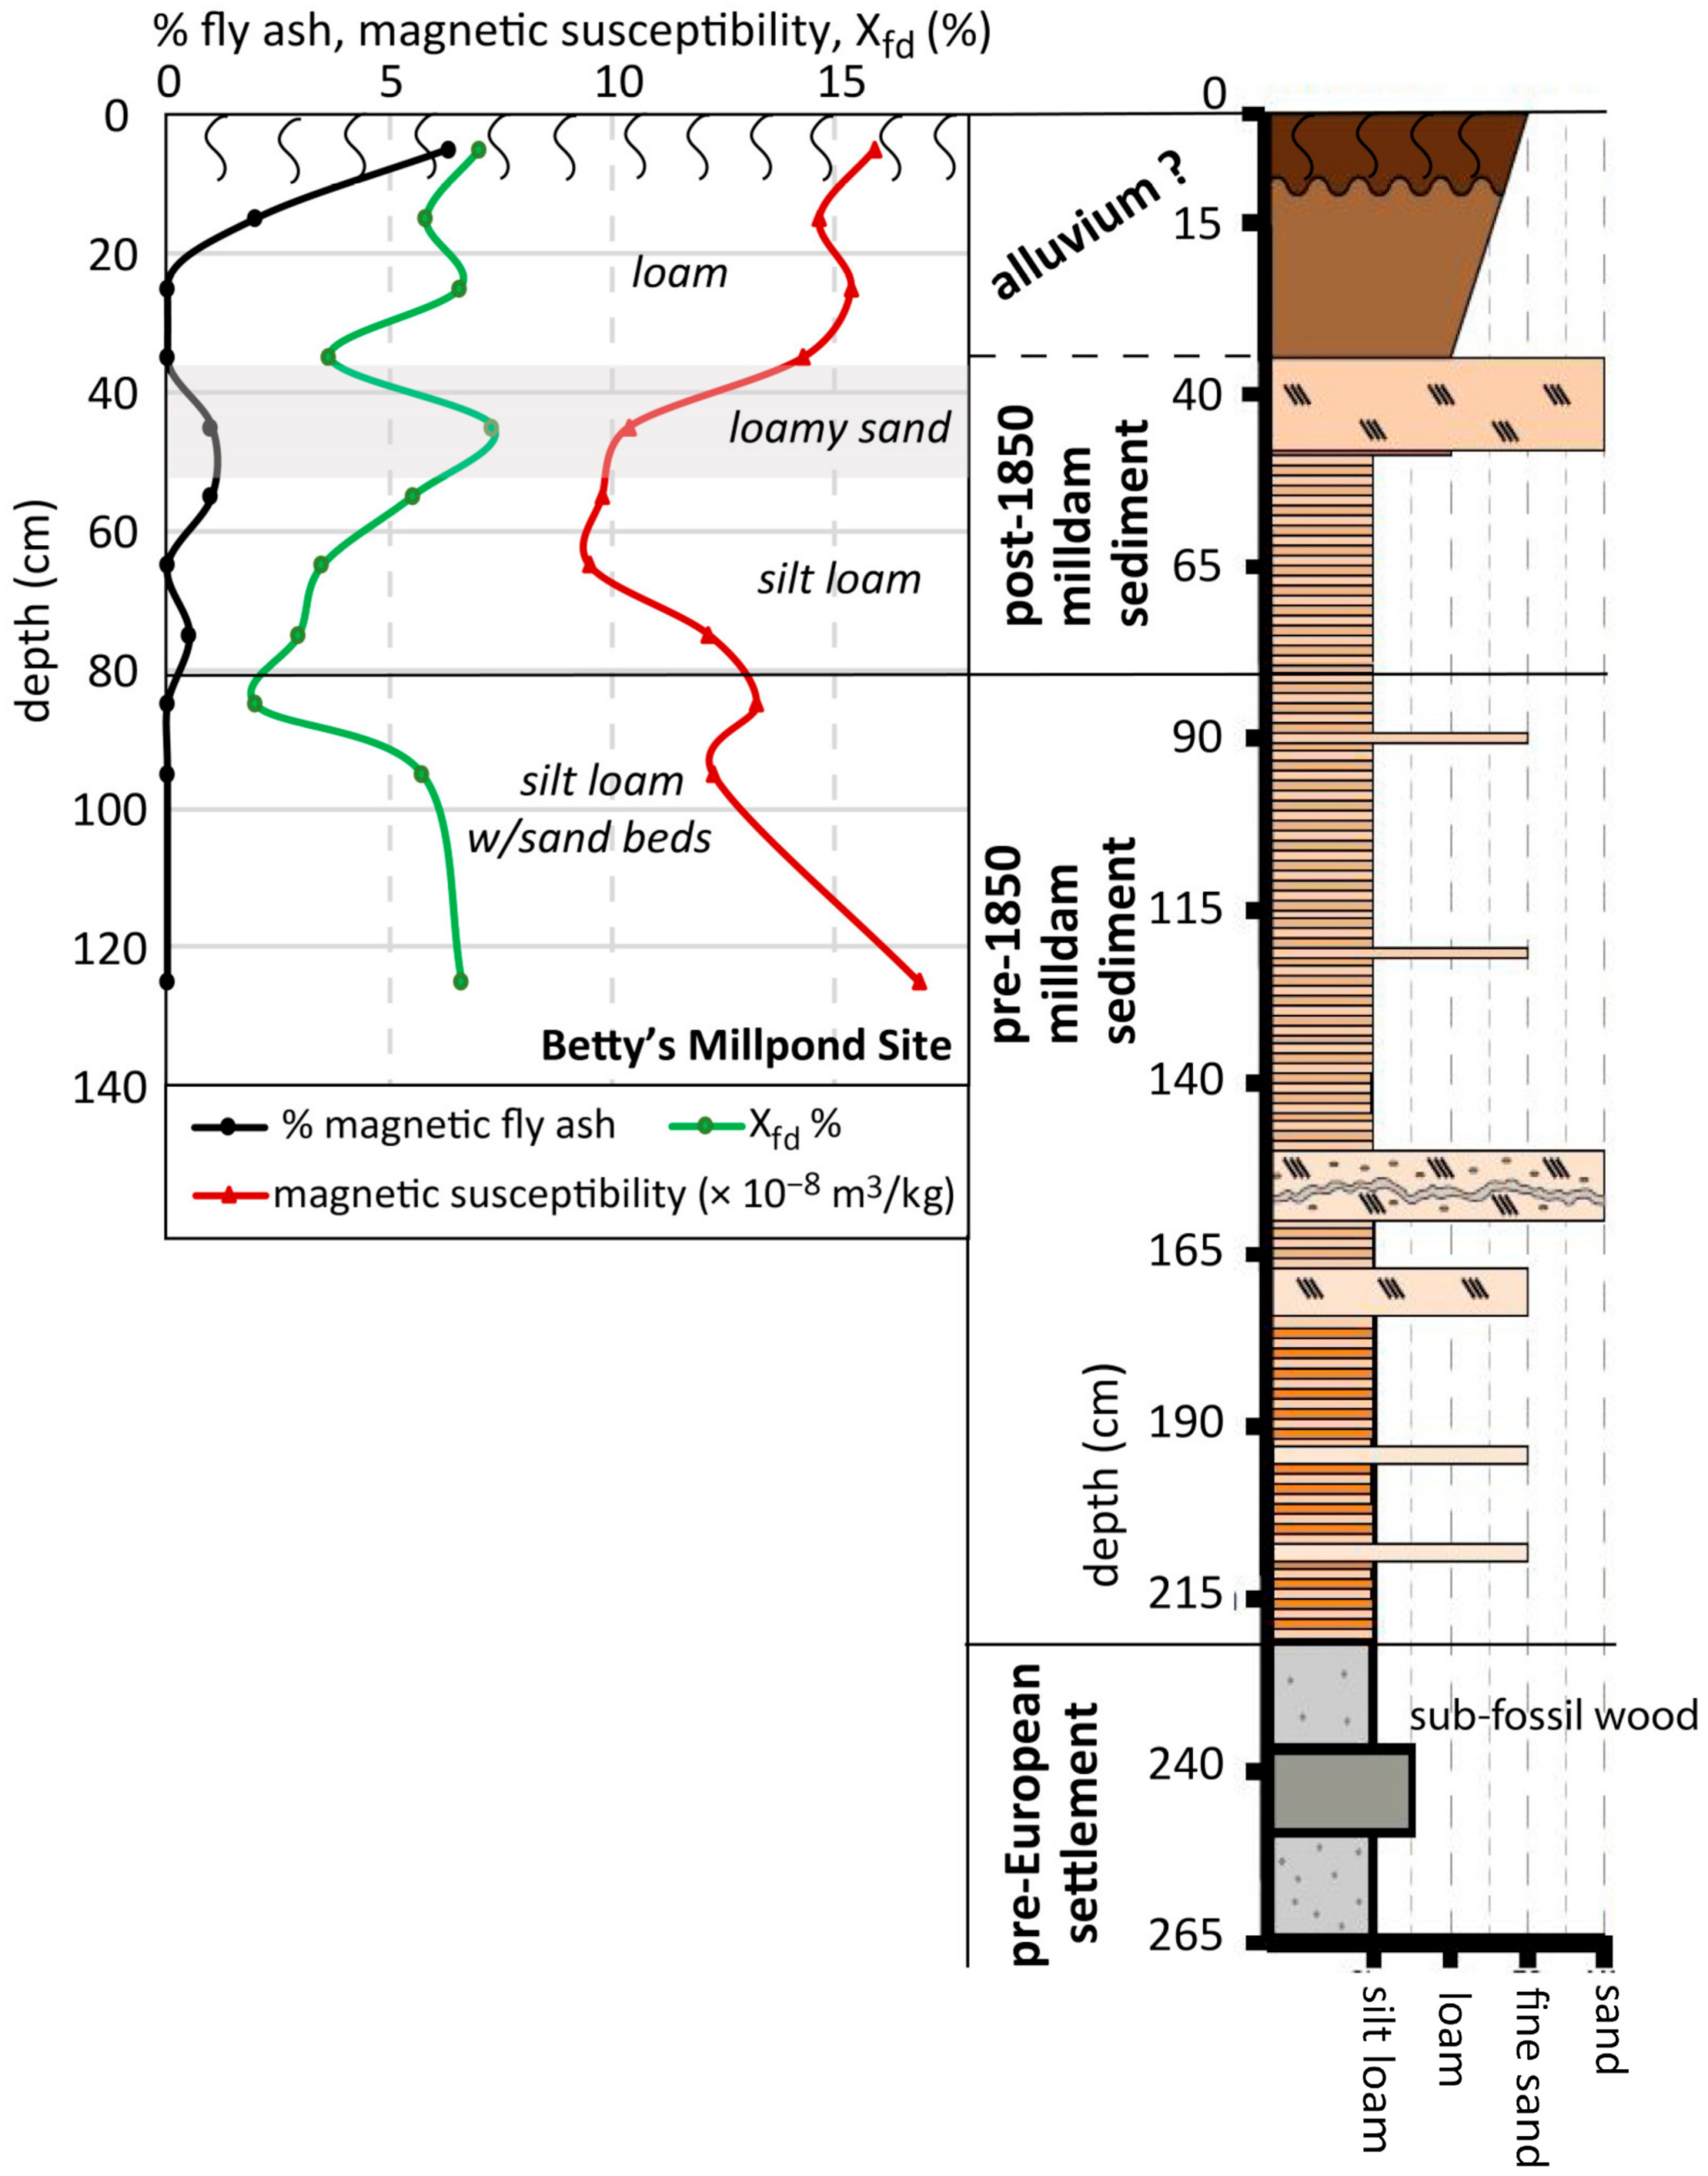
At Betty’s Milldam section (in Umstead Park today), post-1850 alluvium and post-1850 milldam sediment is inferred to be ~80 cm thick based on the occurrence of 1% to 6% of fly ash in magnetic fractions (Figure 7). However, the exact thickness of post-1850 sedimentation is approximate because only rare fly ash grains were found from 30 to 80 cm, and the milldam lake sedimentation was fairly rapid. During the mid-1800s, American locomotives mostly switched their fuel source from wood to coal [58]. Thus, the exact year represented by the oldest fly ash particles in alluvial deposits is somewhat speculative, but was likely in the 1850s. The uppermost 40 cm may represent alluvium deposited after the milldam was breached, but much of the section consists of milldam lake sediments. MS values (9–17 × 10−8 m3/kg) and XFD values (2–7%) are both relatively low, compared with other sites, and do not display a consistent trend. The MS values are slightly lower in the sandy sediments and increase both near surface and at depth.

4.6.2. Lake Decatur, Illinois

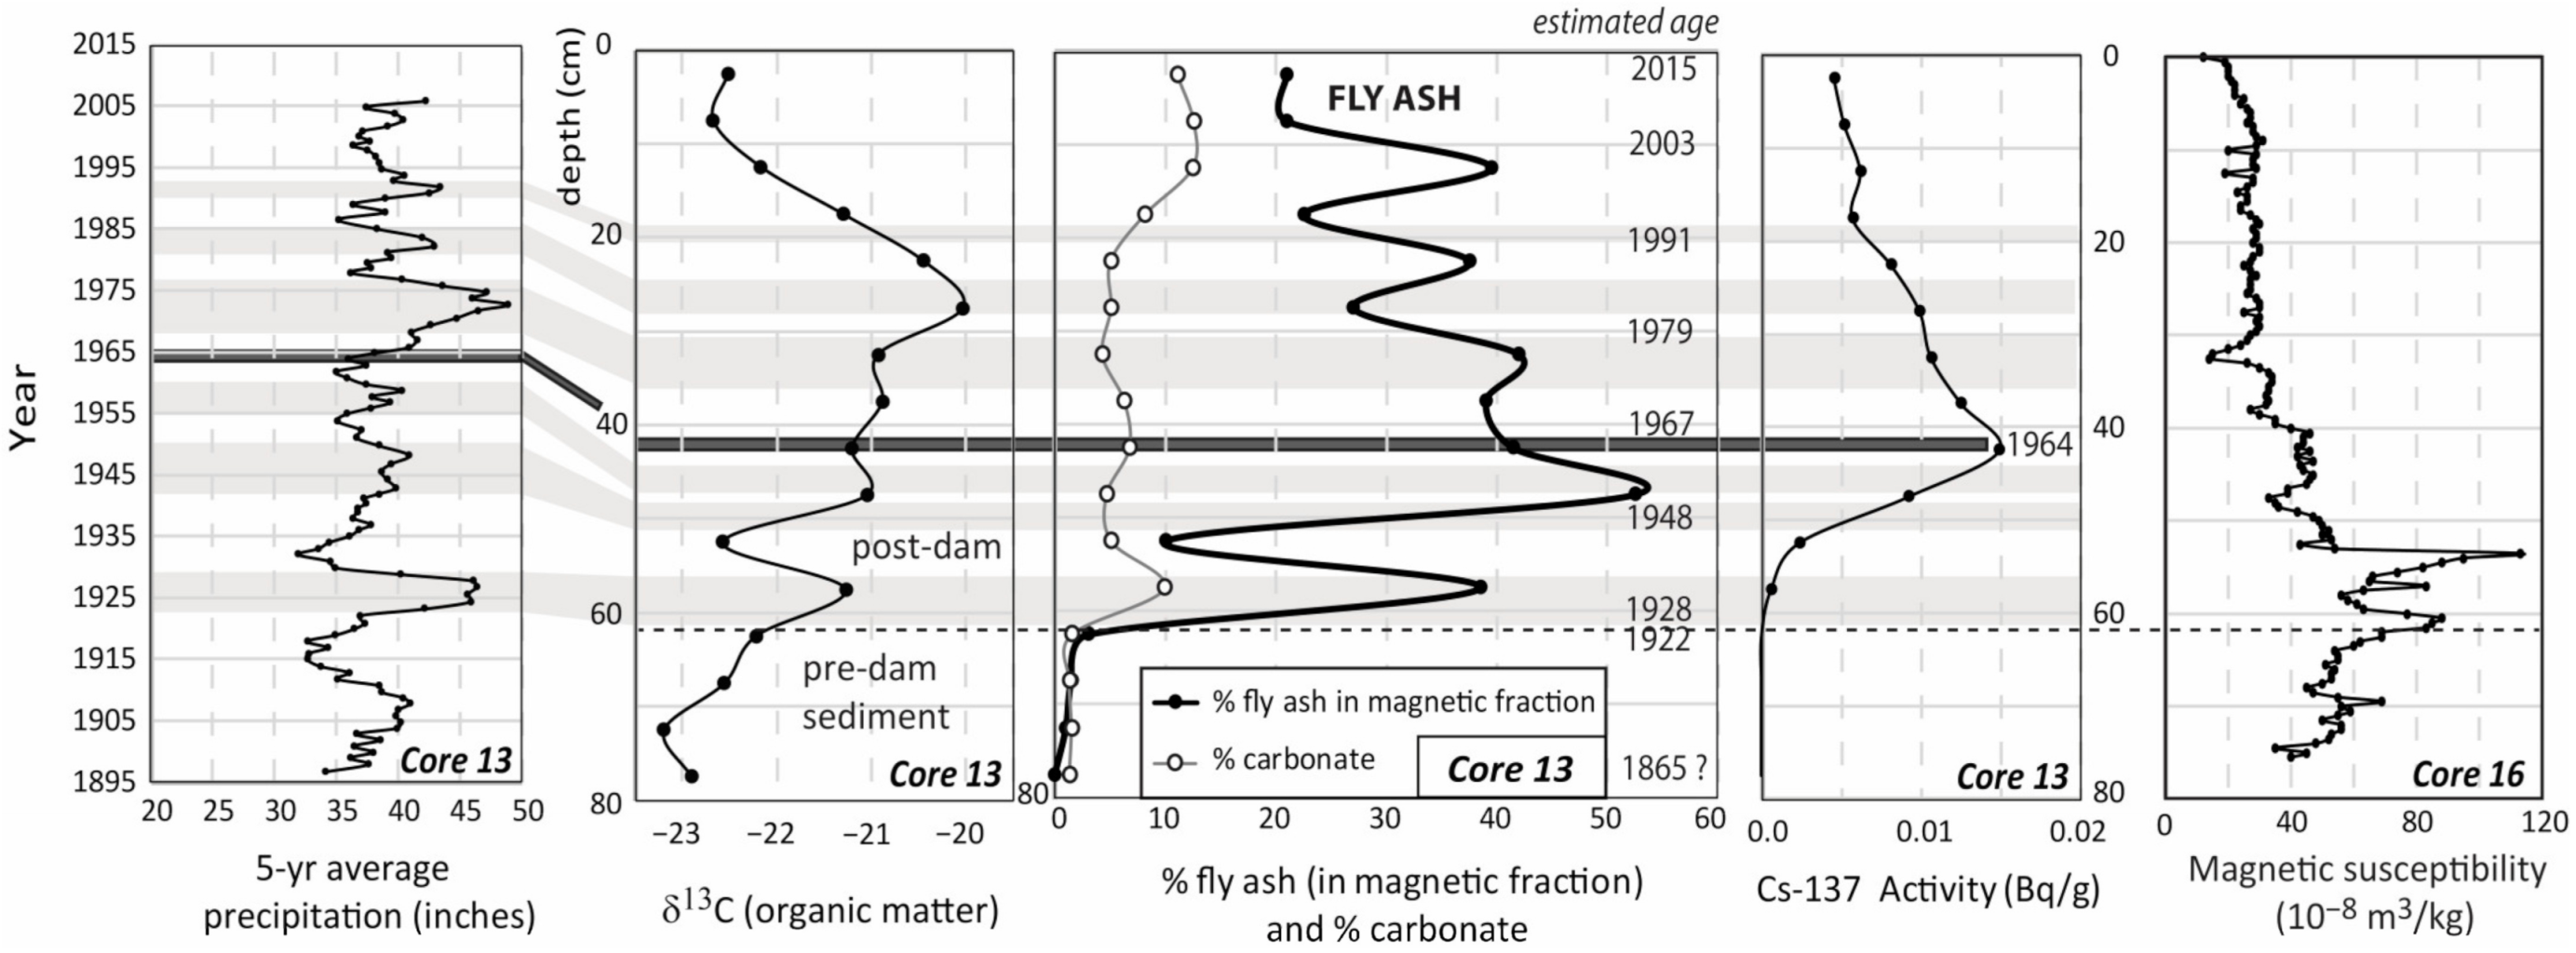
Two cores from Lake Decatur were analyzed for fly ash, δ13C of particulate organic matter (POM), carbonate content, and 137Cs. In Lake Decatur Core 13 (Figure 2), magnetic fly ash is not present below 75 cm (prior to dam construction), and is less than a few percent of the magnetic fraction between 60 and 75 cm depth (Figure 8), perhaps a result of steam locomotive emissions. Based on the sedimentological record, the dam construction is recorded at about 60–65 cm, with lake sediments above and pre-dam Sangamon River floodplain deposits below. The amount of fly ash dramatically increases after 1922, likely a result of increased coal burning in local Decatur power plants (A.E. Staley, Archer Daniels Midland). The proportion of fly ash in the magnetic fraction is highly variable, but remains high (generally above 20%) from 0 to 50 cm depth (Figure 8). A peak in fly ash, at over 50% of the magnetic fraction, was found in lake sediments from the 1950s, ~5 cm below a peak in 137Cs (representing early 1960s), and ~10–15 cm above the 1922 Sangamon River floodplain surface. An overall decrease from the 1960s to 2010s may reflect pollution controls on fly ash emissions; however, the high variability in fly ash content could suggest periodic reworking of mid-20th century sediments with high fly ash contents. A significant peak in magnetic susceptibility occurs at 53 cm depth in Core 16, (a duplicate of Core 13, archived as core IML-DECA15-4A at the National Lacustrine Core Facility at the University of Minnesota; http://lrc.geo.umn.edu/laccore/, archived on 6/23/2015). A 1920s increase in precipitation, POM δ13C, carbonate, and fly ash suggest a relationship of more fly ash with topsoil runoff and synchronous precipitation of carbonate. The carbonate has been identified as calcite rather than dolomite [65], the latter of which is present locally in subsurface glacial sediments [52].
Lake Decatur Core 9 was cored within the infilled Sangamon River channel (Figure 2) and thus contains a thicker sedimentary fill. The pre-dam floodplain or river channels sediments were not reached in the 1.05 m core and all sediments in Core 9 are interpreted as post-1960s as the peak in 137Cs was still not reached at 80 cm depth (Figure 9). Magnetic fly ash proportions are high in the entire core length, consistent with the high fly ash levels in Core 13. Peaks in δ13C match well with peaks in 5 year average rainfall, implying periods of enhanced surface runoff of organic matter sourced from corn in agricultural fields. Peaks in fly ash percentages are nearly opposite the peaks in δ13C but correspond with peaks in carbonate content (Figure 9). A correlation between the carbonate, identified as calcite, and algal lipid concentrations [68] in this core suggests the calcite was biogenically precipitated during times of lower rainfall.

5. Discussion

5.1. Magnetic Fly Ash as a Chronological Tool

Magnetic fly ash has been observed in the uppermost (surficial) samples from every studied locality in central North Carolina and Illinois. At nine North Carolina Piedmont sample sites, magnetic fly ash was identified in the upper 15 to 45 cm of alluvium or lake sediment. These observations were successfully used to identify the base of post-industrial (post-1850) alluvium or milldam sediments. Based on this study and prior work [6,63], the presence of magnetic fly ash in surficial soils and alluvium of the eastern USA is ubiquitous and can be used as a historic chronological marker. Similarly, spheroidal magnetic or carbonaceous fly ash particles have been observed widely in lacustrine and marine sediments worldwide [4,7]. The use of strongly magnetic fly ash particles, rather than spherical carbonaceous fly ash particles (e.g., [4]), can be advantageous in that the methodology is simpler, does not require toxic chemicals or a fume hood, and can be accomplished at a modest cost. However, the carbonaceous fly ash record may slightly differ from magnetic fly ash as it can also be derived from oil combustion and, with lower density, would react differently to transport. Both fly ash methods provide a complement to other methods of dating recent sediment, such as 137Cs and 210Pb. The presence or absence of fly ash enables differentiation of pre-1850 from post-1850 deposits, whereas the isotopic methods are well-suited to 20th century chronologies.
The burning of coal at high temperatures (>1000 °C) in locomotives, steam powered farm equipment, mills, and power plants are the most likely sources of the magnetic fly ash now present in surficial soils, alluvium and lacustrine sediments. The earliest source of fly ash was likely from coal burning locomotives, beginning in the 1850s, but expanding significantly in the 1860s as coal became less expensive and wood supplies decreased [58]. Early locomotives burned wood and the switch from wood to coal was generally later in parts of the American South, where wood was abundant [58]. Fly ash particulate deposition remained low from the mid to late 19th century, as evidenced by higher resolution records from Betty’s Milldam, North Carolina, and Lake Decatur, Illinois. Significant increases in fly ash deposition in the early to mid-20th century correspond with construction of coal-burning power plants; such plants appear to be the main source of fly ash in both study areas (Figure 4, Figure 7, Figure 8, Figure 9).
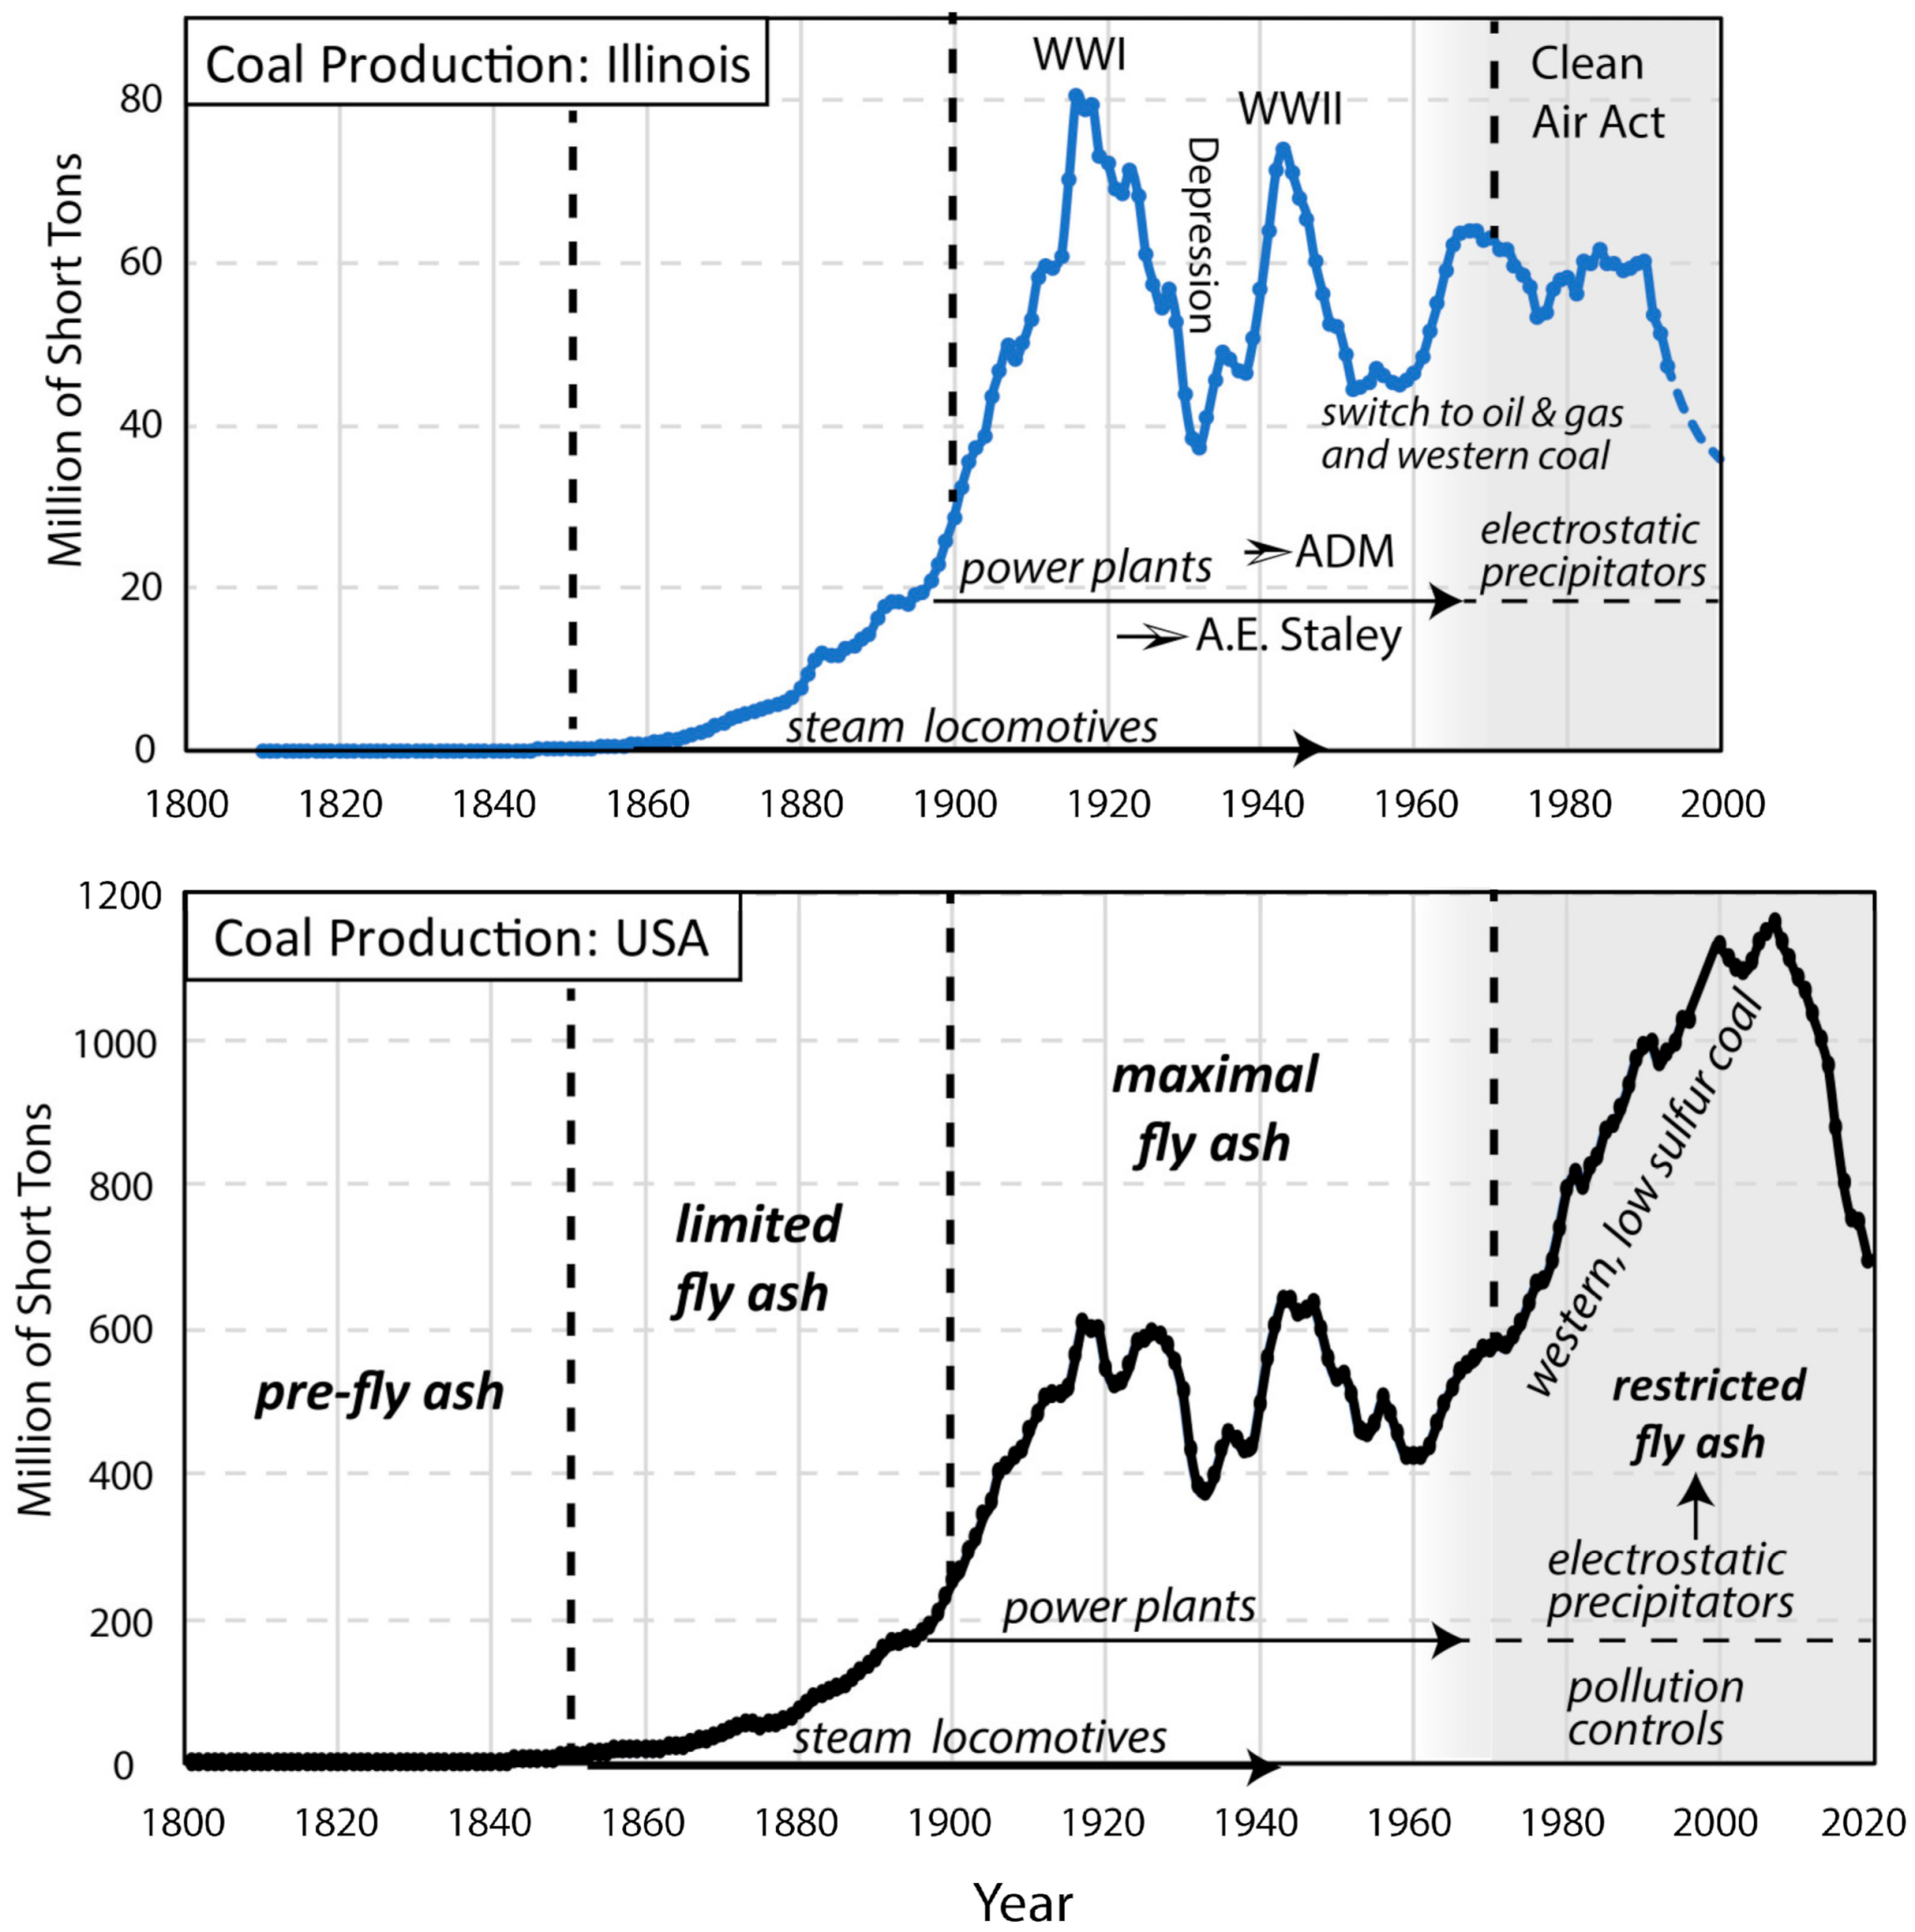
The first significant use of coal in the USA began ~1850, with production increasing dramatically after 1900 and peaking in 1916–1925 (Figure 10). Coal production decreased substantially during the Great Depression and peaked a second time during the 1940s. This second increase in coal use was led by power plant and industrial usage [47], rather than locomotives, which were converting to diesel fuel sources. Coal use decreased in the 1950s as oil and gas production increased, but increased a third time as national energy use accelerated. After the Clean Air Act of 1970, particulate emission standards required electrostatic precipitators in power plants by 1975. In many areas, the use of precipitators began in the 1960s [8]. Thus, atmospheric deposition of fly ash in soils substantially decreased post-1970, even as coal use in power plants increased in the 1970s and 1980s. In the past decade (after 2008; Figure 10), many coal-burning power plants have switched to natural gas or have been retired. Although the emission of magnetic fly ash particles from coal burning continues to decrease, fly ash still remains in the environment and continues to be resedimented from uplands to lowlands. Notably, the failure of fly ash storage complexes can release fly ash slurries into watersheds and thus become mixed into 21st century sediment records [11,69,70].

5.2. Controls on Sedimentation and Preservation of Magnetic Fly Ash in Alluvial Records

Magnetic fly ash can be transported into the geologic record directly through aeolian processes or stepwise, with erosion of upland soils, and resedimentation into floodplains, lakes, or marine environments. Examples of factors that can control the size and quantity of fly ash at a given site include the distance from power plants or other coal burning sources (railroads, mills), the cumulative amount of fly ash released, smokestack height, type of coal burned, temperature of coal burning, and, importantly, the use of particulate pollution controls. Observations of large fly ash particles, 90–125 µm in size, were limited and were all from sites within a few km of a coal burning power plant. Stratigraphic changes in the magnetic fly ash size and quantity in a given sample can be controlled by temporal changes in coal burning sources, fluvial or lacustrine sorting processes, dilution by other sediment sources, and post-depositional alteration of magnetite in poorly drained soils [63]. The proportion of magnetic fly ash is reported as a percent of the magnetic fraction, and thus can be affected by the geologic setting. High percentages of fly ash tends to occur in watersheds with low MS soil parent materials (e.g., carbonates and quartz-dominated sediments); lower percentages of fly ash tends to occur in watersheds with high MS parent materials (e.g., mafic igneous rocks; [72]) because of dilution. Thus, the highest proportion of magnetic fly ash is found at sites near power plants and with a low MS of local sediment. Because magnetic fly ash has low values of XFD [15,24], samples with high fly ash content in surficial samples, such as at sites NCFA-7 and NCFA-4, generally have low XFD values (Figure 4). Although the magnetite content of local soils and bedrock may affect the proportion of magnetic fly ash, it will not affect determinations of post-1850 sediment thicknesses.

5.3. Comparisons of Post-Settlement Alluvium Thickness in Central North Carolina and Illinois

Our findings have shown that post-1850 alluvium in the North Carolina Piedmont study is about 60% of the thickness of such deposits in central Illinois for the same valley width (Figure 6). Several factors could cause these differences, both in relation to erosion rates and sedimentation rates. The Universal Soil Loss Equation [73] highlights the factors that control erosion rates: (1) rainfall amounts, (2) slope steepness and length, (3) soil erodibility (texture and organic matter), (4) vegetation, and (5) land use practices. Given that rainfall amounts and slope gradients are greater in North Carolina than central Illinois, the first two factors cannot explain the alluvial thickness difference. Rather, slower alluvial sedimentation rates in the North Carolina study area likely reflect differences in upland soil erodibility and/or land use (agriculture).
Surface soils in central Illinois are dominantly silt loam in upland areas because of a 1.5 m draping of silt-rich loess deposits across the landscape [52,74]. In contrast, central North Carolina soils [36] may have an uppermost thin layer of silt loam to sandy loam, but below 0.3 m are typically silty clay, clay or silty clay loam. In some areas, crystalline or sedimentary bedrock, or saprolite occurs within 1 to 2 m of the surface. In most areas, weathering profiles are deeper and the residual soils or saprolite are generally clayey and stiff. Thus, beyond small areas of Pleistocene terraces [35], the North Carolina Piedmont is widely covered by clay-rich soils that are generally less erodible than the loess-covered landscapes of the central USA. For example, silty clay soils can have erosion rate that is >30% slower than for silt-rich surface soils [73]. Clayey soils are less erodible because the particles are more resistant to detachment. In contrast, the more silty soils in Illinois provide less cohesion and greater erodibility, despite the low-relief terrain.
Another significant factor to upland erosion rates is land use. The first European settlements in Chatham County were in the mid-1700s [36], with a population density of 1–5 people per km2 in central North Carolina in 1790 [40]. By the late 19th century, agricultural land consisted of ~20% to 40% of the landscape [40] and population densities increased to 10–30 people per km2. The percentage of land in agriculture did not change significantly from 1850 to 1940. Since the mid-20th century, many agricultural lands have been reforested or suburbanized and several artificial reservoirs have been constructed. A decrease in agricultural land has thus occurred. In contrast, agricultural farmland in central Illinois expanded rapidly from 1850 to 1900, to >80% of the land. This farmland has largely remained intact without much change in land use over the past 120 years. Thus, the period of fly ash sedimentation (late 19th century to mid-20th century) was a period of continuous and expansive agriculture in central Illinois compared with partial and discontinuous agricultural coverage in central North Carolina. The difference in land use coverage and history, in addition to soil texture properties, can help to explain thinner deposits of post-1850 alluvial sediment in North Carolina. Sedimentation rates in alluvial settings are also affected by valley width and valley gradients [25]. Thus, the thickness of post-1850 alluvial sediments may have a complex relationship that includes the erosion rates in the drainage basin (land use, soil properties, relief), valley widths, stream gradient and stream power.
Alluvial deposition in the North Carolina Piedmont during European settlement prior to 1850 cannot be directly evaluated by fly ash, but subsurface zones with high XFD% (as high as 13%) are suggestive of significant erosion of uplands as a result of initial land clearing by European settlers in the late 18th and 19th centuries. Relatively high values of XFD (particularly at NCFA-4, -5, -7, and -8) may reflect the neoformation of ultrafine magnetite and magnetite in upper soil sola [21,22,23]. Consequently, periods with accelerated topsoil erosion on uplands may be recorded in alluvial records as zones of enhanced MS and XFD, as was previously noted in the Sangamon River valley of Illinois [6]. At the North Carolina alluvial sites, this zone is typically in the 20 to 110 cm depth range and is typically more reddish brown (7.5YR hue) than the surficial, fly ash-bearing layer (<45 cm depth). It also tends to be finer-grained than the underlying pre-settlement alluvium. The thicknesses of legacy sediment in a northern Virginia Piedmont stream valley, of comparable size to the studied valleys, ranges from 90 to 170 cm [28].
The timing of industrialization and broadscale agriculture clearing was generally in phase in central Illinois, and the Midwestern USA in general, but was offset by a century or more in North Carolina. Central North Carolina was mainly settled by Europeans in mid 1700s, with milldams and large-scale agricultural clearing beginning in the late 1700s. The period from 1750–1850 was an early phase of accelerated sedimentation in floodplains of the southeastern USA [29], but lacks fly ash until early steam locomotives arrived in the 1850s.

5.4. Fly Ash Records in Milldam and Reservoir Lacustrine Sediments

Records of magnetic fly ash in milldam and reservoir sediment are useful in confirming the application of fly ash as a chronological tool and in providing higher resolution sequences of anthropogenic influences on the landscape. Technogenic particles in the stratigraphic record provide a documentation of the effects of land-use changes on sedimentation rates, change in particulate pollution, and can help to trace sediment sources. More rapid sedimentation in anthropogenic lakes, compared with floodplain sediments, allow for more detailed comparisons with decadal-scale changes precipitation, environmental regulation impacts, and watershed-scale processes.
Consistent with these estimations, two radiocarbon ages on charcoal in pre-milldam legacy sediments and milldam sediments from a nearby section are 205 ± 15 and 140 ± 15 14C yr B.P., respectively [27]. When the ages are calibrated with Calib 8.20 [75], the resulting median probability ages are 1775 CE and 1841 CE. With both age determinations below the level of fly ash sampling, the data seem consistent with the earliest fly ash particles representing ~1850 at 80 cm depth in the section.
Betty’s Milldam provides a proof of concept test of the fly ash chronology, in that the timing of the milldam deposits are fairly well constrained. As the milldam was built in the late 18th century and was abandoned prior to an 1865 survey [38], it would be expected that little fly ash would be present in the milldam sediments, except in upper portions. The lack of fly ash between 0.8 and 2.2 m depth corroborates that the milldam sediments are mainly pre-1850. Rare magnetic fly ash particles between 20 and 80 cm depth are probably a result of early steam (coal-burning) locomotives of the 1850s and 1860s.
In the Lake Decatur sediment records, a complex variability in fly ash proportion is found from 1922 (when lake formed) to the present day (Figure 8). Prior to 1922, small amounts of fly ash are present which likely were derived from steam locomotives or steam powered farm equipment from the late 19th century and early 20th century. A sharp increase in fly ash after 1922 corresponds with the construction of A.E. Staley and ADM plants in close proximity to the lake in 1922 and 1939, respectively [59]. From the 1920–1960s, peaks in fly ash correspond with higher values of δ13C, representing more organic matter derived from agricultural corn, a C4 plant [61]; thus, reflecting more topsoil erosion in the watershed. After the 1960s, peaks in magnetic fly ash correlate well with peaks in calcite, yet the exact origin of this correlation is not well understood. During the late 20th century, we infer that the fly ash in lake sediments was sourced from subaqueous flows in upper Lake Decatur or derived from resedimentation of preexisting alluvial sediments within the watershed. It is suspected that, post-1960s, most fly ash did not originate from agricultural fields as there is an inverse relationship with POM δ13C (Figure 9). Increased values of POM δ13C reflect inputs from agricultural corn during periods of higher rainfall. Thus, fly ash sedimentation may have been diluted by field erosion inputs during wet periods, in contrast to processes operating before 1960. It is also possible that periodic dredging in upper Lake Decatur may have complicated the record. Lastly, with two Decatur power plants <3 km from the drill sites (ADM plant <1 km from lake), post-1960s changes in fly ash release or erosion from fly ash storage complexes cannot be ruled out. In sum, the Lake Decatur core records confirm that magnetic fly ash is a reliable indicator of post-settlement sedimentation (post-1850), but with most fly ash deposition occurring after 1900 in central Illinois. Variations in the proportion of magnetic fly ash post-1960s are not fully resolved, but appear to be controlled by a different process than in the early 1900s, when increases fly ash content were in phase with periods of greater topsoil erosion and heavier rainfall.

6. Conclusions

The use of magnetic fly ash is here shown to be a simple and effective method for identifying the thickness, and sediment accumulation rate, of post-1850 alluvial or lacustrine deposits. This methodology can help to provide context to research associated with land-use change, ecological change [37], atmospheric pollution, accelerated soil erosion, archeological sites, and sediment provenance. Magnetic fly ash was found at every site, consisting of 5% to 60% of the silt-size magnetic fraction. The fly ash ranges in size from 3 to 125 µm, is likely magnetite or maghemite in composition, with typical substitutions of Si, Al, Ti, and K. Based on fly ash identifications, post-1850 alluvial deposits in central North Carolina are about 60% the thickness of those in central Illinois for the same valley width. We interpret this as a reflection of relatively less upland soil erosion in North Carolina during this time period because of less expansive agriculture and more clay-rich soil types, compared with the silty loessal soils of Illinois. Higher resolution records of anthropogenic change are recorded in milldam and reservoir lake deposits. Milldam deposits in the eastern USA mainly predate the release of fly ash particles. Reservoirs, such as Lake Decatur, provide sediment records which can capture the decadal-scale history of watershed-scale processes and climate change, along with the effects of environmental regulations on particulate emissions.

Supplementary Materials

The following are available online at https://www.mdpi.com/article/10.3390/min11050476/s1, Table S1. NC Fly Ash Site Field Descriptions.

Author Contributions

Conceptualization, D.A.G.; data curation, D.A.G. and N.E.B.; formal analysis, A.S.L. and C.W.B.; funding acquisition, D.A.G. and N.E.B.; investigation, A.S.L., C.W.B. and N.E.B.; methodology, D.A.G., A.S.L. and C.W.B.; project administration, D.A.G. and N.E.B.; supervision, D.A.G. and N.E.B.; writing—original draft, D.A.G.; writing—review and editing, D.A.G., A.S.L., C.W.B. and N.E.B. All authors have read and agreed to the published version of the manuscript.

Funding

Financial support for the Illinois portion of this study was provided by the US National Science Foundation (NSF) Grant # EAR-1331906 for the Critical Zone Observatory for Intensively Managed Landscapes (IML-CZO).

Data Availability Statement

Core 16 (IML-DECA15-4A-1V-1-A) is archived at the National Lacustrine Core Facility at the University of Minnesota; http://lrc.geo.umn.edu/laccore/, accessed on 30 April 2021. The LacCore data are available at https://opencoredata.org/search.html?q=IML-DECA15-4A, accessed on 30 April 2021. The Lake Decatur core data is also available at https://data.imlczo.org/clowder/datasets/5bd31d9c4f0c57b7e9b06256, accessed on 30 April 2021.

Acknowledgments

Phil Bradley (North Carolina Geological Survey) provided helpful discussions related to the bedrock geology in the North Carolina Piedmont. We also appreciate discussions with Karl Wegmann and Ethan Hyland (North Carolina State University) related to Betty’s Milldam history and alluvial sediment records in central North Carolina. Thanks to William S. Grimley for helping to sample NCFA-6 and to Franklin O. Wegmann for helping to sample Betty’s Milldam site. Phillips Strader (Analytical Instrumentation Facility, North Carolina State University) assisted with Scanning Electron Microscope images and spectroscopy.

Conflicts of Interest

The authors declare no conflict of interest.

References

  1. Jones, R.L.; Olson, K.R. Fly ash as a time marker in sedimentation studies. Soil Sci. Soc. Am. J. 1990, 54, 855–859. [Google Scholar] [CrossRef]
  2. Hussain, I.; Olson, K.R.; Jones, R.L. Erosion patterns on cultivated and uncultivated hillslopes determined by soil fly ash contents. Soil Sci. 1998, 163, 726–738. [Google Scholar] [CrossRef]
  3. Rose, N.L. Fly Ash Particles. In Tracking Environmental Change Using Lake Sediments: Volume 2: Physical and Geochemical Methods; Last, W.M., Smol, J.P., Eds.; Kluwer: Dordrecht, The Netherlands, 2001; pp. 319–349. [Google Scholar]
  4. Rose, N.L. Spheroidal carbonaceous fly ash particles provide a globally synchronous stratigraphic marker for the Anthropocene. Environ. Sci. Technol. 2015, 49, 4155–4162. [Google Scholar] [CrossRef] [PubMed]
  5. Olson, K.R.; Gennadiyev, A.N.; Golosov, V.N. Comparison of fly-ash and radio-cesium tracer methods to assess soil erosion and deposition in Illinois landscapes (USA). Soil Sci. 2008, 173, 575–586. [Google Scholar] [CrossRef]
  6. Grimley, D.A.; Anders, A.M.; Bettis, E.A., III; Bates, B.L.; Wang, J.J.; Butler, S.K.; Huot, S. Using magnetic fly ash to identify post-settlement alluvium and its record of atmospheric pollution, central USA. Anthropocene 2017, 17, 84–98. [Google Scholar] [CrossRef]
  7. Locke, F.; Bertine, K.K. Magnetite in sediments as an indicator of coal combustion. Appl. Geochem. 1986, 1, 345–356. [Google Scholar] [CrossRef]
  8. Patrick, R.; Binetti, V.P.; Halterman, S.G. Acid lakes from natural and anthropogenic causes. Science 1981, 211, 446–448. [Google Scholar] [CrossRef]
  9. U.S. Energy Information Administration. 2021. Available online: https://www.eia.gov/coal/data/browser/ (accessed on 17 March 2021).
  10. Cahoon, K.M. Spheroidal Carbonaceous Particles in a Virginia Mill Pond Provide a Record of Local and Regional Coal Combustion. Undergraduate Honors Thesis, The College of William and Mary, Williamsburg, VA, USA, May 2019; 53p. Available online: https://scholarworks.wm.edu/honorstheses/1408 (accessed on 1 March 2021).
  11. Cowan, E.A.; Seramur, K.C.; Hageman, S.J. Magnetic susceptibility measurements to detect coal fly ash from the Kingston Tennessee spill in Watts Bar Reservoir. Environ. Pollut. 2013, 174, 179–188. [Google Scholar] [CrossRef] [Green Version]
  12. Harkness, J.S.; Sulkin, B.; Vengosh, A. Evidence for coal ash ponds leaking in the southeastern United States. Environ. Sci. Technol. 2016, 50, 583–6592. [Google Scholar] [CrossRef]
  13. Brandt, J.E.; Bernhardt, E.S.; Dwyer, G.S.; Di Giulio, R.T. Selenium ecotoxicology in freshwater lakes receiving coal combustion residual effluents: A North Carolina example. Environ. Sci. Technol. 2017, 51, 2418–2426. [Google Scholar] [CrossRef]
  14. Sarkar, A.; Rano, R.; Mishra, K.K.; Sinha, I.N. Particle size distribution profile of some Indian fly ash—a comparative study to assess their possible uses. Fuel Process. Technol. 2005, 86, 1221–1238. [Google Scholar] [CrossRef]
  15. Kapicka, A.; Jordanova, N.; Petrovsky, E.; Ustjak, S. Effect of different soil conditions on magnetic parameters of power-plant fly ashes. J. Appl. Geophys. 2001, 48, 93–102. [Google Scholar] [CrossRef]
  16. Oldfield, F.; Gedye, S.A.; Hunt, A.; Jones, J.M.; Jones, M.D.; Richardson, N. The magnetic record of inorganic fly ash deposition in lake sediments and ombrotrophic peats. Holocene 2015, 25, 215–225. [Google Scholar] [CrossRef]
  17. Magiera, T.; Jabłońska, M.; Strzyszcz, Z.; Rachwal, M. Morphological and mineralogical forms of technogenic magnetic particles in industrial dusts. Atmos. Environ. 2011, 45, 4281–4290. [Google Scholar] [CrossRef]
  18. Flanders, P.J. Collection, measurements and analysis of airborne magnetic particulates from pollution in the environment. J. Appl. Phys. 1994, 75, 5931–5936. [Google Scholar] [CrossRef]
  19. Kapicka, A.; Petrovsky, E.; Ustjak, S.; Machachova, K. Proxy mapping of fly-ash pollution of soils around a coal-burning power plant: A case study in the Czech Republic. J. Geochem. Explor. 1999, 66, 291–297. [Google Scholar] [CrossRef]
  20. Chudaničová, M.; Hutchinson, S.M.; Hradecký, J.; Sedláček, J. Environmental magnetism as a dating proxy for recent overbank sediments of (peri-) industrial regions in the Czech Republic and UK. Catena 2016, 142, 21–35. [Google Scholar] [CrossRef]
  21. Hanesch, M.; Scholger, R. The influence of soil type on the magnetic susceptibility measured throughout soil profiles. Geophys. J. Int. 2005, 161, 50–56. [Google Scholar] [CrossRef] [Green Version]
  22. Blundell, A.; Dearing, J.A.; Boyle, J.F.; Hannam, J.A. Controlling factors for the spatial variability of soil magnetic susceptibility across England and Wales. Earth-Sci. Rev. 2009, 95, 158–188. [Google Scholar] [CrossRef] [Green Version]
  23. Dearing, J.A.; Bird, P.M.; Dann, R.J.L.; Benjamin, S.F. Secondary ferrimagnetic minerals in Welsh soils: A comparison of mineral magnetic detection methods and implications for mineral formation. Geophys. J. Int. 1997, 130, 727–736. [Google Scholar] [CrossRef] [Green Version]
  24. Hay, K.L.; Dearing, J.A.; Baban, S.M.J.; Loveland, P.J. A preliminary attempt to identify atmospherically-derived pollution particles in English topsoils from magnetic susceptibility measurements. Phys. Chem. Earth 1997, 22, 207–210. [Google Scholar] [CrossRef]
  25. Magilligan, F.J. Historical floodplain sedimentation in the Galena River Basin, Wisconsin and Illinois. Ann. Assoc. Am. Geogr. 1985, 75, 583–594. [Google Scholar] [CrossRef]
  26. Walter, R.C.; Merritts, D.J. Natural streams and the legacy of water-powered mills. Science 2008, 319, 299–304. [Google Scholar] [CrossRef] [PubMed] [Green Version]
  27. Wegmann, K.W.; Lewis, R.Q.; Hunt, M.C. Historic mill ponds and piedmont stream water quality: Making the connection near Raleigh, North Carolina. In From the Blue Ridge to the Coastal Plain: Field Excursions in the Southeastern United States: Geological Society of America Field Guide 29; Eppes, M.C., Bartholomew, M.J., Eds.; Geological Society of America: Boulder, CO, USA, 2012; pp. 93–121. [Google Scholar]
  28. Hupp, C.R.; Noe, G.B.; Schenk, E.R.; Benthem, A.J. Recent and historic sediment dynamics along Difficult Run, a suburban Virginia Piedmont stream. Geomorphology 2013, 180, 156–169. [Google Scholar] [CrossRef]
  29. Trimble, S.W. Man-Induced Soil Erosion of the Southern Piedmont, 1700–1970; Soil Conservation Society of America: Ankeny, IA, USA, 1974; 180p. [Google Scholar]
  30. Reusser, L.; Bierman, P.; Rood, D. Quantifying human impacts on rates of erosion and sediment transport at a landscape scale. Geology 2015, 43, 171–174. [Google Scholar] [CrossRef]
  31. James, L.A. Impacts of pre-vs. postcolonial land use on floodplain sedimentation in temperate North America. Geomorphology 2019, 331, 59–77. [Google Scholar] [CrossRef]
  32. Lyons, N.J.; Starek, M.J.; Wegmann, K.W.; Mitasova, H. Bank erosion of legacy sediment at the transition from vertical to lateral stream incision. Earth Surf. Process. Landf. 2015, 40, 1764–1778. [Google Scholar] [CrossRef]
  33. Clark, T.W.; Gore, P.J.; Watson, M.E. Depositional and structural framework of the Deep River Triassic basin, North Carolina. In Field Trip Guidebook for the 50th Annual Meeting of the Southeastern Section, Geological Society of America, Raleigh, North Carolina; Hoffman, C.W., Ed.; North Carolina Geological Survey: Raleigh, NC, USA, 2001; pp. 27–50. [Google Scholar]
  34. Rice, A.K.; Bradley, P.J.; Grimley, D.A.; Blocher, W.B. Geologic Map of the Goldston 7.5-Minute Quadrangle, Chatham, Lee and Moore Counties, North Carolina, North Carolina Geological Survey Open File Report 2020-06; North Carolina Geological Survey: Raleigh, NC, USA, 2020.
  35. Bradley, P.J.; Rice, A.K.; Grimley, D.A.; Blocher, W.B. Geologic Map of the Colon 7.5-Minute Quadrangle, Lee and Chatham Counties, North Carolina, North Carolina Geological Survey Open File Report 2020-04; North Carolina Geological Survey: Raleigh, NC, USA, 2020.
  36. Hayes, R.D. Soil Survey of Chatham County, North Carolina; U.S. Department of Agriculture, Natural Resources Conservation Service and North Carolina Department of Environment and Natural Resources: Raleigh, NC, USA, 2006; 673p.
  37. Cardenal, E.C. Exploring the Effects of Rapid Land Use Changes on the Piedmont Landscape Using Plant Microfossils and Legacy Sediment. Master’s Thesis, North Carolina State University, Raleigh, NC, USA, 2020; 164p. [Google Scholar]
  38. Bevers, F. Map of Wake County: Raleigh (North Carolina), Nichols & Gorman. 1871. Available online: https://dc.lib.unc.edu/cdm/ref/collection/ncmaps/id/241 (accessed on 15 February 2021).
  39. Burdick, A.W. Paleoecological Phytolith Investigation of Anthropogenic Vegetation Change in Umstead State Park, North Carolina. Bachelor’s Thesis, Carleton College, Northfield, MN, USA, May 2018; 48p. [Google Scholar]
  40. Waisanen, P.J.; Bliss, N.B. Changes in population and agricultural land in conterminous United States counties, 1790 to 1997. Glob. Biogeochem. Cycles 2002, 16, 84-1–84-19. [Google Scholar] [CrossRef]
  41. ESRI. USA Railroads Feature Service Dataset, ESRI and Federal Railroad Administration. Available online: https://services.arcgis.com/P3ePLMYs2RVChkJx/arcgis/rest/services/USA_Railroads_1/FeatureServer (accessed on 16 March 2021).
  42. North Carolina Geological Survey. Geologic Map of North Carolina; General Geologic Map, scale 1:500,000; North Carolina Geological Survey: Raleigh, NC, USA, 1985.
  43. Reinemund, J.A. Geology of the Deep River Coal Field, North Carolina: U.S. Geological Survey Professional Paper 246; US Government Printing Office: Washington, DC, USA, 1955; 159p.
  44. Doggett, J. Railroads in Virginia and Part of North Carolina, Drawn and Engraved for Doggett’s Railroad Guide and Gazetteer; Library of Congress Geography and Map Division: Washington, DC, USA, 1848. Available online: http://hdl.loc.gov/loc.gmd/g3881p.rr003080 (accessed on 15 February 2021).
  45. Duke Energy. 2021. Available online: https://www.duke-energy.com/Our-Company/About-Us/Power-Plants/Cape-Fear-Plant (accessed on 15 February 2021).
  46. Global Energy Monitor. 2021. Available online: https://www.gem.wiki/University_of_North_Carolina_Cogeneration_Facility#cite_note-cogen-3 (accessed on 17 February 2021).
  47. Harrison, C. The historical–geographical construction of power: Electricity in Eastern North Carolina. Local Environ. 2013, 18, 469–486. [Google Scholar] [CrossRef]
  48. Grimley, D.A.; Anders, A.M.; Stumpf, A.J. Quaternary geology of the Upper Sangamon River Basin: Glacial, postglacial, and postsettlement history. In 1967–2016—Celebrating 50 Years of Geoscience in the Mid-Continent: Guidebook for the 50th Annual Meeting of the Geological Society of America–North-Central Section: Guidebook 43; Lasemi, Z., Elrick, S.D., Eds.; Illinois State Geological Survey: Champaign, IL, USA, 2016; pp. 55–96. [Google Scholar]
  49. Curry, B.B.; Lowell, T.V.; Wang, H.; Anderson, A.C. Revised time-distance diagram for the Lake Michigan Lobe, Michigan Subepisode, Wisconsin Episode, Illinois, USA. In Quaternary Glaciation of the Great Lakes Region: Process, Landforms, Sediments, and Chronology; Geological Society of America Special Paper 530; Geological Society of America: Boulder, CO, USA, 2018; pp. 69–101. [Google Scholar]
  50. Lineback, J.A. Quaternary Deposits of Illinois; 1:500,000 scale; Illinois State Geological Survey: Champaign, IL, USA, 1979. [Google Scholar]
  51. Stumpf, A.J. Surficial Geology of Monticello Quadrangle, Piatt County; USGS-STATEMAP contract report, 2 sheets, 1:24,000; Illinois State Geological Survey: Champaign, IL, USA, 2018. [Google Scholar]
  52. Grimley, D.A.; Wang, J.J.; Oien, R.P. Surficial Geology of Mahomet Quadrangle, Champaign and Piatt Counties; Illinois USGS-STATEMAP contract report, 2 sheets, 1:24,000 scale; Illinois State Geological Survey: Champaign, IL, USA, 2016; report 13p. [Google Scholar]
  53. Mount, H.R. Soil Survey of Champaign County; U.S. Department of Agriculture and Illinois Agriculture Experiment Station: Champaign, IL, USA, 1982; 178p.
  54. Fehrenbacher, J.B.; Jansen, I.J.; Olson, K.R. Loess Thickness and Its Effect on Soils in Illinois; University of Illinois at Urbana-Champaign, College of Agriculture, Agricultural Experiment Station Bulletin 782: Champaign, IL, USA, 1986; 14p. [Google Scholar]
  55. Hanson, E.M. East-Central Illinois: Exploring the Beginnings; Dixon Graphics: Champaign, IL, USA, 2012; 128p, Available online: https://eastcentralillinoisbeginnings.com/ (accessed on 30 April 2021).
  56. Baker, N.T.; Capel, P.D. Environmental Factors that Influence the Location of Crop Agriculture in the Conterminous United States. In U.S. Geological Survey Scientific Investigations Report 2011-5108; US Department of the Interior, US Geological Survey: Washington, DC, USA, 2011; 72p. [Google Scholar]
  57. Imlay, S.J.; Carter, E.D. Drainage on the Grand Prairie: The birth of a hydraulic society on the Midwestern frontier. J. Hist. Geogr. 2012, 38, 109–122. [Google Scholar] [CrossRef]
  58. White, J.H. American Locomotives: An Engineering History, 1830–1880; The Johns Hopkins Press: Baltimore, MD, USA, 1968; 528p. [Google Scholar]
  59. Biles, R. The Decline of Decatur. Journal of the Illinois State Historical Society; University of Illinois Press: Champaign, IL, USA, 2017; Volume 110, pp. 183–210, No. 2. [Google Scholar]
  60. Fitzpatrick, W.P.; Bogner, W.C.; Bhowmik, N.G. Sedimentation and Hydrologic Processes in Lake Decatur and its Watershed. In Illinois State Water Survey Report of Investigation 107; Illinois State Water Survey: Champaign, IL, USA, 1987; 96p. [Google Scholar]
  61. Blair, N.E.; Leithold, E.L.; Papanicolaou, A.T.; Wilson, C.G.; Keefer, L.; Kirton, E.; Vinson, D.; Schnoebelen, D.; Rhoads, B.; Yu, M.; et al. The C-biogeochemistry of a Midwestern USA agricultural impoundment in context: Lake Decatur in the intensively managed landscape critical zone observatory. Biogeochemistry 2018, 138, 171–195. [Google Scholar] [CrossRef]
  62. Keefer, L.; Bauer, E.; Markus, M. Hydrologic and Nutrient Monitoring of the Lake Decatur Watershed: Final Report 1993–2008; Illinois State Water Survey, University of Illinois at Urbana-Champaign: Champaign, IL, USA, 2010. [Google Scholar]
  63. Grimley, D.A.; Arruda, N.K. Observations of magnetite dissolution in poorly drained soils. Soil Sci. 2007, 172, 968–982. [Google Scholar] [CrossRef]
  64. Dearing, J.A.; Dann, R.J.L.; Hay, K.; Lees, J.A.; Loveland, P.J.; Maher, B.A.; O’Grady, K. Frequency-dependent susceptibility measurements of environmental materials. Geophys. J. Int. 1996, 124, 228–240. [Google Scholar] [CrossRef] [Green Version]
  65. So, R.T.; Blair, N.E.; Masterson, A.L. Carbonate mineral identification and quantification in sediment matrices using diffuse reflectance infrared Fourier transform spectroscopy. Environ. Chem. Lett. 2020, 18, 1725–1730. [Google Scholar] [CrossRef]
  66. Ritchie, J.C.; McHenry, J.R. Application of radioactive fallout cesium-137 for measuring soil erosion and sediment accumulation rates and patterns: A review. J. Environ. Qual. 1990, 19, 215–233. [Google Scholar] [CrossRef] [Green Version]
  67. Dare, S.A.; Barnes, S.J.; Beaudoin, G.; Méric, J.; Boutroy, E.; Potvin-Doucet, C. Trace elements in magnetite as petrogenetic indicators. Miner. Depos. 2014, 49, 785–796. [Google Scholar] [CrossRef]
  68. Blair, N.E.; Hayes, J.M.; Grimley, D.A.; Anders, A.M. Eroded Critical Zone Carbon and Where to Find It: Examples from the IML-CZO. Biogeochemical Special Volume, Hydrology and Biogeochemical Cycles. In Press.
  69. Cowan, E.A.; Epperson, E.E.; Seramur, K.C.; Brachfeld, S.A.; Hageman, S.J. Magnetic susceptibility as a proxy for coal ash pollution within riverbed sediments in a watershed with complex geology (southeastern USA). Environ. Earth Sci. 2017, 76, 1–15. [Google Scholar] [CrossRef]
  70. Vengosh, A.; Cowan, E.A.; Coyte, R.M.; Kondash, A.J.; Wang, Z.; Brandt, J.E.; Dwyer, G.S. Evidence for unmonitored coal ash spills in Sutton Lake North Carolina: Implications for contamination of lake ecosystems. Sci. Total Environ. 2019, 686, 1090–1103. [Google Scholar] [CrossRef]
  71. Milici, R.C. The COALPROD Database: Historical Production Data for the Major Coal Producing Regions of the Conterminous United States: U.S.G.S. Open-File Report: 97-447. 1997. Available online: https://pubs.usgs.gov/of/1997/of97-447/text.htm (accessed on 6 March 2021).
  72. Bradley, P.J.; Phillips, C.M.; Gay, N.K.; Fuemmeler, S.J. Geologic Map of the Chapel Hill 7.5-min Quadrangle, Orange and Durham Counties, North Carolina; North Carolina Geological Survey Open-file Report 2004-01 Revision-02 (2008), scale 1:24,000; North Carolina Geological Survey: Raleigh, NC, USA, 2004.
  73. Renard, K.G.; Foster, G.R.; Weesies, G.A.; McCool, D.K.; Yode, D.C. Predicting Soil Erosion by Water: A Guide to Conservation Planning with the Revised Universal Soil Loss Equation; RUSLE Handbook No. 703; US Department of Agriculture: Washington, DC, USA, 1997; 404p.
  74. Martin, W.S. Soil Survey of Piatt County; Department of Agriculture and Illinois Agricultural Experiment Station, University of Illinois at Urbana-Champaign: Champaign, IL, USA, 1991; 131p. [Google Scholar]
  75. Reimer, P.J. The INTCAL20 Northern Hemisphere Radiocarbon Age Calibration Curve (0–55 cal kBP). Radiocarbon 2020, 62, 725–757. [Google Scholar] [CrossRef]
Figure 1. Location of sample sites of alluvium in the North Carolina Piedmont in the context of the generalized geology, railroads [41], and coal burning power plants (University of North Carolina [Chapel Hill] and Cape Fear [demolished in 2017]). Geologic substrate is simplified from [42]. The green square on the inset map shows the location of the North Carolina study area. The yellow area on the inset map shows the Upper Sangamon River Basin in Illinois.
Minerals 11 00476 g001
Figure 2. Location of Lake Decatur within the Upper Sangamon River Basin of central Illinois. (A) Sampled alluvial sites from a prior fly ash study [6]; (B) Shallow cores of Lake Decatur sediments [61]. Two coal burning power plants in Decatur (Archer Daniels Midland and A.E. Staley) are indicated, as well as railroad lines.
Minerals 11 00476 g002
Figure 3. Photographs of four of the nine sample sites of alluvium and millpond sediment in the North Carolina Piedmont. Site NCFA-1 is located in the Triassic Basin, site NCFA-3 and NCFA-4 are in the Carolina and Raleigh area crystalline terranes, and Betty’s Milldam is a former milldam site in Umstead Park (Raleigh area terrane). A weak paleosol is observed in the top of pre-European settlement deposits at NCFA-3 and -4.
Minerals 11 00476 g003
Figure 4. Magnetic fly ash (percent of 10–60 µm magnetic fraction), low frequency magnetic susceptibility (×10−8 m3/kg) and frequency dependent magnetic susceptibility (%) with depth from alluvial samples and Betty’s Milldam sediments in central North Carolina.
Minerals 11 00476 g004
Figure 5. Scanning electron microscope images and energy dispersive X-ray spectroscopy (EDS): (A) Multiple fly ash and natural magnetic grains from site NCFA-8, 0–10 cm depth, 150× magnification; (B) Natural magnetic grains from site NCFA-2, 100–120 cm depth (pre-settlement), 300× magnification; (C) Close-up of fly ash sphere and natural magnetite octahedron from NCFA-8, 0–10 cm depth, 1200× magnification; (D) Close-up of fly ash sphere and natural magnetite grain from NCFA-8, 0–10 cm depth, 1500× magnification, yellow arrow points to small 3 µm fly ash particle; (E) Elemental spectrum of a magnetic fly ash (likely magnetite or maghemite) and natural magnetite particle (black rectangles in [C] show area of EDS); (F) Elemental spectrum of a magnetic fly ash and natural magnetite particle (black rectangles in [D] show area of EDS).
Minerals 11 00476 g005
Figure 6. Thickness of post-1850 alluvium versus valley width from 8 sites in the North Carolina Piedmont (this study) and 17 sites in the Upper Sangamon River Basin of central Illinois (data from [6]). Data from Betty’s Milldam and Lake Decatur sites are not included.
Minerals 11 00476 g006
Figure 7. Fly ash, magnetic susceptibility, and frequency dependent magnetic susceptibility data from the upper 1.3 m of the Betty’s Milldam Section. Rooted tree stumps from the pre-settlement alluvium previously yielded a radiocarbon age of 1255 ± 15 14C yr B.P. [27]. The stratigraphic sketch is modified from [37] and [39].
Minerals 11 00476 g007
Figure 8. Lake Decatur Core 13: comparison of records of magnetic fly ash, carbonate content, δ13C, 137Cs, and particle size.
Minerals 11 00476 g008
Figure 9. Lake Decatur Core 9: comparison of records of magnetic fly ash, carbonate content, δ13C, 137Cs, and particle size.
Minerals 11 00476 g009
Figure 10. Coal production (3-year averages) in Illinois and the USA from 1800 to 2019. Data is from [9,71].
Minerals 11 00476 g010
Table 1. NC Fly Ash Site Locations.
Site NameLatitudeLongitudeLocationMax.%
Fly Ash#
Mean MS
(×10−8 m3/kg)
Post-1850 PSA
Thickness (cm)
Valley
Width (m)
Geo-Terrain
NCFA-135.77820−78.83608near Taylor YMCA; Wake Co., NC5122085Triassic Basin
NCFA-235.82600−78.78440Black Creek, Wake Co., NC8583095Metavolcanic epiclastic
NCFA-335.82310−78.78480Black Creek, Wake Co., NC9402055Metavolcanic epiclastic
NCFA-435.92730−79.03970Chapel Hill, Orange Co., NC364445235Metamorphosed granite
NCFA-535.93950−79.08540Chapel Hill, Orange Co., NC83415125Felsic metavolcanics
NCFA-635.76691−78.83589near Westhigh St., Wake Co., NC17530100Triassic Basin
NCFA-735.56043−79.05435Lee Co., NC, Moncure Quad592540450Triassic Basin
NCFA-835.65618−79.89396Holly Springs Road, Wake Co., NC36830350Triassic Basin
Bettys Milldam35.83000−78.75390Umstead Park, Wake Co., NC61380 (milldam)95Metamorphosed granite
# Percent of fly ash within the magnetic fraction. PSA = post-settlement alluvium.
Publisher’s Note: MDPI stays neutral with regard to jurisdictional claims in published maps and institutional affiliations.