Abstract
A number of experiments were conducted on a laboratory batch impact crusher to investigate the effects of particle size and impeller speed on grinding rate and product size distribution. The experiments involved feeding a fixed mass of particles through a funnel into the crusher up to four times, and monitoring the grinding achieved with each pass. The duration of each pass was approximately 20 s; thus, this amounted to a total time of 1 min and 20 s of grinding for four passes. The population balance model (PBM) was then used to describe the breakage process, and its effectiveness as a tool for describing the breakage process in the vertical impact crusher is assessed. It was observed that low impeller speeds require longer crushing time to break the particles significantly whilst for higher speeds, longer crushing time is not desirable as grinding rate sharply decreases as the crushing time increases, hence the process becomes inefficient. Results also showed that larger particle sizes require shorter breakage time whilst smaller feed particles require longer breakage time.
1. Introduction
Comminution has existed from ancient times [1] and is known to be the largest consumer of energy in mining operations [2]. It is comprised of the crushing and grinding stages with the former being 10 to 20 times more energy-efficient compared to the latter [3]. In mining-intensive countries like South Africa and Australia, there is always a need to continuously evaluate innovative technical solutions that come in the forms of circuit optimisation or development of new equipment. Thus, the survival of such companies is hinged on exploiting a wide range of comminution technologies, from the coarse crushing of mined ore and quarry rock to the very fine grinding for the production of cement, pharmaceuticals, paints, ceramics, and other materials [4]. This has made comminution a fertile field of research with a lot of work committed to understanding the operations of crushers and mills.
There has been some understanding amongst researchers that impact crushers, if appropriately applied, could have advantages over the conventional compressive crushers. Their breakage mechanism is preferred especially in aggregates production, which allows fragmentation of particles without leaving residual internal damage to the product, and the product particle shape is more controlled [5]. Evidence from literature shows that significant effort has been expended in understanding the impact crusher performance in relation to machine configuration and operational conditions, through experimental work and mathematical modelling [6] as well as performance comparison with other crushers such as the roller crusher [7], cone crusher [8], and the high pressure grinding rolls (HPGR) [9]. From such comparisons, it is generally accepted that impact crushers have, among other advantages, higher energy efficiency—though wear remains a challenging issue.
In the family of impact crushers, the rotor hammers that collide with the particles can be vertically or horizontally orientated; in our case, they were horizontally orientated. The crusher in this work is vertical and is of interest to us as it is known that impact crushers are capable of incredible size reduction ratio that can go up to 40:1 compared to around 6:1 that is typical for the jaw, gyratory, and cone crushers. In impact crushers, the hammers or beaters on a rotating shaft transfer kinetic energy to the particles as they come in contact with them. This sends shock waves through the material and creates internal stresses in particles that eventually cause breakage. The deflection of particles towards internal hard surfaces in a crusher creates further chances for breakage. When the particles are inhomogeneous, as most ores, various components in the composite particle react differently in accordance with their specific compressibility and elasticity moduli resulting in tension and shear stress between different components and thus promoting more breakage along phase boundaries [3]. The consequence is the predominance of inter-granular rather than cross-granular fracturing, which results in a high degree of particle liberation. The duration for impact breakage is much shorter than the fragmentation process in the jaw and cone crushers [10].
Whiten [11] initiated the modelling on which most work on cone crushers is based. Napier-Munn et al. [3] and Kojovic et al. [12] extended this approach to vertical impact crushers. Segura-Salazar et al. [13] used the same Whiten model supplemented by the equations describing the variation of parameters K3 and T10 in the classification function and the breakage function respectively, which were described as functions of feed rate and rotor speed. K3 is a constant in the classification function and T10 is the percentage of product passing 1/10th of the original particle size, after breakage. With the modified model, the authors were able to predict the product size distribution and the power consumption of the vertical impact crusher. They also managed to establish the inverse proportionality relationship between the feed rate and the proportion of material entering the rotor as well as the direct proportionality relationship between the feed rate and the cascading flow. Vogel and Peukert [14] used single-particle impact tests to model and evaluate impact grinding of polymers, limestone, and glass spheres. They used the probability of breakage and the breakage function methods to describe the influence of material properties, initial particle size, and impact energy on the product of impact comminution. Although their results were insightful, their analysis did not include the mill properties.
In this work, the operations of the vertical shaft impact crusher are further explored, with particular focus on the effect of particle size and rotor speed on the particle size distribution. The population balance model (PBM) is used as a tool to study this process. The PBM model has been widely used to model ball-milling kinetics, and has been successfully applied to modelling hammer mills [15]. It is characterised by the specific rate of breakage denoted by Si and the primary breakage distribution denoted by Bij. These two functions, combined with the mass transportation of particles form the basis for the modelling of the breakage kinetics in comminution devices [16]. It involves setting up narrow size class boundaries where the mass change of each size class can be predicted for any given time interval by doing size-class mass balance calculations. Thus, this modelling approach requires prior determination of the selection and the breakage function parameters [17]. Once these parameters are determined, then a product size distribution can be predicted from a given feed under a given set of operational conditions [18]. The variation of the selection function with particle sizes is defined by the following empirical model [17]:
where xi is the maximum limit in the sieve size interval i in mm; Λ is a positive number that is an index of how rapidly the rates of breakage fall as particle size increases (the higher the value, the more rapidly the values decreases); α is a positive constant that is dependent on material properties; µ and a are parameters that depend on the mill conditions; and Qi is the correction factor accounting for abnormal breakage of coarse particles.
Similarly, the cumulative breakage function Bi,j can be calculated from the following equation [17]:
where β, γ and j are material-characteristics-related parameters.
The parameters in Equations (1) and (2) are measured in the laboratory using a mono-size fraction using a defined procedure [18].
If a size–mass balance is performed for a particular size i, the rate of production of size i material equals the sum of the rate of appearance from breakage of all larger sizes minus the rate of its disappearance by breakage. This is symbolically expressed as follows [17]:
where is the rate of appearance of size i material produced by the fracturing of size j material;(t) is the rate of disappearance of size i material by breakage to smaller sizes; is the selection function of the material considered to be of size i; is the mass fraction of size i present in the mill at time t; and is the mass fraction arriving in size interval i from breakage of size j.
Equation (3) can then be used to predict the particle size distribution of comminution for a batch sample for any grinding time. It should be noted that the determination of parameters is based on specific experimental conditions. Further experimental observations would be required to apply the models to any drastic changes in design or operational conditions, and additional parameters may be required to account for any such deviations from standard conditions as presented by Bilgili et al. [19]. In tumbling mills, PBM has contributed significantly to the unlocking of the mystery of the black box and enabled grinding operations to be optimised, but for the impact crusher in question, it is not known whether the modelling technique can be successfully applied to optimise the operations of the crusher. Moreover, the effect of particle size and rotor speed on the particle size reduction for this particular crusher have not received much attention in the reviewed work on crusher modelling.
In light of the above, an attempt has been made to define reference conditions for modelling the impact crusher from a population balance modelling perspective. The effects of particle size and rotor speed have also been explored. In a separate paper, a more theoretical approach will be adopted that looks at both operating conditions and material to model the kinetics of the impact crusher.
2. Materials and Methods
2.1. Impact Crusher Configuration
The crushing tests on the ore were carried out at Wits laboratory using a laboratory impact crusher shown in Figure 1, designed at the University of Witwatersrand in South Africa. The impact is provided by two crossed bars that are attached to a spindle driven by a variable speed pillar drill machine. The equipment dimensions are given in Table 1 and Figure 1 shows the schematic of the crusher as well as the internal crushing chamber.
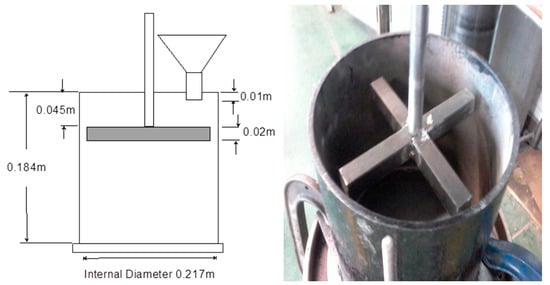
Figure 1.
Picture and schematic of the Wits laboratory impact crusher used for experimentation.

Table 1.
Specifications of the mill.
The investigation of the breakage kinetics of the impact crusher involved two variables; feed particle sizes and impeller speed. As shown in Table 2, it is seen that each particle size class was subjected to three different impeller speeds.
Table 2.
Experimental design.
2.2. Feed Material Preparation and the Crushing Tests
The material used was Sallies Silica from Brits quarry with a density of 2.63 kg/m3 and Young’s Modulus of 67.4 GPa. The material has 99% SiO2, 0.2% Fe2O3, 0.3% Ai2O3, and 0.5% other components. The bulk silica sand was split into smaller representative samples using standard laboratory techniques. Then four different size classes (-19 +16.7 mm, -13.2 +11.2 mm, -9.50 +8.00 mm, and -5.6 +4.75 mm) were prepared by sieving. Each size class was split into four identical samples, weighing 400 g each, using a rotary splitter.
The experimental procedure was the same for all sixteen samples. This involved setting the desired impeller speed at which the crusher was run. A 400 g sample was then placed in a funnel that fed the crushing chamber. The neck of the funnel was blocked by a flat piece of metal to hold the material until when the feed sample had to be released to commence the experiment. The material was subjected to rotor impact as it descended through the crushing chamber and the duration of emptying the entire sample into the crusher was considered as a batch operation lasting for 20 s. The crushed product was collected at the base of the chamber and a representative sample of this product was analysed for size distribution. The entire product including the fraction of the material that had been used for size analysis was placed into the funnel to do a second pass. Then the procedure described above was repeated. A maximum of four passes were carried out on each test. The experimental design is presented in Table 2.
2.3. Simulation of the Crushing Process
The use of population balance modelling to understand breakage in the impact crusher entailed using raw data collected from the experiments to determine the breakage function parameters (β, γ and Φ from Equation (2) and the selection function parameters (a, α, Λ, and µ). For breakage function parameters, Austin et al. [17] posit that good results are obtained when the grinding time is chosen at the point when 20–30% of the material has been broken out of the top size. These researchers also postulated that large amounts of test work is needed to measure all the parameters; thus, they proposed to back-calculate some of the parameters within the population balance model framework. To that end, the experimentally measured breakage function (β, γ, and Φ) and selection function parameters (α and a) were input parameters to a search algorithm generated to search for the best combination of all parameters that successfully minimised the sum of squared errors between the experimental and predicted product size distributions. Figure 2 presents the flowchart for the parameter back-calculation procedure. The calculation procedure is executed through a parameter fmincon that uses a sequential quadratic programming (SQP) method. The function solves a quadratric programming (QP) sub-problem at each iteration. An estimate of the symmetric matrix of the objective function is updated at each iteration by globally converging all the unknown parameters simultaneously and not adjusting them one at a time. The selection and breakage function parameters determined from the algorithm (β, γ, Φ, a, α, Λ, and µ) were then used to assess the performance of the crusher for longer operation times.
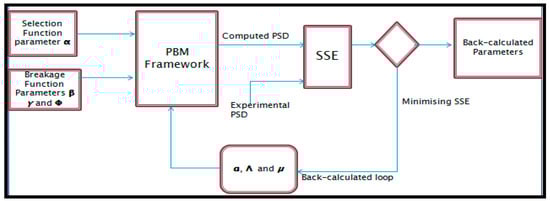
Figure 2.
Diagrammatic representation of the back-calculation procedure adapted from [20].
3. Results and Discussion
To analyse the crusher’s performance, the fraction of material broken below the lower sieve size was calculated at each pass. As seen in Figure 3, the breakage kinetics displayed first-order behaviour.
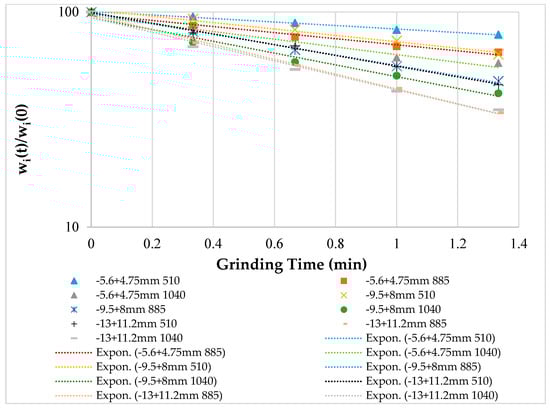
Figure 3.
First-order plots for various size fractions ground at 510 rpm, 885 rpm, and 1040 rpm.
3.1. Determination of the Specific Rate of Breakage
Figure 3 shows the plots of the specific rate of breakage vs. time, and it can be seen that different size classes displayed first-order behaviour. The selection function values (Si) are determined from the slopes of the plots using the power function.
The Si values obtained from the first-order plots in Figure 3, were plotted against feed sizes, and the plots are presented in Figure 4. This helps to graphically present the influence of the crusher rotor speed on the breakage rates of different particle sizes. As seen in the figure, the curves of the rotor speeds, 510 rpm and 885 rpm, are all still within the normal breakage region and thus were used to determine the selection function parameters a and α using the power function. The a and α values for rotor speed 510 rpm were found to be 0.0086 and 1.46, and those for 885 rpm were 0.039 and 1.31 respectively. It is interesting to note that operating the crusher at the rotor speed of 1040 rpm is not beneficial for larger particles as witnessed by the drop of the breakage rates for particle sizes in the ranges of -13 +11.2 mm and -19 +16.7 mm.
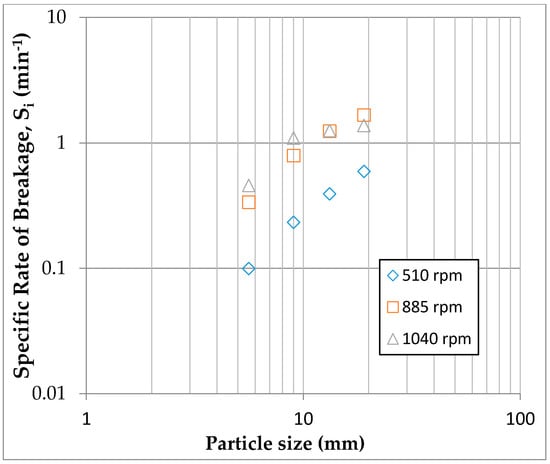
Figure 4.
Variation of the selection function with particle size for different speeds.
3.2. Determination of the Primary Breakage Distribution
The BII method presented in Equation (4) was used to determine the values of B from the size distribution obtained with short periods of crushing. The method corrects for secondary breakage since re-breakage of primary daughter fragments is compensated for by assuming that the product of the breakage rate function and the breakage distribution function, SjBij, is approximately constant.
where pi(0) is the weight fraction of material in the mill less than size xi at time 0; pi(t) is the weight fraction of material in the mill less than size xi at time t; and Bij is the cumulative mass fraction of particles passing the top size of interval i from the breakage of particles of size j and represents the cumulative form of the fraction broken, which is less than the top size.
Figure 5 presents the primary breakage distribution plots of all initial feed size classes determined using Equation (4) and characteristically, the plots show that the breakage distribution function does not depend on the feed particle size, i.e., the primary breakage distribution functions can be considered normalizable. Thus, the B values were fitted into the empirical model presented in Equation (2) and the breakage function parameters β, γ and were determined to be 5.39, 2.38, and 0.38 respectively. The value of γ is a bit high, which implies that the daughter fragments are coarser. This is understandable considering that the reduction ratios were very low for this crusher. The lower value of . shows that particles were breaking from the parent size at a slow rate.
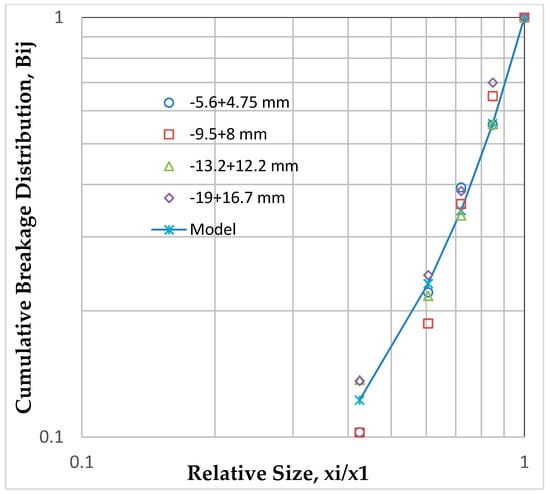
Figure 5.
Breakage function for different feeds.
The selection and breakage function parameters evaluated from the experimental tests were used as initial estimates in the population balance model framework to determine the rest of the parameters. The detailed procedure of the parameter search process is found in Chimwani et al. [19]. Figure 6 presents the comparison of the product size distributions (PSDs) generated from the experimental data and the ones predicted using the model parameters presented in Table 3. Measured parameters are those that were determined from the crushing experiments carried out whilst the remaining parameters were back-calculated within the population balance model framework.
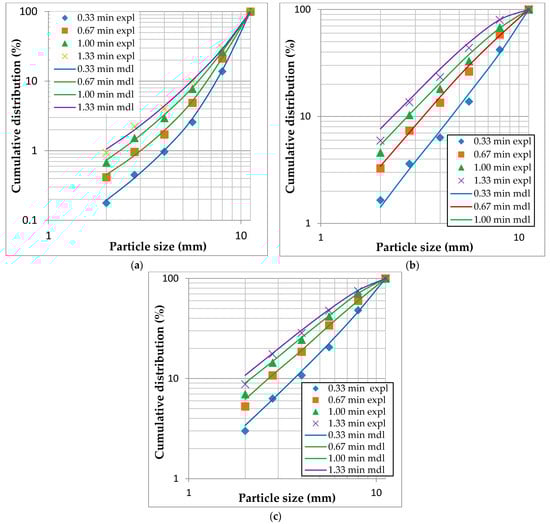
Figure 6.
Measured and predicted particle size for rotor speeds (a) 510 rpm, (b) 885 rpm, and (c) 1040 rpm for feed size -13.2 +11.2 mm.
Table 3.
Breakage parameters.
As shown in Figure 6a, a good agreement can be observed between the PSDs for different rotor speeds, which confirms the estimated parameters. Thus, the population balance model, which has largely been applied to ball milling, can be used to model the impact crusher. However, it is difficult to determine the effectiveness of the crushing process from those PSDs since breakage rates decreased as the number of passes increased for a given rotor speed.
3.3. Effects of the Rotor Speed on the Fragmentation of Particle Sizes
Figure 7 shows the PSDs of different rotor speeds for feed size -5.6 +4.75 mm. In Figure 7a, the size distribution curves corresponding to each pass are shown and each of these passes corresponds to a grind time increment of 0.33 min, and thus the total grind time comes to 1.33 min (80 s). The d10 values for the first and fourth passes, presented in Table 4, show that there is very little grinding progress even after four passes at this low impeller speed of 510 rpm.
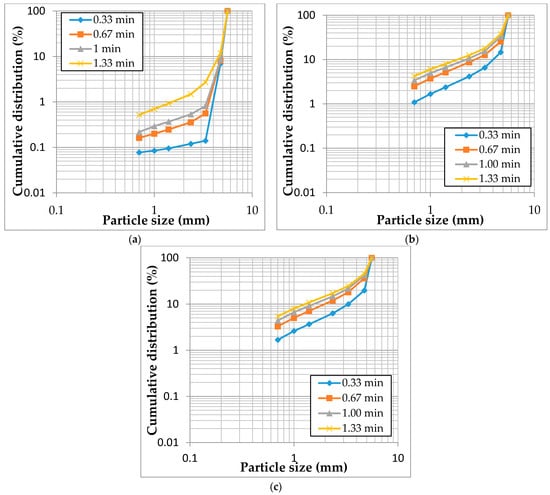
Figure 7.
Cumulative passing rotor speeds (a) 510 rpm, (b) 885rpm, and (c) 1040 rpm for a 5.6 to 4.75 mm feed.
Table 4.
d10, d50, and d90 of the 4.75–5.6 mm particles.
Almost similar or insignificantly different values observed for d50 and d90, as well as a 2.3% difference for d10, in Table 4 show that any particle breakage at this speed was virtually owing to nipping of particle edges as they got hit by beaters and bombarded on the crusher casing and against each other. The impact force was not strong enough to cause particle fracture. This is in agreement with what Vogel and Peukert [14] observed—that in such scenarios, high local stresses cause minor damages to the particles in the form of broken edges or abrasion, albeit with no significant fragmentation occuring. In addition to that, a significant number of particles go through uncomminuted at low speed as the periods between the impacts are longer than the average time spent by particles in the collision path. This is derived by referring to the relevant equipment geometry shown in Figure 1 and applying newtonian physics to estimate the time a particle is within the collision space. The time the particle spends in the space where it can collide with the impeller can be calculated by analysing the distance from the point of exit from the funnel to the upper part of the bar. The time duration of free fall can be calculated as:
where S is the distance, g is the acceleration due to gravity, and t is the time. Thus, at low speeds, longer crushing times are needed as there is need to recycle higher quantities of material and re-present them to the collision space to improve their chances of being impacted by the rotating hammers. Thus, breakage is low not just because of lower energy transfer rate at low speed, but because a number of particles are missed by the rotating impeller.
As the speed was raised from 510 rpm to 885 rpm, there was a significant improvement in particle breakage, as seen from the d10 and d50 values in Table 4. Interesting to note is that as the rotor speed was increased, there was a 10% difference between the PSD of the first 0.33 min and that of 0.67 min, but only a difference of 4% is observed between a minute and 1.33 min of particle breakage in the crusher. This brings forth the issue of the necessity of the longer crushing time (1.33 min); at the highest rotor speeds used (1040 rpm as shown in Figure 7c), there was a difference of 16% between 0.33 and 0.67 min of crushing and yet only 3% between the third and the fourth passes. Thus there is a clear indication that shortened grinding time to no more than 0.67 min would be recommended at this speed; beyond this, the diminishing returns make extended grind time wasteful.
In Table 5, it is shown that as the particle size is increased; there is significant particle breakage even at the lowest speed. Interestingly, d90 also shows particle breakage even at the lowest speed and that confirms that the bigger the particle, the more easily it breaks. This may be attributed to Griffith flaws that indicate higher flaw density in bigger particles, but there is much more to this, as it is shown in the analysis later that larger particles spend more time in the collision space and are subject to more collisions with the impeller than smaller particles. The trend of large particles having higher breakage rates is also evident at higher rotor speeds.
Table 5.
d10, d50, and d90 of the 8–9.5 mm and 11.2–13.2 mm particles.
The PSDs for feed size -9.5 +8 mm indicated by graphs (a to c) and those of feed size -13 +12.2 mm indicated by graphs (a1 to c1) as shown in Figure 8 display a slightly different behaviour from that of feed size -5.6 +4.75 mm, although the general trend is still similar. The slight deviation is seen in the differences between the cumulative percent passing of the PSDs for the rotor speeds 510 rpm and 885 rpm. In those plots, the differences between the third and fourth PSD for feed size -9.5 +8 mm were 8% and 5% for rotor speeds 510 rpm and 885 rpm respectively, and for feed size -13 +12.2 mm they were 4% and 12% for the same rotor speeds in Figure 8d,e and; thus a slight improvement from the cumulative percent passing PSDs of -5.6 +4.75 mm. For the rotor speed of 1040 rpm, the difference between the PSDs of the 1 min and 1.33 min crushing time is as low as 2% for both particle sizes presented in Figure 8c,f. That can be attributed to the reduction of breakage rates observed for third and fourth passes.
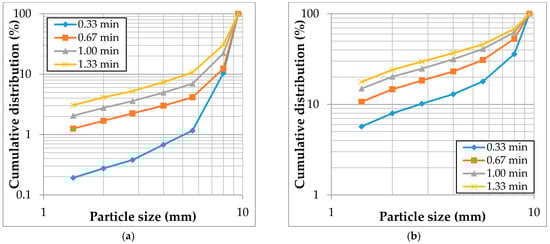
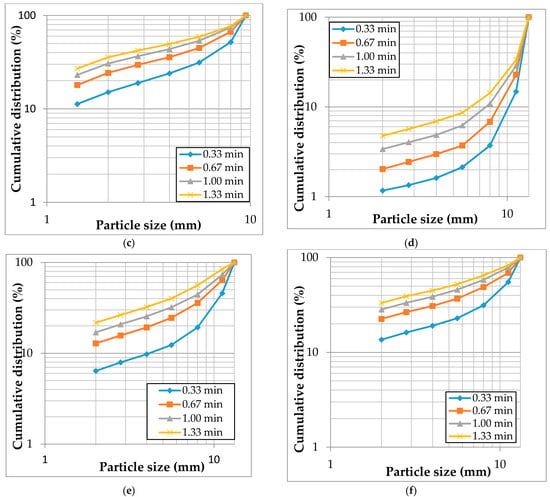
Figure 8.
Cumulative passing for rotor speeds (a) 510 rpm, (b) 885 rpm and (c) 1040 rpm for -9.5 +8 mm feed and (d) 510 rpm, (e) 885 rpm, and (f) 1040 rpm for -13.2 +12.2 mm feed size.
Figure 9 presents the PSDs obtained from grinding feed size -19 +16.7 mm at different rotor speeds and crushing times. The figure shows that there was a difference of 14% between the PSDs of the 0.33 and 0.67 min crushing times for the lowest rotor speed, and then it decreased to 6% between the PSDs of 1 min and 1.33 min. For the 885 rpm and 1040 rpm rotor speeds depicted by Figure 9b,c respectively, crushing the material beyond the 0.67 min is not beneficial owing to less than 5% difference in the cumulative distribution of 1 and 1.3 min.
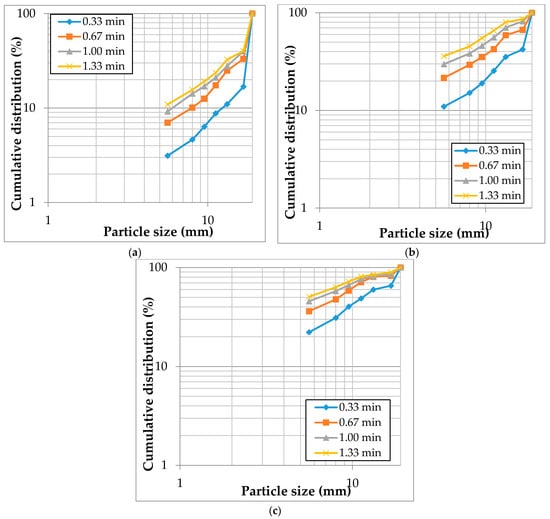
Figure 9.
Cumulative passing rotor speeds (a) 510 rpm, (b) 885 rpm, and (c) 1040 rpm for the 16.7 to 19.0 mm feed.
In Table 6, the rotor speed 1040 rpm has no d10 values, and its d50 and d90 values are less than those of other rotor speeds. The reason behind the failure of this higher rotor speed to yield better results for larger particles can be explained by Equation (5).
Table 6.
d10, d50, and d90 of the 16.7–19.0 mm particles.
When a particle gets into a collision path, its size significantly affects the duration of its stay in that path, as illustrated by Figure 10. Bigger particles will spend a significantly longer time in this space and that means most of the breakage will be done within the first minute of breakage.
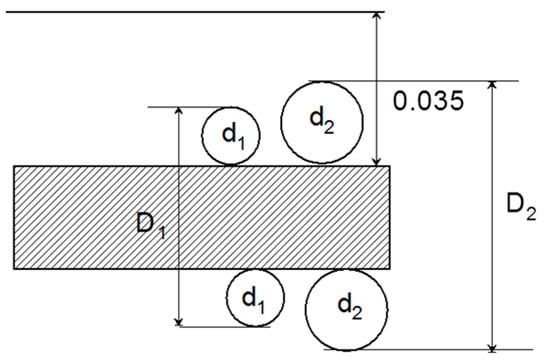
Figure 10.
Different sizes within the collision space.
Based on this analysis, it is found that the 5.6 mm and 19 mm particles will spend 0.007 and 0.027 s respectively in this space. At 510 rpm and 885 rpm impeller speed, using a cross-shaped impeller, the bar will cross the path of particles (510/60) × 4 times per second for the 510 rpm speed and (885/60) × 4 times per second for the 885 rpm speed. Thus the respective periodic times a particle is intercepted are 0.029 s for 510 rpm and 0.017 s for 885 rpm. Thus, three quarters of the time, the small particle will not incur any collision with the impeller at a low rotor speed of 510 rpm while the bigger particle has a 95% chance of colliding with the impeller. At the higher speed of 885 rpm, the bigger particles will be impacted almost twice while for the smaller particles, the chance of being hit is only about 40%. This explains why for the same experimental duration, the big particles show evidence of more repeated breakage.
The other reason for higher breakage rates observed with bigger particles is the relative increase in flaw density with increased particle size. It thus stands to reason that the coarse particles will require a set-up that shortens their grind times relatively. In a muti-stage arrangements of the impellers, far fewer stages would be required for bigger particles.
3.4. Summarised Findings
Breakage rates results show that a higher rotor speed such as 1040 rpm is only beneficial for smaller particle sizes since decreased breakage rates were observed for larger particle sizes for that rotor speed. At low speeds, longer crushing time is needed for the particles to be broken significantly and achieve a given degree of fineness, but this translates to longer crushing time of particles through the crusher—which means more energy consumption in the process. At higher rotor speeds, it is only the first 0.67 min that the crusher is seen to be operating efficiently. Bigger particles were found to break easily initially due to flaws in them and their longer residence time in the collision space, and it was demonstrated that crushing the material of this size for a longer period may lead to the inefficient operation of the crusher.
It is observed that the size evolution towards an overall fine size distribution is greater with increasing particle size due to more repeated breakage events. It is also observed that the higher impeller speeds resulted in finer product for all sizes but most significantly for the finest size sample.
These results provide a significant step towards designing energy-efficient crushers. The next step thus would entail using a more complex approach that looks at particle fracture response and impeller kinetic forces to study more precisely the influence of particle size and impeller speed. The approach would enable us to explore the crusher performance in terms of energy, since comminution is one of the biggest consumers of energy. Work is currently underway to design the same crusher with provisions to measure energy during the crushing process.
It is worth mentioning that the size reduction ratios are very low for the crushing experiments conducted in this work. However, very important insights regarding the amount of crushing needed for the optimum operation of the crusher are drawn from the product PSDs obtained.
4. Conclusions
In this work, it was shown that PBM can be used to evaluate particle size reduction in the vertical impact crusher investigated in this work, as evidenced by the good agreement between the experimental and predicted PSDs. This indicates that under steady, set conditions, this crusher can be modelled like a ball milling process. However, to study more precisely the influence of particle size and impeller speed, a more complex approach that looks at particle fracture response and impeller kinetic forces is required, which will be the main subject of the next paper.
Very important insights regarding the amount of crushing needed for the vertical impact crusher investigated towards optimizing it are drawn from the patterns and behaviour of the PSDs obtained. Low speeds such as 510 rpm require longer crushing time to break the particles significantly, since most of the particles escape from the collision space without being comminuted, and, thus, based on our current crusher design, several passes are required to achieve resonable degree of size reduction. For higher rotor speeds, multiple passes are not desirable since the net grinding rate decreases with increasing grind time, hence becoming more inefficient overall. The research showed that larger particle sizes require shorter breakage time (fewer passes through the crusher), whilst smaller feed particles require longer breakage time (more passes). This is attributed to relatively higher flaw density in larger particles as well as their longer residence time in the collision space. It was, however, not possible to explore to see if there is an upper size limit where large particles start becoming too strong to break, as the feed neck diameter was the limit; this matter will be addressed in our future paper.
It has also been shown that to obtain meaningful size reduction, there is a need to either subject the particles to multiple passes at lower rotor speeds or a single pass at higher speeds, and our future work will look at ways of optimising the crusher with respect to multiple pass configuration. We will also use a more complex approach that looks at particle fracture response and impeller kinetic forces to study more precisely the influence of particle size and impeller speed.
Author Contributions
Conceptualization, N.C. and M.M.B.; methodology, N.C. and M.M.B.; software, M.M.B.; validation, N.C. and M.M.B.; formal analysis, N.C. and M.M.B.; investigation, N.C. and M.M.B.; resources, N.C. and M.M.B.; data curation, N.C. and M.M.B.; writing—original draft preparation, N.C. and M.M.B.; writing—review and editing, N.C. and M.M.B.; visualization, N.C. and M.M.B.; supervision, N.C. and M.M.B.; project administration, N.C. and M.M.B. All authors have read and agreed to the published version of the manuscript.
Funding
This research is funded by NRF Grant No: 120394.
Data Availability Statement
The data presented in this study are available on request from the corresponding author. The data are not publicly available due to university policy.
Acknowledgments
The authors wish to thank the University of the Witwatersrand South Africa and the University of South Africa for supporting this work.
Conflicts of Interest
The authors declare no conflict of interest.
References
- Habashi, F. A Short History of Mineral Processing. In Proceedings of the 23 International Mineral Processing Congress, Istanbul, Turkey, 3–8 September 2006. [Google Scholar]
- Napier-Munn, T. Is progress in energy-efficient comminution doomed? Miner. Eng. 2014, 73, 1–6. [Google Scholar] [CrossRef]
- Borg, G.; Scharfe, F.; Kamradt, A. Improved Particle Liberation by High-Velocity Comminution-The new VeRo Liberator®. Cuprum Czas. Nauk.-Tech. Górnictwa 2015, 2, 5–14. [Google Scholar]
- Napier-Munn, T.J.; Morrell, S.; Morrison, R.D.; Kojovic, T. Mineral Comminution Circuits: Their Operation and Optimisation; Julius Kruttschnitt Mineral Research Centre: Indooroopilly, Australia, 1999. [Google Scholar]
- Wills, B.A. Will’s Mineral Processing Technology: An Introduction to the Practical Aspects of Ore Treatment and Mineral Recovery, 7th ed.; Elsevier Science and Technology Books: London, UK, 2008. [Google Scholar]
- Djordjevic, N.; Shi, F.N.; Morrison, R.D. Applying discrete element modelling to vertical and horizontal shaft impact crushers. Miner. Eng. 2003, 16, 983–991. [Google Scholar] [CrossRef]
- Sandvik, K.L.; Fagerli, S.; Frost, T. Change from pressure crushing in roller mills to impact crushing in production of mineral sand. Powder Technol. 1999, 105, 436–442. [Google Scholar] [CrossRef]
- Lindqvist, M. Energy considerations in compressive and impact crushing of rock. Min. Eng. 2008, 21, 631–641. [Google Scholar] [CrossRef]
- Jankovic, A.; Valery, W.; Davis, E. Cement grinding optimisation. Min. Eng. 2004, 17, 1075–1081. [Google Scholar] [CrossRef]
- Nikolov, S. A Performance Model for Impact Crushers. Miner. Eng. 2002, 15, 715–721. [Google Scholar] [CrossRef]
- Whiten, W.J. The simulation of crushing plants with models developed using multiple spline regression. J. S. Afr. Inst. Min. Metall. 1972, 10, 257–264. [Google Scholar]
- Kojovic, T.; Napier-Munn, T.J.; Andersen, J.S. Modeling cone and impact crushers usinglaboratory determined energy-breakage functions. In Proceedings of the Comminution Practices Symposium: SME Annual Meeting 1997, Denver, CO, USA, 24-27 February 1997; pp. 187–194. [Google Scholar]
- Segura-Salazar, J.; Varios, G.; Rodrigues, V.; Tavares, M. Mathematical modeling of a vertical shaft impact crusher using the Whiten model. Miner. Eng. 2017, 111, 222–228. [Google Scholar] [CrossRef]
- Vogel, L.; Peukert, W. Breakage behaviour of different materials—Construction of a mastercurve for the breakage probability. Powder Technol. 2003, 129, 101–110. [Google Scholar] [CrossRef]
- Shi, F.; Kojovic, T.; Esterle, J.; David, D. An energy-based model for swing hammer mills. Int. J. Miner. Processing 2003, 71, 147–166. [Google Scholar] [CrossRef]
- Chimwani, N.; Mulenga, F.K.; Glasser, D.; Hildebrandt, D.; Bwalya, M. Use of the attainable region method to simulate a full-scale ball mill with a realistic transport model. Miner. Eng. 2014, 73, 116–123. [Google Scholar] [CrossRef]
- Koka, V.R.; Trass, O. Estimation of breakage parameters in grinding operations using a direct search method. Int. J. Miner. Process. 1988, 23, 137–150. [Google Scholar] [CrossRef]
- Austin, L.G.; Klimsel, R.R.; Luckie, P.T. Process Engineering of Size Reduction: Ball Milling; Society of Mining Engineers: New York, NY, USA, 1984. [Google Scholar]
- Bilgili, E.; Yepes, J.; Scarlett, B. Formulation of a non-linear framework for population balance modeling of batch grinding: Beyond first-order kinetics. Chem. Eng. Sci. 2006, 61, 33–44. [Google Scholar] [CrossRef]
- Chimwani, N.; Glasser, D.; Hildebrandt, D.; Metzger, M.J.; Mulenga, F.K. Determination of the milling parameters of a platinum group minerals ore to optimize product size distribution for flotation purposes. Miner. Eng. 2013, 43, 67–78. [Google Scholar] [CrossRef]
Publisher’s Note: MDPI stays neutral with regard to jurisdictional claims in published maps and institutional affiliations. |
© 2021 by the authors. Licensee MDPI, Basel, Switzerland. This article is an open access article distributed under the terms and conditions of the Creative Commons Attribution (CC BY) license (https://creativecommons.org/licenses/by/4.0/).